Computation in the high-conductance state
115
COMPUTATION IN THE HIGH- CONDUCTANCE STATE Franziska Ursula Isolde Hellmundt Dissertation at the Graduate School of Systemic Neurosciences Ludwig‐Maximilians‐Universität München July, 2019
-
Upload
khangminh22 -
Category
Documents
-
view
2 -
download
0
Transcript of Computation in the high-conductance state

C OM P UT A TION IN T H E H IGH -C OND UC TA NC E S TA T E
Franziska Ursula Isolde Hellmundt
Dissertation at the Graduate School of Systemic Neurosciences Ludwig‐Maximilians‐Universität München
July, 2019

Supervisor Prof. Dr. Christian Leibold Department Biologie II Ludwig-Maximilians-Universität München First Reviewer: Prof. Dr. Christian Leibold Second Reviewer: Prof. Dr. Felix Felmy External Reviewer: Prof. Dr. Raoul-Martin Memmesheimer Date of Submission: 26th of July, 2019 Date of Defense : 10th of December, 2019

What if I fall?Oh, but my darling,
what if you fly?- Erin Hansen

iv

List of abbreviations
ACN Anteroventral Cochlear Nucleus
AP Action Potential
AVCN Anteroventral Cochlear Nucleus
CN Cochlear Nucleus
cPSC compound Postsynaptic Current
DG Dentate Gyrus
DNLL Dorsal Nucleus of the Lateral Lemniscus
EC Entorhinal Cortex
GBC Globular Bushy Cells
HC Hippocampus
HF Hippocampal Formation
ILD Interaural Level Difference
ITD Interaural Time Differenc
LFP Local Field Potential
LSO Lateral Superior Olive
LTD Long-Term Depression
LTP Long-Term Potentiation
MNTB Medial Nucleus of the Trapezoid Body

vi List of abbreviations
MSO Medial Superior Olive
O-LM Oriens–Lacunosum-Moleculare
PSC Postsynaptic Current
SBC Spherical Bushy Cell
STDP Spike-Time Dependent Plasticity
SWR Sharp-Wave Ripple

Summary
At high-conductance state, a neuron is exposed to increased synaptic bombard-ment. We analyzed the ability of hippocampal pyramidal neurons, as well as theprinciple cell type of the medial superior olive (MSO), to perform reliable computa-tions under these circumstances. While those neurons come from two completelydifferent brain areas, they are nevertheless ideal study objects, as they are wellstudied and ample functional knowledge is available.Pyramidal neurons exhibit sharp-wave ripple events, a specific type of oscillation,during memory consolidation. They are characterized by sharp voltage deflec-tions, accompanied by fast, ripple oscillation. We were interested in the memorycapacity of one ripple cycle. To test the correlation between spiking at one cy-cle with respect to the activity at the previous cycle, the excitatory conductanceswere modified such that the amplitude of a specific cycle was increased until anAP was generated. We observed only small dependencies between different cy-cles. Thus, we conclude that a major part of compound postsynaptic currents actas background activity.In another set of experiments, learning capabilities of a single cell were tested.For this, 10,000 synapses targeting a single cell were simulated, each with thepotential to generate postsynaptic currents. Predefined patterns had to be repli-cated. The number of patterns as well as the coding ratio (percentage of activesynapses) were systematically varied.The compound postsynaptic currents were injected into two different model ver-sions, a multi compartment, Hodgkin-Huxley type neuron, and a single compart-ment, leaky integrate-and-fire neuron. The leaky integrate-and-fire neuron reflectsthe synaptic drive of a cell in vivo, by allowing to set an optimal firing threshold.

viii Summary
In both models, a small number of patterns can be retrieved using sparse in-puts. For physiological sparseness, pattern retrieval was improved in the leakyintegrate-and-fire neuron, when adding inhibition, but only at low signal-to-noiseratios.From our finding, we conclude that the CA1 is an unlikely candidate network forthe storage of large numbers of patterns.Medial superior olive neurons are characterized by a very highmembrane conduc-tance, which results in a low probability for action potential generation. However,MSO neurons can produce high firing rates and are known for their precise co-incidence detection. To understand this apparent contradiction, we implementeda biophysically inspired, multi-compartment model and combined its finding withresults from immunohistochemical stainings and in vitro recordings.The model neuron included a detailed axonal compartment, which allowed to testthe impact of the distribution of ionic channels on the firing properties. With thehelp of in vitro patch-clamp recordings we investigated the effect of the input fre-quency on the firing threshold, by varying this frequency.One major finding concerns the site at which APs can be generated. With increas-ing input frequency, a lot of APs in the model are initiated at the nodes of Ranvier,in contrast to the axon initial segment.

Contents
List of abbreviations v
Summary vii
1 Introduction 1
1.1 The High-Conductance State . . . . . . . . . . . . . . . . . . . . . 1
1.2 Hippocampus . . . . . . . . . . . . . . . . . . . . . . . . . . . . . . 2
1.2.1 Hippocampal subregions . . . . . . . . . . . . . . . . . . . 4
1.2.2 Synaptic connections . . . . . . . . . . . . . . . . . . . . . 7
1.2.3 Place cells . . . . . . . . . . . . . . . . . . . . . . . . . . . 8
1.2.4 Other spatially organized cells in the HF . . . . . . . . . . . 10
1.2.5 Hippocampal oscillations . . . . . . . . . . . . . . . . . . . 12
1.3 Learning and Memory . . . . . . . . . . . . . . . . . . . . . . . . . 18
1.3.1 Learning in the Hippocampus . . . . . . . . . . . . . . . . . 19
1.3.2 Computational single cell models . . . . . . . . . . . . . . . 22
1.3.3 Hebbian Learning . . . . . . . . . . . . . . . . . . . . . . . 24
1.4 Sound localization . . . . . . . . . . . . . . . . . . . . . . . . . . . 26
1.4.1 Auditory pathways . . . . . . . . . . . . . . . . . . . . . . . 28
1.4.2 Medial superior olive (MSO) . . . . . . . . . . . . . . . . . . 29
1.5 Thesis Aims . . . . . . . . . . . . . . . . . . . . . . . . . . . . . . . 33
2 Study 1: Pattern Separation During Sharp-Wave Ripples using Phys-iological Inputs 35

x Summary
3 Study 2: Action Potential Generation in an Anatomically ConstrainedModel of Medial Superior Olive Axons 55
4 Discussion 714.1 Summary of Study 1 . . . . . . . . . . . . . . . . . . . . . . . . . . 714.2 Summary of Study 2 . . . . . . . . . . . . . . . . . . . . . . . . . . 734.3 The impact of a high-conductance state . . . . . . . . . . . . . . . 74
References 81
List of publications 101
Eidesstattliche Versicherung/Affidavit 103
Author Contributions 105
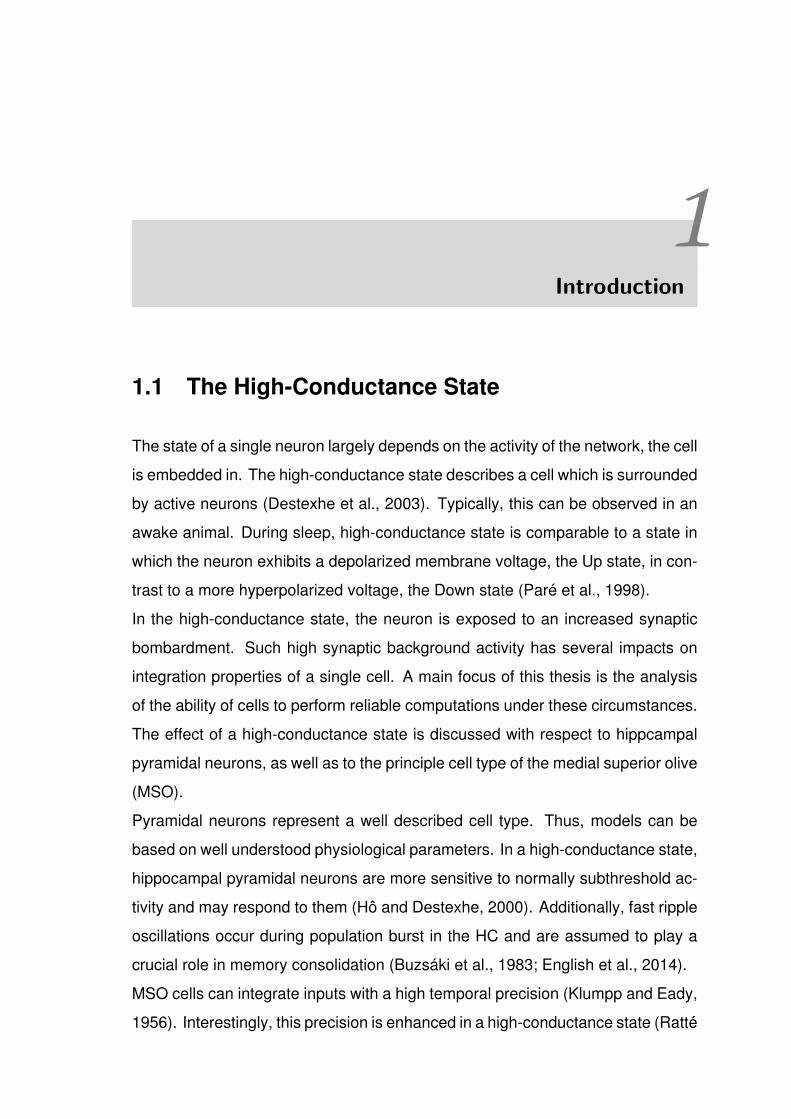
1Introduction
1.1 The High-Conductance State
The state of a single neuron largely depends on the activity of the network, the cellis embedded in. The high-conductance state describes a cell which is surroundedby active neurons (Destexhe et al., 2003). Typically, this can be observed in anawake animal. During sleep, high-conductance state is comparable to a state inwhich the neuron exhibits a depolarized membrane voltage, the Up state, in con-trast to a more hyperpolarized voltage, the Down state (Paré et al., 1998).In the high-conductance state, the neuron is exposed to an increased synapticbombardment. Such high synaptic background activity has several impacts onintegration properties of a single cell. A main focus of this thesis is the analysisof the ability of cells to perform reliable computations under these circumstances.The effect of a high-conductance state is discussed with respect to hippcampalpyramidal neurons, as well as to the principle cell type of the medial superior olive(MSO).Pyramidal neurons represent a well described cell type. Thus, models can bebased on well understood physiological parameters. In a high-conductance state,hippocampal pyramidal neurons are more sensitive to normally subthreshold ac-tivity and may respond to them (Hô and Destexhe, 2000). Additionally, fast rippleoscillations occur during population burst in the HC and are assumed to play acrucial role in memory consolidation (Buzsáki et al., 1983; English et al., 2014).MSO cells can integrate inputs with a high temporal precision (Klumpp and Eady,1956). Interestingly, this precision is enhanced in a high-conductance state (Ratté

2 1. Introduction
et al., 2013).Thus, both systems benefit from a high conductance state to perform very precisecomputations, thus enabling them to function as coincidence detectors (Abeles,1982; Klumpp and Eady, 1956).Before going into further details, the term conductance needs to be introduced.Conductance is the property that denotes the flow of electric currents. Its inverse,the electrical resistance is calculated as voltage per current. In neurons, the con-ductance is determined by the composition of ion channels in the membrane. Theexcitability of neurons is mainly affected by conductance changes. Hence, alter-ing the conductance state of a neuron can result in a changed spiking behavior.The membrane conductance of a neuron influences the membrane time constant.This time constant describes how quickly the membrane potential of a cell risesor decays. It is calculated as the product of membrane resistance and membranecapacitance. This correlation allows MSO neurons, in high conductance states,to have extremely low time constants, which they need to perform with a high tem-poral precision (Scott et al., 2005).A detailed discussion on the impact of this state on the integration properties ofsingle neurons can be found in the discussion chapter, at the end of this thesis.In the remaining part of the introduction, I will introduce the hippocampus, as wellas the MSO. I will start with an overview of the hippocampus, including synapticconnections, area specific cell types, as well as typical oscillations. The subse-quent section is dedicated to learning and memory formation. At the end, thefocus lies on sound localization, including a section about the MSO.
1.2 Hippocampus
The hippocampus (HC) is a brain region which can be found in both hemisphereswithin the medial temporal lobe in mammals. Looking at the three-dimensionalstructure reveals the eponymous shape of the HC, which is often said to resem-ble the form of a seahorse. The name hippocampus is deduced from the Greekword for seahorse. Another, older, denotation is Cornu Ammonis based on acomparison to a ram’s horn. Its abbreviation CA is found in the notation of the
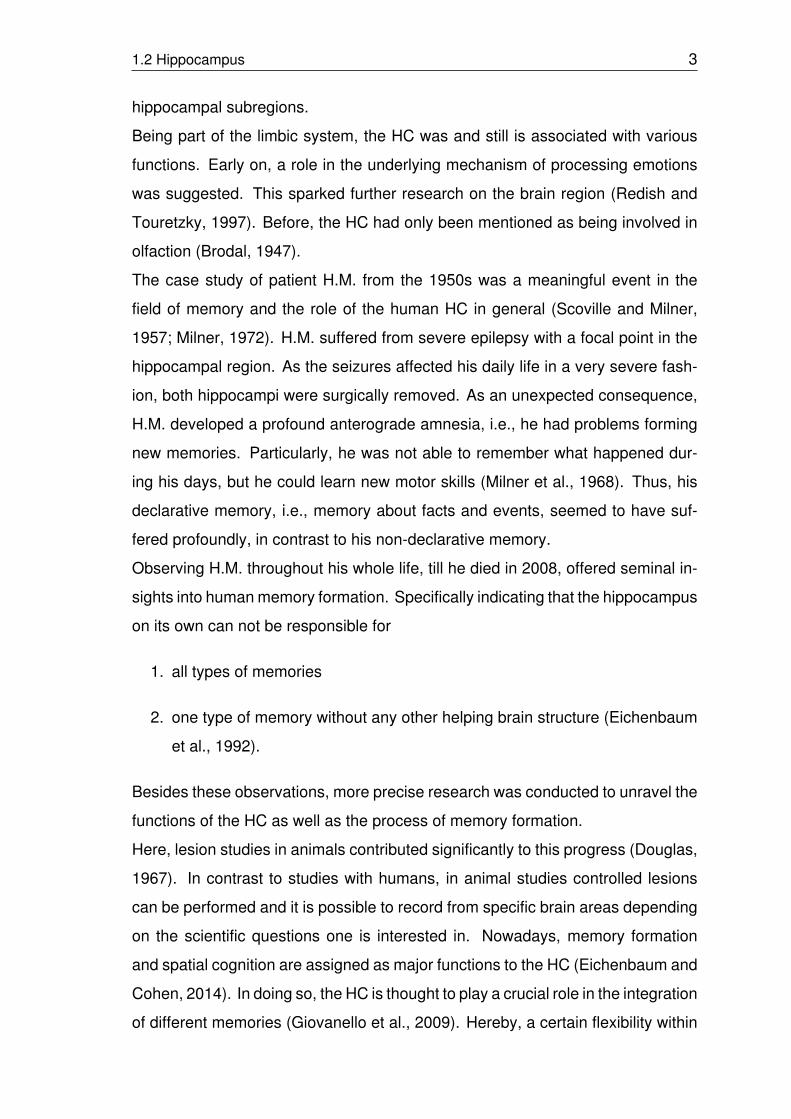
1.2 Hippocampus 3
hippocampal subregions.Being part of the limbic system, the HC was and still is associated with variousfunctions. Early on, a role in the underlying mechanism of processing emotionswas suggested. This sparked further research on the brain region (Redish andTouretzky, 1997). Before, the HC had only been mentioned as being involved inolfaction (Brodal, 1947).The case study of patient H.M. from the 1950s was a meaningful event in thefield of memory and the role of the human HC in general (Scoville and Milner,1957; Milner, 1972). H.M. suffered from severe epilepsy with a focal point in thehippocampal region. As the seizures affected his daily life in a very severe fash-ion, both hippocampi were surgically removed. As an unexpected consequence,H.M. developed a profound anterograde amnesia, i.e., he had problems formingnew memories. Particularly, he was not able to remember what happened dur-ing his days, but he could learn new motor skills (Milner et al., 1968). Thus, hisdeclarative memory, i.e., memory about facts and events, seemed to have suf-fered profoundly, in contrast to his non-declarative memory.Observing H.M. throughout his whole life, till he died in 2008, offered seminal in-sights into humanmemory formation. Specifically indicating that the hippocampuson its own can not be responsible for
1. all types of memories
2. one type of memory without any other helping brain structure (Eichenbaumet al., 1992).
Besides these observations, more precise research was conducted to unravel thefunctions of the HC as well as the process of memory formation.Here, lesion studies in animals contributed significantly to this progress (Douglas,1967). In contrast to studies with humans, in animal studies controlled lesionscan be performed and it is possible to record from specific brain areas dependingon the scientific questions one is interested in. Nowadays, memory formationand spatial cognition are assigned as major functions to the HC (Eichenbaum andCohen, 2014). In doing so, the HC is thought to play a crucial role in the integrationof different memories (Giovanello et al., 2009). Hereby, a certain flexibility within

4 1. Introduction
the neural network is needed in order to link novel experiences to already gainedones. A typical learning paradigm to test this ability would be to learn to associateword pairs. The flexible expression of declarative memory could be shown in rats(Bunsey and Eichenbaum, 1996) and humans (Preston et al., 2004). The ratshad to associate pairs of odors whereas humans were trained with pairs of facesand houses. The type of memory tested here is known as the flexible relationalmemory.Another theory about the HC tackles its contribution in spatial learning and is calledthe cognitive map theory (O’Keefe and Nadel, 1978). The theory states that theHC builds an internal representation of the external environment which can beused, e.g., for navigation. The theory was kick-started by the discovery of thehippocampal place cells (O’Keefe and Dostrovsky, 1971). The firing of a placecell in an animal, in a predetermined maze, is highly correlated to the location ofthe animal. A detailed description of place cells can be found below.The discovery of place cells was trend-stetting in the field of neuroscience, andsubsequently John O’Keefe won the Nobel Prize for Physiology or Medicine in2014. He shared the Nobel Prize with May-Britt and Edvard Moser who were in2005 the first to describe a similar cell type in the entorhinal cortex, namely thegrid cells (Hafting et al., 2005). In contrast to place cells, grid cells feature multiplefiring fields in a more or less regular hexagonal fashion.
1.2.1 Hippocampal subregions
Together with its surrounding structures, the HC is part of the hippocampal for-mation (HF) (Amaral and Witter, 1989). The following areas belong to the HF: theentorhinal cortex (EC), pre- and parasubiculum, subiculum, and dentate gyrus(DG) (see Figure 1.1). There are various connections within this brain regions aswell as projections to other areas which will be examined in the following.The HC can be anatomically as well as functionally divided into different subfields.Asmentioned above, they are labeled with the abbreviation CA followed by a num-ber to distinguish the parts from each other.Already in 1911, Cajal revealed, by looking at Golgi stainings and providing draw-ings, a significant portion of the underlying anatomical structure as well as projec-

1.2 Hippocampus 5
Figure 1.1: Rat brain from a posterolateral view. (a) Anterior part is characterized by the
olfactory bulb (OB). In violet the HF is depicted with its neighboring regions. (b) Horizontal
section through the HF. (c) Main synaptic connections in the HF. Adapted fromWitter et al.
(2000) with permission,
tions from and to different cell layers within the HF (Cajal, 1911). Some of whicheven got forgotten over the years and were found again later, like the projectionfrom the EC to CA1 and CA3 (Witter et al., 2000; Steward and Scoville, 1976).
Layers. Each layer in the HC is characterized by the type of cell bodies as well asaxonal and dendritic connections located in it. These distributions can already beseen in older drawings of hippocampal slices, as mentioned above. Additionally,electrophysiological in vitro or in vivo recordings reveal differences in the layers,as well as molecular analysis of it.

6 1. Introduction
The HC is characterized by the following layers (see, e.g., Amaral et al. (2007)and Benson (2020) as references):
• Stratum lacunosum-moleculare
• Stratum radiatum
• Stratum lucidum
• Stratum pyramidale
• Stratum oriens
Stratum lacunosum-moleculare is the layer that is most superficial. In CA3,projections from EC layer II terminate in this layer. Below it, stratum radiatum canbe found with septal and commissural axons. Stratum lucidum only appearcein CA3. It cannot be found in CA1 and CA2. Mossy fibers from DG terminatein stratum lucidum. Attached, stratum pyramidale is located, containing the cellbodies of the principal cell type in the HC, the excitatory pyramidal neurons(Freund and Buzsáki, 1998). Stratum oriens concludes the layers. It mainlycontains cell somata of inhibitory neurons, like basket cells.The variety of inhibitory interneurons is considerably higher than that of pyramidalcells (Klausberger and Somogyi, 2008). More than 20 have been found inthe CA1, in contrast to a small single-digit number of types of pyramidal cells(Spruston, 2008). These inhibitory cells spread the entire area. Pyramidalneurons in the CA1 are packed in a denser fashion than those in CA3.Overall, pyramidal neurons in CA1 and CA3 have very similar properties (Sprus-ton, 2008). In contrast, pyramidal neurons found in the CA2 are more different,e.g., they possess a higher membrane capacitance, a lower input resistance, andare more hyperpolarized (Dudek et al., 2016). Furthermore, in CA2 no long-termpotentiation seems possible (Dudek et al., 2016).For the sake of completeness, the CA4 has to be mentioned. It is sometimes re-ferred to as the hilar region when assigned to the DG (Amaral, 1978). Regardingthe cells of CA4, which resemble more closely those in the DG than in other CAareas, the assignment to DG seems sensible (Blackstad, 1956). Beyond, CA4is mainly mentioned in the context of schizophrenia (Falkai and Bogerts, 1986).
1.2 Hippocampus 7
In patients with schizophrenia a loss in the volume of CA4 can be registered incomparison to healthy subjects (Haukvik et al., 2015).
1.2.2 Synaptic connections
Trisynaptic Circuit. In the classical view of hippocampal connections the focuslies on the trisynaptic loop (McNaughton and Morris, 1987). As its name implies,it consists of three synapses. Starting from layer II of the EC, neurons projectvia the perforant path to the DG. Here, granule cells are connected to the areaCA3 via the mossy fibers. Finally, the CA3 pyramidal neurons show dense con-nections to pyramidal neurons in area CA1, called Schaffer collaterals. Area CA3and DG exhibit many recurrent connections, in contrast to cells in CA1 (Lisman,1999). Nevertheless, compared to primary sensory cortices, those recurrent con-nections are sparse (Miles et al., 2014).The lamellar hypothesis which came up in the 1970s, suggested that the HC is or-ganized in parallel lamellae (Andersen et al., 1971). This means that all the fibershave the same orientation in the three-dimensional space of the HC, i.e., trans-verse to the longitudinal axis. According to this theory, activation in a small portionof the EC would subsequently lead to a similar amount of activation in the under-lying fiber connections. Thereby, parallel stacks of processing units would exist,with very little exchange across each other. The lamellar hypothesis soundedvery plausible because it was in line with the anatomical organization of the HC.However, more modern tracing technologies, like anterograde tracers, finally dis-proved this (Amaral andWitter, 1989). Thereby, a muchmore diverse connectivitymap could be revealed, including extensive connections also in the longitudinalaxis.
Modern view. Although the trisynaptic loop builds a nice basis, e.g., for com-putational networks of the hippocampal area, as already indicated, ongoing worksuggests a more complicated view (Lisman, 1999). First, it has to be mentionedthat the trisynaptic loop can be bypassed via a direct connection between layerIII of the EC to area CA1 (Van Hoesen et al., 1975). Moreover, the EC posses

8 1. Introduction
direct projections to the subiculum (Witter et al., 1988). There is also a disynapticloop from EC to CA3 and further on to CA1. Thus, it is possible to have spe-cific information processing for different purposes, e.g., for pattern separation orcompletion (Jones and Mchugh, 2011). Pattern separation needs a sparse firingenvironment to give the possibility to activate different combinations of cells fordifferent pattern. This environment can be found in the DG with its granule cells.In contrast to it, pattern completion is linked to the recurrent network of the pyra-midal cells in area CA3.At last, area CA2 has been disregarded for the most time and is getting only veryrecently more attention by analyzing, e.g., its gene expression or electrophysio-logical profile (Jones and Mchugh, 2011). Besides, it was shown that CA2 playsa crucial role in social memory formation (Hitti and Siegelbaum, 2014). The ex-act involvement of CA2 in hippocampal learning is still unclear. There is stronginhibition of the excitatory inputs from CA3 onto the pyramidal neurons in CA2.Thereby, actions potentials are suppressed in CA2 (Nasrallah et al., 2015). How-ever, the generation of action potentials can be achieved by using high frequencydistal inputs or induce long-term depression (Nasrallah et al., 2017).Overall, it has to be mentioned that within the HF lots of parallel circuits exist (Wit-ter et al., 2000). Here, the EC has to be mentioned as the gatekeeper of the HFproviding the input as well as receiving the output.
1.2.3 Place cells
The HC is very important in spatial cognition, i.e, the navigation through differentenvironments (see also Burgess et al. (2002)). In the HC, pyramidal neurons arethe principal cell type. In vivo recordings of these neurons in area CA1 and CA3of rodents reveal a very specific firing pattern in moving animals.This particular type of experiment was first published by O’Keefe and Dostrovskyin 1971 (O’Keefe and Dostrovsky, 1971). They implanted electrodes into the HCof rats and placed the animals into a maze to freely explore the space. Lateranalysis of the data allowed them to report on locations of single cell activity, i.e.,single action potentials of one specific cell. Mapping the activity of one cell ontothe real maze revealed a high correlation between location and activity. Some
1.2 Hippocampus 9
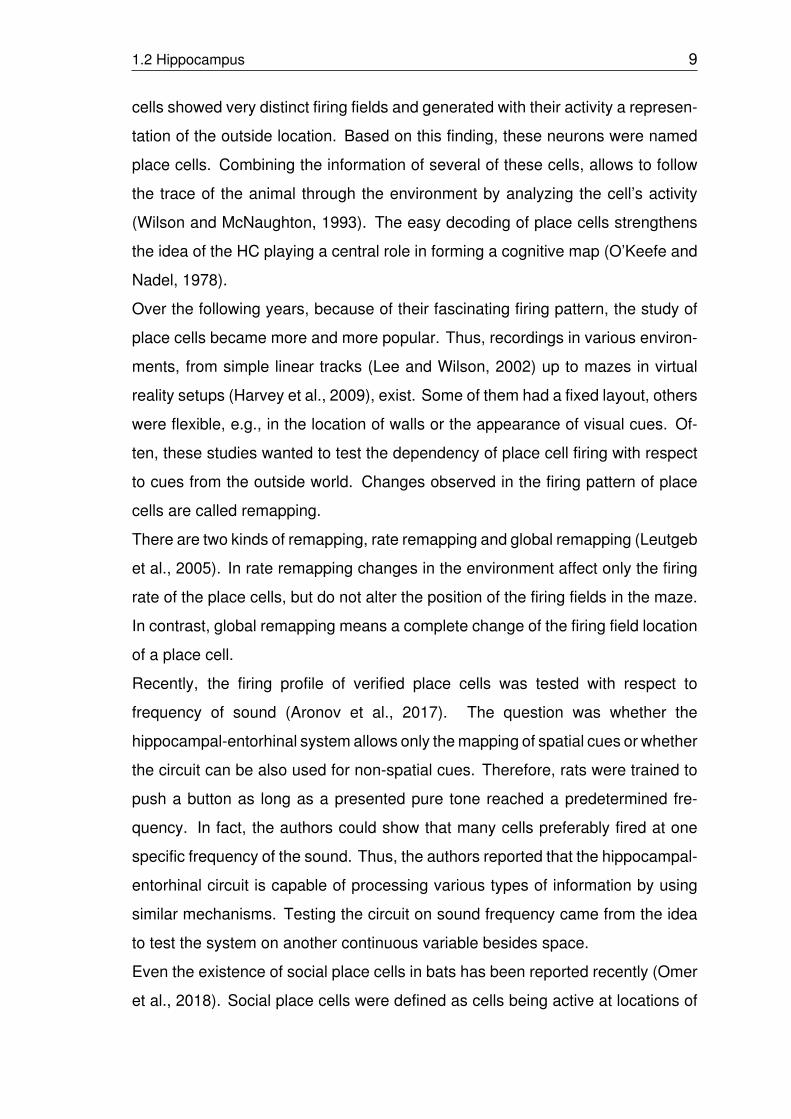
cells showed very distinct firing fields and generated with their activity a represen-tation of the outside location. Based on this finding, these neurons were namedplace cells. Combining the information of several of these cells, allows to followthe trace of the animal through the environment by analyzing the cell’s activity(Wilson and McNaughton, 1993). The easy decoding of place cells strengthensthe idea of the HC playing a central role in forming a cognitive map (O’Keefe andNadel, 1978).Over the following years, because of their fascinating firing pattern, the study ofplace cells became more and more popular. Thus, recordings in various environ-ments, from simple linear tracks (Lee and Wilson, 2002) up to mazes in virtualreality setups (Harvey et al., 2009), exist. Some of them had a fixed layout, otherswere flexible, e.g., in the location of walls or the appearance of visual cues. Of-ten, these studies wanted to test the dependency of place cell firing with respectto cues from the outside world. Changes observed in the firing pattern of placecells are called remapping.There are two kinds of remapping, rate remapping and global remapping (Leutgebet al., 2005). In rate remapping changes in the environment affect only the firingrate of the place cells, but do not alter the position of the firing fields in the maze.In contrast, global remapping means a complete change of the firing field locationof a place cell.Recently, the firing profile of verified place cells was tested with respect tofrequency of sound (Aronov et al., 2017). The question was whether thehippocampal-entorhinal system allows only themapping of spatial cues or whetherthe circuit can be also used for non-spatial cues. Therefore, rats were trained topush a button as long as a presented pure tone reached a predetermined fre-quency. In fact, the authors could show that many cells preferably fired at onespecific frequency of the sound. Thus, the authors reported that the hippocampal-entorhinal circuit is capable of processing various types of information by usingsimilar mechanisms. Testing the circuit on sound frequency came from the ideato test the system on another continuous variable besides space.Even the existence of social place cells in bats has been reported recently (Omeret al., 2018). Social place cells were defined as cells being active at locations of

10 1. Introduction
an observed conspecific. To define social place cells, the firing activity of a placecell in the observer bat was mapped onto to movement trace of the watched con-specific. A similar experiment was performed in rats (Danjo et al., 2018).To what extend the activity in the neurons of the observer represents a socialplace cell or planning of future movement is highly debated. The authors claimthat future planning can be excluded as the fields do not vanish when sharp-waveripples are disrupted in the observer, although they would be necessary for actionplanning (Omer et al., 2018).
Figure 1.2: Rate maps of spatially organized cells in the HF. Blue colors indicate low
firing rates, whereas red colors stand for high firing rates. The number below depicts the
peak firing rates. (A) Place cells in the CA1. (B) Grid cells in the MEC. (C) Boundary
vector cells in the MEC. Adapted from Sanders et al. (2015) with permission.
1.2.4 Other spatially organized cells in the HF
Additionally, to the spatially organized place cells in the HC, a variety of cells canbe found in the EC and surrounding structures, which also exhibit location depen-dent firing patterns (see Figure 1.2).

1.2 Hippocampus 11
As referred to before, in 2014 the Nobel Price was not only awarded to JohnO’Keefe for the discovery of place cells, but also to May-Britt and Edvard Moserfor being the first to describe grid cells in the EC of rats (Fyhn et al., 2004; Haftinget al., 2005). In contrast to most of the place cells, grid cells posses several firingfields in one environment. These fields are not distributed randomly, but followa very specific and highly interesting pattern. They are arranged in a hexagonalfashion. The single fields of these grids vary in size along the dorsal-ventral axis(Brun et al., 2008) and they come in various orientations. Together with placecells they form a distinct representation of the outside location which is easy todecode.Another type of important cells, regarding the navigation through space, are head-direction cells (Taube et al., 1990a). As the name implies, firing of these cellsdepends on the direction of an animal’s head on a horizontal plane. Very earlyon, it was clear that the firing largely dependent on the environment with its localand distal cues (Taube et al., 1990b). By changing these cues one can shift thepreferred angle of a head-direction cell.Sargolini et al. (2006) could show that in deeper layers of the medial EC conjunc-tive cells, exhibiting the properties of grid and head-direction cells, can be found.Additionally, the activity of these cells depends on the running speed of the animal,a property also reported in plain grid and head-direction cells. The convergenceof information about direction, movement, and position within these conjunctivecells indicates a possible role of these neurons in updating the grid coordinatesduring exploration.The next class of spatially dependent firing cells are border cells (Solstad et al.,2008). These neurons are located in the medial EC as well as the parasubiculumand fire with respect to geometric borders, e.g., the wall of a maze. Border cellsbecome active when the animal is, e.g., close to the wall.Furthermore, Lever et al. (2009) found boundary vector cells in the subiculum.The activity of these cells is determined by the distance to a boundary, with eachcell having a peak firing rate at a different distance. Their existence has been pre-dicted since 1996 to explain the expansion of a place field when an environmentis stretched (O’ Keefe and Burgess, 1996; Burgess and O’Keefe, 1996).
12 1. Introduction
Recently, the finding of speed cells has been reported in the medial EC (Kropffet al., 2015). These neurons adapt their firing rate with respect to the runningspeed. Thus, they could serve as information source about the velocity of theanimal for grid cells to adapt their firing rate.The list of cells with spatial firing of spatially firing cells corresponds to the cur-rent view but might be incomplete. New cell types, like the social place cell or thesound dependent cells are described. To what extent these cell types can be infact considered completely new types is a matter of debate. Hereby, the exper-imental protocols carefully need to be analyzed. Especially an expected rewardhas the tendency to increase firing in certain cells and thereby strongly influencesthe firing pattern.
1.2.5 Hippocampal oscillations
Depending on the current state of the brain, largely constrained by the behavior,different oscillations are particularly obvious in electroencephalography (EEG) orlocal field potential (LFP) recordings of the HC (Draguhn and Buzsaki, 2004). Ingeneral, local synchronous rhythms seem to be important to select inputs and pro-vide plasticity in the underlying network (Draguhn and Buzsaki, 2004). Oscillationsof different frequency bands often show close relationships to certain behaviouralstates. Comparing, e.g., the awake to the sleeping brain, reveals profound differ-ences in the power spectrum.In the context of memory formation, oscillations in the cortex are thought to providetime windows in which information transfer and storage is possible. This might beachieved, e.g., by synchronizing the phases of oscillations over different brain re-gions and thereby establishing precise spike timing.Here, I want to give a short overview of the three prominent oscillations in thecortex. Each type is characterized by a frequency band which exact borders arehighly debated among scientist. Thus, the given values below do not need to beseen as exact numbers but rather as a rough range of the respective frequencyband for different oscillations in the HC.

1.2 Hippocampus 13
Theta. An oscillation with a frequency between 8 to 10 Hz is called theta.Theta oscillations are highly prominent during locomotive behavior and rapid eyemovement sleep (REM) (see Figure 1.3). In contrast, they are mainly absentduring resting behavior and slow wave sleep (Jouvet, 1969). Interestingly, thetafrequency exhibits a strong correlation with the running speed (Fuhrmann et al.,2015).Different mechanisms seem to be able to generate theta, with pyramidal neuronsbeing discharged in a synchronous fashion (Buzsáki et al., 1983). This, in turn,induces a synchronous discharge of interneurons, targeted by the pyramidal cells(Tóth and Freund, 1992).
A
B walking
still
Figure 1.3: Hippocapal oscillations. Depending on the behavior of an animal, the LFP
shows different oscillatory pattern. The figure shows the oscillatory differences in the
hippocampus of a rat while it is moving or inactive (still). (A) The green curves show how
the LFP changes over time when the behavior of an animal switches from moving (left
side) to still (right side). The upper curve depicts the recording in the left hemisphere (LH)
and the lower one in the right hemisphere (RH). (B) The upper rat is moving, while the
lower one is still. Next to each rat characteristic voltage traces for the two behavioral states
are shown, filtered in the frequencies indicated above. In case of a moving animal, theta
oscillations are prominent (around 8 Hz). In resting behavior strong voltage deflections,
sharp waves are apparent. Adapted from Buzsáki (2015) with permission.
14 1. Introduction
Theta rhythm became particularly interesting when single spiking activity of pyra-midal neurons in the HC were analyzed with respect to the phase of the oscilla-tion. Skaggs et al. (1996) reported a shift in phase when passing through severalcycles. Spikes appear earlier and earlier in phase. This phenomenon is calledphase precession. During one theta cycle, only a minor fraction of CA1 pyramidalneurons is active (Csicsvari et al., 1998). They correspond to the place cells beingactive at the current location.A link between theta and memory formation in rodents was already provided byWinson (1978). He disrupted hippocampal theta oscillations during a spatial learn-ing task whereby the memory performance of the animals decreased. In humans,Backus et al. (2016) were the first to show electrophysiological evidence for the im-portance of hippocampal theta in the process of memory integration. They founda positive correlation between theta power during memory encoding and the laterperformance in memory recall.
Gamma. Gamma oscillations are faster than theta. They are often subdividedinto fast gamma from 40 to 100 Hz and slow gamma from 25 to 50 Hz. Their am-plitude is typically lower than the one of theta oscillations (Buzsáki et al., 1983).The two subtypes seem to have different origins. Whereas fast gamma is gen-erated in medial EC, slow gamma originates in CA3 (Csicsvari et al., 2003). Byvarying the interplay between these rhythms it appears to be possible to guideinformation flow during memory formation through connection of specific cell as-semblies (Colgin et al., 2009). In these processes precise timing is the key feature.Coordinated spike times might be enabled through synchronization to certain fre-quencies. Here, it is hypothesized that hippocampal theta plays an important rolein the entrainment of gamma (Sirota et al., 2008).
Sharp-wave ripples. During slow-wave sleep and waking immobility, LFPrecordings in the HC exhibit in a regular fashion high voltage deflections, sharp-waves (see Figure 1.3), accompanied by fast oscillation, ripples, in the range of150 to 200 Hz. First described by Buzsáki et al. (1992), very early on, they wereassociated with memory consolidation.

1.2 Hippocampus 15
As sharp-wave ripples (SWR) can be observed in detached hippocampal slices,the HC itself is a good candidate as their origin (Kubota, 2002). Even CA1minisclices, with CA1 being detached from CA3, can exhibit SWRs (Maier et al.,2011).Spikes of CA1 place cells show phase locking to ripples in CA1, which arguesagainst an entrainment of CA1 firing by CA3 (Sullivan et al., 2011). But CA3 maystill alter the firing properties of CA1 cells during ripples as it can be seen in re-play. The phenomenon of replay is dealt with in greater detail the subsequentparagraph.Before I explain the phenomenon of replay, I would like to go a bit more into de-tail about the relevance of SWR currents for memory consolidation. To test theirimportance, a straight-forward approach is to block SWRs during a sleep period di-rectly following a spatial learning task (Girardeau et al., 2009, 2014). In this study,an online detection mechanism was used to filter SWR during the experiment byapplying a threshold in the ripple frequency band. The detected SWR could beblocked by directly inserting an electric pulse. Girardeau et al. (2009) showed thatrats with post-learning SWR blockage performed worse in the task than the con-trol groups. They controlled for effects of the electrical pulse in general by testingunimplanted animals, as well as for the specificity of the stimulation by applyinga pulse 80-120 ms after SWR detection. Both control groups exhibited a similarperformance index, measuring the memory stability over several days after thelearning task.Jadhav et al. (2012) conducted a similar experiment. Instead of blocking SWRduring post-learning sleep, they blocked SWR occurring in awake rats during theperformance of a spatial alternation task. This also resulted in a performanceloss.A later study could identify NMDA receptors as an important component in in-creasing the SWR drive(Girardeau et al., 2014). Blocking NMDA receptors beforetraining of a spatial learning task resulted in a lower performance of the tested an-imals. Those results suggest that the consolidation of spatial memories duringsleep is regulated by processes that depend on NMDA receptors.Together, these studies provide strong evidence for SWR playing a crucial role in

16 1. Introduction
the process of memory consolidation.The mechanisms behind SWR generation are still under debate and various mod-els exist (Donoso et al., 2018). A major point of debate is the origin of SWR oscil-lations, i.e., do SWR originate from excitation, inhibition, or a combination of both(Draguhn et al., 1998; Memmesheimer, 2010; Ylinen et al., 1995; Stark et al.,2014).In the case of models based on excitatory induced fast oscillations, pyramidal cellsare thought to propagate their signals in a second stage to inhibitory interneu-rons. The two studies mentioned here, propse different ways of transmission.While Draguhn et al. (1998) suggested a signal transmission via axo-axonic gap-junctions, later Memmesheimer (2010) introduced the concept of supralinear den-dritic interactions as a potential mechanism for these coherent oscillations.In models that rely on inhibition as a source for SWR, the focus lies on recurrentnetworks of interneurons in area CA3 (Taxidis et al., 2012). These are assumedto generate fast oscillations which in a second step serve as pacemakers for pyra-midal neurons in CA1. The transmission to CA1 could either happen via Schaffercollaterals (Csicsvari et al., 2000) or through activation of local pyramidal cells(Stark et al., 2014).
Replay. The term replay describes a specific pattern of the single cell spiking ac-tivity of pyramidal cells during SWR. As explained before, during free explorationof an environment, tracking the firing of place cells allows for reconstruction of thepathway the tested animal took. Wilson and McNaughton (1994) were the firstto describe a correlation between the firing of these cells during exploration andtheir activity during resting. Namely, place cells firing together while the animalexplored the environment, had the tendency to fire together during subsequentsleep sessions as well. To unravel this phenomenon, detailed multi-site record-ings were necessary.Later on, it was even shown that the relative firing order is preserved Lee andWilson (2002). The replay during sleep is considered as a re-experience of theprevious behavior and thereby as a strong hint that SWR are important in mem-ory consolidation. Moreover, the faster timescale of replay fits the activity profile

1.2 Hippocampus 17
of NMDA receptors which are important in spike-timing dependent plasticity (Gi-rardeau et al., 2009).Interestingly, analysis of single cell activity during short resting times directly aftera running session shows reversed replay (Foster and Wilson, 2006). This couldbe considered to express immediate processing of a recent event.Within 2d environments, a form of replay before a goal-directed behavior was de-scribed (Pfeiffer and Foster, 2013). Thus, replay seems to allow goal-directedmovement, an essential part of spatial learning.
Models of ripple generation There are mainly three different types of modelstrying to explain the generation of ripple oscillations:
1. Axon-axon gap junctions between CA1 pyramidal neurons (Traub and Bib-big, 2000)
2. Solely rhythmic perisomatic inhibition (Pangalos et al., 2013)
3. Phasic inhibition and excitation (Maier et al., 2011).
Based on electrophysiological findings (Draguhn et al., 1998), Traub and Bib-big (2000) developed the idea of an axon-axon gap junction model for ripples.Draguhn et al. (1998) described gap junction dependent 200 Hz oscillations inhippocampal slices, which appeared spontaneously. Spikelets, somatic depolar-izations with small amplitude, are thought to represent electrically coupled cells.Experiments could show a correlation between these spikelets and dye couplingof pyramidal cells (Perez-Velazquez et al., 1994). Schmitz et al. (2001) presentedevidence in favor of an axonal connection between two pyramidal neurons. Thisconnection would allow for a very fast information transfer between cells, as it isthought to happen during SWR.The idea of spikelets being important in this process was strengthened by the find-ing that a strong contribution to place cell firing comes from spikelets (Epszteinet al., 2010).In contrast, Pangalos et al. (2013) put their focus on perisomatic inhibition fromoriens-lacunosum-moleculare (O-LM) interneurons. According to their in vitrorecordings, O-LM neurons increase their firing during SWR due to excitatory
18 1. Introduction
ripple-locked inputs. Thus, in contrast to previous findings, there is enough ac-tivity in O-LM neurons in order to have influence on the synaptic input into CA1pyramidal neurons during SWR.Maier et al. (2011) go even a step further and assume that not only inhibition is akey player, but also excitation. By using in vitro and in vivo recordings, they foundevidence of a ripple modulated excitation.There is still an ongoing debate about whether or not phasic excitation plays acrucial role and is present. Gan et al. (2017) argue against the presence of aphasic excitation. In contrast, Hulse et al. (2016) present findings pointing in thedirection of a ripple generation that needs phasic excitation.
1.3 Learning and Memory
Learning is seen as the process of memory formation in order to store informationwhich can be later restored. Classically, memory can be split into a declarative(explicit) and nondeclarative (implicit) form (Squire, 1992; Squire and Zola, 1996).In everyday life the use of the word memory is typically associated with the declar-ative type.
Declarative Memory. Declarative memory describes the capacity to rememberevents and facts (Cohen and Squire, 1980). Studies with amnesic patients, e.g.,the famous patient H.M., revealed a tight connection between explicit memoriesand themedial temporal lobe structures. Thus, most studies concerned with learn-ing in the HC try to use experimental settings such that the subject has to use itsdeclarative memory.
Nondeclarative Memory. The term nondeclarative memory was establishedby Squire and Zola-Morgan (1988) to replace the term procedural memory asantagonist for declarative memory (Winograd, 1975). Thereby, it becomes atrue opposite of declarative memory as it includes learning types that are notskill-based like classical conditioning. All of these nondeclarative memory abilitieshave an implicit information acquisition in common. Nevertheless, they include

1.3 Learning and Memory 19
a variety of learning and memory types and are, unlike the declarative memory,associated with multiple brain areas.
Furthermore, the division into short-term and long-term memory is widelyused with short-term memory comprising memories lasting seconds to minutes.From a molecular perspective this classification is interesting, as long-termmemory is dependent on protein synthesis, whereas short-term memory is not(Davis and Squire, 1984; Goelet et al., 1986). Thus long lasting memories can beaffected by disruption of protein synthesis, whereas short-term memories cannot.
Memory Capacity. Memory capacity describes the amount of information thatcan be stored and successfully reproduced. Among other possible ways, behav-ioral events can be memorized as sequences of neuronal activity, e.g., as it isobservable in the HC during replay of place cell activity (Pastalkova et al., 2008).Thus, the number of sequences that can be correctly replayed can be seen as ameasurement for memory capacity.Memory capacity is impacted by different factors (Leibold and Kempter, 2006).Those factors include the complexity of the sequence, i.e., its length, as well as themaximum amount of synaptic connections in the corresponding network. Longersequences are harder to reproduce and more prone to mistakes. Increasing thenumber of synapses allows for more synaptic combinations. Consequently, higherconnectivity increases the memory capacity of a network.
1.3.1 Learning in the Hippocampus
In 1989, Buzsáki proposed a ”two-stage model of memory formation”, comprisingthe following steps (Buzsáki, 1989):
1. Encoding
2. Consolidation.
The first stage is accompanied by theta oscillations, whereas the later one by rip-ple oscillations.As explained before, memory consolidation is tightly linked to the phenomenon of
20 1. Introduction
ripples in the HC and disruption of ripples in rodents results in impaired behaviorin memory tasks. Memory consolidation describes the process of transferring amemory representation from its transitional place, e.g., the HC, to a place for long-term storage. The neocortex was proposed as a possible candidate for long-termmemory. Especially associative cortices are known to be highly interconnectedwith temporal lobe structures like the HC. Additionally, cortical spindles, oscilla-tions at 12 Hz which appear during non REM sleep, co occur with hippocampalripples (Peyrache et al., 2011). Ripple oscillations were also found in the posteriorparietal and midline cortex and were time wise correlated to hippocampal ripples(Khodagholy et al., 2017), thus, providing strong evidence for these cortical struc-tures to be involved in memory consolidation.
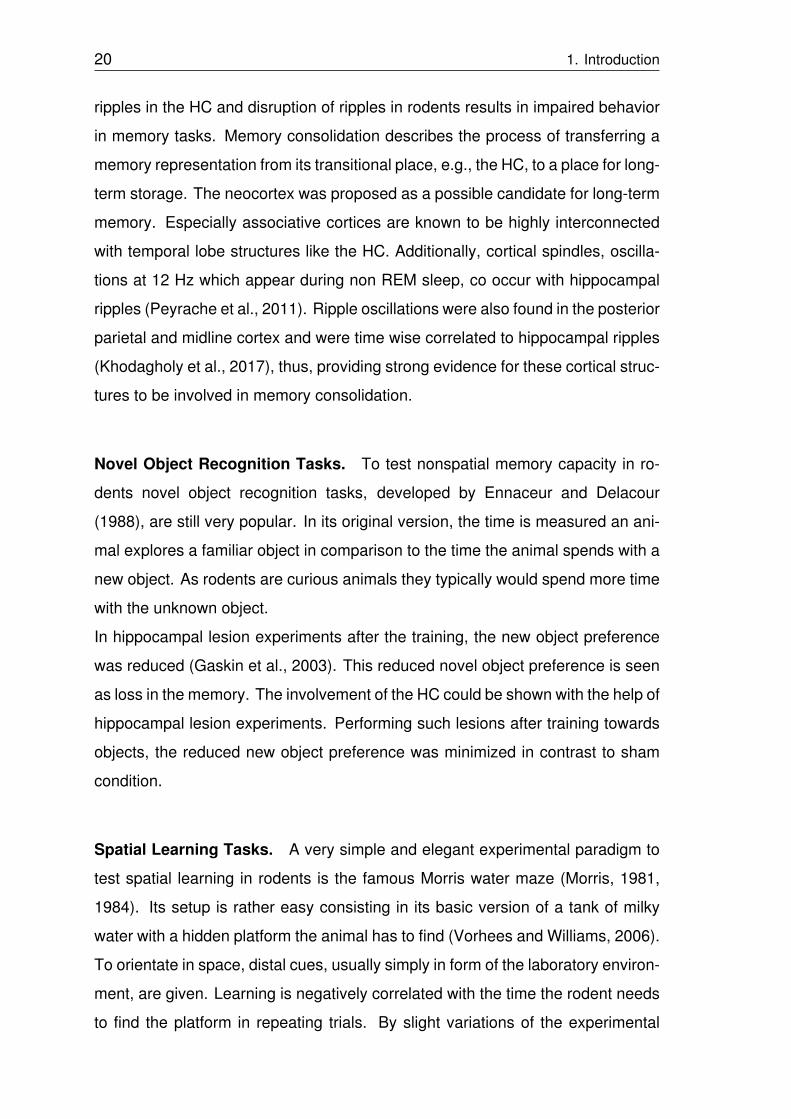
Novel Object Recognition Tasks. To test nonspatial memory capacity in ro-dents novel object recognition tasks, developed by Ennaceur and Delacour(1988), are still very popular. In its original version, the time is measured an ani-mal explores a familiar object in comparison to the time the animal spends with anew object. As rodents are curious animals they typically would spend more timewith the unknown object.In hippocampal lesion experiments after the training, the new object preferencewas reduced (Gaskin et al., 2003). This reduced novel object preference is seenas loss in the memory. The involvement of the HC could be shown with the help ofhippocampal lesion experiments. Performing such lesions after training towardsobjects, the reduced new object preference was minimized in contrast to shamcondition.
Spatial Learning Tasks. A very simple and elegant experimental paradigm totest spatial learning in rodents is the famous Morris water maze (Morris, 1981,1984). Its setup is rather easy consisting in its basic version of a tank of milkywater with a hidden platform the animal has to find (Vorhees and Williams, 2006).To orientate in space, distal cues, usually simply in form of the laboratory environ-ment, are given. Learning is negatively correlated with the time the rodent needsto find the platform in repeating trials. By slight variations of the experimental

1.3 Learning and Memory 21
setup, e.g., removing or shifting the platform location, different forms of learningcan be tested. Another neat advantage is the fact that no pretraining of the ani-mals is required. Nevertheless, there is one big disadvantage, namely the water.Being no concern if one is interested in the rodents behavior, it becomes an issuewhen one wants to perform recordings in the brain. One possible workaround arevirtual reality (VR) setups.By using VR, the concept of the Morris water maze can now even be applied inhumans and can be, e.g., combined with magnetoencephalographic recordings(Cornwell et al., 2008).A common alternative to test spatial memory capabilities are radial arm mazes(Olton and Samuelson, 1976). Here, from a central platform, several linear tracksgo off and the tested animal has to remember, with the help of distal cues, e.g. inwhich arm it already went in order to receive a reward.Spatial learning tasks become even more interesting when considering associa-tive memories. Meaningful events like fear or a reward situation can be associatedwith certain locations. The storage of these associations is linked with strength-ening of synaptic connections (Hebb and Bussey, 1949). On this cellular levelof learning, high frequency inputs can induce changes at the synapse, which arelong lasting, known as long-term potentiation (LTP) (Bliss and Gardner-Medwin,1973).
Learning on a synaptic level. The term long-term potentiation goes back to1973 (Bliss and Gardner-Medwin, 1973). As already marked, LTP describes thestrengthening of synaptic efficiency. It can be artificially induced by applying highfrequency stimulation. It was first observed in the perforant path of the HC andhas since then been described in a lot of other excitatory pathways.The role of LTP, in the the context of learning in the HC, can be best investigatedby disabling LTP during learning tasks. To do so, it is helpful to know that N-methyl-D-aspartate receptor (NMDAR) activation is crucial for the induction of alarge part of LTP types (Collingridge et al., 1983). Thus, it is sufficient to blockNMDAR in order to block at least these specific forms of LTP. The blocking canbe achieved mainly with two different approaches.

22 1. Introduction
On the one hand, there is the pharmacological approach, where a NMDAR an-tagonist is region specifically applied. On the other hand, one can use geneticallymodified mice to prevent the formation of NMDA receptors in defined brain areas.The difficulty with pharmacological NMDAR antagonists is their precise applica-tion, which is virtually not possible. Thus, any experimental outcome has to beinterpreted with care.Long-term depression (LTD) describes the opposite effect of LTP, namely low-ering the effectiveness of synapses over a longer period of time (Bramham andSrebro, 1987). It can be induced by continuously applying a low frequency stim-ulus.
1.3.2 Computational single cell models
To study the computational properties of single neurons, a huge variety of mod-els is available (for reference see, e.g. Abbott and Dayan (2001)). The selectionranges from stochastic models up to biophysically more realistic representations.Neurons can be described with one equation for the whole cell or a complex com-bination of thousands of differential equations. The complexity of themodel shouldbe chosen depending on the scientificquestions. Simple single cell models are agood choice when the focus lies on big neuronal networks. In contrast, highly de-tailed, biophysically inspired cell models are preferably selected when the focuslies on inner cell computations. Today, supercomputers allow scientists to builtcomplex neuronal networks with detailed single neuron models. Nevertheless,simple models don’t lose their right to exists. The fewer parameters used, theeasier it is to interpret the results in a meaningful way.The following section deals with models based on equations for membrane poten-tial changes. In their ordinary form, a whole cell is regarded as one compartment,described by a single membrane voltage Vm. As input, these cell models receiveelectrical currents I.
Integrate-and-fire neuron The integrate-and-fire neuron is represented by thefollowing equation
I(t) = CmdVm(t)
dt. (1.1)

1.3 Learning and Memory 23
with Cm being the membrane capacitance. Membrane voltage changes are rep-resented over the time. Additionally, a voltage threshold has to be set. When thethis threshold is crossed a spike is elicited in the form of a delta function and thevoltage returns to resting state.
Leaky integrate-and-fire neuron As the name implies, the leaky integrate-andfire neuron has an additional term for the membrane leakage Ileak. This currentmimics the ion permeable membrane and thereby allowing the membrane voltageto return to equilibrium potential even when subthreshold inputs are applied. Withthe leak current the equation changes to
I(t)− Ileak = CmdVm(t)
dt, (1.2)
with Ileak =Vm(t)Rm
.
Hodgkin-Huxley typemodel TheHodgkin-Huxleymodel extends the integrate-and-fire neuron with terms for different ion channels (Hodgkin and Huxley, 1952).In the classical version those are sodium, potassium, and a leakage current. Asbase the current is computed the following way
Ii = gi(Vm − Ei). (1.3)
Here, gi denotes the conductance of channel i and Ei its reversal potential. Thesum of sodium, potassium, and leak is represented by
Im = gleak(V − Eleak) + gKn4(V − EK) +m3hgNa(V − ENa). (1.4)
The letters n, m, and h denote the gating variables, which describe the openingand closing dynamics of the channels with respect to membrane voltage changes.Those changes follow the equation
dn
dt= αn(V )(1− n)− βn(V )n, (1.5)
where αn(V ) is the opening and βn(V ) the closing rate. The formula can be rewrit-ten as τn(V )dn
dt= n∞(V )− n, with
τn(V ) =1
αn(V ) + βn(V )(1.6)
24 1. Introduction
andn∞(V ) =
αn(V )
αn(V ) + βn(V ). (1.7)
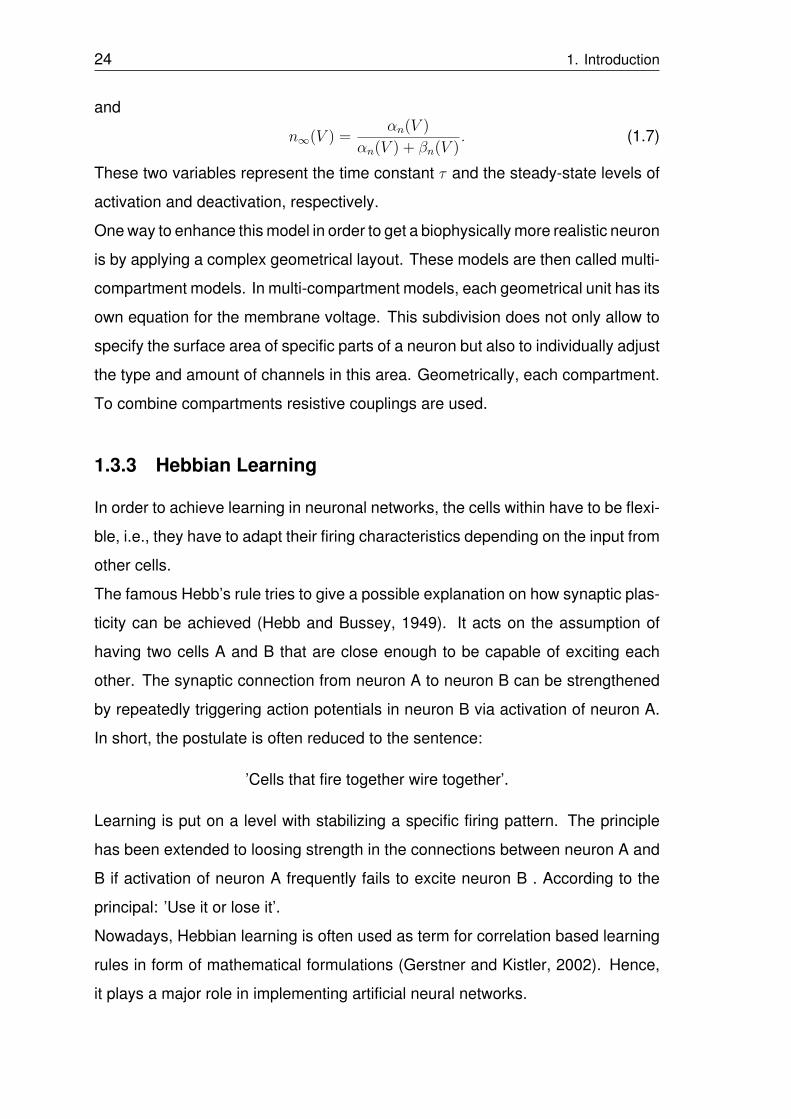
These two variables represent the time constant τ and the steady-state levels ofactivation and deactivation, respectively.Oneway to enhance thismodel in order to get a biophysically more realistic neuronis by applying a complex geometrical layout. These models are then called multi-compartment models. In multi-compartment models, each geometrical unit has itsown equation for the membrane voltage. This subdivision does not only allow tospecify the surface area of specific parts of a neuron but also to individually adjustthe type and amount of channels in this area. Geometrically, each compartment.To combine compartments resistive couplings are used.
1.3.3 Hebbian Learning
In order to achieve learning in neuronal networks, the cells within have to be flexi-ble, i.e., they have to adapt their firing characteristics depending on the input fromother cells.The famous Hebb’s rule tries to give a possible explanation on how synaptic plas-ticity can be achieved (Hebb and Bussey, 1949). It acts on the assumption ofhaving two cells A and B that are close enough to be capable of exciting eachother. The synaptic connection from neuron A to neuron B can be strengthenedby repeatedly triggering action potentials in neuron B via activation of neuron A.In short, the postulate is often reduced to the sentence:
’Cells that fire together wire together’.
Learning is put on a level with stabilizing a specific firing pattern. The principlehas been extended to loosing strength in the connections between neuron A andB if activation of neuron A frequently fails to excite neuron B . According to theprincipal: ’Use it or lose it’.Nowadays, Hebbian learning is often used as term for correlation based learningrules in form of mathematical formulations (Gerstner and Kistler, 2002). Hence,it plays a major role in implementing artificial neural networks.

1.3 Learning and Memory 25
Artificial neural networks
One of the original neural network models for associative memory is the Willshawmodel (Willshaw et al., 1969). The goal is to store a number of P memories, socalled pattern.The Willshaw model convinces by its very simple learning rule. The most sim-ple version consists of two neuronal layers each with N excitatory neurons. Thesynaptic efficacy between two neurons is notated by Jji, with j being the jth presy-naptic neuron and i the ith postsynaptic neuron. If both cells are active in onepresented pattern, Jji is set to 1, otherwise it remains 0. Each memory can berepresented by a vector V , for the first layer Vi with i = 1, ..., N , which leads to asynaptic matrix
Jji = Θp∑
µ=1
V µi V
µj . (1.8)
Early versions of the model were limited to excitation, as the ability to storeinformation was mainly assigned to excitatory synapses. When it became clearthat inhibition cannot be neglected, the model was extended such that onesynapse combines excitatory and inhibitory properties at the same time. Lateraddition of an independent inhibitory synapse enhanced the significance of themodel (Golomb et al., 1990; Shim et al., 1991). Thereby, the model resemblesmore physiological findings.The basic Willshaw model allows for all these adaptations and hence, is still anoften used base for neural networks, especially in the context of sparse coding.In general, artificial neural networks are a big field and recently, their popularityincreased in the field of artificial intelligence and machine learning.
26 1. Introduction
1.4 Sound localization
Localizing the source of a sound can be very crucial for the survival of an animal,e.g. in the case of a prey trying to avoid its predator. Thus, it might not be asurprise how precise this ability is in some species. Nevertheless, it is very im-pressive.In particular, humans have to be mentioned. They can discriminate angularchanges of sound source of around 1 degree (Blauert, 1970).Physically, sound is nothing but a vibration generating a traveling pressure wavethrough a medium, e.g., the air or water. A sound wave is characterized throughdifferent parameters: amplitude, frequency, and speed. These parameters al-ter due to the distance a sound wave is traveling or changes in the medium it istraveling through.
Monaural Sound Localization. Already the sound arriving at one ear typicallycontains spatial information. Responsible for this is a combination of different ef-fects. The ability that even one ear is capable of locating sounds was found veryearly on (Angell and Fite, 1901). In the 80s it was debated whether these monau-ral cues can only extract the elevation (Oldfield and Parker, 1986) or if they alsoadd information to azimuth, the horizontal plane position (Butler, 1986). To gatherdirectional information using just one ear seems to be an interplay between twothings, spectral cues from the pinna and alterations through the head-shadow ef-fect (Van Wanrooij, 2004). Whereas, healthy binaural subjects seem to disregardthe head-shadow effect completely, for monaural listeners it appears to be a cru-cial input for sound localization.
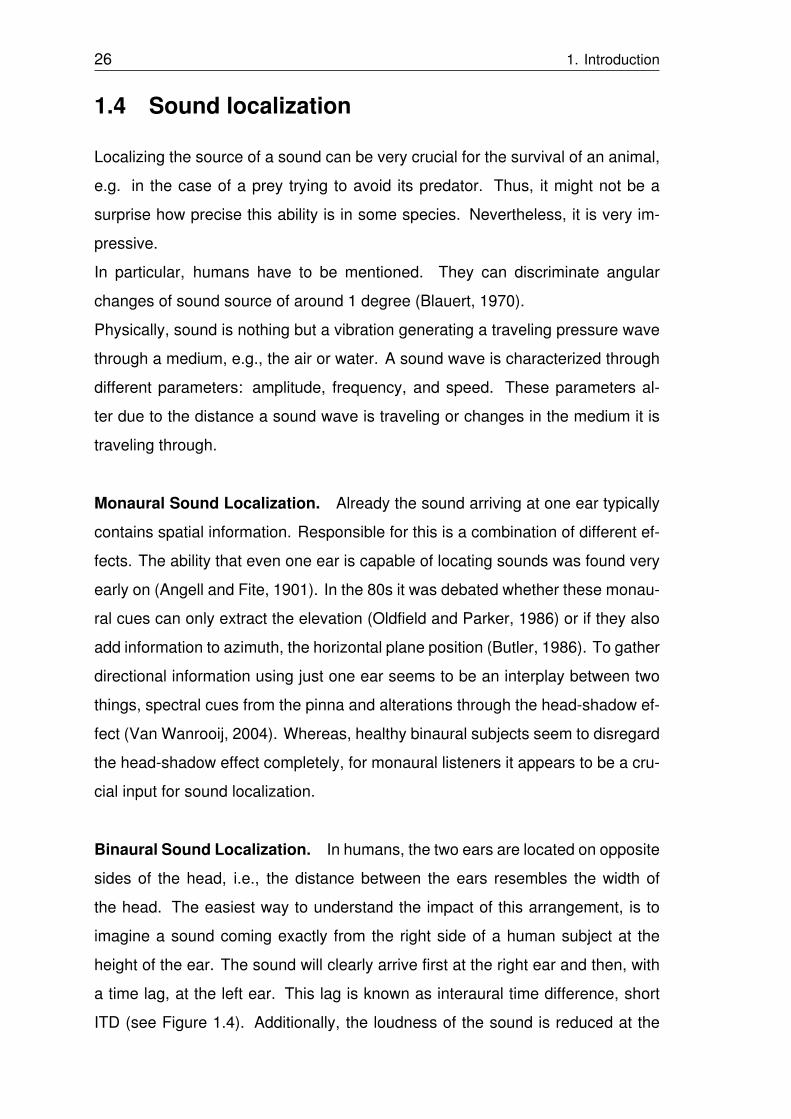
Binaural Sound Localization. In humans, the two ears are located on oppositesides of the head, i.e., the distance between the ears resembles the width ofthe head. The easiest way to understand the impact of this arrangement, is toimagine a sound coming exactly from the right side of a human subject at theheight of the ear. The sound will clearly arrive first at the right ear and then, witha time lag, at the left ear. This lag is known as interaural time difference, shortITD (see Figure 1.4). Additionally, the loudness of the sound is reduced at the

1.4 Sound localization 27
left ear, because of a higher distance to the sound source. The difference inloudness is called interaural level difference, ILD. Together, ITD and ILD providegood information about the direction a sound is coming from (Thompson, 1882).
Figure 1.4: Cues for binaural hearing. Left side depicts interaural time differences,
whereas on the right side interaural level differences are shown. Adapted from Grothe
and Pecka (2014) with permission.
Changing the position of the sound source alters both, ITD and ILD. Shifting asound source from the right side horizontally on a planar circle around the headtowards the front, i.e., facing the nose of a subject, ITD and ILD are reduced untilthey are zero.As already mentioned, humans are very accurate in determining the direction asound is coming from. In the case of ITDs, they can discriminate up to 10 µs(Klumpp and Eady, 1956). For ILDs, changes in the range of 1 to 2 decibel canbe detected (Middlebrooks and Green, 1991).Whereas the minimal ITD is determined by the internal speed of processing theinformation in the brain, the maximum ITD is restricted by head size. For hu-mans the maximum ITD is about 690 µs. Rodents have smaller values, e.g., themaximum ITD in gerbils is 120 µs (Maki and Furukawa, 2005). Gerbils are avery popular experimental animal in auditory research due to their hearing range(Ryan, 1976). With 0.1 to 60 kHz, their hearing range is comparable to the one inhumans with 20 Hz to 20 kHz, especially for the lower frequencies.

28 1. Introduction
It has to be noted that ILDs are particularly useful for high frequencies, whereasITDs are mainly used for low frequency sound localization. A first to describe thisseparated paths and giving it the name duplex theory was Lord Raleigh in 1907(Strutt (Lord Rayleigh), 1907).It has been shown that gerbils also make use of ITDs localizing low frequencysounds (Heffner and Heffner, 1988). An additional point for their popularity inauditory neuroscience.
1.4.1 Auditory pathways
As mentioned above, it is very impressive how precise sound localization is inhumans. Differences in microseconds can be detected. The brain is capable ofdoing so, despite the fact that the duration of an AP lies in millisecond range. Toachieve these levels of accuracy, a high precision in processing is needed in thebrain. For a detailed review on the following auditory pathways have a look atGrothe et al. (2010) and see Figure 1.5.Interestingly, with the calyx of Held, the largest synapse found in the human brain,is part of the auditory pathway (Held, 1893). It was named after the anatomistHans Held, who, with the help of Golgi stainings in the late 19th century, ex-tensively studied the pathways underlying the auditory system (see Schneggen-burger and Forsythe (2006) for a review). This very special synapse connects theanteroventral cochlear nucleus (AVCN) with the contralateral medial nucleus ofthe trapezoid body (MNTB), thereby taking care of a very accurate ILD process-ing.In the ILD processing circuit, the lateral superior olive (LSO) is the first nucleuswhich is sensitive to ILDs (Cant and Casseday, 1986). At the ipsilateral side,there is a direct excitatory connection between spherical bushy cells (SBCs) inthe cochlear nucleus (CN) and cells in the LSO (Ryugo and Sento, 1991). In-puts coming from the contralateral CN have to bypass two synapses. Globularbushy cells (GBCs) in the the contralateral CN project onto cells in the MNTB viathe already mentioned calyx of Held (Harrison and Warr, 1962). This excitatoryconnection is afterwards converted into an inhibition from the MNTB to the LSO(Friauf and Ostwald, 1988). It is assumed that the calyx of Held plays a crucial

1.4 Sound localization 29
part in this switch from a very precise excitation to a very precise inhibition (Her-mann et al., 2007).LSO neurons send out inhibitory projections to the ipsilateral dorsal nucleus ofthe lateral lemniscus (DNLL) and inferior colliculus (IC) and excitatory projectionsto the contralateral DNLL and IC (Adams, 1979). The IC is the second nucleusat which ILD sensitivity is created (Park and Pollak, 1994). Next to the binauralinhibitory input from ipsilateral, it receives monaural excitatory input from the ipsi-lateral CN (Adams, 1979).For this thesis more relevant is the pathway of ITD processing. Here, the impor-tant nucleus, to be mentioned, is the medial superior olive (MSO). As the MSO isvery crucial for study 2, after discussing the ITD processing pathway, I will dedi-cate a more detailed paragraph to it below.The very precise information transfer in the analysis of ITDs starts with the innerhair cells (IHC) in the cochlea (Galambos and Davis, 1943). Especially to lowfrequencies, these cells exhibit phase locking to the incoming wave form (Roseet al., 1967). The phase locking vanishes with increasing frequency, thereby lim-iting temporal information processing for high frequencies in this circuit.Information flow continues from GBCs and SBCs in the CN. Ipsilateral and con-tralateral SBCs send direct excitatory projections onto the MSO (Chirila et al.,2007). GBCs also establish excitatory connections, which are converted into in-hibitory connections onto the MSO. On the ipsilateral side, the change happensin the LNTB (Cant and Casseday, 1986), the contralateral projection switches toinhibition in the MNTB (Kuwabara and Zook, 1992). Thus, binaural excitatory andinhibitory inputs converge in the principal neurons of the MS0.From MSO neurons the signal is further transmitted to the DNLL and IC. In con-trast to LSO neurons, the MSO cells send out excitatory connections.Furthermore, ITD processing is also possible in the LSO, when considering lowfrequency stimuli (Tollin, 2005).
1.4.2 Medial superior olive (MSO)
The MSO is a nucleus located in the auditory brain stem. Exactly like the HC, an-alyzing the structure of the MSO goes back to Cajal (Ramón y Cajal, 1909). Cajal

30 1. Introduction
Figure 1.5: Projections from and to the medial superior olive (MSO) in a gerbil brain. Red
arrows mark excitatory connections, whereas blue arrows depict inhibitory projections.
The MSO receives in total 4 inputs. Contra- and ipsilateral ventral cochlear nuclei have
direct excitatory projections onto the MSO. Inhibitory input arrives at the MSO via the
lateral nucleus of the trapezoid body (LNTB) from ipsilateral and via the medial nucleus of
the trapezoid body (MNTB) from contralateral. Both LNTB and MNTB convert exciation
coming from the VCN into inhibition. The MSO targets the dorsal nucleus of the lateral
lemniscus and the inferior colliculus with excitatory synapses (not shown). Adapted from
Brand et al. (2002) with permission.
already proposed a possible role of the MSO in binaural hearing processing.The MSO has a laminar structure and is organized from dorsal to ventral accord-ing to frequency tuning (Stotler, 1953). The dorsal part is tuned to low frequencieswhereas the ventral part codes high frequencies (Guinan et al., 1972). The princi-pal cells in the MSO receive mainly four inputs, which arrive at the individual cell atvery distinct positions (Werthat et al., 2008). MSO neurons posses a very uniqueshape, with two major dendrites emerging from opposite sides of the cell (Kapferet al., 2002). They are all arranged with the same orientation in para-saggitalplane, giving the nucleus a very distinct look. Both ipsilateral and contralateralexcitation and inhbition target each principal neuron. The excitatory inputs comefrom SBCs (Chirila et al., 2007). The ipsilateral excitation targets lateral dendrites,
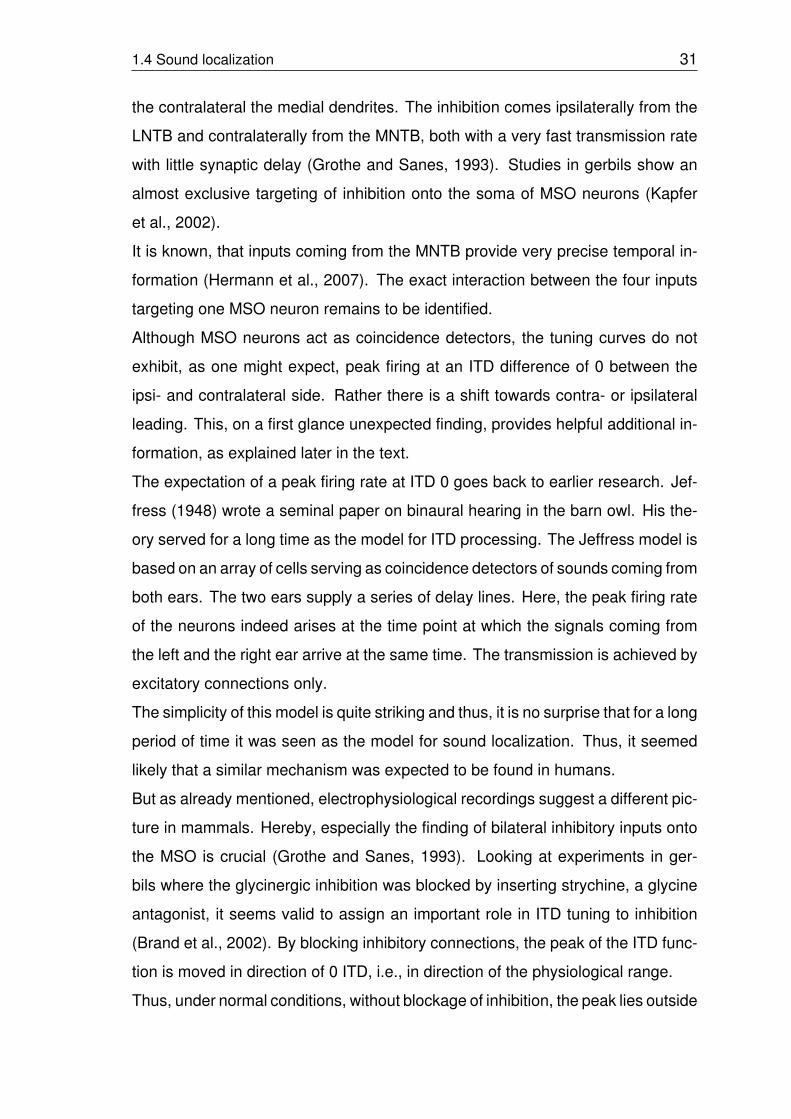
1.4 Sound localization 31
the contralateral the medial dendrites. The inhibition comes ipsilaterally from theLNTB and contralaterally from the MNTB, both with a very fast transmission ratewith little synaptic delay (Grothe and Sanes, 1993). Studies in gerbils show analmost exclusive targeting of inhibition onto the soma of MSO neurons (Kapferet al., 2002).It is known, that inputs coming from the MNTB provide very precise temporal in-formation (Hermann et al., 2007). The exact interaction between the four inputstargeting one MSO neuron remains to be identified.Although MSO neurons act as coincidence detectors, the tuning curves do notexhibit, as one might expect, peak firing at an ITD difference of 0 between theipsi- and contralateral side. Rather there is a shift towards contra- or ipsilateralleading. This, on a first glance unexpected finding, provides helpful additional in-formation, as explained later in the text.The expectation of a peak firing rate at ITD 0 goes back to earlier research. Jef-fress (1948) wrote a seminal paper on binaural hearing in the barn owl. His the-ory served for a long time as the model for ITD processing. The Jeffress model isbased on an array of cells serving as coincidence detectors of sounds coming fromboth ears. The two ears supply a series of delay lines. Here, the peak firing rateof the neurons indeed arises at the time point at which the signals coming fromthe left and the right ear arrive at the same time. The transmission is achieved byexcitatory connections only.The simplicity of this model is quite striking and thus, it is no surprise that for a longperiod of time it was seen as the model for sound localization. Thus, it seemedlikely that a similar mechanism was expected to be found in humans.But as already mentioned, electrophysiological recordings suggest a different pic-ture in mammals. Hereby, especially the finding of bilateral inhibitory inputs ontothe MSO is crucial (Grothe and Sanes, 1993). Looking at experiments in ger-bils where the glycinergic inhibition was blocked by inserting strychine, a glycineantagonist, it seems valid to assign an important role in ITD tuning to inhibition(Brand et al., 2002). By blocking inhibitory connections, the peak of the ITD func-tion is moved in direction of 0 ITD, i.e., in direction of the physiological range.Thus, under normal conditions, without blockage of inhibition, the peak lies outside

32 1. Introduction
the physiological range. Initially, this finding sounds counterintuitive, but this viewcan be changed, when drawing the attention away from the peak to the steepestslope of the function. In contrast to the peak, the slope lies within the physiologicalrange and could allow for a high acuity (Skottun, 1998). This theory includes thefinding that the highest resolution of MSO neurons lies at a rather low variancefiring rate.Overall, there is still room for further discussion about the underlying processesand to what extent results from mammals can be applied to birds and vice versa.Hereby, it is crucial to consider the evolutionary point of view: Processing of au-ditory spatial stimuli evolved independently in mammals and birds (Grothe et al.,2004). Hence, it seems rather valid to assume different ways to process informa-tion on a neuronal level.

1.5 Thesis Aims 33
1.5 Thesis Aims
The thesis is divided into two separate studies with a following discussion. Bothstudies have in common the use of a biophysically inspired, compartmentalizedneuronal model. Whereas the focus of study 1 lies on CA1 pyramidal neurons inthe HC, study 2 is concerned with the integration properties of MSO neurons.
Study 1 - Pattern Separation During Sharp-Wave Ripples using
Physiological Inputs
Sharp-wave ripple (SWR) oscillations can be recorded in the hippocampal LFPduring slow-wave sleep and quiet wakefulness. They are composed of a high volt-age deflection, paired with fast oscillations (ripples) in the range between around150 to 200 Hz (Buzsáki et al., 1992). Studies identified a connection betweenSWR and memory consolidation (Girardeau et al., 2009; Jadhav et al., 2012).During the occurrence of SWR, CA1 pyramidal neurons exhibit temporally pre-cise sparse firing (Wilson and McNaughton, 1994).In the here presented study, the focus lies on these oscillations and on how cel-lular mechanisms help to overcome the noise to integrate the incoming signals ina meaningful way. Biophysically inspired pyramidal cell models were used.The physiological inputs of the model are a distinctive feature of the model andused to test learning in a sparse recurrent network. These inputs are based on invitro recordings in the area CA1 during the spontaneous appearance of SWR(Maier et al., 2011). Parameters obtained from recorded currents were usedto recreate excitatory and inhibitory conductance traces that then served as ourmodel inputs.The first aim was to study the origin of the AP sequences that are observableduring SWR. The second aim was to test the hypothesis that the sparse recurrentnetwork in CA1 is sufficient to store and successfully recall sequences, despitehigh background activity.

34 1. Introduction
Study 2 - Action Potential Generation in an Anatomically Con-
strained Model of Medial Superior Olive Axons
The principal neurons in the MSO are characterized by a distinct electricalproperty, namely a high membrane conductance (Ratté et al., 2013). Thisproperty should make it very hard for the neurons to generate APs. Nevertheless,it is known from in vivo recordings that MSO neurons can produce APs with highfirings rates (Goldberg and Brown, 1969).This leaky membrane of MSO neurons arises from a certain arrangement ofion channels, especially Kv1 and HCN channels. The distribution of the latteris assumed to be crucial for the cell to work as a coincidence detector (Svirskiset al., 2004).The study is based on this observation and uses a mixture of computationalmodeling, in vitro recordings, and immunohistochemical stainings to analyze it.Thus, the aim of this study was to analyze, how precise ITD coding can beachieved in MSO neurons during a high-conductance state causing a shortmembrane time constant. The study tried to provide insights on the impact of thedistribution of ion channels across the membrane on the signal integration time.Additionally, the goal was to test the influence of varied input frequencies on thefiring threshold of a MSO cell.
Overall, both studies share the aim to unravel the cellular mechanisms underlyingthe ability to perform temporally very precise computations in a high-conductancestate.

2Study 1: Pattern Separation During Sharp-Wave
Ripples using Physiological Inputs
This work was done under the supervision of Christian Leibold (CL). FranziskaHellmundt (FH) and CL conceived and designed the research. FH wrote thecode, carried out the simulations and analyzed the data. FH and CL discussedthe results and wrote the manuscript.

Pattern Separation During Sharp-Wave Ripples using
Physiological Inputs
Franziska Hellmundt, Christian Leibold∗
Department Biology II, Ludwig-Maximilians-Universitat Munchen, Martinsried, Germany
Graduate School for Systemic Neurosciences Munich, Martinsried, Germany∗Bernstein Center for Computational Neuroscience Munich, Martinsried, Germany
author correspondence should be addressed to [email protected]
September 21, 2020
Abstract
Sharp wave ripple (SWR) events are brief deflections of the local field potential inhippocampal area CA1 that are associated with high frequency “ripples” and they of-ten coincide with recurring sequences of action potentials from the CA1 pyramidal cellpopulation. The mechanistic underpinnings of these SWR-associated sequences areunclear, particularly since CA1 is known to have only little recurrent synaptic connec-tivity. Nevertheless, these recurrent synapses exist and SWR have also been found inisolated CA1 preparations in-vitro. In this paper, we evaluated the hypothesis that thesparse CA1 recurrent connectivity could indeed be implementing a recurrent associa-tive network for storing sequences by stimulating model CA1 neurons with compoundsynaptic inputs recorded in an in-vitro model of the SWR state. Our simulations showthat, while history effects across cycles are indeed weak, the memory capacity thatcan be reached assuming physiological sparseness levels are much too low to supportthe model of a recurrent sequence memory. We thus conclude that the sequences ob-served during CA1 SWR in vivo must either result from intrinsic stereotypical burstof hyperexcitability, or involve pattern associations via extrahippocampal loops.
1

Introduction
Hippocampal sharp-wave ripple (SWR) events are characterized by large amplitude de-flections of the local field potential (LFP) in hippocampal stratum pyramidale (Buzsaki,1986) that are accompanied by a transient burst of high frequency (∼ 200 Hz) oscil-lations (Buzsaki et al., 1992). SWRs were classically thought to play a role in memoryconsolidation processes (Buzsaki, 1989, 2015), and more recently were shown to be involvedin path planning (Jadhav et al., 2012). The latter interpretation is particularly temptingbecause of the coincidence of SWRs with fast replay of place-field sequences (Lee andWilson, 2002; Gupta et al., 2010).
Furthermore, SWRs are generated intrinsically in the hippocampus (Sullivan et al.,2011; Maier et al., 2011; Oliva et al., 2016) and thus they may be population signaturesof memory-related activity patterns. The physiological mechanisms underlying sequencereplay during sharp waves are, however, unresolved. One potential explanation is thatsequential activity is merely reflecting different levels of excitability such that highly ex-citable cells fire early in a CA3-evoked burst, whereas less excitable cells are activatedtowards the end (Taxidis et al., 2012; Stark et al., 2015). A second explanation could bethat the sequential activity structure is actually encoded in the recurrent synaptic con-nections (Deuchars and Thomson, 1996; Maier et al., 2011) such that at each ripple cyclea different cell assembly is activated from the excitatory drive exerted by the assemblyactive in the previous ripple cycle either within (Deuchars and Thomson, 1996) our outsidethe hippocampus.
Mathematical models based on the second hypothesis are supported by the findingthat ripple-locked excitation has been observed in CA1 pyramidal cells in vitro even inan isolated CA1 preparation (Maier et al., 2011). However, as yet those models havemostly been discussed in discrete time, where a time step is assumed to reflect one ripplecycle (Leibold and Kempter, 2006; Kammerer et al., 2013). Generalizations to continuoustime (Jahnke et al., 2015) so far did not fully explore memory capacity of how many cycle-by-cycle transitions can be retrieved. In this paper, we are asking to which extent thesimplifications made in time discrete models are justified by the biophysical constraints ofa CA1 pyramidal cell simulated in continuous time, and how they would affect memorycapacity. These simplifications particularly concern the cellular memory time scale: Inorder for a cell to decide on a cycle-by-cycle basis whether it should fire in one specificripple cycle, its input to the previous cycles must have only little effect. Furthermore,we explore how the ripple-locked nature of inhibitory currents, and the resulting high-conductance state, would contribute to cycle-by-cycle memory retrieval.
Results
Validation of multi-compartment model
To assess the memory capacity of single ripple cycles in CA1 pyramidal neurons, wecreated a multicompartmental model of a CA1 pyramidal neuron consisting of a soma, anddendritic and axonal compartments. The model was fitted to yield typical input resistance,
2

resting potential and rheobase values (see Methods for details). Voltage responses of themodel cell were simulated for synaptic conductance traces that were reconstructed fromin-vitro slice recordings of CA1 pyramidal cells during sharp-wave ripples (Maier et al.,2011), where conductances were derived from double exponential fits (see Methods) ofboth excitatory and inhibitory compound postsynaptic currents (cPSC). Examples of suchconductance trains are shown in Fig.1 A. In our model, inhibitory inputs were located atthe soma, excitatory conductances at the dendritic compartment.
We first asked, how well the experimentally recorded synaptic inputs can drive ac-tion potentials in our model cell and found that using only the excitatory cPSCs giverise to spiking for 12 % of the recorded cPSCs (126 of 1051 cPSCs). We next intendedto combine excitatory cPSCs with inhibitory cPSCs (in total we generated 2000 of thoserandom stimulus combinations). However, as there are no simultaneous recordings of ex-citatory and inhibitory cPSCs, this required us to decide how cPSCs recorded in differentexperiments should be temporally aligned. The lack of simultaneous recordings of excita-tory and inhibitory cPSCs was due to experimental limitations. To gain either signal, thecorresponding other one needed to be blocked. To record excitatory cPSCs the holding po-tential was shifted towards the reversal potential of Cl−. Inhibitory cPSCs were recordedby pharmacologically blocking GABAergic synaptic inputs at single-cell level. One pos-sibility would be to align them with respect to the intracellular current recording, morespecifically using the fitted onset time of the cPSC (Fig.1 B top), the other possibilitywas to align inputs with respect to the extracellular recording, i.e., the sharp wave (SPW)peak (Fig.1 B bottom). Comparison of the intracellular cPSC Hilbert-phase distributionsbetween the two alignment methods reveals that, while the intracellular alignment, notsurprisingly, results in a better phase coordination in the first few cycles, the SPW peakalignment allows for phase coupling over larger number of cycles. Since we intended tostudy action potential generation over the whole extent of the SPW, we used the SPWpeak as the alignment criterion in what follows. Again measuring the percentage of trialswith action potentials, this time with SPW peak aligned excitatory and inhibitory inputs,we obtained an almost unchanged fraction of 11% action potential-eliciting stimuli (229 of2000). However, the percentage of about 11% active neurons is sparser than the firing ofCA1 pyramidal cells during SWRs in-vivo (Csicsvari et al., 1999, 2000). This suggests thata) pyramidal cells in-vivo are more easily excited than in-vitro and b) inhibition seems toonly have limited effects on the overall spike output but could rather affect the temporalorganization of AP firing. Potentially, the reduced fraction of APs in-vitro could be alsoexplained by less current inputs due to cutting synaptic connection in the slices, althoughthe 200 Hz ripples are very similar to ripples recorded in-vivo (Buzsaki, 1986). To test thelatter hypothesis we computed spike phases of our model outputs, and found that indeedthe action potentials only significantly lock to the ripple oscillation if inhibitory and exci-tatory cPSCs are combined (Fig. 1D). The firing phase of about 300 degrees is consistentwith in-vivo reports (Csicsvari et al., 1999, note that phase zero is set ripple peak with ourMethod, whereas phase zero corresponds to ripple troughs there). Moreover, phase-lockingalso sensitively depends on the overall excitability of the neuron, since adding an addi-tional depolarizing current injection increases spiking probability but removes significantphase locking at both conditions (with and without inhibition; Figure 1E).
3

Hence, our model of a CA1 pyramidal neuron exhibits sparse firing on physiologicalSWR inputs with phase-locking critically depending on the sparse activation and thepresence of inhibitory conductances.
History dependence of spike timing
As a next question, we asked how independent the neuron can process the inputs it receivesin subsequent ripple cycles and thus can function as a pattern associator on a cycle-by-cyclebasis.
To this end, the reconstructed cPSCs were modified such that spiking of the neuroncould be controlled at a specific ripple cycle. Therefore, we picked one cycle, e.g. cycle0 (see Fig. 2 A), and removed the PSCs from this specific cycle to replace them by asingle mean PSC for which we could freely vary the amplitude. These mean PSCs wereconstructed from double exponential fits (see Maier et al., 2011) using the mean rise anddecay times from the recorded excitatory PSCs. The amplitude of this ’artificial’ PSC wasthen increased until our model generated an action potential.
Figures 2 B to E depict the relationship between the minimal amplitude of the insertedPSC that elicited a spike and the amplitude of the experimentally measured excitatoryPSC at the preceding cycle. For pure excitatory inputs, we would expect a negativerelationship, such that excitation from preceding cycles reduces the needed amplitude inthe following cycle to elicit an AP. To test for effects of cycle number, we removed andreplaced PSCs at different ripple cycles from -2 to +1, with cycle 0 determined by theSWR maximum. Left columns show the results for purely excitatory inputs, whereas forthe right column excitation was combined with a randomly picked inhibitory cPSC asdescribed for Figure 1.
Only in the case of removing PSCs at cycle -2 a significant, but small negative re-lationship can be seen (see Figure 2 B and C, p values from Pearson’s correlation). Inthe other cases, a small but not significant negative trend remains and the values for theamplitude of the inserted PSC cluster at about 780 pA (see Figure 2 D and E; conduc-tance amplitudes are obtained by normalizing with the excitatory driving force of -70 mV).This amplitude corresponds to the amplitude needed to elicit an AP with a single PSC(with mean shape). When pairing the adapted excitatory cPSCs with unaltered inhibitorycPSCs, results are qualitatively similar except that there is even a slight positive trendobservable when PSCs are modified at cycle 0.
Thus, the influence from preceding cycles on spike timing in the following cycles is verysmall, if at all present, but appears to be more pronounced in earlier ripple cycles than inlater ones. This suggests that the physiological conductance traces used to stimulate ourneuron model were typically low amplitude and thus hardly carried over to the next ripplecycle. Most of the cPSCs thus seemed to act as a noise background, that, in the nextsection, will be interpreted as the result of interference from multiple stored associations.
4

Pattern associations
Since the history dependence of spike timing was rather weak, we suspected that eachripple cycle might be treated as an individual time step for pattern association. Wetherefore aimed at quantifying the memory capacity of a ripple cycle.
To this end, we created input patterns (Fig. 3A) assuming that cPSCs arise from asparse combination of 10,000 synaptic sites. To standardize the input cPSCs we fixed thenumber of ripple cycles to 7 and the cycle duration to 5 ms. During each cycle everysynapse could be active or inactive, with the ratio of active to inactive synapses deter-mined by the coding ratio f ; the coding ratio can hence be interpreted as the populationsparseness during a ripple cycle. In all synthetic cPSCs we used the 4th cycle to containthe random signal pattern to which the neuron should elicit an action potential, whereasthe others cycles were containing random noise patterns to which the neurons should re-main silent. Signal patterns differed from noise patterns only in that the synaptic weightswere tuned to the signal pattern using Willshaw’s learning rule (Willshaw et al., 1969): Asynaptic weight was set to a standard conductance value (see Methods) if the synapse isactive in at least one of P random signal patterns, otherwise it remains zero.
To quantify the success of memory retrieval, we used the retrieval quality measure
Γ = fraction of hits − fraction of false alarms
from (Leibold and Kempter, 2006). Since we probed the neuron with P cPSCs (each ofwhich contained a different signal pattern in cycle 4) this measure amounts to
Γ =m
P− n
6P,
where m and n count the number of action potentials in the signal cycle and the noisecycles, respectively.
Our simulations show that the retrieval quality only obtains positive values for a largenumber P of stored patterns if the inputs are very sparse (coding ratios below 1%);Figure 3A. For denser codes the capacity is limited to about 10 patterns. Adding inhibitiondoes not improve storage capacity bur rather degrades it.
From these findings one may conclude that there is a necessity for sparse inputs.However, the idea of a cycle-by-cycle association additionally requires that the sparsenessis similar in all ripple cycles, because the output in one cycle should be the input in the nextcycle. Our simulations show that such a self-consistency in firing rate can, if at all, onlybe obtained for very low pattern numbers and coding ratio of about 0.04, which, assuming7 ripple cycles, corresponds to sparseness values of about 7 × 0.04 ≈ 0.3 per sharp-wave,which indeed comes close to what is reported from in-vivo experiments (Csicsvari et al.,2000).
Thus, to be consistent with in-vivo firing rates a cycle-by-cycle pattern associationwould only have a limited capacity of about ten patterns and thus would not be usefulas a sequence memory, at least not if it was implemented by recurrent CA1 synapses (re-ported to realize a connectivity probability of 1% in Deuchars and Thomson, 1996). Apotential problem for the validity of this conclusion could, however, arise from the neu-ron being modeled according to in-vitro measurements not reflecting the excitability and
5

synaptic drive CA1 pyramidal cells experience in-vivo. We therefore next repeated ca-pacity measurements in a simpler neuron model which allows us to set an optimal firingthreshold.
Pattern associations in leaky integrator neurons
In order to be able to control different spiking thresholds in a controlled manner, weimplemented a single compartment leaky-integrate and fire neuron (LIF). Again the neuronwas driven by 10,000 synapses, representing the potential input from other CA1 cells,during ripple oscillations. The resulting conductance trains were constructed identicallyas in Figure 3A. We now simulated multiple variants of the neuron model for a wholerange of firing thresholds between -20 mV and -10 mV. For high thresholds the outputrate was lower than the input rate (coding ratio), for low thresholds the output rate washigher than f (Figure 4B), such that for each input coding ratio there was a thresholdwith equal input and output rate (black line Figure 4C). This threshold was then usedfor capacity calculations for a recurrent regime in which activity in each cycle triggers theactivity in the next cycle.
For only excitatory cPSCs (Figure 5D) positive retrieval quality can again only beachieved for sparse (f < 1%) inputs, ruling out cycle-by-cycle retrieval for physiologicalsparseness values. However, after including inhibition we observe positive but small Γvalues for large number of patterns even for physiological sparseness (Figure 5D). Thusadaptive threshold mechanisms could restore a high capacity in the presence of inhibition,but only at low signal-to-noise ratios. It is therefore questionable whether such a recurrentsequence memory is realized in CA1 (see Discussion).
Discussion
Based on physiologically recorded synaptic currents during sharp-wave ripple states in-vitro, this manuscript evaluates the capacity of a putatively recurrently connected CA1network for sequence memory. Our results show that physiological sparseness values ofabout 30% (Csicsvari et al., 2000) per sharp wave (corresponding to about 4% per ripplecycle) are only consistent with the recurrent CA1 network hypothesis if ripple-lockedexcitatory and inhibitory currents are injected simultaneously, if the firing threshold isadaptable, and if low signal-to-noise ratios are sufficient.
Threshold adaptations of pyramidal cells have been shown to occur by both homeo-static changes in cellular excitability and synaptic strength (Burrone et al., 2002; Turri-giano, 2017). As a consequence the adapted threshold in slice recordings during the SWRstate could thus indeed reflect the adapted threshold state for situations with of only fewstereotypical patterns being repeated (Reichinnek et al., 2012). The adaptive thresholdmechanism is needed because slight changes in the threshold lead to a different integrationof inputs (Kempter et al., 1998). Only at an optimal threshold value the cell can functionas coincidence detector.
To derive storage capacity from single neuron firing behavior, we made fundamentalsimplifications. First, we assessed sequence replay by the retrieval quality measure which
6

compares hit and false alarm rates. Such an approach of course would not work in arecurrent setting with entirely independent activity patterns, it rather assumes that thefalse alarm activation in one cycle contribute to the signal input in the next cycle. However,there is no physiological evidence that activity patterns in different cycles of a singleSWR are independent. Thus, our model could still be consistent with recurring sequencemotifs (Chenani et al., 2019). Here, the starting pattern defines the specific evolution ofsequential activation without the ability to rewire associations between patterns withinsequences. Second, the input cPSCs used in our model are derived from in-vitro recordingsand it is unclear how well they reflect the in-vivo situation. Indeed (Gan et al., 2017)reported that ripple locked excitation cannot be identified in intracellular recordings in-vivo. The difference between the in-vivo and the in-vitro situation maybe reflecting overallhomeostatic excitability increase. Particularly our simulations with added DC currents(Figure 1) show that increased excitability may shadow ripple locking of action potentialsand hence that of recurrent EPSCs. Third, inhibitory and excitatory cPSCs cannot berecorded simultaneously from the same cell. We therefore randomly combined excitatoryand inhibitory inputs, which disregards the possibility that at the single neuron level bothinputs could have a higher degree of temporal coordination eventually leading to a bettersignal to noise ratio. However, the high postsynaptic connectivity (out degree) (Bezaireand Soltesz, 2013) of inhibitory neurons (particularly parvalbumin positive basket cells)argues in favor of a relatively similar inhibitory signals at all pyramidal cells and thereforesuch increases in signal-to noise ratio may be small.
Combining the results of our modeling and the limitations listed above, we can con-clude that it is rather unlikely that at least under in-vivo conditions the recurrent CA1network stores a large number of sequences of activity patterns. Since CA1 recordings,nevertheless show an extremely rich reservoir of sequences (Nadasdy et al., 1999; Liuet al., 2018; Chenani et al., 2019) their underlying mechanisms must be different fromsimple recurrence. There are two most likely alternatives. First, as already eluded to inthe introduction, sequences may be generated by an excitability bias (Taxidis et al., 2012;Stark et al., 2015), where more excitably neurons in a pattern tend to fire first. Secondly,sequences may be generated by extrahippocampal recurrent loops. Such a mechanismwould solve the independence problem of the noise patterns since consecutive feedforwardlayers would be able to filter out false alarm activations (Reyes, 2003). Moreover, ex-perimental evidence showing spike timing alterations following medial entorhinal cortexlesions (Schlesiger et al., 2015) and dentate gyrus lesions (Sasaki et al., 2018) are alsoconsistent with this latter idea.
Methods
Fitting of composed postsynaptic currents
The parameters used to reconstruct the post-synaptic currents (PSCs) were received fromin-vitro recordings in hippocampal slices (Maier et al., 2011). The conductance of a single
7

PSC was modeled as follows:
I(t) = I0 Θ(t− t0)
[exp
(t− t0τd
)− exp
(− t− t0
τr
)](1)
with the Heaviside step function Θ(t) = 0 for t < 0 and Θ(t) = 1 otherwise. The currentI0 = AN is the product of the peak amplitude A of the PSC and normalization factor
N =
(τrτd
) τr(τd−τr) −
(τrτd
) τd(τr−τd)
. (2)
Here, τr and τd denote the rise and decay time, with average values of τr = 1.7 ± 0.04 msand τd = 4.04 ± 0.08 ms.Combining several of these PSCs, resembles a compound post-synaptic current (cPSC).The data, collected in the in-vitro recordings, includes 1051 excitatory and 814 inhibitorycPSCs. Currents were transformed into conductances by dividing by the 70 mV which isapproximately the driving force used in the experimental recordings.
Extracellular ripple cycles
In order to perform a cycle specific analysis, extracellular ripple cycles had to be mappedonto the intracellular signals. Therefore, the extracellular voltage signal was filtered inthe ripple band (120 Hz to 300 Hz) and phases were obtained using a Hilbert transformof the filtered signal. Ripple cycles were subsequently identified as framed by the timepoints with Hilbert phase zero.
Single-compartment model
To gain control over the firing thresholds, we implemented a single-compartment leaky-integrate-and-fire model of a CA1 pyramidal neuron. The cell is modeled as one singlecompartment with one membrane voltage V governed by the differential equation
cmdV
dt= −Im, (3)
with capacitance cm = 100 pF and Im = Ileak + Iexc + Iinh. All currents are modeled asOhmic,
I = gi (V − Ei), (4)
with i being one specific channel type with its corresponding conductance gi and reversalpotential Ei.
The leak current Ileak has a conductance gleak = 1r , with r being the membrane resis-
tance set to r = 50 MOhm. The resting potential was set by Vrest = Eleak = −70 mV,the excitatory and inhibitory reversal potentials were taken to be Eexc = −6.5 mV andEinh = −66 mV. Additionally, the model contained a refractory time of τ = 5 ms. Thefiring threshold was a free parameter.
8
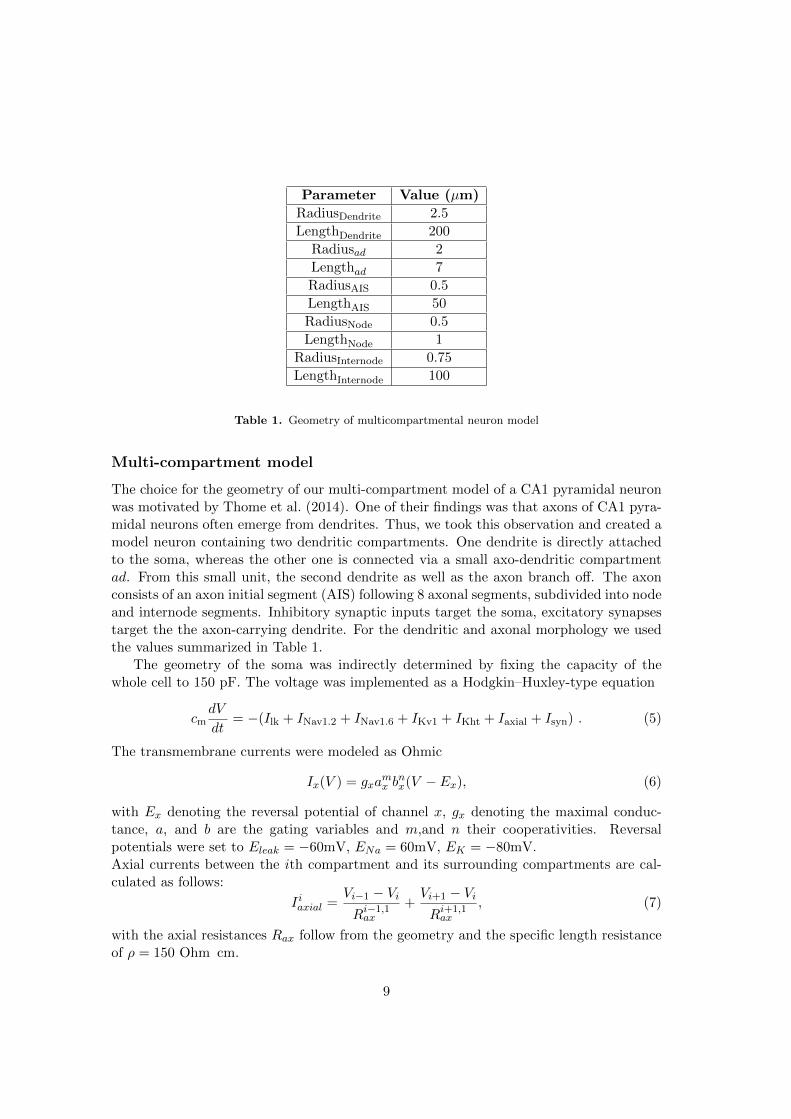
Parameter Value (µm)
RadiusDendrite 2.5
LengthDendrite 200
Radiusad 2
Lengthad 7
RadiusAIS 0.5
LengthAIS 50
RadiusNode 0.5
LengthNode 1
RadiusInternode 0.75
LengthInternode 100
Table 1. Geometry of multicompartmental neuron model
Multi-compartment model
The choice for the geometry of our multi-compartment model of a CA1 pyramidal neuronwas motivated by Thome et al. (2014). One of their findings was that axons of CA1 pyra-midal neurons often emerge from dendrites. Thus, we took this observation and created amodel neuron containing two dendritic compartments. One dendrite is directly attachedto the soma, whereas the other one is connected via a small axo-dendritic compartmentad. From this small unit, the second dendrite as well as the axon branch off. The axonconsists of an axon initial segment (AIS) following 8 axonal segments, subdivided into nodeand internode segments. Inhibitory synaptic inputs target the soma, excitatory synapsestarget the the axon-carrying dendrite. For the dendritic and axonal morphology we usedthe values summarized in Table 1.
The geometry of the soma was indirectly determined by fixing the capacity of thewhole cell to 150 pF. The voltage was implemented as a Hodgkin–Huxley-type equation
cmdV
dt= −(Ilk + INav1.2 + INav1.6 + IKv1 + IKht + Iaxial + Isyn) . (5)
The transmembrane currents were modeled as Ohmic
Ix(V ) = gxamx b
nx(V − Ex), (6)
with Ex denoting the reversal potential of channel x, gx denoting the maximal conduc-tance, a, and b are the gating variables and m,and n their cooperativities. Reversalpotentials were set to Eleak = −60mV, ENa = 60mV, EK = −80mV.Axial currents between the ith compartment and its surrounding compartments are cal-culated as follows:
Iiaxial =Vi−1 − Vi
Ri−1,1ax
+Vi+1 − Vi
Ri+1,1ax
, (7)
with the axial resistances Rax follow from the geometry and the specific length resistanceof ρ = 150 Ohm cm.
9
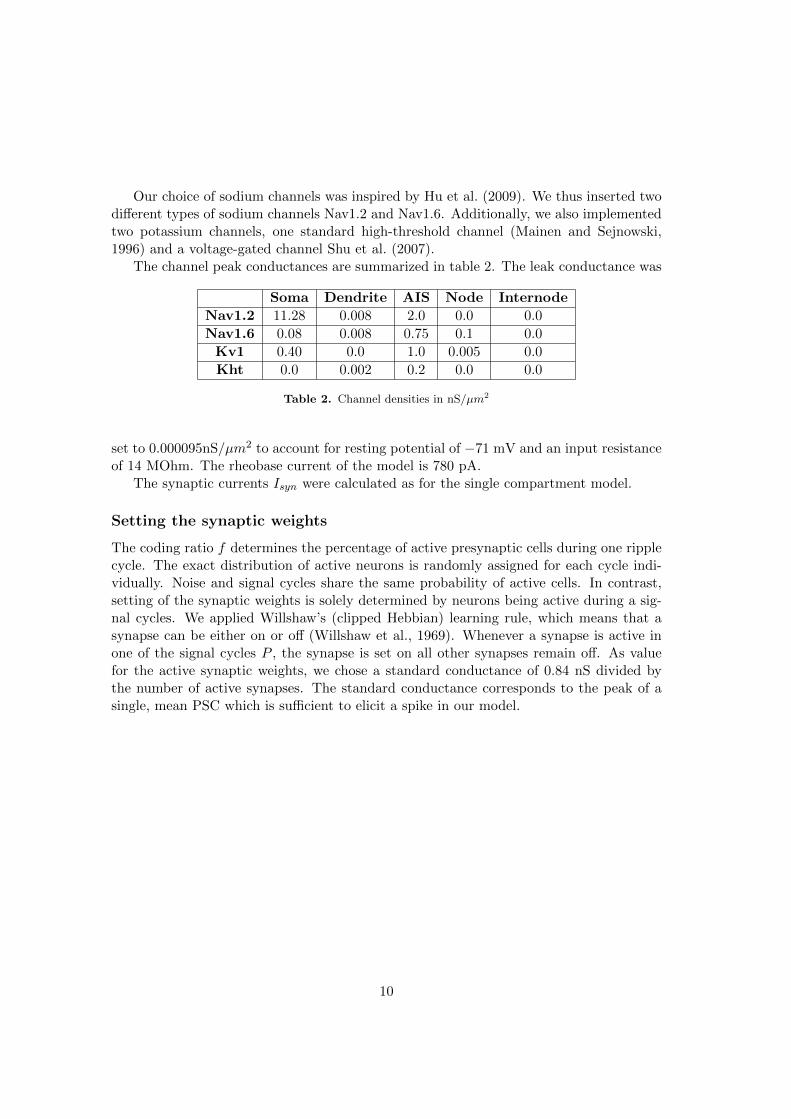
Our choice of sodium channels was inspired by Hu et al. (2009). We thus inserted twodifferent types of sodium channels Nav1.2 and Nav1.6. Additionally, we also implementedtwo potassium channels, one standard high-threshold channel (Mainen and Sejnowski,1996) and a voltage-gated channel Shu et al. (2007).
The channel peak conductances are summarized in table 2. The leak conductance was
Soma Dendrite AIS Node Internode
Nav1.2 11.28 0.008 2.0 0.0 0.0
Nav1.6 0.08 0.008 0.75 0.1 0.0
Kv1 0.40 0.0 1.0 0.005 0.0
Kht 0.0 0.002 0.2 0.0 0.0
Table 2. Channel densities in nS/µm2
set to 0.000095nS/µm2 to account for resting potential of −71 mV and an input resistanceof 14 MOhm. The rheobase current of the model is 780 pA.
The synaptic currents Isyn were calculated as for the single compartment model.
Setting the synaptic weights
The coding ratio f determines the percentage of active presynaptic cells during one ripplecycle. The exact distribution of active neurons is randomly assigned for each cycle indi-vidually. Noise and signal cycles share the same probability of active cells. In contrast,setting of the synaptic weights is solely determined by neurons being active during a sig-nal cycles. We applied Willshaw’s (clipped Hebbian) learning rule, which means that asynapse can be either on or off (Willshaw et al., 1969). Whenever a synapse is active inone of the signal cycles P , the synapse is set on all other synapses remain off. As valuefor the active synaptic weights, we chose a standard conductance of 0.84 nS divided bythe number of active synapses. The standard conductance corresponds to the peak of asingle, mean PSC which is sufficient to elicit a spike in our model.
10

References
Bezaire, M. J. and Soltesz, I. (2013). Quantitative assessment of CA1 local circuits:knowledge base for interneuron-pyramidal cell connectivity. Hippocampus, 23(9):751–785.
Burrone, J., O’Byrne, M., and Murthy, V. N. (2002). Multiple forms of synaptic plas-ticity triggered by selective suppression of activity in individual neurons. Nature,420(6914):414–418.
Buzsaki, G. (1986). Hippocampal sharp waves: their origin and significance. Brain re-search, 398(2):242–252.
Buzsaki, G. (1989). Two-stage model of memory trace formation: a role for ”noisy” brainstates. Neuroscience, 31(3):551–570.
Buzsaki, G. (2015). Hippocampal sharp wave-ripple: A cognitive biomarker for episodicmemory and planning. Hippocampus, 25(10):1073–1188.
Buzsaki, G., Horvath, Z., Urioste, R., Hetke, J., and Wise, K. (1992). High-frequencynetwork oscillation in the hippocampus. Science, 256(5059):1025–1027.
Chenani, A., Sabariego, M., Schlesiger, M. I., Leutgeb, J. K., Leutgeb, S., and Leibold,C. (2019). Hippocampal CA1 replay becomes less prominent but more rigid withoutinputs from medial entorhinal cortex. Nat Commun, 10(1):1341.
Csicsvari, J., Hirase, H., Czurko, A., Mamiya, A., and Buzsaki, G. (1999). Fast net-work oscillations in the hippocampal CA1 region of the behaving rat. J. Neurosci.,19(16):RC20.
Csicsvari, J., Hirase, H., Mamiya, A., and Buzsaki, G. (2000). Ensemble patterns of hip-pocampal CA3-CA1 neurons during sharp wave-associated population events. Neuron,28(2):585–594.
Deuchars, J. and Thomson, A. M. (1996). CA1 pyramid-pyramid connections in rathippocampus in vitro: dual intracellular recordings with biocytin filling. Neuroscience,74(4):1009–1018.
Gan, J., Weng, S. M., Pernia-Andrade, A. J., Csicsvari, J., and Jonas, P. (2017). Phase-Locked Inhibition, but Not Excitation, Underlies Hippocampal Ripple Oscillations inAwake Mice In Vivo. Neuron, 93(2):308–314.
Gupta, A. S., van der Meer, M. A., Touretzky, D. S., and Redish, A. D. (2010). Hip-pocampal replay is not a simple function of experience. Neuron, 65(5):695–705.
Hu, W., Tian, C., Li, T., Yang, M., Hou, H., and Shu, Y. (2009). Distinct contribu-tions of Na(v)1.6 and Na(v)1.2 in action potential initiation and backpropagation. Nat.Neurosci., 12(8):996–1002.
11
Jadhav, S. P., Kemere, C., German, P. W., and Frank, L. M. (2012). Awake hippocampalsharp-wave ripples support spatial memory. Science, 336(6087):1454–1458.
Jahnke, S., Timme, M., and Memmesheimer, R. M. (2015). A Unified Dynamic Model forLearning, Replay, and Sharp-Wave/Ripples. J. Neurosci., 35(49):16236–16258.
Kammerer, A., Tejero-Cantero, A., and Leibold, C. (2013). Inhibition enhances mem-ory capacity: optimal feedback, transient replay and oscillations. J Comput Neurosci,34(1):125–136.
Kempter, R., Gerstner, W., Hemmen, J. L. v., and Wagner, H. (1998). Extracting oscil-lations: Neuronal coincidence detection with noisy periodic spike input. Neural Com-putation, 10(8):1987–2017.
Lee, A. K. and Wilson, M. A. (2002). Memory of sequential experience in the hippocampusduring slow wave sleep. Neuron, 36(6):1183–1194.
Leibold, C. and Kempter, R. (2006). Memory capacity for sequences in a recurrent networkwith biological constraints. Neural Comput, 18(4):904–941.
Liu, K., Sibille, J., and Dragoi, G. (2018). Generative Predictive Codes by MultiplexedHippocampal Neuronal Tuplets. Neuron, 99(6):1329–1341.
Maier, N., Tejero-Cantero, A., Dorrn, A. L., Winterer, J., Beed, P. S., Morris, G., Kempter,R., Poulet, J. F., Leibold, C., and Schmitz, D. (2011). Coherent phasic excitation duringhippocampal ripples. Neuron, 72(1):137–152.
Mainen, Z. F. and Sejnowski, T. J. (1996). Influence of dendritic structure on firing patternin model neocortical neurons. Nature, 382(6589):363–366.
Nadasdy, Z., Hirase, H., Czurko, A., Csicsvari, J., and Buzsaki, G. (1999). Replay and timecompression of recurring spike sequences in the hippocampus. J. Neurosci., 19(21):9497–9507.
Oliva, A., Fernandez-Ruiz, A., Buzsaki, G., and Berenyi, A. (2016). Role of HippocampalCA2 Region in Triggering Sharp-Wave Ripples. Neuron, 91(6):1342–1355.
Reichinnek, S., von Kameke, A., Hagenston, A. M., Freitag, E., Roth, F. C., Bading, H.,Hasan, M. T., Draguhn, A., and Both, M. (2012). Reliable optical detection of coherentneuronal activity in fast oscillating networks in vitro. Neuroimage, 60(1):139–152.
Reyes, A. D. (2003). Synchrony-dependent propagation of firing rate in iteratively con-structed networks in vitro. Nat. Neurosci., 6(6):593–599.
Sasaki, T., Piatti, V. C., Hwaun, E., Ahmadi, S., Lisman, J. E., Leutgeb, S., and Leutgeb,J. K. (2018). Dentate network activity is necessary for spatial working memory bysupporting CA3 sharp-wave ripple generation and prospective firing of CA3 neurons.Nat. Neurosci., 21(2):258–269.
12
Schlesiger, M. I., Cannova, C. C., Boublil, B. L., Hales, J. B., Mankin, E. A., Brandon,M. P., Leutgeb, J. K., Leibold, C., and Leutgeb, S. (2015). The medial entorhinal cortexis necessary for temporal organization of hippocampal neuronal activity. Nat. Neurosci.,18(8):1123–1132.
Shu, Y., Yu, Y., Yang, J., and McCormick, D. A. (2007). Selective control of corticalaxonal spikes by a slowly inactivating K+ current. Proc. Natl. Acad. Sci. U.S.A.,104(27):11453–11458.
Stark, E., Roux, L., Eichler, R., and Buzsaki, G. (2015). Local generation of multineu-ronal spike sequences in the hippocampal CA1 region. Proc. Natl. Acad. Sci. U.S.A.,112(33):10521–10526.
Sullivan, D., Csicsvari, J., Mizuseki, K., Montgomery, S., Diba, K., and Buzsaki, G. (2011).Relationships between hippocampal sharp waves, ripples, and fast gamma oscillation:influence of dentate and entorhinal cortical activity. J. Neurosci., 31(23):8605–8616.
Taxidis, J., Coombes, S., Mason, R., and Owen, M. R. (2012). Modeling sharp wave-ripplecomplexes through a CA3-CA1 network model with chemical synapses. Hippocampus,22(5):995–1017.
Thome, C., Kelly, T., Yanez, A., Schultz, C., Engelhardt, M., Cambridge, S. B., Both,M., Draguhn, A., Beck, H., and Egorov, A. V. (2014). Axon-carrying dendrites conveyprivileged synaptic input in hippocampal neurons. Neuron, 83(6):1418–1430.
Turrigiano, G. G. (2017). The dialectic of Hebb and homeostasis. Philos. Trans. R. Soc.Lond., B, Biol. Sci., 372(1715).
Willshaw, D. J., Buneman, O. P., and Longuet-Higgins, H. C. (1969). Non-holographicassociative memory. Nature, 222(5197):960–962.
13
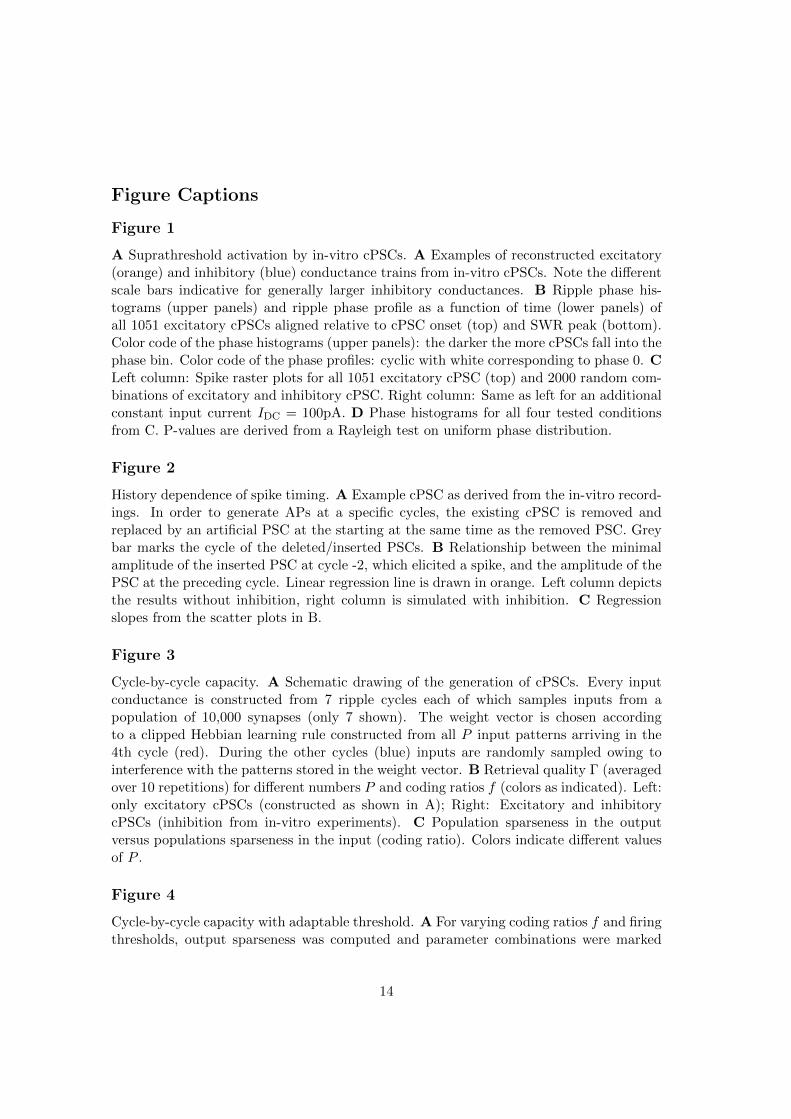
Figure Captions
Figure 1
A Suprathreshold activation by in-vitro cPSCs. A Examples of reconstructed excitatory(orange) and inhibitory (blue) conductance trains from in-vitro cPSCs. Note the differentscale bars indicative for generally larger inhibitory conductances. B Ripple phase his-tograms (upper panels) and ripple phase profile as a function of time (lower panels) ofall 1051 excitatory cPSCs aligned relative to cPSC onset (top) and SWR peak (bottom).Color code of the phase histograms (upper panels): the darker the more cPSCs fall into thephase bin. Color code of the phase profiles: cyclic with white corresponding to phase 0. CLeft column: Spike raster plots for all 1051 excitatory cPSC (top) and 2000 random com-binations of excitatory and inhibitory cPSC. Right column: Same as left for an additionalconstant input current IDC = 100pA. D Phase histograms for all four tested conditionsfrom C. P-values are derived from a Rayleigh test on uniform phase distribution.
Figure 2
History dependence of spike timing. A Example cPSC as derived from the in-vitro record-ings. In order to generate APs at a specific cycles, the existing cPSC is removed andreplaced by an artificial PSC at the starting at the same time as the removed PSC. Greybar marks the cycle of the deleted/inserted PSCs. B Relationship between the minimalamplitude of the inserted PSC at cycle -2, which elicited a spike, and the amplitude of thePSC at the preceding cycle. Linear regression line is drawn in orange. Left column depictsthe results without inhibition, right column is simulated with inhibition. C Regressionslopes from the scatter plots in B.
Figure 3
Cycle-by-cycle capacity. A Schematic drawing of the generation of cPSCs. Every inputconductance is constructed from 7 ripple cycles each of which samples inputs from apopulation of 10,000 synapses (only 7 shown). The weight vector is chosen accordingto a clipped Hebbian learning rule constructed from all P input patterns arriving in the4th cycle (red). During the other cycles (blue) inputs are randomly sampled owing tointerference with the patterns stored in the weight vector. B Retrieval quality Γ (averagedover 10 repetitions) for different numbers P and coding ratios f (colors as indicated). Left:only excitatory cPSCs (constructed as shown in A); Right: Excitatory and inhibitorycPSCs (inhibition from in-vitro experiments). C Population sparseness in the outputversus populations sparseness in the input (coding ratio). Colors indicate different valuesof P .
Figure 4
Cycle-by-cycle capacity with adaptable threshold. A For varying coding ratios f and firingthresholds, output sparseness was computed and parameter combinations were marked
14

blue or orange for which output sparseness was below or above the input sparseness (codingratio). The black line connects the parameter combinations where input and outputsparseness were identical. B Examples of cPSCs and corresponding voltage responsesfor a case in the blue (top) and a case in the orange (bottom) regimes from A. Thegrey rectangle marks the signal cycle (4th cycle). C Retrieval quality as a function ofP for various values of f (colors as indicated). Left: Simulations with only excitatorycPSCs. Right: Combination of excitatory cPSCs (constructed as shown in Figure 3A)and inhibitory cPSCs from in-vitro recordings.
15

Figure 1
16

Figure 2
17

Figure 3
18

Figure 4
19

3Study 2: Action Potential Generation in an
Anatomically Constrained Model of Medial
Superior Olive Axons
Simon Lehnert (SL), Marc C. Ford (MCF), Olga Alexandrova (OA), Felix Felmy(FF), Benedikt Grothe (BG), and Christian Leibold (CL) designed the research.SL performed the computational modeling. Morphometric measurements wereperformed byMCF, andOA. FH and FF performed the electrophysiological record-ings. SL, MCF, OA, FH, and FF analyzed the data. SL, MCF, FF, BG, and CLwrote the paper.The paper has been published in The Journal of Neuroscience (Lehnert et al.,2014).

Systems/Circuits
Action Potential Generation in an Anatomically ConstrainedModel of Medial Superior Olive Axons
Simon Lehnert,1 Marc C. Ford,1,2 Olga Alexandrova,1 Franziska Hellmundt,1,2 Felix Felmy,1,3 Benedikt Grothe,1
and Christian Leibold1
1Department Biology II, 2Graduate School of Systemic Neurosciences, and 3Department Biology I, BioImaging Zentrum, Ludwig-Maximilians-UniversitatMunchen, D-82152 Planegg-Martinsried, Germany
Neurons in the medial superior olive (MSO) encode interaural time differences (ITDs) with sustained firing rates of �100 Hz. They areable to generate such high firing rates for several hundred milliseconds despite their extremely low-input resistances of only few megao-hms and high synaptic conductances in vivo. The biophysical mechanisms by which these leaky neurons maintain their excitability arenot understood. Since action potentials (APs) are usually assumed to be generated in the axon initial segment (AIS), we analyzedanatomical data of proximal MSO axons in Mongolian gerbils and found that the axon diameter is �1 �m and the internode length is�100 �m. Using a morphologically constrained computational model of the MSO axon, we show that these thin axons facilitate theexcitability of the AIS. However, for ongoing high rates of synaptic inputs the model generates a substantial fraction of APs in its nodes ofRanvier. These distally initiated APs are mediated by a spatial gradient of sodium channel inactivation and a strong somatic current sink.The model also predicts that distal AP initiation increases the dynamic range of the rate code for ITDs.
Key words: action potential; axon; coincidence detection; interaural time difference; sound localization
IntroductionThe generation of action potentials (APs) is widely assumed totake place in the axon initial segment (AIS). Evidence for thisassumption stems predominantly from cortical pyramidal neu-rons and cerebellar Purkinje neurons using simultaneous so-matic and axonal whole-cell recordings (Stuart and Sakmann,1994; Stuart et al., 1997; Kole et al., 2007; Shu et al., 2007) andvoltage-sensitive dye imaging (Palmer and Stuart, 2006; Foust etal., 2010; Palmer et al., 2010; Popovic et al., 2011). At rest, theseneurons have relatively high input resistances of 10 –200 M�,allowing them to integrate synaptic inputs over several millisec-onds. Thus, during depolarizing stimuli, the soma generallyserves as a strong and temporarily stable current source for theAIS. In neurons with very low input resistances of 2–5 M�, themechanisms of AP initiation have not yet been studied in suchgreat detail. In those cells, the membrane time constants are tooshort to allow the soma to serve as a temporarily stable currentsource. Conversely, the soma might even act as a current sink tothe AP generating zone and therefore increases the AP thresholdat the AIS.
In the present study, we investigated AP generation in neu-rons of very low input resistance, the principal cells of the medialsuperior olive (MSO). These neurons have membrane time con-stants in the range of only a few hundreds of microseconds andinput resistances as low as 5 M� (Scott et al., 2005; Couchman etal., 2010). The MSO is a binaural nucleus in the ascendingauditory pathway. MSO neurons encode the azimuthal posi-tion of low-frequency sounds via differences in the time ofarrival at the two ears by their firing rate (Goldberg andBrown, 1969; Yin and Chan, 1990; Fitzpatrick et al., 1997;Brand et al., 2002) with a precision of only a few tens of mi-croseconds. This exquisite temporal precision of binaural coin-cidence detection is partly achieved by the fast membrane timeconstants of neurons resulting from the high expression of low-voltage-activated potassium channels and hyperpolarization-activated cation channels (Svirskis et al., 2002; Koch et al., 2004;Scott et al., 2005; Mathews et al., 2010; Baumann et al., 2013),both of which are already open at rest. Despite the resulting lowinput resistance, these neurons can fire at high rates of �100Hz and more. The mechanisms by which this is possible arestill unresolved.
In this article, we address the question of how AP generation isaccomplished in leaky neurons using a computational model ofMSO neurons with axonal morphology based on new detailedmorphometric data. Our simulations show that, despite the leakysoma, the AIS remains electrotonically isolated and retains itsability to generate APs. However, we also identified conditionsunder which the APs are initiated at the nodes of Ranvier. Thisdistal initiation of APs increases the dynamic range of the ratecode of interaural time differences (ITDs).
Received Sept. 20, 2013; revised March 5, 2014; accepted March 8, 2014.Author contributions: S.L., M.C.F., O.A., F.F., B.G., and C.L. designed research; S.L., M.C.F., O.A., F.H., and F.F.
performed research; S.L., M.C.F., O.A., F.H., and F.F. analyzed data; S.L., M.C.F., F.F., B.G., and C.L. wrote the paper.This work was supported by the German Research Foundation via the Collaborative Research Center 870 and the
Elisabeth und Helmut Uhl Stiftung.The authors declare no competing financial interests.Correspondence should be addressed to Christian Leibold, Computational Neuroscience, Department Biology II,
Ludwig-Maximilians-University Munich, Grosshaderner Strasse 2, D-82152 Planegg-Martinsried, Germany. E-mail:[email protected].
DOI:10.1523/JNEUROSCI.4038-13.2014Copyright © 2014 the authors 0270-6474/14/345370-15$15.00/0
5370 • The Journal of Neuroscience, April 9, 2014 • 34(15):5370 –5384

Materials and MethodsGeneralAll experiments were performed according to institutional guidelines,and national and regional laws; it was approved by the Regierung vonOberbayern (AZ55.2–1-54 –2531-105–10). All results are given as themean � SEM.
Retrograde labeling of MSO cellsMongolian gerbils (Meriones unguiculatus) of either sex [n � 4; postnatalday 29 (P29) to P31] were anesthetized with pentobarbital (2 mg/kg bodyweight) and intracardially perfused with ice-cold Ringer’s solution con-taining 0.1% heparin. After decapitation, the brainstem was removedfrom the skull under ice-cold dissection solution comprising the follow-ing (in mM): 125 NaCl, 2.5 KCl, 1 MgCl2, 0.1 CaCl2, 25 glucose, 1.25NaH2PO4, 25 NaHCO3, 0.4 ascorbic acid, 3 myo-inositol, and 2 pyruvicacid (all chemicals were from Sigma-Aldrich). For retrograde labeling ofMSO cells, the brainstem was sectioned along the posterior–anterior axisuntil the MSO, lateral superior olive, and superior paraolivary nucleus(SPN) were clearly visible. Borosilicate glass micropipettes with a tipdiameter of 10 –15 �m were filled with a 10% solution of tetramethyl-rhodamine dextran (3000 molecular weight; Invitrogen) and visuallyguided to the SPN. Cells were labeled by applying 2– 4 electroporationpulse trains (50 ms, 50 V, 10 Hz; modified from previous studies; Ford etal., 2009). Subsequently, the explants were transferred to a chamber con-taining oxygenated incubation solution (same as incubation solution,but containing 2 mM instead of 0.1 mM CaCl2) and incubated at roomtemperature for 90 min. Thereafter, brainstems were immersion fixed atroom temperature overnight in 4% paraformaldehyde solution.
ImmunohistochemistryBrainstems were sectioned transversally (80 –120 �m slice thickness),rinsed in PBS, and transferred to blocking solution containing 1% bovineserum albumin, 2% Triton X-100, and 0.1% saponin in PBS. Multiple-immunofluorescence labeling was performed with the following primaryantibodies: ankyrin G (sc-28561; rabbit; 1:500; Santa Cruz Biotechnol-ogy), Kv1.2 (75-008 clone K14/16; mouse; 1:500; NeuroMab),microtubule-associated protein 2 (CH22103; chicken polyclonal; 1:1000;Neuromics), and myelin basic protein (ab7349; rat monoclonal; 1:20;abcam). The incubation time (4°C) for primary antibodies was 3 d. Afterincubation with secondary antibodies (1–2 d; 4°C) and rinsing in PBS,sections were mounted with Vectashield mounting medium.
Confocal microscopyConfocal images were acquired with a TCS SP5-2 confocal laser-scanning microscope (Leica Microsystems) equipped with HCX PL APO63�/numerical aperture 1.3 glycerol objective. Fluorochromes were ex-cited at 405, 488, 561, 594, and 633 nm for aminoethylcoumarin acetate,DyLight488, tetramethylrhodamine dextran, Alexa Fluor 594, and Dy-Light649, respectively. The emission filters for these fluorochromes wereset to (in the same order) 410 – 460, 510 –550, 565–585, 605– 625, and640 –760 nm. For each optical section the images were collected sequen-tially for four to five fluorochromes. Stacks of 8-bit grayscale images wereobtained with axial distances of 290 nm between optical sections and apixel size of 120.4 nm. To obtain an improved signal-to-noise ratio, eachsection image was averaged from five successive scans. After stack acqui-sition, the Z chromatic shift between color channels was corrected. RGBstacks, montages of RGB optical sections, and maximum-intensity pro-jections were assembled into tables by using ImageJ 1.37k plugins andPhotoshop version 8.0.1 (Adobe Systems) software.
MorphometryMorphometric measurements were made from overlapping image stacksof MSO principal cells. Using the ImageJ 1.37k paint-brush tool, individ-ual axons of MSO cells filled with tetrametylrhodamine dextran weremanually labeled by following single axons subsequently through eachoptical section of the confocal stack (Werthat et al., 2008; for dendrites,see Couchman et al., 2010). Afterward, the neighboring axons were dig-itally deleted. We refer to this method as digital extraction. The sameaxon was identified in the neighboring overlapping confocal stacks anddigitally extracted. AISs and nodes of Ranvier were identified on the basis
ankyrin G/Kv1.2 antibody staining. AIS and internode lengths were mea-sured in three dimensions in confocal stack images using the ImageJ1.37k Sync Measure 3D tool. AIS and internodal axon diameters weremeasured at the positions defined by ankyrin G and Kv1.2 labeling (seeFig. 2B) in maximum-intensity projections of image stacks based ontetrametylrhodamine dextran labeling. The mean diameter of the firstinternode was averaged from measurements at several (10 –29) differentpositions between the outer borders of the juxtaparanodes (see Fig. 2B,K3 and K6).
ElectrophysiologyExperimental procedures were as described in Couchman et al. (2010). Inbrief, Mongolian gerbils of either sex of P60 –P80 were anesthetized withisoflurane. Brains were removed after decapitation, and 110-�m-thickhorizontal brainstem slices were taken with a VT1200S vibratome (Leica)in dissection solution containing the following (in mM): 50 sucrose, 25NaCl, 27 NaHCO3, 2.5 KCl, 1.25 NaH2PO4, 3 MgCl2, 0.1 CaCl2, 25glucose, 0.4 ascorbic acid, 3 myo-inositol, and 2 Na-pyruvate, pH 7.4when bubbled with 95% O2 and 5% CO2. Slices were incubated in re-cording solution (same as slice solution but with 125 mM NaCl, no su-crose, and 2 mM CaCl2 and 1 mM MgCl2) at 36°C for 45 min, bubbledwith 5% CO2 and 95% O2.
Incubated slices were placed into a recoding chamber attached to aBX51WI microscope (Olympus) equipped with a custom-made gradientcontrast illumination and continuously perfused with recording solutionkept at 34 –36°C by a Warner Instruments heating system. MSO neuronswere visualized at 60� magnification with a Retiga 2000 DC camera (TillPhotonics/FEI Munich). Current-clamp whole-cell recordings were per-formed using an EPC10/2 amplifier (HEKA Elektronik) on visually iden-tified MSO neurons with electrode resistances of �3 M�. Accessresistance was estimated in voltage-clamp after break in and was bridgebalanced to 100% in current-clamp mode. The internal recording solu-tion consisted of the following (in mM): 145 K-gluconate, 4.5 KCl, 15HEPES, 2 Mg-ATP, 2 K-ATP, 0.3 Na2-GTP, 7.5 Na2-phosphocreatine, 5K-EGTA, pH 7.2. The liquid junction potential was corrected on-linewith an estimated value of 17 mV.
Computational modelingBased on the morphometric analysis, a multicompartmental model wascreated to study the generation of APs in MSO principal cells. The modelconsists of one large somatic compartment that combines the somaticand dendritic membrane surface (Ashida et al., 2007). The model focuseson the axonal morphology, since APs are generally assumed to be gener-ated there. The axon model consisted of an unmyelinated AIS followedby an extensive myelinated part that was periodically interrupted by 21nodes of Ranvier. Figure 1A shows a schematic drawing of the first seg-ments of the model up to the fourth node of Ranvier (R4). The AIS wasfurther subdivided into a tapering part (tAIS) and a constant part (cAIS),resembling the actual geometry of the AIS. The voltages of the compart-ments followed a Hodgkin–Huxley-type equation as follows:
Cm
dV
dt� � INa � IKHT � IKLT � Ih � Ilk � Isyn � Iaxial � Iext,
where Iext is the external current, and the ohmic transmembrane currentsare as follows:
IxV � gxaxmbx
nV � Ex.
Here, Cm is the membrane capacitance, gx is respective peak conduc-tances, ax and bx are the gating variables, and m and n are the respectivecooperativities. The dynamics of the gating variables are modeled ac-cording to first-order kinetics, as follows:
da
dt�
a� � a
�aand
db
dt�
b� � b
�b
where a� and b� are the steady-state activation functions, and �a and �b
are the voltage-dependent time constants.The axial current for the ith compartment is defined as follows:
Lehnert et al. • Action Potentials in MSO Axons J. Neurosci., April 9, 2014 • 34(15):5370 –5384 • 5371

Iaxiali �
Vi�1 � Vi
Raxiali�1, i �
Vi 1 � Vi
Raxiali 1, i ,
in which Raxial denotes the axial resistance be-tween the ith compartment and its respectiveneighboring compartments. The axial resis-tance results from the geometry of the axonalsegment (diameter and length) as well as thespecific axial resistivity of 100 �cm, which is inthe range of usually assumed values (Mainen etal., 1995; Mainen and Sejnowski, 1996; Shu etal., 2007).
The specific model for the sodium channelwas taken from Scott et al. (2010) with a rever-sal potential for sodium of 69 mV and a mod-ified conductance density in the axon of 4 nS/�m 2 to fit the firing threshold of our current-clamp measurements (see Fig. 4). We chose thesomatic sodium conductance density to be 0.2nS/�m 2, a value 20-fold smaller than that inthe axon and reflecting the low sodium channeldensity found in MSO principal cell somata(Scott et al., 2010). The high-threshold potas-sium channel was modeled according to Roth-man and Manis (2003) without a slowactivation variable and only at the soma since ithad only little effect in the axon. The low-threshold potassium channel (KLT) wasmodeled according to (Mathews et al., 2010)and was present in the soma and all unmyeli-nated axonal compartments. The potassiumreversal potential was set to �90 mV. Thehyperpolarization-activated cation channelgives rise to a somatic hyperpolarization (h)-activated cation current (Ih), which was mod-eled using the kinetics measured in dorsal MSOneurons (Baumann et al., 2013), with a reversalpotential of �35 mV. The resting potential of�68 mV and the somatic input resistance of 5M� were set by adjusting the peak conduc-tances of KLT and h current. The somatic sur-face was set to 8750 �m 2, such that we get asomatodendritic capacitance of 70 pF (Rauten-berg et al., 2009), assuming a specific capaci-tance of 0.8 �F/cm 2 (Gentet et al., 2000; Shu etal., 2007). As a consequence, the somatic mem-brane time constant is 350 �s, which closelyresembles the measured membrane time con-stants in vitro (Scott et al., 2005; Couchman etal., 2010). The specific myelin conductance perlamella was set to 0.1 �F/cm 2 (McIntyre et al.,2002, 2004). Together with a g-ratio of 0.7 andan assumed myelin periodicity of 16 nm(Agrawal et al., 2009), our standard model ex-hibits nine myelin lamellae. Thus, we obtain aspecific capacitance of the myelin sheath of0.0111 �F/cm 2, similar to the value of 0.01 �F/cm 2 used in Kuba et al. (2006) for axons ofnucleus laminaris (NL) neurons. Some com-putational studies of axons use specific capaci-tances per lamella that are significantly higher;however, they compensate for this by a larger number of myelin lamellae.Using a substantially larger myelin capacitance (e.g., three times orhigher) would cause propagation failures of generated APs in our model,a result that would contradict the secure propagation of APs known fromMSO principal neurons (Scott et al., 2007). This matching of an experi-mental finding argues in favor of our parameter choice. The validity ofthe parameter choice is further supported by our physiological measure-ments of firing thresholds for onset-like responses in Figure 4.
A detailed account of the geometrical and electrical features of themodel is given in Tables 1 and 2, respectively.
In response to somatic current injections, the neuron model exhib-its typical onset behavior (Fig. 1B; i.e., it fires only one AP; Scott et al.,2005; Couchman et al., 2010) at the onset of the depolarizing pulse.The AP amplitude at the soma resembles physiologically measuredvalues of �10 mV (Scott et al., 2005; Couchman et al., 2010), whereas,at the nodes of Ranvier, the APs exhibit usual amplitude values of�100 mV.
SomaAxon initialsegment
tAIS cAIS
Nodes of Ranvier
R1 R2 R3 R4
Internodes
2 ms50 mVV
R5
VSoma
I
...
...
... 6 nA
−3 nA
0 20 40 60 80 100−0.2−0.1
00.10.2 Gammatone filter
RectificationRat
e (k
Hz)
420 440 460 480 50050
050
100 Excitation: ipsi / contra
Inhibition: ipsi / contra
nS
420 440 460 480 500−80−40
040
SomaR5 10 ms
mV
IS: cAIS
search intervalvoltage peak
IS: R1
A
B
C
D
E
F SomatAIScAISR1R2
R3R4R5R6R7
Figure 1. Computational model. A, Schematic drawing of the first segments from the soma to R4 of the MSO model neuron. TheAIS is subdivided into two compartments: the tAIS and the cAIS. B, Voltage response in different compartments (top, R5; middle,soma) to current injections at the soma (bottom). C, D, The input conductances were obtained from noise that is filtered by agammatone filter with a center frequency of 500 Hz (gray) and half-wave rectified (C, black). The trace from C is transformed intoconductance inputs by convolution with excitatory (ipsilateral, dark red; contralateral, light red) and inhibitory (ipsilateral, green;contralateral, light green) synaptic kernels (D; see Materials and Methods). E, Voltage responses of the soma (blue) and R5 (lightgray) of the model when driven with the conductance trains depicted in D. F, The AP initiating segment (IS, black arrow) is derivedfrom the voltage traces at the individual compartments (color coded segments: blue, soma; pink, tAIS; red, cAIS; green, R1; darkgray to light gray, R2–R7). Example traces show a cAIS-generated (left) and an R1-generated (right) AP. Dashed traces indicate thesearch intervals of duration L that are defined by the voltage peak (dot) of the downstream segment (see Materials and Methods).The voltage peak that occurs earliest in time defines the SIS.
5372 • J. Neurosci., April 9, 2014 • 34(15):5370 –5384 Lehnert et al. • Action Potentials in MSO Axons

Since ongoing synaptic bombardment under in vivo conditions in-creases the leakiness of the neuron, we decided to study AP generationusing a temporally extended naturalistic stimulus that resembles the pe-riodicity of a cochlear channel with a specific center frequency. Ourstimuli were generated using bandpass-filtered white noise n(t) (Fig. 1C)that was linearly filtered (convolved) with a gammatone kernel, asfollows:
ft � t4e�t�cos t�c,
with � (�c) � 24.7(4.37 � �c/(2) 1) in kilohertz (Glasberg andMoore, 1990) and the center frequency �c/(2) in kilohertz. The filteroutput was half-wave rectified and normalized to yield a spike probabil-ity function with a mean AP rate R (200 Hz) during the stimulus length l� 300 ms. The resulting input train was then multiplied with a factor S,which we call the stimulus intensity, and afterward convolved withdouble-exponential functions Gexc and Ginh, which we created to resem-ble electrophysiologically measured synaptic kinetics for excitatory andinhibitory synaptic activity (Couchman et al., 2010):
Gexct � gexc
1 � e�t/1.01.3 e�t/0.27
max 1 � e�t/1.01.3 e�t/0.27and
Ginht � ginh
1 � e�t/0.4 e�t/1.6
max 1 � e�t/0.4 e�t/1.6.
Here, gexc � 37 nS and ginh � 57 nS are the peak conductances of singlefibers (Couchman et al., 2010), and time t is considered in milliseconds.Examples for such synaptic conductance trains are shown in Figure 1D.Unless mentioned otherwise, we used two inhibitory inputs based on thesame stimulus wave form; one advances the excitatory inputs by 0.6 msand one lags them by 0.11 ms (see Impact of distal AP initiation on ITDcoding; Leibold, 2010). Apart from the simulations in which the inhibi-tory inputs are essential (see Figs. 5M, 8), all simulations were performedwith only excitatory inputs activated.
Neuron model with dendritesTo test the robustness of our findings in a model with dendrites, weperformed simulations (see Fig. 8) in a model variant in which twoidentical dendrites (five compartments each) were added to the soma.Excitatory synapses were placed at the dendrites (ipsilateral inputs at thelateral dendrite, contralateral inputs at the medial dendrite), and inhib-itory synapses were restricted to the soma (Kapfer et al., 2002). Theparameters of the dendritic model were chosen such that the basic char-acteristics at the soma (input resistance, resting potential, capacitance,and EPSP kinetics) matched that of the model with a single somatoden-dritic compartment and hence the physiological data from Scott et al.(2005) and Couchman et al. (2010). Most importantly, the length of eachof the dendrites was 200 �m, with a constant diameter of 5 �m. Thesomatic surface was reduced to 2467 �m 2, such that the total cell surfaceremained at 8750 �m 2, which is equal to the model with only one soma-todendritic compartment. The geometrical length of the dendritic com-partments appears slightly longer than that observed in MSO neurons(Rautenberg et al., 2009), since we did not take into account branching ofdendrites but had to match the overall cell surface for comparability.
In the dendritic compartments, sodium channels were omitted (Scottet al., 2010), and thus the sodium density of the remaining somatic com-partment was scaled up such that the total sodium conductance matchedthat of the simpler model with only one somatodendritic compartment.The conductance of the low-threshold potassium channels decayed ex-ponentially along the dendrites with a length constant of 74 �m(Mathews et al., 2010). The peak conductance at the somatic compart-ment was thereby identical to that of the simpler model. The conduc-tance of the h current was chosen to follow the same gradient along thedendrite to keep the local balance of the two channels. Finally, the inputresistance and resting potential of the model with dendrites werematched to those of the simpler model by adjusting the peak conduc-tances of the h current and the passive leak current.
Analysis of simulationsIn our simulations, APs during ongoing stimulation were often not detect-able in the soma (Fig. 1E). However, at more distal locations in the axon, theamplitude and kinetic differences of subthreshold responses and APs aremuch larger, and, thus, at the more distal axonal compartments these twocases are very easy to separate by a simple amplitude threshold.
Initiating segment. Since the MSO model is described by a system ofcoupled differential equations, the generation of an AP necessarily re-quires the interplay of all compartments. The question of where an AP isgenerated thus can only be answered by a phenomenological criterion.This phenomenological AP-initiating segment was identified as follows(Fig. 1F ). First, a stimulus evoked AP was defined by a voltage thresholdcriterion in R7 at which AP and no AP events are clearly separable.Second, we inspected the voltage trace at the axonal nodes of Ranvier andthe AIS going from distal to proximal, and identified the segment-specific AP times via the voltage peaks (above �50 mV) that occurredwithin a certain time interval of duration L around the voltage peak in the(previous) downstream node. The duration L of this time interval isdetermined by L � 5.33 , where is the impulse conduction time fromnode to node for a strong current stimulus delivered at rest, which elicitsa clear AIS AP. The window is asymmetrically aligned to the previousvoltage peak such that the preceding part is three times longer than thepart following the voltage peak. The factor 5.33 allows for a slower APpropagation of the AIS and near-threshold stimuli. Within the set of alldetected voltage peaks, the earliest in time defines the AP initiation seg-ment. This algorithm has been tested against a variety of simple thresholdand phase space criteria, and has proven to give more reliable results fordifferent axonal morphologies and different input parameters, even forextremely fast voltage deflections.
In simulations in which we tested higher somatic input resistances (seeFig. 5L), the somatic AP was strongly influencing the voltage trace in theAIS, which made it difficult to identify a clear AIS voltage peak. Wetherefore identified the AIS AP as the first drop of the voltage derivativebelow 50 V/s, identifying a shoulder in the voltage deflection.
In few cases (see Fig. 6) during orthodromic propagation does the APamplitude initially decrease before increasing again in the more distal
Table 1. Geometrical parameters of the model
Parameters Values
Soma/somatodendritic compartmentArea 8750 �m 2
Axon initial segment (tapering part)Length 10 �mLarge diameter 1.64 �mSmall diameter 0.66 �m
Axon initial segment (constant part)Length 10 �mDiameter 0.66 �m
InternodesLength 100 �mInner diameter 0.66 �mOuter diameter 0.948 �m (corresponding to a g-ratio of 0.7),Myelin lamellae 9 (corresponding to a myelin periodicity of 16 nm)*
Node(s) of ranvierLength 1 �mDiameter 0.66 �m
*From Agrawal et al. (2009).
Table 2. Maximum conductances of voltage-gated channels
Channels Soma tAIS cAIS Internodes Nodes
gNa 0.2 4 4 0 4gKHT 0.1 0 0 0 0gKLT 1.55 1.55 1.55 0 1.55gh 0.02 0.02 0.02 0 0glk 0.0005 0.0005 0.0005 0.0002 0.05
Data are in nS/�m 2.
Lehnert et al. • Action Potentials in MSO Axons J. Neurosci., April 9, 2014 • 34(15):5370 –5384 • 5373

axonal segments. Such APs were also labeled as being distally initiated,even though they would have been an AIS AP according to the time-window criterion.
Relative slope during ongoing conductance trains. To identify the inputfeatures that are most predictive for spiking, we placed particular empha-sis on current amplitude and the relative current slope (derivative di-vided by amplitude). We chose relative slope because the derivative ofany oscillating function linearly scales with the amplitude of the input,and, thus, without such normalization, dependencies on slopes are con-founded by amplitude effects. To determine the relative derivative of theinput current in Figure 7, G and H, we normalized by the amplitude of ahigh-pass-filtered version (fourth-order Butterworth filter with a cutoffof one-third of the stimulation frequency) of the input current ratherthan by the actual amplitude itself. This was necessary to obtain the actuallocal relative slope for each cycle and not a distorted value caused by thetemporal summation of the input currents of high-frequency stimuli.
ITD codingTo assess how well the responses of the model neuron resolve an ITD �,we computed the Fisher information I(�), assuming a Gaussian distribu-tion of AP counts. From at least 90 repetitions of a 300 ms stimulus, weobtained the mean AP count (tuning curve) �(�) and its variance v(�),and calculated the Fisher information as follows:
I� ����2
v��
1
2 �v��
v� �2
ResultsMorphometry of the AIS and proximal axonUsing a combination of retrograde tracing of MSO neurons andimmunohistochemical labeling of ankyrin G and Kv1.2 channels,a detailed morphometric analysis of the AIS and proximal axon of
Figure 2. Morphometry of the AIS and first internodal segments in MSO neurons. A, Retrogradely labeled MSO neuron after digital extraction from the surrounding area. Insets A� and A� showmagnifications of the AIS and first node of Ranvier, respectively. B, Schematic of the proximal axon segment comprising the AIS, the first internode, and the first node of Ranvier, illustrating thepositions where measurements were made. Red and green dots indicate the distribution of ankyrin G and Kv1.2 immunolabeling in the AIS and axon. A1–A4 and K1–K8 indicate the borders ofankyrin G- and Kv1.2-positive domains, respectively. JPN, Juxtaparanodes. C, Mean diameter of the AIS at various positions plotted as a function of the mean distance from the soma. Diameter anddistance measurements were made at the positions indicated in B. Error bars show the SEM.
5374 • J. Neurosci., April 9, 2014 • 34(15):5370 –5384 Lehnert et al. • Action Potentials in MSO Axons

20 msStimulusIn
tern
ode
leng
th (μm
)
50
100
125
150
0 3 6 90
0.3
0.6
0.9
500 Hz500 Hz500 Hz500 Hz
0 9 18 270
0.3
0.6
0.9
750 Hz750 Hz750 Hz750 Hz
0 20 40 600
0.2
0.4
1000 Hz1000 Hz1000 Hz1000 Hz
0 9 18 270
0.3
0.6
0.9
Nor
mal
ized
AP
freq
uenc
y Axon diameter (μm)
0.500.661.001.50
750 Hz750 Hz750 Hz750 Hz
0 9 18 270
0.3
0.6
0.9
tAIS length (μm)
5101520
750 Hz750 Hz750 Hz750 Hz
0 9 18 270
0.3
0.6
0.9
Axonal gNa
(%)75
100125150
750 Hz750 Hz750 Hz750 Hz
0 9 18 270
0.3
0.6
0.9
Nodal gNa
(%)75
100125150
750 Hz750 Hz750 Hz750 Hz
0 9 18 270
0.3
0.6
0.9
Stimulus intensity S
tAIS diameter (μm)
1.001.642.002.50
750 Hz750 Hz750 Hz750 Hz
1.00
1.64
1.64sealed
0 9 18 270
0.3
0.6
0.9
Somatic Rin
(MΩ)35
2040
750 Hz750 Hz750 Hz750 Hz
A
D
G
B C
E F
H I J
Figure 3. Input/output functions of the model. A, Spike trains were simulated for bandpass stimuli (top trace) of duration 300 ms. The four spike trains are derived from the same (frozen noise)stimulus with a center frequency of 750 Hz and intensity S � 18 (as indicated by dotted lines) and internode lengths as indicated by colors. B–J, Graphs depict firing probabilities for different(color-coded) morphological parameters and sodium conductances and for increasing stimulus intensities S (see Materials and Methods). Parameters that were varied are internode length (colorcoded) and center frequency (B–D), axonal diameter (E), length of the AIS tapering part (F ), peak sodium conductance in all unmyelinated parts of the axon (G), peak sodium conductance in thenodes of Ranvier (H ), proximal diameter of the AIS tapering part (I ), and somatic input resistance (J ). Inset in I compares relative AP frequencies of two control traces (with different tAIS diameter)from I to a model where all subthreshold transmembrane conductances were removed from the tAIS (pink trace, sealed).
Lehnert et al. • Action Potentials in MSO Axons J. Neurosci., April 9, 2014 • 34(15):5370 –5384 • 5375

12 MSO neurons was performed (Fig. 2A). Our immunostain-ings revealed that the AIS consisted of a 17.3 � 1.1-�m-longankyrin G-positive domain emerging directly from the soma anda 11.2 � 0.6-�m-long Kv1.2-positive domain starting at 7.6 �0.7 �m distal from the soma in the labeled axons (Fig. 2A,B).Diameter measurements indicated that the AIS consisted of thetAIS and the cAIS. On average, the diameter of the AIS decreasedfrom 1.6 � 0.1 �m at the soma (position A1) to 0.6 � 0.1 �m atthe position K2, as defined in Figure 2, B and C. The length of theAIS (measured from A1 to K2; Fig. 2B) ranged from 14.0 to 24.0�m (18.8 � 1.0 �m). Adjacent to the AIS was a 2.3 � 0.2-�m-long segment devoid of ankyrin G and Kv1.2 labeling, whichwe interpret as the paranodal (or para-AIS) region, wheremyelin is anchored to the axon (Duflocq et al., 2011; Fig. 2A�,arrow). The paranodal region was followed by a 2.9 � 0.5-�m-long Kv1.2-positive domain representing the juxtaparanode(or juxtapara-AIS). The first node of Ranvier was identifiedbased on its typical arrangement of two juxtaparanodal Kv1.2-positive domains that were separated from the nodal ankyrinG domain through unlabeled paranodes (Fig. 2A�). The lengthof the first internode ranged from �50 to �150 �m (100.4 �9.1 �m), and its mean diameter (Fig. 2 B, C, measured at sev-eral positions between the two juxtaparanodal borders K3and K6) was 0.7 � 0.1 �m. These axonal parameters were usedto constrain a computational model of the MSO neuron(Table 1).
Input– output functionsWe first determined how the AP frequency of our computationalneuron model is influenced by the parameters that we assumed tobe most crucial for axonal excitability (AP threshold), i.e., themorphological parameters internode length, axonal diameter,proximal diameter, and tAIS length; and the electrical propertiesdensity of sodium channels in the unmyelinated axonal segmentsand somatic input resistance (Fig. 3). We tested how much theinfluence of these excitability parameters on AP probability de-pended on the center frequency of the bandpass stimuli (see Ma-terials and Methods) and found that for center frequencies of�500 Hz all of the axonal parameters had little influence onspiking probability (Fig. 3A–D, example of internode length). Forhigher stimulus frequencies, the axonal parameters had distinctinfluences on the input– output functions. As we increased theinternode length, the spiking probability generally decreased(Fig. 3A–D), which can be attributed to a reduction of the axialcurrent flow. Geometrical alterations that increase the axonalsodium conductance (while keeping the channel density con-stant) mostly result in an increase of the firing rate. This increasecould be observed in simulations with altered axonal diameter[keeping a constant ratio of 0.7 between the inner (axon) andouter (myelin) diameter of the internode]. The firing rate alsoincreased with axonal diameter (Fig. 3E), reflecting the corre-sponding increase of the number of sodium channels. Also anincrease of the length of the tAIS led to a higher AIS sodium
−30−20−100
250
500
750
1000
1250
Amplitude (nA)
Cen
ter
freq
uenc
y (H
z)
pAP
0.15
0.25
0.5
0 0.2 0.4 0.6 0.8 1
duration
ampl
itude
I (1/ms)
6
3
1.5
4 nA
Soma
20 mV
R1
1 ms
40 mV
1 1.5 2
2
6
10
amplitudeNormalized
1/du
ratio
n (1
/ms)
(2f)−1
ampl
itude
I (kHz)
1.0
0.5
0.254 nA
Soma
20 mV
R1
1 ms
40 mV
1 1.5 20
0.5
1
amplitudeNormalized
Fre
quen
cy (
kHz)
8.7 ms−1
fastAP
no AP
2 nA
slow
3.8 ms−1 15 m
V 0.7 ms
1 1.5 2
2
4
6
8
Normalizedamplitude
1/du
ratio
n (1
/ms) I (kHz)
0.7 APno AP
2 nA 0.3
15 m
V1 ms 1 1.251.5
00.25
0.50.75
1
Normalizedamplitude
Fre
quen
cy (
kHz)
A model B1 B2model
C1 C2
D1 D2 E1 E2in−vitro in−vitro
Figure 4. Frequency-dependent AP threshold. A, Firing probability (color coded) of the model cell as a function of center frequency and cycle amplitude for ongoing inputs. Iso-probabilitycontours are shown for firing probabilities of 15% (dotted trace), 25% (dot-dashed trace), and 50% (dashed trace). B1, Ramp stimulus (left) and raw data of the simulation for three different rampdurations (right). Black and red traces indicate subthreshold and AP responses, respectively. B2, Light blue mesh shows parameter region that evoked an AP response. In vitro threshold is overlaidas a black line (see D). C, same as B, for half-wave-rectified sine stimuli. D, E, In vitro results. D1, Stimuli (left) and current-clamp traces (right) for the ramp stimulus experiment. D2, Threshold curvesfrom individual neurons (gray traces) and their average (black, n � 12, same as in B2). E, same as D, but for half-wave-rectified sine stimuli in vitro (n � 8). The data of B–E were normalized to thesmallest amplitude that elicited an AP response in the specific cell. Error bars show the SEM.
5376 • J. Neurosci., April 9, 2014 • 34(15):5370 –5384 Lehnert et al. • Action Potentials in MSO Axons

conductance and an increasing firing probability (Fig. 3F). In linewith these findings, a direct increase in the sodium conductancein unmyelinated axonal compartments (Fig. 3G,H) also facili-tated AP probabilities. However, a different effect was observedwhen the proximal diameter of the tAIS was decreased, whichalso decreased the amount of sodium conductance but, interest-ingly, increased AP frequency (Fig. 3I). This indicates that inaddition to the total local sodium conductance excitability of theaxon also profits from an increased electrotonic isolation fromthe leak currents in the soma. This interpretation was corrobo-rated by the following two additional sets of simulations: (1) anincrease of the tAIS input resistance by removing all tAIS sub-threshold conductances from the equation had almost no effecton firing probability (Fig. 3I, inset); and (2) increasing the so-matic input resistance (by multiplicative scaling of the peak con-ductances of KLT channel and h current, keeping a constantresting potential) strongly enhanced AP frequency (Fig. 3J). TheMSO soma thus acts as a strong current sink for the AIS, and,hence, the axon excitability crucially depends on rather smallchanges of the somatic current reaching the axon.
Frequency-dependent thresholdSince the firing probabilities strongly depended on the centerfrequency of the inputs (Fig. 3), we performed a more systematicanalysis of the frequency dependence of excitability of our com-putational neuron model and corroborated these data by in vitromeasurements of MSO cells. The frequency dependence of MSOfiring probability in the model was determined for a large range ofbandpass stimuli with center frequencies ranging from 100 to
1250 Hz and varying stimulation intensities (Fig. 4A). This allowsthe assessment of the firing thresholds of MSO neurons withrespect to both the shape (frequency content) and the amplitudeof the input currents. The lowest current thresholds were ob-served at �500 Hz. For higher as well as lower input frequencies,more excitatory drive was necessary to reach a certain firingprobability.
To better understand the dependence of AP initiation on theinput kinetics, we simulated two onset stimulation paradigmsusing brief current stimuli applied at rest. First, we applied a rampstimulus for which we could independently vary amplitude andramp duration (Fig. 4B1). The ramp duration was assumed toserve as a proxy for stimulus shape (frequency) during the ongo-ing bandpass stimulation. The firing probabilities (Fig. 4B2) ob-tained with these stimuli very well explained the behaviorobserved for low-frequency bandpass inputs, which effectivelyimplements a slope threshold (Golding and Oertel, 2012); that is,the neuron fires in response to a specific speed of membranedepolarization that is rather independent of amplitude. Such be-havior has been previously described in octopus cells (Ferragamoand Oertel, 2002), in the vestibular pathway (Beraneck et al.,2007) and the MSO (Jercog et al., 2010), and is generally attrib-uted to the fast kinetics of the KLT channels, which are furtheropening only for slow stimuli and cannot generate such addi-tional leaks for fast-rising stimuli. The high-frequency behaviorof our threshold profile, however, could not be modeled using thesimple ramp stimuli. We therefore also applied half-wave-rectified sine waves (Fig. 4C1). Here again, both the low- and thehigh-frequency increase of threshold amplitudes was observed
S AIS R1 R3 R5 R70
0.3
0.6R
in (
GΩ
)
S AIS R1 R3 R5 R70
2
4
I ax(p
A)
S AIS R1 R3 R5 R70
0.1
Vax
(mV
)
Segment
10 ms
30 mV
0.5 ms
0.25 0.5 0.75 10
0.2
0.4
0.6
0.8
Internodelength (μm)
50100125150
D−
AP
frac
tion
0.25 0.5 0.75 10
0.2
0.4
0.6
0.8
Axonaldiameter (μm)
0.500.661.001.50
Stimulus frequency (kHz)0.25 0.5 0.75 1
0
0.2
0.4
0.6
0.8Nodal g
Na(%)
75100125150
off on0
0.2
0.4
0.6
0.8
Inhibition
Frequency(Hz)250500750
1000
3 5 20 1000
0.2
0.4
0.6
0.8
Frequency(Hz)2505007501000
Somatic Rin (MΩ)
A
B
C
D
E F G H
I J K L M
Soma cAISR1
R2R3
R4R5
Figure 5. Distal AP initiation. A–C, Local input resistance (A), axial current (B), and Vax (C) in the different model compartments for the standard parameters (black traces), the model with shorterinternode lengths of 50 �m (magenta traces), and thicker axonal diameter of 1.5 �m (cyan traces). D, Exemplary voltage traces in different compartments (colors as indicated). Filled colored circlesshow the AP-initiating segment for each suprathreshold response (see legend). E–H, Example events (from D) for subthreshold response (E), and evoked APs generated in the AIS (F ), R1 (G), andR2 (H ). I–K, Fraction of distally initiated APs (D-AP; for a fixed AP probability of 15%), with varying internode length (I ), axonal diameter (J ), and sodium conductance in the nodes of Ranvier (K ).L, Fraction of distally initiated APs for different somatic input resistances. M, Fraction of distally initiated APs without and with inhibition for several input frequencies.
Lehnert et al. • Action Potentials in MSO Axons J. Neurosci., April 9, 2014 • 34(15):5370 –5384 • 5377

(Fig. 4C2). Thus, the threshold amplitudefor high frequencies crucially depends onthe duration of the stimulus. This indi-cated that the high-frequency part of thethreshold curve reflects the limit imposedby the charging of the membrane capaci-tor for regimes in which the membranevoltage rises too quickly to open the low-threshold potassium channels (Jercog etal., 2010). These modeling results wereverified physiologically using whole-cellcurrent-clamp recordings using the samestimuli as in the model (see Materials andMethods). From the recorded data ob-tained with the ramp stimuli, the APprobability was fitted by a sigmoid foreach ramp duration as a function of theamplitude using at least 10 consecutivetrials. The amplitude at which the fit wasat 50% AP probability was defined as thethreshold. The physiologically obtainedthreshold curves qualitatively matchedthe modeling results for the ramp-current stimuli (Fig. 4B2, su-perimposed black trace, D) with less firing for slow-input rampsand secure responses for faster ramps. For the half-wave-rectifiedsine stimuli, threshold amplitudes were obtained by manual test-ing (Fig. 4C2, superimposed black trace, E) and also qualitativelymatched the simulations with the lowest firing threshold for me-dium frequencies and less firing for low and high frequencies.From these simulations and experiments, we concluded that thethreshold behavior observed during ongoing stimulation is func-tionally very similar to that in onset-like stimulus paradigms withsingle current pulses.
Site of AP initiationAlthough AP initiation might be functionally similar under onsetand ongoing stimulus conditions, the underlying mechanismsmay be different, since, owing to the temporal summation of theinputs, the ongoing stimulation sets the cell membrane into astate that is very different from resting conditions (e.g., because ofsteady-state activation of channels and changes in input resis-tance). We therefore investigated AP initiation during ongoingstimulation in greater detail. In particular, we were interested inthe contributions of the different cellular (somatic and axonal)compartments to the generation of APs.
A first assessment of the local excitability of the model neuronwas derived from local input resistance measurements, usingsmall hyperpolarizing current pulses (amplitude, �100 pA for300 ms) that were consecutively injected into the soma, the cAIS,and the nodes of Ranvier of our model at rest (Fig. 5A, blacktrace). Here, the input resistance was derived from the peak of thevoltage responses and not the steady-state component to obtain ameasure for the instantaneous susceptibility of the local mem-brane. In our model, the peak conductance parameters were cho-sen such that the somatic input resistance was fixed at 5 M�(Scott et al., 2005; Couchman et al., 2010). With the standardparameter settings (Tables 1 and 2), the AIS had two (tAIS, 9.7M�) to six times (cAIS, 28.5 M�) the input resistance of thesoma. Further distally in the axon, the R1 showed a 50-fold in-crease of input resistance (256.5 M�). We next applied a currentpulse of 1 nA at the soma while at the same time extracting thepeak of the axial current in the respective axonal segments (Fig.5B, black trace). The portion of this current that spread from the
soma into the AIS was only 0.4% (4 pA), with further attenuationat the R1 (0.3 pA). Multiplying the axial current by the local inputresistance yields a measure that can be interpreted as the axonallymediated voltage amplitude (Vax). This voltage amplitude wasfurther used as an estimate for the local excitability. The axiallymediated voltage amplitude was maximal at the second and thirdnodes of Ranvier (Fig. 5C, black trace). Thus, in contrast to theclassical model of AP initiation at the AIS, the second and thirdnodes appear to be more excitable, indicating that the more distalcompartments play an important role in axon excitability in leakyneurons.
A detailed analysis of AP times in the individual compart-ments revealed that the site of AP initiation was indeed not re-stricted to the AIS (Fig. 5D–H). Although many APs wereinitiated in the AIS (Fig. 5F, I–K), 5– 60% (depending on inputconditions) of the APs first crossed the detection threshold (seeMaterials and Methods) at the first (Fig. 5G) or even the second(Fig. 5H) node of Ranvier, while the AIS showed a responsesimilar to the subthreshold case (Fig. 5E). The amplitudes of thesomatic and AIS APs were relatively small, independent of wherethey were generated, and underwent subsequent amplificationby the nodes of Ranvier as they orthodromically propagatedalong the axon (Fig. 5F–H).
To further elucidate the mechanisms of this distal AP initia-tion, we quantified its occurrence under our naturalistic ongoinginput paradigm for different morphological parameters. Forpurely excitatory inputs, the fraction of distally initiated APs overAIS APs increased with stimulus frequency (Fig. 5I–L). Forshorter internodes (Fig. 5I) and thicker axonal diameter (Fig. 5J),more distal APs were observed. This is because the resulting in-creased axial conductance allows the stimulus-evoked potentialto propagate further along the axon and is also illustrated by thepeak of the Vax located at more distal regions of the axon in bothconditions (Fig. 5C, cyan and magenta traces). Consistently, ahigher nodal sodium conductance increased the fraction of dis-tally initiated APs as well, because APs could be more easily ini-tiated at the nodes (Fig. 5K).
A major factor influencing distal AP initiation for inputs at allcenter frequencies is the somatic input resistance. The prevalenceof distal AP initiation is strongly reduced with the increase ofinput resistance of the soma (Fig. 5L). Hence, distal spiking
250 Hz
200
nS
100 ms baseline
500 Hz 750 Hz 1000 Hz
0 100 200
40
60
80
Conductance (nS)S
odiu
m in
activ
atio
n (%
)
SAISR1R2R3
S AIS R1 R2 R3
40
60
80
Segment250 500 750 1000
0
0.5
1
200300400500
Stimulus frequency (Hz)
D−
AP
frac
tion
A
CB D
Figure 6. High input frequencies cause sodium channel inactivation in the somatic and proximal axonal membranes. A, Periodicsynaptic conductances with a peak value of 400 nS for center frequencies of 250, 500, 750, and 1000 Hz. Red traces are obtained bylow-pass filtering the voltage traces (cutoff frequency, 100 Hz). B, Steady-state sodium channel inactivation measured in differentmodel compartments for increasing excitatory conductances. C, Steady-state sodium channel inactivation for traces (color coded)in A in different compartments. D, Fraction of distally initiated APs (D-APs) for input traces in A with different conductance peakvalues (color coded; in nS).
5378 • J. Neurosci., April 9, 2014 • 34(15):5370 –5384 Lehnert et al. • Action Potentials in MSO Axons

should be particularly prevalent in leaky neurons that receivefast-fluctuating inputs such as in the MSO.
Since MSO neurons not only receive excitatory inputs but alsostrong phase-locked inhibitory inputs via the medial and lateraltrapezoid body, we also performed simulations with excitatoryand inhibitory inputs. In these simulations, the frequency depen-dence of the site of AP initiation is less clear (Fig. 5M). On the onehand, the fraction of distally initiated APs also increased withfrequency for center frequencies of �500 Hz. On the other hand,
for a low center frequency of 250 Hz, in-hibition also generated large amounts ofdistal AP initiation. This already indicatesthat distal AP initiation may result from avariety of different mechanisms, particu-larly also those that add to the somaticcurrent sink.
Distal AP initiation forhigh-frequency inputsThe steady-state approach to axonal excit-ability (Fig. 5A–C) disregards contribu-tions from the dynamics of the ionchannels. To understand whether suchdynamic properties of the neuron modelalso contribute to distal AP initiation, weused strictly periodic synaptic (conduc-tance) input trains of different frequen-cies (Fig. 6A). Temporal summation ofthe synaptic inputs generated a conduc-tance plateau that increased with fre-quency as revealed by low-pass filtering(Fig. 6A, second-order Butterworth low-pass filter with a cutoff frequency of 100Hz, red traces). We then applied these av-erage conductance values as a constantconductance to the cell and measured thecorresponding steady-state sodium chan-nel inactivation at the soma, the AIS, andthe first three nodes of Ranvier (Fig. 6B).This revealed that a larger average con-ductance generally caused more sodiumchannel inactivation. Moreover, the con-ductance level was highest at the soma anddecreases along the axon. Thus, a regimeof a high-frequency input generates a per-sistent depolarization of the membranewith a larger fraction of inactivated so-dium channels at the proximal axonalmembranes than at the distal segments(Fig. 6C). As a result, this leads to a largerfraction of distal AP initiation with in-creased input frequency (Fig. 6D).
Influence of distal AP initiation on thefiring thresholdTo understand the functional relevance ofdistal AP initiation, we next investigatedwhich input properties are particularlyamenable to evoke distal APs during on-going stimulation (Fig. 2B–D). We there-fore repeatedly stimulated the neuronmodel with identical input trains for con-secutively increasing mean synaptic con-
ductances. Figure 7A–F shows an exemplary stimulus cycle forwhich, with increasing conductance, the voltage profile along theaxon transitions from a completely subthreshold response (Fig.7B) over an AP being initiated at the nodes of Ranvier (Fig. 7C,D)to an AP generated at the AIS (Fig. 7E,F). From these examples,it seemed that distal AP initiation is particularly prevalent at theAP threshold.
To further evaluate the threshold property of distal AP initia-tion, we ran the simulations using excitatory bandpass inputs of
102 nS
1 ms
106 nS 107 nS 114 nS
10 ms
30 mV
129 nS
−12−10−8−6−4−20
1
2
3
Amplitude (nA)
Rel
ativ
e sl
ope
(1/m
s)
250 Hz
no APAP AISD−AP
−40−2000
5
10
15
Amplitude (nA)
Rel
ativ
e sl
ope
(1/m
s)
1000 Hz
no APAP AISD−AP
2 4 6
0
0.2
0.4
0.6
0.8
1
Stimulus intensity
AP
rat
e / D
−A
P fr
actio
n APD−AP
0 30 60
0
0.2
0.4
0.6
0.8
1
Stimulus intensity
AP
rat
e / D
−A
P fr
actio
n APD−AP
A
B C D E F
G1
G2
H1
H2
SomacAISR1
R2R3
R4R5
Figure 7. Function of distal AP initiation. A, Example voltage traces for a stimulus with center frequency 250 Hz. The boxindicates a cycle that was further investigated for different excitatory peak conductance values. B–F, The selected stimulus cycleevolves from a subthreshold response (B), via a distally initiated AP (C, D), to an AP initiated in the AIS (E, F ). G1, Model responsesto input trains with a center frequency of 250 Hz generate a broad range of cycle amplitudes and relative derivatives (see Materialsand Methods). Each dot corresponds to a cycle within the input train. Black, Subthreshold response; red, AP response initiated inthe AIS; cyan, AP response initiated in a node of Ranvier (D-AP). G2, Firing rate and fraction of distally initiated APs for increasingexcitatory synaptic conductances and an input with 250 Hz center frequency. H1, Same as G1 for an input with a center frequencyof 1000 Hz. The cyan line in the box is a linear fit to the distally initiated APs from G1. H2, Same as G2 but for inputs with 1000 Hzcenter frequency.
Lehnert et al. • Action Potentials in MSO Axons J. Neurosci., April 9, 2014 • 34(15):5370 –5384 • 5379

different center frequencies and amplitudes. For a low-frequencyinput with a center frequency of 250 Hz, the rate of distally initi-ated APs was highest right at the border between no APs and AISAPs (Fig. 7G1,G2). The orientation of this border was diagonal inamplitude–frequency space and qualitatively matched the APboundaries from Figure 4 (Fig. 7G1). For 1000 Hz, the distribu-tion of AIS APs and distally initiated APs is different (Fig.7H1,H2). There, the boundary between AP firing and no firingwas approximately vertical, indicating that the cell effectively im-plemented an amplitude threshold being insensitive to the slopeof the input current (Fig. 7H1). Moreover, for 1000 Hz centerfrequency, distal AP initiation could no longer be seen as a thresholdeffect. In fact, after an initial dip for low amplitudes, the overallfraction of distally initiated spikes rose with input amplitude (Fig.7H), which is in line with the dependence of the fraction of distallyinitiated APs on sodium inactivation from Figure 6.
In conclusion, distal AP initiation seems to have two effects.(1) If the sodium channels were only slightly inactivated, the cellis able to fire in response to smaller stimulus amplitudes thanwithout distal initiation of APs. (2) If the sodium channels arelargely inactivated (as in the case of temporally summed high-frequency input), distal AP initiation allows the cell to keep uphigh firing rates for high-frequency stimuli with large stimulusamplitudes.
Impact of distal AP initiation on ITD codingThe above findings have important consequences for the firingbehavior of MSO cells in vivo. We simulated ITD tuning functionsusing our ongoing input paradigm with synaptic conductances de-rived from bandpass-filtered noise. Mimicking phase-locked au-
ditory activity from the two ears, we split up the synaptic inputsinto two channels with distinct temporal disparity for the puta-tive ipsilateral and contralateral excitatory synapses, which, dis-regarding possible additional cochlear and transmission delays,we interpret as an ITD. We assumed that the cell also receivedphase-locked inhibitory input from both ears (from the medialand lateral nuclei of the trapezoid body) and used the inhibitorysynapses to generate a maximum shift in best ITD (Brand et al.,2002; Leibold and van Hemmen, 2005; Pecka et al., 2008; Leibold,2010). For bandpass input with a center frequency of 250 and 500Hz, the contralateral inhibition was advanced compared withexcitation by 0.8 ms, whereas the ipsilateral inhibition was de-layed with respect to excitation by 0.11 ms. For these low centerfrequencies of the input, the model generated a rate code of ITD(Fig. 8A1,A2) in which firing at low rates was relatively moresupported by distally initiated APs (Fig. 8B1,B2). This becomesobvious if one computes Fisher information as a means to assessthe ITD resolution of the neuronal responses (Fig. 8C). Fisherinformation (resolution) is particularly high at the slopes of thetuning curves. In line with the high fractions of distally initiatedAPs at low firing rates (Fig. 8B), distally initiated APs also con-tribute a particularly large amount of information at these lowrate regimes. Although, for the present definition of ITDs, theselow rate parts are largely outside the physiological range (Fig. 8,gray bars), they might still become physiologically relevant if ad-ditional bilaterally asymmetric cochlear, axonal, or cellular delaysexist that shift the tuning curves in parallel to the ITD axis.
To achieve the maximal peak shift for bandpass input with acenter frequency of 1000 Hz, we set the contralateral inhibition tolead the excitation by 0.5 ms. The situation was very similar to
−1−0.5 0 0.5 10
0.1
250 Hz
Rela
tive
AP
rate all
AISD−AP
−1−0.5 0 0.5 10
0.3
0.6
0.9
D−A
P fr
actio
n
−1−0.5 0 0.5 10
100
200
Fish
er in
form
atio
n
−1−0.5 0 0.5 10
0.1
500 Hz
−1−0.5 0 0.5 10
0.3
0.6
0.9
−1−0.5 0 0.5 10
500
1000
−1−0.5 0 0.5 10
0.1
1000 Hz
−1−0.5 0 0.5 10
0.3
0.6
0.9
−1−0.5 0 0.5 10
500
1000
ITD (ms)
−1−0.5 0 0.5 10
0.2
0.4
500 Hz
−1−0.5 0 0.5 10
0.3
0.6
0.9
−1−0.5 0 0.5 10
2000
4000
−1−0.5 0 0.5 10
0.1
500 Hz
−1−0.5 0 0.5 10
0.3
0.6
0.9
−1−0.5 0 0.5 10
1000
2000
A A A A A1 2 3 4 5
B B B B B1 2 3 4 5
C C C C C1 2 3 4 5
with inhibition without inhibition with dendrites
Figure 8. Representation of auditory space. A, ITD tuning curves (more specifically noise delay functions; black) for input trains of 250, 500, and 1000 Hz center frequency, a purely excitatorymodel, and a model with dendrites (both receiving input with 500 Hz center frequency). Tuning curves without distally initiated APs are depicted in red, and tuning curves with only distally initiatedAPs are depicted in green. Gray bar indicates the physiological range of ITDs for gerbils. B, Fraction of distally initiated APs (D-APs) of the tuning curves from A. C, Fisher information (in kHz 2, stimulusduration 300 ms) of the tuning curves (and the respective distal and AIS parts) from A.
5380 • J. Neurosci., April 9, 2014 • 34(15):5370 –5384 Lehnert et al. • Action Potentials in MSO Axons

those for the two lower center frequencies, only that the best ITD,in contrast to in vivo findings (Brand et al., 2002), was close to themidline (Fig. 8A3), and the code was mediated by distal AP initi-ation to an even larger extent (Fig. 8B3). Also Fisher informationwas particularly high for distally initiated APs, even within thephysiological range without any additional asymmetric delays(Fig. 8C3). Thus, the realistically slow decaying inhibition (expo-nential decay with a time constant of 1.6 ms; Magnusson et al.,2005; Couchman et al., 2010) could well account for the observedpeak shifts of low-frequency cells in gerbils, whereas it (at leastalone) does not do so for frequencies of �1 kHz and beyond(Pecka et al., 2008).
As a control, we ran the simulations without inhibitory inputs(Fig. 8A4,B4,C4) which resulted in a best delay of zero. In this case,distally initiated APs were less prevalent. We thus conclude thatdistal AP initiation is an important mode of AP generation, par-ticularly in the high-frequency channels but also in low-frequency channels with phase-locked inhibition.
In a final set of simulations, we tested how robust our findingsare in a model that includes dendrites (Fig. 8A5,B5,C5). MSOneurons typically have two dendrites, a lateral one receivesipsilateral excitatory input fibers and a medial one targeted bycontralateral excitatory input fibers. We adjusted the modelsuch that all basic physiological properties matched those ofthe simpler model and, hence, the published electrophysiolog-ical data (Scott et al., 2005; Couchman et al., 2010). The tuningcurves and distal AP fractions from this extended model werealmost identical to that of the simpler model. We thus con-
clude that the additional dendritic cur-rent sinks do not influence theexcitability of the neuron beyond theircontribution to the basic physiologicalparameters (input resistance, restingpotential, and EPSP shape).
DiscussionIn this study, we used naturalistic synapticconductance trains to investigate AP ini-tiation in a model of binaural coincidencedetector neurons in the MSO, featuring adetailed axonal morphology. Modeling aswell as electrophysiology showed thatMSO cells incorporate temporal filteringproperties such that they were easiest toexcite for an input frequency of �500 Hz.In contrast to current theories, the site ofAP generation was not restricted to theAIS but varied depending on the spectralcomposition of the input. Further distallyinitiated APs (at the nodes of Ranvier) oc-curred close to the AP threshold in low-frequency channels, particularly in thepresence of inhibition, as well as for strongstimulation in the high-frequency chan-nels. Mechanistically, distal AP initiationat low frequencies was mediated by astrong somatic current sink, whereas forhigh frequencies it resulted from a stron-ger sodium channel inactivation in theAIS than in the distal axon. Importantly,in both cases, the ability of the neuron togenerate APs in more distal axonal seg-ments increased the dynamic range of fir-ing rates. Distal AP initiation thereby
facilitates the resolution of the rate code of ITDs in the cell (Skot-tun, 1998).
Our model simulations show that AP initiation cannot beviewed to generally occur at one specific site, but rather the prox-imal axonal segments act as a whole during this process. This isbecause the axial transport of charge particularly strongly deter-mines the excitability of neighboring axonal segments (Baranaus-kas et al., 2013). To support the idea of distributed AP generationon a phenomenological level, we compared the trajectories of AISAPs and distally initiated APs plotting AIS voltage against voltageat the first node of Ranvier (Fig. 9). Although, on average, we seea clear distinction between the trajectories of the AIS and distallyinitiated APs, for higher stimulus frequencies the two sorts oftrajectories form a continuum. This means that for some APs it isvalid to assign a single site of initiation, but for others (Fig. 9, closeto the border between red and green traces) it is rather difficult. Afurther argument in favor of spatially distributed AP generation isthat the distribution of AP initiation sites in our model alsodepends on stimulus frequency, with high frequencies givingrise to more distal spiking (Fig. 5I ). This finding is consistentwith previous reports about layer 5 pyramidal neurons reveal-ing that the first node of Ranvier facilitates high-frequency(�100 Hz) burst firing and reduces the somatic AP thresholdby 5 mV (Kole, 2011). In summary, these results suggest thatfor high-frequency inputs, AP initiation of MSO cells indeedresults from a spatially distributed and collective mechanism,
−60 −40 −20−80
−60
−40
−20
0250 Hz
AISD−AP
−60 −40 −20−80
−60
−40
−20
0500 Hz
−60 −40 −20−80
−60
−40
−20
0750 Hz
−60 −40 −20−80
−60
−40
−20
01000 Hz
VAIS
(mV)
VR
1(m
V)
Figure 9. Is there a discrete site of AP initiation? AIS voltage vs voltage at the first node of Ranvier during AP firing for inputswith different center frequencies (as indicated). Red traces are APs identified as AIS APs by the algorithm described in Figure 1F.Green traces are APs classified as distally initiated (D-AP).
Lehnert et al. • Action Potentials in MSO Axons J. Neurosci., April 9, 2014 • 34(15):5370 –5384 • 5381

whereas for low-frequency inputs APs are rather generated ata distinct site.
Our computational model explains the small AP amplitudesobserved in vivo (Yin and Chan, 1990) and in vitro (Scott et al.,2007; Couchman et al., 2010). However, the specific choice ofparameters is crucial to further justify the model results. Whereasmost of the parameters are closely tied to the existing MSO liter-ature and the new morphometric data presented in this article,specifically the sodium conductances have not yet been deter-mined experimentally in MSO axons. We have set the axonalsodium conductance density such that the firing threshold (70 –110 nS) for a single excitatory synaptic conductance stimulus fitsour current-clamp measurements (Couchman et al., 2010).Moreover, the axonal sodium conductance density of 4 nS/�m 2
used in the model lies within the range of values reported forcortical pyramidal neuron AISs (2.5 nS/�m 2, Kole et al., 2008)and has been used in several other studies (7.5 nS/�m 2, Shu et al.,2007; 4.5 nS/�m 2, Spirou et al., 2008). In our standard parameterset, we decided to use the same sodium channel density for allunmyelinated axonal compartments (the AIS and the nodes ofRanvier). This simplification rather leads to an underestimationof distal AP initiation (Fig. 5K). Assuming a higher sodium chan-nel density in the nodes of Ranvier than in the axon initial seg-ment, as shown by immunogold electron microscopy in corticalpyramidal cells (Lorincz and Nusser, 2010), relatively decreasesthe excitability of the AIS, thereby increasing the fraction of dis-tally initiated APs.
In the analog ITD circuitry of birds, axonal processing has alsobeen shown to be functionally important (Kuba et al., 2006;Ashida et al., 2007). In NL cells receiving phase-locked inputs upto 3 kHz, the AP initiation zone (clustering of sodium channels)of the AIS is located substantially more distal compared with thelow-frequency neurons (Kuba et al., 2006). This finding is in linewith the present observation of AP initiation moving to moredistal parts of the axon for high-frequency stimuli. Comparedwith MSO principal neurons, which we suggest to have a dynam-ically changing site of AP initiation, in NL neurons the site of APinitiation seems rather hardwired, which is also supported by apartial myelination of the initial segment (Carr and Boudreau,1993).
The mechanisms underlying ITD tuning of MSO principalneurons are highly debated (Grothe et al., 2010; Roberts et al.,2013; van der Heijden et al., 2013). Traditionally, ITD processingwas thought to rely exclusively on the coincidence detection ofexcitatory inputs and neuronal ITD representation on the neu-rons that respond most at their best ITD. This best ITD is deter-mined by the difference of internal delay lines between the earsand the coincidence detector neuron (Jeffress, 1948). While in thebird systems this concept still seems to constitute the core mech-anism underlying ITD maps (Ashida and Carr, 2011), the situa-tion in mammals is less clear. In brainstem and midbrain, the bestITDs change with stimulus frequency inconsistently with the as-sumption of a solely temporal conduction delay (i.e., they exhibita so-called characteristic phase; Yin and Chan 1990, Agapiou andMcAlpine, 2008, Siveke et al., 2012). Furthermore, blockade ofglycinergic transmission in vivo shifted the best ITD of MSOneurons toward zero (Brand et al., 2002), hence arguing for adistinct effect of inhibitory inputs on the timing and shape of theexcitatory potentials (Brand et al., 2002; Pecka et al., 2008) andproviding a putative explanation for the frequency-dependentbest ITDs (Leibold, 2010). Although it has been assumed that,given its slow kinetics, inhibition alone cannot account for a sub-stantial shift of the best ITD (Jercog et al., 2010; Day and Semple,
2011; Roberts et al., 2013), our present modeling results showthat inhibition has the potential to generate shifts as large as thephysiological ITD range of gerbils (�130 �s), at least for frequen-cies �500 Hz. This, of course, does not exclude further mecha-nisms like cochlear or axonal delays (Schroeder, 1977; Shamma etal., 1989; Joris et al., 2006; Day and Semple, 2011) and morpho-logical (Zhou et al., 2005; but see Rautenberg et al., 2009) orphysiological (Jercog et al., 2010; but see Roberts et al., 2013)asymmetries. A further argument against a contribution of fastinhibition to the shift of best ITDs stems from recent in vivowhole-cell recordings (van der Heijden et al., 2013), which state alack of obvious hyperpolarizing IPSPs. Because of the slow inhib-itory time constant, our simulations show that during an ongoingstimulus IPSPs indeed do not show up as isolated potentials (Fig.1D) but nevertheless influence the phase of the monaurally in-duced oscillations sufficiently to induce a shift of best ITDs (evenfor 1 kHz, although not much).
Beyond the auditory brainstem, fast and leaky cell membraneshave also been reported in cortical pyramidal cells during massivesynaptic bombardment such as in high-conductance states [Pareet al., 1998 (who reported input resistances as low as 4 M�)]and sharp wave ripple events (Bahner et al., 2011). Under bothconditions, the cells show extensive spiking activity in vivo(Csicsvari et al., 1999; Steriade, 2001). It is thus tempting tospeculate that distal AP initiation contributes to firing as wellby allowing the somatic current sink to decouple from theaxonal AP-generating zones in a context-dependent manner(Vladimirov et al., 2013).
ReferencesAgapiou JP, McAlpine D (2008) Low-frequency envelope sensitivity pro-
duces asymmetric binaural tuning curves. J Neurophysiol 100:2381–2396.CrossRef Medline
Agrawal D, Hawk R, Avila RL, Inouye H, Kirschner DA (2009) Internodalmyelination during development quantitated using x-ray diffraction.J Struct Biol 168:521–526. CrossRef Medline
Ashida G, Carr CE (2011) Sound localization: Jeffress and beyond. CurrOpin Neurobiol 21:745–751. CrossRef Medline
Ashida G, Abe K, Funabiki K, Konishi M (2007) Passive soma facilitatessubmillisecond coincidence detection in the owl’s auditory system. J Neu-rophysiol 97:2267–2282. CrossRef Medline
Bahner F, Weiss EK, Birke G, Maier N, Schmitz D, Rudolph U, Frotscher M,Traub RD, Both M, Draguhn A (2011) Cellular correlate of assemblyformation in oscillating hippocampal networks in vitro. Proc Natl AcadSci U S A 108:E607– 616. CrossRef Medline
Baranauskas G, David Y, Fleidervish IA (2013) Spatial mismatch betweenthe Na flux and spike initiation in axon initial segment. Proc Natl AcadSci U S A 110:4051– 4056. CrossRef Medline
Baumann VJ, Lehnert S, Leibold C, Koch U (2013) Tonotopic organizationof the hyperpolarization-activated current (Ih) in the mammalian medialsuperior olive. Front Neural Circuits 7:117. CrossRef Medline
Beraneck M, Pfanzelt S, Vassias I, Rohregger M, Vibert N, Vidal PP, MooreLE, Straka H (2007) Differential intrinsic response dynamics determinesynaptic signal processing in frog vestibular neurons. J Neurosci 27:4283–4296. CrossRef Medline
Brand A, Behrend O, Marquardt T, McAlpine D, Grothe B (2002) Preciseinhibition is essential for microsecond interaural time difference coding.Nature 417:543–547. CrossRef Medline
Carr CE, Boudreau RE (1993) An axon with a myelinated initial segment inthe bird auditory system. Brain Res 628:330 –334. CrossRef Medline
Couchman K, Grothe B, Felmy F (2010) Medial superior olivary neuronsreceive surprisingly few excitatory and inhibitory inputs with balancedstrength and short-term dynamics. J Neurosci 30:17111–17121. CrossRefMedline
Csicsvari J, Hirase H, Czurko A, Mamiya A, Buzsaki G (1999) Oscillatorycoupling of hippocampal pyramidal cells and interneurons in the behav-ing Rat. J Neurosci 19:274 –287. Medline
Day ML, Semple MN (2011) Frequency-dependent interaural delays in the
5382 • J. Neurosci., April 9, 2014 • 34(15):5370 –5384 Lehnert et al. • Action Potentials in MSO Axons

medial superior olive: implications for interaural cochlear delays. J Neu-rophysiol 106:1985–1999. CrossRef Medline
Duflocq A, Chareyre F, Giovannini M, Couraud F, Davenne M (2011)Characterization of the axon initial segment (AIS) of motor neurons andidentification of a para-AIS and a juxtapara-AIS, organized by protein4.1B. BMC Biol 9:66. CrossRef Medline
Ferragamo MJ, Oertel D (2002) Octopus cells of the mammalian ventralcochlear nucleus sense the rate of depolarization. J Neurophysiol 87:2262–2270. CrossRef Medline
Fitzpatrick DC, Batra R, Stanford TR, Kuwada S (1997) A neuronal popu-lation code for sound localization. Nature 388:871– 874. CrossRefMedline
Ford MC, Grothe B, Klug A (2009) Fenestration of the calyx of Held occurssequentially along the tonotopic axis, is influenced by afferent activity,and facilitates glutamate clearance. J Comp Neurol 514:92–106. CrossRefMedline
Foust A, Popovic M, Zecevic D, McCormick DA (2010) Action potentialsinitiate in the axon initial segment and propagate through axon collateralsreliably in cerebellar Purkinje neurons. J Neurosci 30:6891– 6902.CrossRef Medline
Gentet LJ, Stuart GJ, Clements JD (2000) Direct measurement of specificmembrane capacitance in neurons. Biophys J 79:314 –320. CrossRefMedline
Glasberg BR, Moore BC (1990) Derivation of auditory filter shapes fromnotched-noise data. Hear Res 47:103–138. CrossRef Medline
Goldberg JM, Brown PB (1969) Response of binaural neurons of dogsuperior olivary complex to dichotic tonal stimuli: some physiologicalmechanisms of sound localization. J Neurophysiol 32:613– 636.Medline
Golding NL, Oertel D (2012) Synaptic integration in dendrites: exceptionalneed for speed. J Physiol 590:5563–5569. CrossRef Medline
Grothe B, Pecka M, McAlpine D (2010) Mechanisms of sound localizationin mammals. Physiol Rev 90:983–1012. CrossRef Medline
Jeffress LA (1948) A place theory of sound localization. J Comp PhysiolPsychol 41:35–39. CrossRef Medline
Jercog PE, Svirskis G, Kotak VC, Sanes DH, Rinzel J (2010) Asymmetricexcitatory synaptic dynamics underlie interaural time difference pro-cessing in the auditory system. PLoS Biol 8:e1000406. CrossRefMedline
Joris PX, Van de Sande B, Louage DH, van der Heijden M (2006) Binauraland cochlear disparities. Proc Natl Acad Sci U S A 103:12917–12922.CrossRef Medline
Kapfer C, Seidl AH, Schweizer H, Grothe B (2002) Experience-dependentrefinement of inhibitory inputs to auditory coincidence-detector neu-rons. Nat Neurosci 5:247–253. CrossRef Medline
Koch U, Braun M, Kapfer C, Grothe B (2004) Distribution of HCN1 andHCN2 in rat auditory brainstem nuclei. Eur J Neurosci 20:79 –91.CrossRef Medline
Kole MH (2011) First node of Ranvier facilitates high-frequency burst en-coding. Neuron 71:671– 682. CrossRef Medline
Kole MH, Letzkus JJ, Stuart GJ (2007) Axon initial segment Kv1 channelscontrol axonal action potential waveform and synaptic efficacy. Neuron55:633– 647. CrossRef Medline
Kole MH, Ilschner SU, Kampa BM, Williams SR, Ruben PC, Stuart GJ(2008) Action potential generation requires a high sodium channeldensity in the axon initial segment. Nat Neurosci 11:178 –186.CrossRef Medline
Kuba H, Ishii TM, Ohmori H (2006) Axonal site of spike initiation enhancesauditory coincidence detection. Nature 444:1069 –1072. CrossRefMedline
Leibold C (2010) Influence of inhibitory synaptic kinetics on the interauraltime difference sensitivity in a linear model of binaural coincidence de-tection. J Acoust Soc Am 127:931–942. CrossRef Medline
Leibold C, van Hemmen JL (2005) Spiking neurons learning phase delays:how mammals may develop auditory time-difference sensitivity. PhysRev Lett 94:168102. CrossRef Medline
Lorincz A, Nusser Z (2010) Molecular identity of dendritic voltage-gatedsodium channels. Science 328:906 –909. CrossRef Medline
Magnusson AK, Kapfer C, Grothe B, Koch U (2005) Maturation of glycin-ergic inhibition in the gerbil medial superior olive after hearing onset.J Physiol 568:497–512. CrossRef Medline
Mainen ZF, Sejnowski TJ (1996) Influence of dendritic structure on firing
pattern in model neocortical neurons. Nature 382:363–366. CrossRefMedline
Mainen ZF, Joerges J, Huguenard JR, Sejnowski TJ (1995) A model of spikeinitiation in neocortical pyramidal neurons. Neuron 15:1427–1439.CrossRef Medline
Mathews PJ, Jercog PE, Rinzel J, Scott LL, Golding NL (2010) Control ofsubmillisecond synaptic timing in binaural coincidence detectors byK(v)1 channels. Nat Neurosci 13:601– 609. CrossRef Medline
McIntyre CC, Richardson AG, Grill WM (2002) Modeling the excitability ofmammalian nerve fibers: influence of afterpotentials on the recovery cy-cle. J Neurophysiol 87:995–1006. Medline
McIntyre CC, Grill WM, Sherman DL, Thakor NV (2004) Cellular effects ofdeep brain stimulation: model-based analysis of activation and inhibi-tion. J Neurophysiol 91:1457–1469. CrossRef Medline
Palmer LM, Stuart GJ (2006) Site of action potential initiation in layer 5pyramidal neurons. J Neurosci 26:1854 –1863. CrossRef Medline
Palmer LM, Clark BA, Grundemann J, Roth A, Stuart GJ, Hausser M (2010)Initiation of simple and complex spikes in cerebellar Purkinje cells.J Physiol 588:1709 –1717. CrossRef Medline
Pare D, Shink E, Gaudreau H, Destexhe A, Lang EJ (1998) Impact of spon-taneous synaptic activity on the resting properties of cat neocortical py-ramidal neurons In vivo. J Neurophysiol 79:1450 –1460. Medline
Pecka M, Brand A, Behrend O, Grothe B (2008) Interaural time differenceprocessing in the mammalian medial superior olive: the role of glycinergicinhibition. J Neurosci 28:6914 – 6925. CrossRef Medline
Popovic MA, Foust AJ, McCormick DA, Zecevic D (2011) The spatio-temporal characteristics of action potential initiation in layer 5 pyramidalneurons: a voltage imaging study. J Physiol 589:4167– 4187. CrossRefMedline
Rautenberg PL, Grothe B, Felmy F (2009) Quantification of the three-dimensional morphology of coincidence detector neurons in the medialsuperior olive of gerbils during late postnatal development. J Comp Neu-rol 517:385–396. CrossRef Medline
Roberts MT, Seeman SC, Golding NL (2013) A mechanistic understandingof the role of feedforward inhibition in the mammalian sound localizationcircuitry. Neuron 78:923–935. CrossRef Medline
Rothman JS, Manis PB (2003) The roles potassium currents play in regulat-ing the electrical activity of ventral cochlear nucleus neurons. J Neuro-physiol 89:3097–3113. CrossRef Medline
Schroeder MR (1977) New viewpoints in binaural interactions. In: Psycho-physics and physiology of hearing (Evans EF, Wilson JP, eds), pp 455–467. New York: Academic.
Scott LL, Mathews PJ, Golding NL (2005) Posthearing developmental re-finement of temporal processing in principal neurons of the medial supe-rior olive. J Neurosci 25:7887–7895. CrossRef Medline
Scott LL, Hage TA, Golding NL (2007) Weak action potential backpropaga-tion is associated with high-frequency axonal firing capability in principalneurons of the gerbil medial superior olive. J Physiol 583:647– 661.CrossRef Medline
Scott LL, Mathews PJ, Golding NL (2010) Perisomatic voltage-gated so-dium channels actively maintain linear synaptic integration in principalneurons of the medial superior olive. J Neurosci 30:2039 –2050. CrossRefMedline
Shamma SA, Shen NM, Gopalaswamy P (1989) Stereausis: binaural pro-cessing without neural delays. J Acoust Soc Am 86:989 –1006. CrossRefMedline
Shu Y, Duque A, Yu Y, Haider B, McCormick DA (2007) Properties ofaction-potential initiation in neocortical pyramidal cells: evidence fromwhole cell axon recordings. J Neurophysiol 97:746 –760. CrossRefMedline
Siveke I, Leibold C, Schiller E, Grothe B (2012) Adaptation of binaural pro-cessing in the adult brainstem induced by ambient noise. J Neurosci 32:462– 473. Medline
Skottun BC (1998) Sound location and neurons. Nature 393:531. CrossRefMedline
Spirou GA, Chirila FV, von Gersdorff H, Manis PB (2008) HeterogeneousCa2 influx along the adult calyx of held: a structural and computationalstudy. Neuroscience 154:171–185. CrossRef Medline
Steriade M (2001) Impact of network activities on neuronal properties incorticothalamic systems. J Neurophysiol 86:1–39. Medline
Stuart GJ, Sakmann B (1994) Active propagation of somatic action poten-
Lehnert et al. • Action Potentials in MSO Axons J. Neurosci., April 9, 2014 • 34(15):5370 –5384 • 5383

tials into neocortical pyramidal cell dendrites. Nature 367:69 –72.CrossRef Medline
Stuart G, Schiller J, Sakmann B (1997) Action potential initiation and prop-agation in rat neocortical pyramidal neurons. J Physiol 505:617– 632.CrossRef Medline
Svirskis G, Kotak V, Sanes DH, Rinzel J (2002) Enhancement of signal-to-noise ratio and phase locking for small inputs by a low-thresholdoutward current in auditory neurons. J Neurosci 22:11019 –11025.Medline
van der Heijden M, Lorteije JA, Plauska A, Roberts MT, Golding NL, Borst JG(2013) Directional hearing by linear summation of binaural inputs at themedial superior olive. Neuron 78:936 –948. CrossRef Medline
Vladimirov N, Tu Y, Traub RD (2013) Synaptic gating at axonal branches,and sharp-wave ripples with replay: a simulation study. Eur J Neurosci38:3435–3447. CrossRef Medline
Werthat F, Alexandrova O, Grothe B, Koch U (2008) Experience-dependent refinement of the inhibitory axons projecting to the medialsuperior olive. Dev Neurobiol 68:1454 –1462. CrossRef Medline
Yin TC, Chan JC (1990) Interaural time sensitivity in medial superior oliveof cat. J Neurophysiol 64:465– 488. Medline
Zhou Y, Carney LH, Colburn HS (2005) A model for interaural time differ-ence sensitivity in the medial superior olive: interaction of excitatory andinhibitory synaptic inputs, channel dynamics, and cellular morphology.J Neurosci 25:3046 –3058. CrossRef Medline
5384 • J. Neurosci., April 9, 2014 • 34(15):5370 –5384 Lehnert et al. • Action Potentials in MSO Axons

4Discussion
At a first glance, the two studies that have been presented here, have little incommon. They represent two completely different brain areas and circuits, withextremely different functions. Nevertheless, principal cells in the medial superiorolive (MSO) as well as pyramidal neurons in the hippocampus (HC) share someprofoundly similar properties. In the following I will highlight a selection of theseand discuss their impact on the presented studies. Unless stated otherwise, theresults are obtained from experiments with rodents, typically mice or rats, or in thecase of MSO studies gerbils.To begin with, I will give an overview of the most important discussion points ofeach study separately. Afterwards, I will discuss the impact of high-conductancestates in the information processing of single neurons and on the network level.This topic leads to an analysis of the influence of dendritic integration.
4.1 Summary of Study 1
Many studies suggest a tight link between memory formation and the HC. In ourstudy, we focus on SWR, large voltage deflections, visible in the LFP, which areaccompanied by fast, bursting oscillations. In the living animal, they mainly occurduring quiet wakefulness and sleep. SWR are thought to be important in memoryconsolidation. In this work (see Chapter 2), we focus on the memory capacity ofSWR.Therefor, we created two different models of a CA1 pyramidal neuron, anone compartmental leaky-integrate and fire model, and a biophysically inspired

72 4. Discussion
Hodgkin-Huxley type model. We used physiological, compound postsynaptc cur-rents (cPSCs) as inputs, recreated from in vitro slice recordings (Maier et al.,2011). These inputs allowed us to investigate memory capacity of single ripplecycles in a continuous time space. Former studies mainly treated a ripple cycleas one discrete event in time (Kammerer et al., 2013).To begin with, we studied the impact on spiking at a specific cycle with respectto the activity in the preceding ripple cycle. Unaltered reconstructed, excitatorycPSCs were modified such that at the beginning of the experiment the PSCs atselected cycle were deleted. Instead as average PSC was inserted, which ampli-tude was increased until an AP was elicited. We could not observe a strong effectof preceding activity on spike timing at the following cycle. The amplitudes of ourconductances appear not to be sufficiently high. We conclude that most of thecPSCs serve as a form of noisy background activity. Thus, this finding allowed usto treat each ripple cycle as an individual unit for pattern association.To study the memory capacity of a single ripple cycle, artificial cPSCs were cre-ated. We fixed the duration of one ripple event to 7 cycles and defined the 4thcycle to be our signal cycle, at which we expected the generation of APs. All othercycles were treated, as noise cycles, in accordance with our first finding. Settingof the synaptic weights depended on the activity during signal pattern. We variedthe number of ripple inputs, and measured the ability of the neuron to retrievethose. Large numbers of ripple patterns could only be restored in the case ofsparse coding in the inputs.As our biophysical model relied on parameters drawn from observations made inin vitro recordings, we applied the same learning paradigm in a leaky-integrateand fire neuron. This gave us control over the spiking threshold. In each trial wedetermined the threshold such that the output firing rate resembled the input rate.When only excitation was applied, the results match the findings in the biophysicalmodel. However, adding inhibition improves the memory capacity for larger num-bers of patterns, although to a small extent. Thus, threshold adaptation as wellas excitation, accompanied by inhibition, are necessary requirements,to improvememory retrieval.
4.2 Summary of Study 2 73
4.2 Summary of Study 2
The MSO is known for its importance in interaural time difference (ITD) process-ing. Despite the very low input resistance of MSO neurons, they can generateand sustain very high firing rates. How this works is still unclear and thus, we tryto give more insights into the topic of action potential (AP) initiation in the principalMSO neurons (Lehnert et al., 2014).The main core of this study (see Chapter 3) is a biophysically inspired multi-compartment model of a binaural coincidence detection neuron featuring a verydetailed axonal segment. The synaptic conductance inputs were created basedon experimental findings. The study could show that AP initiation is possible atdifferent locations along the axon and not only at the axonal initial segment (AIS).Thereby, the exact position of the initiation appears to be dependent on the spec-tral profile of the used input. Especially high frequency inputs seem to be able togenerate APs at distal parts of the axon. In contrast, low frequency inputs appearto be more restricted to initiate APs in the region of the AIS. The possibility of gen-erating APs at different locations might have a profound impact on the integrationof inputs.Two major effects have to be mentioned which are possibly ascribed to the flex-ible AP initiation site. First, high stimulus amplitudes are able to keep high firingrates, despite the large excitement. And second, it is more likely to generate APsusing small stimulus amplitudes.Both of these findings play a key role in keeping the high precision in the rate codeof ITDs.Adding inhibition, enhances the occurrence of APs to appear more distal.Another very unique feature in our study is the chosen sodium conductance den-sity used in the axonal segments. In contrast to other parameters, the actual val-ues do not come from direct electrophysiological recordings. As such experimentshaven’t been conducted, the value for the sodium conductance was inferred fromcurrent-clamp experiments. It was known which excitatory conductance traceshould elicit an AP. Thus, the sodium conductance density was adjusted suchthat a conductance trace evokes an AP.

74 4. Discussion
4.3 The impact of a high-conductance state
The typical or not so typical neuron
Due to their shape, pyramidal neurons are often used to depict a standard ’text-book neuron’ (see, e.g., Abbott and Dayan (2001) as a reference for classicalinformation transfer in a single neuron). In this classical view, a pyramidal neuronconsists of a highly branching dendrite and a single axon, typically drawn on theopposite of the dendrite. The described shape goes back to the first drawings ofcortical neurons from Cajal in 1911 (Cajal, 1911).In textbooks this setting is used to explain the input-output behavior in a single neu-ron. Signal processing in this traditional view takes the following steps. Synapsestarget the dendrite. Any input travels from the dendrites, through the soma to theaxon. In case of a strong enough input, an AP will be generated at the axon hillockor axon nodes, which travels along the axon to target via a synapse the next neu-ron and the transfer can start over again.And indeed, this type of pyramidal neuron has been described in the HC. But overthe years of studying the cortex, a whole variety of pyramidal neurons, with re-spect to their shape, was found. Not to mention the huge diversity of neuronsin general, which ranges from extensive branching axons in neocortical interneu-rons to Purkinje cells in the cerebellum with two highly branching dendrites, andall possible variations in between those two examples (Parekh and Ascoli, 2013).It is still unclear how much impact the actual shape of each individual neuron hason the overall integration of information in neuronal networks. Additionally, theeffects on the integration of inputs at single cell level are most uncertain, as well.Thome et al. (2014) started looking into this topic inside the hippocampal frame-work. They unraveled the finding that a huge portion of pyramidal neurons in theregion CA1 have axon-carrying dendrites (AcDs). As already explained, the clas-sical view would be that the axon emerges from an AIS attached to the soma.Here, the axon is linked to the soma via a small dendritic compartment. Thomeet al. (2014) described effects on the AP generation. AcD neurons tend to exhibitmore dendritic spikes. When a current input is injected into an AcD a lower thresh-old is needed to elicit an AP in comparison to an injection into a normal dendrite.
4.3 The impact of a high-conductance state 75
Thus, altering the form of a neuron comes along with profound changes in electri-cal properties. On the one hand, this can be simply explained from the geometricalproperties. Here, cable theory applies, which is basically the attempt to describethe current flow in a passive neuron through mathematical equations. Therefore,the neuron is theoretically subdivided in cylindrical units with certain values fortheir resistance and capacitance (Hodgkin and Huxley, 1952). On the other hand,the distribution of ion channels in the membrane has a high impact on the elec-trophysiological properties of a neuron.The properties of neurons are mainly gained through stainings of slices or record-ings in the latter, so called in vitro recordings. The big advantage of slice record-ings, in contrast to in vivo recordings, is the high control over external parameters,like temperature or ions in the surrounding fluid. In theory, this should allow fora good reproducibility, in case of performing experiments under the same condi-tions. Unfortunately, this aim is in reality more difficult, e.g., due to parameterswhich cannot be easily controlled, like atmospheric pressure or temperature in thelaboratory, among many others.But, in vitro recordings lack a very important feature, which was neglected for along time. Namely the existence of a fully functioning neuronal network, the cellof interest is embedded in. This is especially important when considering that thecerebral cortex is known for its very dense connectivity, with one cell receivinginputs from several thousand synapses. Thus, by cutting those connections onecan expect a huge effect on the overall activity of the neurons.One key difference between in vitro and in vivo recordings, I want to focus on, isthe input resistance. Interestingly, in vitro recordings go along with higher valuesfor the input resistance than in vivo recordings. Moreover, the input resistance inin vivo recordings highly depends on the behavior of the animal. A supplemen-tary point, which will be discussed later. Additionally, I also want to highlight theinfluence of higher conductances in precise temporal processing in MSO cells.
Impact of a high-conductance state
Conductance describes how well a current travels through a medium, and it isthe inverse of the resistance. Thus, it is equivalent to talk about low resistance

76 4. Discussion
instead of high conductance.In neurons the conductance plays a crucial role for their excitability, thereby affect-ing the spiking behavior of the cells, i.e., altering the neural code. Before I go intodetails about the effects of changes in the resistance, I want to briefly introducethe notion of neural code, which resembles a bit my description of a ”textbook”neuron from above.The process of information transfer through the brain can be called neural coding.The first clear definition of this term was given in a report from a work session in1968. Here, the participants subdivided neural coding into 4 parts (Bullock, THand Perkel, 1968). The coding starts with the generation of information (1). Thisinformation can then be transformed (2) and transmitted (3). As a last step the re-ceiver has to interpret it (4). The aim of this is a reliable transmission of informationthrough the neuronal system. Interestingly, the participants already concludedthat computational simulations of neurons have a big advantage in comparison toin vitro experiments. Simulations allow to control the effect of surrounding cellswith a high level of detail and thereby mimicking the real environment of a cell.Neurons with a low input resistance, equal to a high-conductance state, are char-acterized by a variety of properties (for a review see Destexhe et al. (2003)).As previously mentioned, high-conductances allow for an increased temporal pre-cision in firing. By analyzing the response time of a cell with respect to a currentstep inserted into the soma, the membrane time constant can be measured (Des-texhe and Paré, 1999). It was shown that a higher conductance comes with areduced membrane time constant. The smaller time constant is responsible fordifferent effects. Among others, the ability to effectively resolve inputs exhibitinghigh frequencies has to be mentioned (Rudolph and Destexhe, 2003). The pre-sented effect is assumed to be crucial for the high resolution needed in processingauditory cues.Another consequence, resulting from a low resistance, is an altered responsive-ness of the neuron. An increased conductance reinforces the responsiveness ofa neuron (Paré et al., 1998; Zerlaut and Destexhe, 2017). It has to be noted thatthis is not the case with a constant high conductance, but rather a fluctuation isneeded. Otherwise, the effect is reversed, i.e., the responsiveness is reduced. To

4.3 The impact of a high-conductance state 77
achieve this enhancement effect, a balanced synaptic bombardment with respectto excitation and inhibition is needed (Shu et al., 2003). A prominent example forthis extreme increase of synaptic activity are UP states during slow-wave sleep(Steriade et al., 2001). Especially, in contrast to their counterpart, the DOWNstates, where activity levels are low. Shu et al. (2003) used this framework tostudy the effects on a single cell exposed to this synaptic barrage. It appears thatUP states allow for an easier generation of AP with a small number of inputs. Ad-ditionally, the authors attribute the creation of context, e.g., attention, to the highsynaptic background activity. Fast changes between different states are possible.In contrast to changes in modulatory transmitters, tuning on and off of the synapticbarrage is rather quick. Thereby, making it the perfect choice to switch betweendifferent network states, depending on the situation.Moreover, high conductance-states have impact on the effectiveness of synapticinputs with respect to their entry location at the dendrite (Destexhe et al., 2003).Last, I want to mention the impact of high-conductance state on the temporal in-tegration of input signals. This specific condition seems to allow for switching be-tween different coding strategies, e.g., between a firing-rate based coding strategyand coincidence detection (Perkel and Holmes Bullock, 1968). Different codingstrategies have an impact on the spike synchrony and the degree to which thissynchrony can be kept from one neuron to the next (Ratté et al., 2013).Already the chosen selection of consequences, high-conductance states can havein neurons, makes clear how much impact they do have. The above section waskept more generic and not all of the described observations can be applied toneurons in general, and in particular to hippocampal pyramidal or principal MSOneurons. Thus, in the following, I try to examine the impact of this state on thetwo mentioned cell types. A conclusion that can be drawn from all of these ef-fects is the general phenomenon of cells being more ore less stochastic in theirresponses. This can be explained by the huge barrage of synaptic inputs the cellsreceive during the high-conductance states.
Hippocampus. As it is apparent from the paragraph above, high-conductanceinfluences the cell in several ways. Specifically in the HC, the following observa-
78 4. Discussion
tions have been made.In a study from 2001, Stacey and Durand (2001) performed slice recordings ofCA1 pyramidal neurons. They injected current pulses into the Schaffer collater-als. To generate synaptic noise, they placed an electrode nearby the CA3 regionand applied a long current pulse. Modulating the noise influenced the capabil-ity of detecting subthreshold activity in CA1 neurons. To be more precise, noiseimproves the ability of doing so. Moreover, they also suggest that this barrageof synaptic input could also be used to get over the effect of attenuation, seenin passive dendrites (Stacey and Durand, 2000). Thus, signal detection in gen-eral seems to largely benefit from enhanced noise. It seems that increasing thebackground activity, leads to an enhancement of random spiking, which in turndecreases the signal to noise ratio (Stacey and Durand, 2001)Hô and Destexhe (2000) focused their simulation study of neocortical pyramidalneurons on the different components of background activity. Next to a tonicallyactive conductance, voltage fluctuations are important to be observed. Especiallythese voltage fluctuations seem to account for a higher sensitivity of the cell to-wards subthreshold inputs.
MSO. In general, MSO neurons are, as previously mentioned, known for theirextremely high temporal precision, used for sound localization. The membranetime constant of these cells is small, with values around a few hundreds of milisec-onds (Scott et al., 2005). The high precision is needed for accurate coincidencedetection, which is the ability to solely generate a response in the case of syn-chronous inputs (Ratté et al., 2013). The crucial ion channels are namely thelow-threshold potassium channel Kv1 and sodium channels (Svirskis et al., 2004).The low-threshold potassium currents impact the absolute as well as the relativerefractory period of the MSO neuron, together with the cation currents (Negm andBruce, 2014). Using a computational model, Svirskis et al. (2004) could showthat increasing the potassium current results in a reduced coincidence detection.Increasing the sodium current exhibited the opposite effect. Thus, the authorsconcluded that in order to gain a precise time window for the coincidence detec-tion, sodium channels should be more activated and the low-threshold potassium

4.3 The impact of a high-conductance state 79
channels deactivated by the requested synaptic inputs.Here, the distribution of the specific ion channels along the cell are vital as well.Mathews et al. (2010) focused on the effect of Kv1 channels. They demonstratedthat in synaptic integration the time resolution can be increased by activation ofKv1 channels. Additionally, the gradient of this potassium channel allows for com-pensation of filter effects stemming from the passive cable properties.
Coincidence detection. The ability of a neuron to function as a coincidencedetector, and thereby transforming temporal code into a rate code, relies onseveral factors. One major factor seems to be the integration time with respect tothe interspike interval. If the integration time of a neuron is long in comparison tothe interspike interval of the input, the cell can sum up the inputs and thereby actsas a temporal integrator (König et al., 1996). In contrast, coincidence detectorshave a low integration time that allows the neuron to transmit signals with hightemporal precision and depend on the membrane time constant (Kempter et al.,1998).In the case of coincidence detection with subthreshold inputs, a reduced low-threshold potassium channel activity is suggested to play a key role (Svirskiset al., 2004). These potassium currents appear to be involved in the generationof membrane potential resonances (Beraneck et al., 2007) that help to intensifythe subthreshold signal and thereby overcome noise (Kempter et al., 1998).Neurons acting as coincidence detectors can be found in different brain areas.In the auditory brain stem, next to other nuclei, the MSO is known for its ability toprocess incoming inputs with a high temporal precision (Hermann et al., 2007).Fischer et al. (2018) argue that neurons can actively change their integrationproperties via these subthreshold membrane resonances and thereby servingdifferent frequency inputs. The authors assume that in particular the leakinessof a neuron affects the resonance, a property of a cell that can dynamicallychange. Thereby, Fischer et al. (2018) predict that their finding is not restrictedto a specific type of neuron.Thus, also hippocampal pyramidal cells could potentially function like this. DuringSWR occurrence the single cell has to overcome massive background noise

80 4. Discussion
and exhibits an increased membrane conductance (Prescott et al., 2006). Theincreased membrane conductance directly results in a decreased membranetime constant (Bernander and Koch, 1991). An effect that, similar to MSO cells,alters the integration properties of a pyramidal neuron and allows it to function ascoincidence detector.
The aim of this thesis was to identify possible mechanisms, that allow neurons toperform reliable computations in high-conductance state. Hippocampal pyramidalneurons and MSO neurons proved as a good study object choice, as they are wellstudied and ample functional knowledge is available.CA1 pyramidal neurons show a decrease of signal to noise ratio with enhancednoise. MSO neurons appear to change the AP generation site along the axon withincreased input frequency.

References
Abbott, L. and P. Dayan (2001). Theoretical Neuroscience. Computational andMathematical Modeling of Neural Systems. 22, 74
Abeles, M. (1982). Role of the cortical neuron: integrator or coincidence detector?Israel Journal of Medical Sciences 18(1), 83. 2
Adams, J. C. (1979). Ascending projections to the inferior colliculus. Journal ofComparative Neurology . 29
Amaral, D. G. (1978). AGolgi study of cell types in the hilar region of the hippocam-pus in the rat. The Journal of Comparative Neurology 182(4 Pt 2), 851–914.6
Amaral, D. G., H. E. Scharfman, and P. Lavenex (2007). The dentate gyrus: fun-damental neuroanatomical organization (dentate gyrus for dummies). Progressin Brain Research 163, 3–790. 6
Amaral, D. G. and M. P. Witter (1989). The three-dimensional organization ofthe hippocampal formation: A review of anatomical data. Neuroscience 31(3),571–591. 4, 7
Andersen, P., T. V. Bliss, and K. K. Skrede (1971). Lamellar organization ofhippocampal excitatory pathways. Experimental Brain Research 13(2), 222–238. 7
Angell, J. R. and W. Fite (1901). From the Psychological Laboratory of the Uni-

82 4. Discussion
versity of Chicago: The monaural localization of sound. Psychological Re-view 8(3), 225–246. 26
Aronov, D., R. Nevers, and D. W. Tank (2017). Mapping of a non-spatial dimen-sion by the hippocampal-entorhinal circuit. Nature 543(7647), 719–722. 9
Backus, A. R., J. M. Schoffelen, S. Szebényi, S. Hanslmayr, and C. F. Doeller(2016). Hippocampal-prefrontal theta oscillations support memory integration.Current Biology 26(4), 450–457. 14
Benson, J. B. (2020). Encyclopedia of infant and early childhood development.Elsevier. 6
Beraneck, M., S. Pfanzelt, I. Vassias, M. Rohregger, N. Vibert, P.-P. Vidal, L. E.Moore, and H. Straka (2007). Differential intrinsic response dynamics deter-mine synaptic signal processing in frog vestibular neurons. Journal of Neuro-science 27 (16), 4283–4296. 79
Bernander, O. and C. Koch (1991). Synaptic Background Activity Influences Spa-tiotemporal Integration in Single Pyramidal Cells. The Biological Bulletin. 80
Blackstad, T. W. (1956). Commissural connections of the hippocampal region inthe rat, with special reference to their mode of termination. Journal of Compar-ative Neurology 105(3), 417–537. 6
Blauert, J. (1970). Sound localization in the median plane(Frequency function ofsound localization in median plane measured psychoacoustically at both earswith narrow band signals). Acustica. 26
Bliss, T. V. and a. R. Gardner-Medwin (1973). Long-lasting potentiation of synaptictransmission in the dentate area of the unanaestetized rabbit following stimula-tion of the perforant path. The Journal of Physiology 232(2), 357–374. 21
Bramham, C. R. and B. Srebro (1987). Induction of long-term depression andpotentiation by low- and high-frequency stimulation in the dentate area of theanesthetized rat: magnitude, time course and EEG. Brain Research 405(1),100–107. 22
4.3 The impact of a high-conductance state 83
Brand, A., O. Behrend, T. Marquardt, D. McAlpine, and B. Grothe (2002). Preciseinhibition is essential for microsecond interaural time difference coding. Na-ture 417 (6888), 543–547. 30, 31
Brodal, A. (1947). The hypocampus and the sense of smell; a review. Brain: AJournal of Neurology , 179–222. 3
Brun, V. H., T. Solstad, K. B. Kjelstrup, M. Fyhn, M. P. Witter, E. I. Moser, andM. B. Moser (2008). Progressive increase in grid scale from dorsal to ventralmedial entorhinal cortex. Hippocampus 18(12), 1200–1212. 11
Bullock, TH and Perkel, D. (1968). Neutral coding- A report based on an NRPworksession(Neural coding by impulses and trains on single and multiple channels,and representation of information in nonimpulse carriers). 76
Bunsey, M. and H. Eichenbaum (1996). Conservation of hippocampal memoryfunction in rats and humans. Nature 379(6562), 255–257. 4
Burgess, N., E. A. Maguire, and J. O’Keefe (2002). The human hippocampus andspatial and episodic memory. Neuron 35(4), 625–641. 8
Burgess, N. and J. O’Keefe (1996). Neuronal computations underlying the firingof place cells and their role in navigation. Hippocampus 6(6), 749–762. 11
Butler, R. A. (1986). The bandwidth effect on monaural and binaural localization.Hearing Research. 26
Buzsáki, G. (1989). Two-stagemodel of memory trace formation: a role for “noisy”brain states. Neuroscience 31(3), 551–570. 19
Buzsáki, G. (2015). Hippocampal sharp wave-ripple: A cognitive biomarker forepisodic memory and planning. Hippocampus 25(10), 1073–1188. 13
Buzsáki, G., Z. Horváth, R. Urioste, J. Hetke, and K. Wise (1992). High-frequencynetwork oscillation in the hippocampus. Science 256(5059), 1025–1027. 14,33
84 4. Discussion
Buzsáki, G., L. Lai-Wo S., and C. H. Vanderwolf (1983). Cellular bases of hip-pocampal EEG in the behaving rat. Brain Research Reviews 6(2), 139–171. 1,13, 14
Cajal, S. R. (1911). Histologie du système nerveux de l’homme et des vertébrés.Volume 2. Paris: Maloine, 891–942. 5, 74
Cant, N. B. and J. H. Casseday (1986). Projections from the anteroventralcochlear nucleus to the lateral and medial superior olivary nuclei. Journal ofComparative Neurology . 28, 29
Chirila, F. V., K. C. Rowland, J. M. Thompson, and G. A. Spirou (2007). Develop-ment of gerbil medial superior olive: Integration of temporally delayed excitationand inhibition at physiological temperature. Journal of Physiology . 29, 30
Cohen, N. and L. Squire (1980). Preserved learning and retention of patternanalysing skill in amnesia: dossiciation of knowing how and knowing that. Sci-ence 210(4466), 207–210. 18
Colgin, L. L., T. Denninger, M. Fyhn, T. Hafting, T. Bonnevie, O. Jensen, M. B.Moser, and E. I. Moser (2009). Frequency of gamma oscillations routes flow ofinformation in the hippocampus. Nature 462(7271), 353–357. 14
Collingridge, G. L., S. J. Kehl, and H. McLennan (1983). Excitatory amino acidsin synaptic transmission in the Schaffer collateral commissural pathway of therat hippocampus. The Journal of Physiology 334(1), 33–46. 21
Cornwell, B. R., L. L. Johnson, T. Holroyd, F. W. Carver, and C. Grillon (2008).Human Hippocampal and Parahippocampal Theta during Goal-Directed SpatialNavigation Predicts Performance on a Virtual Morris Water Maze. Journal ofNeuroscience 28(23), 5983–5990. 21
Csicsvari, J., H. Hirase, A. Czurko, and G. Buzsáki (1998). Reliability and statedependence of pyramidal cell-interneuron synapses in the hippocampus: Anensemble approach in the behaving rat. Neuron 21(1), 179–189. 14

4.3 The impact of a high-conductance state 85
Csicsvari, J., H. Hirase, A. Mamiya, and G. Buzsáki (2000). Ensemble pat-terns of hippocampal ca3-ca1 neurons during sharp wave–associated popu-lation events. Neuron 28(2), 585–594. 16
Csicsvari, J., B. Jamieson, K. D. Wise, and G. Buzsáki (2003). Mechanisms ofgamma oscillations in the hippocampus of the behaving rat. Neuron 37 (2),311–322. 14
Danjo, T., T. Toyoizumi, and S. Fujisawa (2018). Spatial representations of selfand other in the hippocampus. Science. 10
Davis, H. P. and L. R. Squire (1984). Protein synthesis and memory: A review.Psychological Bulletin 96(3), 518–559. 19
Destexhe, A. and D. Paré (1999). Impact of network activity on the integrativeproperties of neocortical pyramidal neurons in vivo. Journal of Neurophysiology .76
Destexhe, A., M. Rudolph, and D. Paré (2003). The high-conductance state ofneocortical neurons in vivo. Nature Reviews Neuroscience. 1, 76, 77
Donoso, J. R., D. Schmitz, N. Maier, and R. Kempter (2018). Hippocampal rip-ple oscillations and inhibition-first network models: frequency dynamics andresponse to gaba modulators. Journal of Neuroscience 38(12), 3124–3146. 16
Douglas, R. J. (1967). The hippocampus and behavior. Psychological Bul-letin 67 (6), 416–442. 3
Draguhn, A. and G. Buzsaki (2004). Neuronal oscillations in cortical networks.Science 304(5679), 1926–9. 12
Draguhn, A., R. D. Traub, D. Schmitz, and J. G. R. Jefferys (1998). Electricalcoupling underlies high-frequency oscillations in the hippocampus in vitro. Na-ture 394(6689), 189–192. 16, 17
Dudek, S. M., G. M. Alexander, and S. Farris (2016). Rediscovering area CA2:Unique properties and functions. Nature Reviews Neuroscience 17 (2), 89–102.6
86 4. Discussion
Eichenbaum, H. and N. J. Cohen (2014). CanWeReconcile the Declarative Mem-ory and Spatial Navigation Views on Hippocampal Function? Neuron 83(4),764–770. 3
Eichenbaum, H., T. Otto, and N. J. Cohen (1992). The hippocampus: What doesit do? Behavioral & Neural Biology 57 (1), 2–36. 3
English, D. F., A. Peyrache, E. Stark, L. Roux, D. Vallentin, M. A. Long, andG. Buzsáki (2014). Excitation and Inhibition Compete to Control Spiking duringHippocampal Ripples: Intracellular Study in Behaving Mice. The Journal ofNeuroscience 34(49), 16509–16517. 1
Ennaceur, A. and J. Delacour (1988). A new one-trial test for neurobiological stud-ies of memory in rats. 1: Behavioral data. Behavioural Brain Research 31(1),47–59. 20
Epsztein, J., A. K. Lee, E. Chorev, and M. Brecht (2010). Impact of Spikeletson Hippocampal CA1 Pyramidal Cell Activity During Spatial Exploration. Sci-ence 327 (5964), 474–477. 17
Falkai, P. and B. Bogerts (1986). Cell loss in the hippocampus of schizophrenics.European Archives of Psychiatry and Neurological Sciences 236(3), 154–161.6
Fischer, L., C. Leibold, and F. Felmy (2018). Resonance properties in auditorybrainstem neurons. Frontiers in Cellular Neuroscience 12, 8. 79
Foster, D. andM.Wilson (2006). Reverse replay in hippocampal place cells duringthe awake state. Nature 440(30 March), 680–683. 17
Freund, T. and G. Buzsáki (1998). Interneurons of the hippocampus. Hippocam-pus 6(4), 347–470. 6
Friauf, E. and J. Ostwald (1988). Divergent projections of physiologically charac-terized rat ventral cochlear nucleus neurons as shown by intra-axonal injectionof horseradish peroxidase. Experimental Brain Research. 28

4.3 The impact of a high-conductance state 87
Fuhrmann, F., D. Justus, L. Sosulina, H. Kaneko, T. Beutel, D. Friedrichs,S. Schoch, M. K. Schwarz, M. Fuhrmann, and S. Remy (2015). Locomotion,Theta Oscillations, and the Speed-Correlated Firing of Hippocampal NeuronsAre Controlled by a Medial Septal Glutamatergic Circuit. Neuron 86(5), 1253–1264. 13
Fyhn, M., S. Molden, M. P. Witter, E. I. Moser, and M.-B. Moser (2004). Spatialrepresentation in the entorhinal cortex. Science 305(5688), 1258–64. 11
Galambos, R. and H. Davis (1943). The response of single auditory-nerve fibresto acoustic stimulation. Journal of Neurophysiology . 29
Gan, J., S. ming Weng, A. J. Pernía-Andrade, J. Csicsvari, and P. Jonas (2017).Phase-locked inhibition, but not excitation, underlies hippocampal ripple oscil-lations in awake mice In vivo. Neuron 93(2), 308–314. 18
Gaskin, S., A. Tremblay, and D. G. Mumby (2003). Retrograde and anterogradeobject recognition in rats with hippocampal lesions. Hippocampus 13(8), 962–969. 20
Gerstner, W. and W. M. Kistler (2002). Mathematical formulations of Hebbianlearning. Biological Cybernetics 87 (5-6), 404–415. 24
Giovanello, K. S., D. Schnyer, and M. Verfaellie (2009). Distinct hippocampalregions make unique contributions to relational memory. Hippocampus 19(2),111–117. 3
Girardeau, G., K. Benchenane, S. I. Wiener, G. Buzsáki, and M. B. Zugaro (2009).Selective suppression of hippocampal ripples impairs spatial memory. NatureNeuroscience 12(10), 1222–1223. 15, 17, 33
Girardeau, G., A. Cei, andM. Zugaro (2014). Learning-induced plasticity regulateshippocampal sharp wave-ripple drive. Journal of Neuroscience 34(15), 5176–5183. 15
Goelet, P., V. F. Castellucci, S. Schacher, and E. R. Kandel (1986). The long andthe short of long-term memory - A molecular framework. Nature 322(6078),419–422. 19

88 4. Discussion
Goldberg, J. M. and P. B. Brown (1969). Response of binaural neurons of dog su-perior olivary complex to dichotic tonal stimuli: some physiological mechanismsof sound localization. Journal of Neurophysiology 32(4), 613–636. 34
Golomb, D., N. Rubin, and H. Sompolinsky (1990). Willshaw model: Associativememory with sparse coding and low firing rates. Physical ReviewA 41(4), 1843–1854. 25
Grothe, B., C. Köppl, J. H. Casseday, and C. E. Carr (2004). The evolution ofcentral pathways and theyr neural processing patterns. In Evolution of the Ver-tebrate Auditory System, pp. 289–359. 32
Grothe, B. and M. Pecka (2014). The natural history of sound localization in mam-mals - a story of neuronal inhibition. Frontiers in Neural Circuits. 27
Grothe, B., M. Pecka, and D. McAlpine (2010). Mechanisms of Sound Localizationin Mammals. Physiological Reviews. 28
Grothe, B. and D. H. Sanes (1993). Bilateral inhibition by glycinergic afferents inthe medial superior olive. Journal of Neurophysiology . 31
Guinan, J. J., B. E. Norris, and S. S. Guinan (1972). Single auditory units in thesuperior olivary complex: II: Locations of unit categories and tonotopic organi-zation. International Journal of Neuroscience. 30
Hafting, T., M. Fyhn, S. Molden, M. B. Moser, and E. I. Moser (2005). Microstruc-ture of a spatial map in the entorhinal cortex. Nature 436(7052), 801–806. 4,11
Harrison, J. M. and W. B. Warr (1962). A study of the cochlear nuclei and as-cending auditory pathways of the medulla. Journal of Comparative Neurology .28
Harvey, C. D., F. Collman, D. A. Dombeck, andD.W. Tank (2009). Intracellular dy-namics of hippocampal place cells during virtual navigation. Nature 461(7266),941–946. 9
4.3 The impact of a high-conductance state 89
Haukvik, U. K., L. T. Westlye, L. Mørch-Johnsen, K. N. Jørgensen, E. H. Lange,A. M. Dale, I. Melle, O. A. Andreassen, and I. Agartz (2015). In vivo hippocam-pal subfield volumes in schizophrenia and bipolar disorder. Biological Psychia-try 77 (6), 581–588. 7
Hebb, D. O. . E. A. and T. J. Bussey (1949). The Organization of Behavior. Tech-nical report. 21, 24
Heffner, R. S. and H. E. Heffner (1988). Sound Localization and Use of BinauralCues by the Gerbil (Meriones unguiculatus). Behavioral Neuroscience 102(3),422–428. 28
Held, H. (1893). Die zentrale Gehörleitung. Arch. Anat. Physiol. Anat. Abt. 17,201–248. 28
Hermann, J., M. Pecka, H. von Gersdorff, B. Grothe, and A. Klug (2007). SynapticTransmission at the Calyx of Held Under In Vivo–Like Activity Levels. Journalof Neurophysiology 98(2), 807–820. 29, 31, 79
Hitti, F. L. and S. A. Siegelbaum (2014). The hippocampal CA2 region is essentialfor social memory. Nature 508(1), 88–92. 8
Hô, N. and A. Destexhe (2000). Synaptic Background Activity Enhances the Re-sponsiveness of Neocortical Pyramidal Neurons. Journal of Neurophysiology .1, 78
Hodgkin, A. L. and A. F. Huxley (1952). A quantitative description of membranecurrent and its application to conduction and excitation in nerve. The Journal ofPhysiology 117 (4), 500—-544. 23, 75
Hulse, B. K., L. C. Moreaux, E. V. Lubenov, and A. G. Siapas (2016). MembranePotential Dynamics of CA1 Pyramidal Neurons during Hippocampal Ripples inAwake Mice. Neuron 89(4), 800–813. 18
Jadhav, S. P., C. Kemere, P. W. German, and L. M. Frank (2012). Awake Hip-pocampal Sharp-Wave Ripples Support Spatial Memory. Science 336(6087),1454–1458. 15, 33

90 4. Discussion
Jeffress, L. A. (1948). A place theory of sound localization. Journal of Comparativeand Physiological Psychology 41(1), 35–39. 31
Jones, M. W. and T. J. Mchugh (2011). Updating hippocampal representations:CA2 joins the circuit. Trends in Neurosciences 34(10), 526–535. 8
Jouvet, M. (1969). Biogenic amines and the state of sleep. Science 163, 32–41.13
Kammerer, A., Á. Tejero-Cantero, and C. Leibold (2013). Inhibition enhancesmemory capacity: optimal feedback, transient replay and oscillations. Journalof Computational Neuroscience 34(1), 125–136. 72
Kapfer, C., A. H. Seidl, H. Schweizer, and B. Grothe (2002). Experience-dependent refinement of inhibitory inputs to auditory coincidence-detector neu-rons. Nature Neuroscience 5(3), 247–253. 30, 31
Kempter, R., W. Gerstner, and J. L. Van Hemmen (1998). How the threshold of aneuron determines its capacity for coincidence detection. Biosystems 48(1-3),105–112. 79
Khodagholy, D., J. N. Gelinas, and G. Buzsáki (2017). Learning-enhanced cou-pling between ripple oscillations in association cortices and hippocampus. Sci-ence 358(6361), 369–372. 20
Klausberger, T. and P. Somogyi (2008). Neuronal Diversity and Temporal Dynam-ics: The Unity of Hippocampal Circuit Operations. Science 321(5885), 53–57.6
Klumpp, R. G. and H. R. Eady (1956). Some Measurements of Interaural TimeDifference Thresholds. The Journal of the Acoustical Society of America. 1, 2,27
König, P., A. K. Engel, and W. Singer (1996). Integrator or coincidence detector?the role of the cortical neuron revisited. Trends in Neurosciences 19(4), 130–137. 79

4.3 The impact of a high-conductance state 91
Kropff, E., J. E. Carmichael, M. B. Moser, and E. I. Moser (2015). Speed cells inthe medial entorhinal cortex. Nature 523(7561), 419–424. 12
Kubota, D. (2002). Endogenous Waves in Hippocampal Slices. Journal of Neu-rophysiology 89(1), 81–89. 15
Kuwabara, N. and J. M. Zook (1992). Projections to the medial superior olive fromthe medial and lateral nuclei of the trapezoid body in rodents and bats. Journalof Comparative Neurology . 29
Lee, A. K. and M. A. Wilson (2002). Memory of sequential experience in thehippocampus during slow wave sleep. Neuron 36(6), 1183–1194. 9, 16
Lehnert, S., M. C. Ford, O. Alexandrova, F. Hellmundt, F. Felmy, B. Grothe, andC. Leibold (2014). Action potential generation in an anatomically constrainedmodel of medial superior olive axons. Journal of Neuroscience 34(15), 5370–5384. 55, 73, 105
Leibold, C. and R. Kempter (2006). Memory capacity for sequences in a recurrentnetwork with biological constraints. Neural computation 18(April), 904–941. 19
Leutgeb, S., J. K. Leutgeb, C. A. Barnes, E. I. Moser, B. L. McNaughton, andM.-B. Moser (2005). Independent codes for spatial and episodic memory inhippocampal neuronal ensembles. Science (New York, N.Y.) 309(5734), 619–23. 9
Lever, C., S. Burton, A. Jeewajee, J. O’Keefe, and N. Burgess (2009). Boundaryvector cells in the subiculum of the hippocampal Formation. Journal of Neuro-science 29(31), 9771–9777. 11
Lisman, J. E. (1999). Relating hippocampal circuitry viewpoint to function: recall ofmemory sequences by reciprocal dentate–CA3 interactions. Neuron 22, 233–242. 7
Maier, N., Á. Tejero-Cantero, A. L. Dorrn, J. Winterer, P. S. Beed, G. Morris,R. Kempter, J. F. A. Poulet, C. Leibold, and D. Schmitz (2011). Coherent PhasicExcitation during Hippocampal Ripples. Neuron 72(1), 137–152. 15, 17, 18,33, 72

92 4. Discussion
Maki, K. and S. Furukawa (2005). Acoustical cues for sound localization by theMongolian gerbil, Meriones unguiculatus. The Journal of the Acoustical Societyof America. 27
Mathews, P. J., P. E. Jercog, J. Rinzel, L. L. Scott, and N. L. Golding (2010).Control of submillisecond synaptic timing in binaural coincidence detectors byKv1 channels. Nature Neuroscience 13(5), 601–609. 79
McNaughton, B. L. and R. G. M. Morris (1987). Hippocampal synaptic enhance-ment and information storage within a distributed memory system. Trends inNeurosciences 10(10), 408–415. 7
Memmesheimer, R.-M. (2010). Quantitative prediction of intermittent high-frequency oscillations in neural networks with supralinear dendritic interactions.Proceedings of the National Academy of Sciences of the United States of Amer-ica 107 (24), 11092–11097. 16
Middlebrooks, J. C. and D. M. Green (1991). Sound localization by human listen-ers. Annual Review of Psychology . 27
Miles, R. M., C. Le Duigou, J. Simonnet, M. Telenczuk, and D. Fricker (2014).Recurrent synapses and circuits in the ca3 region of the hippocampus: an as-sociative network. Frontiers in Cellular Neuroscience 7, 262. 7
Milner, B. (1972). Disorders of learning and memory after temporal lobe lesionsin man. Clinical Neurosurgery 19, 421–446. 3
Milner, B., S. Corkin, and H. L. Teuber (1968). Further analysis of the hippocampalamnesic syndrome: 14-year follow-up study of H.M. Neuropsychologia 6(3),215–234. 3
Morris, G. M. (1981). Spatial localization does not require local cues the presenceof local cues. Learning and Motivation 12, 239–260. 20
Morris, R. (1984). Developments of a water-maze procedure for studying spatiallearning in the rat. Journal of Neuroscience Methods 11(1), 47–60. 20

4.3 The impact of a high-conductance state 93
Nasrallah, K., R. a. Piskorowski, and V. Chevaleyre (2015). Inhibitory plasticitypermits the recruitment of CA2 pyramidal neurons by CA3. eNeuro 2(August),1–12. 8
Nasrallah, K., R. A. Piskorowski, and V. Chevaleyre (2017). Bi-directional inter-play between proximal and distal inputs to CA2 pyramidal neurons. Neurobiol-ogy of Learning and Memory 138, 173–181. 8
Negm, M. H. and I. C. Bruce (2014). The effects of HCN and KLT ion channelson adaptation and refractoriness in a stochastic auditory nerve model. IEEETransactions on Biomedical Engineering. 78
O’ Keefe, J. and N. Burgess (1996). Geometric determinants of the place fieldsof hippocampal neurons. Nature 381(6581), 425–428. 11
O’Keefe, J. and J. Dostrovsky (1971). The hippocampus as a spatial map. Prelim-inary evidence from unit activity in the freely-moving rat. Brain Research 34(1),171–175. 4, 8
O’Keefe, J. and L. Nadel (1978). Hippocampus physiology. The Hippocampus asa Cognitive Map (1), 141–230. 4, 9
Oldfield, S. R. and S. P. Parker (1986). Acuity of sound localisation: a topographyof auditory space. III. Monaural hearing conditions. Perception. 26
Olton, D. S. and R. J. Samuelson (1976). Remembrance of places passed: Spa-tial memory in rats. Journal of Experimental Psychology: Animal Behavior Pro-cesses 2(2), 97–116. 21
Omer, D. B., S. R. Maimon, L. Las, and N. Ulanovsky (2018). Social place-cellsin the bat hippocampus. Science (New York, N.Y.) 359(6372), 218–224. 9, 10
Pangalos, M., J. R. Donoso, J. Winterer, A. R. Zivkovic, R. Kempter, N. Maier,and D. Schmitz (2013). Recruitment of oriens-lacunosum-moleculare interneu-rons during hippocampal ripples. Proceedings of the National Academy of Sci-ences 110(11), 4398–4403. 17

94 4. Discussion
Paré, D., E. Shink, H. Gaudreau, A. Destexhe, and E. J. Lang (1998). Impact ofspontaneous synaptic activity on the resting properties of cat neocortical pyra-midal neurons in vivo. Journal of Neurophysiology . 1, 76
Parekh, R. and G. A. Ascoli (2013). Neuronal morphology goes digital: a researchhub for cellular and system neuroscience. Neuron 77 (6), 1017–1038. 74
Park, T. J. and G. D. Pollak (1994). Azimuthal receptive fields are shaped byGABAergic inhibition in the inferior colliculus of the mustache bat. Journal ofNeurophysiology . 29
Pastalkova, E., V. Itskov, A. Amarasingham, and G. Buzsáki (2008). In-ternally generated cell assembly sequences in the rat hippocampus. Sci-ence 321(5894), 1322–1327. 19
Perez-Velazquez, J. L., T. A. Valiante, and P. L. Carlen (1994). Modulation ofgap junctional mechanisms during calcium-free induced field burst activity: apossible role for electrotonic coupling in epileptogenesis. The Journal of neuro-science : The official Journal of the Society for Neuroscience 14(7), 4308–17.17
Perkel, D. H. and T. Holmes Bullock (1968). Neural Coding: A report based on anNRP work session. N Neurosciences Research Program Neurosciences Res.Prog. Bull . 77
Peyrache, A., F. P. Battaglia, and A. Destexhe (2011). Inhibition recruitment inprefrontal cortex during sleep spindles and gating of hippocampal inputs. Pro-ceedings of the National Academy of Sciences 108(41), 17207–17212. 20
Pfeiffer, B. E. and D. J. Foster (2013). Hippocampal place-cell sequences depictfuture paths to remembered goals. Nature 497 (7447), 74–79. 17
Prescott, S. A., S. Ratté, Y. De Koninck, and T. J. Sejnowski (2006). Nonlin-ear interaction between shunting and adaptation controls a switch between in-tegration and coincidence detection in pyramidal neurons. Journal of Neuro-science 26(36), 9084–9097. 80

4.3 The impact of a high-conductance state 95
Preston, A. R., Y. Shrager, N. M. Dudukovic, and J. D. E. Gabrieli (2004). Hip-pocampal contribution to the novel use of relational information in declarativememory. Hippocampus 14(2), 148–152. 4
Ramón y Cajal, S. (1909). Histologie du Systeme Nerveux de l’Homme et desVertebres. 29
Ratté, S., S. Hong, E. DeSchutter, and S. A. Prescott (2013). Impact of neuronalproperties on network coding: Roles of spike initiation dynamics and robustsynchrony transfer. 1, 34, 77, 78
Redish, A. D. and D. S. Touretzky (1997). Cognitive maps beyond the hippocam-pus. [Review] [182 refs]. Hippocampus. 7 (August 1996), 15–35. 3
Rose, J. E., J. F. Brugge, D. J. Anderson, and J. E. Hind (1967). Phase-lockedresponse to low-frequency tones in single auditory nerve fibers of the squirrelmonkey. Journal of Neurophysiology . 29
Rudolph, M. and A. Destexhe (2003). Gain modulation and frequency lockingunder conductance noise. Neurocomputing. 76
Ryan, A. (1976). Hearing sensitivity of the mongolian gerbil, Meriones unguicu-latis. The Journal of the Acoustical Society of America 59(5), 1222. 27
Ryugo, D. K. and S. Sento (1991). Synaptic connections of the auditory nerve incats: Relationship between endbulbs of held and spherical bushy cells. Journalof Comparative Neurology . 28
Sanders, H., C. Rennó-Costa, M. Idiart, and J. Lisman (2015). Grid cells and placecells: an integrated view of their navigational and memory function. Trends inneurosciences 38(12), 763–775. 10
Sargolini, F., M. Fyhn, T. Hafting, B. L. McNaughton, M. P. Witter, M. B. Moser,and E. I. Moser (2006). Conjunctive representation of position, direction, andvelocity in entorhinal cortex. Science 312(5774), 758–762. 11
Schmitz, D., S. Schuchmann, A. Fisahn, A. Draguhn, E. H. Buhl, E. Petrasch-Parwez, R. Dermietzel, U. Heinemann, and R. D. Traub (2001). Axo-axonal

96 4. Discussion
coupling: A novel mechanism for ultrafast neuronal communication. Neu-ron 31(5), 831–840. 17
Schneggenburger, R. and I. D. Forsythe (2006). The calyx of held. Cell and tissueresearch 326(2), 311–337. 28
Scott, L. L., P. J. Mathews, and N. L. Golding (2005). Posthearing developmentalrefinement of temporal processing in principal neurons of the medial superiorolive. Journal of Neuroscience 25(35), 7887–7895. 2, 78
Scoville, W. B. and B. Milner (1957). Loss of recent memory after bilateral hip-pocampal lesions. Journal of neurology, neurosurgery, and psychiatry 20(1),11. 3
Shim, G. M., D. Kim, and M. Y. Choi (1991). Statistical-mechanical formulation ofthe Willshaw model with local inhibition. Physical Review A 43(12), 7012–7018.25
Shu, Y., A. Hasenstaub, M. Badoual, T. Bal, and D. A. McCormick (2003). Bar-rages of synaptic activity control the gain and sensitivity of cortical neurons. TheJournal of Neuroscience : The official Journal of the Society for Neuroscience.77
Sirota, A., S. Montgomery, S. Fujisawa, Y. Isomura, M. Zugaro, and G. Buzsáki(2008). Entrainment of neocortical neurons and gamma oscillations by the hip-pocampal theta rhythm. Neuron 60(4), 683–697. 14
Skaggs, W. E., B. L. McNaughton, M. A. Wilson, and C. A. Barnes (1996). Thetaphase precession in hippocampal neuronal populations and the compressionof temporal sequences. Hippocampus 6(2), 149–172. 14
Skottun, B. C. (1998). Sound localization and neurons. Nature 393(6685), 531–531. 32
Solstad, T., T. Solstad, C. N. Boccara, C. N. Boccara, E. Kropff, E. Kropff, M.-B. Moser, M.-B. Moser, E. I. Moser, and E. I. Moser (2008). Representationof geometric borders in the entorhinal cortex. Science 322(December), 1865–1868. 11

4.3 The impact of a high-conductance state 97
Spruston, N. (2008). Pyramidal neurons: dendritic structure and synaptic integra-tion. Nature Reviews Neuroscience 9(3), 206–221. 6
Squire, L. R. (1992). ”Memory and the hippocampus: A synthesis from findingswith rats, monkeys, and humans”: Correction. Psychological Review 99(3),582. 18
Squire, L. R. and S. M. Zola (1996). Structure and function of declarative andnondeclarative memory systems. Proceedings of the National Academy of Sci-ences 93(24), 13515–13522. 18
Squire, L. R. and S.M. Zola-Morgan (1988). Memory: brain systems and behavior.Trends in neurosciences 11, 170–175. 18
Stacey, W. C. and D. M. Durand (2000). Stochastic resonance improves sig-nal detection in hippocampal ca1 neurons. Journal of Neurophysiology 83(3),1394–1402. 78
Stacey, W. C. and D. M. Durand (2001). Synaptic Noise Improves Detection ofSubthreshold Signals in Hippocampal CA1 Neurons. Journal of Neurophysiol-ogy . 78
Stark, E., L. Roux, R. Eichler, Y. Senzai, S. Royer, and G. Buzsáki (2014). Pyrami-dal cell-interneuron interactions underlie hippocampal ripple oscillations. Neu-ron 83(2), 467–480. 16
Steriade, M., I. Timofeev, and F. Grenier (2001). Natural waking and sleep states:a view from inside neocortical neurons. Journal of neurophysiology 85(5),1969–1985. 77
Steward, O. and S. A. Scoville (1976). Cells of origin of entorhinal cortical affer-ents to the hippocampus and fascia dentata of the rat. Journal of ComparativeNeurology 169(3), 347–370. 5
Stotler, W. A. (1953). An experimental study of the cells and connections of thesuperior olivary complex of the cat. Journal of Comparative Neurology . 30

98 4. Discussion
Strutt (Lord Rayleigh), J. W. (1907). On our perception of sound direction. Philo-sophical Magazine Series 6. 28
Sullivan, D., J. Csicsvari, K. Mizuseki, S. Montgomery, K. Diba, and G. Buzsáki(2011). Relationships between hippocampal sharp waves, ripples, and fastgamma oscillation: influence of dentate and entorhinal cortical activity. Journalof Neuroscience 31(23), 8605–8616. 15
Svirskis, G., V. Kotak, D. H. Sanes, and J. Rinzel (2004). Sodium along with low-threshold potassium currents enhance coincidence detection of subthresholdnoisy signals in mso neurons. Journal of neurophysiology 91(6), 2465–2473.34, 78, 79
Taube, J. S., R. U. Muller, and J. B. Ranck (1990a). Head-direction cells recordedfrom the postsubiculum in freelymoving rats. i. description and quantitative anal-ysis. Journal of Neuroscience 10(2), 420–435. 11
Taube, J. S., R. U. Muller, and J. B. Ranck, JB (1990b). Head-direction cellsrecorded from the postsubiculum in freely moving rats. II. Effects of environ-mental manipulations. J. Neurosci. 10(2), 436–447. 11
Taxidis, J., S. Coombes, R. Mason, and M. R. Owen (2012). Modeling sharpwave-ripple complexes through a CA3-CA1 network model with chemicalsynapses. Hippocampus 22(5), 995–1017. 16
Thome, C., T. Kelly, A. Yanez, C. Schultz, M. Engelhardt, S. B. Cambridge,M. Both, A. Draguhn, H. Beck, and A. V. Egorov (2014). Axon-carrying den-drites convey privileged synaptic input in hippocampal neurons. Neuron 83(6),1418–1430. 74
Thompson, S. P. (1882). On the function of the two ears in the perception ofspace. The London, Edinburgh, andDublin Philosophical Magazine and Journalof Science 13, 406—-416. 27
Tollin, D. J. (2005). Interaural Phase and Level Difference Sensitivity inLow-Frequency Neurons in the Lateral Superior Olive. Journal of Neuro-science 25(46), 10648–10657. 29

4.3 The impact of a high-conductance state 99
Tóth, K. and T. F. Freund (1992). Calbindin D28k-containing nonpyramidal cellsin the rat hippocampus: Their immunoreactivity for GABA and projection to themedial septum. Neuroscience 49(4), 793–805. 13
Traub, R. D. and A. Bibbig (2000). A model of high-frequency ripples in the hip-pocampus based on synaptic coupling plus axon-axon gap junctions betweenpyramidal neurons. The Journal of neuroscience 20(6), 2086–2093. 17
Van Hoesen, G. W., D. N. Pandya, and N. Butters (1975). Some connections ofthe entorhinal (area 28) and perirhinal (area 35) cortices of the rhesus monkey.II. Frontal lobe afferents. Brain Research 95(1), 25–38. 7
Van Wanrooij, M. M. (2004). Contribution of Head Shadow and Pinna Cues toChronic Monaural Sound Localization. Journal of Neuroscience 24(17), 4163–4171. 26
Vorhees, C. V. and M. T. Williams (2006). Morris water maze: Procedures forassessing spatial and related forms of learning and memory. Nature Proto-cols 1(2), 848–858. 20
Werthat, F., O. Alexandrova, B. Grothe, and U. Koch (2008). Experience-dependent refinement of the inhibitory axons projecting to the medial superiorolive. Developmental Neurobiology . 30
Willshaw, D. J., O. P. Buneman, and H. C. Longuet-Higgins (1969). Non-holographic associative memory. Nature 222(5197), 960–962. 25
Wilson, M. A. and B. L. McNaughton (1993). Dynamics of the hippocampal en-semble code for space. Science 261(5124), 1055–1058. 9
Wilson, M. A. and B. L. McNaughton (1994). Reactivation of hippocampal ensem-ble memories during sleep. Science 265(5172), 676–679. 16, 33
Winograd, T. (1975). Frame representations and the declarative / procedural con-troversy. Representation and Understanding: Studies in Cognitive Science,185–210. 18
100 4. Discussion
Winson, J. (1978). Loss of hippocampal theta rhythm results in spatial memorydeficit in the rat. Science 201(4351), 160–163. 14
Witter, M. P., A. W. Griffioen, B. Jorritsma-Byham, and J. L. Krijnen (1988). En-torhinal projections to the hippocampal CA1 region in the rat: An underesti-mated pathway. Neuroscience Letters 85(2), 193–198. 8
Witter, M. P., P. A. Naber, T. Van Haeften, W. C. M. Machielsen, S. A. R. B.Rombouts, F. Barkhof, P. Scheltens, and F. H. Lopes Da Silva (2000). Cortico-hippocampal communication by way of parallel parahippocampal-subicularpathways. Hippocampus 10(4), 398–410. 5, 8
Witter, M. P., F. G. Wouterlood, P. A. Naber, and T. Van Haeften (2000). Anatom-ical organization of the parahippocampal-hippocampal network. Annals of theNew York Academy of Sciences 911(1), 1–24. 5
Ylinen, A., A. Bragin, Z. Nádasdy, G. Jandó, I. Szabo, A. Sik, and G. Buzsáki(1995). Sharp wave-associated high-frequency oscillation (200 hz) in the in-tact hippocampus: network and intracellular mechanisms. Journal of Neuro-science 15(1), 30–46. 16
Zerlaut, Y. and A. Destexhe (2017). Enhanced responsiveness and low-levelawareness in stochastic network states. Neuron 94(5), 1002–1009. 76

List of publications
Lehnert S; Ford MC; Alexandrowa O; Hellmundt F; Felmy F; Grothe B; LeiboldC (2014) Action Potential Generation in an Anatomically Constrained Model ofMedial Superior Olive Axons J Neurosci 34: 5370-5384.doi: 10.1523/JNEUROSCI.4038-13.2014
Thurley K; Hellmundt F; Leibold C (2013) Phase Precession of Grid Cells in aNetwork Model without External Pacemaker Hippocampus 23: 786-796.doi: 10.1002/hipo.22133.

102 Appendix . List of publications

Eidesstattliche Versicherung/Affidavit
Hiermit versichere ich an Eides statt, dass ich die vorliegende DissertationComputation in the High-Conductance state selbstständig angefertigt habe, michaußer der angegebenen keiner weiteren Hilfsmittel bedient und alle Erkenntnisse,die aus dem Schrifttum ganz oder annähernd übernommen sind, als solche ken-ntlich gemacht und nach ihrer Herkunft unter Bezeichnung der Fundstelle einzelnnachgewiesen habe.
I hereby confirm that the dissertation Computation in the High-Conductance Stateis the result of my own work and that I have only used sources or materials listedand specified in the dissertation.
München, den 28. September 2020 Franziska Hellmundt

104 Appendix . Eidesstattliche Versicherung/Affidavit
Author Contributions
Chapter 2 is an unpublished manuscript. The work was done under the super-vision of Christian Leibold (CL). Franziska Hellmundt (FH) and CL conceivedand designed the research. FH wrote the code, carried out the simulations andanalyzed the data. FH and CL discussed the results and wrote the manuscript.
Chapter 3 was published in The Journal of Neuroscience (Lehnert et al., 2014).Simon Lehnert (SL), Marc C. Ford (MCF), Olga Alexandrova (OA), Felix Felmy(FF), Benedikt Grothe (BG), and Christian Leibold (CL) designed the research.SL performed the computational modeling. Morphometric measurements wereperformed by MCF, and OA. FH and FF performed the electrophysiologicalrecordings. SL, MCF, OA, FH, and FH analyzed the data. SL, MCF, FF, BG, andCL wrote the paper.
Munich, July 2019
Franziska Hellmundt Christian Leibold