The British rule in Assam, accompanied as it was by many ...

Journal of Electromyography and Kinesiology 25 (2015) 469–478
Contents lists available at ScienceDirect
Journal of Electromyography and Kinesiology
journal homepage: www.elsevier .com/locate / je lek in
Stretch-induced changes in tension generation process and stiffness arenot accompanied by alterations in muscle architecture of the middle anddistal portions of the two gastrocnemii
http://dx.doi.org/10.1016/j.jelekin.2015.03.0011050-6411/� 2015 Elsevier Ltd. All rights reserved.
⇑ Corresponding author. Tel.: +39 02 5031 4639; fax: +39 02 5031 4630.E-mail address: [email protected] (F. Esposito).
Emiliano Cè a,b, Stefano Longo a, Susanna Rampichini a,b, Michela Devoto a, Eloisa Limonta a,Massimo Venturelli a, Fabio Esposito a,⇑a Department of Biomedical Sciences for Health (SCIBIS), University of Milan, Via G. Colombo 71, 20133 Milan, Italyb Center of Sport Medicine, Don Gnocchi Foundation, Via Capecelatro 66, 20148 Milan, Italy
a r t i c l e i n f o
Article history:Received 28 July 2014Received in revised form 3 March 2015Accepted 3 March 2015
Keywords:Electrically-evoked contractionPennation angleFascicle lengthPlantar flexor muscles
a b s t r a c t
The study aimed to evaluate the stretch-induced changes in muscle architecture in different portions ofthe gastrocnemius medialis (GM) and lateralis (GL) muscles. The reliability and sensitivity of the measure-ments were also assessed. Fascicle length (FL) and pennation angle (PA) were calculated in the middleand distal portions of GM and GL at 0�, 10� and 20� of ankle dorsiflexion. At the same angles, passive tor-que (Tpass), peak torque (pT) and myotendinous junction displacement of GM were determined. Stiffnesswas calculated at muscle–tendon unit (MTU), muscle and tendon level. After static stretching administra-tion, Tpass, pT and MTU stiffness decreased by 22%, 12% and 16%, respectively (p < 0.05). Muscle and ten-don stiffness decreased by 15% and 16% (p < 0.05). Nevertheless, no changes in FL and PA occurred. Thereliability of the approach was always very high (intraclass correlation coefficient > 0.90), with an ade-quate level of sensitivity. pT after static stretching was related to decreases in MTU, muscle and tendonstiffness, but not to alterations in muscle architecture.
� 2015 Elsevier Ltd. All rights reserved.
1. Introduction
Static stretching (SS) is commonly used in rehabilitation andsports environments, with the aims of increasing joint range ofmotion (ROM) and preventing limited mobility (Nakamura et al.,2011). Recent studies showed that pre-exercise SS may negativelyaffect maximum force and power output (Behm et al., 2004; LaTorre et al., 2010; Limonta et al., 2012, 2013; Rubini et al., 2007;Simic et al., 2013), which are highly dependent on neuromuscularactivation and muscle mass, composition and architecture. Thisacute response to SS has been related to both neural and mechani-cal factors, among which a reduction in the neural drive (Avelaet al., 2004; Cè et al., 2008a,b; Guissard et al., 1988, 1989) and adecrease in the muscle–tendon unit (MTU) stiffness (Duong et al.,2001; Fowles et al., 2000; Herda et al., 2011; Magnusson et al.,1995; Nordez et al., 2008; Ryan et al., 2011), which leads to analteration in the passive tension-length relationship (Taylor et al.,1990). While the stretch-induced reduction in neural drive hasbeen ascribed to changes in pre- and post-synaptic circuits at
spinal level (Avela et al., 2004; Chalmers, 2004; Guissard et al.,1988, 1989, 2001), the alteration in MTU stiffness has been attrib-uted to changes in the viscoelastic properties of the tissues, such asan increased extensibility of the tendon (Kato et al., 1985; Kuboet al., 2001a,b) and muscular components (aponeuroses, contrac-tile and connective tissues) (Morse et al., 2008).
Also possible stretch-induced changes in muscle architecturehave been investigated to explain the reduction in force after SS(Abellaneda et al., 1985; Kato et al., 1985; Morse et al., 2008;Nakamura et al., 2011). Muscle architecture, which is defined bymuscle fascicles length (FL), their insertion angle (pennation angle– PA) and muscle thickness (Koryak, 2008), is strongly related tomuscle strength as the larger the PA the more contractile materialcan be packed within a certain volume, thus increasing the mus-cle’s capacity to exert force (Kawakami et al., 1985).
Possible changes in muscle architecture after SS may providefurther insights into the mechanisms behind the acute reductionin force. Indeed, a large increase in PA may reduce fascicles forceproduction transmitted to the tendon due to a higher oblique lineof action. However, the few studies regarding the behavior of FLand PA after an acute bout of SS are controversial. For instance,while some studies showed no changes in the architecture of the
470 E. Cè et al. / Journal of Electromyography and Kinesiology 25 (2015) 469–478
gastrocnemius medialis muscle (GM) after SS, either at rest (Katoet al., 1985) or during ankle dorsiflexion (Nakamura et al., 2011),another study reported FL and PA changes during passive ankledorsiflexion (Abellaneda et al., 1985). However, these studiesinvestigated the effects of SS on one head only of the gastrocnemii,(GM), and mainly in its middle portion (Morse et al., 2008;Nakamura et al., 2011), assuming that the gastrocnemius lateralismuscle (GL), as well as the other portions of the gastrocnemii(e.g., distal parts), have the same behavior. Muscle architecturehas been shown to be uniform along the proximal, central and dis-tal portion of the GM and GL bellies, measured at 50% ± 2 cm fromthe distance between the two tendon insertions (Maganaris et al.,1998a,b). However, other anatomical and functional studiesrevealed that GL presents different compartments reflecting dis-tinct function and architecture, whereas GM seems to be an archi-tecturally homogeneous muscle (Wolf and Kim, 1997). Moreover,(i) the muscle architecture and the cross-sectional area of thetwo heads of the gastrocnemius muscle are different (Maganariset al., 1998a,b; Seynnes et al., 2008), hence, the acute response interms of muscle architecture to a bout of SS could change betweenGM and GL; and (ii) the measurement of muscle architecture on aportion closer to the myotendinous junction (MTJ) could be differ-ently affected by SS than the central portion in both muscle bellies.
Therefore, the aims of this study were (i) to assess the reliabilityand sensitivity of the muscle architecture and MTU stiffness mea-surements; (ii) to evaluate the stretch-induced changes in musclearchitecture in the middle and distal portions of both GM andGL; and (iii) to verify the changes in MTU, muscle and tendon stiff-ness after a bout of SS, checking for possible correlations amongthe relative changes in these parameters.
2. Methods
2.1. Participants
Fourteen physically active male participants (mean ± standarddeviation: age 23 ± 2 yrs; body mass 75.6 ± 9.5 kg; stature1.77 ± 0.08 m; GM skinfold 8.1 ± 1.4 mm; GL skinfold4.9 ± 1.1 mm; calf circumference 38.1 ± 3.5 cm) were recruited forthis study. After receiving a full explanation of the aim of the studyand the experimental procedures, a written informed consent wasgiven by each participant. Participants were all clinically healthywith no previous history of lower limb injuries. They were askedto abstain from caffeine or similar in the 24 h preceding the testand to report to the laboratory without any form of physical exer-cise of heavy intensity in the previous 48 h. The study wasapproved by the local University Ethical Committee and had beenperformed in accordance with the principles of the 1975Declaration of Helsinki.
2.2. Experimental design
After a first visit for familiarization purposes, the participantsreported to the laboratory a second day for testing procedures.During the day of the tests, ROM, muscle architecture, passiveand electrically-evoked forces were determined before and afterSS. In a subset of ten participants, measurements were carriedout in duplicate to determine intra-session reliability.
2.3. Experimental procedures
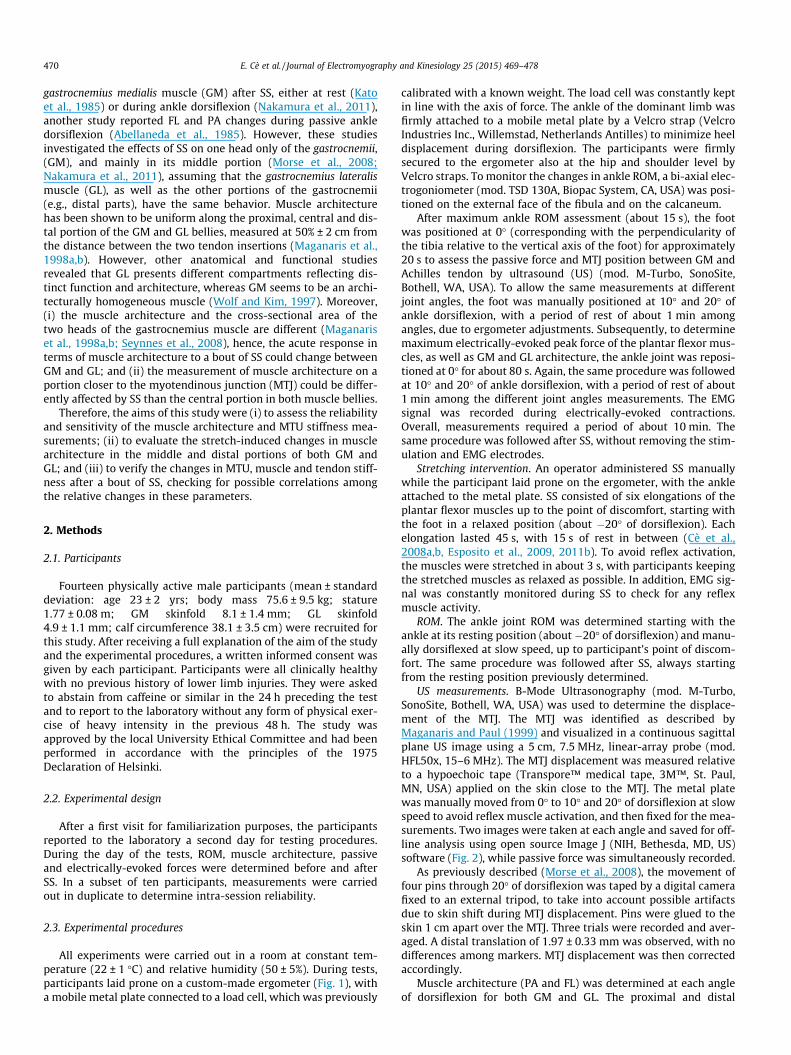
All experiments were carried out in a room at constant tem-perature (22 ± 1 �C) and relative humidity (50 ± 5%). During tests,participants laid prone on a custom-made ergometer (Fig. 1), witha mobile metal plate connected to a load cell, which was previously
calibrated with a known weight. The load cell was constantly keptin line with the axis of force. The ankle of the dominant limb wasfirmly attached to a mobile metal plate by a Velcro strap (VelcroIndustries Inc., Willemstad, Netherlands Antilles) to minimize heeldisplacement during dorsiflexion. The participants were firmlysecured to the ergometer also at the hip and shoulder level byVelcro straps. To monitor the changes in ankle ROM, a bi-axial elec-trogoniometer (mod. TSD 130A, Biopac System, CA, USA) was posi-tioned on the external face of the fibula and on the calcaneum.
After maximum ankle ROM assessment (about 15 s), the footwas positioned at 0� (corresponding with the perpendicularity ofthe tibia relative to the vertical axis of the foot) for approximately20 s to assess the passive force and MTJ position between GM andAchilles tendon by ultrasound (US) (mod. M-Turbo, SonoSite,Bothell, WA, USA). To allow the same measurements at differentjoint angles, the foot was manually positioned at 10� and 20� ofankle dorsiflexion, with a period of rest of about 1 min amongangles, due to ergometer adjustments. Subsequently, to determinemaximum electrically-evoked peak force of the plantar flexor mus-cles, as well as GM and GL architecture, the ankle joint was reposi-tioned at 0� for about 80 s. Again, the same procedure was followedat 10� and 20� of ankle dorsiflexion, with a period of rest of about1 min among the different joint angles measurements. The EMGsignal was recorded during electrically-evoked contractions.Overall, measurements required a period of about 10 min. Thesame procedure was followed after SS, without removing the stim-ulation and EMG electrodes.
Stretching intervention. An operator administered SS manuallywhile the participant laid prone on the ergometer, with the ankleattached to the metal plate. SS consisted of six elongations of theplantar flexor muscles up to the point of discomfort, starting withthe foot in a relaxed position (about �20� of dorsiflexion). Eachelongation lasted 45 s, with 15 s of rest in between (Cè et al.,2008a,b, Esposito et al., 2009, 2011b). To avoid reflex activation,the muscles were stretched in about 3 s, with participants keepingthe stretched muscles as relaxed as possible. In addition, EMG sig-nal was constantly monitored during SS to check for any reflexmuscle activity.
ROM. The ankle joint ROM was determined starting with theankle at its resting position (about �20� of dorsiflexion) and manu-ally dorsiflexed at slow speed, up to participant’s point of discom-fort. The same procedure was followed after SS, always startingfrom the resting position previously determined.
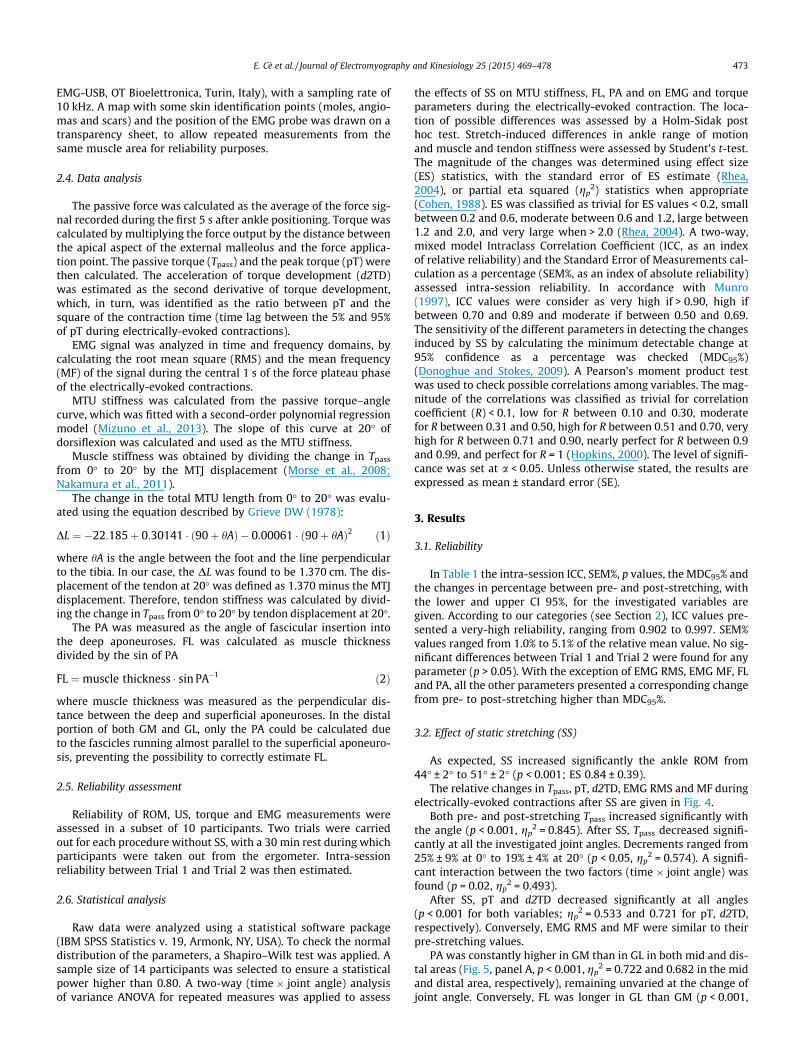
US measurements. B-Mode Ultrasonography (mod. M-Turbo,SonoSite, Bothell, WA, USA) was used to determine the displace-ment of the MTJ. The MTJ was identified as described byMaganaris and Paul (1999) and visualized in a continuous sagittalplane US image using a 5 cm, 7.5 MHz, linear-array probe (mod.HFL50x, 15–6 MHz). The MTJ displacement was measured relativeto a hypoechoic tape (Transpore™ medical tape, 3M™, St. Paul,MN, USA) applied on the skin close to the MTJ. The metal platewas manually moved from 0� to 10� and 20� of dorsiflexion at slowspeed to avoid reflex muscle activation, and then fixed for the mea-surements. Two images were taken at each angle and saved for off-line analysis using open source Image J (NIH, Bethesda, MD, US)software (Fig. 2), while passive force was simultaneously recorded.
As previously described (Morse et al., 2008), the movement offour pins through 20� of dorsiflexion was taped by a digital camerafixed to an external tripod, to take into account possible artifactsdue to skin shift during MTJ displacement. Pins were glued to theskin 1 cm apart over the MTJ. Three trials were recorded and aver-aged. A distal translation of 1.97 ± 0.33 mm was observed, with nodifferences among markers. MTJ displacement was then correctedaccordingly.
Muscle architecture (PA and FL) was determined at each angleof dorsiflexion for both GM and GL. The proximal and distal

Force transducer
EMG 4-channel linear array
Receiving electrodeSites for US
measurements
Ground electrode
Stimulating electrode
GM GL
Medial
Distal
MTJ
A B
C
Fig. 1. Experimental set up, showing ultrasound (US) sites of measurement on the gastrocnemius medialis (GM) and lateralis (GL) muscles (panel A), electromyogram (EMG)and electrical stimulation electrodes placement (panel B), and the force transducer position for force detection (panel C). Panel A: horizontal dotted lines represent the site forUS image detection in the medial and distal portions of the GM and GL, and at myotendinous junction (MTJ), while the central vertical dotted line indicates the separationbetween the two muscle bellies. Panel B: the position of the stimulating and receiving electrodes for tibial nerve stimulation and of the two 4-channel linear arrays togetherwith the ground electrodes for EMG detection are depicted. Panel C: foot and load cell position within the ergometer. Foot was maintained in the same position also duringstatic stretching administration.
E. Cè et al. / Journal of Electromyography and Kinesiology 25 (2015) 469–478 471
insertions of the two heads of gastrocnemius were identified by US.Images were obtained along the middle sagittal plane of the GMand GL, at the 50% and 25% of muscle length (toward distal tendoninsertion, Fig. 3). The head of the probe was held perpendicular tothe skin surface by an expert operator, to provide an image includ-ing both superficial and deep aponeuroses, and a number of clearlyvisible fascicles that could be followed between the aponeuroses.The corresponding skin surface was marked with a dermographicpencil (mod 27010, Fysiomed NV, Edegem, Belgium) to allowrepeated measurements from the same skin area after SS. Theoperator ensured that no pressure was exerted on the skin duringmeasurements. To improve acoustic coupling, water-soluble trans-mission gel (Cogel, Comedical, Trento, Italy) was placed over thescan head. The sequence of scans was randomized across musclesand portions.
Force measurements. The force output of the dynamometer wasrecorded by a calibrated load cell (mod. SM-2000 N, Interface, UK;operating linearly between 0 and 2000 N), acquired by a dataacquisition system (mod. UM150, Biopac System, Santa Barbara,USA; sampling rate 10 kHz) and driven to the auxiliary input ofthe EMG amplifier (mod. EMG-USB, OT Bioelettronica, Turin,Italy, sampling rate 10 kHz) after A/D conversion. The passive forceexerted by plantar flexor muscles against the ergometer platformwas recorded at 0�, 10� and 20� of dorsiflexion. The peak force eli-cited by a tetanic stimulation (50 Hz; pulse duration: 304 ls;
stimulation amplitude: +10% of the maximum compound motoraction potential) was measured at the same joint angles with5 min of rest in between. The tibial nerve was supramaximallystimulated by an electrical stimulator (mod. St-Pro MultichannelProgrammable Neuromuscular Stimulator, LiSin, Turin, Italy). Thereceiving electrode (70 � 35 mm) was positioned on the uppermargin of the patella, whereas the stimulating electrode(35 � 35 mm) was placed above the tibial nerve at the poplitealfossa level.
EMG detection. Surface EMG signal was detected by a lineararray probe, which included four silver bar electrodes (linear array45 mm � 20 mm; electrode 2 mm � 1 mm; inter-electrode dis-tance 10 mm, mod ELSCH004, OT Bioelettronica. Turin, Italy), fordifferential EMG detection. The skin area under the EMG electrodeswas cleaned carefully with ethyl alcohol and gently abraded withfine sand paper and a conductive cream (Nuprep, Weaver andCo., Aurora, USA) to achieve inter-electrode impedance below2000 X. The EMG probe was placed over the GM and GL belliesalong muscle fiber direction, with the EMG electrodes positionedbetween the tendon and the motor point, in accordance with theEuropean recommendations for surface EMG (Hermens et al.,1999). The probe was then fixed steadily by an adhesive elasticband (Fixomull Stretch, Beiersdorf, Hamburg, Germany). EMGsignal was amplified (�1000), filtered (bandwidth of 10–500 Hz)and stored on a personal computer after A/D conversion (mod.

MTJ
Reference marker
GM
MTJ
20°
Achilles tendon
SOL
10°
0°
MTJ
Displacement
Superficial
Deep
DistalProximal
Fig. 2. Sagittal plane US image showing echo-absorptive marker (vertical white line), gastrocnemius medialis (GM), soleus muscle (SOL), myotendinous junction (MTJ) of theGM with the Achilles tendon at different angles of ankle dorsiflexion. The displacement of the MTJ from 0� (right angle between the tibia and the foot) to 20� of dorsiflexion isrepresented as the distance between the two dashed lines.
Fig. 3. Sagittal plane US images showing examples of muscle architecture measurements of the gastrocnemius medialis (GM) muscle at middle (A) and distal (B) portions.Angle of pennation (PA) was determined as the angle between GM muscle fiber fascicles and the deep aponeuroses. Fascicle length (FL) was measured in the mid portiondrawing a continuous line along the fascicle line between the two aponeuroses. Muscle thickness (MT) was measured as the perpendicular distance between the superficialand deep aponeuroses.
472 E. Cè et al. / Journal of Electromyography and Kinesiology 25 (2015) 469–478
E. Cè et al. / Journal of Electromyography and Kinesiology 25 (2015) 469–478 473
EMG-USB, OT Bioelettronica, Turin, Italy), with a sampling rate of10 kHz. A map with some skin identification points (moles, angio-mas and scars) and the position of the EMG probe was drawn on atransparency sheet, to allow repeated measurements from thesame muscle area for reliability purposes.
2.4. Data analysis
The passive force was calculated as the average of the force sig-nal recorded during the first 5 s after ankle positioning. Torque wascalculated by multiplying the force output by the distance betweenthe apical aspect of the external malleolus and the force applica-tion point. The passive torque (Tpass) and the peak torque (pT) werethen calculated. The acceleration of torque development (d2TD)was estimated as the second derivative of torque development,which, in turn, was identified as the ratio between pT and thesquare of the contraction time (time lag between the 5% and 95%of pT during electrically-evoked contractions).
EMG signal was analyzed in time and frequency domains, bycalculating the root mean square (RMS) and the mean frequency(MF) of the signal during the central 1 s of the force plateau phaseof the electrically-evoked contractions.
MTU stiffness was calculated from the passive torque–anglecurve, which was fitted with a second-order polynomial regressionmodel (Mizuno et al., 2013). The slope of this curve at 20� ofdorsiflexion was calculated and used as the MTU stiffness.
Muscle stiffness was obtained by dividing the change in Tpass
from 0� to 20� by the MTJ displacement (Morse et al., 2008;Nakamura et al., 2011).
The change in the total MTU length from 0� to 20� was evalu-ated using the equation described by Grieve DW (1978):
DL ¼ �22:185þ 0:30141 � ð90þ hAÞ � 0:00061 � ð90þ hAÞ2 ð1Þ
where hA is the angle between the foot and the line perpendicularto the tibia. In our case, the DL was found to be 1.370 cm. The dis-placement of the tendon at 20� was defined as 1.370 minus the MTJdisplacement. Therefore, tendon stiffness was calculated by divid-ing the change in Tpass from 0� to 20� by tendon displacement at 20�.
The PA was measured as the angle of fascicular insertion intothe deep aponeuroses. FL was calculated as muscle thicknessdivided by the sin of PA
FL ¼ muscle thickness � sin PA�1 ð2Þ
where muscle thickness was measured as the perpendicular dis-tance between the deep and superficial aponeuroses. In the distalportion of both GM and GL, only the PA could be calculated dueto the fascicles running almost parallel to the superficial aponeuro-sis, preventing the possibility to correctly estimate FL.
2.5. Reliability assessment
Reliability of ROM, US, torque and EMG measurements wereassessed in a subset of 10 participants. Two trials were carriedout for each procedure without SS, with a 30 min rest during whichparticipants were taken out from the ergometer. Intra-sessionreliability between Trial 1 and Trial 2 was then estimated.
2.6. Statistical analysis
Raw data were analyzed using a statistical software package(IBM SPSS Statistics v. 19, Armonk, NY, USA). To check the normaldistribution of the parameters, a Shapiro–Wilk test was applied. Asample size of 14 participants was selected to ensure a statisticalpower higher than 0.80. A two-way (time � joint angle) analysisof variance ANOVA for repeated measures was applied to assess
the effects of SS on MTU stiffness, FL, PA and on EMG and torqueparameters during the electrically-evoked contraction. The loca-tion of possible differences was assessed by a Holm-Sidak posthoc test. Stretch-induced differences in ankle range of motionand muscle and tendon stiffness were assessed by Student’s t-test.The magnitude of the changes was determined using effect size(ES) statistics, with the standard error of ES estimate (Rhea,2004), or partial eta squared (gp
2) statistics when appropriate(Cohen, 1988). ES was classified as trivial for ES values < 0.2, smallbetween 0.2 and 0.6, moderate between 0.6 and 1.2, large between1.2 and 2.0, and very large when > 2.0 (Rhea, 2004). A two-way,mixed model Intraclass Correlation Coefficient (ICC, as an indexof relative reliability) and the Standard Error of Measurements cal-culation as a percentage (SEM%, as an index of absolute reliability)assessed intra-session reliability. In accordance with Munro(1997), ICC values were consider as very high if > 0.90, high ifbetween 0.70 and 0.89 and moderate if between 0.50 and 0.69.The sensitivity of the different parameters in detecting the changesinduced by SS by calculating the minimum detectable change at95% confidence as a percentage was checked (MDC95%)(Donoghue and Stokes, 2009). A Pearson’s moment product testwas used to check possible correlations among variables. The mag-nitude of the correlations was classified as trivial for correlationcoefficient (R) < 0.1, low for R between 0.10 and 0.30, moderatefor R between 0.31 and 0.50, high for R between 0.51 and 0.70, veryhigh for R between 0.71 and 0.90, nearly perfect for R between 0.9and 0.99, and perfect for R = 1 (Hopkins, 2000). The level of signifi-cance was set at a < 0.05. Unless otherwise stated, the results areexpressed as mean ± standard error (SE).
3. Results
3.1. Reliability
In Table 1 the intra-session ICC, SEM%, p values, the MDC95% andthe changes in percentage between pre- and post-stretching, withthe lower and upper CI 95%, for the investigated variables aregiven. According to our categories (see Section 2), ICC values pre-sented a very-high reliability, ranging from 0.902 to 0.997. SEM%values ranged from 1.0% to 5.1% of the relative mean value. No sig-nificant differences between Trial 1 and Trial 2 were found for anyparameter (p > 0.05). With the exception of EMG RMS, EMG MF, FLand PA, all the other parameters presented a corresponding changefrom pre- to post-stretching higher than MDC95%.
3.2. Effect of static stretching (SS)
As expected, SS increased significantly the ankle ROM from44� ± 2� to 51� ± 2� (p < 0.001; ES 0.84 ± 0.39).
The relative changes in Tpass, pT, d2TD, EMG RMS and MF duringelectrically-evoked contractions after SS are given in Fig. 4.
Both pre- and post-stretching Tpass increased significantly withthe angle (p < 0.001, gp
2 = 0.845). After SS, Tpass decreased signifi-cantly at all the investigated joint angles. Decrements ranged from25% ± 9% at 0� to 19% ± 4% at 20� (p < 0.05, gp
2 = 0.574). A signifi-cant interaction between the two factors (time � joint angle) wasfound (p = 0.02, gp
2 = 0.493).After SS, pT and d2TD decreased significantly at all angles
(p < 0.001 for both variables; gp2 = 0.533 and 0.721 for pT, d2TD,
respectively). Conversely, EMG RMS and MF were similar to theirpre-stretching values.
PA was constantly higher in GM than in GL in both mid and dis-tal areas (Fig. 5, panel A, p < 0.001, gp
2 = 0.722 and 0.682 in the midand distal area, respectively), remaining unvaried at the change ofjoint angle. Conversely, FL was longer in GL than GM (p < 0.001,

Table 1Intra-session reliability between Trial 1 and 2. Intraclass correlation coefficient (ICC), standard error of measurements as a percentage (SEM%), p value, minimum detectablechange at 95% confidence as a percentage (MDC95%) and the percentage difference between pre- and post-stretching values, with the lower and upper 95% confidence interval (CI)are here reported for range of motion (ROM), torque (Tpass, passive torque; pT, peak torque; d2TD, acceleration of torque development), EMG (RMS, root mean square; MF, meanfrequency), stiffness and muscle architecture parameters (FL, fascicle length; PA, pennation angle).
Trial 1 Trial 2 ICC SEM% p value MDC95% Measured changes (CI95%)
ROM (�) 44 ± 2 43 ± 2 0.938 1.1 0.436 2.3 18.1 (10.2–25.9)Tpass (Nm) 3.68 ± 0.42 3.71 ± 0.48 0.934 3.1 0.621 6.2 21.7 (9.4–34.1)pT (Nm) 76 ± 9 75 ± 9 0.997 1.0 0.814 1.3 12.2 (5.8–18.6)d2TD (Nm s�2) 1131 ± 211 1129 ± 212 0.925 5.1 0.899 10.1 56.6 (44.0–69.1)EMG RMS (mV) 0.49 ± 0.05 0.50 ± 0.06 0.912 3.2 0.612 6.3 5.6 (�2.4–13.5)EMG MF (Hz) 82 ± 4 81 ± 5 0.910 1.7 0.654 3.3 1.4 (�13.9–16.7)MTU stiffness (Nm deg�1) 0.24 ± 0.03 0.23 ± 0.02 0.921 3.0 0.501 5.9 15.8 (�0.3–31.8)Muscle stiffness (Nm cm�1) 23.2 ± 3.1 23.8 ± 2.8 0.945 2.9 0.534 5.7 14.5 (�6.1–35.0)Tendon stiffness (Nm cm�1) 11.2 ± 1.4 10.8 ± 1.0 0.902 3.42 0.687 6.8 15.9 (2.4–29.4)FL (mm) 61.3 ± 6.3 61.4 ± 5.4 0.934 2.45 0.745 4.8 0.10 (�1.5–1.7)PA (�) 19.7 ± 0.6 19.5 ± 0.7 0.928 1.0 0.711 1.8 1.50 (�1.5–4.5)
Fig. 4. Torque and EMG parameters as a percentage of the corresponding pre-stretching values (dashed line), measured at 0�, 10� and 20� of dorsiflexion(0� = right angle between the tibia and the foot). Passive torque (Tpass); peak torque(pT); second derivative of torque development (d2TD); root mean square (RMS) andmean frequency (MF). EMG RMS and MF are presented as the average of thegastrocnemius medialis and gastrocnemius lateralis. ⁄p < 0.05 post- vs pre-stretching.
474 E. Cè et al. / Journal of Electromyography and Kinesiology 25 (2015) 469–478
gp2 = 0.607). FL was significantly higher at 20� than at 10� or 0� in
both GM and GL (p < 0.001, gp2 = 0.905 and 0.821 in GM and GL,
respectively).MTJ displacement did not change significantly between pre-
and post-SS (from 0.61 ± 0.09 cm to 0.63 ± 0.16 cm, p = 0.66).After SS, MTU stiffness decreased from 0.45 ± 0.06 Nm deg�1 to0.36 ± 0.04 Nm deg�1 compared to pre-stretching condition(p < 0.001, ES: 0.46 ± 0.38).
After SS, muscle and tendon stiffness decreased significantlyfrom 23.2 ± 3.1 Nm cm�1 to 18.5 ± 2.1 Nm cm�1 and from17.98 ± 0.46 Nm cm�1 to 15.50 ± 0.51 Nm cm�1 (p = 0.03, ES:0.46 ± 0.38, p = 0.03, ES: 1.45 ± 0.48, in muscle and tendon stiffness,respectively).
3.3. Correlations
According to the classification adopted in Section 2, a positivestrong correlation was found between stretch-induced changes inMTU and tendon stiffness (r = 0.554 and r2 = 0.34 p < 0.05).Conversely, no correlation was found between stretch-inducedchanges in MTU and muscle stiffness (Fig. 6).
4. Discussion
The main findings of this study were that (i) the reliability of theapproach was always very high, with an adequate level of
sensitivity; (ii) muscle architecture was not acutely affected bySS administration, regardless of the site of measurement; and(iii) after SS, stiffness decreased at MTU, muscle and tendon level.A significant correlation between the percentage decrease in MTUand tendon stiffness was also observed. These findings suggestthat, when the central drive to the muscles was ruled out as acause of force output depression (by the use of electrical stim-ulation), the observed decrease in pT could be related to changesin MTU, muscle, and tendon stiffness, but not in musclearchitecture.
4.1. Range of motion, force and EMG parameters
Under electrically-evoked contraction, an increase in ankleROM, a decrease in pT and d2TD, a downward shift of the passivetorque/angle relationship, with unchanged EMG parameters, wereobserved after SS. Although these findings were already reported(Cè et al., 2008a,b, Costa et al., 2010; Esposito et al., 2012, 2011a;Nakamura et al., 2011; Simic et al., 2013), they were a necessarycondition to assess the efficacy of the SS protocol.
The ankle joint angles at which measurements were performedwere at about 45% and 40% of the total ROM before and after SS,respectively, falling within the stiff portion of the ROM, as wit-nessed by all stiffness values. Indeed, the Tpass exerted by the footbetween �20� and 0� was trivial, making the resultant overall stiff-ness in this range negligible.
Maximum force reduction induced by stretching maneuvers is awell-known phenomenon and it has been attributed to two mainmechanisms: (i) a neural inhibitory effect (Avela et al., 2004;Guissard et al., 1989), and (ii) a change in the structural and func-tional characteristics of the MTU (Kubo et al., 2001b; Proske andMorgan, 1999; Trombitas et al., 1998). The use of electrical stim-ulation in the present study allowed us to focus only on the secondgroup of mechanisms.
4.2. Reliability
The very high ICC values found in all measurements, which ran-ged from 0.902 to 0.997, and the SEM% values below 5%, indicatethat this approach can provide reliable values for passive and elec-trically-evoked torque, EMG parameters, stiffness and musclearchitecture. These results are in line with some other studies pre-viously reported (Cè et al., 2013; Kwah et al., 1985; Nakamuraet al., 2011), where a high reliability for torque and EMG parame-ters (Cè et al., 2013), muscle and tendon stiffness (Nakamura et al.,2011), and muscle architecture (Kwah et al., 1985) were retrieved.Moreover, the significant stretch-induced changes in force
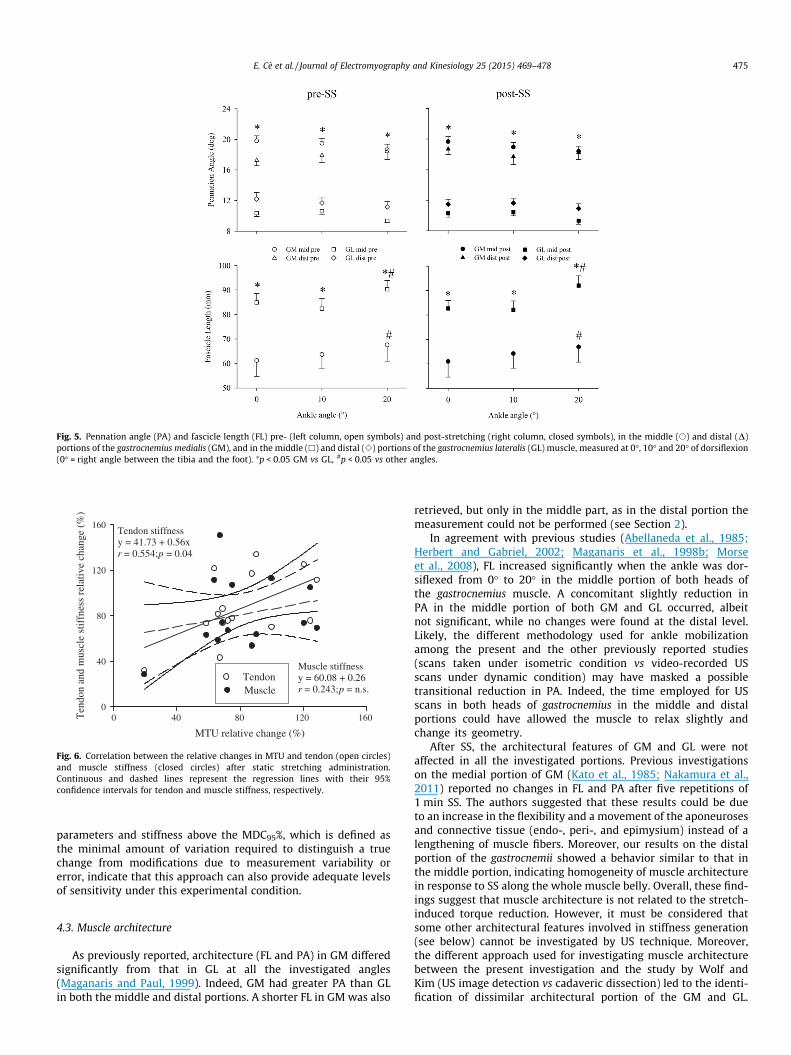
Fig. 5. Pennation angle (PA) and fascicle length (FL) pre- (left column, open symbols) and post-stretching (right column, closed symbols), in the middle (s) and distal (D)portions of the gastrocnemius medialis (GM), and in the middle (h) and distal (e) portions of the gastrocnemius lateralis (GL) muscle, measured at 0�, 10� and 20� of dorsiflexion(0� = right angle between the tibia and the foot). ⁄p < 0.05 GM vs GL, #p < 0.05 vs other angles.
MTU relative change (%)
0 40 80 120 160Ten
don
and
mus
cle
stif
fnes
s re
lativ
e ch
ange
(%
)
0
40
80
120
160Tendon stiffnessy = 41.73 + 0.56xr = 0.554; p = 0.04
Muscle stiffnessy = 60.08 + 0.26r = 0.243; p = n.s.
Tendon Muscle
Fig. 6. Correlation between the relative changes in MTU and tendon (open circles)and muscle stiffness (closed circles) after static stretching administration.Continuous and dashed lines represent the regression lines with their 95%confidence intervals for tendon and muscle stiffness, respectively.
E. Cè et al. / Journal of Electromyography and Kinesiology 25 (2015) 469–478 475
parameters and stiffness above the MDC95%, which is defined asthe minimal amount of variation required to distinguish a truechange from modifications due to measurement variability orerror, indicate that this approach can also provide adequate levelsof sensitivity under this experimental condition.
4.3. Muscle architecture
As previously reported, architecture (FL and PA) in GM differedsignificantly from that in GL at all the investigated angles(Maganaris and Paul, 1999). Indeed, GM had greater PA than GLin both the middle and distal portions. A shorter FL in GM was also
retrieved, but only in the middle part, as in the distal portion themeasurement could not be performed (see Section 2).
In agreement with previous studies (Abellaneda et al., 1985;Herbert and Gabriel, 2002; Maganaris et al., 1998b; Morseet al., 2008), FL increased significantly when the ankle was dor-siflexed from 0� to 20� in the middle portion of both heads ofthe gastrocnemius muscle. A concomitant slightly reduction inPA in the middle portion of both GM and GL occurred, albeitnot significant, while no changes were found at the distal level.Likely, the different methodology used for ankle mobilizationamong the present and the other previously reported studies(scans taken under isometric condition vs video-recorded USscans under dynamic condition) may have masked a possibletransitional reduction in PA. Indeed, the time employed for USscans in both heads of gastrocnemius in the middle and distalportions could have allowed the muscle to relax slightly andchange its geometry.
After SS, the architectural features of GM and GL were notaffected in all the investigated portions. Previous investigationson the medial portion of GM (Kato et al., 1985; Nakamura et al.,2011) reported no changes in FL and PA after five repetitions of1 min SS. The authors suggested that these results could be dueto an increase in the flexibility and a movement of the aponeurosesand connective tissue (endo-, peri-, and epimysium) instead of alengthening of muscle fibers. Moreover, our results on the distalportion of the gastrocnemii showed a behavior similar to that inthe middle portion, indicating homogeneity of muscle architecturein response to SS along the whole muscle belly. Overall, these find-ings suggest that muscle architecture is not related to the stretch-induced torque reduction. However, it must be considered thatsome other architectural features involved in stiffness generation(see below) cannot be investigated by US technique. Moreover,the different approach used for investigating muscle architecturebetween the present investigation and the study by Wolf andKim (US image detection vs cadaveric dissection) led to the identi-fication of dissimilar architectural portion of the GM and GL.

476 E. Cè et al. / Journal of Electromyography and Kinesiology 25 (2015) 469–478
Hence, possible changes in the architecture of the deeper portion ofGL, which are not identifiable by an US approach, should not becompletely ruled out.
Unfortunately, given the morphological characteristics of mus-cle fascicles in the proximal portions of GM and GL, it was not pos-sible to capture satisfying images providing FLs and PAs with anadequate level of precision (<5% error). Indeed, due to their inser-tion at femoral condyle level, muscle fascicles present curvilineardirections that made difficult the correct estimation of FL.Moreover, contrary to the other two investigated portions of GMand GL, PA calculation was unreliable (ICC < 0.50), thus makingthe interpretation of the results questionable.
4.4. MTU, muscle and tendon stiffness
Our SS protocol led to a reduction of the whole MTU stiffness,accompanied by decrements of muscle and tendon stiffness. Thecorrelation found between the SS-induced reductions in MTU andtendon stiffness suggests that MTU stiffness is likely more influ-enced by modifications in tendon stiffness rather than musclemechanical changes.
Several mechanisms and structures are involved in the decreasein stiffness after SS: (i) resting filamentary tension, caused by thestretching of the stable cross-link between the actin and myosinfilaments (Proske and Morgan, 1999); (ii) stretching of the no-con-tractile proteins of the endosarcomeric cytoskeleton, in particularthe titin protein (Trombitas et al., 1998), and exosarcomericcytoskeleton, in particular the desmin protein (Magid and Law,1985); (iii) deformation of the connective tissues located withinand surrounding the muscle (in particular, the perimysium is con-sidered the tissue that is the major contributor to extracellular pas-sive resistance to stretch) (Borg and Caulfield, 1980; Rowe, 1981);(iv) the length of the tendons and aponeuroses (Kubo et al., 2001b);and (v) changes in the length–tension relationship, which couldimpair force generation during muscle contraction (Kubo et al.,2001a).
The main contributor (muscle or tendon) to the stretch-inducedchanges in MTU stiffness has been a matter of debate amonginvestigators. On one hand, some studies reported that tendonstiffness decreased after a bout of SS (Burgess et al., 2009; Katoet al., 2010; Kubo et al., 2002). On the other hand, Morse et al.(2008) demonstrated that MTU and muscle stiffness decreasedafter passive stretching of 5 min, whereas no change was seen inthe tendon properties. Similarly, Kay and Blazevich (2009)reported that 3 min of passive stretching decreased MTU and mus-cle stiffness, but had no effect at the tendon level. Lastly, Nakamuraet al. (2013) reported that 5 min of passive stretching decreasedMTU and muscle stiffness and increased tendon stiffness. The dif-ferent methods used to determine MTJ displacement (dynamic vsisometric evaluation), SS administration modalities (manual vsisokinetic) and the relative different range of joint angle at whichstiffness was calculated (30� and/or end of ROM vs 20�) mightexplain the discrepancies reported among studies.
The lack of correlation between the relative decrease in pT andd2TD on one side (about 10% and 50%, respectively), and the rela-tive decrease in MTU, muscle and tendon stiffness on the other side(about 20%, 22% and 14%, respectively) suggests that the decreasein stiffness level can explain the decrease in muscle force outputand its development only qualitatively, but not quantitatively.Therefore, other mechanisms involved in muscle force generationcapacity, such as dihydropyridine-ryanodine receptors coupling,ca2+ uptake and sensitivity, which have been suggested beingtransitionally altered after passive stretching (Bruton et al.,1995), may likely contribute to explain the magnitude of forceparameters drop after SS.
4.5. Study limitations
Under the present experimental setting, we were not able topartition the relative contribution of GM, GL and soleus muscles,as well as of other deep muscles, to the overall torque and muscleand tendon stiffness. Future studies seem necessary to assess therelative contribution of each plantar flexors muscle to the overalltorque and stiffness changes. Moreover, it must be taken intoaccount that the measurement of the passive force and MTJ dis-placement itself involved an elongation of the plantar flexors mus-cles. These evaluations occurred before pT determination,therefore these elongations may have contributed to decreasedforce output, thus potentially underestimating the effects of SS.However, the maneuver for Tpass and MTJ displacement assessmentlasted only about 1 min, with only the measurements performed at20� of dorsiflexion (about 20 s) representing a meaningful elonga-tion. Such a short elongation is likely not sufficient, though, tocause a significant reduction in force output (Kay and Blazevich,2012).
5. Conclusion
In the present study, the use of electrically-evoked contractionspermitted to exclude (or strongly limit) the neuromuscular alter-ations involved in the SS-induced force reduction (as witnessedby the similar EMG RMS and MF values between pre- and post-SS administration), thus focusing only on the mechanical factors.The present findings showed that after a bout of SS, the decreasein torque production was not related to the architectural charac-teristics of the middle and distal portion of both gastrocnemiusheads, thus excluding the role of changes in PA and FL as possiblecontributors to the stretch-induced decrease in maximum forceoutput. Conversely, torque reduction was coupled with a signifi-cant decrease in the whole MTU stiffness. Such a reduction is attri-butable to a decline in stiffness at muscle and tendon level. Inparticular, MTU stiffness decrements after SS correlated withchanges in stiffness at the tendon level.
Conflicts of interest
No conflicts of interest to declare. The experiments comply withthe current laws of the country in which they were performed.
Acknowledgements
The authors wish to thank all the participants involved in thestudy, for their patience and committed involvement. The studywas supported by a PUR Grant (2008) assigned to Fabio Espositoby the University of Milan.
References
Abellaneda S, Guissard N, Duchateau J. The relative lengthening of themyotendinous structures in the medial gastrocnemius during passivestretching differs among individuals. J Appl Physiol 1985;2009(106):169–77.
Avela J, Finni T, Liikavainio T, Niemela E, Komi PV. Neural and mechanical responsesof the triceps surae muscle group after 1 h of repeated fast passive stretches. JAppl Physiol 2004;96:2325–32.
Behm DG, Bambury A, Cahill F, Power K. Effect of acute static stretching on force,balance, reaction time, and movement time. Med Sci Sports Exerc2004;36:1397–402.
Borg TK, Caulfield JB. Morphology of connective tissue in skeletal muscle. Tissue Cell1980;12:197–207.
Bruton JD, Lannergren J, Westerblad H. Mechano-sensitive linkage in excitation–contraction coupling in frog skeletal muscle. J Physiol (Lond) 1995;484:737–42.
Burgess KE, Graham-Smith P, Pearson SJ. Effect of acute tensile loading on gender-specific tendon structural and mechanical properties. J Orthop Res2009;27:510–6.

E. Cè et al. / Journal of Electromyography and Kinesiology 25 (2015) 469–478 477
Cè E, Paracchino E, Esposito F. Electrical and mechanical response of skeletal muscleto electrical stimulation after acute passive stretching in humans: a combinedelectromyographic and mechanomyographic approach. J Sports Sci2008a;26:1567–77.
Cè E, Rampichini S, Maggioni MA, Veicsteinas A, Merati G. Effects of passivestretching on post-activation potentiation and fibre conduction velocity ofbiceps brachii muscle. Sport Sci Health 2008b;4:43–50.
Cè E, Rampichini S, Limonta E, Esposito F. Torque and mechanomyogramcorrelations during muscle relaxation: effects of fatigue and time-course ofrecovery. J Electromyogr Kinesiol 2013;23:1295–303.
Chalmers G. Re-examination of the possible role of Golgi tendon organ and musclespindle reflexes in proprioceptive neuromuscular facilitation muscle stretching.Sports Biomech 2004;3:159–83.
Cohen J. Statistical power analysis for the behavioral sciences. 2nd ed. LawrenceErlbaum associates; 1988.
Costa PB, Ryan ED, Herda TJ, Walter AA, Hoge KM, Cramer JT. Acute effects of passivestretching on the electromechanical delay and evoked twitch properties. Eur JAppl Physiol 2010;108:301–10.
Donoghue D, Stokes EK. How much change is true change? The minimumdetectable change of the Berg Balance Scale in elderly people. J Rehab Med2009;41:343–6.
Duong B, Low M, Moseley AM, Lee RY, Herbert RD. Time course of stress relaxationand recovery in human ankles. Clin Biomech (Bristol, Avon) 2001;16:601–7.
Esposito F, Ce E, Rampichini S, Veicsteinas A. Acute passive stretching in apreviously fatigued muscle: electrical and mechanical response during tetanicstimulation. J Sports Sci 2009;27:1347–57.
Esposito F, Limonta E, Ce E. Passive stretching effects on electromechanical delayand time course of recovery in human skeletal muscle: new insights from anelectromyographic and mechanomyographic combined approach. Eur J ApplPhysiol 2011a;111:485–95.
Esposito F, Limonta E, Ce E. Time course of stretching-induced changes inmechanomyogram and force characteristics. J Electromyogr Kinesiol2011b;21:795–802.
Esposito F, Ce E, Limonta E. Cycling efficiency and time to exhaustion are reducedafter acute passive stretching administration. Scand J Med Sci Sports2012;22:737–45.
Fowles JR, Sale DG, MacDougall JD. Reduced strength after passive stretch of thehuman plantarflexors. J Appl Physiol 2000;89:1179–88.
Grieve DW, Pheasant S, Cavanagh PR. Prediction of gastrocnemius length from kneeand ankle posture. In: Aej K, editor. Biomechanics. Baltimore, MD: UniversityPark Press; 1978. p. 405–12.
Guissard N, Duchateau J, Hainaut K. Muscle stretching and motoneuron excitability.Eur J Appl Physiol Occup Physiol 1988;58:47–52.
Guissard N, Duchateau J, de Montigny L, Hainaut K. Decrease of motoneuronexcitability during stretching of the human soleus. Biomed Biochim Acta1989;48. S489-92.
Guissard N, Duchateau J, Hainaut K. Mechanisms of decreased motoneuroneexcitation during passive muscle stretching. Exp Brain Res 2001;137:163–9.
Herbert RD, Gabriel M. Effects of stretching before and after exercising on musclesoreness and risk of injury: systematic review. Br Med J 2002;325:468–70.
Herda TJ, Costa PB, Walter AA, Ryan ED, Hoge KM, Kerksick CM, et al. Effects of twomodes of static stretching on muscle strength and stiffness. Med Sci Sport Exer2011;43:1777–84.
Hermens H, Freiks B, Merletti R, Stegeman D, Blok GR J, Disselhorst-Klug C, et al.Eurpoean recommendations for surface electromyography. TheNederlands: RRD; 1999.
Hopkins WG. Measures of reliability in sports medicine and science. Sports Med2000;30:1–15.
Kato E, Vieillevoye S, Balestra C, Guissard N, Duchateau J. Acute effect of musclestretching on the steadiness of sustained submaximal contractions of theplantar flexor muscles. J Appl Physiol 1985;2011(110):407–15.
Kato E, Kanehisa H, Fukunaga T, Kawakami Y. Changes in ankle joint stiffness due tostretching: the role of tendon elongation of the gastrocnemius muscle. Eur JSport Sci 2010;10:111–9.
Kawakami Y, Abe T, Fukunaga T. Muscle-fiber pennation angles are greater inhypertrophied than in normal muscles. J Appl Physiol 1985;1993(74):2740–4.
Kay AD, Blazevich AJ. Moderate-duration static stretch reduces active and passiveplantar flexor moment but not Achilles tendon stiffness or active muscle length.J Appl Physiol 2009;106:1249–56.
Kay AD, Blazevich AJ. Effect of acute static stretch on maximal muscle performance:a systematic review. Med Sci Sports Exerc 2012;44:154–64.
Koryak YA. Functional and clinical significance of the architecture of human skeletalmuscles. Hum Physiol 2008;34:482–92.
Kubo K, Kanehisa H, Fukunaga T. Is passive stiffness in human muscles related tothe elasticity of tendon structures? Eur J Appl Physiol 2001a;85:226–32.
Kubo K, Kanehisa H, Kawakami Y, Fukunaga T. Influence of static stretching onviscoelastic properties of human tendon structures in vivo. J Appl Physiol2001b;90:520–7.
Kubo K, Kanehisa H, Fukunaga T. Effect of stretching training on the viscoelasticproperties of human tendon structures in vivo. J Appl Physiol2002:595–601 (1985).
Kwah LK, Pinto RZ, Diong J, Herbert RD. Reliability and validity of ultrasoundmeasurements of muscle fascicle length and pennation in humans: a systematicreview. J Appl Physiol 1985;2013(114):761–9.
La Torre A, Castagna C, Gervasoni E, Ce E, Rampichini S, Ferrarin M, et al. Acuteeffects of static stretching on squat jump performance at different knee startingangles. J Strength Cond Res 2010;24:687–94.
Limonta E, Cè E, Esposito F. Effects of acute passive stretching on ventilatory patternduring prolonged cycle exercise. Sport Sci Health 2012;7:105–11.
Limonta E, Cè E, Rampichini S, Veicsteinas A, Esposito F. Effects of acute passivestretching on mean response time during an incremental ramp test. Sport SciHealth 2013;9:25–30.
Maganaris CN, Paul JP. In vivo human tendon mechanical properties. J Physiol1999;521(Pt 1):307–13.
Maganaris CN, Baltzopoulos V, Sargeant AJ. Changes in Achilles tendon moment armfrom rest to maximum isometric plantarflexion: in vivo observations in man. JPhysiol 1998a;510(Pt 3):977–85.
Maganaris CN, Baltzopoulos V, Sargeant AJ. In vivo measurements of the tricepssurae complex architecture in man: implications for muscle function. J Physiol1998b;512(Pt 2):603–14.
Magid A, Law DJ. Myofibrils bear most of the resting tension in frog skeletal-muscle.Science 1985;230:1280–2.
Magnusson SP, Simonsen EB, Aagaard P, Gleim GW, McHugh MP, Kjaer M.Viscoelastic response to repeated static stretching in the human hamstringmuscle. Scand J Med Sci Sports 1995;5:342–7.
Mizuno T, Matsumoto M, Umemura Y. Viscoelasticity of the muscle-tendon unit isreturned more rapidly than range of motion after stretching. Scand J Med SciSports 2013;23:23–30.
Morse CI, Degens H, Seynnes OR, Maganaris CN, Jones DA. The acute effect ofstretching on the passive stiffness of the human gastrocnemius muscle tendonunit. J Physiol (Lond) 2008;586:97–106.
Munro B. Statistical methods for health care research. 3rd ed. New York:Lippincott; 1997.
Nakamura M, Ikezoe T, Takeno Y, Ichihashi N. Acute and prolonged effect of staticstretching on the passive stiffness of the human gastrocnemius muscle tendonunit in vivo. J Orthop Res 2011;29:1759–63.
Nakamura M, Ikezoe T, Takeno Y, Ichihashi N. Time course of changes in passiveproperties of the gastrocnemius muscle-tendon unit during 5 min of staticstretching. Man Ther 2013;18:211–5.
Nordez A, Gennisson JL, Casari P, Catheline S, Cornu C. Characterization of musclebelly elastic properties during passive stretching using transient elastography. JBiomech 2008;41:2305–11.
Proske U, Morgan DL. Do cross-bridges contribute to the tension during stretch ofpassive muscle? J Muscle Res Cell M 1999;20:433–42.
Rhea MR. Determining the magnitude of treatment effects in strength trainingresearch through the use of the effect size. J Strength Cond Res 2004;18:918–20.
Rowe RW. Morphology of perimysial and endomysial connective tissue in skeletalmuscle. Tissue Cell 1981;13:681–90.
Rubini EC, Costa AL, Gomes PS. The effects of stretching on strength performance.Sports Med 2007;37:213–24.
Ryan ED, Thompson BJ, Herda TJ, Sobolewski EJ, Costa PB, Walter AA, et al. Therelationship between passive stiffness and evoked twitch properties: theinfluence of muscle CSA normalization. Physiol Meas 2011;32:677–86.
Seynnes OR, Maganaris CN, de Boer MD, di Prampero PE, Narici MV. Early structuraladaptations to unloading in the human calf muscles. Acta Physiol (Oxf)2008;193:265–74.
Simic L, Sarabon N, Markovic G. Does pre-exercise static stretching inhibit maximalmuscular performance? A meta-analytical review. Scand J Med Sci Sports2013;23:131–48.
Taylor DC, Dalton Jr JD, Seaber AV, Garrett Jr WE. Viscoelastic properties of muscle-tendon units. The biomechanical effects of stretching. Am J Sports Med1990;18:300–9.
Trombitas K, Greaser M, French G, Granzier H. PEVK extension of human soleusmuscle titin revealed by immunoelectron microscopy with the anti-titinantibody 9D10. Biophys J 1998;74:7. A155-A.
Wolf SL, Kim JH. Morphological analysis of the human tibialis anterior and medialgastrocnemius muscles. Acta Anat (Basel) 1997;158:287–95.
Emiliano Cè was born in Italy in 1976. He receivedthe Degree in Sport Sciences from the University ofMilan (Italy) in 2002. He achieved his PhD inMorphological Sciences (2007) at the University ofMilan (Italy). He received the BSc in Osteopathy fromthe University of Wales (Wales, UK) in 2010. Presentposition: Assistant Professor by the Department ofBiomedical Sciences for Health of the University ofMilan (Italy). His research interests are addressed tothe study of muscle biological signals, in particularforce, surface electromyogram (EMG) andmechanomyogram (MMG), in muscle during volun-tary or stimulated contractions in different physio-logical models (fatigue, training, temperature, etc.).
Currently his scientific activity is focused on the properties of the muscle-tendonunit mechanical model and the possibility to monitor the motor unit activation
strategy by the analysis of force, EMG and MMG signals. He is a member of theItalian Society of Sport Sciences (SISMES).
478 E. Cè et al. / Journal of Electromyography and Kinesiology 25 (2015) 469–478
Stefano Longo was born in Italy in 1977. He receivedthe Degree in Sport Science at the University of Milan(Italy) in 2004. He achieved his PhD in PhysicalActivity and Health (2009) at the University of Milan.He has been a visiting PhD student (2006–2008) at theManchester Metropolitan University (UK). Currentposition: Assistant Professor at the Department ofBiomedical Sciences for Health, University of Milan.His main research area concerns the adaptations of themuscle-tendon unit to resistance training andstretching, with the main focus on modifications ofmuscle architecture and stiffness. He is a member ofthe European College of Sport Science (ECSS) and theItalian Society of Sport Sciences (SISMES).
Susanna Rampichini graduated in PhysicalEducation from Istituto Superiore di EducazioneFisica di Milano, Italy in 1998 and in BiomedicalEngineering from Politecnico di Milano (Italy) in2003. She is the technician at the laboratory ofExercise physiology of the Department of Sport,Nutrition and Health Sciences of the University ofMilan (Italy). She is interested in the neuromuscularcontrol and in signal processing. She is a member ofthe Italian Society of Sport Sciences (SISMES).
Michela Devoto received the B.Sc. in Sport Sciencesand Health from the University of Milan (Italy) in2012. She is actually a M.S. in Sport Sciences studentof the School of Sport Sciences of the University ofMilan (Italy).
Eloisa Limonta was born in Milan in 1979. Shegraduated in Exercise Sciences at the University ofMilan in 2002. She received his PhD in Sport andPhysical Activity in 2007 at University of Milan andshe is an Assistant Professor at the Department ofBiomedical Sciences for Health since 2005. Herresearch field is in Exercise Physiology and Trainingin Sports, with special interests in electrical andmechanical aspects of muscle contraction and inphysiological responses to different strength trainingmodalities.
Massimo Ventrurelli received the B.Sc Sport Sciencesfrom the University of Verona (Italy) in 2004, the M.S.in Sport Sciences from the University of Verona (Italy)in 2006. He achieved his PhD in TranslationalMedicine (2011) at the University of Verona (Italy).Present position: Assistant Professor by theDepartment of Biomedical Sciences for Health of theUniversity of Milan (Italy). He is a member of theItalian Society of Sport Sciences (SISMES) of theAmerican Physiological Society (APS), of the AmericanCollege of Sport Medicine (ACSM), of the AmericanGeriatrics Society, of the International Society of Agingand Physical Activity (ISAPA), and of the EuropeanCollege of Sport Science (ECSS).
Fabio Esposito was born in Vedano al Lambro(Milan, Italy) in 1963. He received his medical degreefrom the University of Milan in 1990 and the spe-cialization in Sports Medicine from the University ofBrescia in 1994. He worked as Assistant Professor atUniversity of Brescia, then joining the faculty atUniversity of Milan in 2003, where he is currentlyAssociate Professor of Physiology at the Departmentof Biomedical Sciences for Health. His research fieldis Human Physiology, with special interests in exer-cise physiology, muscle electro-mechanical behavior,pulmonary gas exchange, physiological responses toexercise training and exercise-induced cardiopro-tection. He is a member of the Physiological Society
of Italy (SIF), of the American Physiological Society (APS), of the American College ofSports Medicine (ACSM), and of the Italian Society of Sport Sciences (SISMES).
Copyright © 2022 FDOKUMEN