Osteocyte morphology in human tibiae of different bone pathologies with different bone mineral...
9
Osteocyte morphology in human tibiae of different bone pathologies with different bone mineral density — Is there a role for mechanosensing? ☆ Ruud P. van Hove a,b , Peter A. Nolte b , Aviral Vatsa a , Cornelis M. Semeins a , Philip L. Salmon c , Theo H. Smit d , Jenneke Klein-Nulend a, ⁎ a Department of Oral Cell Biology, ACTA-University of Amsterdam and VU University Amsterdam, Research Institute MOVE, Amsterdam, The Netherlands b Department of Orthopedics, Spaarne Hospital, Hoofddorp, The Netherlands c SkyScan N.V., Kontich, Belgium d Department of Physics and Medical Technology, VU University Medical Center, Research Institute MOVE, Amsterdam, The Netherlands abstract article info Article history: Received 27 January 2009 Revised 15 April 2009 Accepted 15 April 2009 Available online 3 May 2009 Edited by: T. Einhorn Keywords: Osteocyte Mechanosensing Bone mineral density 3D morphology Mechanical loading Matrix strains due to external loading are different in bones of different pathologies with different bone mineral density (BMD), and are likely sensed by the osteocytes, the putative bone mechanosensors. The mechanosensitivity of osteocytes appears to be strongly influenced by their morphology. In this study, we explored the possibility that osteocyte morphology might play a role in various bone pathologies with different BMD. Confocal laser scanning microscopy and nano-CT were used to quantitatively determine 3D morphology and alignment of osteocytes and osteocyte lacunae in human proximal tibial bone with relatively low (osteopenic), medium (osteoarthritic), and high (osteopetrotic) BMD. Osteopenic osteocytes were relatively large and round (lengths 8.9:15.6:13.4 μm), osteopetrotic osteocytes were small and discoid shaped (lengths 5.5:11.1:10.8 μm), and osteoarthritic osteocytes were large and elongated (lengths 8.4:17.3:12.2 μm). Osteopenic osteocyte lacunae showed 3.5 fold larger volume and 2.2 fold larger surface area than osteoarthritic lacunae, whereas osteopetrotic lacunae were 1.9 fold larger and showed 1.5 fold larger surface area than osteoarthritic lacunae. Osteopetrotic osteocyte lacunae had lower alignment than osteopenic and osteoarthritic lacunae as indicated by their lower degree of anisotropy. The differences in 3D morphology of osteocytes and their lacunae in long bones of different pathologies with different BMD might reflect an adaptation to matrix strain due to different external loading conditions. Moreover, since direct mechanosensing of matrix strain likely occurs by the cell bodies, the differences in osteocyte morphology and their lacunae might indicate differences in osteocyte mechanosensitivity. The exact relationship between osteocyte morphology and bone architecture, however, is complex and deserves further study. © 2009 Elsevier Inc. All rights reserved. Introduction Osteocytes reside within the lacunae and the canaliculi of the lacuno-canalicular network surrounded by bone matrix [1]. The lacunae contain the osteocyte cell bodies from which long, actin- rich slender cell processes (50–60 per cell) radiate through the canaliculi to the surrounding osteocytes, to the cells lining the bone surface, and to the extraosseous space [2,3]. Osteocytes are likely stimulated by mechanical loading of long bones resulting in mechan- ical deformation or strain of the perilacunar bone matrix and a loading-induced fluid flow through the lacuno-canalicular network [4,5]. Loading-induced strain and fluid flow have been shown to be independent mechanical stimuli for osteocytes [6]. Loading-induced fluid flow through the canalicular network results in a fluid shear stress at the osteocyte cell membrane [4]. In response to this fluid shear stress, osteocytes produce soluble factors which regulate osteoblast and osteoclast activity which affects bone remodeling [7–11]. External mechanical forces are known to influence cytoskeletal structure and thus the cellular shape [12]. Furthermore, cells are known to actively rearrange the organization and contractile activity of the cytoskeleton and redistribute their intracellular forces in response to mechanical loading [13]. Osteocytes appear to align in the principle mechanical loading direction on bone [14]. Significant differences in 3D morphology of single osteocytes in unidirectionally loaded fibulae and multidirectionally loaded calvariae bones of adult mice exist, which probably is an adaptation to the differences in physiological mechanical loading patterns in these bones [14]. Moreover, alignment of single osteocytes in fibular bone parallel to Bone 45 (2009) 321–329 ☆ Funding: This study is supported by the Foundation for Orthopedic Research Spaarne Hospital Hoofddorp, The Netherlands. ⁎ Corresponding author. Department of Oral Cell Biology, ACTA-VU University, Van der Boechorststraat 7, 1081 BT Amsterdam, The Netherlands. Fax: +31 20 4448683. E-mail address: [email protected] (J. Klein-Nulend). 8756-3282/$ – see front matter © 2009 Elsevier Inc. All rights reserved. doi:10.1016/j.bone.2009.04.238 Contents lists available at ScienceDirect Bone journal homepage: www.elsevier.com/locate/bone
Transcript of Osteocyte morphology in human tibiae of different bone pathologies with different bone mineral...

Bone 45 (2009) 321–329
Contents lists available at ScienceDirect
Bone
j ourna l homepage: www.e lsev ie r.com/ locate /bone
Osteocyte morphology in human tibiae of different bone pathologies with differentbone mineral density — Is there a role for mechanosensing?☆
Ruud P. van Hove a,b, Peter A. Nolte b, Aviral Vatsa a, Cornelis M. Semeins a, Philip L. Salmon c,Theo H. Smit d, Jenneke Klein-Nulend a,⁎a Department of Oral Cell Biology, ACTA-University of Amsterdam and VU University Amsterdam, Research Institute MOVE, Amsterdam, The Netherlandsb Department of Orthopedics, Spaarne Hospital, Hoofddorp, The Netherlandsc SkyScan N.V., Kontich, Belgiumd Department of Physics and Medical Technology, VU University Medical Center, Research Institute MOVE, Amsterdam, The Netherlands
☆ Funding: This study is supported by the FoundaSpaarne Hospital Hoofddorp, The Netherlands.⁎ Corresponding author. Department of Oral Cell Bio
der Boechorststraat 7, 1081 BT Amsterdam, The NetherlE-mail address: [email protected] (J. Klein-Nul
8756-3282/$ – see front matter © 2009 Elsevier Inc. Adoi:10.1016/j.bone.2009.04.238
a b s t r a c t
a r t i c l e i n f oArticle history:Received 27 January 2009Revised 15 April 2009Accepted 15 April 2009Available online 3 May 2009
Edited by: T. Einhorn
Keywords:OsteocyteMechanosensingBone mineral density3D morphologyMechanical loading
Matrix strains due to external loading are different in bones of different pathologies with different bonemineral density (BMD), and are likely sensed by the osteocytes, the putative bone mechanosensors. Themechanosensitivity of osteocytes appears to be strongly influenced by their morphology. In this study, weexplored the possibility that osteocyte morphology might play a role in various bone pathologies withdifferent BMD.Confocal laser scanning microscopy and nano-CT were used to quantitatively determine 3D morphology andalignment of osteocytes and osteocyte lacunae in human proximal tibial bone with relatively low(osteopenic), medium (osteoarthritic), and high (osteopetrotic) BMD.Osteopenic osteocytes were relatively large and round (lengths 8.9:15.6:13.4 μm), osteopetrotic osteocyteswere small and discoid shaped (lengths 5.5:11.1:10.8 μm), and osteoarthritic osteocytes were large andelongated (lengths 8.4:17.3:12.2 μm). Osteopenic osteocyte lacunae showed 3.5 fold larger volume and 2.2fold larger surface area than osteoarthritic lacunae, whereas osteopetrotic lacunae were 1.9 fold larger andshowed 1.5 fold larger surface area than osteoarthritic lacunae. Osteopetrotic osteocyte lacunae had loweralignment than osteopenic and osteoarthritic lacunae as indicated by their lower degree of anisotropy.The differences in 3D morphology of osteocytes and their lacunae in long bones of different pathologies withdifferent BMD might reflect an adaptation to matrix strain due to different external loading conditions.Moreover, since direct mechanosensing of matrix strain likely occurs by the cell bodies, the differences inosteocyte morphology and their lacunae might indicate differences in osteocyte mechanosensitivity. Theexact relationship between osteocyte morphology and bone architecture, however, is complex and deservesfurther study.
© 2009 Elsevier Inc. All rights reserved.
Introduction
Osteocytes reside within the lacunae and the canaliculi of thelacuno-canalicular network surrounded by bone matrix [1]. Thelacunae contain the osteocyte cell bodies from which long, actin-rich slender cell processes (50–60 per cell) radiate through thecanaliculi to the surrounding osteocytes, to the cells lining the bonesurface, and to the extraosseous space [2,3]. Osteocytes are likelystimulated by mechanical loading of long bones resulting in mechan-ical deformation or strain of the perilacunar bone matrix and aloading-induced fluid flow through the lacuno-canalicular network
tion for Orthopedic Research
logy, ACTA-VU University, Vanands. Fax: +31 20 4448683.end).
ll rights reserved.
[4,5]. Loading-induced strain and fluid flow have been shown to beindependent mechanical stimuli for osteocytes [6].
Loading-induced fluid flow through the canalicular networkresults in a fluid shear stress at the osteocyte cell membrane [4]. Inresponse to this fluid shear stress, osteocytes produce soluble factorswhich regulate osteoblast and osteoclast activity which affects boneremodeling [7–11]. External mechanical forces are known to influencecytoskeletal structure and thus the cellular shape [12]. Furthermore,cells are known to actively rearrange the organization and contractileactivity of the cytoskeleton and redistribute their intracellular forcesin response to mechanical loading [13]. Osteocytes appear to align inthe principle mechanical loading direction on bone [14]. Significantdifferences in 3D morphology of single osteocytes in unidirectionallyloaded fibulae and multidirectionally loaded calvariae bones of adultmice exist, which probably is an adaptation to the differences inphysiological mechanical loading patterns in these bones [14].Moreover, alignment of single osteocytes in fibular bone parallel to
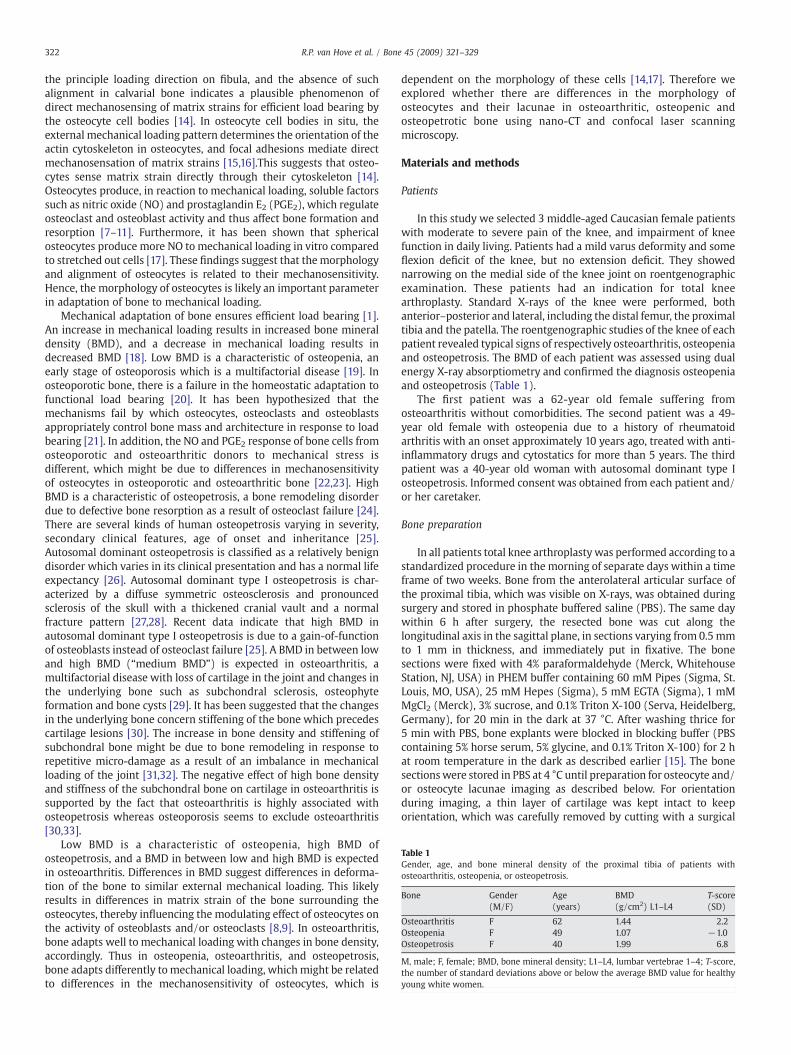
Table 1Gender, age, and bone mineral density of the proximal tibia of patients withosteoarthritis, osteopenia, or osteopetrosis.
Bone Gender(M/F)
Age(years)
BMD(g/cm2) L1–L4
T-score(SD)
Osteoarthritis F 62 1.44 2.2Osteopenia F 49 1.07 −1.0Osteopetrosis F 40 1.99 6.8
M, male; F, female; BMD, bone mineral density; L1–L4, lumbar vertebrae 1–4; T-score,the number of standard deviations above or below the average BMD value for healthyyoung white women.
322 R.P. van Hove et al. / Bone 45 (2009) 321–329
the principle loading direction on fibula, and the absence of suchalignment in calvarial bone indicates a plausible phenomenon ofdirect mechanosensing of matrix strains for efficient load bearing bythe osteocyte cell bodies [14]. In osteocyte cell bodies in situ, theexternal mechanical loading pattern determines the orientation of theactin cytoskeleton in osteocytes, and focal adhesions mediate directmechanosensation of matrix strains [15,16].This suggests that osteo-cytes sense matrix strain directly through their cytoskeleton [14].Osteocytes produce, in reaction to mechanical loading, soluble factorssuch as nitric oxide (NO) and prostaglandin E2 (PGE2), which regulateosteoclast and osteoblast activity and thus affect bone formation andresorption [7–11]. Furthermore, it has been shown that sphericalosteocytes produce more NO to mechanical loading in vitro comparedto stretched out cells [17]. These findings suggest that themorphologyand alignment of osteocytes is related to their mechanosensitivity.Hence, the morphology of osteocytes is likely an important parameterin adaptation of bone to mechanical loading.
Mechanical adaptation of bone ensures efficient load bearing [1].An increase in mechanical loading results in increased bone mineraldensity (BMD), and a decrease in mechanical loading results indecreased BMD [18]. Low BMD is a characteristic of osteopenia, anearly stage of osteoporosis which is a multifactorial disease [19]. Inosteoporotic bone, there is a failure in the homeostatic adaptation tofunctional load bearing [20]. It has been hypothesized that themechanisms fail by which osteocytes, osteoclasts and osteoblastsappropriately control bone mass and architecture in response to loadbearing [21]. In addition, the NO and PGE2 response of bone cells fromosteoporotic and osteoarthritic donors to mechanical stress isdifferent, which might be due to differences in mechanosensitivityof osteocytes in osteoporotic and osteoarthritic bone [22,23]. HighBMD is a characteristic of osteopetrosis, a bone remodeling disorderdue to defective bone resorption as a result of osteoclast failure [24].There are several kinds of human osteopetrosis varying in severity,secondary clinical features, age of onset and inheritance [25].Autosomal dominant osteopetrosis is classified as a relatively benigndisorder which varies in its clinical presentation and has a normal lifeexpectancy [26]. Autosomal dominant type I osteopetrosis is char-acterized by a diffuse symmetric osteosclerosis and pronouncedsclerosis of the skull with a thickened cranial vault and a normalfracture pattern [27,28]. Recent data indicate that high BMD inautosomal dominant type I osteopetrosis is due to a gain-of-functionof osteoblasts instead of osteoclast failure [25]. A BMD in between lowand high BMD (“medium BMD”) is expected in osteoarthritis, amultifactorial disease with loss of cartilage in the joint and changes inthe underlying bone such as subchondral sclerosis, osteophyteformation and bone cysts [29]. It has been suggested that the changesin the underlying bone concern stiffening of the bone which precedescartilage lesions [30]. The increase in bone density and stiffening ofsubchondral bone might be due to bone remodeling in response torepetitive micro-damage as a result of an imbalance in mechanicalloading of the joint [31,32]. The negative effect of high bone densityand stiffness of the subchondral bone on cartilage in osteoarthritis issupported by the fact that osteoarthritis is highly associated withosteopetrosis whereas osteoporosis seems to exclude osteoarthritis[30,33].
Low BMD is a characteristic of osteopenia, high BMD ofosteopetrosis, and a BMD in between low and high BMD is expectedin osteoarthritis. Differences in BMD suggest differences in deforma-tion of the bone to similar external mechanical loading. This likelyresults in differences in matrix strain of the bone surrounding theosteocytes, thereby influencing the modulating effect of osteocytes onthe activity of osteoblasts and/or osteoclasts [8,9]. In osteoarthritis,bone adapts well to mechanical loading with changes in bone density,accordingly. Thus in osteopenia, osteoarthritis, and osteopetrosis,bone adapts differently to mechanical loading, whichmight be relatedto differences in the mechanosensitivity of osteocytes, which is
dependent on the morphology of these cells [14,17]. Therefore weexplored whether there are differences in the morphology ofosteocytes and their lacunae in osteoarthritic, osteopenic andosteopetrotic bone using nano-CT and confocal laser scanningmicroscopy.
Materials and methods
Patients
In this study we selected 3 middle-aged Caucasian female patientswith moderate to severe pain of the knee, and impairment of kneefunction in daily living. Patients had a mild varus deformity and someflexion deficit of the knee, but no extension deficit. They showednarrowing on the medial side of the knee joint on roentgenographicexamination. These patients had an indication for total kneearthroplasty. Standard X-rays of the knee were performed, bothanterior–posterior and lateral, including the distal femur, the proximaltibia and the patella. The roentgenographic studies of the knee of eachpatient revealed typical signs of respectively osteoarthritis, osteopeniaand osteopetrosis. The BMD of each patient was assessed using dualenergy X-ray absorptiometry and confirmed the diagnosis osteopeniaand osteopetrosis (Table 1).
The first patient was a 62-year old female suffering fromosteoarthritis without comorbidities. The second patient was a 49-year old female with osteopenia due to a history of rheumatoidarthritis with an onset approximately 10 years ago, treated with anti-inflammatory drugs and cytostatics for more than 5 years. The thirdpatient was a 40-year old woman with autosomal dominant type Iosteopetrosis. Informed consent was obtained from each patient and/or her caretaker.
Bone preparation
In all patients total knee arthroplasty was performed according to astandardized procedure in the morning of separate days within a timeframe of two weeks. Bone from the anterolateral articular surface ofthe proximal tibia, which was visible on X-rays, was obtained duringsurgery and stored in phosphate buffered saline (PBS). The same daywithin 6 h after surgery, the resected bone was cut along thelongitudinal axis in the sagittal plane, in sections varying from 0.5 mmto 1 mm in thickness, and immediately put in fixative. The bonesections were fixed with 4% paraformaldehyde (Merck, WhitehouseStation, NJ, USA) in PHEM buffer containing 60 mM Pipes (Sigma, St.Louis, MO, USA), 25 mM Hepes (Sigma), 5 mM EGTA (Sigma), 1 mMMgCl2 (Merck), 3% sucrose, and 0.1% Triton X-100 (Serva, Heidelberg,Germany), for 20 min in the dark at 37 °C. After washing thrice for5 min with PBS, bone explants were blocked in blocking buffer (PBScontaining 5% horse serum, 5% glycine, and 0.1% Triton X-100) for 2 hat room temperature in the dark as described earlier [15]. The bonesectionswere stored in PBS at 4 °C until preparation for osteocyte and/or osteocyte lacunae imaging as described below. For orientationduring imaging, a thin layer of cartilage was kept intact to keeporientation, which was carefully removed by cutting with a surgical

Fig. 1. Maximal 2D projection of single osteocytes in osteoarthritic, osteopenic andosteopetrotic cortical bone of the proximal tibia using confocal laser scanningmicroscopy scans. (A) Osteoarthritic bone, showing relatively elongated osteocytes.(B) Osteopenic bone, showing relatively round osteocytes. (C) Osteopetrotic bone,showing relatively small and round osteocytes. All types of bone show the presence ofthe intercellular osteocyte network. Bar, 15 μm.
323R.P. van Hove et al. / Bone 45 (2009) 321–329
knife before nano-CT scanning and confocal laser scanning micro-scopy. The same bone preparation procedure was followed for theresected bone of each patient.
Osteocyte staining
For in situ imaging, the actin cytoskeleton of the osteocytes in thebone matrix was stained using Alexa 488 fluorescent phalloidin(Invitrogen, Eugene, OR, USA) for 24 h, as described previously [34],before confocal laser scanning microscopy.
Confocal laser scanning microscopy
Image acquisitionConfocal images of osteocytes were obtained by using BioRad
MRC-1000 UV Leica confocal system attached to a Leica invertedmicroscope (Leica Microsystems, Wetzlar, Germany). A Leica 63×water immersion objective was used with a numerical aperture of 1.2and a working distance of 170 μm. The bone sections were excited byusing a krypton/argon laser at 488 nm and the emissionwas collectedat 519 nm. Sequences of x–y optical slices were collected, separated by0.1 μm on the z-axis. Osteocytes in bone sections from osteoarthritic,osteopenic and osteopetrotic bone were scanned up to a depth (z-direction) of 10–30 μm with steps of 0.1 μm. Osteocyte length anddepth were measured in the x–y plane. Osteocyte width wasmeasured using maximal projection of a series of z-scans.
Post acquisition image processing: deconvolutionAll images were processed by means of an interactive maximum
likelihood estimation algorithm (Huygens II deconvolution software,Scientific Volume Imaging, Hilversum, The Netherlands, http://www.svi.nl) running on Octane and Origin 300 Computers (SGI, MountainView, CA, USA). Deconvolution of a series of x–y optical slices, ‘z-stacks’, was done in order to achieve the very best resolution with thehighest degree of statistical confidence [35]. This processing improvesthe quality of blurry or noisy images in such a way that the structuresbecome sharper and clearer in an environment cleaned of noise,which in the end improves the quality of the 3D reconstruction to alarge extent.
3D reconstruction: surface renderingAfter deconvolution of the image z-stacks with the Huygens-II
software, the structures (osteocyte cell bodies) included in the imagefiles were 3D-reconstructed by using the Amira™ visualization/modeling software (Konrad Zuse Zentrum for Information Technol-ogy, Berlin, Germany, http://amira.zib.de; program distribution bywww.amiravis.com) [36]. Morphological measurements were carriedout by using Amira™ visualization/modeling software.
Nano-computed tomographic scanning
From two sections of the resected bone of the proximal tibia ofeach patient, a piece of bone of approximately 3×1×0.75 mm in sizewas cut and mounted onto a nano-CT stage and a standardized conebeam nano-CT scan was performed using a high-resolution nano-CTsystem (SkyScan 2011, SkyScan N.V., Kontich, Belgium). Isotropicvoxel sizes for the scans were 580 nm. The applied X-ray voltage was25 kV and no filter was used. After standardized reconstruction by amodified Feldkamp algorithm [37], using SkyScan NRecon software,the data sets for each bone section were analyzed using SkyScan CT-analyzer software. Volumes of interest (VOI) of 200 layers wereselected in each of the six sections from cortical bone regions. Bonesections from osteoarthritic, osteopenic and osteopetrotic bone werescanned with a region of interest of 200 slices of 580 nm thickness.The number of osteocyte lacunae in the total volume of interest wasmeasured, from which osteocyte lacunae density was calculated.

Fig. 2. 3D reconstruction of single osteocytes in osteoarthritic, osteopenic andosteopetrotic cortical bone of the proximal tibia using confocal laser scanningmicroscopy scans. (A) Osteoarthritic bone, showing relatively elongated osteocytes.(B) Osteopenic bone, showing relatively large, round osteocytes. (C) Osteopetroticbone, showing relatively small, round osteocytes. Bar in x, y and z-direction, 20 μm.
324 R.P. van Hove et al. / Bone 45 (2009) 321–329
Osteocyte lacunae that were clearly visible in the reconstructedimages were converted into discrete binary objects by inversebinarization combined with image filtering steps such as despecklingto remove noise. Volume and surface area of each osteocyte lacunawere measured. To assess the alignment of osteocyte lacunae in bone,the degree of anisotropy was measured. A spherical volume of interestwas selected with a diameter of 160 pixels, spanning 93 μm, centeredin the initial volume of interest, to exclude artifacts. The degree ofanisotropy of a single osteocyte lacuna in osteoarthritic, osteopenicand osteopetrotic bone was measured by facet normal orientationdistribution using ANT™ software (SkyScan, Kontich, Belgium), whichcreates surface rendered 3D models based on algorithms such asMarching Cubes [38] and adaptive rendering (SkyScan). The degree ofanisotropy of osteocyte lacunae in the volume of interest wasmeasured by using the mean intercept length (MIL), which isequivalent to alignment of the osteocyte lacunae.
Statistics
Statistical analysis was performed using Kyplot (KyensLab Inc.,Tokyo, Japan). Mean values of the morphological parameters length,width, and depth, from individual osteocytes, as well as the meanvalues of volume and surface from individual osteocyte lacunae werecalculated and statistically analyzed using one-way analysis ofvariance (ANOVA) to compare osteoarthritic, osteopenic, and osteo-petrotic bone. Student's t-test was used to compare themean values ofwidth, length, and depth of osteocytes and volume and surface area ofosteocyte lacunae in osteoarthritic, osteopenic, and osteopetroticbone individually. Differences were considered significant if pb0.05.
Results
Confocal laser scanning microscopy of osteocytes in bone sectionsfrom osteoarthritic, osteopenic and osteopetrotic bone was per-formed. The maximal projection high-resolution optical slices of theconfocal z-series scan showed relatively elongated osteocytes inosteoarthritic bone (Fig. 1A), relatively large and round osteocytes inosteopenic bone (Fig. 1B) and relatively small and round osteocytes inosteopetrotic bone (Fig. 1C).
The 3D reconstructed images of single osteocytes supported theresults of the maximal projection high-resolution optical slices of theconfocal z-series and showed relatively elongated osteocytes inosteoarthritic bone (Fig. 2A), relatively large and spherical osteocytesin osteopenic bone (Fig. 2B), and relatively small and sphericalosteocytes in osteopetrotic bone (Fig. 2C).
One-way analysis of variance showed significant differencesbetween osteoarthritic, osteopenic and osteopetrotic bone for width,length, and depth of osteocytes measured by confocal laser scanningmicroscopy and volume and surface area of osteocyte lacunaemeasured by nano-CT scanning (Table 2).
In osteopetrotic bone, the width of osteocytes was 1.5 fold lowercompared to osteoarthritic bone, and 1.6 fold lower compared to
Table 2One-way analysis of variance of morphological parameters of osteocytes and osteocytelacunae in osteoarthritic, osteopenic, and osteopetrotic bone.
Parameter SS d.f. F p
Ocy width 813.1 110 24.6 b0.001Ocy length 1986.8 110 33.0 b0.001Ocy depth 1312.8 110 5.9 b0.01Lac volume 23.4×10⁶ 2475 211.7 b0.001Lac surface 26.1×10⁶ 2475 160.8 b0.001Lac S/V 498.9 2475 213.3 b0.001
Ocy, osteocyte; Lac, osteocyte lacuna; S/V, surface to volume ratio; SS, total sum ofsquares; d.f., total degrees of freedom; F, Fisher's distribution is the variance of thegroup means divided by the mean of the within-group variances; p, p-value.

Fig. 3. Dimensions and ratio lengths of osteocytes in osteoarthritic, osteopenic and osteopetrotic cortical bone of the proximal tibia measured by confocal laser microscopy scans and3D reconstruction. (A) PET bone showed a lower osteocytewidth compared toOA andOP bone. (B) PET bone showed a shorter osteocyte length compared to OAbone andOP bone. (C)OP bone showed a higher osteocyte depth than PET bone. (D) The length-to-width ratio of osteocytes is smaller in OP bone compared to OA bone. The width-to-depth ratio ofosteocytes is higher in PET bone compared toOAbone. The length-to-width and the depth-to-width ratio of osteocytes is smaller in OP bone compared to PET bone. Data are presentedas mean±SEM. Ocy, osteocyte; OA, osteoarthritic; OP, osteopenic; PET, osteopetrotic. aSignificantly different from OA, pb0.05. bSignificantly different from PET, pb0.05.
325R.P. van Hove et al. / Bone 45 (2009) 321–329
osteopenic bone. Osteocyte width was similar in osteoarthritic andosteopenic bone (Fig. 3A, Table 3). Osteocyte length was measuredsimilarly as osteocyte width, using maximal projection of a series of z-scans. In osteopetrotic bone, the length of osteocytes was 1.5 foldlower compared to osteoarthritic bone, and 1.4 fold lower compared toosteopenic bone. Osteocyte length was similar in osteoarthritic andosteopenic bone (Fig. 3B, Table 3). Osteocyte depth was measuredusing 3D reconstruction of a series of z-scans. Osteocyte depth inosteopetrotic bone was 1.2 fold lower compared to osteopenic boneand osteoarthritic bone (Fig. 3C, Table 3). The width-to-length-to-depth ratio was calculated by dividing the length and depth of eachosteocyte by its width to describe the osteocyte's morphology. Inosteopetrotic bone, the width-to-length ratio of osteocytes wassimilar compared to osteoarthritic bone and 1.2 fold higher comparedto osteopenic bone. The width-to-length ratio of osteocytes inosteopenic bone was 1.3 fold lower compared to osteoarthritic bone.In osteopetrotic bone, the width-to-depth ratio of osteocytes was 1.4
Table 3Morphological parameters of osteocytes in osteoarthritic, osteopenic, and osteopetroticcortical bone of the proximal tibia.
Bone Number ofosteocytes
Width(μm)
Length(μm)
Depth(μm)
Osteoarthritis 37 8.4±0.4 17.3±0.7 12.2±0.6Osteopenia 36 8.9±0.4a 15.6±0.4a 13.4±0.6a
Osteopetrosis 38 5.5±0.3b 11.1±0.5b 10.8±0.4
Data are presented as mean±SEM for the entire population of osteocytes.a Significantly different from PET, pb0.05.b Significantly different from OA, pb0.05.
fold higher compared to osteoarthritic and osteopenic bone. Hence,osteocytes in osteopenic bone were relatively round (ratio lengths1:1.8:1.6), those in osteopetrotic bone more discoid shaped (ratiolengths 1:2.2:2.2), and in osteoarthritic bone rather elongated (ratiolengths 1:2.3:1.6) (Fig. 3D).
Nano-CT scans of bone sections from osteoarthritic, osteopenic andosteopetrotic bone revealed that osteoarthritic bone showed thehighest osteocyte lacunae density and osteopenic bone the lowest,while the value for osteocyte lacunae density in osteopetrotic bonewas intermediate, i.e. between the values measured for osteoarthriticand osteopenic bone (Table 4).
The 3D nano-CT scan images showed relatively small, alignedosteocyte lacunae in osteoarthritic bone (Fig. 4A), and large, alignedosteocyte lacunae in osteopenic bone (Fig. 4B). In osteopetrotic bone,the osteocyte lacunae were intermediate sized, without any obviousalignment in any direction (Fig. 4C).
Table 4Osteocyte lacunae density in osteoarthritic, osteopenic, and osteopetrotic cortical boneof the proximal tibia.
Bone Osteocyte lacunaedensity (×103/mm3)
Number ofosteocyte lacunae
Total VOI(×10−3 mm3)
Osteoarthritis 21.8±4.0 659±70 30.6±0.8Osteopenia 8.0±0.5 120.5±30.3 14.4±3.1Osteopetrosis 15.6±3.4 458.5±5.8 32.2±4.6
The mean osteocyte lacunae density was calculated from the number of osteocytelacunae measured per bone volume of interest using nano-CT scanning in two samplesof each bone type. Data are presented as mean±SEM. VOI, bone volume of interest.

Fig. 4. 3D reconstruction of osteocyte lacunae in osteoarthritic, osteopenic andosteopetrotic cortical bone of the proximal tibia using nano-CT scanning. (A)Osteoarthritic bone, showing relatively small, aligned osteocyte lacunae. (B) Osteopenicbone, showing relatively large, aligned osteocyte lacunae. (C) Osteopetrotic bone,showing relatively intermediate sized osteocyte lacunae without any obviousalignment. Bar, 15 μm.
326 R.P. van Hove et al. / Bone 45 (2009) 321–329
The mean volume of single osteocyte lacunae in osteopenic andosteopetrotic bone was respectively 3.5 and 1.9 fold larger comparedto osteoarthritic bone, and that in osteopenic bone 1.8 fold largercompared to osteopetrotic bone (Fig. 5A, Table 5). The mean surfacearea of single osteocyte lacunae in osteopenic and osteopetrotic bonewas respectively 2.2 and 1.5 fold larger compared to osteoarthriticbone, and that in osteopenic bone 1.5 fold larger compared toosteopetrotic bone (Fig. 5B, Table 5). The surface area-to-volume ratioof osteocyte lacunae in osteopenic bone compared to osteoarthriticand osteopetrotic bone was 1.8 respectively 1.2 fold lower, and that inosteopetrotic bone 1.2 fold lower compared to osteoarthritic bone(Fig. 5C).
The degree of anisotropy within the osteocyte lacunae ofosteoarthritic, osteopenic and osteopetrotic bone was measured
Fig. 5. Dimensions and surface area-to-volume ratio of osteocyte lacuna inosteoarthritic, osteopenic and osteopetrotic cortical bone of the proximal tibiameasured by nano-CT scanning. (A) Osteocyte lacuna volume is higher in OP and PETbone compared to OA bone. Osteocyte lacuna volume is higher in OP bone compared toPET bone. (B) Osteocyte lacuna surface is higher in OP and PET bone compared to OAbone. Osteocyte lacuna surface is higher in OP bone compared to PET bone. (C) Thesurface area-to-volume ratio (S/V ratio) of osteocyte lacuna is lower in OP and PET bonecompared to OA bone. The S/V ratio of osteocyte lacuna is lower in OP bone comparedto PET bone. Data are presented as mean±SEM. Ocy, osteocyte; OA, osteoarthritic; OP,osteopenic; PET, osteopetrotic. aSignificantly different fromOA, pb0.0001. bSignificantlydifferent from PET, pb0.0001.

Table 5Morphological parameters and alignment of osteocyte lacunae in osteoarthritic,osteopenic, and osteopetrotic cortical bone of the proximal tibia.
Bone Volume (μm3) Surface area (μm2) MIL (a.u.)
Osteoarthritis 51.2±2.2 94.6±2.8 2.8±0.1Osteopenia 179.1±15.6a,b 211.9±14.4a,b 3.1±0.8Osteopetrosis 97.6±4.5a 142.0±5.0a 1.8±0.3
Directional alignment of osteocyte lacunae was determined from their degree ofanisotropy by using nano-CT scanning. The degree of anisotropy was measured usingthe mean intercept length. Data are presented as mean±SEM for the entire populationof single osteocyte lacunae. MIL, mean intercept length; a.u., arbitrary units.
a Significantly different from OA, pb0.05.b Significantly different from PET, pb0.05.
Fig. 6. Degree of anisotropy within the osteocyte lacunae in osteoarthritic, osteopenicand osteopetrotic cortical bone measured by nano-CT scanning using ANT™ softwareand the mean intercept length. (A) The degree of anisotropy was 11% higher in OP bone,and 37% lower in PET bone compared to OA bone. (B) The mean intercept length wasslightly higher in OP bone, and lower in PET bone compared to OA bone. Data arepresented as mean±SEM. OA, osteoarthritic; OP, osteopenic; PET, osteopetrotic; MIL,mean intercept length; a.u., arbitrary units.
327R.P. van Hove et al. / Bone 45 (2009) 321–329
using ANT™ software within a volume of interest, described as asphere with a diameter of 160 pixels, spanning 93 μm, within theinitial region of interest, to exclude artifacts. Therewere no differencesin the degree of anisotropy between osteoarthritic, osteopenic andosteopetrotic bone using ANT™ software (Fig. 6A). In osteopenic boneand osteoarthritic bone, the MIL was 1.8 respectively 1.6 fold highercompared to osteopetrotic bone, and 1.1 fold lower in osteoarthriticbone compared to osteopenic bone (Fig. 6B, Table 5).
Discussion
Bone adapts to increased mechanical loading by an increase inbone density and to decreased mechanical loading by a decrease inbone density [18]. The apparent difference in bone density in patientswith osteopenia, osteopetrosis and osteoarthritis can be explainedamong others by a difference in adaptation tomechanical loading. Thissuggests a difference in mechanosensitivity of osteocytes in thesethree bone types, which might result from a difference in osteocytemorphology. We explored this possibility that osteocyte morphologymight play a role in various bone pathologies. Nano-CT and confocalmicroscopy demonstrated significant differences in osteocyte 3D-morphology in osteopenic, osteopetrotic and osteoarthritic bone i.e.osteocytes in osteoarthritic bone were relatively small and elongated,whereas osteocytes in osteopenic bone were relatively large andround, and osteocytes in osteopetrotic bone were relatively small andhad a round, discoid shape. Osteopenic bone showed large osteocytelacunae, whereas osteocyte lacunae in osteopetrotic bone weresmaller. The smallest osteocyte lacunae were found in osteoarthriticbone. Since the osteocyte cell body likely has a role in directmechanosensing of matrix strain and adapts its 3D-morphology tomechanical loading for efficient mechanosensing, differences in cellshape might reflect differences in osteocyte mechanosensitivity,which might relate to differences in BMD.
Although we observed a difference in morphology betweenosteocytes in osteoarthritic and osteopenic bone, there was littledifference in cell size in these two bone pathologies. However, wefound a significant difference in size of the osteocyte lacunae. Theseresults suggest a discrepancy in the size of the osteocyte and its lacunain osteopenic bone compared to osteoarthritic bone. This findingimplies that deformation of the bone matrix due to mechanicalloading, resulting in matrix strain, cannot be easily sensed byosteocytes in osteopenic bone [14]. When osteocytes are lessstimulated by mechanical loading they produce a.o. less NO andPGE2 which results in low osteoblast activity and high osteoclastactivity, and finally in low BMD and progressive bone loss [7–10]. Thismight be a cause of the progressive bone loss in osteopenia orosteoporosis due to osteoclast stimulation by osteocytes [9].
In a computational and experimental model, McGarry et al. [6]already showed that there are independent roles for fluid flow andstrain as mechanical stimuli, where fluid flow causes fluid shear stressat the osteocyte cell processes and matrix strains act on the cell body.High bone mineral density in osteopetrosis might be explained by a
narrow space between the osteocyte cell processes and the wall of thecanaliculi in which they extend. When bone is loaded, this causes arelatively high fluid shear stress on the osteocyte resulting inincreased signaling molecule production (nitric oxide, prostaglandins,etc), followed by stimulation of osteoblast differentiation andincreased osteogenesis, and finally narrowing of the space betweenthe osteocyte cell processes and the wall of the canaliculi in whichthey extend leading to increased bone mineral density. The samereasoning could be used inversely for osteopenia resulting inosteoporosis.
It is generally accepted that the surface area-to-volume ratio isinversely proportional to the size of an object. If the radius of differentobjects is the same, the surface area-to-volume ratio of these objectsprovides an indication for the morphology of an object. A sphericalobject for example, has the lowest surface area-to-volume ratio. Ourfindings show that the osteocyte lacunae of osteopenic bone are themost spherical and osteocyte lacunae of osteoarthritic bone are theleast spherical.
Looking critically at the data obtained by confocal laser scanningmicroscopy and nano-CT, and assuming that the volume of anosteocyte equals the volume of an ellipsoid geometrical figure (4/3×π×1/2l×1/2w×1/2d), the osteocyte volume calculated usingconfocal laser scanning microscopy data exceeds the volume of theosteocyte lacuna. This discrepancy can be ascribed to spatial intensityheterogeneity, which might be caused a.o. by photo-bleaching,fluorescence attenuation in depth (z-axis), image acquisition factorsand manual adjustment of the threshold of the acquired signal [39].These factors however do not affect our conclusion, since theosteocyte 3D morphology, as assessed by the ratio of the osteocytedimensions (length, width, and depth), is likely not affected oraffected to a similar extend in the three bone pathologies by thefactors causing this discrepancy. For example, the osteocyte 3Dmorphology could be affected by shrinkage during the period from

328 R.P. van Hove et al. / Bone 45 (2009) 321–329
bone isolation to fixation. Since the bone obtained from our patientswas treated according to the same protocol, the osteocytes would beaffected to a similar extend. Shrinkage however does not apply tomineralized tissue and therefore does not affect the morphology ofosteocyte lacunae nor the differences found between the three bonetypes.
In osteopenic bone we found low osteocyte lacuna density andlarge osteocyte lacunae compared to osteoarthritic and osteopetroticbone. Reduced osteocyte density in female patients with low BMDconsists with findings from a previous study by Mullender et al. [40].Previous studies on the size of osteocyte lacunae in osteoporosis usingtwo-dimensional sections produced contradictory results [41,42]. Astudy by McCreadie et al. using confocal microscopy did not showdifferences in osteocyte lacuna size in bone of womenwith amean ageof 80 years, with and without an osteoporotic fracture [43]. Theosteopenic bone we used for assessment of osteocyte lacuna size wasderived from a 49-year old female patient with rheumatoid arthritistreated with anti-inflammatory drugs such as corticosteroids andcytostatics. There were no patients with rheumatoid arthritis in thestudy of McCreadie et al. [43] and the age of the patient populationwas markedly higher than that of the patient in our study. Thereforeour results cannot be easily compared. Rheumatoid arthritis causeslocalized and generalized osteoporosis, and the use of corticosteroidsexaggerates the development of osteoporosis in 40% of the patientswith rheumatoid arthritis [44]. Therefore, the bone of the osteopenicpatient in our study is an excellent representation of bone that ischaracterized by low BMD. The bones of the osteoarthritic andosteopetrotic patient were typically representations of bone withmedium and high BMD respectively.
The patients in our study had similar characteristics regarding age,sex, ethnicity, comorbidities, alignment of the knee, pain andimpairment of knee function in daily living, which suggests similarexternal loading conditions. Thorp et al. showed that amongindividuals with mild radiographic osteoarthritis of the knee,symptomatic patients have significantly higher medial compartmentloads than asymptomatic patients [45]. A biomechanical componentto the distinction between symptomatic and asymptomatic radio-graphic osteoarthritis may be pathophysiologically important [45].Our patients were considered symptomatic, since they experiencedknee pain and impairment in daily life. We speculate that the similarexternal loading conditions of the proximal tibia in combination withdifferences in BMD in our patients suggests that the osteocytes areinherently different in osteopenic, osteoarthritic, and osteopetroticbone, which might alter their ability to sense mechanical stimuli.
To our knowledge this is the first study to use nano-CT scanning tovisualize and measure the size of osteocyte lacunae in humanosteoarthritic, osteopenic and osteopetrotic bone. Vatsa et al. [14]used nano-CT scanning to show a high degree of anisotropy, measuredby facet normal orientation distribution using ANT™ software (Sky-Scan) of osteocyte lacunae in mouse fibula compared to calvaria. Facetnormal orientation distribution correlates with the degree ofanisotropy within an osteocyte lacuna. It was concluded thatosteocytes align in the principal loading direction [14]. Using thesame measurement for the degree of anisotropy, we did not find adifference in the degree of anisotropy within osteocyte lacunae inosteopenic, osteopetrotic and osteoarthritic bone. However, when weused thewell knownmean intercept length asmeasurement of degreeof anisotropy [46], the osteocyte lacunae in osteopetrotic bone wereless aligned to the principal direction of loading compared to theosteocyte lacunae in osteopenic and osteoarthritic bone. This could beexplained by the high bone density in osteopetrotic bone whichresults in little deformation of bonematrix tomechanical loading [47].This suggests a relatively small matrix strain resulting from mechan-ical loading of bone. The relatively small matrix strain on osteocytes inresponse to mechanical loading of osteopetrotic bone could result in alower degree of anisotropy.
High BMD in autosomal dominant type I osteopetrosis correspondsto the round, discoid shape of osteocytes in osteopetrotic bone. Roundosteocytes have been shown to be much more sensitive for smallstrain than flat osteocytes [17]. Thus, osteocytes in osteopetrotic bonemight be more sensitive to mechanical loading and therefore producemore soluble factors such as NO which have been shown to inhibitosteoclast activity [9]. This increasedmechanosensitivity of osteocytesin autosomal dominant type I osteopetrosis could result in theimbalance in osteoblast/osteoclast activity leading to a high BMD inautosomal dominant type I osteopetrosis. This is supported by studiessuggesting that the LRP5/Wnt signaling pathway plays a key role inmechanosensing of bone [48]. In a studywith LRP5mutantmice it wasemphasized that LRP5 is required for normal proliferation andfunction of osteoblasts [49]. In autosomal dominant type I osteope-trosis a gain-of-function mutation in the LRP5 gene is found [50]. Intransgenic mice with a similar gain-of-function mutation, a lowerthreshold level of strain is required to induce a bone formationresponse after loading of the tibia [48].
A limitation of this study is the small number of subjects, which ispredominantly due to the relatively small number of middle-agedfemale patients with an indication for total knee arthroplasty. Theindication for total knee arthroplasty in middle-aged female patientswith a low bone mineral density is rare because osteoarthritis andosteopenia are common in the elderly but rarely coexist [30].Furthermore, autosomal dominant type I osteopetrosis is a raredisease and its prevalence is low [25]. This study was conducted aftervisual inspection of osteocytes in human iliac crest bone of ninepatients with high, low, and intermediate BMD, which clearly revealeddifferences in osteocytemorphology (data not shown). To support thisobservation we quantified the morphological differences in detail insubjects with typical signs of high, low, and intermediate BMD. SinceVatsa et al. [14] showed differences in osteocytemorphology inmousefibulae compared to calvariae and suggested that this was due to theprincipal direction of loading, we used subchondral cortical bonebiopsies of the articular surface of the proximal tibia taken at the samelocation and undergoing similar loading direction. Mechanical loadingof murine tibia showed that the cortical bone needs a higher load torespond with an increase in bone compared to the trabecular bone[51]. This suggests that trabecular bone is more responsive tomechanical loading and therefore osteocyte morphology in trabecularbone might be more relevant. However, after extended research of theliterature we could not find any information on the morphology ofosteocyte and osteocyte lacunae in trabecular bone.
In conclusion, we have demonstrated in subchondral cortical boneof the resected lateral articular surface of the proximal tibia obtainedfrom three patients with an indication for total knee arthroplasty anddifferent bone pathologies c.q. different BMD (osteoarthritis, osteo-penia, and osteopetrosis), that there are significant differences in themorphology of osteocytes as well as their lacunae. The differences in3D morphology of single osteocytes in bone with different BMD maybe an adaptation to the differences in matrix strain in these bones inresponse to similar external physiological mechanical loading. More-over, since direct mechanosensing of matrix strain likely occurs by thecell bodies, the differences in osteocyte morphology and their lacunaemight indicate differences in osteocyte mechanosensitivity. The exactrelationship between osteocyte morphology and bone architecture,however, is complex and deserves further study. This exploratorystudy shows, for the first time, a relationship between osteocytemorphology and bone architecture, which provides new insight andmight contribute to a better understanding of the cellular processesthat lead to different BMD in various bone pathologies.
Acknowledgments
Ruud van Hove received financial assistance from the Foundationof Orthopedic Research Spaarne Hospital Hoofddorp, The Netherlands.

329R.P. van Hove et al. / Bone 45 (2009) 321–329
Aviral Vatsa was funded by the Foundation for Fundamental Researchon Matter (FOM), The Netherlands (ALW/FOM/NWO project no.01FB28/2). The authors are grateful to Floris Wouterlood for his helpwith deconvolution and 3D reconstruction of confocal images.
References
[1] Burger EH, Klein-Nulend J. Mechanotransduction in bone—role of the lacuno-canalicular network. FASEB J 1999;13:S101–12 Suppl.
[2] Sugawara Y, Kamioka H, Honjo T, Tezuka K, Takano-Yamamoto T. Three-dimensional reconstruction of chick calvarial osteocytes and their cell processesusing confocal microscopy. Bone 2005;36:877–83.
[3] Kamioka H, Honjo T, Takano-Yamamoto T. A three-dimensional distribution ofosteocyte processes revealed by the combination of confocal laser scanningmicroscopy and differential interference contrast microscopy. Bone 2001;28:145–9.
[4] Cowin SC, Moss-Salentijn L, Moss ML. Candidates for the mechanosensory systemin bone. J Biomech Eng 1991;113:191–7.
[5] Nicolella DP, Moravits DE, Gale AM, Bonewald LF, Lankford J. Osteocyte lacunaetissue strain in cortical bone. J Biomech 2006;39:1735–43.
[6] McGarry JG, Klein-Nulend J, Mullender MG, Prendergast PJ. A comparison of strainand fluid shear stress in stimulating bone cell responses—a computational andexperimental study. FASEB J 2005;19:482–4.
[7] Klein-Nulend J, Van der Plas A, Semeins CM, Ajubi NE, Frangos JA, Nijweide PJ,Burger EH. Sensitivity of osteocytes to biomechanical stress in vitro. FASEB J1995;9:441–5.
[8] Vezeridis PS, Semeins CM, Chen Q, Klein-Nulend J. Osteocytes subjected topulsating fluid flow regulate osteoblast proliferation and differentiation. BiochemBiophys Res Commun 2006;348:1082–8.
[9] Tan SD, de Vries TJ, Kuijpers-Jagtman AM, Semeins CM, Everts V, Klein-Nulend J.Osteocytes subjected to fluid flow inhibit osteoclast formation and boneresorption. Bone 2007;41:745–51.
[10] Klein-Nulend J, Semeins CM, Ajubi NE, Nijweide PJ, Burger EH. Pulsating fluid flowincreases nitric oxide (NO) synthesis by osteocytes but not periosteal fibroblasts—correlation with prostaglandin upregulation. Biochem Biophys Res Commun1995;217:640–8.
[11] Bacabac RG, Smit TH, Mullender MG, Dijcks SJ, van Loon JJWA, Klein-Nulend J.Nitric oxide production by bone cells is fluid shear stress rate dependent. BiochemBiophys Res Commun 2004;315:823–9.
[12] Wang N, Butler JP, Ingber DE. Mechanotransduction across the cell-surface andthrough the cytoskeleton. Science 1993;260:1124–7.
[13] Chen CS, Tan J, Tien J. Mechanotransduction at cell–matrix and cell–cell contacts.Annu Rev Biomed Eng 2004;6:275–302.
[14] Vatsa A, Breuls RG, Semeins CM, Salmon PL, Smit TH, Klein-Nulend J. Osteocytemorphology in fibula and calvaria — is there a role for mechanosensing? Bone2008;43:452–8.
[15] Vatsa A, Semeins CM, Smit TH, Klein-Nulend J. Paxillin localisation in osteocytes—is it determined by the direction of loading? Biochem Biophys Res Commun 2008:1019–24.
[16] Ponik SM, Pavalko FM. Formation of focal adhesions on fibronectin promotes fluidshear stress induction of COX-2 and PGE2 release in MC3T3-E1 osteoblasts. J ApplPhysiol 2004;97:135–42.
[17] Bacabac RG, Mizuno D, Schmidt CF, Mackintosh FC, van Loon JJWA, Klein-Nulend J,Smit TH. Round versus flat: bone cell morphology, elasticity, and mechanosensing.J Biomech 2008;41:1590–8.
[18] Skerry TM. The response of bone to mechanical loading and disuse: fundamentalprinciples and influences on osteoblast/osteocyte homeostasis. Arch BiochemBiophys 2008;473:117–23.
[19] Assessment of fracture risk and its application to screening for postmenopausalosteoporosis. Report of a WHO Study Group. World Health Organ Tech Rep Ser1994;843:1–129.
[20] Mosley JR. Osteoporosis and bone functional adaptation: mechanobiologicalregulation of bone architecture in growing and adult bone, a review. J Rehabil ResDev 2000;37:189–99.
[21] Lanyon L, Skerry T. Postmenopausal osteoporosis as a failure of bone's adaptationto functional loading: a hypothesis. J Bone Miner Res 2001;16:1937–47.
[22] Bakker AD, Klein-Nulend J, Tanck E, Heyligers IC, Albers GH, Lips P, Burger EH.Different responsiveness to mechanical stress of bone cells from osteoporoticversus osteoarthritic donors. Osteoporos Int 2006;17:827–33.
[23] Sterck JG, Klein-Nulend J, Lips P, Burger EH. Response of normal andosteoporotic human bone cells to mechanical stress in vitro. Am J Physiol1998;274:E1113–20.
[24] Shapiro F, Glimcher MJ, HoltropME, Tashjian Jr AH, Brickley-Parsons D, Kenzora JE.Human osteopetrosis: a histological, ultrastructural, and biochemical study. J BoneJoint Surg Am 1980;62:384–99.
[25] Balemans W, Van Wesenbeeck L, Van Hul W. A clinical and molecular overview ofthe human osteopetroses. Calcif Tissue Int 2005;77:263–74.
[26] Bollerslev J, Mosekilde L. Autosomal dominant osteopetrosis. Clin Orthop Relat Res1993;294:45–51.
[27] Bollerslev J, Andersen Jr PE. Fracture patterns in two types of autosomal-dominantosteopetrosis. Acta Orthop Scand 1989;60:110–2.
[28] Andersen Jr PE, Bollerslev J. Heterogeneity of autosomal dominant osteopetrosis.Radiology 1987;164:223–5.
[29] Sarzi-Puttini P, Cimmino MA, Scarpa R, Caporali R, Parazzini F, Zaninelli A, Atzeni F,Canesi B. Osteoarthritis: an overview of the disease and its treatment strategies.Semin Arthritis Rheum 2005;35:1–10.
[30] Dequeker J, Mokassa L, Aerssens J. Bone density and osteoarthritis. J RheumatolSuppl 1995;43:98–100.
[31] Radin EL, Rose RM. Role of subchondral bone in the initiation and progression ofcartilage damage. Clin Orthop Relat Res 1986;213:34–40.
[32] Burr DB. Anatomy and physiology of the mineralized tissues: role in thepathogenesis of osteoarthrosis. Osteoarthr Cartil 2004;12(Suppl A):S20–30.
[33] Milgram JW, Jasty M. Osteopetrosis. A morphological study of twenty-one cases. JBone Joint Surg Am 1982;64:912–29.
[34] Small JV, Rottner K, Hahne P, Anderson KI. Visualising the actin cytoskeleton.Microsc Res Tech 1999;47:3–17.
[35] WallaceW, Schaefer LH, Swedlow JR. Aworkingperson's guide to deconvolution inlight microscopy. Biotechniques 2001;31:1076.
[36] Wouterlood FG. 3D reconstruction of neurons from multichannel confocal laserscanning image series. Curr Prot Neurosci 2005;2.8:2.8.1–2.8.16.
[37] Feldkamp LA, Davis LC, Kress JW. Practical cone-beam algorithm. J Opt Soc Am A1984;1:612–9.
[38] LorensenWE, Cline HE. Marching cubes: a high resolution 3D surface constructionalgorithm. Comput Graph (ACM) 1987;21:163–9.
[39] Lee SC, Bajcsy P. Intensity correction of fluorescent confocal laser scanningmicroscope images by mean-weight filtering. J Microsc 2006;221:122–36.
[40] Mullender MG, Tan SD, Vico L, Alexandre C, Klein-Nulend J. Differences inosteocyte density and bone histomorphometry between men and women andbetween healthy and osteoporotic subjects. Calcif Tissue Int 2005;77:291–6.
[41] Wright PH, Jowsey JO, Robb RA. Osteocyte lacunar area in normal bone,hyperparathyroidism, renal disease, and osteoporosis. Surg Forum 1978;29:558–9.
[42] Mullender MG, van der Meer DD, Huiskes R, Lips P. Osteocyte density changes inaging and osteoporosis. Bone 1996;18:109–13.
[43] McCreadie BR, Hollister SJ, Schaffler MB, Goldstein SA. Osteocyte lacuna size andshape in women with and without osteoporotic fracture. J Biomech 2004;37:563–72.
[44] Joffe I, Epstein S. Osteoporosis associated with rheumatoid arthritis: pathogenesisand management. Semin Arthritis Rheum 1991;20:256–72.
[45] Thorp LE, Sumner DR, Wimmer MA, Block JA. Relationship between pain andmedial knee joint loading in mild radiographic knee osteoarthritis. ArthritisRheum 2007;57:1254–60.
[46] Odgaard A. Three-dimensional methods for quantification of cancellous bonearchitecture. Bone 1997;20:315–28.
[47] Rice JC, Cowin SC, Bowman JA. On the dependence of the elasticity and strength ofcancellous bone on apparent density. J Biomech 1988;21:155–68.
[48] Johnson ML, Harnish K, Nusse R, Van Hul W. LRP5 and Wnt signaling: a unionmade for bone. J Bone Miner Res 2004;19:1749–57.
[49] Kato M, Patel MS, Levasseur R, Lobov I, Chang BH, Glass DA, Hartmann C, Li L,Hwang TH, Brayton CF, Lang RA, Karsenty G, Chan L. Cbfa1-independent decreasein osteoblast proliferation, osteopenia, and persistent embryonic eye vasculariza-tion in mice deficient in Lrp5, a Wnt coreceptor. J Cell Biol 2002;157:303–14.
[50] Van Wesenbeeck L, Cleiren E, Gram J, Beals RK, Benichou O, Scopelliti D, Key L,Renton T, Bartels C, Gong Y, WarmanML, De Vernejoul MC, Bollerslev J, Van Hul W.Six novel missense mutations in the LDL receptor-related protein 5 (LRP5) gene indifferent conditions with an increased bone density. Am J Hum Genet 2003;72:763–71.
[51] de Souza RL, Matsuura M, Eckstein F, Rawlinson SC, Lanyon LE, Pitsillides AA. Non-invasive axial loading of mouse tibiae increases cortical bone formation andmodifies trabecular organization: a new model to study cortical and cancellouscompartments in a single loaded element. Bone 2005;37:810–8.