Proteomic profiling of liver from Elaphe taeniura, a common ...
10
Proteomic profiling of liver from Elaphe taeniura, a common snake in eastern and southeastern Asia Liang Chen 1 , Hengchuan Xia 3 , Yiting Wang 2 , Keping Chen 3 , Lvgao Qin 3 , Bin Wang 3 , Qin Yao 3 , Jun Li 4 , Yuanqing He 3 and Ermi Zhao 1,5 1 Key Laboratory of Bio-resources and Eco-environment, College of Life Sciences, Sichuan University, Chengdu, Sichuan Province, China. 2 College of Athletic Sports, Yangzhou University, Yangzhou, Jiangsu Province, China. 3 Institute of Life Sciences, Jiangsu University, Zhenjiang, Jiangsu Province, China. 4 Center for Physics and Chemistry, Jiangsu University, Zhenjiang, Jiangsu Province, China. 5 Chengdu Institute of Biology, the Chinese Academy of Sciences, Chengdu, Sichuan Province, China. Abstract Snake liver has been implicated in the adaptation of snakes to a variety of habitats. However, to date, there has been no systematic analysis of snake liver proteins. In this study, we undertook a proteomic analysis of liver from the colubrid snake Elaphe taeniura using a combination of two-dimensional electrophoresis (2-DE) and matrix-assisted laser desorption/ionization time of flightmass spectrometry (MALDI-TOF MS). We also constructed a local protein sequence database based on transcriptome sequencing to facilitate protein identification. Of the 268 protein spots revealed by 2-DE 109 gave positive MS signals, 84 of which were identified by searching the NCBInr, Swiss-Prot and local databases. The other 25 protein spots could not be identified, possibly because their transcripts were not be stable enough to be detected by transcriptome sequencing. GO analysis showed that most proteins may be involved in binding, catalysis, cellular processes and metabolic processes. Forty-two of the liver proteins identified were found in other reptiles and in amphibians. The findings of this study provide a good reference map of snake liver proteins that will be useful in molecular investigations of snake physiology and adaptation. Keywords: 2D electrophoresis, Elaphe taeniura, MALDI-TOF mass spectrometry, protein. Received: November 14, 2012; Accepted: May 11, 2013. Introduction Proteomics has been widely used for the global analy- sis of protein profiles and has provided insights into mecha- nisms related to development, physiology and pathology (Yanes et al., 2007). Proteomic studies have been reported for various organisms, such asbacteria, mouse, rat, guinea pig (Cavia porcellus), worms (Nematoda), Leguminosae (Medicago sativa Linn), rice (Oryza sativa) and humans (Klose, 1975; O’Farrell, 1975; Scheele, 1975; Emmert- Buck et al., 2000; Kaji et al., 2000; Ahram et al., 2002; Li et al., 2003), as well as amphibians, e.g., the African clawed frog Xenopus laevis (Jelaso et al., 2005; Gillardin et al., 2009), and snakes (Campbell and Campbell,2001). Al- though proteomic analyses of venoms from more than 55 snake genera have been reported (Fry et al., 2003; Serrano et al., 2005; Menezes et al., 2006; Yanes et al., 2007; Fox and Serrano, 2008), to date there has been no proteomic analysis of snake tissues. Snakes are highly adapted to a variety of terrestrial, arboreal, semiaquatic and marine habitats (Conant and Col- lins,1991). This adaptability has been attributed to the de- velopment of a special metabolic system in snakes. The liver plays a major role in metabolism, including glycogen storage, red blood cell degradation, plasma protein synthe- sis, hormone production and detoxification (Dardevet et al., 2006; Reddy and Rao, 2006), and also contains dis- ease-associated proteins (Zeindl-Eberhart et al., 2001; Yokoyama et al., 2004). Recent studies have shown that snake liver has a strong metabolic capacity (Ladyman et al., 2003; Starck et al., 2004) that may have an important role ensuring survival in nature. Previous studies of snake liver have focused mainly on plasma proteins (Chiu and Lam,1994), as well as histological and biochemical analy- ses (Chiu and Wong, 1974; Wong and Chiu, 1979; Chang and Zheng, 2003); there have been no molecular biology or proteomic analyses. Genetics and Molecular Biology, 36, 3, 438-447 (2013) Copyright © 2013, Sociedade Brasileira de Genética. Printed in Brazil www.sbg.org.br Send correspondence to Ermi Zhao. Key Laboratory of Bio-Re- sources and Eco-environment, College of Life Sciences, Sichuan University, No.24 South Section 1, Yihuan Road, 610064 Chengdu, Sichuan Province, China. E-mail: [email protected]. Research Article
-
Upload
khangminh22 -
Category
Documents
-
view
0 -
download
0
Transcript of Proteomic profiling of liver from Elaphe taeniura, a common ...
Proteomic profiling of liver from Elaphe taeniura, a common snake in easternand southeastern Asia
Liang Chen1, Hengchuan Xia3, Yiting Wang2, Keping Chen3, Lvgao Qin3, Bin Wang3, Qin Yao3,
Jun Li4, Yuanqing He3 and Ermi Zhao1,5
1Key Laboratory of Bio-resources and Eco-environment, College of Life Sciences, Sichuan University,
Chengdu, Sichuan Province, China.2College of Athletic Sports, Yangzhou University, Yangzhou, Jiangsu Province, China.3Institute of Life Sciences, Jiangsu University, Zhenjiang, Jiangsu Province, China.4Center for Physics and Chemistry, Jiangsu University, Zhenjiang, Jiangsu Province, China.5Chengdu Institute of Biology, the Chinese Academy of Sciences, Chengdu, Sichuan Province, China.
Abstract
Snake liver has been implicated in the adaptation of snakes to a variety of habitats. However, to date, there has beenno systematic analysis of snake liver proteins. In this study, we undertook a proteomic analysis of liver from thecolubrid snake Elaphe taeniura using a combination of two-dimensional electrophoresis (2-DE) and matrix-assistedlaser desorption/ionization time of flightmass spectrometry (MALDI-TOF MS). We also constructed a local proteinsequence database based on transcriptome sequencing to facilitate protein identification. Of the 268 protein spotsrevealed by 2-DE 109 gave positive MS signals, 84 of which were identified by searching the NCBInr, Swiss-Prot andlocal databases. The other 25 protein spots could not be identified, possibly because their transcripts were not bestable enough to be detected by transcriptome sequencing. GO analysis showed that most proteins may be involvedin binding, catalysis, cellular processes and metabolic processes. Forty-two of the liver proteins identified were foundin other reptiles and in amphibians. The findings of this study provide a good reference map of snake liver proteinsthat will be useful in molecular investigations of snake physiology and adaptation.
Keywords: 2D electrophoresis, Elaphe taeniura, MALDI-TOF mass spectrometry, protein.
Received: November 14, 2012; Accepted: May 11, 2013.
Introduction
Proteomics has been widely used for the global analy-
sis of protein profiles and has provided insights into mecha-
nisms related to development, physiology and pathology
(Yanes et al., 2007). Proteomic studies have been reported
for various organisms, such asbacteria, mouse, rat, guinea
pig (Cavia porcellus), worms (Nematoda), Leguminosae
(Medicago sativa Linn), rice (Oryza sativa) and humans
(Klose, 1975; O’Farrell, 1975; Scheele, 1975; Emmert-
Buck et al., 2000; Kaji et al., 2000; Ahram et al., 2002; Li et
al., 2003), as well as amphibians, e.g., the African clawed
frog Xenopus laevis (Jelaso et al., 2005; Gillardin et al.,
2009), and snakes (Campbell and Campbell,2001). Al-
though proteomic analyses of venoms from more than 55
snake genera have been reported (Fry et al., 2003; Serrano
et al., 2005; Menezes et al., 2006; Yanes et al., 2007; Fox
and Serrano, 2008), to date there has been no proteomic
analysis of snake tissues.
Snakes are highly adapted to a variety of terrestrial,
arboreal, semiaquatic and marine habitats (Conant and Col-
lins,1991). This adaptability has been attributed to the de-
velopment of a special metabolic system in snakes. The
liver plays a major role in metabolism, including glycogen
storage, red blood cell degradation, plasma protein synthe-
sis, hormone production and detoxification (Dardevet et
al., 2006; Reddy and Rao, 2006), and also contains dis-
ease-associated proteins (Zeindl-Eberhart et al., 2001;
Yokoyama et al., 2004). Recent studies have shown that
snake liver has a strong metabolic capacity (Ladyman et al.,
2003; Starck et al., 2004) that may have an important role
ensuring survival in nature. Previous studies of snake liver
have focused mainly on plasma proteins (Chiu and
Lam,1994), as well as histological and biochemical analy-
ses (Chiu and Wong, 1974; Wong and Chiu, 1979; Chang
and Zheng, 2003); there have been no molecular biology or
proteomic analyses.
Genetics and Molecular Biology, 36, 3, 438-447 (2013)
Copyright © 2013, Sociedade Brasileira de Genética. Printed in Brazil
www.sbg.org.br
Send correspondence to Ermi Zhao. Key Laboratory of Bio-Re-sources and Eco-environment, College of Life Sciences, SichuanUniversity, No.24 South Section 1, Yihuan Road, 610064 Chengdu,Sichuan Province, China. E-mail: [email protected].
Research Article
In this report, we describe the first proteomic study of
snake liver using 2-DE and MALDI-TOF MS. The source
of liver was Elaphe taeniura (Cope, 1861; Pike et al.,
2008), a colubrid snake with a wide distribution in China,
Russian, Japan, India and southeastern Asia. Since there are
no reports on snake genomes, we also constructed a local
database of predicted protein sequences based on trans-
criptome sequencing data; this database significantly facili-
tated protein identification. A reference map of the E.
taeniura liver protein profile was successfully constructed
and 84 of 268 protein spots were identified.
Materials and Methods
Preparation
Adult E. taeniura were provided by Nanjing Jinlin
Snake Industry Co. Ltd. (Jiangsu province, China). After
anesthesia by an intraperitoneal injection of an overdose
(45 mg/kg) of sodium pentobarbital, we dissected the body
of snakes. Samples of the liver tissue were immediately
frozen in liquid nitrogen and stored at -70 °C until use. All
of the procedures conformed to ethical standards for the
treatment of animals and were designed to minimize animal
suffering. The protocol was approved by the ethics commit-
tee of the Laboratory for Animal Research Center at Jiang-
su University, China. All reagents were from Sigma unless
stated otherwise.
Protein sample preparation
Hepatic tissue (0.15 g) was homogenized with a pre-
cooled mortar and pestle in 1.5 mL of lysis buffer contain-
ing 7 M urea, 2 M thiourea and 4% Chaps followed by
sonication (twice) for 10 s on ice. The homogenate was
transferred to an Eppendorf tube and centrifuged (10,000 g,
20 min, 4 °C). Protein samples were treated with a 2-DE
clean-up kit (GE Healthcare), vacuum-dried and dissolved
in 120 �L of buffer A containing 7 M urea, 2 M thiourea,
4% Chaps, 0.2% Bio-Lyte pH 3-10 and 65 mM dithiotreitol
(DTT). The protein concentration was determined using the
Bradford assay with bovine serum albumin (BSA) as stan-
dard. The protein samples were stored at -20 °C for later
use.
Two-dimensional electrophoresis
Isoelectric focusing (IEF) was done using an IPGphor
focusing system (Bio-Rad) according to the manufacturer’s
instructions. IPG strips (linear pH 3-10 gradient; 17 cm)
were run at 20 °C. The protein sample (1.4 mg) was first
rehydrated in buffer using active rehydration (13 h with
50 V) in a total volume of 400 �L after which IEF was done
with a voltage gradient of 250 V (0.5 h), 1,000 V (1 h) and
10,000 V (5 h), and then continued for a total of 60 kVh at
10 kV. The focused strip was equilibrated for 15 min with
equilibration solution (6 M urea, 0.375 M Tris-HCl, pH 8.8,
20% (v/v) glycerol, 2% (w/v) SDS and 0.002% (w/v)
bromophenol blue) containing 2% (w/v) DTT and for an-
other 15 min with same solution containing 2.5% (w/v)
iodoacetamide. SDS-PAGE was done using 12% gels at
30 mA (constant) until the dye front reached the bottom of
the gel. The gel was stained with 0.1% coomassie brilliant
blue G-250 (Bio-SafeTM, Bio-Rad) and photographed with
a digital single lens reflex (Nikon D5000) and standard lens
(AF 50 mm f/1.4D).
In situ digestion
268 protein spots in the 2D gel that were detected by
coomassie brilliant blue staining were manually excised,
transferred to Eppendorf tubes and then destained, re-
duced, alkylated and digested with trypsin. Briefly, the gel
slices were immersed in double-distilled water, sonicated
(twice) for 10 min, washed with 100 mM NH4HCO3/ace-
tonitrile (1:1, v/v), dehydrated in acetonitrile and dried in
a Speedvac vacuum concentrator (Eppendorf AG, Ham-
burg, Germany). The protein slices were then reduced
with 10 mM DTT in 100 mM NH4HCO3 for 1 h at 56 °C
and then incubated with 40 mM iodoacetamide in 100 mM
NH4HCO3 for 45 min at room temperature. The protein
spots were washed sequentially with 25 mM ammonium
bicarbonate, 50% acetonitrile and 100% acetonitrile, and
then incubated overnight in 25 mM NH4HCO3 containing
20 �g of trypsin/mL at 37 °C (Liang et al., 2007; Qin et al.,
2009).
Mass spectrometry analysis
After digestion, the protein peptides were extracted
twice in 0.5% trifluoroacetic acid (TFA) and 2.5%
TFA/50% acetonitrile. A one microliter sample was then
spotted onto an MTP Anchor Chip board (Bruker) and ana-
lyzed with a MALDI-TOF mass spectrometer. Peptide
mass fingerprints of 1,000-4,000 Da were obtained. Stan-
dard peptides were used as external standards. The peak
value of the trypsin peptide and matrix were used as inter-
nal parameters (Kim et al., 2007).
Liver transcriptome of E. taeniura
The liver transcriptome of E. taeniura was sequenced
by Hanyu Biological Co., Ltd. (Shanghai, China). Briefly,
liver RNA was extracted and mRNA was purified by stan-
dard procedures followed by cDNA synthesis. RNA was
fragmented by incubation at 95 °C for 5 min and annealed
with biotinylated random primers that contained a Solexa
adapter sequence. The RNA fragments were then captured
with streptavidin coupled to biotinylated random primers.
Finally, a double-strand Solexa library was produced by
PCR amplification, with clean data being obtained from the
raw data using the FASTX software package. De novo as-
sembling was then done using the Velvet and Oases soft-
ware packages.
Chen et al. 439
Bioinformatics analysis
Open reading frames were identified by using an
in-house program based on ‘GetORF’ from EMBOSS
(Rice et al., 2000). Gene annotation was done by BLASTP
searching against the Swiss-Prot and GenBank databases
with an E value cutoff of 1e-3. The predicted proteins were
used to construct a local MASCOT protein database and to
analyze the peptide finger prints of snake liver proteins.
To identify the proteins, the MS fingerprints were
screened against the NCBInr and Swiss-Prot sequence da-
tabases with the search engine MASCOT. Unidentified
proteins were searched in a local database constructed spe-
cifically for this purpose. Fixed modification was set to be
carbamidomethyl (C) and variable modification was set to
be oxidation (M). The mass tolerance was set as � 0.2 to �
0.8 Da. The species were set as Chordata and a CI
score > 62 was considered to be a positive match.
The resulting protein sequences were aligned with
Interpro Scan to obtain the gene ontology (GO) identifica-
tions and the collected information was then analyzed by
WEGO (Ye et al., 2006).
Configuration and installation of local database
The Configuration Editor/Database Maintenance of
the MASCOT homepage was used for the custom database
configuration. In this process, the translated protein se-
quence in sequence directory file is parsed and compressed
by the MASCOT program, producing homonyms a00, i00,
s00 and a statistics database retrieval file in which the MS
data perform a retrieval step. Subsequently, the new data-
base name (cldata) was entered in the EST sequence file
path in the configuration page, options and parsing rules
were defined and applied to complete a new database defi-
nition. Details on the settings can be provided by the
authors on request.
Results
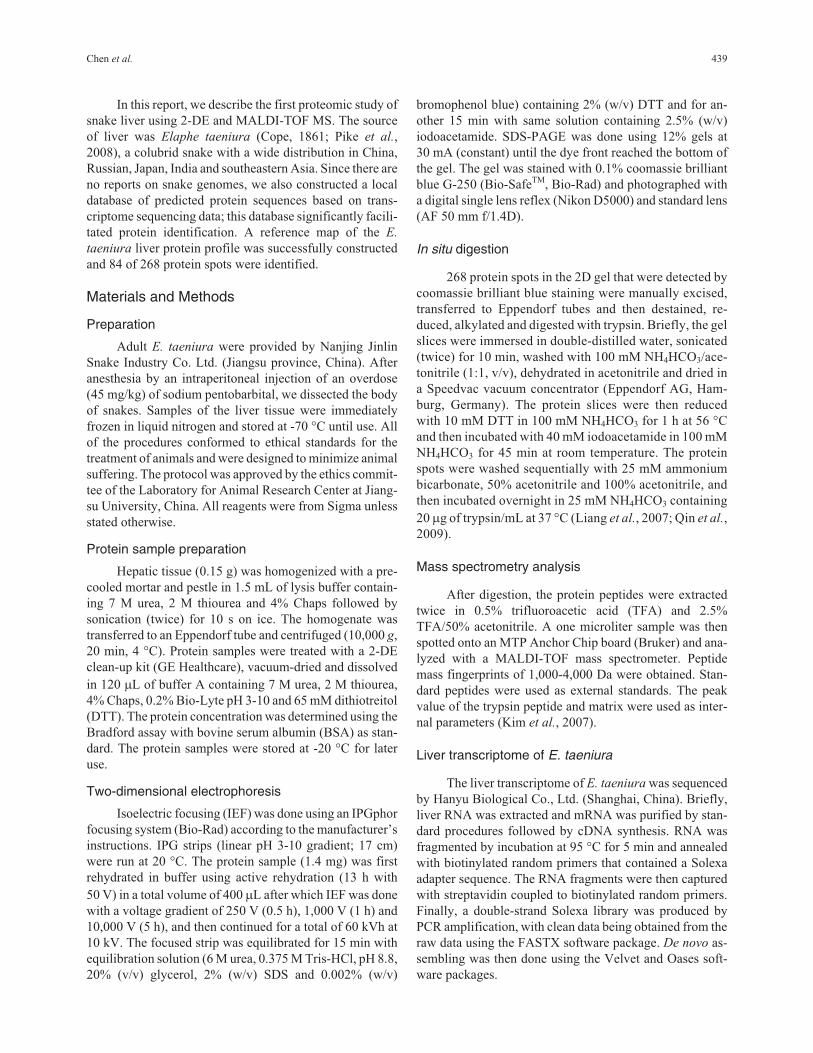
Protein profile of E. taeniura liver
Figure 1 shows a reference 2-DE map of E. taeniura
liver in which 268 spots were detected. The pIs of 196 pro-
tein spots ranged from 5 to 9 (73.1% of spots); 21 spots had
a pI < 4 (7.83% of spots) and 26 had a pI > 9 (9.7% of
spots). The molecular masses of most proteins were be-
tween 29 kDa and 97.2 kDa. 109 protein spots had a good
MS signal, 84 of which were identified. Of these 84 pro-
teins, 54 were represented in the NCBInr and Swiss-Prot
databases for Chordata and 30 were in the local database.
Table 1 summarizes the data for these proteins.
440 Proteomic profile of E. taeniura liver
Figure 1 - Two-dimensional electrophoretic reference map of E. taeniura liver. A total of 268 protein spots were observed, of which 109 gave a good MS
signal; 84 of the latter proteins were identified in subsequent analysis. A sample of liver protein (1.4 mg) was separated by IEF (linear pH gradient
from pH 3-10) and SDS-PAGE on a 12% polyacrylamide gel. Proteins were visualized by coomassie brilliant blue (CBB) G-250 staining. Expanded
views of spots 64, 66, 90, 91, 100 and 101 are shown on the right.
Chen et al. 441
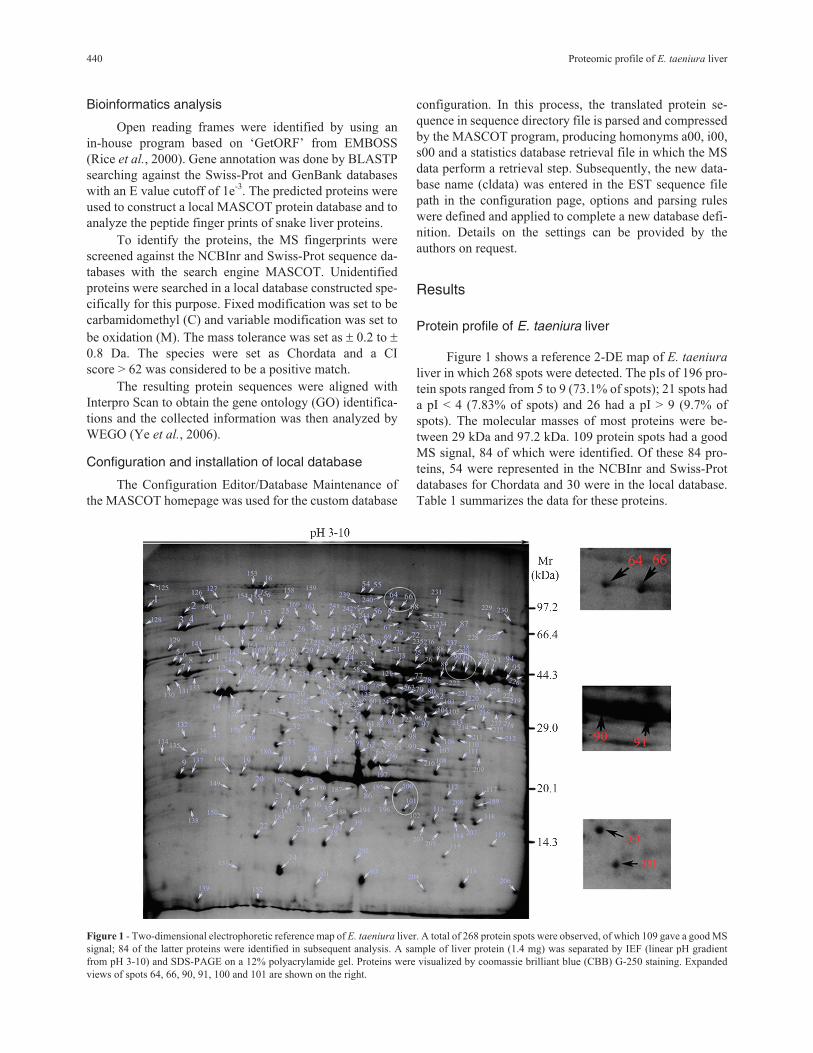
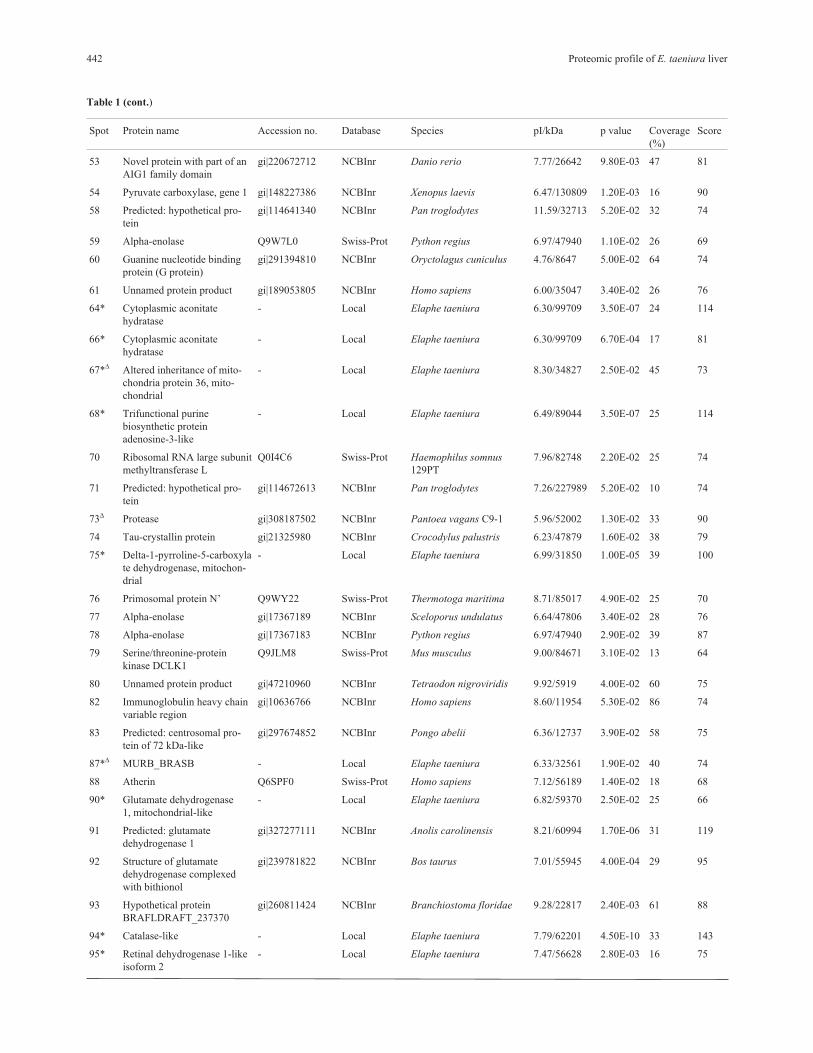
Table 1 - Proteins identified by MALDI-TOF mass spectrometry and MASCOT.
Spot Protein name Accession no. Database Species pI/kDa p value Coverage
(%)
Score
1 N-terminal plus middle do-
mains (N+m) of Grp94
gi|159794958 NCBInr Canis lupus familiaris 6.38/58167 5.40E-03 26 84
4 Hypothetical protein
BRAFLDRAFT_71661
gi|260823156 NCBInr Branchiostoma floridae 8.39/147395 5.40E-02 10 74
5 Heat shock protein HSP
90-�-like
gi|327278721 NCBInr Anolis carolinensis 4.98/84451 4.30E-09 36 146
6 Tubulin �-4 chain-like gi|327263983 NCBInr Anolis carolinensis 4.82/50080 2.70E-11 47 184
7 Mitochondrial ATP synthase
� subunit
gi|47575824 NCBInr Xenopus (Silurana)
tropicalis
5.38/56328 1.30E-06 38 120
8 Mitochondrial ATP synthase
� subunit
gi|148223359 NCBInr Xenopus laevis 5.25/56395 2.10E-10 44 158
9* Nicotinamide
N-methyltransferase-like
- Local Elaphe taeniura 5.10/32099 1.60E-04 29 82
12* Cytochrome �-c1 complex
subunit 1, mitochondrial-like
- Local Elaphe taeniura 5.64/53739 5.60E-08 33 122
13 Unnamed protein product gi|47207906 NCBInr Tetraodon nigroviridis 6.68/50199 7.40E-03 23 82
14 POTE ankyrin domain family
member F
A5A3E0 Swiss-Prot Homo sapiens 5.83/123020 3.80E-02 12 63
15 Actin, cytoplasmic type 5 gi|288541396 NCBInr Xenopus laevis 5.30/42165 4.60E-04 44 95
17 Heat shock cognate 71 kDa
protein-like
gi|74211333 NCBInr Anolis carolinensis 5.37/71027 5.90E-04 25 121
18 Heat shock protein60 kDa gi|296439571 NCBInr Mesocricetus auratus 4.73/29133 2.20E-02 33 78
19* Putative prohibitin variant 1 - Local Elaphe taeniura 5.59/31571 4.00E-03 38 74
20*� Hypothetical protein
VC0395_0781
- Local Elaphe taeniura 9.05/4233 3.30E-03 86 74
21* Thioredoxin-dependent per-
oxide reductase, mitochon-
drial-like
- Local Elaphe taeniura 8.72/28255 8.70E-03 28 70
24 Putative protein FAM157A C9JC47 Swiss-Prot Homo sapiens 11.26/43211 1.60E-02 32 67
25 Heat shock 70 kDa protein 9
(mortalin)
gi|148228693 NCBInr Xenopus laevis 5.68/72800 3.00E-03 19 86
27 40S ribosomal protein S6 P47838 Swiss-Prot Gallus gallus 10.83/28808 4.10E-02 37 63
28* 4-Trimethylaminobutyraldehy
de dehydrogenase-like
- Local Elaphe taeniura 8.66/41807 2.00E-05 36 96
29 Predicted: hypothetical pro-
tein
gi|194685097 NCBInr Bos taurus 9.03/183966 1.90E-02 16 78
30 Leucine-rich repeat and
coiled-coil domain-containing
protein 1
Q69ZB0 Swiss-Prot Mus musculus 5.67/120577 5.80E-03 19 72
31 Interleukin 15 receptor �
chain isoform 1A
gi|29028294 NCBInr Mus musculus 9.51/24907 5.30E-02 32 74
32 Predicted: low quality pro-
tein: prohibitin-like
gi|334323093 NCBInr Monodelphis domestica 5.57/29882 8.30E-03 37 82
35 Protein Wnt-2b Q98SN7 Swiss-Prot Gallus gallus 9.17/44464 1.80E-02 33 67
37* Heme oxygenase 1-like - Local Elaphe taeniura 9.26/36906 3.50E-09 46 134
39* Glutathione S-transferase
2-like
- Local Elaphe taeniura 5.63/17123 4.80E-05 46 93
40 2-Hydroxyacyl-CoA lyase 1 Q8CHM7 Swiss-Prot Rattus norvegicus 7.08/64431 4.30E-02 18 63
46 Keratin 10 gi|186629 NCBInr Homo sapiens 4.72/39832 4.10E-03 33 85
50 PMCA4 gi|170524482 NCBInr Caviaporcellus 7.66/36538 4.20E-02 34 75
52 Keratin, type II cytoskeletal 1 gi|119395750 NCBInr Homo sapiens 8.15/66170 4.30E-03 34 85
442 Proteomic profile of E. taeniura liver
Spot Protein name Accession no. Database Species pI/kDa p value Coverage
(%)
Score
53 Novel protein with part of an
AIG1 family domain
gi|220672712 NCBInr Danio rerio 7.77/26642 9.80E-03 47 81
54 Pyruvate carboxylase, gene 1 gi|148227386 NCBInr Xenopus laevis 6.47/130809 1.20E-03 16 90
58 Predicted: hypothetical pro-
tein
gi|114641340 NCBInr Pan troglodytes 11.59/32713 5.20E-02 32 74
59 Alpha-enolase Q9W7L0 Swiss-Prot Python regius 6.97/47940 1.10E-02 26 69
60 Guanine nucleotide binding
protein (G protein)
gi|291394810 NCBInr Oryctolagus cuniculus 4.76/8647 5.00E-02 64 74
61 Unnamed protein product gi|189053805 NCBInr Homo sapiens 6.00/35047 3.40E-02 26 76
64* Cytoplasmic aconitate
hydratase
- Local Elaphe taeniura 6.30/99709 3.50E-07 24 114
66* Cytoplasmic aconitate
hydratase
- Local Elaphe taeniura 6.30/99709 6.70E-04 17 81
67*� Altered inheritance of mito-
chondria protein 36, mito-
chondrial
- Local Elaphe taeniura 8.30/34827 2.50E-02 45 73
68* Trifunctional purine
biosynthetic protein
adenosine-3-like
- Local Elaphe taeniura 6.49/89044 3.50E-07 25 114
70 Ribosomal RNA large subunit
methyltransferase L
Q0I4C6 Swiss-Prot Haemophilus somnus
129PT
7.96/82748 2.20E-02 25 74
71 Predicted: hypothetical pro-
tein
gi|114672613 NCBInr Pan troglodytes 7.26/227989 5.20E-02 10 74
73� Protease gi|308187502 NCBInr Pantoea vagans C9-1 5.96/52002 1.30E-02 33 90
74 Tau-crystallin protein gi|21325980 NCBInr Crocodylus palustris 6.23/47879 1.60E-02 38 79
75* Delta-1-pyrroline-5-carboxyla
te dehydrogenase, mitochon-
drial
- Local Elaphe taeniura 6.99/31850 1.00E-05 39 100
76 Primosomal protein N’ Q9WY22 Swiss-Prot Thermotoga maritima 8.71/85017 4.90E-02 25 70
77 Alpha-enolase gi|17367189 NCBInr Sceloporus undulatus 6.64/47806 3.40E-02 28 76
78 Alpha-enolase gi|17367183 NCBInr Python regius 6.97/47940 2.90E-02 39 87
79 Serine/threonine-protein
kinase DCLK1
Q9JLM8 Swiss-Prot Mus musculus 9.00/84671 3.10E-02 13 64
80 Unnamed protein product gi|47210960 NCBInr Tetraodon nigroviridis 9.92/5919 4.00E-02 60 75
82 Immunoglobulin heavy chain
variable region
gi|10636766 NCBInr Homo sapiens 8.60/11954 5.30E-02 86 74
83 Predicted: centrosomal pro-
tein of 72 kDa-like
gi|297674852 NCBInr Pongo abelii 6.36/12737 3.90E-02 58 75
87*� MURB_BRASB - Local Elaphe taeniura 6.33/32561 1.90E-02 40 74
88 Atherin Q6SPF0 Swiss-Prot Homo sapiens 7.12/56189 1.40E-02 18 68
90* Glutamate dehydrogenase
1, mitochondrial-like
- Local Elaphe taeniura 6.82/59370 2.50E-02 25 66
91 Predicted: glutamate
dehydrogenase 1
gi|327277111 NCBInr Anolis carolinensis 8.21/60994 1.70E-06 31 119
92 Structure of glutamate
dehydrogenase complexed
with bithionol
gi|239781822 NCBInr Bos taurus 7.01/55945 4.00E-04 29 95
93 Hypothetical protein
BRAFLDRAFT_237370
gi|260811424 NCBInr Branchiostoma floridae 9.28/22817 2.40E-03 61 88
94* Catalase-like - Local Elaphe taeniura 7.79/62201 4.50E-10 33 143
95* Retinal dehydrogenase 1-like
isoform 2
- Local Elaphe taeniura 7.47/56628 2.80E-03 16 75
Table 1 (cont.)
Characteristics of the transcriptome assembly
DNA sequencing by Illumina HiSeq 2000 resulted in
a cDNA library containing 29,614,448 reads and
2,754,143,664 bases. The number of paired-end reads was
14,807,224, with an average length of 93 bp. A total of
88,907 contigs > 100 bp in size (which reflected the quality
of the data) was assembled using Velvet and Oases soft-
wares, and 23,285 predicted proteins had clear biological
annotations.
Protein identification and GO analysis
Of the 84 identified proteins, 42 were matched to am-
phibian and reptile protein sequence databases. Interest-
ingly, the amphibian and reptile databases contained no
information for the remaining 42 proteins, although there
were matches in databases of other species. The presence of
these protein spots in the 2D gel indicates that many snake
proteins remain to be identified. For instance, protein spot
74 was identified as tau-crystallin, a homologue of which
Chen et al. 443
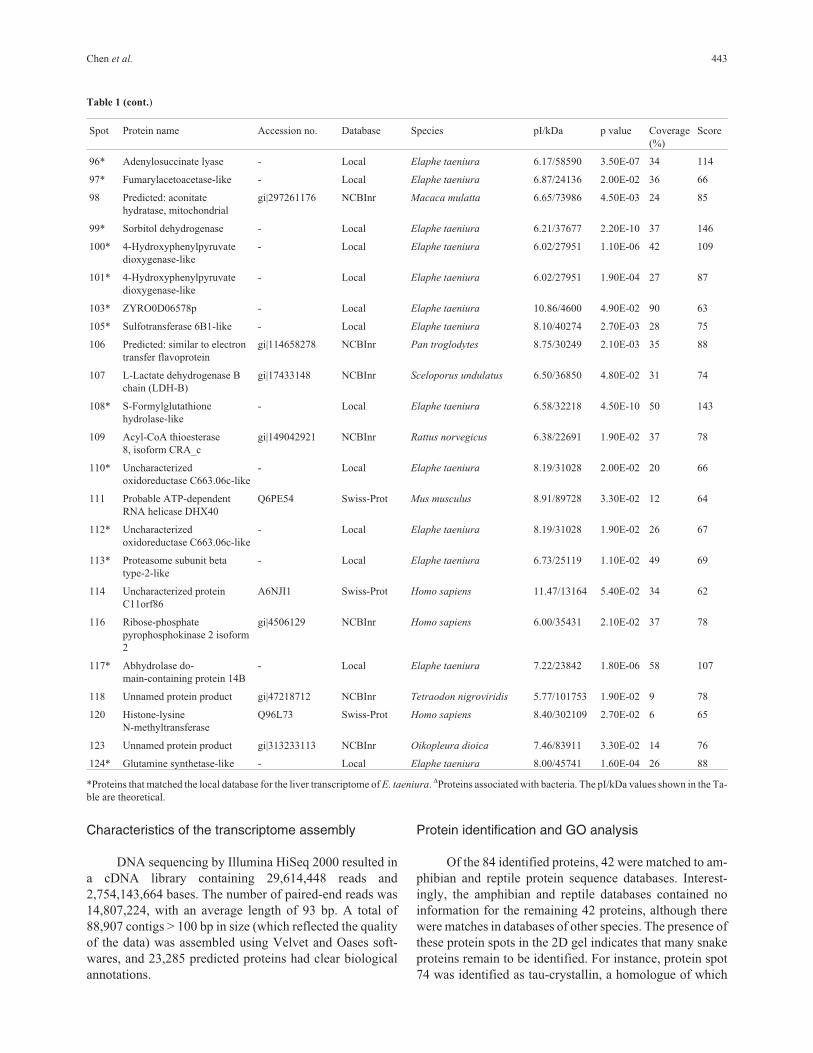
Spot Protein name Accession no. Database Species pI/kDa p value Coverage
(%)
Score
96* Adenylosuccinate lyase - Local Elaphe taeniura 6.17/58590 3.50E-07 34 114
97* Fumarylacetoacetase-like - Local Elaphe taeniura 6.87/24136 2.00E-02 36 66
98 Predicted: aconitate
hydratase, mitochondrial
gi|297261176 NCBInr Macaca mulatta 6.65/73986 4.50E-03 24 85
99* Sorbitol dehydrogenase - Local Elaphe taeniura 6.21/37677 2.20E-10 37 146
100* 4-Hydroxyphenylpyruvate
dioxygenase-like
- Local Elaphe taeniura 6.02/27951 1.10E-06 42 109
101* 4-Hydroxyphenylpyruvate
dioxygenase-like
- Local Elaphe taeniura 6.02/27951 1.90E-04 27 87
103* ZYRO0D06578p - Local Elaphe taeniura 10.86/4600 4.90E-02 90 63
105* Sulfotransferase 6B1-like - Local Elaphe taeniura 8.10/40274 2.70E-03 28 75
106 Predicted: similar to electron
transfer flavoprotein
gi|114658278 NCBInr Pan troglodytes 8.75/30249 2.10E-03 35 88
107 L-Lactate dehydrogenase B
chain (LDH-B)
gi|17433148 NCBInr Sceloporus undulatus 6.50/36850 4.80E-02 31 74
108* S-Formylglutathione
hydrolase-like
- Local Elaphe taeniura 6.58/32218 4.50E-10 50 143
109 Acyl-CoA thioesterase
8, isoform CRA_c
gi|149042921 NCBInr Rattus norvegicus 6.38/22691 1.90E-02 37 78
110* Uncharacterized
oxidoreductase C663.06c-like
- Local Elaphe taeniura 8.19/31028 2.00E-02 20 66
111 Probable ATP-dependent
RNA helicase DHX40
Q6PE54 Swiss-Prot Mus musculus 8.91/89728 3.30E-02 12 64
112* Uncharacterized
oxidoreductase C663.06c-like
- Local Elaphe taeniura 8.19/31028 1.90E-02 26 67
113* Proteasome subunit beta
type-2-like
- Local Elaphe taeniura 6.73/25119 1.10E-02 49 69
114 Uncharacterized protein
C11orf86
A6NJI1 Swiss-Prot Homo sapiens 11.47/13164 5.40E-02 34 62
116 Ribose-phosphate
pyrophosphokinase 2 isoform
2
gi|4506129 NCBInr Homo sapiens 6.00/35431 2.10E-02 37 78
117* Abhydrolase do-
main-containing protein 14B
- Local Elaphe taeniura 7.22/23842 1.80E-06 58 107
118 Unnamed protein product gi|47218712 NCBInr Tetraodon nigroviridis 5.77/101753 1.90E-02 9 78
120 Histone-lysine
N-methyltransferase
Q96L73 Swiss-Prot Homo sapiens 8.40/302109 2.70E-02 6 65
123 Unnamed protein product gi|313233113 NCBInr Oikopleura dioica 7.46/83911 3.30E-02 14 76
124* Glutamine synthetase-like - Local Elaphe taeniura 8.00/45741 1.60E-04 26 88
*Proteins that matched the local database for the liver transcriptome of E. taeniura. �Proteins associated with bacteria. The pI/kDa values shown in the Ta-
ble are theoretical.
Table 1 (cont.)
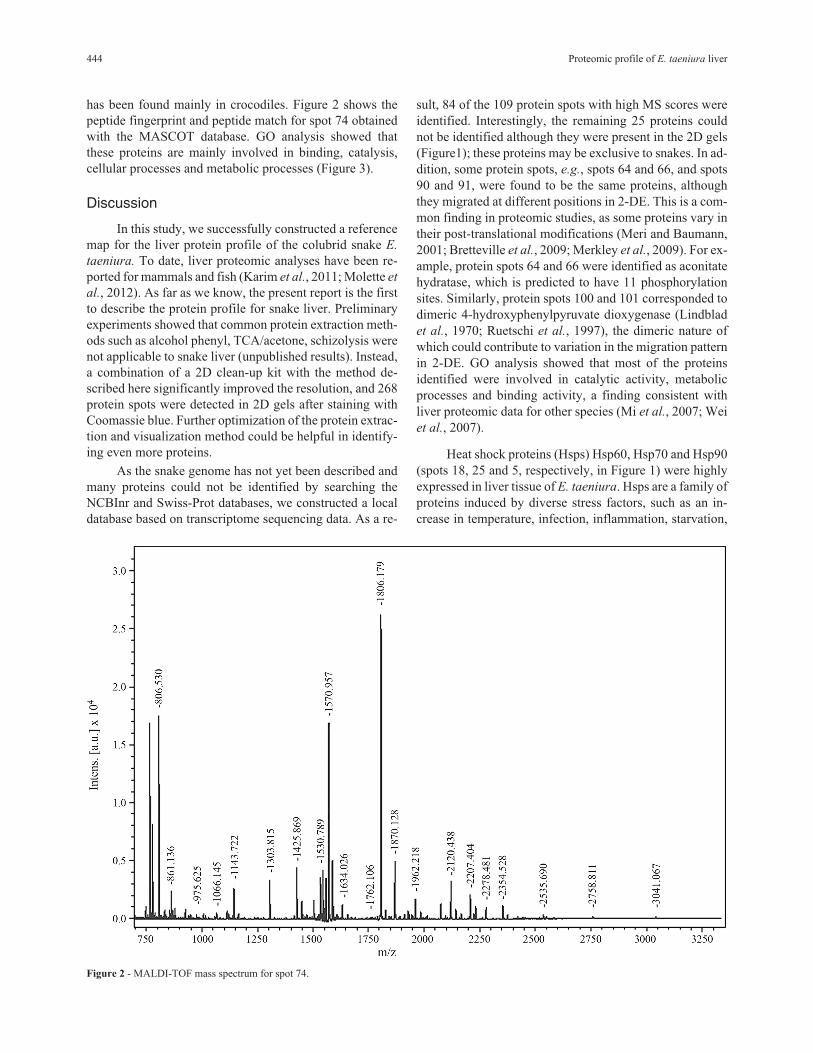
has been found mainly in crocodiles. Figure 2 shows the
peptide fingerprint and peptide match for spot 74 obtained
with the MASCOT database. GO analysis showed that
these proteins are mainly involved in binding, catalysis,
cellular processes and metabolic processes (Figure 3).
Discussion
In this study, we successfully constructed a reference
map for the liver protein profile of the colubrid snake E.
taeniura. To date, liver proteomic analyses have been re-
ported for mammals and fish (Karim et al., 2011; Molette et
al., 2012). As far as we know, the present report is the first
to describe the protein profile for snake liver. Preliminary
experiments showed that common protein extraction meth-
ods such as alcohol phenyl, TCA/acetone, schizolysis were
not applicable to snake liver (unpublished results). Instead,
a combination of a 2D clean-up kit with the method de-
scribed here significantly improved the resolution, and 268
protein spots were detected in 2D gels after staining with
Coomassie blue. Further optimization of the protein extrac-
tion and visualization method could be helpful in identify-
ing even more proteins.
As the snake genome has not yet been described and
many proteins could not be identified by searching the
NCBInr and Swiss-Prot databases, we constructed a local
database based on transcriptome sequencing data. As a re-
sult, 84 of the 109 protein spots with high MS scores were
identified. Interestingly, the remaining 25 proteins could
not be identified although they were present in the 2D gels
(Figure1); these proteins may be exclusive to snakes. In ad-
dition, some protein spots, e.g., spots 64 and 66, and spots
90 and 91, were found to be the same proteins, although
they migrated at different positions in 2-DE. This is a com-
mon finding in proteomic studies, as some proteins vary in
their post-translational modifications (Meri and Baumann,
2001; Bretteville et al., 2009; Merkley et al., 2009). For ex-
ample, protein spots 64 and 66 were identified as aconitate
hydratase, which is predicted to have 11 phosphorylation
sites. Similarly, protein spots 100 and 101 corresponded to
dimeric 4-hydroxyphenylpyruvate dioxygenase (Lindblad
et al., 1970; Ruetschi et al., 1997), the dimeric nature of
which could contribute to variation in the migration pattern
in 2-DE. GO analysis showed that most of the proteins
identified were involved in catalytic activity, metabolic
processes and binding activity, a finding consistent with
liver proteomic data for other species (Mi et al., 2007; Wei
et al., 2007).
Heat shock proteins (Hsps) Hsp60, Hsp70 and Hsp90
(spots 18, 25 and 5, respectively, in Figure 1) were highly
expressed in liver tissue of E. taeniura. Hsps are a family of
proteins induced by diverse stress factors, such as an in-
crease in temperature, infection, inflammation, starvation,
444 Proteomic profile of E. taeniura liver
Figure 2 - MALDI-TOF mass spectrum for spot 74.

hypoxia and water deprivation. These proteins play impor-
tant roles in protein folding, translocation and the assembly
of intracellular proteins that may protect against environ-
mental stress (Gray et al., 1999; Nollen and Morimoto,
2002; Sun et al., 2008; Di Domenico et al., 2010). In the
face of increasing habitat destruction, many animals, in-
cluding reptiles, are facing severe environmental chal-
lenges that require physiological adaptations. The elevated
expression of Hsps in snake liver may help to protect this
species from such stress and could contribute to the ability
of snakes to adapt to different environments.
Some of the proteins identified here, e.g., tau-crys-
tallin (spot 74) and �-enolase (spots 59, 77 and 78), have
also been found in amphibians and reptiles. Tau-crystallin
is a taxon-restricted crystallin found in the eye lenses of
reptiles and a few avian species but is presumably absent in
mammals (Mishra et al., 2002). The level of tau-crystallin
expression in the lens varies among species, e.g., in croco-
diles it is the least abundant crystallin and is present in trace
amounts (Williams et al., 1985; Mishra et al., 2002). Inter-
estingly, tau-crystallin had a relatively high expression in
E. taeniura liver.
Acknowledgments
This work was supported by Natural Science Fun-
dation for Universities of Jiangsu Province (No.
10KJB180001), Start-Up Research Funding of Jiangsu
University for Distinguished Scholars (No.09JDG005),
and Postdoctoral daily finance of Jiangsu University
(1143002139). We thank professors Xiaoyong Liu and
Haijun Liu for their scientific advice and technical exper-
tise.
References
Ahram M, Best CJ, Flaig MJ, Gillespie JW, Leiva IM, Chuaqui
RF, Zhou G, Shu H, Duray PH, Linehan WM, et al. (2002)
Proteomic analysis of human prostate cancer. Mol Carcinog
33:9-15.
Bretteville A, Ando K, Ghestem A, Loyens A, Begard S, Beau-
villain JC, Sergeant N, Hamdane M and Buee L (2009)
Two-dimensional electrophoresis of tau mutants reveals
specific phosphorylation pattern likely linked to early tau
conformational changes. PloS One 4:e4843.
Campbell KR and Campbell TS (2001) The accumulation and ef-
fects of environmental contaminants on snakes: A review.
Environ Monit Assess 70:253-301.
Chang C and Zheng R (2003) Effects of ultraviolet B on epidermal
morphology, shedding, lipid peroxide, and antioxidant en-
zymes in Cope’s rat snake (Elaphe taeniura). J Photochem
Photobiol B 72:79-85.
Chiu K and Lam K (1994) Plasma T3 and T4 levels in a snake,
Elaphe taeniura. Comp Biochem Physiol A 107:107-112.
Chiu KW and Wong CC (1974) Testicular cycles of the striped
racer, Elaphe taeniura. Gen Comp Endocrinol 23:242-244.
Conant R and Collins J (1991) A Field Guide to Amphibians and
Reptiles of Eastern and Central North America. Houghton
Mifflin Co, Boston, 450 pp.
Cope ED (1861) Catalogue of the Colubridae in the Museum of
the Academy of Natural Sciences of Philadelphia. Part 3.
Proc Acad Nat Sci Philadelphia 12:553-566.
Dardevet D, Moore MC, Remond D, Everett-Grueter CA and
Cherrington AD (2006) Regulation of hepatic metabolism
by enteral delivery of nutrients. Nutr Res Rev 19:161-173.
Chen et al. 445
Figure 3 - GO classification of the proteins identified in E. taeniura liver. The proteins were grouped into three main categories and 25 subcategories. The
total number of matched GOs corresponding to identified proteins was 77.

Di Domenico F, Sultana R, Tiu GF, Scheff NN, Perluigi M, Cini C
and Butterfield DA (2010) Protein levels of heat shock pro-
teins 27, 32, 60, 70, 90 and thioredoxin-1 in amnestic mild
cognitive impairment: An investigation on the role of cellu-
lar stress response in the progression of Alzheimer disease.
Brain Res 1333:72-81.
Emmert-Buck MR, Gillespie JW, Paweletz CP, Ornstein DK,
Basrur V, Appella E, Wang QH, Huang J, Hu N, Taylor P, et
al. (2000) An approach to proteomic analysis of human tu-
mors. Mol Carcinog 27:158-165.
Fox JW and Serrano SM (2008) Exploring snake venom proteo-
mes: Multifaceted analyses for complex toxin mixtures.
Proteomics 8:909-920.
Fry BG, Wuster W, Ryan Ramjan SF, Jackson T, Martelli P and
Kini RM (2003) Analysis of Colubroidea snake venoms by
liquid chromatography with mass spectrometry: Evolution-
ary and toxinological implications. Rapid Commun Mass
Spectrom 17:2047-2062.
Gillardin V, Silvestre F, Dieu M, Delaive E, Raes M, Thome JP
and Kestemont P (2009) Protein expression profiling in the
African clawed frog Xenopus laevis tadpoles exposed to the
polychlorinated biphenyl mixture aroclor 1254. Mol Cell
Proteomics 8:596-611.
Gray CC, Amrani M and Yacoub MH (1999) Heat stress proteins
and myocardial protection: Experimental model or potential
clinical tool? Int J Biochem Cell Biol 31:559-573.
Jelaso AM, Delong C, Means J and Ide CF (2005) Dietary expo-
sure to Aroclor 1254 alters gene expression in Xenopus
laevis frogs. Environ Res 98:64-72.
Kaji H, Tsuji T, Mawuenyega KG, Wakamiya A, Taoka M and
Isobe T (2000) Profiling of Caenorhabditis elegans proteins
using two-dimensional gel electrophoresis and matrix as-
sisted laser desorption/ionization-time of flight-mass spec-
trometry. Electrophoresis 21:1755-1765.
Karim M, Puiseux-Dao S and Edery M (2011) Toxins and stress in
fish: Proteomic analyses and response network. Toxicon
57:959-969.
Kim Y, Nandakumar MP and Marten MR (2007) Proteome map
of Aspergillus nidulans during osmoadaptation. Fungal Ge-
net Biol 44:886-895.
Klose J (1975) Protein mapping by combined isoelectric focusing
and electrophoresis of mouse tissues. A novel approach to
testing for induced point mutations in mammals. Human-
genetik 26:231-243.
Ladyman M, Bonnet X, Lourdais O, Bradshaw D and Naulleau G
(2003) Gestation, thermoregulation, and metabolism in a vi-
viparous snake, Vipera aspis: Evidence for fecundity-
independent costs. Physiol Biochem Zool 76:497-510.
Li WW, Quinn GB, Alexandrov NN, Bourne PE and Shindyalov
IN (2003) A comparative proteomics resource: Proteins of
Arabidopsis thaliana. Genome Biol 4:R51.
Liang Y, Chen H, Tang M and Shen S (2007) Proteome analysis
of an ectomycorrhizal fungus Boletus edulis under salt
shock. Mycol Res 111:939-946.
Lindblad B, Lindstedt S, Olander B and Omfeldt M (1970) Purifi-
cation ofp-hydroxyphenylpyruvate hydroxylase from hu-
man liver. Acta Chem Scand 25:329-330.
Menezes MC, Furtado MF, Travaglia-Cardoso SR, Camargo AC
and Serrano SM (2006) Sex-based individual variation of
snake venom proteome among eighteen Bothrops jararaca
siblings. Toxicon 47:304-312.
Meri S and Baumann M (2001) Proteomics: Posttranslational
modifications, immune responses and current analytical
tools. Biomol Eng 18:213-220.
Merkley MA, Hildebrandt E, Podolsky RH, Arnouk H, Ferris DG,
Dynan WS and Stoppler H (2009) Large-scale analysis of
protein expression changes in human keratinocytes immor-
talized by human papilloma virus type 16 E6 and E7 onco-
genes. Proteome Sci 7:29.
Mi J, Garcia-Arcos I, Alvarez R and Cristobal S (2007) Age-re-
lated subproteomic analysis of mouse liver and kidney pero-
xisomes. Proteome Sci 5:19.
Mishra AK, Chandrashekhar R, Aggarwal RK and Sharma Y
(2002) Crocodilian tau-crystallin: Overexpression, purifica-
tion, and characterization. Protein Expr Purif 25:59-64.
Molette C, Théron L, Marty-Gasset N, Fernandez X and Rémig-
non H (2012) Current advances in proteomic analysis of
(fatty) liver. J Proteomics 75:4290-4295.
Nollen EA and Morimoto RI (2002) Chaperoning signaling path-
ways: Molecular chaperones as stress-sensing ‘heat shock’
proteins. J Cell Sci 115:2809-2816.
O’Farrell pH (1975) High resolution two-dimensional electropho-
resis of proteins. J Biol Chem 250:4007-4021.
Pike DA, Pizzatto L, Pike BA and Shine R (2008) Estimating sur-
vival rates of uncatchable animals: The myth of high juve-
nile mortality in reptiles. Ecology 89:607-611.
Qin L, Liu X, Li J, Chen H, Yao Q, Yang Z, Wang L and Chen K
(2009) Protein profile of Nomuraea rileyi spore isolated
from infected silkworm. Curr Microbiol 58:578-585.
Reddy JK and Rao MS (2006) Lipid metabolism and liver inflam-
mation. II. Fatty liver disease and fatty acid oxidation. Am J
Physiol Gastrointest Liver Physiol 290:G852-858.
Rice P, Longden I and Bleasby A (2000) EMBOSS: The Euro-
pean Molecular Biology Open Software Suite. Trends Genet
16:276-277.
Ruetschi U, Rymo L and Lindstedt S (1997) Human 4-hydroxy-
phenylpyruvate dioxygenase gene (HPD). Genomics
44:292-299.
Scheele GA (1975) Two-dimensional gel analysis of soluble pro-
teins. Characterization of guinea pig exocrine pancreatic
proteins. J Biol Chem 250:5375-5385.
Serrano SM, Shannon JD, Wang D, Camargo AC and Fox JW
(2005) A multifaceted analysis of viperid snake venoms by
two-dimensional gel electrophoresis: An approach to under-
standing venom proteomics. Proteomics 5:501-510.
Starck JM, Moser P, Werner RA and Linke P (2004) Pythons me-
tabolize prey to fuel the response to feeding. Proc Biol Sci
271:903-908.
Sun B, Wang JH, Lv YY, Zhu SS, Yang J and Ma JZ (2008)
Proteomic adaptation to chronic high intensity swimming
training in the rat heart. Comp Biochem Physiol Part D
Genomics Proteomics 3:108-117.
Wei Y, Wang J, Zhang X, Xu M and Dai J (2007) Identification
and characterization of expressed sequence tags from the
liver of rare minnow (Gobiocypris rarus). Comp Biochem
Physiol D 2:356-362.
Williams LA, Ding L, Horwitz J and Piatigorsky J (1985) tau-
Crystallin from the turtle lens: Purification and partial char-
acterization. Exp Eye Res 40:741-749.
Wong C and Chiu K (1979) The snake thyroid gland V. Effects of
hypophysectomy on iodine metabolism in the striped racer,
Elaphe taeniura. J Comp Physiol B 131:297-302.
446 Proteomic profile of E. taeniura liver
Yanes O, Aviles FX, Wenzel R, Nazabal A, Zenobi R and Calvete
JJ (2007) Proteomic profiling of a snake venom using high
mass detection MALDI-TOF mass spectrometry. J Am Soc
Mass Spectrom 18:600-606.
Ye J, Fang L, Zheng H, Zhang Y, Chen J, Zhang Z, Wang J, Li S,
Li R and Bolund L (2006) WEGO: A web tool for plotting
GO annotations. Nucleic Acids Res 34:W293-297.
Yokoyama Y, Kuramitsu Y, Takashima M, Iizuka N, Toda T,
Terai S, Sakaida I, Oka M, Nakamura K and Okita K (2004)
Proteomic profiling of proteins decreased in hepatocellular
carcinoma from patients infected with hepatitis C virus.
Proteomics 4:2111-2116.
Zeindl-Eberhart E, Klugbauer S, Dimitrijevic N, Jungblut PR,
Lamer S and Rabes HM (2001) Proteome analysis of rat
hepatomas: Carcinogen-dependent tumor-associated pro-
tein variants. Electrophoresis 22:3009-3018.
Internet Resources
Interpro Scan, http://www.ebi.ac.uk/Tools/pfa/iprscan/ (accessed
August 28, 2012).
WEGO, http://wego.genomics.org.cn/cgi-bin/wego/index.pl (ac-
cessed August 30, 2012).
Associate Editor: Ana Tereza R. Vasconcelos
License information: This is an open-access article distributed under the terms of theCreative Commons Attribution License, which permits unrestricted use, distribution, andreproduction in any medium, provided the original work is properly cited.
Chen et al. 447