Metabolomic profiling of amoebic and pyogenic liver abscesses: an in vitro NMR study
16
ORIGINAL ARTICLE Metabolomic profiling of amoebic and pyogenic liver abscesses: an in vitro NMR study Santosh Kumar Bharti • Virendra Jaiswal • Ujjala Ghoshal • Uday Chand Ghoshal • Sanjay S. Baijal • Raja Roy • Chunni Lal Khetrapal Received: 19 May 2011 / Accepted: 9 July 2011 / Published online: 16 July 2011 Ó Springer Science+Business Media, LLC 2011 Abstract Pus samples obtained from 109 patients with liver abscess were examined by NMR spectroscopy. To our knowledge this is the first report on metabolic profiling of liver abscesses. Fifty metabolites were identified by com- bination of one (1D) and two-dimensional (2D) NMR spectra. Metabolic derangements were evaluated for dif- ferentiation between amoebic (ALA) and pyogenic liver abscess (PLA). The NMR results indicate that aspartate, asparagine and galactose, integral components of lipopro- teophophoglycans (LPG) of the cell wall of Entamoeba histolytica are metabolic biomarkers of ALA. On the other hand, acetate, propionate, butyrate, succinate and formate, the fermentation products the facultative anaerobes are significantly prevalent in PLA. The NMR based metabolic profile of ALA and PLA are evaluated taking polymerase chain reaction (PCR) and bacterial culture as gold standard method. However, when NMR results were compared with culture and PCR methods, a correct diagnosis of 94.11% in ALA (n = 85) and 100% in PLA (n = 10) cases were observed. NMR spectroscopy in conjunction with PCR and culture can expedite in differentiating ALA from PLA. Keywords NMR spectroscopy Amoebic liver abscess Pyogenic liver abscess Metabolic profiling PCR Culture Principal Component Analysis Abbrevations CPMG Carr–Purcell–Meiboom–Gill PCR Polymerase chain reaction TOCSY Total correlation spectroscopy DQF-COSY Double quantum filtered-correlation spectroscopy HSQC Heteronuclear single quantum coherence spectroscopy 1 Introduction Liver abscess is a collection of pus accumulated in a cavity formed by localised hepatic infection in the liver com- monly caused by infection with protozoan parasite Ent- amoeba histolytica as amoebic liver abscess (ALA) or gut derived bacteria such as Escherichia coli, Klebsiella pneumoniae etc., as pyogenic liver abscess (PLA). Other types of liver abscesses like fungal, tubercular etc. are also found but rare or relatively less frequent (Huang et al. 1996; Rahmatulla et al. 2001). World Health Organization (WHO) estimates that amoebiasis is one of the three most common causes of death from parasitic diseases. Mortality Santosh Kumar Bharti, Virendra Jaiswal are the authors have contributed equally. Electronic supplementary material The online version of this article (doi:10.1007/s11306-011-0339-7) contains supplementary material, which is available to authorized users. S. K. Bharti R. Roy C. L. Khetrapal (&) Centre of Biomedical Magnetic Resonance, Sanjay Gandhi Postgraduate Institute of Medical Sciences Campus, Raibarely Road, Lucknow, Uttar Pradesh 226014, India e-mail: [email protected] V. Jaiswal U. Ghoshal Department of Microbiology, Sanjay Gandhi Post Graduate Institute of Medical Sciences, Lucknow, Uttar Pradesh, India U. C. Ghoshal Department of Gastroenterology, Sanjay Gandhi Post Graduate Institute of Medical Sciences, Lucknow, Uttar Pradesh, India S. S. Baijal Department of Radiodiagnosis, Sanjay Gandhi Post Graduate Institute of Medical Sciences, Lucknow, Uttar Pradesh, India 123 Metabolomics (2012) 8:540–555 DOI 10.1007/s11306-011-0339-7
Transcript of Metabolomic profiling of amoebic and pyogenic liver abscesses: an in vitro NMR study

ORIGINAL ARTICLE
Metabolomic profiling of amoebic and pyogenic liver abscesses:an in vitro NMR study
Santosh Kumar Bharti • Virendra Jaiswal •
Ujjala Ghoshal • Uday Chand Ghoshal •
Sanjay S. Baijal • Raja Roy • Chunni Lal Khetrapal
Received: 19 May 2011 / Accepted: 9 July 2011 / Published online: 16 July 2011
� Springer Science+Business Media, LLC 2011
Abstract Pus samples obtained from 109 patients with
liver abscess were examined by NMR spectroscopy. To our
knowledge this is the first report on metabolic profiling of
liver abscesses. Fifty metabolites were identified by com-
bination of one (1D) and two-dimensional (2D) NMR
spectra. Metabolic derangements were evaluated for dif-
ferentiation between amoebic (ALA) and pyogenic liver
abscess (PLA). The NMR results indicate that aspartate,
asparagine and galactose, integral components of lipopro-
teophophoglycans (LPG) of the cell wall of Entamoeba
histolytica are metabolic biomarkers of ALA. On the other
hand, acetate, propionate, butyrate, succinate and formate,
the fermentation products the facultative anaerobes are
significantly prevalent in PLA. The NMR based metabolic
profile of ALA and PLA are evaluated taking polymerase
chain reaction (PCR) and bacterial culture as gold standard
method. However, when NMR results were compared with
culture and PCR methods, a correct diagnosis of 94.11% in
ALA (n = 85) and 100% in PLA (n = 10) cases were
observed. NMR spectroscopy in conjunction with PCR and
culture can expedite in differentiating ALA from PLA.
Keywords NMR spectroscopy � Amoebic liver abscess �Pyogenic liver abscess � Metabolic profiling � PCR �Culture � Principal Component Analysis
Abbrevations
CPMG Carr–Purcell–Meiboom–Gill
PCR Polymerase chain reaction
TOCSY Total correlation spectroscopy
DQF-COSY Double quantum filtered-correlation
spectroscopy
HSQC Heteronuclear single quantum coherence
spectroscopy
1 Introduction
Liver abscess is a collection of pus accumulated in a cavity
formed by localised hepatic infection in the liver com-
monly caused by infection with protozoan parasite Ent-
amoeba histolytica as amoebic liver abscess (ALA) or gut
derived bacteria such as Escherichia coli, Klebsiella
pneumoniae etc., as pyogenic liver abscess (PLA). Other
types of liver abscesses like fungal, tubercular etc. are also
found but rare or relatively less frequent (Huang et al.
1996; Rahmatulla et al. 2001). World Health Organization
(WHO) estimates that amoebiasis is one of the three most
common causes of death from parasitic diseases. Mortality
Santosh Kumar Bharti, Virendra Jaiswal are the authors have
contributed equally.
Electronic supplementary material The online version of thisarticle (doi:10.1007/s11306-011-0339-7) contains supplementarymaterial, which is available to authorized users.
S. K. Bharti � R. Roy � C. L. Khetrapal (&)
Centre of Biomedical Magnetic Resonance, Sanjay Gandhi
Postgraduate Institute of Medical Sciences Campus,
Raibarely Road, Lucknow, Uttar Pradesh 226014, India
e-mail: [email protected]
V. Jaiswal � U. Ghoshal
Department of Microbiology, Sanjay Gandhi Post Graduate
Institute of Medical Sciences, Lucknow, Uttar Pradesh, India
U. C. Ghoshal
Department of Gastroenterology, Sanjay Gandhi Post Graduate
Institute of Medical Sciences, Lucknow, Uttar Pradesh, India
S. S. Baijal
Department of Radiodiagnosis, Sanjay Gandhi Post Graduate
Institute of Medical Sciences, Lucknow, Uttar Pradesh, India
123
Metabolomics (2012) 8:540–555
DOI 10.1007/s11306-011-0339-7

mainly results from extra-intestinal infections, ALA being
the commonest. Differentiation of ALA from PLA is
important as management and outcome of the two condi-
tions may differ (Lodhi et al. 2004). Clinical features and
conventional laboratory parameters of the two conditions
are similar and include fever, cough, right upper quadrant
abdominal pain, leukocytosis, enlarged liver and raised
right dome of the diaphragm on chest radiograph. There are
some specific sonographic feature of ALA that differ from
PLA but these differences are not sufficient for differenti-
ation (Ralls et al. 1987). Demonstration of E. histolytica,
the causative organism of ALA, on microscopy of pus
sample is infrequent (Haque et al. 2000). Laboratory
diagnosis of ALA is usually made by conventional serum
antiamoebic antibody test. However, it cannot differentiate
past infection from current infection and is also positive in
a proportion of healthy population in endemic areas
(Khairnar and Parija 2007). Detection of amoebic antigen
has low sensitivity, particularly in patients partly treated
with anti-amoebic drugs (Haque et al. 2000; Parija and
Khairnar 2007; Zeehaida et al. 2008). Several polymerase
chain reaction (PCR)-based methods have been developed
to amplify DNA of E. histolytica in liver pus and stool
specimens (Acuna-Soto et al. 1993; Khan et al. 2006;
Tannich and Burchard 1991; WHO 1997). PCR is one of
the methods having best sensitivity and specificity for
detection of E. histolytica in liver pus samples as compared
to other techniques (Fotedar et al. 2007a, b; Verweij et al.
2004) and also recommended by WHO (1997). The PCR is
elegant technique and frequently adopted by biological
scientists but routinely not applied in pathology laboratory
because of its complexity and difficult procedures (Latchman
1995). PCR was chosen because of its high sensitivity for
diagnosis of ALA and comparing the NMR metabolic
profile. PLA is conventionally diagnosed by positive bac-
terial culture in liver pus in absence of anti-amoebic anti-
body in serum. However, sensitivity of this criterion is low
if antibiotics have been used previously. The metabolomics
approach to provide insight into their metabolic status and
pathophysiology of pus formation has not been yet repor-
ted. On the other hand such an approach may provide
desired information on ALA as well as PLA. Metabolomics
allows the qualitative and quantitative measurement of all
metabolites present in cell, biofluids, pathological fluids,
tissue and tissue extract (Dunn and Ellis 2005; Lindon et al.
2000, 2003). The biochemical composition of ALAs and
PLAs may differ. Among all the other analytical techniques
used for metabolomics studies, high resolution NMR
spectroscopy is widely used for investigating the compo-
sition of body fluids, tissues extract, pathological fluids, as
a wide range of metabolites can be detected simultaneously
without separation of individual components. Therefore,
we hypothesize that metabolic profile of pus from liver
abscess would be different in patients with ALA and PLA.
Accordingly we undertook this study with the following
aims, (a) Metabolic profiling of liver abscess, (b) To find
out the metabolic differences between ALA and PLA
taking PCR and bacterial culture as gold standard methods.
2 Materials and methods
2.1 Subjects
One hundred nine patients undergoing drainage of liver
abscess in the Department of Radiodiagnosis in a tertiary
care centre during a 3 year period (January 2006 to
December 2009) were included in this study. Classification
of liver abscesses was based on result of E. histolytica-PCR
and bacterial culture which were previously described
(Virendra Jaiswal et al. 2010). Patients diagnosed to have,
mixed infection with E. histolytica and bacteria were
excluded. Informed consent was obtained from all the
patients and the protocol was approved by Institution’s
Ethics Committee (PGI/DIR/RC/957/2007).
2.2 Sample preparations for NMR
Five ml of liver pus specimen was collected from each
patient during drainage of abscess. An aliquot (approxi-
mately 2 ml) of liver pus was immediately stored in -80�C
for 1H NMR analysis and the remaining sample was pro-
cessed microbiologically for another study, which has been
reported previously (Virendra Jaiswal et al. 2010). Before
performing the NMR analysis, samples were thawed at
room temperature. The whole volume of sample was son-
icated to homogenise and the centrifuge at 12,000 rpm for
10 min at 4�C temperature to remove the suspended par-
ticulate matter. For 1H NMR experiments 250 ll of
supernatant was pipetted out and makeup to 500 ll with
deuterium oxide (D2O). For quantitative evaluation of
various metabolites, sample was taken in 5 mm NMR tube
with a Wilmad coaxial insert filled with known concen-
tration of TSP (Sodium salt of 3-trimethylsilyl-(2,2,3,3-d4)-
propionic acid) in deuterium oxide. All the chemicals used
for NMR analysis were purchased from Sigma Aldrich,
USA. All the samples were coded and randomly provided
for NMR analysis and PCR and Culture results were not
disclosed until complete NMR analysis.
2.3 Experimental 1H NMR spectroscopy
The NMR experiments were performed on a Bruker Avance
400 MHz spectrometer equipped with a 5 mm Broad Band
Inverse probe shielded with z-gradients. During the analy-
sis, sample temperature was 300 K. One dimensional (1D)
Metabolic profile of pus from liver abscesses 541
123

single pulse experiments and Carr–Purcell–Meiboom–Gill
(CPMG) sequence were used with presaturation pulse to
suppress the water signal. The parameters used are: 8 kHz
spectral width, 32K data points, 90� flip angle (10.6 ls), a
total repetition time of 19.04 s and total echo time of
269 ms (for CPMG experiments), number of scan 128,
dummy scan 8. The resultant spectra were processed using
exponential line broadening of 0.3 Hz before Fourier
transformation. Manual phase correction was performed
followed by automatic base line correction. Unambiguous
assignments of various metabolites were performed using
2D homonuclear and heteronuclear NMR spectroscopy.
Some of the resonances were also confirmed by spiking
experiments using standard compounds. The magnitude
mode double quantum filtered correlation spectroscopy
(DQF-COSY), total correlation spectroscopy (TOCSY) and1H–13C heteronuclear single quantum coherence (HSQC)
spectroscopy were performed for the assignments of reso-
nances. For DQF-COSY 2K data points were collected in t2domain over a spectral width of 8 kHz, water resonance was
presaturated during relaxation delay of 2.0 s, 512 t1 incre-
ments with 64 transient scans and 16 dummy scans. For
TOCSY, all basic parameters were same as in DQF-COSY.
Spin lock time used was 70 ms. 512 increments were col-
lected in t1 dimension using 88 transient scan. The resulting
2D data were Fourier transformed after zero filling in the t1dimension to 1,024 points and multiplying in both dimen-
sion by sine bell window function. All data acquisition and
processing were performed using XWINNMR 3.5 version.
The parameters used for 1H–13C HSQC were: 2K data
points in t2 dimension over spectral width of 5,952 Hz, 500
t1 increments with 80 transients, relaxation delay of 2.0 s,
acquisition time of 170 ms and 90� pulse length. The
spectral width in t1 dimension was 20,124 Hz. The phase
sensitive data were obtained by the antiecho-time propor-
tional phase increments (Antiecho-TPPI) method. The
resulting data were zero-filled to 512 data points and were
weighted with 90� squared sine window functions in both
the dimensions prior to Fourier transformation.
2.4 PCR and bacterial culture of pus
Five ml of liver pus obtained during drainage of abscess
was examined for bacteria by Gram’s staining and bacterial
culture as per standard methods (Collee et al. 1996). PCR
analysis was performed on the sample for the detection of
E. histolytica in pus sample using Zaman et al. method
(2000).
2.5 Statistical analysis
Principal Component Analysis (PCA) on NMR Spectra:
The CPMG spectra obtained from ALA (n = 85) and PLA
(n = 10) were subjected for the multivariate PCA. The
spectra were reduced to 395 (between 0.5 and 9.0 ppm)
discrete chemical shift regions by digitization to produce a
series of sequentially integrated regions of 0.02 ppm width,
using Bruker AMIX software (Version 3.8.7, Bruker
GmbH, Germany). The region of 4.5–5.1 ppm was exclu-
ded from the analysis to remove the residual signal of
HOD, water and distorted region due to water suppression.
The data obtained was mean centered, scaled to Pareto
Scaling and then normalized by dividing each integral of
the segment by total area of the spectrum in order to
compensate for the differences in overall metabolite con-
centration between individual samples. The resulting data
matrix was further subjected for the PCA.
Univariate analysis of quantitative and categorical data:
Mann–Whitney U test and Fisher Exact test (SPSS 11.5)
was applied on the quantitative data and categorical data
respectively.
3 Results
Fourteen patients were excluded from the final analysis as a
definite diagnosis could not be made due to inadequate
work-up (n = 3), tubercular liver abscess (n = 1), fungal
liver abscess (n = 1), mixed infection (n = 9). Eighty-five
patients with ALA (85/104, 81.7%) and ten with PLA
(10/104, 9.6%) were finally included in this study. There-
fore the total sample size was from 95 patients.
Male were more affected by ALA (88%) as compared to
PLA (55%). Mean age of the ALA (41.1 ± 15.6 years) and
PLA (42.2 ± 23.1 years) patients were almost same and no
significant differences were found in our study. The mean
age of male and female in ALA group was 42.0 ± 16.4 and
40.5 ± 19.7 years respectively.
3.1 Identification of metabolites by NMR spectroscopy
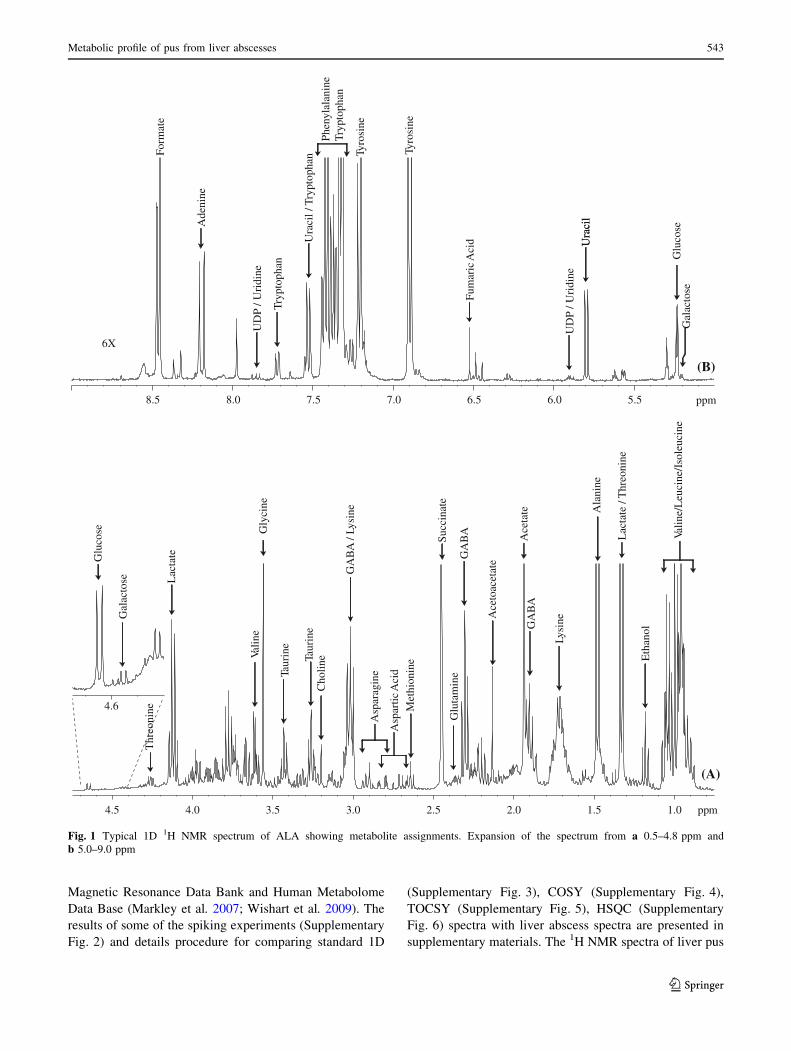
The NMR spectra of liver abscesses were analyzed by the
combined use of 1D and 2D NMR spectroscopy. A typical
1D 1H NMR spectrum of ALA is shown in Fig. 1. The
typical 2D COSY, 1H–13C HSQC and TOCSY spectra used
for assignments of the compounds are shown in Figs. 2, 3
and Supplementary Fig. 1 respectively with resonance
assignments. The assignments were also carried out on the
basis of coupling pattern, coupling constant and chemical
shift reported in the literature (Bollard et al. 2009; Denkert
et al. 2008; Foxall et al. 1993; Gao et al. 2009; Govindaraju
et al. 2000; Grand et al. 1999; Gupta et al. 2001; Lai et al.
2005; Lindon et al. 1999; Nicholson et al. 1995; Nicholson
and Wilson 1989; Pinero-Sagredo et al. 2010; Rocha et al.
2010; Silwood et al. 2002; Sweatman et al. 1993), com-
parison with reference compounds present in Biological
542 S. K. Bharti et al.
123
Magnetic Resonance Data Bank and Human Metabolome
Data Base (Markley et al. 2007; Wishart et al. 2009). The
results of some of the spiking experiments (Supplementary
Fig. 2) and details procedure for comparing standard 1D
(Supplementary Fig. 3), COSY (Supplementary Fig. 4),
TOCSY (Supplementary Fig. 5), HSQC (Supplementary
Fig. 6) spectra with liver abscess spectra are presented in
supplementary materials. The 1H NMR spectra of liver pus
5.56.06.57.07.58.08.5
6X
ppm
1.01.52.02.53.03.54.04.5 ppm
4.6
Lysi
ne
Lac
tate
/ T
hreo
nine
Ala
nine
Ace
tate
Suc
cina
te
Ace
toac
etat
eGA
BA
GA
BA
GA
BA
/ Ly
sine
Eth
anol
Taur
ine
Met
hion
ine
Lac
tate
Thr
eoni
ne
Vali
ne
Glu
cose
Gal
acto
se
Gly
cine
Vali
ne/L
euci
ne/I
sole
ucin
e
Asp
arti
c A
cid
Asp
arag
ine
Taur
ine
Glu
cose
Ura
cil
UD
P / U
ridi
ne
Fum
aric
Aci
d
Gal
acto
se
Ura
cil /
Try
ptop
han
Tryp
toph
an
UD
P / U
ridi
ne
Ade
nine
Form
ate
Ura
cil
Tyro
sine
Tyro
sine
Phe
nyla
lani
neTr
ypto
phan
Glu
tam
ine
Cho
line
(A)
(B)
Fig. 1 Typical 1D 1H NMR spectrum of ALA showing metabolite assignments. Expansion of the spectrum from a 0.5–4.8 ppm and
b 5.0–9.0 ppm
Metabolic profile of pus from liver abscesses 543
123

samples were highly complex and it did not allow all the
assignment on the basis of chemical shift reported in lit-
eratures. 2D homonuclear NMR experiments were per-
formed to resolve the spectral complexity. Even resonance
overlapping was also observed in COSY and TOCSY
spectra in the chemical shift region of 3.0–4.25 ppm.
Therefore 1H–13C HSQC was recorded and it provided
better resolution for assignments of metabolites due to
more dispersion of chemical shift in 13C dimension.
Aspartic acid, asparagine and galactose were observed in
low concentrations and therefore assigned by spiking
experiments (Supplementary Fig. 2). Whereas, acetic acid,
formic acid, succinate and acetoacetate were assigned by
the 13C chemical shifts obtained from the HSQC spectra as
well as by spiking with known standard compounds in the1H NMR spectra. Different classes of metabolites such as
carbohydrates, organic acids, aliphatic and aromatic amino
acids (AAA), bacterial fermentation products and lipids
Fig. 2 2D 1H–1H COSY spectrum of ALA along with the assignment
of the metabolites. (Ileu isoleucine, Leu leucine, Val valine, Lyslysine, Glu glutamate, Gln glutamine, Meth methionine, Arg arginine,
Eth ethanol, Pro proline, Ala alanine, Lac lactate, Thre threonine, Citcitrate, Asp aspartic acid, Asn asparagine, Tyr tyrosine, His histidine,
Phe phenylalanine, Tau taurine, Try tryptophan, Gluc glucose)
544 S. K. Bharti et al.
123

were detected in the 1H NMR spectra liver pus. The
detailed 1H NMR chemical shift assignment of the
metabolites observed in the liver pus samples are presented
in Table 1. GABA was observed in very high concentration
in some of the samples and it was assigned by TOCSY as
shown in (Supplementary Fig. 1).
3.2 PCA of NMR spectra
Multivariate analysis (PCA) was performed on the CPMG1H NMR spectra of ALA and PLA as it provides better
baseline. A seven-component model explained 98.0% of the
variance, with the first two components explaining 93.5.0%
ppm
1.01.52.02.53.03.54.04.5 ppm
15
20
25
30
35
40
45
50
55
60
65
70
75
Leucine
LeucineLeucine
Leucine
Leucine
Valine
Valine
Valine
Valine
Isoleucine
Isoleucine
Isoleucine
Isoleucine
Isoleucine
Lactate
Threonine
Threonine
Lactate
Aspartic Acid
Asparagine
Methionine
Methionine
Methionine
Methionine
Lysine
Lysine
Lysine
LysineGlutamic Acid
Glutamic Acid
Tryptophan
Histidine
Tyrosine
Phenylalanine
Tryptophan
PhenylalanineTyrosine
Histidine
Proline
Proline
Citrate
Proline
Glycine
Citrulline
Citrulline
Alanine
Choline
Choline
Ornithine
Ornithine
Ornithine
Serine
Serine
Betaine
Myo-Inositol
Myo-InositolMyo-Inositol
Gluconic Acid
Gluconic Acid
Gluconic Acid
Glucose
Glucose
Glucose
Glucose
Glucose
Glucose
Alanine
Aspartic Acid
Asparagine
Proline
Glycerol
Glycerol
Ornithine
Fig. 3 2D 1H–13C HSQC spectrum of ALA. The assignments of the metabolites are labelled
Metabolic profile of pus from liver abscesses 545
123
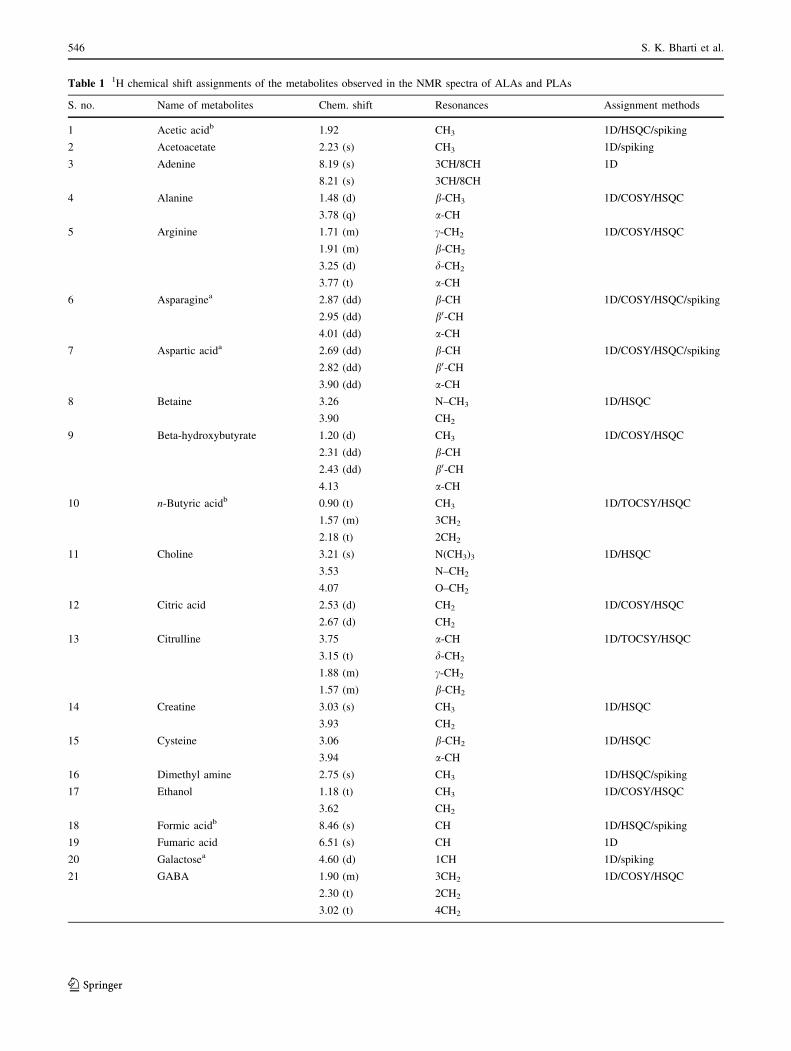
Table 1 1H chemical shift assignments of the metabolites observed in the NMR spectra of ALAs and PLAs
S. no. Name of metabolites Chem. shift Resonances Assignment methods
1 Acetic acidb 1.92 CH3 1D/HSQC/spiking
2 Acetoacetate 2.23 (s) CH3 1D/spiking
3 Adenine 8.19 (s) 3CH/8CH 1D
8.21 (s) 3CH/8CH
4 Alanine 1.48 (d) b-CH3 1D/COSY/HSQC
3.78 (q) a-CH
5 Arginine 1.71 (m) c-CH2 1D/COSY/HSQC
1.91 (m) b-CH2
3.25 (d) d-CH2
3.77 (t) a-CH
6 Asparaginea 2.87 (dd) b-CH 1D/COSY/HSQC/spiking
2.95 (dd) b0-CH
4.01 (dd) a-CH
7 Aspartic acida 2.69 (dd) b-CH 1D/COSY/HSQC/spiking
2.82 (dd) b0-CH
3.90 (dd) a-CH
8 Betaine 3.26 N–CH3 1D/HSQC
3.90 CH2
9 Beta-hydroxybutyrate 1.20 (d) CH3 1D/COSY/HSQC
2.31 (dd) b-CH
2.43 (dd) b0-CH
4.13 a-CH
10 n-Butyric acidb 0.90 (t) CH3 1D/TOCSY/HSQC
1.57 (m) 3CH2
2.18 (t) 2CH2
11 Choline 3.21 (s) N(CH3)3 1D/HSQC
3.53 N–CH2
4.07 O–CH2
12 Citric acid 2.53 (d) CH2 1D/COSY/HSQC
2.67 (d) CH2
13 Citrulline 3.75 a-CH 1D/TOCSY/HSQC
3.15 (t) d-CH2
1.88 (m) c-CH2
1.57 (m) b-CH2
14 Creatine 3.03 (s) CH3 1D/HSQC
3.93 CH2
15 Cysteine 3.06 b-CH2 1D/HSQC
3.94 a-CH
16 Dimethyl amine 2.75 (s) CH3 1D/HSQC/spiking
17 Ethanol 1.18 (t) CH3 1D/COSY/HSQC
3.62 CH2
18 Formic acidb 8.46 (s) CH 1D/HSQC/spiking
19 Fumaric acid 6.51 (s) CH 1D
20 Galactosea 4.60 (d) 1CH 1D/spiking
21 GABA 1.90 (m) 3CH2 1D/COSY/HSQC
2.30 (t) 2CH2
3.02 (t) 4CH2
546 S. K. Bharti et al.
123

Table 1 continued
S. no. Name of metabolites Chem. shift Resonances Assignment methods
22 a-Glucose 3.41 C4H 1D/COSY/TOSCY/HSQC
3.54 C2H
3.71 C3H
3.83 C6H
3.85 C5H
5.24 (d) C1H
23 b-Glucose 3.24 C2H 1D/COSY/TOSCY/HSQC
3.41 C4H
3.47 C5H
3.49 C3H
3.74 C6H
3.91 C60H
4.65 (d) C1H
24 Gluconic acid 4.11 2CH 1D/HSQC
4.02 3CH
3.81 6CH2
3.65 6CH2
3.75 4CH
3.75 5CH
25 Glutamate 2.09 b-CH2 1D/COSY/HSQC
2.35 (m) c-CH2
3.77 a-CH
26 Glutamine 2.13 (m) b-CH2 1D/COSY/TOSCY/HSQC
2.45 (m) c-CH2
3.77 a-CH
27 Glycine 3.56 CH2 1D/HSQC
28 Glycerol 3.57 1,3CH2 1D/COSY/HSQC
3.66 1,3CH2
3.79 2CH
29 Histidine 3.18 b-CH 1D/HSQC
3.25 b0-CH
3.99 a-CH
7.13 (s) C4H-ring
7.98 (s) C2H-ring
30 Isoleucine 0.94 (t) d-CH3 1D/COSY/TOSCY/HSQC
1.01 (d) c-CH3
1.26 (m) c-CH
1.47 (m) c0-CH
1.98 (m) b-CH
3.68 (d) a-CH
31 Lactate 1.33 (d) b-CH3 1D/COSY/HSQC
4.12 (q) a-CH
32 Leucine 0.96 (d) d-CH3 1D/COSY/TOSCY/HSQC
0.97 (d) d0-CH3
1.71 (m) c-CH/b-CH2
3.75 a-CH
33 Lipids 0.90/0.96 CH3 1D/COSY/TOCSY
1.29 –(CH2)n–
Metabolic profile of pus from liver abscesses 547
123

Table 1 continued
S. no. Name of metabolites Chem. shift Resonances Assignment methods
1.58 CH2–CH2–CO
2.04/2.07 CH=CH–CH2
2.25 CH2–CO
2.81 CH=CH–CH2–CH=CH
5.32 CH=CH
34 Lysine 1.47 (m) c-CH2 1D/COSY/TOSCY/HSQC
1.72 (m) b-CH2
1.9 (m) d-CH2
3.02 N–CH2
3.74 a-CH
35 Methionine 2.13 (s) S–CH3 1D/COSY/HSQC
2.16 (m) b-CH2
2.64 (t) c-CH2
3.85 a-CH
36 Myo-inositol 3.28 (t) C2H-ring 1D/COSY/HSQC
3.54 (d) C1,3H-ring
3.62 (t) C5H-ring
4.06 (t) C4,6H-ring
37 Ornithine 1.81 (m) c-CH2 1D/COSY/HSQC
1.92 (m) b-CH2
3.05 (t) d-CH2
3.78 a-CH
38 Phenylalanine 3.12 b-CH 1D/COSY/HSQC
3.28 b0-CH
3.98 a-CH
7.32 (d) C2H, C6H-ring
7.37 (m) C4H-ring
7.41 (m) C3H, C5H-ring
39 Propionic acidb 1.05 (t) CH3 1D/COSY/HSQC
2.18 (q) CH2
40 Proline 2.01 (m) c-CH2 1D/COSY/HSQC
2.08 (m) b-CH
2.35 (m) b0-CH
3.35 d-CH
3.42 d0-CH
4.13 a-CH
41 Serine 3.85 (m) b-CH2 1D/COSY/HSQC
3.97 (m) a-CH
42 Succinateb 2.46 (s) CH2 1D/HSQC/spiking
43 Scyllo-inositol 3.35 (s) CH 1D/HSQC
44 Taurine 3.25 (t) S–CH2 1D/COSY/HSQC
3.41 (t) N–CH2
45 Threonine 1.34 (d) c-CH3 1D/COSY/HSQC
3.6 (d) a-CH
4.25 (m) b-CH
46 Tryptophan 3.29 (dd) b-CH 1D/COSY/HSQC
3.47 (dd) b0-CH
548 S. K. Bharti et al.
123

of the total variance. The clear clustering between ALA and
PLA in the PCA of spectra demonstrated significant meta-
bolic variations in ALA and PLA groups (Fig. 4). Exami-
nation of PC1, PC2 and PC3 loadings showed that the cluster
separation arising mainly due to acetate, succinate, formate,
asparagine, aspartic acid, glucose, branch chain amino acids
(BCA), AAA, lactate, alanine etc. (Fig. 5). The analysis of
2D loading plot showed that PLA samples were separated
from ALA mainly due to acetate, succinate and formate
(Supplementary Fig. 7). Dispersion in the ALA group was
observed due variations in BCA, AAA, lactate, aspartic acid,
asparagine, alanine etc. One of the ALA sample was over-
lapped with PLA group (Fig. 4) and detail spectral analysis
of this sample showed high content of acetate, succinate and
formate which are key metabolites in PLA. Aspartic acid and
asparagine were also present in this sample but their inten-
sities were relatively low when compared with acetate,
succinate and formate, proving their major role in separating
PLA from ALA. Acetate, succinate and formate were also
observed in two other ALA samples but in less concentration
and therefore classified in the cluster of ALA group (Fig. 5).
3.3 NMR spectral assignments, quantitation
and statistical analysis
The stack plots of the two representative PLA and ALA
pus samples 1H NMR spectra are shown in Fig. 6 so as to
highlight the major differences in the metabolites. The
absence of asparagine, aspartic acid and galactose reso-
nances was very straightforward in the PLA spectrum.
-2.5-2.0
-1.5-1.0
-0.50.0
0.51.0
1.5
PC-1PC-2
PC-3
-2.0-1.5
-1.0-0.5
0.00.5
1.0-1.0
-0.5
0.0
0.5
1.0
1.5
ALA (n=85)PLA (n=10)
Fig. 4 PCA of CPMG 1H NMR spectra of ALA and PLA. Scores
plot PCA discriminating ALA from PLA based on selected metab-
olites. ALA cases mark by circle, have acetate, succinate and formate
in the NMR spectra
Table 1 continued
S. no. Name of metabolites Chem. shift Resonances Assignment methods
4.04 (dd) a-CH
7.19 (t) C5H-ring
7.26 (t) C6H-ring
7.30 (s) C2H-ring
7.53 (d) C4H-ring
7.72 (d) C7H-ring
47 Tyramine 2.92 (t) CH2 1D/COSY/HSQC
3.23 N–CH2
6.88 (d) 3,5CH
7.21 (d) 2,5CH
48 Tyrosine 3.06 (dd) b-CH 1D/COSY/HSQC
3.19 (dd) b0-CH
3.95 (dd) a-CH
6.89 (d) C3H, C5H-ring
7.18 (d) C2H, C6H-ring
49 Uracil 5.8 (s) C5H-ring 1D/COSY/HSQC
7.54 (d) C6H-ring
50 Valine 0.99 (d) c-CH3 1D/COSY/TOCSY/HSQC
1.04 (d) c0-CH3
3.62 (d) b-CH
2.28 a-CH
a Metabolites specific to ALA and bmetabolites specific to PLA. All other metabolites were common in both ALA and PLA samples
Metabolic profile of pus from liver abscesses 549
123

While in ALA, absence of acetate, propionate, butyrate,
succinate and formate signals were observed. A doublet at
4.60 ppm arising due to anomeric proton signal of galact-
ose was observed only in *40% ALA pus samples.
A known concentration of TSP was used in coaxial insert
to avoid the quantitative error arising due to interaction of
TSP with proteins present in the sample. A relaxation time of
19.04 s was given to ensure the full relaxation of all reso-
nances. Relative integral of metabolites resonances were
normalise to TSP signal. Concentration of the TSP present in
coaxial insert was validated by known concentration of
glycine before quantification of the metabolites (Larive et al.
1997). Quantitation of only 17 metabolites was performed
from patients with ALA and PLA. However, quantitation of
propionate and butyrate could not be performed due to
overlapping of the resonances with other signals. Quantita-
tive variability of the common metabolites was found to be
statistically insignificant between ALA and PLA (Table 2).
The presence of aspartic acid, asparagine and/or galactose
was found to be fingerprint metabolites in ALA cases, while
acetate, succinate, propionate, butyrate and formate were
only observed in PLA cases. Sample size in PLA group was
quite low as compared to ALA. Therefore, in order to verify
the bacterial fermentation products specific to PLA, an in
vitro study has been performed by incubating bacterial
clinical isolates (K. pneumoniae) in bacteria free liver
abscess (ALA) having no previous fermentation product as
observed by NMR spectroscopy. K. pneumoniae was chosen
because it the most common isolates of PLA (Chang et al.
2000; Cheng et al. 1989; Lee et al. 2001; Rahimian et al.
2004). The ALA sample mixed with K. pneumoniae sus-
pension in phosphate buffered saline and incubated for 18 h
at 37�C. Detail procedure and results are reported in sup-
plementary material. After 18 h incubation liver abscess
sample showed bacterial fermentation products acetate,
formate, succinate, propionate etc. in very high concentra-
tion (Supplementary Fig. 8) as already reported in all the 10
PLA samples.
Butyrate and propionate which are specifically found in
PLA did not demonstrated significant role in PCA clus-
tering of spectra. This may due to their low concentration
and overlapping with other signals. Similarly, a doublet
signal at 4.60 ppm for galactose was found to be insig-
nificant in the PCA loading plots when tried with including
galactose region. This may due to its very low concentra-
tion and was observed in only *40% of the samples from
ALA. Therefore, it was thought worthwhile that detailed
analysis of individual spectra followed by univariate
analysis may help for better discrimination.
On the basis of these distinct resonances, ALA and PLA
were classified and compared with PCR and culture results
and the details are presented in (Table 3). The data presented
is quite intriguing, the ALA samples can be 94.11% correctly
classified by NMR. Three patients had bacterial fermentation
products in their pus samples along with asparagine and
aspartic acids detected by NMR spectroscopy. All the ten
PLA samples were correctly identified by NMR spectros-
copy. Two ALA patients could not be classified by NMR
spectroscopy as it neither showed bacterial fermentation
products nor aspartic acid and asparagine in their pus samples.
4 Discussion
The results of 1H NMR spectroscopy of liver pus speci-
mens provide evidence that the metabolic profile of ALA is
different from that of PLA. Unsupervised multivariate PCA
also clearly demonstrated the differential metabolic profile
1.02.03.04.05.06.07.08.09.0
-0.4
-0.2
0.0
0.2
0.4
Ace
tate
Succ
inat
e
Form
ate
BC
A
Ala
nine
Asp
arag
ine
Asp
artic
Aci
d
Glu
cose
AA
A
1.02.03.04.05.06.07.08.09.0
-0.4
-0.2
0.0
0.2
0.4 PC-1 Loading
PC-2 Loading
BC
A
AA
A
Form
ate
Wat
er R
egio
n
Lac
tate
Ace
tate
Lac
tate
Suc
cina
te
Ala
nine
1.02.03.04.05.06.07.08.09.0
-0.4
-0.2
0.0
-0.2
-0.4PC-3 Loading
AA
A
Glu
cose
Gly
cine
BC
A
Lac
tate
Lac
tate
Fig. 5 PCA of CPMG 1H NMR spectra of ALA and PLA. 1D
loading plot of a PC 1, b PC 2 and c PC 3 generated from PCA shown
in Fig. 4. PC 1 and PC 2 are the major component for group
separation
550 S. K. Bharti et al.
123

of ALA and PLA. Even the NMR based metabolic profile
of ALA was found to be different when compared with
other pyogenic abscesses like brain abscesses and abdom-
inal abscesses (Grand et al. 1999; Lai et al. 2002, 2005).
This indicates that metabolism of E. histolytica is entirely
different from bacterial metabolism. One of the charac-
teristic features of E. histolytica is the presence of cell wall
rich surface antigens, lipoproteophophoglycans (LPG), rich
in aspartic acid, serine, glutamic acid, glucose and galact-
ose (Sue Moody-Haupt 2000). The presence of aspartic
acid and galactose in ALA may therefore be attributed to
the constituent of the cell wall of the E. histolytica in the
pus samples. Another plausible source of aspartic acid,
asparagine and galactose may be related to its specific
metabolism or due to different mode of pathogenesis of
E. histolytica (http://www.genome.jp/kegg-bin/show_pathway?
ehi00052) which is entirely different from the bacterial
metabolism (Anderson and Loftus 2005). In the absence of
glucose E. histolytica utilizes several amino acids such as
asparagine, aspartate, threonine, tryptophan, methionine,
homocysteine etc. for generation of ATP (Anderson and
Loftus 2005). Proton NMR spectra of ALA suggests that
glucose was present in a considerable amount and thus
amino acids were not utilized by E. histolytica. However,
glucose utilization by E. histolytica is lower as compared to
bacteria as confirmed by quantitative analysis (Table 2).
The metabolism predicted on the basis of genome sequence
of E. histolytica also suggests the production of ethanol and
propionate (Loftus et al. 2005). Ethanol was observed in
amoebic liver pus but not specific to ALA samples only.
Whereas, propionate was observed along with acetate and
succinate in PLA samples indicating end products of the
bacterial fermentation.
Metabolic profile of PLA showed additional resonances
such as acetate, succinate, propionate, formate and butyrate
and absence of aspartate, asparagine and galactose. These
metabolites present in the PLA are well known fermenta-
tion product of bacterial metabolism (Clark 1989; Murarka
et al. 2008; Wang et al. 2010). Our results of in vitro fer-
mentation liver abscess with K. pneumoniae also substan-
tiate that succinate, acetate, formate, propionate etc. are the
end product of bacterial fermentations. The presence of
6.07.08.0 1.02.03.04.05.0 ppm
Form
ate
Succ
inat
e
Ace
tate
Asp
/ A
sn
Asp
artic
Aci
d
Asp
artic
Aci
dM
ethi
onin
e
Asp
arag
ine
Asp
arag
ine
2.72.9 2.8 2.63.0
(A)
(B)
(C)
Glu
cose
Glu
cose
Eth
anol
Fig. 6 A stack plot of typical 1H NMR spectra of a PLAs and b ALAs showing difference in the metabolic profile. c Expansion of the spectra
between 2.6 to 3.0 ppm
Metabolic profile of pus from liver abscesses 551
123

their strong signal in liver abscess spectra clearly indicates
the abscess with pyogenic origin. Earlier, in vivo and in
vitro 1H NMR investigations had revealed the presence of
acetate and succinate as bacterial fermentation product in
the spectra of pyogenic brain abscesses. These signals had
been used as a diagnostic biomarker for the differentiation
Table 2 Evaluation of statistical significance of metabolites quantified and specific metabolites as observed in the 1H NMR spectra of ALA and
PLA
Metabolites ALA (mg/dl) (n = 85) PLA (mg/dl) (n = 10) P values
Median (range) Median (range)
Tryptophan 1.88 (0.00–29.62) 1.94 (0.00–17.92) NS*
(70%)a (80%)
Phenylalanine 16.32 (0.00–145.40) 9.39 (1.10–114.66) NS
(98.82%) (100%)
Histidine 10.18 (0.00–77.96) 4.66 (0.00–24.94) NS
(95.3%) (90%)
Tyrosine 12.73 (0.00–101.92) 6.68 (0.76–63.60) NS
(98.82%) (100%)
Uracil 0.67 (0.00–8.74) 0.48 (0.00–15.04) NS
(62.35%) (90%)
Glucose 30.90 (0.00–442.06) 10.63 (0.00–77.56) NS
(97.64%) (80%)
Threonine 23.34 (150.10) 10.38 (0.66–103.18) NS
(97.64%) (100%)
Valine 22.52 (0.00–141.62) 8.83 (1.40–156.58) NS
(98.82%) (100%)
Glycine 12.35 (0.19–78.88) 5.23 (1.00–95.14) NS
(100%) (100%)
Lysine 81.69 (1.28–628.88) 52.23 (6.00–747.00) NS
(100%) (100%)
Alanine 26.59 (0.43–157.42) 11.92 (1.66–198.42) NS
(100%) (100%)
Lactate 82.82 (7.65–319.90) 60.54 (9.30–293.16) NS
(100%) (100%)
Acetate 0.00 (2.10–32.08) 32.23 (4.34–130.72) 0.001
(3.52%) (100%)
Succinate Not detected 5.10 (0.95–155.13) 0.001
(3.52%) (1.95–28.0) (100%)
Formate Not detected 6.83 (1.53–17.77) 0.001
(3.52%) (1.10–12.34) (100%)
Aspartic Acid 10.24 (0.40–64.44) Not detected 0.001
(100%) (0.00%)
Asparagine 3.74 (0.00–26.23) Not detected 0.001
(98.82%) (0.00%)
Galactose Not quantified Not detected 0.014
(38.50%) (0.00%)
Propionate Not detected Not quantifiedb 0.001
(0.00%) (100%)
Butyrate Not detected Not quantified 0.001
(0.00%) (100%)
NS* not significant i.e. P values [0.05a Percentage defines the presence of metabolites in respective group. Example: Tryptophan was present in the 70% of the ALA i.e. in 30% ALA
sample it was absent. bNot quantified means metabolites detected in respective group but we are unable to quantify because of signal overlap
552 S. K. Bharti et al.
123

of pyogenic abscesses from tumors and tuberculous brain
abscesses (Garg et al. 2004; Grand et al. 1999; Gupta et al.
2001; Kim et al. 1997; Lai et al. 2002, 2005). These fer-
mentation products had also been utilized for the monitoring
of treatment. (Burtscher and Holtas 1999). Therefore, the
presence of strong signals of acetate, succinate, formate, and
propionate in liver pus samples clearly demonstrate the
presence of pyogenic infection.
Three ALA cases were classified as mixed infection by
NMR, the plausible reason may be the patients had
received antibiotic treatment prior to drainage of liver
abscess. Hence, their culture results were sterile but their
fermentation metabolites persisted in pus samples. NMR
spectroscopy was unable to classify two ALA cases and
this is may be because of low concentration of asparagine
and aspartate which was beyond the NMR detection limit.
Moreover, bacterial fermentation products were also not
observed in these cases, indicating absence of bacterial
infection. Therefore, large sample size is required to ensure
the role of these metabolites for differentiation in liver
abscess especially in mixed infection.
5 Conclusion
On the basis of our results of 1H NMR spectroscopic analysis
of liver pus, it may be concluded that the differential met-
abolic profile of ALA and PLA reflect the different meta-
bolic pathways involved in the infection of E. histolytica and
bacterial pathogens. These differential metabolic profiles of
ALA and PLA can be used to investigate the molecular
pathogenesis of E. histolytica and bacteria. The in vitro
NMR analysis of liver pus suggests that acetate, formate and
succinate can be used as distinguishing marker for PLA from
ALA in in vivo MRS studies. We believe that NMR spec-
troscopy of pus samples may be useful in conjunction with
routine diagnostic methods for better discrimination with
ALAs. For the differentiation with other liver abscesses like
fungal, tubercular etc., verification of metabolic profile of
such abscesses is required using NMR spectroscopy.
Acknowledgment Financial assistance from the Department of
Science and Technology, Govt. of India and Sanjay Gandhi Post
Graduate Institute of Medical Sciences, Lucknow, India are gratefully
acknowledged.
References
Acuna-Soto, R., Samuelson, J., De Girolami, P., Zarate, L., Millan-
Velasco, F., Schoolnick, G., et al. (1993). Application of the
polymerase chain reaction to the epidemiology of pathogenic
and nonpathogenic Entamoeba histolytica. American Journal ofTropical Medicine and Hygiene, 48, 58–70.
Anderson, I. J., & Loftus, B. J. (2005). Entamoeba histolytica:
Observations on metabolism based on the genome sequence.
Experimental Parasitology, 110, 173–177.
Bollard, M. E., Contel, N. R., Ebbels, T. M. D., Smith, L., Beckonert,
O., Cantor, G. H., et al. (2009). NMR-based metabolic profiling
identifies biomarkers of liver regeneration following partial
hepatectomy in the rat. Journal of Proteome Research, 9, 59–69.
Burtscher, I. M., & Holtas, S. (1999). In vivo proton MR spectroscopy
of untreated and treated brain abscesses. American Journal ofNeuroradiology, 20, 1049–1053.
Chang, S.-C., Fang, C.-T., Hsueh, P.-R., Chen, Y.-C., & Luh, K.-T.
(2000). Klebsiella pneumoniae isolates causing liver abscess in
Taiwan. Diagnostic Microbiology and Infectious Disease, 37,
279–284.
Cheng, D. L., Liu, Y. C., Yen, M. Y., Liu, C. Y., Shi, F. W., & Wang,
L. S. (1989). Causal bacteria of pyogenic liver abscess. TaiwanYi Xue Hui Za Zhi, 88, 1008–1011.
Clark, D. P. (1989). The fermentation pathways of Escherichia coli.FEMS Microbiology Letters, 63, 223–234.
Collee, J. G., Miles, R. S., & Watt, B. (1996). Tests for theidentification of bacteria (14th ed.). London: Churchill
Livingstone.
Denkert, C., Budczies, J., Weichert, W., Wohlgemuth, G., Scholz, M.,
Kind, T., et al. (2008). Metabolite profiling of human colon
carcinoma—deregulation of TCA cycle and amino acid turnover.
Molecular Cancer, 7, 72.
Dunn, W. B., & Ellis, D. I. (2005). Metabolomics: Current analytical
platforms and methodologies. Trends in Analytical Chemistry,24, 285–294.
Table 3 Classification of NMR results on the basis of distinct metabolic profile taking PCR and bacterial culture methods as gold standard
method
Gold standard method (N = 95) NMR method
ALA PLA Mixeda Sterileb
PCR ?ve, B.Cult. -ve ALA (n = 85) 80 0 3 2
PCR -ve, B.Cult. ?ve PLA (n = 10) 0 10 0 0
NMR results were classified on the basis of aspartic acid, asparagine/galactose in ALA and bacterial fermentation product such as acetate,
succinate, formate, butyrate and propionate in PLA. Gold Standard Criteria: ALA; PCR positive for E. histolytica and culture negative for
bacteria and PLA; PCR negative for E. histolytica and culture positive for bacteria. Other cases were excluded as discussed in Sect. 2a Mixed (both ALA and PLA) was classified on the basis of NMR metabolic profileb Neither ALA nor PLA was classified on the basis of NMR metabolic profile
Metabolic profile of pus from liver abscesses 553
123

Fotedar, R., Stark, D., Beebe, N., Marriott, D., Ellis, J., & Harkness, J.
(2007a). Laboratory diagnostic techniques for Entamoeba spe-
cies. Clinical Microbiology Reviews, 20, 511–532. (table of
contents).
Fotedar, R., Stark, D., Beebe, N., Marriott, D., Ellis, J., & Harkness, J.
(2007b). PCR detection of Entamoeba histolytica, Entamoebadispar, and Entamoeba moshkovskii in stool samples from
Sydney. Australian Journal of Clinical Microbiology, 45,
1035–1037.
Foxall, P. J., Parkinson, J. A., Sadler, I. H., Lindon, J. C., &
Nicholson, J. K. (1993). Analysis of biological fluids using
600 MHz proton NMR spectroscopy: Application of homonu-
clear two-dimensional J-resolved spectroscopy to urine and
blood plasma for spectral simplification and assignment. Journalof Pharmaceutical and Biomedical Analysis, 11, 21–31.
Gao, H., Lu, Q., Liu, X., Cong, H., Zhao, L., Wang, H., et al. (2009).
Application of 1H NMR-based metabonomics in the study of
metabolic profiling of human hepatocellular carcinoma and liver
cirrhosis. Cancer Science, 100, 782–785.
Garg, M., Gupta, R. K., Husain, M., Chawla, S., Chawla, J., Kumar,
R., et al. (2004). Brain abscesses: Etiologic categorization with
in vivo proton MR spectroscopy. Radiology, 230, 519–527.
Govindaraju, V., Young, K., & Maudsley, A. A. (2000). Proton NMR
chemical shifts and coupling constants for brain metabolites.
NMR in Biomedicine, 13, 129–153.
Grand, S., Passaro, G., Ziegler, A., Esteve, F., Boujet, C., Hoffmann,
D., et al. (1999). Necrotic tumor versus brain abscess: impor-
tance of amino acids detected at 1H MR spectroscopy—initial
results. Radiology, 213, 785–793.
Gupta, R. K., Vatsal, D. K., Husain, N., Chawla, S., Prasad, K. N.,
Roy, R., et al. (2001). Differentiation of tuberculous from
pyogenic brain abscesses with in vivo proton MR spectroscopy
and magnetization transfer MR imaging. American Journal ofNeuroradiology, 22, 1503–1509.
Haque, R., Mollah, N. U., Ali, I. K., Alam, K., Eubanks, A., Lyerly,
D., et al. (2000). Diagnosis of amoebic liver abscess and
intestinal infection with the TechLab Entamoeba histolytica II
antigen detection and antibody tests. Journal of ClinicalMicrobiology, 38, 3235–3239.
Huang, C. J., Pitt, H. A., Lipsett, P. A., Osterman, F. A., Jr, Lillemoe,
K. D., Cameron, J. L., et al. (1996). Pyogenic hepatic abscess.
Changing trends over 42 years. Annals of Surgery, 223,
600–607. (discussion 607–609).
Khairnar, K., & Parija, S. C. (2007). A novel nested multiplex
polymerase chain reaction (PCR) assay for differential detection
of Entamoeba histolytica, E. moshkovskii and E. dispar DNA in
stool samples. BMC Microbiology, 7, 47.
Khan, U., Mirdha, B. R., Samantaray, J. C., & Sharma, M. P. (2006).
Detection of Entamoeba histolytica using polymerase chain
reaction in pus samples from amoebic liver abscess. IndianJournal of Gastroenterology, 25, 55–57.
Kim, S. H., Chang, K. H., Song, I. C., Han, M. H., Kim, H. C., Kang,
H. S., et al. (1997). Brain abscess and brain tumor: Discrimi-
nation with in vivo H-1 MR spectroscopy. Radiology, 204,
239–245.
Lai, P. H., Ho, J. T., Chen, W. L., Hsu, S. S., Wang, J. S., Pan, H. B.,
et al. (2002). Brain abscess and necrotic brain tumor: Discrim-
ination with proton MR spectroscopy and diffusion-weighted
imaging. American Journal of Neuroradiology, 23, 1369–1377.
Lai, P. H., Li, K. T., Hsu, S. S., Hsiao, C. C., Yip, C. W., Ding, S.,
et al. (2005). Pyogenic brain abscess: Findings from in vivo 1.5-
T and 11.7-T in vitro proton MR spectroscopy. AmericanJournal of Neuroradiology, 26, 279–288.
Larive, C. K., Jayawickrama, D., & Orfi, L. (1997). Quantitative
analysis of peptides with NMR spectroscopy. Applied Spectros-copy, 51, 1531–1536.
Latchman, D. S. (1995). PCR applications in pathology: Principlesand practice. Oxford: Oxford University Press.
Lee, K. T., Wong, S. R., & Sheen, P. C. (2001). Pyogenic liver
abscess: An audit of 10 years’ experience and analysis of risk
factors with invited commentary. Digestive Surgery, 18,
459–466.
Lindon, J. C., Nicholson, J. K., & Everett, J. R. (1999). NMR
spectroscopy of biofluids. In G. A. Webb (Ed.), Annual reportson NMR spectroscopy (pp. 1–88). London: Academic Press.
Lindon, J. C., Nicholson, J. K., Holmes, E., & Everett, J. R. (2000).
Metabonomics: Metabolic processes studied by NMR spectros-
copy of biofluids. Concepts in Magnetic Resonance, 12,
289–320.
Lindon, J. C., Holmes, E., & Nicholson, J. K. (2003). So what’s the
deal with metabonomics? Analytical Chemistry, 75, 384A–391A.
Lodhi, S., Sarwari, A. R., Muzammil, M., Salam, A., & Smego, R. A.
(2004). Features distinguishing amoebic from pyogenic liver
abscess: A review of 577 adult cases. Tropical Medicine andInternational Health, 9, 718–723.
Loftus, B., Anderson, I., Davies, R., Alsmark, U. C., Samuelson, J.,
Amedeo, P., et al. (2005). The genome of the protist parasite
Entamoeba histolytica. Nature, 433, 865–868.
Markley, J. L., Anderson, M. E., Cui, Q., Eghbalnia, H. R., Lewis, I.
A., Hegeman, A. D., et al. (2007). New bioinformatics resources
for metabolomics. Pacific Symposium on Biocomputing, 12,
157–168.
Murarka, A., Dharmadi, Y., Yazdani, S. S., & Gonzalez, R. (2008).
Fermentative utilization of glycerol by Escherichia coli and its
implications for the production of fuels and chemicals. Appliedand Environmental Microbiology, 74, 1124–1135.
Nicholson, J. K., & Wilson, I. D. (1989). High resolution proton
magnetic resonance spectroscopy of biological fluids. Progressin Nuclear Magnetic Resonance Spectroscopy, 21, 449–501.
Nicholson, J. K., Foxall, P. J. D., Spraul, M., Farrant, R. D., &
Lindon, J. C. (1995). 750 MHz 1H and 1H-13C NMR spectros-
copy of human blood plasma. Analytical Chemistry, 67,
793–811.
Parija, S. C., & Khairnar, K. (2007). Detection of excretory
Entamoeba histolytica DNA in the urine, and detection of
E. histolytica DNA and lectin antigen in the liver abscess pus for
the diagnosis of amoebic liver abscess. BMC Microbiology, 7,
41.
Pinero-Sagredo, E., Nunes, S., de Los Santos, M. J., Celda, B., &
Esteve, V. (2010). NMR metabolic profile of human follicular
fluid. NMR in Biomedicine, 23, 485–495.
Rahimian, J., Wilson, T., Oram, V., & Holzman, R. S. (2004).
Pyogenic liver abscess: Recent trends in etiology and mortality.
Clinical Infectious Diseases, 39, 1654–1659.
Rahmatulla, R. H., Al-Mofleh, I. A., Al-Rashed, R. S., Al-Hedaithy,
M. A., & Mayet, I. Y. (2001). Tuberculous liver abscess: A case
report and review of literature. European Journal of Gastroen-terology and Hepatology, 13, 437–440.
Ralls, P. W., Barnes, P. F., Radin, D. R., Colletti, P., & Halls, J.
(1987). Sonographic features of amoebic and pyogenic liver
abscesses: A blinded comparison. American Journal of Roent-genology, 149, 499–501.
Rocha, C. M., Barros, A. S., Gil, A. M., Goodfellow, B. J., Humpfer,
E., Spraul, M., et al. (2010). Metabolic profiling of human lung
cancer tissue by 1H high resolution magic angle spinning
(HRMAS) NMR spectroscopy. Journal of Proteome Research,9, 319–332.
Silwood, C. J. L., Lynch, E., Claxson, A. W. D., & Grootveld, M. C.
(2002). 1H and 13C NMR spectroscopic analysis of human
saliva. Journal of Dental Research, 81, 422–427.
Sue Moody-Haupt, J. H. P., Mirelman, D., & McConville, M. J.
(2000). The major surface antigens of Entamoeba histolytica
554 S. K. Bharti et al.
123

trophozoites are GPI-anchored proteophosphoglycans. Journalof Molecular Biology, 297, 409–420.
Sweatman, B. C., Farrant, R. D., Holmes, E., Ghauri, F. Y.,
Nicholson, J. K., & Lindon, J. C. (1993). 600 MHz 1H-NMR
spectroscopy of human cerebrospinal fluid: Effects of sample
manipulation and assignment of resonances. Journal of Phar-maceutical and Biomedical Analysis, 11, 651–664.
Tannich, E., & Burchard, G. D. (1991). Differentiation of pathogenic
from nonpathogenic Entamoeba histolytica by restriction frag-
ment analysis of a single gene amplified in vitro. Journal ofClinical Microbiology, 29, 250–255.
Verweij, J. J., Blange, R. A., Templeton, K., Schinkel, J., Brienen, E.
A., van Rooyen, M. A., et al. (2004). Simultaneous detection of
Entamoeba histolytica, Giardia lamblia, and Cryptosporidiumparvum in fecal samples by using multiplex real-time PCR.
Journal of Clinical Microbiology, 42, 1220–1223.
Virendra Jaiswal, U. G., Kumar, S., Baijal, S. S., Mittal, B., Dhole, T.
N., & Ghoshal, U. C. (2010). Diagnosis of amoebic liver abscess:
A study to evaluate the role of IgG antibody, antigen detection
and polymerase chain reaction. Indian Journal of Gastroenter-ology, 29, 106–107.
Wang, Q., Ou, M. S., Kim, Y., Ingram, L. O., & Shanmugam, K. T.
(2010). Metabolic flux control at the pyruvate node in an
anaerobic Escherichia coli strain with an active pyruvate
dehydrogenase. Applied and Environmental Microbiology, 76,
2107–2114.
WHO. (1997). Amoebiasis. Weekly Epidemiological Record, 72,
97–99.
Wishart, D. S., Knox, C., Guo, A. C., Eisner, R., Young, N., Gautam,
B., et al. (2009). HMDB: A knowledgebase for the human
metabolome. Nucleic Acids Research, 37, D603–D610.
Zaman, S., Khoo, J., Ng, S. W., Ahmed, R., Khan, M. A., Hussain, R.,
et al. (2000). Direct amplification of Entamoeba histolytica DNA
from amoebic liver abscess pus using polymerase chain reaction.
Parasitology Research, 86, 724–728.
Zeehaida, M., Wan Nor Amilah, W. A., Amry, A. R., Hassan, S.,
Sarimah, A., & Rahmah, N. (2008). A study on the usefulness of
Techlab Entamoeba histolytica II antigen detection ELISA in the
diagnosis of amoebic liver abscess (ALA) at Hospital Universiti
Sains Malaysia (HUSM), Kelantan, Malaysia. Tropical Biomed-icine, 25, 209–216.
Metabolic profile of pus from liver abscesses 555
123