A metabolomic view of how the human gut microbiota impacts the host metabolome using humanized and...
11
ORIGINAL ARTICLE A metabolomic view of how the human gut microbiota impacts the host metabolome using humanized and gnotobiotic mice A Marcobal 1 , PC Kashyap 1,2 , TA Nelson 3 , PA Aronov 4 , MS Donia 5 , A Spormann 3 , MA Fischbach 5 and JL Sonnenburg 1 1 Department of Microbiology and Immunology, Stanford University School of Medicine, Stanford, CA, USA; 2 Department of Gastroenterology and Hepatology, Mayo Clinic, Rochester, MN, USA; 3 Department of Chemical Engineering, Stanford University School of Medicine, Stanford, CA,USA; 4 Vincent Coates Foundation Mass Spectrometry Laboratory, Stanford University, Stanford, CA, USA and 5 Department of Bioengineering and Therapeutic Sciences and California Institute for Quantitative Biosciences, University of California, San Francisco, San Francisco, CA, USA Defining the functional status of host-associated microbial ecosystems has proven challenging owing to the vast number of predicted genes within the microbiome and relatively poor understanding of community dynamics and community–host interaction. Metabolomic approaches, in which a large number of small molecule metabolites can be defined in a biological sample, offer a promising avenue to ‘fingerprint’ microbiota functional status. Here, we examined the effects of the human gut microbiota on the fecal and urinary metabolome of a humanized (HUM) mouse using an optimized ultra performance liquid chromatography–mass spectrometry-based method. Differences between HUM and conventional mouse urine and fecal metabolomic profiles support host-specific aspects of the microbiota’s metabolomic contribution, consistent with distinct microbial composi- tions. Comparison of microbiota composition and metabolome of mice humanized with different human donors revealed that the vast majority of metabolomic features observed in donor samples are produced in the corresponding HUM mice, and individual-specific features suggest ‘persona- lized’ aspects of functionality can be reconstituted in mice. Feeding the mice a defined, custom diet resulted in modification of the metabolite signatures, illustrating that host diet provides an avenue for altering gut microbiota functionality, which in turn can be monitored via metabolomics. Using a defined model microbiota consisting of one or two species, we show that simplified com- munities can drive major changes in the host metabolomic profile. Our results demonstrate that metabolomics constitutes a powerful avenue for functional characterization of the intestinal microbiota and its interaction with the host. The ISME Journal (2013) 7, 1933–1943; doi:10.1038/ismej.2013.89; published online 6 June 2013 Subject Category: Microbe-microbe and microbe-host interactions Keywords: metabolomics; humanized mice; gut microbiota; UPLC-MS Introduction The metabolic capacity of the human body is a product of resident microbial communities integrated with human cells. This view has generated an increasing interest in defining the effect of the resident microbiota on the set of small molecule metabolites associated with a host. A frontier in intestinal microbiota studies is to extend our under- standing of host-resident microbes beyond microbial species or genes, to link microbial community structures with microbial functions that could impact human health. Metabolomics has emerged as a technique that allows the functional status of host– microbial integration to be defined in biological fluids and tissues, such as urine, blood and feces. Metabolites originate from a complex network of chemical and biochemical pathways and offer a chemical fingerprint of microbiota functional status. Although confirming the identity of individual small molecules is currently challenging, when established, this information offers insight into the chemical messengers that mediate microbe–microbe and microbe–host interactions. Ultra performance liquid chromatography (UPLC) coupled with high- resolution mass spectrometry (MS) allows reprodu- cible measurements of a wide range of metabolites in a complex sample. Correspondence: JL Sonnenburg, Department of Microbiology and Immunology Stanford University School of Medicine, 299 Campus Drive, Fairchild Building D315 Stanford, CA 94305, USA. E-mail: [email protected] Received 20 December 2012; revised 21 March 2013; accepted 24 April 2013; published online 6 June 2013 The ISME Journal (2013) 7, 1933–1943 & 2013 International Society for Microbial Ecology All rights reserved 1751-7362/13 www.nature.com/ismej
-
Upload
independent -
Category
Documents
-
view
1 -
download
0
Transcript of A metabolomic view of how the human gut microbiota impacts the host metabolome using humanized and...

ORIGINAL ARTICLE
A metabolomic view of how the human gutmicrobiota impacts the host metabolome usinghumanized and gnotobiotic mice
A Marcobal1, PC Kashyap1,2, TA Nelson3, PA Aronov4, MS Donia5, A Spormann3,MA Fischbach5 and JL Sonnenburg1
1 Department of Microbiology and Immunology, Stanford University School of Medicine, Stanford, CA,USA; 2Department of Gastroenterology and Hepatology, Mayo Clinic, Rochester, MN, USA;3Department of Chemical Engineering, Stanford University School of Medicine, Stanford, CA,USA;4Vincent Coates Foundation Mass Spectrometry Laboratory, Stanford University, Stanford, CA, USA and5Department of Bioengineering and Therapeutic Sciences and California Institute for QuantitativeBiosciences, University of California, San Francisco, San Francisco, CA, USA
Defining the functional status of host-associated microbial ecosystems has proven challengingowing to the vast number of predicted genes within the microbiome and relatively poorunderstanding of community dynamics and community–host interaction. Metabolomic approaches,in which a large number of small molecule metabolites can be defined in a biological sample, offer apromising avenue to ‘fingerprint’ microbiota functional status. Here, we examined the effects of thehuman gut microbiota on the fecal and urinary metabolome of a humanized (HUM) mouse using anoptimized ultra performance liquid chromatography–mass spectrometry-based method. Differencesbetween HUM and conventional mouse urine and fecal metabolomic profiles support host-specificaspects of the microbiota’s metabolomic contribution, consistent with distinct microbial composi-tions. Comparison of microbiota composition and metabolome of mice humanized with differenthuman donors revealed that the vast majority of metabolomic features observed in donor samplesare produced in the corresponding HUM mice, and individual-specific features suggest ‘persona-lized’ aspects of functionality can be reconstituted in mice. Feeding the mice a defined, custom dietresulted in modification of the metabolite signatures, illustrating that host diet provides an avenuefor altering gut microbiota functionality, which in turn can be monitored via metabolomics. Usinga defined model microbiota consisting of one or two species, we show that simplified com-munities can drive major changes in the host metabolomic profile. Our results demonstrate thatmetabolomics constitutes a powerful avenue for functional characterization of the intestinalmicrobiota and its interaction with the host.The ISME Journal (2013) 7, 1933–1943; doi:10.1038/ismej.2013.89; published online 6 June 2013Subject Category: Microbe-microbe and microbe-host interactionsKeywords: metabolomics; humanized mice; gut microbiota; UPLC-MS
Introduction
The metabolic capacity of the human body is aproduct of resident microbial communities integratedwith human cells. This view has generated anincreasing interest in defining the effect of theresident microbiota on the set of small moleculemetabolites associated with a host. A frontier inintestinal microbiota studies is to extend our under-standing of host-resident microbes beyond microbialspecies or genes, to link microbial community
structures with microbial functions that could impacthuman health. Metabolomics has emerged as atechnique that allows the functional status of host–microbial integration to be defined in biologicalfluids and tissues, such as urine, blood and feces.Metabolites originate from a complex network ofchemical and biochemical pathways and offer achemical fingerprint of microbiota functional status.Although confirming the identity of individualsmall molecules is currently challenging, whenestablished, this information offers insight into thechemical messengers that mediate microbe–microbeand microbe–host interactions. Ultra performanceliquid chromatography (UPLC) coupled with high-resolution mass spectrometry (MS) allows reprodu-cible measurements of a wide range of metabolites ina complex sample.
Correspondence: JL Sonnenburg, Department of Microbiology andImmunology Stanford University School of Medicine, 299 CampusDrive, Fairchild Building D315 Stanford, CA 94305, USA.E-mail: [email protected] 20 December 2012; revised 21 March 2013; accepted 24April 2013; published online 6 June 2013
The ISME Journal (2013) 7, 1933–1943& 2013 International Society for Microbial Ecology All rights reserved 1751-7362/13
www.nature.com/ismej

Mice provide an experimentally tractable modelto investigate how resident microbial communitiesimpact small molecule metabolites present in hostbiofluids. Comparisons of conventional mice thatharbor a complex microbiota with germ-free (GF)mice that lack a microbiota have established theprofound microbial impact on host metabolomicprofile (Claus et al., 2008; Swann et al., 2011a).Manipulation of microbiota composition via oralantibiotic treatment, cohousing mice with differentmicrobiotas, and creation of simplified microbiotasin ex-GF (gnotobiotic) mice (Yap et al., 2008) haveillustrated the dynamic nature of microbial hostmetabolomic integration to influence metabolomicsignatures (Goodwin et al., 1994). Additional experi-mental manipulation of external factors known tomodify the gut microbiota (for example, dietarychange and probiotic treatment) constitute importantfirst steps toward elucidating the mechanisms thatdrive alterations in microbe-dependent metabolomicphenotypes (Marchesi et al., 2007; Holmes et al.,2008; Kessner et al., 2008; Wikoff et al., 2009).
Although the distal gut microbiota of mice andhumans harbor the same bacterial phyla, 85% ofgenera and microbial species found in mice are notseen in humans (Ley et al., 2005). HUM mice (ex-GFmice colonized with a human microbiota) areemerging as a powerful model for studying human-relevant microbes in a controlled experimentalsetting (Mallett et al., 1987; Bowey et al., 2003). Herewe use HUM mice as a model for studying metabo-lomic changes within urine and feces. To definemicrobe-related signatures in the urine and feces ofthis mouse model, we have optimized a nontargetedmetabolomics UPLC-MS method. We have appliedthis method to samples from HUM and conventionalmice, demonstrating that the mice harboring thehuman microbiota express a set of metabolitesdistinct from that of their mouse microbiota-harbor-ing counterparts. We have established a significantoverlap in microbe-dependent metabolomes of micehumanized with different donor samples. Coloniza-tion of GF mice with one or two microbial speciesshows that simple models of the microbiota can drivemajor changes in host metabolomic profile, althoughdistinct from the impact exerted by a complexmicrobiota. Our results demonstrate that the applica-tion of metabolomic analysis to HUM mice constitu-tes a powerful approach for characterization ofintestinal microbiota functional status.
Materials and methods
MiceGF Swiss-Webster (SW) and C57BL/6J and conven-tional (RF, Taconic Inc., Cambridge city, IN, USA)SW mice were maintained as previously described(Sonnenburg et al., 2010). Humanization wasperformed using human fecal samples obtainedfrom healthy anonymous donors. Frozen feces were
thawed by dilution in an equal volume of pre-reduced phosphate-buffered saline in anerobic con-ditions and 0.2 ml non-settling material was gavagedinto GF-recipient mice. Mice were fed standard diet(Purina LabDiet 5K67) or polysaccharide-deficientdiet (Bio-Serv, Frenchtown, NJ, USA; Sonnenburget al., 2010). GF mice were mono- or bi-associatedusing oral gavage with 108 colony-forming units ofBacteroides thetaiotaomicron (Bt) VPI-5482 and/orBifidobacterium longum (Bl) NCC2705. Bacteria werecultured under anerobic conditions at 37 1C intryptone-yeast extract-glucose medium (Sonnenburget al., 2010) or Reinforced Clostridial Medium(Becton Dickinson and Company, Sparks, MD,USA). All experiments were done according to theA-PLAC, the Stanford IACUC. Urine and fecalsamples were collected and placed in a freezer at� 70 1C within 30 min of collection until analysis.
Urine sample preparationTwenty microlitres of urine sample was mixed with40ml of 10 mM ammonium formate. Five microlitresof the mixture was used in the reverse-phase liquidchromatography (RPLC)-electrospray ionization(ESI) analysis. When reverse-phase analysis wascompleted, samples were decapped, 10 mL aliquotsof remaining samples were transferred into anotherset of high-performance liquid chromatography vialsand resuspended with 30mL acetonitrile for hydro-philic interaction chromatography (HILIC)-ESI ana-lysis, using 10ml per injection.
Fecal sample preparationFive hundred microlitres of 1:1 methanol: acidifiedwater (0.1% formic acid) was added to 10–30 mg offeces. Tubes were vortexed at 4 1C for 15 min. Aftervortexing, the tube was placed in a 4 1C centrifuge at500� g for 15 min. The supernatant was pipettedinto a new tube, with care to minimize disruption ofthe pellet. The resulting fecal water samples wereextracted by using solid-phase OASIS extractioncartridges (Waters, Mifford, MA, USA). Metaboliteswere eluted with 500 ml methanol, dried in aspeedvac and resuspended in 100 ml of initial mobilephase composition corresponding to the two differ-ent chromatography methods below. Five micro-litres of the 100 ml sample was used in the analysis.
RPLC conditionsChromatographic separation was performed on a150-mm� 2.1-mm Kinetex 1.7 mm C18 column(Phenomenex, Torrance, CA, USA) using a ACQUITYUltra Performance Liquid Chromatography system(Waters). The flow rate was 0.25 ml min�1. Columnwas held at 40 1C. Solvent A was 10 mM ammoniumformate in water and solvent B was 10 mM ammo-nium formate in methanol. The gradient started at5% B and linearly increased to 10% B at 14 min;
Metabolomics of HUM and gnotobiotic miceA Marcobal et al
1934
The ISME Journal

then linearly increased to 100% B at 22 min; andheld at 100% B for 5 min. The column was equilibra-ted at 5% B for 3 min before starting the run. First1.3 min of mobile phase flow were diverted from theion source into the waste.
HILIC conditionsChromatographic separation was performed usingthe 150-mm� 2.1-mm Cogent Diamond Hydride,4mm 100 A HILIC column (MicroSolv, Eatontown,NJ, USA). Column temperature was 40 1C. The flowrate was 0.4 ml min� 1. Solvent A was 10% acetoni-trile with 15 mM ammonium formate and solvent Bwas 90% acetonitrile with 15 mM ammonium for-mate. The gradient started at 100% B for 1 min,followed by a linear decrease to 30% B over 14 min,a hold at 30% B for 1 min, and a 0.6 ml min� 1 hold at100% B for 1 min. The column was equilibrated at100% B for 5 min before starting the run.
MS conditionsMS was performed on the Exactive (Thermo Fisher,Waltham, MA, USA) orbitrap mass spectrometeroperated in positive and negative electrospray modeand controlled by Xcalibur 2.1 software. The scanrange was from 70 to 800 m/z, at 50 000 full widthat half maximum resolution. For positive mode(ESIþ ), we used the following conditions: sheathgas flow rate 40 (arbitrary units), auxilary gasflow rate 8 (arbitrary units), sweep gas flow rate 1(arbitrary units), spray voltage 3.5 kV, capillarytemperature 275 1C, capillary voltage � 60 V, tubelens voltage � 100 V and skimmer voltage � 20 V.For negative electrospray mode (ESI� ), the follow-ing conditions were used: sheath gas flow rate 30(arbitrary units), auxiliary gas flow rate 4 (arbitraryunits), sweep gas flow rate 1 (arbitrary units), sprayvoltage 3.5 kV, capillary temperature 275 1C, capil-lary voltage � 60 V, tube lens voltage � 100 V andskimmer voltage � 21 V.
Data analysisProfile mode raw data from the individual analyseswere converted to centroid mode mzXML files withmsconvert and subjected to nonlinear data align-ment by xcms (Smith et al., 2006; Kessner et al.,2008). Intensity data files were imported into theweb-based program MetaboAnalyst for statisticalunivariate and multivariate analysis (http://www.metaboanalyst.ca). Unbiased metabolite iden-tification was determined using METLIN databaseusing a maximum error of 3 p.p.m., empiricalformulas (Smith et al., 2005). When possible,compound identity validations were performed byanalyzing pure compounds (Supplementary FigureS8). Tryptamine, indoxyl glucuronide, creatine,creatinine and 5-hydroxyindole were obtained fromSigma-Aldrich (St Louis, MO, USA). Features that
vary significantly between the two sample sets wereevaluated by univariate statistical analysis, andsignificance was defined as 410-fold change withP-valueo0.01.
Detection of indole-3-lactic acid production by liquidchromatography-tandem mass spectrometryOvernight culture of Bl NCC2705 was grown inReinforced Clostridial Medium supplemented with0.1% L-tryptophan (Sigma-Aldrich). Two hundredmicrolitres of culture before and after growth werecollected, centrifuged (2700� g, 10 min) and fil-tered. Four volumes of cold methanol were addedand protein precipitate was removed by centrifuga-tion. Supernatants were dried in a speedvac andreconstituted in 250 ml of acetonitrile:water (10:90).Ten microlitres of each samples were used for theanalysis. Chromatographic separation was per-formed on a 150-mm� 2.1-mm Zorbac 5mm C18column using Agilent liquid chromatography (LC)pump/autosampler system (Agilent, Santa Clara,CA, USA). The flow rate was 0.2 ml min�1. SolventA was 0.1% formic acid in water and solvent B was0.1% formic acid in acetonitrile. The gradient startedat 5% B, then linearly increased to 95% B at 25 minand held at 95% B for 5 min. The column wasequilibrated at 5% B for 5 min before starting the run.MS was performed on the LTQ orbitrapXL (ThermoFisher) mass spectrometer operatedin positive elec-trospray mode (full scan/CID,m/z¼ 206.2). The scanrange was from 120 to 1000 Da. Standards of try-ptophan and indole-3-lactic acid were used in theanalysis (Sigma-Aldrich).
16S ribosomal RNA sequencingAfter fecal DNA isolation (MoBio fecal DNA kit,Carlsbad, CA, USA), 626 bp amplicons (including aunique 12 bp Golay barcode) spanning V3–V5 regionof bacterial 16S ribosomal RNA (rRNA) weregenerated using barcoded forward primer (338F,906R). Samples were sent for pyrosequencing toDuke ISGP using the Roche 454 titanium platform(Indianapolls, IN, USA). Post processing of pyrose-quencing data was done using QIIME (Caporasoet al., 2010). As a first step, data from the sequencingand the metadata were combined to demultiplex thebarcoded reads, and quality filtering was done usingthe default parameters in QIIME. Sequences weregrouped into operational taxonomic units at 97%sequence similarity using uclust. Taxonomy wasassigned using RDP (Ribosomal Database Project)classifier against GreenGenes database, sequenceswere aligned and a phylogenetic tree was built fromreference sequences using FastTree. An operationaltaxonomic unit table showing counts of eachoperational taxonomic unit in each sample wasproduced. Beta diversity was determined usingunweighted UniFrac (Lozupone et al., 2006) and isrepresented as principal co-ordinate plots.
Metabolomics of HUM and gnotobiotic miceA Marcobal et al
1935
The ISME Journal

Results
UPLC-MS reveals the effect of the gut microbiota on theurine and fecal metabolomes of HUM miceWe have optimized a UPLC-MS-based method thatallows the examination of the metabolomic profile ofmurine fecal and urine samples. Our goal was toinvestigate the dynamics of small molecules producedby a human gut microbiota using a HUM mousemodel. Urine and fecal samples were collected fromadult (8 weeks old; GF SW mice, n¼ 3), followed bycolonization of these mice using a fecal sample froman adult human (‘humanization’, achieved by gavageof GF mice with 200ml of frozen fecal samplereconstituted 1:1 using pre-reduced phosphate-buffered saline). Eight weeks after humanization,urine and fecal samples were collected again (HUMsamples, n¼ 3). Throughout the experiment, micewere maintained on a standard plant polysaccharide-rich diet (RD) inside gnotobiotic isolators. An UPLC-MS-based untargeted metabolomic approach con-sisted of either of two types of chromatographicconditions (RPLC or HILIC), and two ionizationconditions (ESI in positive mode, ESIþ ; or negativemode, ESI� ), resulting in four possible combinationsof these conditions (see Figure 1a for a schematicoverview of the approach). The rationale behindemploying these different conditions is to detect asmany classes of small molecules (for example, hydro-phobic, hydrophilic, negatively charged and posi-tively charged) as possible.
MS was performed with a mass accuracy within2 p.p.m. and metabolites were detected within themass range of 70–800 m/z. The resulting peakintensity data matrix was filtered to eliminatefeatures obtained when column conditioning andwashing steps were performed (SupplementaryFigure S1). Features were obtained with the follow-ing chromatography retention times: 1.5–20 min forRPLC, or 1–17 min for HILIC. RPLC-ESIþ detectedthe largest number of features in urine, and RPLC-ESI� detected the largest number of features in thefecal samples (Figure 1b). Despite urine havinggenerally a larger number of features than feces,the number of significantly different featuresbetween HUM and GF mice metabolomes washigher in fecal samples than in urine, independentof the chromatographic and ionization methodutilized (Figure 1c). Our analysis included theidentification of clusters of masses with sameretention time, which correspond to naturallyoccurring isotopes, clusters, fragments or adducts(for example, MþHþ , MþNaþ and MþKþ ) of thesame molecule. Although the number of possibleclusters or adducts varies in each method, anexample of the percentage of these features as apercentage of total features is shown in Figure 1d.Our analysis shows that these features do not affectour estimate of the number of unique metabolicfeatures. The complete set of these features char-acteristic for HUM or GF mice in each of themethods can be found in Supplementary Table S1.
Fecal Sample
Urine Sample
Solid phase extractionHLB columns
UPLC-MS Peak intensity data file
MetaboAnalyst
Univariate analysis Multivariate analysis
Significant Different Features
Hierarchical Cluster/Heatmap
t-test/fold change
PCA/PLS-DA
Unbiased metaboliteidentification (METLIN)
0
50
100
150
200
250
RP
LC-E
SI+
RP
LC-E
SI-
HIL
IC-E
SI+
HIL
IC-E
SI-
RP
LC-E
SI+
RP
LC-E
SI-
HIL
IC-E
SI+
HIL
IC-E
SI-
Sig
nific
ant d
iffer
ent
feat
ures
GF>HM
HM>GF
Fecal samples Urine samples
0
500
1000
1500
2000
RP
LC-E
SI+
RP
LC-E
SI-
HIL
IC-E
SI+
HIL
IC-E
SI-
RP
LC-E
SI+
RP
LC-E
SI-
HIL
IC-E
SI+
HIL
IC-E
SI-
Num
ber
of fe
atur
es
Fecal samples Urine samples
4%9%
87%
HUM>GFFecal Samples RPLC-ESI+
Putative compoundsIsotopesAdducts
Figure 1 Ultra performance liquid chromatography (UPLC)-MS analysis reveals microbial-related metabolites in fecal and urinesamples of HUM mice. (a) Experimental workflow for metabolomic data generation and analysis. (b) Number of features detected in fecesand urine of at least one of three HUM mice by different UPLC-MS methods. (c) Number of significantly different features (Po0.01, 410-fold difference) between HUM (n¼3) and GF (n¼3) mice found in urine or fecal metabolome. (d) Percentage of predicted isotopes andadducts in the set of features characteristic of feces from HUM mice (RPLC-ESIþ ).
Metabolomics of HUM and gnotobiotic miceA Marcobal et al
1936
The ISME Journal

Fecal and urine metabolome from HUM mice is distinctfrom conventional miceThe intestinal microbiota of HUM mice reconstitutesmany compositional aspects of the human microbiotaand is distinct from that of a mouse (Ley et al., 2005;Turnbaugh et al., 2009b), but the extent to whichthese communities functionally differ remains under-explored. We assessed the fecal and urinary metabo-lome of mice harboring a native (murine) versushuman-derived microbiota as a measure of commu-nity functionality. Fecal and urine samples fromHUM, conventional and GF SW mice (n¼ 3 micesampled/colonization state) were analyzed usingthe optimized RPLC-ESIþ -based method. Principalcomponent analysis of metabolomic profiles revealcolonization-specific clustering for both fecal andurine samples (Figures 2a and b). Colonization-specific clustering was observed using all fourchromatographic and ionization conditions describedin Figure 1 in both fecal and urine samples,consistent with the differences between coloniza-tion states being independent of the method of datageneration. The differentiation between coloniza-tion states was also observed by hierarchicalclustering performed using the intensities of thedetected features in each sample (Figure 2c for fecalmetabolomes and Figure 2d for urine metabolomes).
Ninety-nine of 821 analyzed features differentiatedthe fecal metabolomes of HUM and conventionalmice; 45 of 2081 features differentiated the urinemetabolomes of these two groups (n¼ 3 per group;410-fold difference in abundance and P-valueo0.01,t-test). These data show that HUM mice derived froma human donor sample have a collection ofmetabolites in urine and feces that is distinct fromthose generated by this group of conventional mice.
The HUM microbiota alters levels of identifiablemetabolitesA major hurdle in metabolomic studies is confirmingthe chemical identity of detected m/z values. Thischallenge is due to deficiencies in pure chemicalstandards and a paucity of database entries related tomicrobial metabolites and their host-conjugatedcounterparts (for example, glucuronidated). We usedan unbiased metabolite identification approach onthe features associated with HUM mouse samples(10-fold relative to GF samples, Po0.01, t-test).Empirical formulas were assigned to a subset offeatures with a maximum error of 3 p.p.m. using theMETLIN database (Smith et al., 2005). When anunambiguous assignment was possible and thecandidate metabolite was available, the pure
PC1 (54.9%)
PC
2 (2
1.8
%)
PC1 (50.9%)
PC
2 (2
2.0
%)
Urine Feces
GF
HUM
CN
2-2 0
-10
Normalized Intensity values
GF
HUM
CN
2-2 0
Normalized Intensity values
10
5
0
-5
-10
10
5
0
-5
-10
-5 0 5 10 15 -10 -5 0 5 10 15
GF HUM CN
GF HUM CN
Figure 2 Humanized (HUM) mice fecal and urine metabolomes are distinct from those of conventional mice. (a, b) Principal componentanalysis (PCA) plot of fecal (a) and urine (b) metabolome from germ-free (GF, pre-humanization), conventional (CN) and HUM mice. (c, d)Hierarchical clustering of the fecal (c) and urine (d) metabolome from GF, CN and HUM mice samples.
Metabolomics of HUM and gnotobiotic miceA Marcobal et al
1937
The ISME Journal
metabolite standard was obtained and analyzedunder the identical chromatographic and ionizationconditions. The resulting spectra were comparedagainst the experimental spectra for compoundverification. The resulting verified identification dataare listed in Supplementary Table S2.
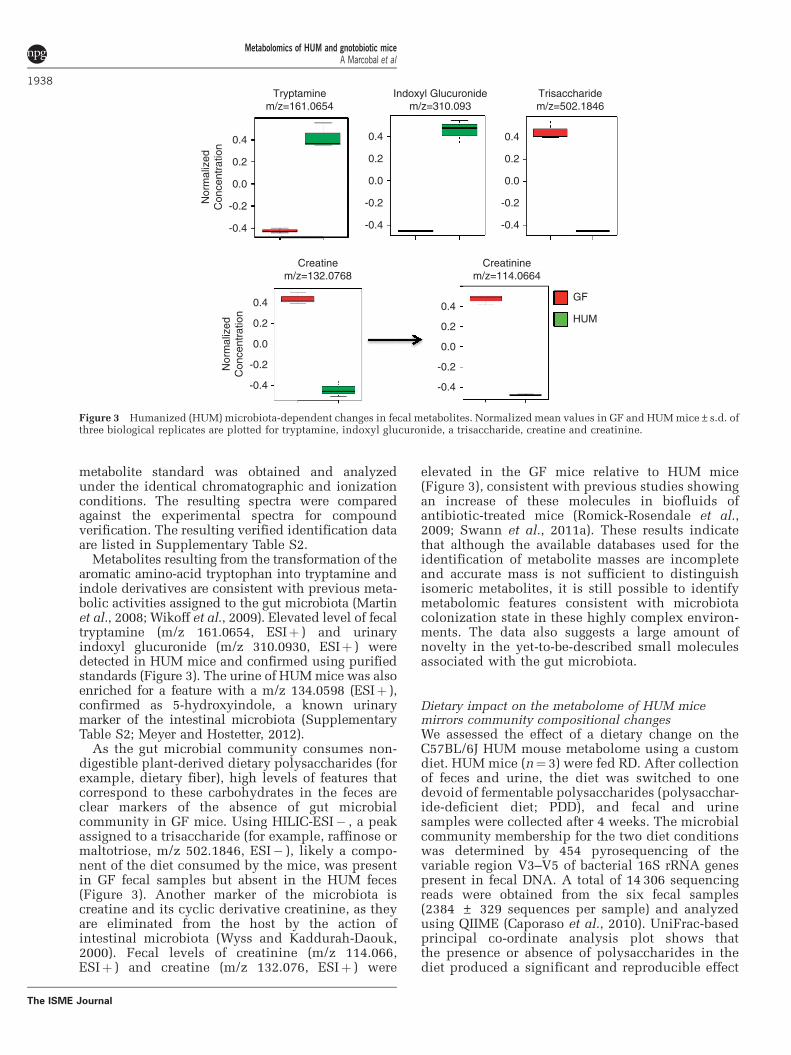
Metabolites resulting from the transformation of thearomatic amino-acid tryptophan into tryptamine andindole derivatives are consistent with previous meta-bolic activities assigned to the gut microbiota (Martinet al., 2008; Wikoff et al., 2009). Elevated level of fecaltryptamine (m/z 161.0654, ESIþ ) and urinaryindoxyl glucuronide (m/z 310.0930, ESIþ ) weredetected in HUM mice and confirmed using purifiedstandards (Figure 3). The urine of HUM mice was alsoenriched for a feature with a m/z 134.0598 (ESIþ ),confirmed as 5-hydroxyindole, a known urinarymarker of the intestinal microbiota (SupplementaryTable S2; Meyer and Hostetter, 2012).
As the gut microbial community consumes non-digestible plant-derived dietary polysaccharides (forexample, dietary fiber), high levels of features thatcorrespond to these carbohydrates in the feces areclear markers of the absence of gut microbialcommunity in GF mice. Using HILIC-ESI� , a peakassigned to a trisaccharide (for example, raffinose ormaltotriose, m/z 502.1846, ESI� ), likely a compo-nent of the diet consumed by the mice, was presentin GF fecal samples but absent in the HUM feces(Figure 3). Another marker of the microbiota iscreatine and its cyclic derivative creatinine, as theyare eliminated from the host by the action ofintestinal microbiota (Wyss and Kaddurah-Daouk,2000). Fecal levels of creatinine (m/z 114.066,ESIþ ) and creatine (m/z 132.076, ESIþ ) were
elevated in the GF mice relative to HUM mice(Figure 3), consistent with previous studies showingan increase of these molecules in biofluids ofantibiotic-treated mice (Romick-Rosendale et al.,2009; Swann et al., 2011a). These results indicatethat although the available databases used for theidentification of metabolite masses are incompleteand accurate mass is not sufficient to distinguishisomeric metabolites, it is still possible to identifymetabolomic features consistent with microbiotacolonization state in these highly complex environ-ments. The data also suggests a large amount ofnovelty in the yet-to-be-described small moleculesassociated with the gut microbiota.
Dietary impact on the metabolome of HUM micemirrors community compositional changesWe assessed the effect of a dietary change on theC57BL/6J HUM mouse metabolome using a customdiet. HUM mice (n¼ 3) were fed RD. After collectionof feces and urine, the diet was switched to onedevoid of fermentable polysaccharides (polysacchar-ide-deficient diet; PDD), and fecal and urinesamples were collected after 4 weeks. The microbialcommunity membership for the two diet conditionswas determined by 454 pyrosequencing of thevariable region V3–V5 of bacterial 16S rRNA genespresent in fecal DNA. A total of 14 306 sequencingreads were obtained from the six fecal samples(2384 ± 329 sequences per sample) and analyzedusing QIIME (Caporaso et al., 2010). UniFrac-basedprincipal co-ordinate analysis plot shows thatthe presence or absence of polysaccharides in thediet produced a significant and reproducible effect
GF
HUM
Creatinem/z=132.0768
Creatininem/z=114.0664
Nor
mal
ized
Con
cent
ratio
n
Nor
mal
ized
Con
cent
ratio
n
Tryptaminem/z=161.0654
0.4
0.2
0.0
-0.2
-0.4
0.4
0.2
0.0
-0.2
-0.4
0.4
0.2
0.0
-0.2
-0.4
0.4
0.2
0.0
-0.2
-0.4
Trisaccharidem/z=502.1846
0.4
0.2
0.0
-0.2
-0.4
Indoxyl Glucuronidem/z=310.093
Figure 3 Humanized (HUM) microbiota-dependent changes in fecal metabolites. Normalized mean values in GF and HUM mice±s.d. ofthree biological replicates are plotted for tryptamine, indoxyl glucuronide, a trisaccharide, creatine and creatinine.
Metabolomics of HUM and gnotobiotic miceA Marcobal et al
1938
The ISME Journal

on microbial composition as the RD mice clusterseparately from the PDD mice (Figure 4a). Samplesfrom the PDD group cluster tightly, indicatinggreater homogeneity within the bacterial profilefor this dietary condition compared with the morecomplex RD. Although both dietary conditionsresulted in a dominance of Firmicutes and Bacter-oidetes, the Bacilli (P¼ 0.017) and b-proteobacteria(P¼ 0.02) were more highly represented in PDD micethan the RD-fed mice (Supplementary Figure S2).
Next, we addressed the effect of diet on themetabolomic profile of fecal and urine samples fromHUM mice fed RD or PDD. Multivariate statisticalanalyses reveal that the fecal metabolomes of thetwo different dietary conditions (RPLC-ESIþ ) arehighly distinguishable and mirror the compositionaldifferences that we observe between samples(Figure 4b, Supplementary Table S3). The urinesamples also showed a similar separation by diet(Supplementary Figure S3). To determine whetherthe separation between samples was due to unmo-dified compounds present in the diet, fecal metabo-lites from RD- and PDD-fed mice were comparedwith extracts of the two different diets. This analysis
revealed that the contribution of compounds presentin the diet to the differences identified between thetwo dietary groups is very low (7.1% of the featuresin feces of RD-fed mice are present in RD; 6.3% ofthe features in feces of PDD-fed mice are present inPDD). Hierarchical clustering of the metabolomicprofiles from feces and diet illustrates that metabo-lites from the diet contribute only a small portion ofthe unique fecal metabolites associated with aspecific diet condition (Figure 4c). These data revealthat diet-induced changes in microbial compositionare mirrored by changes in the microbiota-depen-dent metabolome and suggest that metabolomicscan serve as an effective read-out of diet-inducedalterations in microbiota composition and function.
A simplified model microbiota drives major changes inthe metabolome of GF miceWe next introduced one or two species of bacteriainto GF SW mice to assess the impact of simplifiedcommunities on the fecal and urine metabolomecompared with mice colonized with a complexmicrobial community. GF SW mice were colonized
PDD RD
PC1 (33.2 %)
PC
2 (2
1.5
%)
PC1 (78.3%)
PC
2 (9
.0 %
)
-10
-5
0
5
10
-10 -5 0 5 10
PDD
RD
PDD humanized mice
RD humanized mice
16S rRNA Fecal Metabolome
2-2 0
Normalized Intensity values
0.4
0.2
0
0.2
-0.4-0.4 -0.2 0 0.2 0.4
PDD
RD
Figure 4 Dietary change alters composition and function of HUM mouse microbiota. (a) Principal co-ordinate analysis (PCOA) plot of16S rRNA-based gut microbial profiling from HUM mice fed a regular diet (RD) or polysaccharide-deficient diet (PDD; n¼3 mice pergroup). (b) PCA plot of fecal metabolite profiling from HUM mice fed with two different diets. (c) Hierarchical clustering of fecalmetabolomes from HUM mice fed with two different diets versus metabolomes of the respective mouse diets.
Metabolomics of HUM and gnotobiotic miceA Marcobal et al
1939
The ISME Journal

with either Bt (n¼ 3) or with a mix of equalconcentration of Bt and Bl (n¼ 3). Ten days aftercolonization, urine and fecal samples were collectedfrom both groups of mice. Relative bacterial densitieswithin fecal samples were determined for theBt/Bl group using differential plating (see Materialsand methods), revealing that Bt colonizes oneorder of magnitude higher than Bl (90.2±7.7% ofBt; 9.8±7.7% of Bl). The impact of these simplifiedmicrobiotas on the host metabolome was determinedby analyzing fecal and urine samples by RPLC-ESIþ .Metabolomic profiles of the gnotobiotic samples werecompared with those of GF mice (10-fold, Po0.01,t-test) to identify the microbial signatures of monoand bi-colonization (Supplementary Table S4). Theintroduction of one or two microorganisms in theintestine significantly shifts the urine and fecalmetabolomic profile of the host (Figure 5 for fecalsamples; Supplementary Figure S4 for urine samples).Although the Bt mono- and Bt/Bl bi-associationsproduced metabolomic profiles that are similar toone another, features unique to the bi-colonized miceindicate an impact of Bl, despite the fact that itcolonizes at one order of magnitude less than Bt. Thebi-association-induced changes in metabolomic pro-file may be a result of multiple factors that are alteredupon different colonization states including changesin community member abundance, interactions withthe host and altered gene expression of the microbes.One feature corresponding to indolelactic acid (m/z206.0739, ESIþ ) was detected in Bt/Bl fecal samples,which was not present in the GF and Bt samples.To verify that Bl is able to produce indolelacticacid, we grew Bl in culture medium supplementedwith 0.1% tryptophan (a precursor of indole deriva-tives). The production of indolelactic by Bl wasconfirmed by UPLC-MS comparison with a purifiedstandard (Supplementary Figure S5). Together, thesedata demonstrate that even a low level of colonization,as seen with Bl, is sufficient to impact the fecalmetabolome.
To determine whether colonization with a simpli-fied microbiota drives similar changes in the metabo-lomic profiles as colonization with a complete humanmicrobiota, metabolites associated with humanizationwere compared with those associated with the Bt andBt/Bl colonization states (that is, metabolites notpresent in GF). No features were identified that werecommonly present in HUM mice and either the mono-or bi-colonized mice. However, two metabolitesshowed a decrease in prevalence relative to GF in allthree colonization states (Figure 5). These dataindicate that the metabolome of one and two membermodel microbiotas do not reconstitute the metabolo-mic complexity of a HUM microbiota (SupplementaryFigure S6); however, these simple microbiotas canmodel some aspects of a complete microbiota, such asdepletion of certain compounds. The extent to whichadditional other species within simplified microbiotascan represent metabolomic features of a complexcommunity requires further investigation.
Humanization of mice reconstitutes gut microbialdiversity and human fecal metabolomic profileWe wished to test whether the gut microbialcommunities in human feces retain their composi-tion when transferred to GF mice, and whetheraspects of metabolomic individuality of each humancan be mirrored in the HUM animals. We collectedfeces from three healthy human donors: two malesand one female. Four weeks following humanizationof GF SW mice (n¼ 4–8 per donor), fecal sampleswere collected from each mouse and submittedfor 16S rRNA-based microbial community enumera-tion by pyrosequencing. Unweighted UniFrac-based principal co-ordinate analysis plots of the16S rRNA microbial composition data show that the
154.09721 180.08766 198.15977 206.08085 228.06271 254.08520 266.14609 293.06259 293.06328 300.17989 304.07866 305.13543 328.15978 333.11513 359.14904 376.17563 392.17679 434.18853 250.07975 265.11311 284.09886 298.11437 305.08541 320.09644 431.09768 445.11186 447.09489 507.11384 513.18743 559.15612 583.16348 617.23381 625.17425
m/z (ESIPos)
BT BTBL
01020
100500
>1000
Fold Change
-10-20
-100<-500
HUM
Figure 5 Simplified model microbiotas alter fecal metabolome.Heat-map of microbe-dependent metabolites from fecal samplesof gnotobiotic mice colonized with B. thetaiotaomicron (BT), Btand B. longum (BTBL) or humanized (HUM) mice. Featuressignificantly increased or decreased in either BT or BTBL relativeto GF are shown; fold change410 and P-valueo0.01 m/z valuesin red indicate GF-related features that disappear in all threecolonization states.
Metabolomics of HUM and gnotobiotic miceA Marcobal et al
1940
The ISME Journal

microbiota of HUM mice clusters with the corre-sponding human fecal inoculum (Figure 6a). Thesedata reveal that individual-specific differences ingut microbial communities can be faithfully recon-stituted in GF mice by humanization using humanfeces.
Although a small portion of the detected featuresare specific to either human or mouse samples, mostof the compounds are independent of the source ofthe feces (RPLC-ESIþ , Figure 6b), suggesting thatmuch of the microbiota functional status is recalci-trant to modification by the host species. Moreover,comparison of metabolites common to mice andhuman from the three different sets of samples(donor 1-, 2- or 3-derived) revealed a high degreeof overlap in the metabolomes of these groups,and a low percentage of donor-specific features(Figure 6c). These findings support the idea thatmany functional attributes are shared betweenmicrobiotas that differ compositionally (Turnbaughet al., 2009a). Conversely, some of the features thatdifferentiate donor 3 HUM mouse fecal metabolomefrom those of donor 1 and donor 2 were alsodetected in the human fecal sample of donor 3,and absent in the other human samples (Figure 6dand Supplementary Figure S7). Therefore, someindividualized aspects of the human gut microbio-ta’s metabolomic activity can be reconstructedwithin HUM mice.
Discussion
Sequencing-focused techniques have been usedextensively to characterize the species and genecontent of gut microbial communities associatedwith health or a variety of diseases (Qin et al., 2010;Arumugam et al., 2011; Huttenhower et al., 2012).It is apparent that common functional attributesare found in divergently composed communitiesand conversely, distinct functional traits can beexpressed by similarly composed microbiotas(Turnbaugh et al., 2009a; Nicholson et al., 2012).Therefore, characterization of microbiota functionmay be more illuminating to the status of host–microbial interaction than the microbial species orgene content. Coupled to the importance of attainingthe functional state of a specific microbiota underspecific conditions are additional challenges span-ning from data generation (for example, technical) tointerpretation and integration of new types offunction-focused data sets. Metabolomics offers arapid method of defining hundreds to thousands ofsmall molecules associated with a sample; theresulting spectrum of masses offers a chemical‘fingerprint’ of microbiota function that is informa-tive even in the absence of definitive compoundassignments. Grouping of different samples/commu-nities based on metabolomic profile, quantifying theextent of functional change over time or based on
0
20
40
60
80
100
1 2 3
% F
eatu
res
Features found infecal samples
Human Mice
Common Mice-Human
PC1 (45.9%)-10
PC
2 (2
2 .1
%)
Hmouse_donor1
CommonMice-Human_1
35617
17
10
2
63
CommonMice-Human_2
CommonMice-Human_3
Hmouse_donor2 Hmouse_donor3
PC3-Percent variation explained 2.8%
PC
2-P
erce
nt v
aria
tion
expl
aine
d 4.
6%
Donor 1Hmouse_donor1Donor 2Hmouse_donor2Donor3Hmouse_donor3
0.020
0.015
0.010
0.005
0.000
-0.005
-0.010
-0.015
-0.020
-0.025-0.20 -0.15 -0.10 -0.05 0.00 0.05 0.10 0.15
10
5
0
-5
-10
-5 0 5 10 15
Figure 6 Gut microbial diversity and human fecal metabolome are reconstituted in HUM mice. (a) Principal co-ordinate analysis(PCOA) plot of 16S rRNA-based gut microbial profiling from HUM mice from three different donors (n¼ 4–8 mice per group) and therespective donor samples (open enlarged symbols). (b) Percent of features found in human feces, HUM mouse feces or both, for the threerespective donor/recipient groups using RPLC-ESIþ . (c) Venn diagram with metabolites common to the human and HUM mice samplesfor each donor/recipient group. (d) PCA plot of fecal metabolite profiling from HUM mice colonized with three different fecal samples.
Metabolomics of HUM and gnotobiotic miceA Marcobal et al
1941
The ISME Journal

different treatments, and characterizing the chemicalcomplexity associated with different communitiesare all possible in the absence of knowing thecompound to which each feature corresponds. Agrowing number of examples illustrate that themetabolites derived from this diverse microbialcommunity can have a direct role in human healthand disease, indicating that this universe of smallmolecules not only serves as an excellent proxy forfunctional state, but also provides a window into thecompounds that are mediating microbe–microbe andmicrobe–host interaction (Nicholson et al., 2012).
The investigation of microbiota function is metwith two related challenges. First, the sensitivity ofmicrobiota adaptation to environmental variables(for example, diet) necessitates the need for a highlycontrolled experimental platform to generate repro-ducible, interpretable data, such as a mouse model.Second, the desire to study human-relevantmicrobes, which differ from those that are found inthe native mouse microbiota (Ley et al., 2005), is notimmediately compatible with standard mouse mod-els. The transplantation of human gut microbiotainto GF mice represents a human-relevant experi-mental model for pursuing microbiota functionalityand its impact on host biology in healthy anddiseased states (Goodman et al., 2011).
Here we present a study that applies an optimizedmetabolomics method on urine and fecal samplesderived from mice that have been colonized with ahuman microbiota to permit the study of human-relevant microbes in a controlled experimentalsetting. Using this method, we demonstrate thatthe vast majority of metabolomic features that wedetected in human feces are reconstituted in HUMmice. These data establish that mice harboring ahuman gut microbiota are a valid model forreconstructing human microbiota functionality inan experimental setting. Furthermore, the overlap inmetabolomic features associated with three groupsof HUM mice, each colonized with a different donormicrobiota, is consistent with the implied func-tional conservation in divergently composed humangut communities (Turnbaugh et al., 2009a). Despitethe common functional attributes, our study andothers show that dietary modifications of themicrobiota are a significant factor in shaping themetabolomic features associated with feces andurine (Legido-Quigley et al., 2010). The set of diet-induced metabolites provides an example of howthe ability of complex external factors to interactwith and influence the functionality of human gutmicrobes can be chemically quantified, a first step inunraveling the dynamics of microbiota function andits impact on the host.
Although humanization of GF mice provides anattractive model of how the human microbiotainteracts with a host, the microbiota in this modelremains a highly complex system that is resistant tomechanistic and hypothesis-based experimentation.The possibility of evaluating more simplified,
defined communities on the host metabolomicprofile is a promising avenue to gain mechanisticinsights. Simplified and defined model systemshave been used extensively to study functionalproperties of common gut residents in vivo(Sonnenburg et al., 2006; Samuel et al., 2007;Marco et al., 2010; Rey et al., 2010; Faith et al.,2011). Our use of one- and two-member modelcommunities indicates that there are aspects of thehost metabolome that are conserved between thesesimplified ecosystems and an entire human micro-biota, specifically the common depletion of meta-bolites that are present in GF mice. An importantremaining question is at what point of constructing adefined microbiota is the functionality associatedwith a complex HUM community sufficientlyapproximated. Although the answer will vary basedon the scientific question being addressed, it islikely that metabolomic profiling will be an impor-tant component of assessing the functional capacityof simplified communities for comparison with thatof a complete human microbiota.
Our results set the stage for discovery and elucida-tion of small molecule-mediated interactions betweenhuman-associated microbes and the host. Our detec-tion of individual-specific metabolomic featuressuggests that personalized HUM mice could be usedin a variety of applications relevant to human health,ranging from biomarker discovery to characterizationand categorization of community response to micro-biota-targeted treatments. In addition, the experimen-tal approach that we have implemented to investigatethe gut microbiota functional status should bestraightforward to apply to microbial communitiesassociated with other body habitats.
Conflict of Interest
The authors declare no conflict of interest.
Acknowledgements
We thank Erica Sonnenburg for providing comments onthe manuscript and Tim Meyer for helpful discussions.This work was funded in part by grants fromNational Institutes of Health (R01-DK085025 and DP2-OD006515).
References
Arumugam M, Raes J, Pelletier E, Le Paslier D, Yamada T,Mende DR et al. (2011). Enterotypes of the human gutmicrobiome. Nature 473: 174–180.
Bowey E, Adlercreutz H, Rowland I. (2003). Metabolism ofisoflavones and lignans by the gut microflora: a studyin germ-free and human flora associated rats. FoodChem Toxicol 41: 631–636.
Caporaso JG, Kuczynski J, Stombaugh J, Bittinger K,Bushman FD, Costello EK et al. (2010). QIIME allows
Metabolomics of HUM and gnotobiotic miceA Marcobal et al
1942
The ISME Journal
analysis of high-throughput community sequencingdata. Nat Methods 7: 335–336.
Claus SP, Tsang TM, Wang Y, Cloarec O, Skordi E, MartinF-P et al. (2008). Systemic multicompartmental effectsof the gut microbiome on mouse metabolic pheno-types. Mol Syst Biol 4: 219.
Faith JJ, McNulty NP, Rey FE, Gordon JI. (2011). Predictinga human gut microbiota’s response to diet in gnoto-biotic mice. Science 333: 101–104.
Goodman AL, Kallstrom G, Faith JJ, Reyes A, Moore A,Dantas G et al. (2011). Extensive personal human gutmicrobiota culture collections characterized andmanipulated in gnotobiotic mice. Proc Natl Acad SciUSA 108: 6252–6257.
Goodwin BL, Ruthven CRJ, Sandler M. (1994). Gut floraand the origin of some urinary aromatic phenoliccompounds. Biochem Pharmacol 47: 2294–2297.
Holmes E, Loo RL, Stamler J, Bictash M, Yap IKS, Chan Qet al. (2008). Human metabolic phenotype diversityand its association with diet and blood pressure.Nature 453: 396–U350.
Huttenhower C, Gevers D, Knight R, Abubucker S, BadgerJH, Chinwalla AT et al. (2012). Structure, function anddiversity of the healthy human microbiome. Nature486: 207–214.
Kessner D, Chambers M, Burke R, Agus D, Mallick P. (2008).ProteoWizard: open source software for rapid proteo-mics tools development. Bioinformatics 24: 2534–2536.
Legido-Quigley C, Stella C, Perez-Jimenez F,Lopez-Miranda J, Ordovas J, Powell J et al. (2010).Liquid chromatography-mass spectrometry methodsfor urinary biomarker detection in metabonomicstudies with application to nutritional studies. BiomedChromatogr 24: 737–743.
Ley RE, Backhed F, Turnbaugh P, Lozupone CA, KnightRD, Gordon JI. (2005). Obesity alters gut microbialecology. Proc Nat Acad Sci USA 102: 11070–11075.
Lozupone C, Hamady M, Knight R. (2006). UniFrac - anonline tool for comparing microbial community diversityin a phylogenetic context. BMC Bioinformatics 7: 371.
Mallett AK, Bearne CA, Rowland IR, Farthing MJG, ColeCB. (1987). The use of rats associated with a humanfecal flora as a model for studyng the effects of dieton the human gut microflora. J Appl Bacteriol 63:39–45.
Marchesi JR, Holmes E, Khan F, Kochhar S, Scanlan P,Shanahan F et al. (2007). Rapid and noninvasivemetabonomic characterization of inflammatory boweldisease. J Proteome Res 6: 546–551.
Marco ML, de Vries MC, Wels M, Molenaar D, Mangell P,Ahrne S et al. (2010). Convergence in probioticLactobacillus gut-adaptive responses in humans andmice. ISME J 4: 1481–1484.
Martin F-PJ, Wang Y, Sprenger N, Yap IKS, Lundstedt T,Lek P et al. (2008). Probiotic modulation of symbioticgut microbial-host metabolic interactions in ahumanized microbiome mouse model. Mol Syst Biol4: 1–15.
Meyer TW, Hostetter TH. (2012). Uremic solutes fromcolon microbes. Kidney Int 81: 949–954.
Nicholson JK, Holmes E, Kinross J, Burcelin R, Gibson G,Jia W et al. (2012). Host-gut microbiota metabolicinteractions. Science 336: 1262–1267.
Qin J, Li R, Raes J, Arumugam M, Burgdorf KS, ManichanhC et al. (2010). A human gut microbial gene catalogueestablished by metagenomic sequencing. Nature 464:59–U70.
Rey FE, Faith JJ, Bain J, Muehlbauer MJ, Stevens RD,Newgard CB et al. (2010). Dissecting the in vivometabolic potential of two human gut acetogens. J BiolChem 285: 22082–22090.
Romick-Rosendale LE, Goodpaster AM, Hanwright PJ,Patel NB, Wheeler ET, Chona DL et al. (2009). NMR-based metabonomics analysis of mouse urine and fecalextracts following oral treatment with the broad-spectrum antibiotic enrofloxacin (Baytril). MagnReson Chem 47: S36–S46.
Samuel BS, Hansen EE, Manchester JK, Coutinho PM,Henrissat B, Fulton R et al. (2007). Genomic andmetabolic adaptations of Methanobrevibacter smithiito the human gut. Proc Natl Acad Sci USA 104:10643–10648.
Smith CA, Maille GO, Want EJ, Qin C, Trauger SA,Brandon TR et al. (2005). METLIN: a metabolite massspectral database. Ther Drug Monit 27: 747–751.
Smith CA, Want EJ, O’Maille G, Abagyan R, Siuzdak G.(2006). XCMS: processing mass spectrometry data formetabolite profiling using nonlinear peak alignment,matching, and identification. Anal Chem 78: 779–787.
Sonnenburg ED, Zheng H, Joglekar P, Higginbottom SK,Firbank SJ, Bolam DN et al. (2010). Specificity ofpolysaccharide use in intestinal bacteroides speciesdetermines diet-induced microbiota alterations. Cell141: 1241–U1256.
Sonnenburg JL, Chen CTL, Gordon JI. (2006). Genomic andmetabolic studies of the impact of probiotics on amodel gut symbiont and host. PLoS Biol 4: 2213–2226.
Swann JR, Tuohy KM, Lindfors P, Brown DT, Gibson GR,Wilson ID et al. (2011a). Variation in antibiotic-induced microbial recolonization impacts on the hostmetabolic phenotypes of rats. J Proteome Res 10:3590–3603.
Turnbaugh PJ, Hamady M, Yatsunenko T, Cantarel BL,Duncan A, Ley RE et al. (2009a). A core gut microbiomein obese and lean twins. Nature 457: 480–U487.
Turnbaugh PJ, Ridaura VK, Faith JJ, Rey FE, Knight R,Gordon JI. (2009b). The effect of diet on the human gutmicrobiome: a metagenomic analysis in humanizedgnotobiotic mice. Sci Transl Med 1: 6ra14.
Wikoff WR, Anfora AT, Liu J, Schultz PG, Lesley SA,Peters EC et al. (2009). Metabolomics analysis revealslarge effects of gut microflora on mammalian bloodmetabolites. Proc Natl Acad Sci USA 106: 3698–3703.
Wyss M, Kaddurah-Daouk R. (2000). Creatine and creati-nine metabolism. Physiol Rev 80: 1107–1213.
Yap IKS, Li JV, Saric J, Martin F-P, Davies H, Wang Y et al.(2008). Metabonomic and microbiological analysis ofthe dynamic effect of vancomycin-induced gut micro-biota modification in the mouse. J Proteome Res 7:3718–3728.
Supplementary Information accompanies this paper on The ISME Journal website (http://www.nature.com/ismej)
Metabolomics of HUM and gnotobiotic miceA Marcobal et al
1943
The ISME Journal