
Cord blood metabolomic profiling in intrauterine growth restriction
13
ORIGINAL PAPER Cord blood metabolomic profiling in intrauterine growth restriction Donata Favretto & Erich Cosmi & Eugenio Ragazzi & Silvia Visentin & Marianna Tucci & Paolo Fais & Giovanni Cecchetto & Vincenzo Zanardo & Guido Viel & Santo Davide Ferrara Received: 23 June 2011 /Revised: 14 September 2011 /Accepted: 25 October 2011 /Published online: 19 November 2011 # Springer-Verlag 2011 Abstract A number of metabolic abnormalities have been observed in pregnancies complicated by intrauterine growth restriction (IUGR). Metabolic fingerprinting and clinical metabolomics have recently been proposed as tools to investigate individual phenotypes beyond genomes and proteomes and to advance hypotheses on the genesis of diseases. Non-targeted metabolomic profiling was employed to study fetal and/or placental metabolism alterations in IUGR fetuses by liquid chromatography high-resolution mass spec- trometry (LC-HRMS) analysis of cord blood collected soon after birth. Samples were collected from 22 IUGR and 21 appropriate for gestational age (AGA) fetuses. Birth weight differed significantly between IUGR and AGA fetuses (p < 0.001). Serum samples were immediately obtained and deproteinized by mixing with methanol at room temperature and centrifugation; supernatants were lyophilized and recon- stituted in water for analysis. LC-HRMS analyses were performed on an Orbitrap mass spectrometer linked to a Surveyor Plus LC. Samples were injected into a 1.0×150- mm Luna C18 column. Spectra were collected in full-scan mode at a resolution of approximately 30,000. Data were acquired over the m/z range of 50–1,000, with measurements performed in duplicate. To observe metabolic variations between the two sets of samples, LC-HRMS data were analyzed by a principal component analysis model. Many features (e.g., ionic species with specific retention times) differed between the two classes of samples: among these, the essential amino acids phenylalanine, tryptophan, and methi- onine were identified by comparison with available databases. Logistic regression coupled to a receiver-operating character- istic curve identified a cut-off value for phenylalanine and tryptophan, which gave excellent discrimination between IUGR and AGA fetuses. Non-targeted LC-HRMS analysis of cord blood collected at birth allowed the identification of significant differences in relative abundances of essential amino acids between IUGR and AGA fetuses, emerging as a promising tool for studying metabolic alterations. Keywords IUGR . Metabolomics . HRMS . Essential amino acids . Tryptophan . Phenylalanine Introduction Intrauterine growth restriction (IUGR) is defined by the American College of Obstetricians and Gynecologists [1] as an ultrasound estimated fetal weight (EFW) less than the 10th percentile for gestational age. Regulation of fetal growth is multifactorial and complex. Several factors, Electronic supplementary material The online version of this article (doi:10.1007/s00216-011-5540-z) contains supplementary material, which is available to authorized users. D. Favretto (*) : M. Tucci : P. Fais : G. Cecchetto : G. Viel : S. D. Ferrara Department of Public Health and Environmental Medicine, Forensic Toxicology and Antidoping Unit, University of Padova, 35122 Padova, Italy e-mail: [email protected] E. Cosmi : S. Visentin Department of Gynecological Science and Human Reproduction, University of Padova, 35122 Padova, Italy E. Ragazzi Department of Pharmacology and Anesthesiology, University of Padova, 35122 Padova, Italy V. Zanardo Department of Pediatrics, University of Padova, 35122 Padova, Italy Anal Bioanal Chem (2012) 402:1109–1121 DOI 10.1007/s00216-011-5540-z
-
Upload
independent -
Category
Documents
-
view
1 -
download
0
Transcript of Cord blood metabolomic profiling in intrauterine growth restriction

ORIGINAL PAPER
Cord blood metabolomic profiling in intrauterinegrowth restriction
Donata Favretto & Erich Cosmi & Eugenio Ragazzi & Silvia Visentin & Marianna Tucci &Paolo Fais & Giovanni Cecchetto & Vincenzo Zanardo & Guido Viel &Santo Davide Ferrara
Received: 23 June 2011 /Revised: 14 September 2011 /Accepted: 25 October 2011 /Published online: 19 November 2011# Springer-Verlag 2011
Abstract A number of metabolic abnormalities have beenobserved in pregnancies complicated by intrauterine growthrestriction (IUGR). Metabolic fingerprinting and clinicalmetabolomics have recently been proposed as tools toinvestigate individual phenotypes beyond genomes andproteomes and to advance hypotheses on the genesis ofdiseases. Non-targeted metabolomic profiling was employedto study fetal and/or placental metabolism alterations in IUGRfetuses by liquid chromatography high-resolution mass spec-trometry (LC-HRMS) analysis of cord blood collected soonafter birth. Samples were collected from 22 IUGR and 21appropriate for gestational age (AGA) fetuses. Birth weightdiffered significantly between IUGR and AGA fetuses (p<0.001). Serum samples were immediately obtained and
deproteinized by mixing with methanol at room temperatureand centrifugation; supernatants were lyophilized and recon-stituted in water for analysis. LC-HRMS analyses wereperformed on an Orbitrap mass spectrometer linked to aSurveyor Plus LC. Samples were injected into a 1.0×150-mm Luna C18 column. Spectra were collected in full-scanmode at a resolution of approximately 30,000. Data wereacquired over the m/z range of 50–1,000, with measurementsperformed in duplicate. To observe metabolic variationsbetween the two sets of samples, LC-HRMS data wereanalyzed by a principal component analysis model. Manyfeatures (e.g., ionic species with specific retention times)differed between the two classes of samples: among these, theessential amino acids phenylalanine, tryptophan, and methi-onine were identified by comparison with available databases.Logistic regression coupled to a receiver-operating character-istic curve identified a cut-off value for phenylalanine andtryptophan, which gave excellent discrimination betweenIUGR and AGA fetuses. Non-targeted LC-HRMS analysisof cord blood collected at birth allowed the identification ofsignificant differences in relative abundances of essentialamino acids between IUGR and AGA fetuses, emerging as apromising tool for studying metabolic alterations.
Keywords IUGR .Metabolomics . HRMS . Essential aminoacids . Tryptophan . Phenylalanine
Introduction
Intrauterine growth restriction (IUGR) is defined by theAmerican College of Obstetricians and Gynecologists [1] asan ultrasound estimated fetal weight (EFW) less than the10th percentile for gestational age. Regulation of fetalgrowth is multifactorial and complex. Several factors,
Electronic supplementary material The online version of this article(doi:10.1007/s00216-011-5540-z) contains supplementary material,which is available to authorized users.
D. Favretto (*) :M. Tucci : P. Fais :G. Cecchetto :G. Viel :S. D. FerraraDepartment of Public Health and Environmental Medicine,Forensic Toxicology and Antidoping Unit, University of Padova,35122 Padova, Italye-mail: [email protected]
E. Cosmi : S. VisentinDepartment of Gynecological Science and Human Reproduction,University of Padova,35122 Padova, Italy
E. RagazziDepartment of Pharmacology and Anesthesiology,University of Padova,35122 Padova, Italy
V. ZanardoDepartment of Pediatrics, University of Padova,35122 Padova, Italy
Anal Bioanal Chem (2012) 402:1109–1121DOI 10.1007/s00216-011-5540-z

including genetic (intrinsic fetal conditions) and environ-mental (maternal and external conditions), can lead toIUGR and to serious consequences, e.g., activation ofadaptation systems leading to considerable fetal growthretardation, metabolic, neuroendocrine and cardiovascularadaptations, and early and later life consequences [2–5].
Birth weight and gestational age at birth are the mostimportant predictors of neonatal mortality and morbidity,being responsible for 50% of preterm and 20% of termperinatal deaths [6] and determining hypoxic encephalopathyand cerebral palsy due to intrapartum distress and metabolicacidosis [7].
Several studies suggest that low birth weight isassociated with the development of an “in uteroprogrammed” metabolic syndrome in adult life [2, 3].
Metabolomics, and in particular “clinical metabolomics”,is commonly defined as comprehensive study of all LMWmetabolites (generally, <1,500 Da) expressed in tissues,organs, or organisms and aims at evaluating and/orpredicting health and disease risk. The individual genomeand possibly epigenetic effects influence the metabolicsignatures of a candidate tissue or body fluid by environ-mental exposure, diet behavior, and lifestyle. An advantageof clinical metabolomics is that it adds significant newinformation to the individual phenotype beyond genomeand proteome analysis, just by using a small amount ofbody fluids [8–11].
The aim of the present study was to identify fetal and/orplacental metabolism abnormalities by the study of themetabolomic profile in IUGR fetuses with non-targetedmetabolomic liquid chromatography high-resolution massspectrometry (LC-HRMS) analysis of cord blood collectedsoon after birth, with a cohort of appropriate for gestationalage (AGA) fetuses as controls.
Materials and methods
Patient selection
A longitudinal prospective study was performed fromMarch to December 2009 in the Maternal Fetal Medicinesection and Forensic Toxicology and Antidoping Unit,University of Padova. Women were enrolled in the studyduring third-trimester routine fetal ultrasonography performedto evaluate EFW, amniotic fluid volume, and placentalocation. Intrauterine growth restriction was defined as anEFW of <10th percentile, and AGA as an EFW between the10th and 90th percentiles, according to Italian standardsfor birth weight and gestational age and confirmed atbirth [12]. The Ethics Committee of the UniversityHospital approved the study, and written informed consentwas obtained from all women.
In all patients, gestational age was determined by the lastmenstrual period and confirmed by ultrasound in the firsttrimester or at 18–24 weeks of gestation. Inclusion criteriafor IUGR pregnancies were: single pregnancy and neonatalweight of <10th percentile. Inclusion criteria for AGApregnancies were: single pregnancy and birth weightbetween the 10th and 90th percentiles. In addition, onlywomen undergoing cesarean section and not in labor wereconsidered for the study, in order to exclude labor as afactor which may alter metabolomic results. Exclusioncriteria for both groups were multiple pregnancies, chro-mosomal abnormalities or syndromes, congenital infection,preeclampsia, fetal alcohol syndrome or maternal drugingestion, other congenital or acquired diseases leading topostnatal growth restriction (severe cardiac malformation,bronchopulmonary dysplasia, or severe malformations),and large-for-gestational-age fetuses, >90th percentile.
Clinical characteristics of study population
Maternal and neonatal characteristics are listed in Table 1.Forty-three Caucasian women met the inclusion criteria. Ofthese, 22 had IUGR and 21 AGA fetuses. Median maternalage at delivery was 32 years (range, 23–37) in the IUGRand 30 years (range, 24–44) in the AGA group. All womenin the IUGR group were delivered by cesarean section (fivefor fetal distress and five for previous cesarean section) aswere those in AGA group (21 for previous cesareandelivery). Median gestational age at delivery for IUGRfetuses was 38 weeks (range, 32–41.3), and median birthweight was 2,477.5 g (range, 1,395–2,378). Mediangestational age in the AGA group was 38.3 weeks (range,36.4–41.2), and median birth weight was 3,420 g (range,2,650–4,200). There was a statistically significant differ-ence in birth weight between the two groups (p<0.001).Three IUGR neonates needed NICU hospitalization forrespiratory distress syndrome at delivery.
Sampling procedure
Fetal blood samples (0.5 mL) were obtained from theumbilical vein from a doubly clamped segment of the cordimmediately after fetal extraction, and were collected in aVacutainer SST II Advance (BP Diagnostic, BelliverIndustrial Estate, Plymouth, UK) tube and centrifuged at1,500×g for 10 min at 4 °C. Time from birth to samplecollection did not exceed 10 min. Time was recorded with astopwatch.
Sample preparation
Serum samples (200 μl) were immediately deproteinized bymixing with methanol (600 μl) at room temperature, vortex
1110 D. Favretto et al.

mixed for 20 s, and incubated at −20 °C overnight.Samples were then centrifuged (13,845×g, 15 min, 4 °C).Supernatants were transferred to Eppendorf tubes andlyophilized. Samples were reconstituted in 100 μl of waterprior to analysis.
Liquid chromatography coupled with high-resolution massspectrometry analysis
LC-HRMS analysis was performed on an LTQ-orbitrapmass spectrometer (Thermo Fisher Scientific, Bremen,Germany) connected to a Surveyor Plus LC. Sampleswere injected into a 1.0×150-mm Luna C18 column(Phenomenex, Torrance, CA, USA). Samples wereeluted at a flow rate of 0.1 mL/min, with a chromato-graphic gradient of two mobile phases: water, 0.1%formic acid (phase A) and methanol, 0.1% formic acid(phase B). After an isocratic step of 1 min at 90%phase A and 10% phase B, a linear gradient from 10%to 100% B was run over the next 35 min, with amobile phase flow of 0.1 mL/min. A 10-μl samplevolume was injected into the column. An electrospraysource was used, working in positive ion mode. For thepositive ion detection mode, the sheath gas was set at13 (arbitrary units) and the auxiliary gas at 29 (arbitraryunits), and capillary temperature was 275 °C. The sprayvoltage and tube lens voltage were 4,500 and 85 V,respectively. Lens parameters were optimized with atune solution containing 14 metabolites (cystine, argi-nine hydrochloride, arginine, tryptophan, lysine mono-hydrochloride, lysine, tyrosine, serine, valine, leucine,asparagine, glutamic acid, methionine, and histidine) ata concentration of 1–3 mmol/L and infused at 5 μL/min. Gasflows were then optimized with the same compounds but witha 0.1-mL/min HPLC flow. Orbitrap calibration was performedin the positive ion mode. Spectra were collected in full-scanmode at a mass resolution of approximately 30,000 (full widthat half maximum of peak, FWHM). Data were acquired overthe m/z range of 50–1,000 at a speed of 0.45 s/scan(2 μscans). Measurements were performed in duplicate (twoinjections from the same sample), to account for anyanalytical variability.
All data were processed with Qualbrowser (ThermoFisher) and its chemical formula generator was used toprovide elemental compositions.
Raw data from analysis were transformed to peak tablesby XCMS software (http://massspec.scripps.edu/xcms/xcms.php), including statistical tools (see below).
Statistical analysis
Data pre-processing
RawLC/MS data were preprocessed for untargeted metaboliteprofiling with the open-source package XCMS [13], writtenin R statistical programming language, available at MetlinMetabolite Database and the Bioconductor BioinformaticsProject [14]. Peak matching and single-step retention timealignment of all samples were obtained automatically, and amatrix of aligned peaks was produced in .tsv format. Valuesclose to zero due to baseline noise were filtered and excludedsince these values can interfere with computationalalgorithms in further data analysis.
Peak detection was performed at a minimum peak widthof 1 ppm, a noise threshold of 5, and a subtraction multiplefactor of 1.5. Alignment involved a 10-ppm mass toleranceand a 0.1-min retention-time tolerance.
Any relationships between pairs of variables weretested by least squares linear regression, quantified byPearson’s correlation coefficient r, considered significantfor p<0.05.
Univariate analysis
To identify the most significant differences between IUGRand AGA data points, univariate statistical analysis wasfirst used. Filtering procedures, such as fold-changeanalysis and t tests were applied, followed by a volcanoplot, with a fold-change threshold of 2 and a t test thresholdof 0.1. Significantly different data at the probability level ofp<0.05 were used for further procedures of multivariateanalysis, to obtain identification of relevant biomarkers.
One-way ANOVA was used to detect differencesbetween the two groups. Differences were judgedstatistically significant at p<0.05.
Multivariate analysis
Multivariate analysis allows the limitations of simple visualexamination of spectra profiles to be overcome since it
Table 1 Clinical characteristicsof the study population
Data are expressed in medianand range
IUGR (n=22) AGA (n=21) p
Maternal age (year) 32 (23–37) 30 (24–44) NS
Gestational age at delivery (weeks) 38 (32–41.3) 38.3 (36.4–41.2) NS
Birthweight at delivery (g) 2,477.5 (1,395–2,378) 3,420 (2,650–4,200) <0.001
Apgar at 5 min 9 (7–10) 9 (7–10) NS
Cord blood metabolomic profiling 1111
works on the entire set of variables (i.e., the relativeabundances of all ionic species detected) and often allowssatisfactory exploratory analysis of the complete metabolitefingerprints of the species examined [15].
Cluster analysis In order to group spectra, cluster analysiswas initially used. Various clustering algorithms, bothhierarchical and non-hierarchical, running under R, weretested in a preliminary assessment of the data, such asaverage linkage (with centroids of measurements), com-plete linkage (with the farthest pair of observations fromtwo groups), single linkage (with the nearest pair of data),Ward’s method (minimizing the sum of squares of any twoclusters), k-mean clustering, and a self-organizing map.Distance indices were determined by Euclidean distance.Hierarchical clustering was performed with the hclustfunction in R package stat. Results were presented asdendrograms or heat maps.
Principal Component Analysis Principal component analysis(PCA) was obtained with an R prcomp package, based on asingle-value decomposition algorithm. The covariance matrixand standardized principal component score were selected.The first three components were considered for data
classification. Both 2D and 3D scatter plots were obtainedto display the results of analysis.
Receiver-operating characteristic curve
The relationship between a true positive rate (sensitivity)and a false-positive rate (1 specificity) for various cut-offvalues of abundance of the examined ionic species wasevaluated with the receiver-operating characteristic (ROC)curve and AUC calculation [16].
Metabolite identification
The metabolites of possible importance found by LC-HRMS spectrometry were compared with those storedin the Scripps Center for Mass Spectrometry (http://metlin.scripps.edu/), Mass Bank Database (http://www.massbank.jp/en/database.html) and Human MetabolomeDatabase (http://www.hmdb.ca/). The identities of metabo-lites of particular interest were confirmed by comparison oftheir retention times, accurate mass spectra, and high-resolution MS/MS information to those of authenticchemical standards.
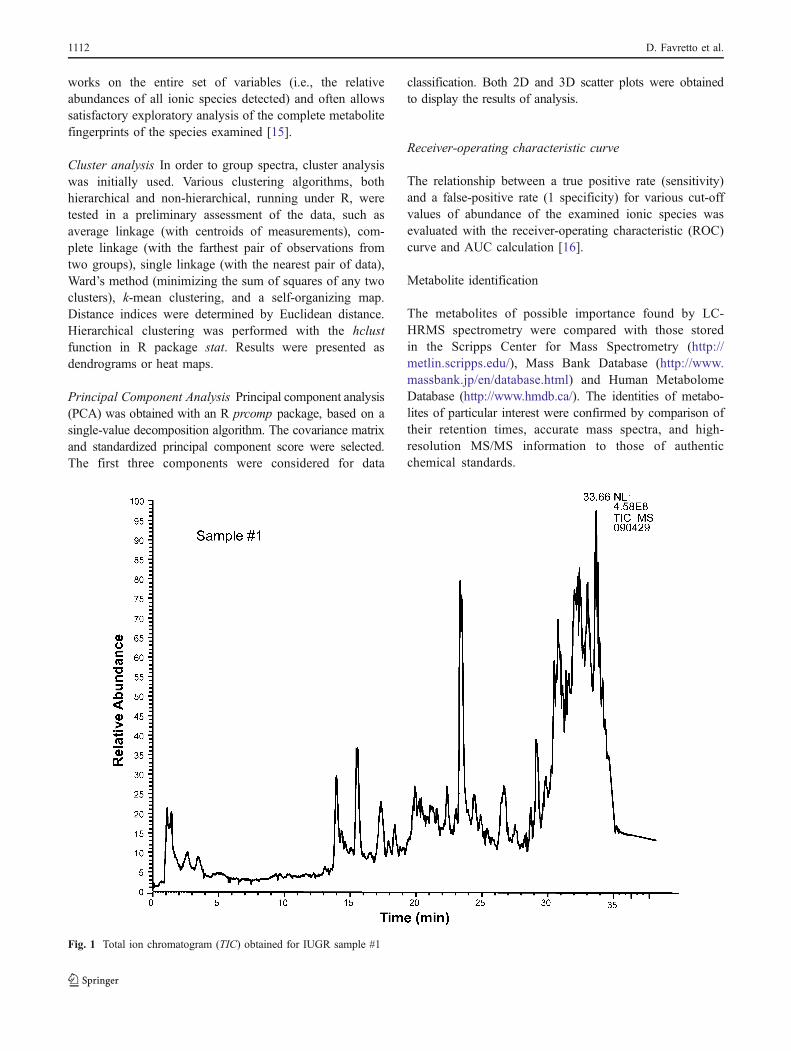
Fig. 1 Total ion chromatogram (TIC) obtained for IUGR sample #1
1112 D. Favretto et al.

Results
LC-HRMS data
A first set of samples was analyzed in both negativeand positive ion mode; the positive ion mode revealed abetter sensitivity and increased the number of com-pounds detected. For this reason, the data from negativeion mode were not used in this study and the remainingsamples were analyzed by using only positive iondetection mode. A sample of an ion chromatogram(total ion chromatogram) of one IUGR sample wasreported in Fig. 1.
Ionic species profiles detected by LC-HRMS measure-ments revealed 864 spectral bins, which were implementedin a data matrix and statistically analyzed. Following pre-processing procedures, several species were discarded, asthe algorithm used considered them within baseline noise.After filtering for this, a total of 648 ionic species remainedand was subjected to multivariate analysis.
Univariate analysis
The most important features of the spectra were selectedafter a significant t test, fold-change analysis, and volcano
plot. Most of the ionic species with their specific retentiontimes (about 85%) were found to differ significantlybetween the serum samples obtained from the two classesof patients.
Multivariate analysis
Cluster analysis performed on all detected ionic speciespermitted to distinguish two main classes (see Fig. S1 in theElectronic supplementary material) which separated the twogroups quite well. PCA analysis on the same data (Fig. 2)confirmed the trend indicated by cluster analysis: IUGRwere located differently from AGA fetuses in the three-dimensional Euclidean space representing the first threeprincipal components (explaining about 72% of totalvariance). Several ionic species were identified by comparisonwith available metabolite databases (Table 2). Focusing onthese data, a simple visual inspection revealed totallydifferent patterns of abundance in the two fetal groups (Fig.S2 in the Electronic supplementary material). The detaileddistribution of the ionic species is shown in Fig. 3: all(except kynurenine and the dipeptide phenylalanyl–phenylalanine) were found to differ significantly betweenthe two groups (ANOVA, p<0.0001; for caffeine only, p=0.0028). Cluster analysis of these species discriminated
Fig. 2 3D scatterplot of the firstthree principal components inPCA conducted on all the ionicspecies. The red ellipsoids arethe spatial surfaces covering50% of IUGR (blue) or AGA(red) patients, respectively. Thepercentage of the first three PCsresponsible for the observedseparation was, respectively:PC1, 54%; PC2, 10%; andPC3, 8%
Cord blood metabolomic profiling 1113

quite well between the two fetal groups, showing also theoccurrence of a cluster among some of the ionic species(Fig. 4).
ROC curve
Logistic regression coupled with an ROC curve applied to eachionic species led to appreciable accuracy in discriminatingIUGR and AGA fetuses. The area under the curve was elevatedfor most species, suggesting excellent accuracy indiscriminating between IUGR and AGA, with highspecificity and sensitivity (Table 2) at the indicated cut-offs. It should be noted that two metabolites, identified asphenylalanine and tryptophan, discriminated excellentlybetween IUGR and AGA (specificity of 89% and 86%,respectively; sensitivity was 100% for both). As an
example, logistic regression and the ROC curve forphenylalanine is shown in Fig. S3 in the Electronicsupplementary material. Most of the identified metaboliteswere also significantly correlated, as indicated by themultiple correlations of pairwise scatter plot in Fig. S4 inthe Electronic supplementary material.
Table 2 Identified ionic species, with respective specificity and sensitivity of their diagnostic discriminant ability, obtained with ROC curveanalysis
Identification type Metabolites Label, accordingto XCMS software
AUCa Cut-offabundance
Specificity(%)
Sensitivity(%)
Definitive Valine C5H11NO2 M118T89 0.055556 54,334,841 96 69
Definitive Isoleucine C6H13N02 M132T109 0.055556 183,967,098 96 69
Definitive Glutamate C5H9NO4 M148T88 0.064583 723,357 85 91
Definitive Methionine C5H11NO2S M150T91 0.063889 747,089 96 84
Definitive Dopamine C8H11NO2 M154T113 0.065278 24,027,148 81 96
Definitive Hystidine C6H9N3O2 M156T78 0.0625 2,616,953 71 100
Definitive Proline C5H9NO2 M116T89 0.054167 10,827,974 96 69
Definitive Phenylalanine C9H11NO2 M166T157 0.068056 118,841,665 89 100
Definitive Uric acid C5H4N4O3 M169T71 0.058333 1,866,553 54 97
Definitive Caffeine C8H10N4O2 M195T564 0.059028 4,257,749 75 81
Putative 5-Methyl-2-undecenoic acid C12H22O2b M199T1878 0.065278 2,474,492 96 81
Definitive Tryptophan C11H12N2O2 M205T219 0.066667 159,059,405 86 100
Definitive Kynurenine C10H12N2O3 M209T132 Nd Nd nd nd
Definitive leu pro C11H20N2O3 M229T92 0.067361 1,489,723 96 91
Definitive L-Thyronine C15H15NO4 M274T93 0.060417 44,019,994 96 69
Definitive Oleic acid C18H34O2 M283T1984 0.065278 1,035,372 86 94
Definitive Hexadecanedioic acid C16H30O4 M287T1879 0.065278 1,035,372 96 69
Putative PHE PHE C18H20N2O3b M313T768 Nd Nd nd Nd
Putative Arg cys asn C13H25N7O5Sb M392T1941 0.063194 1,820,121 82 97
Putative ARG PHE ARG C21H35N9O4b M478T2012 0.066667 5,996,730 96 84
Putative TRP ARG ARG C23H36N10O4b M517T1958 0.064583 14,451,441 82 100
Putative 1-Hydroxyvitamin D3 3-D-glucopyranoside C33H52O8
bM577T1978 0.061806 8,384,333 79 94
The ionic species with particular features in discriminating the two groups, suggesting relevance as markers are shown in bold
nd not determined (due to lack of fit to logistic model), M nominal mass, T retention timea The area under the ROC curve (AUC) indicates the ability of the test to discriminate between subjects. An area of 1 indicates perfect accuracywith 100% sensitivity and 100% specificity; an area of 0.5 indicates casual assessment. AUC 0.90–1.00 is considered excellent, 0.80–0.90 good,0.70–0.80 fair, 0.60–0.70 poor, and 0.50–0.60 failing. The cut-off values at various relative abundances of m/z were evaluated to find the bestcombination of sensitivity and specificityb Putative metabolite did not match with the accurate mass and retention time of an authentic standard but to the accurate mass only
Fig. 3 Box plot of the distribution of abundances of most relevantionic species detected and identified in spectra from IUGR or AGApatients. The ends of the box represent the 1st and 3rd quartile,respectively. The line across the middle of the box indicates themedian value. The whiskers extend from the ends of the box to theoutermost data point that falls within the distances computed as (upperquartile+1.5×(interquartile range)) and (lower quartile−1.5×(interquartilerange)). All data were significantly different in the two groups atp<0.0001 (ANOVA), except caffeine (ionic species M195T564) forwhich p=0.0028; kynurenine (M209T132) and phenylalanine–phenylalanine (M313T768) were not significantly different
b
1114 D. Favretto et al.

Cord blood metabolomic profiling 1115
1116 D. Favretto et al.

Discussion
It is generally accepted that IUGR is associated with areduction in oxygen and nutrient supply across the placenta,and a number of metabolic abnormalities have beenreported in pregnancies complicated by IUGR [17].
The present study highlights the fact that IUGR andAGA fetuses can be accurately discriminated according tothe ionic species detected through LC-HRMS analysis inserum obtained from cord blood, which shows statisticallysignificant differences (significant t test, fold-change,volcano plot and cluster analysis). In particular, 22metabolites, identified by comparison with the availablemetabolomic databases (Table 2), had an excellent abilityto discriminate between IUGR and AGA fetuses, mea-sured by logistic regression analysis and an ROC curve(Fig. 3). Of these 22 metabolites, seven are alpha-aminoacids. These finding were partially expected consideringthe recent literature evidencing the increse in essentialamino acids when placental villous from small forgestational age [18] or serum from preeclampsia-diagnosed women [19] are analyzed by an analogousmetabolomic strategy. However, our results are the firstpertaining the cord blood metabolomic profiling, and they canhelp widening the knowledge of both pre-eclampsia andgrowth retardation phenomenon. As shown in Table 2 andFig. 3, the best predictors (independently considered) werephenylalanine, tryptophan, and glutamate, with sensitivityranging from 91% to 100%, and specificity between 85%and 89%. All amino acids were up-regulated in IUGRsamples compared with AGA.
In humans, phenylalanine and tryptophan are bothessential amino acids which must be supplied in dietaryproteins. Once in the body, phenylalanine may follow anyof three pathways. It may be (1) incorporated into cellularproteins, (2) converted to phenylpyruvic acid via aminoacid oxidase or tyrosine amino transferase, or (3) convertedto tyrosine via phenylalanine hydroxylase. Tyrosine can beconverted into L-DOPA, which is further converted intodopamine, norepinephrine (noradrenaline) and epinephrine
(adrenaline). Deficiencies in phenylalanine hydroxylase areresponsible for the commonest form of phenylketonuria(PKU) in humans. Tryptophan functions as a biochemicalprecursor for serotonin, which is synthesized via tryptophanhydroxylase. Serotonin, in turn, can be converted tomelatonin, via N-acetyltransferase and 5-hydroxyindole-O-methyltransferase activity. Kynurenine is the first key branchpoint intermediate in tryptophan’s catabolic pathway, asshown in Fig. 5.
Several studies have compared the amino acid profiles ofIUGR vs. AGA fetuses. Five were performed in humanfetuses [20–24] and three in animals [25–27]. The mostrecent [18] was performed in vitro in placental tissuesexposed to different O2 tensions.
Paolini et al. [20] were the first to study amino acidplacental transport in IUGR pregnancies and detected adecrease (downregulation) of phenylalanine in fetalplasma obtained after cordocentesis; they also reportedlower concentrations of leucine, glycine, and proline inIUGR compared with AGA fetuses. Whereas de Boo etal. [25] reported no differences in phenylalanine andtyrosine concentrations between IUGR and AGA ewes,Morris et al. [22], in their study on free amino acidconcentrations in normal and abnormal third-trimesterplacental villi, found increased phenylalanine in IUGRwith respect to AGA humans. More recently, Horgan etal. [18] used a metabolomic approach to study the effectof changing O2 tension on human placental metabolism invitro, observed upregulation of amino acids (phenylala-nine, tryptophan, and methionine) in small for gestationalage vs. AGA conditions and suggested abnormalities inplacental metabolism, amino acid transfer into fetalcirculation and also feto-placental perfusion in pregnan-cies complicated by growth restriction. The findings ofthe present study, performed in vivo in fetuses fromwomen having normal diet profiles, show that the relativeconcentration of phenylalanine in serum is significantlyhigher in IUGR than in AGA fetuses (sensitivity, 100%;specificity, 89%; Table 2) and match the results of ofHorgan et al. [18]. The observed upregulation ofphenylalanine may be the result of the small size of theplacenta in IUGR fetuses, which in turn may lead toaltered placental metabolism, with increased fetal proteincatabolism and decreased amino acid transfer across thebasal membrane, with a final accumulation of phenylal-anine. In the study of Paolini et al. [20], in whichdownregulation of phenylalanine was evidenced, womenwere overfed with amino acid and plasma concentrationratios between the fetus and mother were recorded ratherthan absolute concentrations; in addition, all the IUGRfetuses had placental insufficiency and showed low pH,hypoxia, and hypercarbia during cordocentesis, whichmay increase the catabolic fetal status, resulting in
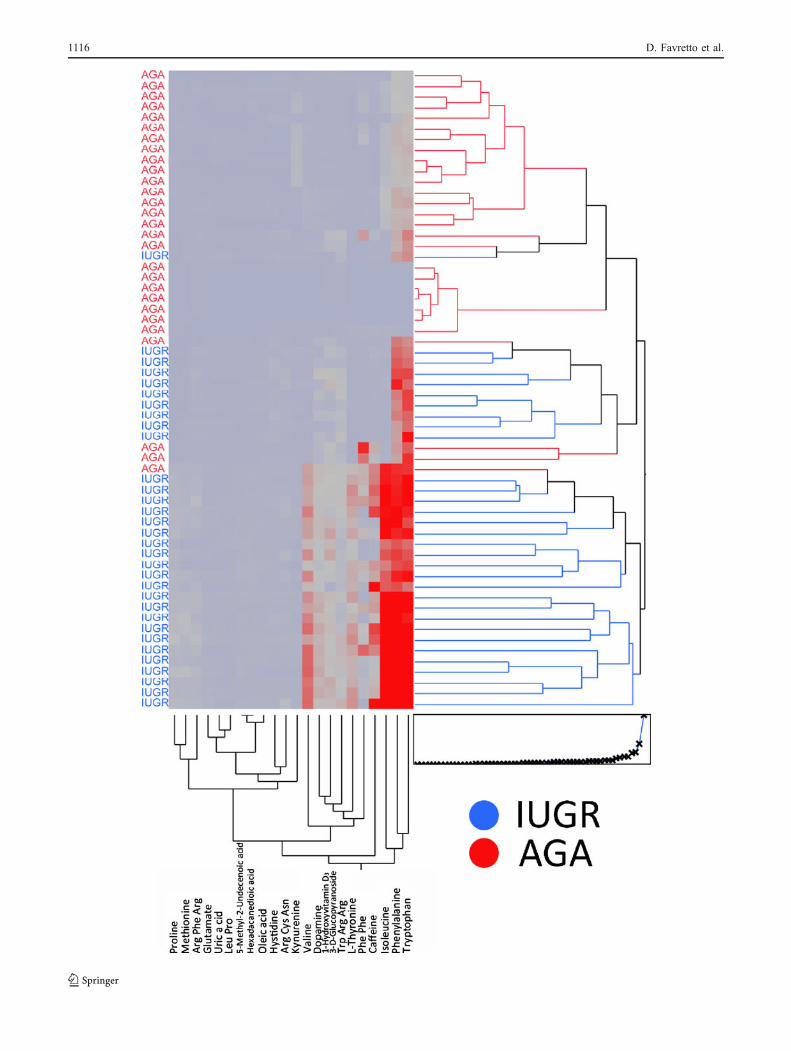
Fig. 4 Dendrogram and heatmap following cluster analysis on the 22relevant ionic species identified in blood samples from IUGR andAGA fetuses (see Table 2). Clustering was obtained with Ward’salgorithm using Euclidean distance. Abundance values for eachvariable are on a graduated color scale from blue (lower value) togray to red (higher value). The dendrograms, provided for bothpatient’s and metabolite’s variables, show the possibility to separatequite well the two groups of patients just using the indicatedmetabolites. The heatmap, representing each variable’s abundancewith a color intensity, gives at a glance the data distribution, andmakes possible to recognize that some metabolites vary more amongpatients, and therefore they maybe more appropriate as possiblemarkers of disease
R
Cord blood metabolomic profiling 1117

consumption of amino acids in different organs, particu-larly in the brain.
As regards tryptophan, a serotonin precursor, severalreports have shown that, in rats malnourished in utero, thereis an acceleration in the brain synthesis of serotonin,
starting in the fetal period and coinciding with elevationof the free fraction of tryptophan in plasma and brain [28].Increased tryptophan plasma concentrations have recentlybeen reported also in IUGR infants [29], which suggests anincrease of this serotonin precursor in the brain, with
Fig. 5 Metabolism of tryptophan. Of the dietary tryptophan that is notused in protein synthesis, 99% is metabolized along the kynureninepathway (red arrows). Alternative pathways are the conversion oftryptophan to 5-hydroxytryptamine (5-HT) and then to melatonin, orto tryptamine and then to the kynuramines (or kynurenamines).
3-HAO, 3-hydroxyanthranilic acid oxidase; IDO, indoleamine 2,3-dioxygenase; KAT, kynurenine aminotransferase; MAO, monoamineoxidase; QPRT, quinolinic-acid phosphoribosyl transferase; TDO,tryptophan 2,3-dioxygenase
1118 D. Favretto et al.

enhanced serotonin synthesis and activity [30]. Huang et al.[31] located serotonin and its receptors in the placenta,implying their role in placental development. The presentdata unquestionably confirm that, soon after delivery,tryptophan is more concentrated in the serum of IUGRthan in that of AGA fetuses.
Dunn et al. [32] and Horgan et al. [18] also notedchanges in kyurenine concentrations in their studies onmetabolic disturbances in placental explants in pregnan-cies complicated by growth restriction and/or hypoxia. Wealso observed lower concentrations of kynurenine inIUGR than in AGA fetuses, but this does not match thelogistic model (see Fig. S3 in the Electronic supplementarymaterial, in which only kynurenine appears to be up-regulated in AGA fetuses).
In the metabolic disruption produced in placentalexplants by oxygen deprivation [18], the essential aminoacid methionine is up-regulated, as it was in the presentin vivo study (see Table 2). Methionine has lowersensitivity (84%) but higher specificity (96%) thanphenylalanine and tryptophan. Its metabolism in mammalsleads to its conversion to S-adenosylmethionine (SAM)by methionine adenosyltransferase; SAM serves as amethyl donor in many methyltransferase reactions, andis converted to S-adenosylhomocysteine, in turn con-verted to homocysteine by adenosylhomocysteinase.Subsequently, homocysteine undergoes two fates: it canbe used to regenerate methionine via methionine syn-thase, or to form cysteine via cystathionine-β-synthaseand cystathionine-γ-lyase. Hyperhomocysteinemia hasbeen associated with growth restriction, vasculopathiesand oxidative stress [33].
Glutamate is the third amino acid with significantlydifferent serum concentrations in IUGR and AGAfetuses, showing excellent discriminative power betweenthe two groups of patients (sensitivity, 91%; specificity,85%; Table 2).
The exchange of glutamate between mother and fetusis known to be important for the development of thefetus and placenta [34, 35]. The mechanisms underlyingthis exchange are largely unknown; however, glutamatetransporters may be involved, as it is known thatglutamate transporters (EAAT1, EAAT2, and EAAT3)are expressed in rat placenta [35]. It has been demonstratedby in vitro perfusion of human placenta that glutamic acid canbe converted into glutamine by human placental tissue,indicating that abnormal cord concentrations of glutamatemay be related to its altered placental metabolism.
In previous studies, target nutrients as well as fetal orplacental metabolite concentrations have been measured byvarious methods at delivery in the umbilical vesselsconnecting the fetus to the placenta [36–41]. The proposed
approach, based on untargeted metabolomic profiling,offers a more comprehensive picture of the fetalmetabolome at birth, although it cannot differentiateplacental metabolism from placental transport. Althoughpresenting some limitations (e.g., small number of cases,same ethnic origin of mothers, IUGR defined here as abirth weight less than the 10th percentile), this studyproposes novel and interesting insights into IUGR.
Conclusions
LC-HRMS analysis of serum obtained from cord bloodcollected soon after delivery revealed that the metabolicfootprint in IUGR fetuses can be distinguished from thatof controls and that 22 identified metabolites signifi-cantly contribute toward differentiating IUGR fromAGA fetuses. To our knowledge, this is the first timethat metabolomic profiling has been used to investigateIUGR in vivo. The most evident changes in the serummetabolome of IUGR fetuses were linked to aminoacids; in particular, phenylalanine, tryptophan andglutamate exhibited the highest sensitivity. Our study,conducted when results from Horgan et al. [18] were notavailable to the scientific community, substantiate themetabolic disruption observed in vitro.
These results confirm that factors such as nutrientdeficiency may play an important role in the pathophysiologyof IUGR and suggest a novel point of view for investigatingand perhaps understanding the pathogenesis of IUGR.
Acknowledgments This study was financed by “Progetto d’Ateneo2009” no. CPDA098835 from the University of Padova.
References
1. Chauhan SP, Gupta LM, Hendrix NW, Berghella V (2009)Intrauterine growth restriction: comparison of American Collegeof Obstetricians and Gynecologists practice bulletin with othernational guidelines. Am J Obstet Gynecol 200(4):e401–e406.doi:10.1016/j.ajog.2008.11.025, 409
2. Barker DJ (2006) Adult consequences of fetal growth restriction.Clin Obstet Gynecol 49(2):270–283
3. Barker DJ (2000) In utero programming of cardiovascular disease.Theriogenology 53(2):555–574
4. Baschat AA, Viscardi RM, Hussey-Gardner B, Hashmi N,Harman C (2009) Infant neurodevelopment following fetal growthrestriction: relationship with antepartum surveillance parameters.Ultrasound Obstet Gynecol 33(1):44–50. doi:10.1002/uog.6286
5. Cosmi E, Visentin S, Fanelli T, Mautone AJ, Zanardo V (2009)Aortic intima media thickness in fetuses and children withintrauterine growth restriction. Obstet Gynecol 114(5):1109–1114. doi:10.1097/AOG.0b013e3181bb23d300006250-200911000-00022
Cord blood metabolomic profiling 1119

6. Miller J, Turan S, Baschat AA (2008) Fetal growth restriction. SeminPerinatol 32(4):274–280. doi:10.1053/j.semperi.2008.04.010
7. Baschat AA (2010) Fetal growth restriction—from observation tointervention. J Perinat Med 38(3):239–246. doi:10.1515/JPM.2010.041
8. Lucio M, Fekete A, Weigert C, Wagele B, Zhao X, Chen J,Fritsche A, Haring HU, Schleicher ED, Xu G, Schmitt-Kopplin P,Lehmann R (2010) Insulin sensitivity is reflected by characteristicmetabolic fingerprints—a Fourier transform mass spectrometricnon-targeted metabolomics approach. PLoS One 5(10):e13317.doi:10.1371/journal.pone.0013317
9. Want EJ, Wilson ID, Gika H, Theodoridis G, Plumb RS, ShockcorJ, Holmes E, Nicholson JK (2010) Global metabolic profilingprocedures for urine using UPLC-MS. Nat Protoc 5(6):1005–1018
10. Antonucci R, Atzori L, Barberini L, Fanos V (2010) Metabolomics:the “new clinical chemistry” for personalized neonatal medicine.Minerva Pediatr 62(3 Suppl 1):145–148
11. König S (2011) Urine molecular profiling distinguishes health anddisease: new ways in diagnostics? Test case UPLC-MS. Exp RevMol Diagn 11(4):383–391
12. Pardi G, Marconi AM, Cetin I (2002) Placental–fetal interrela-tionship in IUGR fetuses—a review. Placenta 23(Suppl A):S136–S141. doi:10.1053/plac.2002.0802
13. Paladini D, Rustico M, Viora E, Giani U, Bruzzese D,Campogrande M, Martinelli P (2005) Fetal size charts for theItalian population. Normative curves of head, abdomen and longbones. Prenat Diagn 25(6):456–464. doi:10.1002/pd.1158
14. Smith CA, Want EJ, O’Maille G, Abagyan R, Siuzdak G (2006)XCMS: processing mass spectrometry data for metabolite profilingusing nonlinear peak alignment, matching, and identification. AnalChem 78(3):779–787. doi:10.1021/ac051437y
15. Gentleman RC, Carey VJ, Bates DM, Bolstad B, Dettling M,Dudoit S, Ellis B, Gautier L, Ge Y, Gentry J, Hornik K, HothornT, Huber W, Iacus S, Irizarry R, Leisch F, Li C, Maechler M,Rossini AJ, Sawitzki G, Smith C, Smyth G, Tierney L, Yang JY,Zhang J (2004) Bioconductor: open software development forcomputational biology and bioinformatics. Genome Biol 5(10):R80. doi:10.1186/gb-2004-5-10-r80
16. Hanley JA, McNeil BJ (1982) The meaning and use of the areaunder a receiver operating characteristic (ROC) curve. Radiology143:29–36
17. Eisen MB, Spellman PT, Brown PO, Botstein D (1998) Clusteranalysis and display of genome-wide expression patterns. ProcNatl Acad Sci U S A 95(25):14863–14868
18. Horgan RP, Broadhurst DI, Dunn WB, Brown M, Heazell AE,Kell DB, Baker PN, Kenny LC (2010) Changes in the metabolicfootprint of placental explant-conditioned medium cultured indifferent oxygen tensions from placentas of small for gestationalage and normal pregnancies. Placenta 31(10):893–901.doi:10.1016/j.placenta.2010.07.002
19. Dunn WA, Broadhurst D, Brown M, Baker PN, Redman CWG,Kenny LC, Kell DB (2008) Metabolic profiling of serum usingultra performance liquid chromatography and the LTQ-Orbitrapmass spectrometry system. J Chromatogr B 871:288–298
20. Paolini CL, Marconi AM, Ronzoni S, Di Noio M, FennesseyPV, Pardi G, Battaglia FC (2001) Placental transport ofleucine, phenylalanine, glycine, and proline in intrauterinegrowth-restricted pregnancies. J Clin Endocrinol Metab 86(11):5427–5432
21. Baioria R, Sooranna SR, Ward S, Hancock M (2002) Placenta as alink between amino acids, insulin-IGF axis, and low birth weight:evidence from twin studies. J Clin Endocrinol Metab 87(1):308–315
22. Morris NH, Burston D, Ramsay B, Sooranna SR (1995) Freeamino acid concentrations in normal and abnormal third trimesterplacental villi. Eur J Clin Invest 25(10):796–798
23. Chien PF, Smith K, Watt PW, Scrimgeour CM, Taylor DJ, RennieMJ (1993) Protein turnover in the human fetus studied at termusing stable isotope tracer amino acids. Am J Physiol 265(1 Pt 1):E31–E35
24. Cetin I, Corbetta C, Sereni LP, Marconi AM, Bozzetti P, Pardi G,Battaglia FC (1990) Umbilical amino acid concentrations innormal and growth-retarded fetuses sampled in utero bycordocentesis. Am J Obstet Gynecol 162(1):253–261
25. De Boo HA, Van Zijl PL, Smith DE, Kulik W, Lafeber HN,Harding JE (2005) Arginine and mixed amino acids increaseprotein accretion in the growth-restricted and normal ovine fetusby different mechanisms. Pediatr Res 58(2):270–277.doi:10.1203/01.PDR.0000169977.48609.55
26. Bauer R, Walter B, Vorwieger G, Bergmann R, Fuchtner F, BrustP (2001) Intrauterine growth restriction induces up-regulation ofcerebral aromatic amino acid decarboxylase activity in newbornpiglets: [18F]fluorodopa positron emission tomographis study.Pediatr Res 49(4):474–480
27. Matsueda S, Niiyama Y (1982) The effects of excess amino acidson maintenance of pregnancy and fetal growth in rats. J Nutr SciVitaminol (Tokyo) 28(5):557–573
28. Hernandez RJ, Manjarrez GG, Chagoya G (1989) Newbornhumans and rats malnourished in utero: free plasma L-tryptophan,neutral amino acid and brain serotonin synthesis. Brain Res488:1–13
29. Hernandez-Rodriguez J, Meneses L, Herrera R, Manjarrez G(2009) Another abnormal trait in the serotonin metabolism path inintrauterine growth-restricted infants. Neonatology 95(2):125–131. doi:10.1159/000153096
30. Manjarrez G, Cisneros I, Herrera R, Vazquez F, Robles A,Hernandez J (2005) Prenatal impairment of brain serotonergictransmission in infants. J Pediatr 147(5):592–596. doi:10.1016/j.jpeds.2005.06.025
31. Huang WQ, Zhang CL, Di XY, Zhang RQ (1998) Studies on thelocalization of 5-hydroxytryptamine and its receptors in humanplacenta. Placenta 19(8):655–661
32. Dunn WB, Brown M, Worton SA, Crocker IP, Broadhurst D,Horgan R, Kenny LC, Baker PN, Kell DB, Heazell AE (2009)Changes in the metabolic footprint of placental explant-conditioned culture medium identifies metabolic disturbancesrelated to hypoxia and pre-eclampsia. Placenta 30(11):974–980.doi:10.1016/j.placenta.2009.08.008
33. Aubard Y, Darodes N, CantaloubeM (2000) Hyperhomocysteinemiaand pregnancy—review of our present understanding andtherapeutic implications. Eur J Obstet Gynecol Reprod Biol93(2):157–165
34. Moores RR Jr, Vaughn PR, Battaglia FC, Fennessey PV,Wilkening RB, Meschia G (1994) Glutamate metabolism in fetusand placenta of late-gestation sheep. Am J Physiol 267(1 Pt 2):R89–R96
35. Matthews JC, Beveridge MJ, Malandro MS, Rothstein JD,Campbell-Thompson M, Verlander JW, Kilberg MS, Novak DA(1998) Activity and protein localization of multiple glutamatetransporters in gestation day 14 vs. day 20 rat placenta. Am JPhysiol 274(3 Pt 1):C603–C614
36. Bell AW, Hay WW Jr, Ehrhardt RA (1999) Placental transport ofnutrients and its implications for fetal growth. J Reprod FertilSuppl 54:401–410
37. Grosso LM, Triche EW, Belanger K, Benowitz NL, Holford TR,Bracken MB (2006) Caffeine metabolites in umbilical cord blood,cytochrome P-450 1A2 activity, and intrauterine growth restriction.Am J Epidemiol 163(11):1035–1041. doi:10.1093/aje/kwj125
38. Jobgen WS, Ford SP, Jobgen SC, Feng CP, Hess BW, NathanielszPW, Li P, Wu G (2008) Baggs ewes adapt to maternalundernutrition and maintain conceptus growth by maintaining
1120 D. Favretto et al.

fetal plasma concentrations of amino acids. J Anim Sci 86(4):820–826. doi:10.2527/jas.2007-0624
39. Kwon H, Ford SP, Bazer FW, Spencer TE, Nathanielsz PW,Nijland MJ, Hess BW, Wu G (2004) Maternal nutrientrestriction reduces concentrations of amino acids andpolyamines in ovine maternal and fetal plasma and fetalf lu ids . B io l Reprod 71(3) :901–908. doi :10 .1095/biolreprod.104.029645biolreprod.104.029645
40. Wu G, Bazer FW, Datta S, Johnson GA, Li P, Satterfield MC,Spencer TE (2008) Proline metabolism in the conceptus:implications for fetal growth and development. Amino Acids 35(4):691–702. doi:10.1007/s00726-008-0052-7
41. Cetin I, Alvino G (2009) Intrauterine growth restriction:implications for placental metabolism and transport. A review.Placenta 30(Suppl A):S77–S82. doi:10.1016/j.placenta.2008.12.006
Cord blood metabolomic profiling 1121