PROJECT/PROGRAMME PROPOSAL TO THE ADAPTATION ...
202
1 | Page PART I: PROJECT / PROGRAMME INFORMATION 1.1 Project / Programme Information: Project / Programme Category: Regular Country / ies: India Title of the Project / Programme: Climate Proofing of Watershed Development Projects in the States of Rajasthan and Tamil Nadu Type of Implementing Entity: National Implementing Entity (NIE) Implementing Entity: National Bank for Agriculture and Rural Development (NABARD) Executing Entity / ies Executing Entities-Rajasthan: Foundation for Ecological Security (FES) ITC-Rural Development Trust (ITC-RDT) Rajasthan Rural Institute of Development Management (RRIDMA) ALERT SANSTHAN SEVA MANDIR MAHAN SEVA SANSTHAN GAYATRI SEVA SANSTHAN Watershed Consultants Organisation (WASCO) Executing Entities-Tamil Nadu: Mysore Resettlement Development Agency (MYRADA) Association of Serva Seva Farms (ASSEFA) Society for People’s Action for Change and Education (SPACE) Centre for Improved Rural Health and Environmental Protection (CIRHEP) Sri Sakthi Social Economical and Educational Welfare Trust (SWEET) Voluntary Organisation for Integration of Community and Environment (VOICE) Amount of Finance Requested: US$ 1,344,155 (US $ 1.344 million) PROJECT/PROGRAMME PROPOSAL TO THE ADAPTATION FUND
-
Upload
khangminh22 -
Category
Documents
-
view
2 -
download
0
Transcript of PROJECT/PROGRAMME PROPOSAL TO THE ADAPTATION ...

1 | P a g e
PART I: PROJECT / PROGRAMME INFORMATION
1.1 Project / Programme Information: Project / Programme Category: Regular Country / ies: India Title of the Project / Programme: Climate Proofing of Watershed Development Projects in the
States of Rajasthan and Tamil Nadu Type of Implementing Entity: National Implementing Entity (NIE) Implementing Entity: National Bank for Agriculture and Rural Development
(NABARD) Executing Entity / ies Executing Entities-Rajasthan:
Foundation for Ecological Security (FES) ITC-Rural Development Trust (ITC-RDT)
Rajasthan Rural Institute of Development Management (RRIDMA) ALERT SANSTHAN SEVA MANDIR MAHAN SEVA SANSTHAN GAYATRI SEVA SANSTHAN Watershed Consultants Organisation (WASCO)
Executing Entities-Tamil Nadu: Mysore Resettlement Development Agency (MYRADA) Association of Serva Seva Farms (ASSEFA) Society for People’s Action for Change and Education (SPACE) Centre for Improved Rural Health and Environmental Protection (CIRHEP) Sri Sakthi Social Economical and Educational Welfare Trust (SWEET) Voluntary Organisation for Integration of Community and Environment (VOICE)
Amount of Finance Requested: US$ 1,344,155 (US $ 1.344 million)
PROJECT/PROGRAMME PROPOSAL TO THE ADAPTATION FUND
2 | P a g e
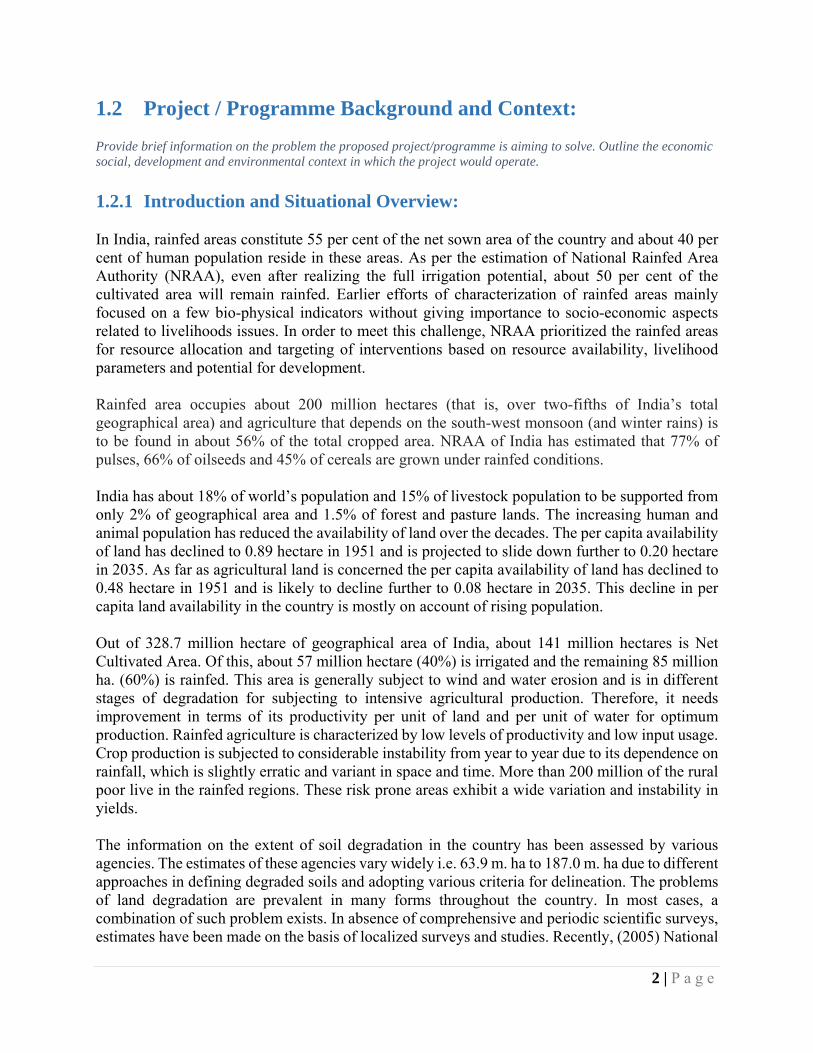
1.2 Project / Programme Background and Context: Provide brief information on the problem the proposed project/programme is aiming to solve. Outline the economic social, development and environmental context in which the project would operate.
1.2.1 Introduction and Situational Overview: In India, rainfed areas constitute 55 per cent of the net sown area of the country and about 40 per cent of human population reside in these areas. As per the estimation of National Rainfed Area Authority (NRAA), even after realizing the full irrigation potential, about 50 per cent of the cultivated area will remain rainfed. Earlier efforts of characterization of rainfed areas mainly focused on a few bio-physical indicators without giving importance to socio-economic aspects related to livelihoods issues. In order to meet this challenge, NRAA prioritized the rainfed areas for resource allocation and targeting of interventions based on resource availability, livelihood parameters and potential for development. Rainfed area occupies about 200 million hectares (that is, over two-fifths of India’s total geographical area) and agriculture that depends on the south-west monsoon (and winter rains) is to be found in about 56% of the total cropped area. NRAA of India has estimated that 77% of pulses, 66% of oilseeds and 45% of cereals are grown under rainfed conditions. India has about 18% of world’s population and 15% of livestock population to be supported from only 2% of geographical area and 1.5% of forest and pasture lands. The increasing human and animal population has reduced the availability of land over the decades. The per capita availability of land has declined to 0.89 hectare in 1951 and is projected to slide down further to 0.20 hectare in 2035. As far as agricultural land is concerned the per capita availability of land has declined to 0.48 hectare in 1951 and is likely to decline further to 0.08 hectare in 2035. This decline in per capita land availability in the country is mostly on account of rising population. Out of 328.7 million hectare of geographical area of India, about 141 million hectares is Net Cultivated Area. Of this, about 57 million hectare (40%) is irrigated and the remaining 85 million ha. (60%) is rainfed. This area is generally subject to wind and water erosion and is in different stages of degradation for subjecting to intensive agricultural production. Therefore, it needs improvement in terms of its productivity per unit of land and per unit of water for optimum production. Rainfed agriculture is characterized by low levels of productivity and low input usage. Crop production is subjected to considerable instability from year to year due to its dependence on rainfall, which is slightly erratic and variant in space and time. More than 200 million of the rural poor live in the rainfed regions. These risk prone areas exhibit a wide variation and instability in yields. The information on the extent of soil degradation in the country has been assessed by various agencies. The estimates of these agencies vary widely i.e. 63.9 m. ha to 187.0 m. ha due to different approaches in defining degraded soils and adopting various criteria for delineation. The problems of land degradation are prevalent in many forms throughout the country. In most cases, a combination of such problem exists. In absence of comprehensive and periodic scientific surveys, estimates have been made on the basis of localized surveys and studies. Recently, (2005) National

3 | P a g e
Bureau of Soil Survey and Land Use Planning (NBSS&LUP), Nagpur of ICAR has published that 146.82 million hectare area is reported to be suffering from various kinds of land degradation. It includes water erosion 93.68 million ha, wind erosion 9.48 million ha, water logging/flooding 14.30 million ha., salinity/alkalinity 5.94 million ha., soil acidity 16.04 million ha and complex problem 7.38 million ha. Planning Commission (Khanna, 1989), Government of India has identified 15 agro-climatic regions in the country. The agro-climatic classification of the Planning Commission is primarily based on geographical basis for developmental purpose. As per Planning Commission classification, the State of Rajasthan falls under Trans-Gangetic Plains and Tamil Nadu in West Coast Plains and Ghat. Later, based on following four major criteria, Planning Commission come up with 150 disadvantaged districts across the States for concentrated interventions.
1. High population of landless and agricultural wage earners 2. Low household income and high rate of migration 3. Higher per cent of SC and ST population 4. Status of infrastructure
Natural Resource Index (NRI)
Rainfall: According to the Natural Resource Index (NRI) of NRAA, based on rainfall, Rajasthan falls under dry and semi-arid zone whereas western part of the State falls under arid region. The State of Tamil Nadu majorly falls under dry and moist semi-arid region, based on rainfall.
Drought: According to NRI (Combined probability of moderate and severe drought at district level based on the IMD maps, Gore et al., 2010), the probability of severe drought is high in Western parts of Rajasthan and moderate in the interior parts of Rajasthan and South India, including Tamil Nadu. Rest of the country has <10% probability of experiencing drought.

4 | P a g e
Available water content: Available water content, in absolute terms (i.e. in mm) indicates the storage capacity of soil and its availability to plants. Available water content, for majority of the district of Tamil Nadu is more than 100 mm whereas the available water content in parts of Rajasthan is less than 100 mm. Degraded and Wastelands: Major part of degraded and wastelands are in the range 0-20% & 20-40% in majority of the districts in the country. Severely degraded land is found in Rajasthan whereas less than 20% of degraded and wastelands are observed in coastal region of Tamil Nadu.
Rainfed Area: Based on the percent rainfed area, districts were categorized into 3 classes i.e. <35% rainfed area, 35-70% and >70% rainfed area. Except for few districts in coastal areas of AP, Tamil Nadu and IGP, rest of the districts are having more than 35% area as rainfed. Groundwater Status: Based on groundwater utilization, the districts are categorized into safe, semi-critical, critical and over-exploited by Central Ground Water Board (CGWB). Most parts of Rajasthan and parts of Tamil
Nadu are considered as over- exploited.
Irrigation intensity: More than 100% of irrigation intensity indicates assured availability of water for more than one cropping season in a year. Irrigation intensity is high in delta areas of Cauvery, Krishna & Godavari basins followed by the irrigated areas of Rajasthan. The districts falling under these regions have more than 40% of area under cultivation for more than one cropping season. Status of Natural Resources (NRI): The combined status of natural
resources (NRI) is low on left half of the country, i.e., Western and Central part extending from Haryana to Tamil Nadu with exception of West Coastal region of Karnataka & Kerala.
5 | P a g e
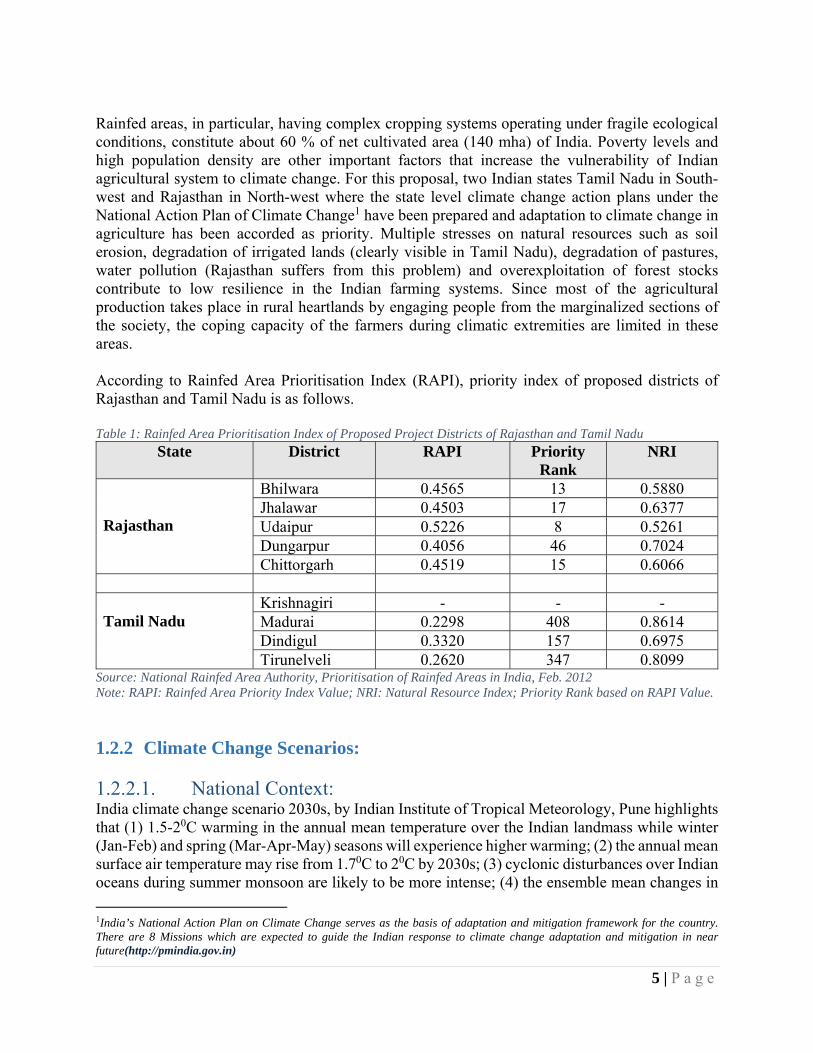
Rainfed areas, in particular, having complex cropping systems operating under fragile ecological conditions, constitute about 60 % of net cultivated area (140 mha) of India. Poverty levels and high population density are other important factors that increase the vulnerability of Indian agricultural system to climate change. For this proposal, two Indian states Tamil Nadu in South-west and Rajasthan in North-west where the state level climate change action plans under the National Action Plan of Climate Change1 have been prepared and adaptation to climate change in agriculture has been accorded as priority. Multiple stresses on natural resources such as soil erosion, degradation of irrigated lands (clearly visible in Tamil Nadu), degradation of pastures, water pollution (Rajasthan suffers from this problem) and overexploitation of forest stocks contribute to low resilience in the Indian farming systems. Since most of the agricultural production takes place in rural heartlands by engaging people from the marginalized sections of the society, the coping capacity of the farmers during climatic extremities are limited in these areas. According to Rainfed Area Prioritisation Index (RAPI), priority index of proposed districts of Rajasthan and Tamil Nadu is as follows. Table 1: Rainfed Area Prioritisation Index of Proposed Project Districts of Rajasthan and Tamil Nadu
State District RAPI Priority Rank
NRI
Rajasthan
Bhilwara 0.4565 13 0.5880 Jhalawar 0.4503 17 0.6377 Udaipur 0.5226 8 0.5261 Dungarpur 0.4056 46 0.7024 Chittorgarh 0.4519 15 0.6066
Tamil Nadu
Krishnagiri - - - Madurai 0.2298 408 0.8614 Dindigul 0.3320 157 0.6975 Tirunelveli 0.2620 347 0.8099
Source: National Rainfed Area Authority, Prioritisation of Rainfed Areas in India, Feb. 2012 Note: RAPI: Rainfed Area Priority Index Value; NRI: Natural Resource Index; Priority Rank based on RAPI Value. 1.2.2 Climate Change Scenarios:
1.2.2.1. National Context: India climate change scenario 2030s, by Indian Institute of Tropical Meteorology, Pune highlights that (1) 1.5-20C warming in the annual mean temperature over the Indian landmass while winter (Jan-Feb) and spring (Mar-Apr-May) seasons will experience higher warming; (2) the annual mean surface air temperature may rise from 1.70C to 20C by 2030s; (3) cyclonic disturbances over Indian oceans during summer monsoon are likely to be more intense; (4) the ensemble mean changes in
1India’s National Action Plan on Climate Change serves as the basis of adaptation and mitigation framework for the country. There are 8 Missions which are expected to guide the Indian response to climate change adaptation and mitigation in near future(http://pmindia.gov.in)

6 | P a g e
the monsoon rainfall are in the range of 2 to 12% while the annual temperature changes are of the order of 1.4 to 1.90C.IPCC have specific observations on India in relation to climate change and its impact in its AR 5 Report. Some of the findings of the report in the national context are as follows.
Rainfall: Over India, the increase in the number of monsoon break days and the decline in the number of monsoon depressions are consistent with the overall decrease in seasonal mean rainfall. But an increase in extreme rainfall events occurred at the expense of weaker rainfall events over the central Indian region and in many other areas. Water: Unsustainable consumption of groundwater for irrigation and other uses is considered to be the main cause of groundwater depletion in the Indian states like Rajasthan, Punjab and Haryana. Adaptation Options: Adaptation of freshwater resources to climate change can be identified as developing adaptive/integrated water resource management of the trade-offs balancing water availability against increasing demand, in order to cope with uncertainty and change. Examples of the options include: developing water saving technologies in irrigation; water infrastructure development in the Ganges river basin; increasing water productivity in the Indus and Ganges river basins; changing cropping systems and patterns; and water re-use.
Projected Impact:
In India, a changing climate was projected to reduce monsoon sorghum grain yield by 2-14% by 2020, with worsening yields by 2050 and 2080. In the Indo-Gangetic Plains, a large reduction in wheat yields is projected, unless appropriate cultivars and crop management practices are adopted. With rising temperatures, the process of rice development accelerates and reduces the duration for growth.Based on Wassmann et al. (2009a, 2009b), the report highlight that, in terms of risks of increasing heat stress, there are parts of Asia where current temperatures are already approaching critical levels during the susceptible stages of the rice plant. These include: North India (October), South India (April, August) and East India (March-June). In India, the Indo-Gangetic Plains are under threat of a significant reduction in wheat yields. This area produces 90 million tons of wheat grain annually (about 14-15% of global wheat production). Climate projections showed that there will be a 51% decrease in the most favorable and high yielding area due to heat stress. About 200 million people (using the current population) in this area whose food intake relies on crop harvests would experience adverse impacts. Floodplains and Coastal Areas. Three of the world’s five most populated cities (Tokyo, Delhi and Shanghai) are located in areas with high risk of floods (UN, 2012). Flood risk and associated human and material losses are heavily concentrated in India, apart from Bangladesh and China.

7 | P a g e
Industry and Infrastructure: On the east coast of India, clusters of districts with poor infrastructure and demographic development are also the regions of maximum vulnerability. Hence, extreme events are expected to be more catastrophic in nature for the people living in these districts. Moreover, the lower the district is in terms of the infrastructure index and its growth, the more vulnerable it is to the potential damage from extreme events and hence people living in these regions are prone to be highly vulnerable (Patnaik and Narayanan, 2009).
1.2.2.2. In the Context of Project States:
Climate Change Scenario-Rajasthan: Droughts: Rajasthan has experienced 48 drought years of varied intensity in the period 1901-2002, which means that the chance of occurrence of a meteorological drought in the state is about 47% (Rathore, 2004). The state has the maximum probability of occurrence of droughts in India (RPCB, 2010). The number of severe and very severe drought years is larger in the western and southern districts of Rajasthan even though the southern region receives high average rainfall. Ray and Shewale et al (2001)estimated the percentage area in India affected by moderate and severe drought and found (based on data analysis of a 124 year time-period, 1875- 1998) that the probability of occurrence of droughts was maximum in West Rajasthan. The probability of moderate drought in Rajasthan was found to vary between 17- 24%, and between 2-14% in case of severe drought. During the year 2002 when about 29% of the total area of the country was affected by drought, the seasonal rainfall departure (%) for west Rajasthan and east Rajasthan were -71 and -60 respectively. Based on historical data, it is observed that the frequency of occurrence of droughts in the state varies district wise. The recurrence period (year) of once in 3 years is seen for the districts Barmer, Jaisalmer, Jalore, Jodhpur and Sirohi. The recurrence period of once in 4 years is seen for the districts Ajmer, Bikaner, Bundi, Dungarpur, Sriganganagar, Nagaur, Hanumangarh and Churu. For districts Alwar, Banswara, Bhilwara, Jaipur, Jhunjhunu, Pali, Sawai Madhopur, Sikar, Dausa and Karauli the frequency of droughts are once in 5 years where as for Chittorgarh, Jhalawar, Kota, Udaipur, Tonk, Rajsamand and Baran the frequency is once every 6 years. The least drought occurring frequency of once every 8 years is seen for the districts Bharatpur and Dholpur.

8 | P a g e
Figure 1: Map of Rajasthan showing drought frequency for different districts; Source: Disaster Management & Relief Department, Government of Rajasthan Source: Rajasthan Climate Change Action Plan
Rainfall: The average rainfall of Rajasthan is 574 mm compared to the all-India average of 1,100 mm and a significant variation is seen across different regions. In the western Rajasthan, the average annual rainfall ranges from less than 100 mm in north-western part of Jaisalmer (lowest in the state) to over 400 mm in Sikar, Jhunjhunu, and Pali region and along the western periphery of the Aravali range. In the eastern region, the rainfall ranges from 550 mm in Ajmer to 1020 mm in Jhalawar. In plains, Banswara (920 mm) and Jhalawar (950 mm) districts receive the maximum annual rain. The highest rainfall (1638 mm) is received at Mount Abu (Sirohi district) in the southwest region of the state. The annual spatially averaged rainfall is highly variable and it is most erratic in the western region with frequent dry spells, punctuated occasionally by heavy downpour in some years associated with the passing low pressure systems over the region (Rathore, 2004)(Draft: Disaster Risk Reduction, SAARC Disaster Management Centre, 2008). The number of rainy days during the South west monsoon period from June end to mid-September over Rajasthan varies from 10 in Jaisalmer to 40 in Jhalawar and to 48 in Mount Abu. The number of rainfall days during the rest of the year in different parts of Rajasthan range from 2.1 cm at Jaisalmer to 7.2 cm at Jaipur, distributed over 2.5 to 6 rainy day (Khan, 1988). During the rainfall deficit year of 2002, the state received just 220.4mm rainfall up to September, against the normal of 518.6mm in the overall monsoon. The maximum average rainfall of 726 mm was recorded in 1996 and minimum 291.6 mm was recorded in 1987 prior to 2002 (Goel and Singh, 2006). Rainfall shows a fluctuating trend in the State between 2000 and 2013. In 2012, overall, percentage of deviation from normal rainfall estimated to be 17 percent (IMD report). Excess of 20% to 59% reported in 13 districts of the State

9 | P a g e
whereas deficit of 20% to 59% reported in 2 districts of the State during the same year. Normal and actual rainfall in the State from 1999 to 2012 is presented in the table. Table 2: Average Rainfall in Rajasthan from 1999 to 2012
Year Normal Rainfall (mm) Actual Rainfall (mm) Percentage Category 1999 531.0 450.0 (-)16% Normal 2000 531.0 381.0 (-)29% Deficit 2001 531.0 517.0 (-)3% Normal 2002 531.0 231.9 (-)56% Deficit 2003 539.8 552.9 (+) 1% Normal 2004 539.8 484.7 (-)12% Normal 2005 539.8 508.2 (-)7% Normal 2006 539.8 652.5 (+) 19% Normal 2007 539.8 505.7 (-)8% Normal 2008 539.8 540.5 (-)3% Normal 2009 539.8 387.0 (-)31% Deficit 2010 533.9 623.9 (+) 17% Normal 2011 530.1 701.0 (+) 32% Excess 2012 530.1 624.8 (+) 18% Normal
Source: Monsoon Report, 2012, Based on IMD.
The regional model estimates the mean annual rainfall to decrease slightly, but the extreme rainfall is expected to increase in frequency and intensity. 2071-2100 projections show an increase of 20mm for maximum 1-day rainfall and 30 mm for maximum 5-day rainfall. Temperature A gradual decreasing trend in mean annual temperature for the region of northwest India has been observed (Pant and Hingane, 1988). The maximum contribution to his decrease is during the southwest monsoon (-0.520C/100 years). An assessment on extreme weather events over India for the last 100 years has been done by De et al. (2005). After Jammu and Kashmir, Rajasthan is the second state where maximum number of cold waves has occurred (De et al., 2005). A gradual decreasing trend in mean annual temperature for North West region over India has been observed during the southwest monsoon season in the past. High resolution regional model projections for 2071-2100 have predicted an increase in annual mean surface temperature for all parts of India with an increase of 2-40C for the state of Rajasthan. Extreme Events: Droughts being rampant in Rajasthan, it has been found from observation records for over 100 years that the probability of occurrence of severe and very severe droughts is high over the Western Rajasthan region. In spite of receiving high average rainfall the Southern districts of Rajasthan have also experienced large number of severe droughts in the past. Many places in Rajasthan have witnessed flash floods due to heavy rainfall events. Floods in July 1981 in Jaipur, Tonk, Nagaur and in 2006 over Barmer are a few examples. All these floods have resulted in unprecedented loss of lives and property. Due to heavy rain downpour, flooding in rivers have been also observed over the state. Dholpur flood in Aug., 1982 is an example of flooding due to river Chambal.

10 | P a g e
Wind Damage: Barring the districts of Banswara and Dungapur, all of the districts in Rajasthan come under high damage zone owing to high velocity winds.
Figure 2: Map of Rajasthan showing wind damage risk zones. Blue: high risk green: moderate risk (Disaster Management & Relief Department, Government of Rajasthan) Source: Rajasthan Climate Change Action Plan
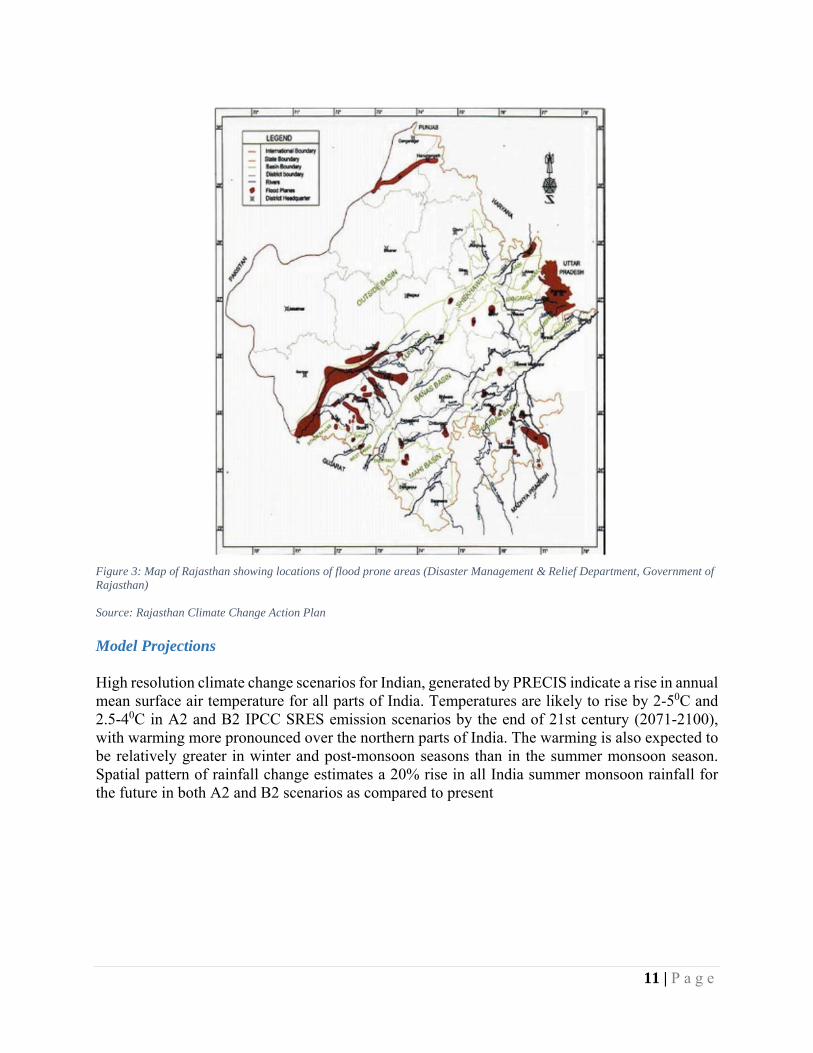
Flood: In July 1981, Rajasthan received abnormally heavy rain that caused flooding in Jaipur, Tonk, Nagaur and Sawai Madhopur. In July 1943, 50 inches of rain in one day was recorded on the hills of Mewar and Merwara. In August 2006, the usually drought prone Barmer district was hit by flash floods. Many people (about 1200) died in this flood. All these floods have resulted in unprecedented loss of lives and property. Apart from flooding from rainfall, river water flooding in Rajasthan has also caused havoc in past years. On 25th Aug, 1982 Dholpur in Rajasthan witnessed severe floods owing to river Chambal where the water level deviation was 14.21m over the danger level (DL) mark.
11 | P a g e
Figure 3: Map of Rajasthan showing locations of flood prone areas (Disaster Management & Relief Department, Government of Rajasthan) Source: Rajasthan Climate Change Action Plan Model Projections High resolution climate change scenarios for Indian, generated by PRECIS indicate a rise in annual mean surface air temperature for all parts of India. Temperatures are likely to rise by 2-50C and 2.5-40C in A2 and B2 IPCC SRES emission scenarios by the end of 21st century (2071-2100), with warming more pronounced over the northern parts of India. The warming is also expected to be relatively greater in winter and post-monsoon seasons than in the summer monsoon season. Spatial pattern of rainfall change estimates a 20% rise in all India summer monsoon rainfall for the future in both A2 and B2 scenarios as compared to present

12 | P a g e
Figure 4: Projected changes in summer monsoon rainfall (upper panel) and surface air temperature (lower panel) for A2 and B2 scenarios for 2071-2100 (Kumar et al. (2006); (SDC V&A Program, 2009) Source: Rajasthan Climate Change Action Plan
The model projections for mean annual surface air temperature in Rajasthan indicates an increase by 2-40C for the 2071-2100 period. Mean annual rainfall is predicted to decrease slightly, whereas the extreme rainfall is expected to increase in frequency and intensity. Maximum 1-day rainfall is expected to increase by 20 mm, and maximum 5-day rainfall by 30 mm in the period 2071-2100 (SDC V&A Program, 2009).

13 | P a g e
Figure 5: Baseline and future (2071-2100) projections of mean annual cycles of precipitation for Rajasthan, as simulated by PRECIS (Kumar et al., 2006)
Source: Rajasthan Climate Change Action Plan
Climate Change Scenario in Watersheds: It is observed that climate related risk is high in all most all the watersheds. Occurrence of drought /consecutive drought is a common phenomenon in these watersheds which affect overall production and productivity of crops. Likelihood probability of drought is expected in 3-4 years in majority of the watersheds, posing high threat to people’s livelihoods. Delay in onset of monsoon, high intensity rainfall in short duration and long dry spell in monsoon are also emerging as a threat for the people which results with top soil erosion, high crop mortality and poor availability of fodder crops for the livestock. Livestock rearing is one of the major livelihoods strategy in the State as a whole, including these watersheds and poor availability of fodder has got a direct bearing on the livelihoods of the marginal segment. Climate analysis reveals that probability of occurrence of such situation is once in 4-5 years in some watersheds and even within 3-4 years in some of these watersheds. Cold wave, frost, hailstorm and pest attack are some of other issues that have been observed in these watersheds. Table 3: Existing Climate Risk, Impact and Probability of Occurrence Matrix
Risk Impact of Climate Variability Likelihood Probability Risk Category
Drought Scarcity of drinking water Generally in 3-4 years High Migration of people Reduction in crop production / productivity Reduction in overall productivity of fodder Death of livestock due to lack of fodder Excess rainfall Soil erosion Every 3 to 4 years Medium Increased incidence of Insect / Pest Attack Human health issues (Fever, Dengue Etc.) Damage to water harvesting structures Delay in Monsoon Delay in sowing, planting and harvesting Every 4-5 year High Reduction in Kharif crop production Seasonality shift reduce productivity Scarcity of fodder

14 | P a g e
Delay in Kharif leads to delay in Rabi crop Intermitted long dry spell Reduction in crop yields, crop loss Every alternate year High Temperature extremes Increased evapo-transpiration Frequent Medium Reduced flowering and grain filling in wheat Increasing crop water demand , High mortality of small ruminants Fire out-break in forest area Hailstorm Crop Damage Every 3 to 4 years Medium Increased livestock mortality Cold wave High mortality of animals Every 4-5 years Medium Frost Crop Damage Every 2-3 years Medium Reduction in crop yields
Source: Climate Vulnerability Assessment Study in the proposed ten Watersheds of Rajasthan
Community Opinion on Climate Variability and its Impact: Field survey findings, including participatory situation analysis reveals that while the risk of drought is quite rampant in all the watersheds, floods / flash flood is also a threat due to intense rainfall in short span of time. Increasing attack of pests and morbidity / mortality rate of livestock population during such period is also witnessed by the community. Agriculture production normally goes down posing threat to family income from agricultural activities. Extreme Weather Events: Most of the watersheds have experienced extreme weather events during different years like, severe drought in recent years of 2002 and 2007, consecutive drought in 1998-2000, 2002-03 and 2007-10. Occurrence of flood / flash flood is also reported in some of the watersheds due to climate variability like flood of 2003 in Nayagaon-I and II watersheds, flood in 2006 in Malvi watershed etc. Future Climate Projection: As per the climate projection model for the watersheds, deviation in maximum temperature is expected to be between 0.26 to 0.94 across different watersheds by 2030 and which is likely to increase to 0.79 to 1.59 by 2050. Similarly, deviation in expected minimum temperature by 2030 is likely to be within 0.39 to 1.02 and by 2050, it is expected to be in the range of 1.03 to 1.77 across the watersheds. Expected change in rainfall is likely to be -3.0 to 4.3 by 2030 and 4.0 to 16.0 mm by 2050 in different watersheds. Climate Change Scenario-Tamil Nadu: Rainfall The State mainly receives its rainfall in three seasons, viz. South west Monsoon (SWM), North east Monsoon (NEM) and Pre monsoon season. The normal annual rainfall falling over the state is 958.4 mm is received at the State. About 48 per cent of the total annual average rainfall is received during NEM, while about 35 per cent is received during SWM and the balance in the other seasons. Tamil Nadu receives about 51 per cent of its annual rainfall during NEM season (IMD, 2001). The coastal districts receive about 65 - 75 per cent of annual rainfall and interior districts get about 40-50 per cent in this season. The percentage share of rainfall during the NEM

15 | P a g e
is higher in most parts of Tamil Nadu. The hilly regions in the west and hilly/ plain lands in north western half of the region only receive major share from SWM. Spatial distribution of the rain fall received over Tamil Nadu is highly variable. Rainfall over coastal areas is more and decreases to inland areas since the rainfall causing systems are forming over Bay of Bengal and moving towards the coast of Tamil Nadu. Also the rainfall over northern end is more than the southern locations. It is probably due the maximum rainfall zones of the main systems are in the north eastern sectors. Orography of the rainfall process also plays an important role in the spatial distribution of rainfall. The windward (eastern) sides of the Eastern Ghats are having more rainfall than the leeward (western) side. The total amount of rainfall in the season is not constant and have inter seasonal and intra seasonal variability due to formation/ non-formation of rain causing mechanisms and their movements. If they move in north westerly or westerly direction, the systems cause more rainfall than when they re-curve or move in northerly direction The coefficient of variation of annual rainfall is less than 25 per cent over the central part except over the coastal area north of latitude 10° N and extreme southern part where the coefficient may even exceed 30 per cent. A review study carried out by Jain and Kumar (2012), indicates that the annual rainfall has increased by +8.5 percent and +4.4 percent in the Cauvery river basins and the river basins north to Cauvery river basin in Tamilnadu respectively in the last 100 years with respect to the average rain fall during this period. The river basins that are in the south of the Cauvery river basin have experienced decrease in annual rain fall by -9.8 percent. An analysis of annual rainy days indicates that there is no change in the Cauvery basin in the last 100 year period, however, the river basins north and south of the Cauvery basins have experience decreasing trend by -3.6 per cent and - 32.3 per cent. Monsoons Onset and Withdrawals:The normal onset of Southwest (SW) monsoon over Tamil Nadu is predicted to take place on 1st June with a standard deviation of 7.4 days (based on data of 1901-2011). During the last 31years (1981-2011) period, however, the normal date has advanced by a day with SD of 6 days. The earliest onset is 11th May and the late onset is 18th June. Based on the linear trend analysis, it was found that the onset is advanced by one day in every 20 years period (1901-2011). The Northeast monsoon (NE monsoon) sets in over Tamil Nadu on 20th October (based on 1901-2000). The earliest onset is 4th October and late onset is 11th November. In 75 per cent of years, the onset of NE monsoon took place between 13th October and 27th October. In 8 per cent of years the monsoon onset was found in November month (Asokan, 2007). Northeast monsoon withdraws from Tamil Nadu on 30th December with SD of 14 days. IN 51 per cent of the years, the withdrawal is between 14th December and 4th January. IN 2 per cent of the years the withdrawal took place in November itself. IN 40 per cent of the years, the withdrawal occurred in January month. The early or late onset does not have any bearing on the monsoon performance. Extreme Rainfall:Long term studies carried out by Guhathakurta et al (2011), for the period 1901-2005, indicate, that Tamilnadu is experiencing more dry days than wet days every year. However, there has been a significant increase in heavy precipitation events as indicated in the recordings of

16 | P a g e
the IMD observing stations in the state. Increase in one day extreme rain fall events of the order of 5 to 10 cm has been observed along the northern coast of the state. In rest of the state, the extreme rain fall event has increased by less than 5 cm or less. The analysis of 25 year return period of rain fall shows a large variation from 10cm in the western parts of Tamilnadu to 25 cm and more in the northern and central coastal regions of the state. Temperature In general the maximum temperature rarely exceeds 43° C and the minimum temperature rarely downs below 18° C. The mean annual temperature is 28.2°C in the plains and 15.2°C in the hills. The temperature is minimum in the month of December with 24.7°C and maximum in May with 37.3°C. Soil temperature data available for a few places indicate a range from 30.7°C to 32.3°C in the plains and around 14.4°C in the hills. On the basis of temperature the coastal plain (Aduthurai) is classified as hyper-thermic (very hot), northern part (Coimbatore) and southern part (Kovilpatty) are iso-hyperthermic (steadily very hot) and hill area (Uthagamandalam) is iso-mesic (steadily cold). Annamalai et al (2011), based on their study on temperature over Cauvery basin of Tamil Nadu reported that the average year to year variation in surface temperature lies in the range about 0.4° C with few years warmer or cooler by 0.80C. Based on the technique of deducting the long-time forced component (trend), the temperature series in both the seasons clearly indicates a warming tendency. For the period from 1951 to 2008, the warming is of the order of 0.7 to 0.80C and this is above the natural variability. One difference is that, while the warming is gradual during SWM, it appears to occur abruptly during NEM season. Balasubramanian et al (1994) based on their analysis of Coimbatore prevailed temperature from 1962 to 1992 found that there was decadal variability in maximum and minimum temperature and this was on the rise level up to 0.1 to 2.70C. Cyclones Along the eastern coast of India, Tamilnadu has been hit by about 32 cyclonic storms between1891 to 2006 of which 30 were severe cyclonic storms. The total number of cyclonic storms hitting the Tamilnadu coast increased to 44 by 2011. A sharp increase by 37.5 per cent between 2006 and 2011. Maximum number of cyclonic storms tend to cross over north Tamil Nadu coast in the post monsoon season. No cyclonic disturbances crossed Tamil Nadu coast during monsoon season (June-September). The number of storms crossed north Tamil Nadu coast is four times more than that crossed south Tamil Nadu coast during Pre monsoon months during this period. Only three cyclonic disturbances crossed Tamil Nadu coast during winter months. Linear trend analysis based on two different periods 1891- 2011 for winter, pre monsoon, Monsoon, post monsoon and annual frequency shows that the formation of cyclonic disturbances in the BOB during winter and post monsoon months (October-February) shows an increasing trend while a decreasing trend is seen during the monsoon months (June – September).There is an increasing trend in the number of severe cyclonic storms to form in BOB in Pre monsoon months (March –May) during same period.

17 | P a g e
Sea level rise The mean sea level rise trendoff the Chennai coast is 0.32 mm/year, estimated with a 95% confidence interval of +0.37 mm/year based on monthly mean sea level data for the period 1916 to 2008 which is equivalent to a change of 0.10 feet in 100 years Climate Projection: The following section gives the projections of temperature and precipitation based on outputs obtained at a spatial resolution of 25 km x 25 km generated by the UK Met Office Hadley centre regional climate model PRECIS with boundary data inputs from 6 of the 17- member perturbed-physics ensemble (HadCM3Q0-Q16, known as 'QUMP'). The GHG emission drivers are generated by the IPCC A1B SRES scenario. Maximum Temperature: The maximum temperature over Tamil Nadu is projected to increase by 1.1 0C, 2.0 0C and 3.40C in the years 2040, 2070 and 2100 respectively with reference to the baseline 1970-2000. District wise changes indicate a general maximum increase of about 1.3 0C over the North western districts of Nilgiris, Coimbatore, Tiruppur and western parts of Dindigul District. The minimum increase of about 0.7 0C is seen along the eastern parts of coastal districts particularly over Kanyakumari, Nagapattinam, Tirunelvelli and Ramanathapuram.
Figure 6: Change in Max. Temperature (0C) projections for 2040, 2070 and 2100 with reference to baseline (1970-2000). Source: Climate Change Action Plan, Tamil Nadu (Draft)
Minimum Temperature: Projection of minimum temperature over Tamil Nadu as a whole for 2040, 2070 and 2100 with reference to baseline 1970-2000 are likely to increase by 1.10C, 2.2 0Cand 3.40C respectively. District wise changes indicate generally lesser changes over the western parts and close to the coast. A general rise in temperature is seen ranging from 1 to 1.50C for the period 2010 to 2040 and between 2 to 2.60C for the period 2040-2070 and between 2.7 to 3.80C for the period between2070 and 2100.The southern districts Kanyakumariand Tirunelvelli show minimum increase,while the centralinterior districts Karur,Tiruppur,and Namakkal show the maximum increase in the minimum Temperature.

18 | P a g e
Figure 7: Change in min. Temperature (0C) projections for 2040, 2070 and 2100 with reference to baseline (1970_2000) Source: Climate Change Action Plan, Tamil Nadu (Draft)
Annual Rainfall: The Projection for 2040 indicates a general increase in rainfall by about 7cm for the period 2040 to 2070 with reference to the base mean 1970 to 2000 while it increases by 9cm for the period 2070 to 2100. SW and NE monsoons being principal rainy seasons and analyses have been carried out for these two seasons. For Tamil Nadu as a whole, both SW and NE monsoon generally show an increase in rainfall for 2040, 2070 and 2100 ranging from 1.2 to 1.9 cm. However district wise projection indicate variant distribution.
Figure 8: Change in Annual Rainfall (mm) projections for 2040, 2070 and 2100 with reference to baseline (1970_2000) Source: Climate Change Action Plan, Tamil Nadu (Draft)

19 | P a g e
Cyclone Projections:The 4x4 report published by the Ministry of Environment and Forest (MoEF), Government of India, in 2010 concludes, that in future, the number of cyclones hitting the eastern Indian coast including Tamil Nadu is likely to reduce, however, the intensity,i.e., the wind speed of the cyclones may increase. Projected Sea Level Rise:Using CLIMASYSTEM (a model used for generating sea level rise) with climate inputs from PRECIS it is projected that by the end of the century i.e. by 2100 the Sea level may rise off Tamil Nadu coast up to the height of 1.1 to1.25m. Consequently the increase in sea level rise in 2100 with respect to current levels is likely to range from 0.19 m to a maximum of 0.83 m. Table 4: Projection of Sea Level Rise based on different IPCC SRES Scenarios
IPCC SRES Scenarios GLOBAL PROJECTIONS
2100
REGIONAL PROJECTIONS 2100
1.097 m 1.252m B1 0.18 to 0.38m 0.19 to 0.41m 0.22 to 0.47m B2 0.20 to 0.43m 0.21 to 0.47m 0.25 to 0.53m A1B 0.21 to 0.48m 0.23 to 0.52m 0.26 to 0.60m A1T 0.20 to 0.45m 0.21 to 0.49m 0.25 to 0.56m A2 0.23 to 0.51m 0.25 to 0.55m 0.28 to 0.63m A1F1 0.26 to 0.59m 0.28 to 0.64m 0.32 to 0.73m
Source: Climate Change Action Plan, Tamil Nadu (Draft)
Impact of climate change Agriculture:The major climate change drivers that could adversely impact agriculture in Tamil Nadu are: Continuous increase in ambient temperature: It is well known that increase in temperature leads to decrease in yields of majority of the crops. For example, increase in temperature, causes spikelet sterility in rice affecting its productivity. Some crops may gain due to increase in CO2 in the atmosphere, for example maize, but temperature increase beyond 30C will reduce maize yields as well.
Increase in frequency and intensity of droughts: Tamil Nadu is prone to droughts in every 2.5 years. As a result of droughts, summer crops are likely to experience enhanced Evapo Transpiration, needing larger, more frequent irrigation. The surface water resources are likely to be depleted, creating pressure on ground water which though may need the needs in the 1st year but recurrent droughts will not enable natural recharge. Further, over extraction of ground water will enhance carbon footprint. The droughts are spread in pockets across Tamil Nadu. A further increase in frequency is likely to lead to increased soil erosion due to long dry spells and increase in fallow land, hampering the food security of the population in these pockets and a large scale migration may happen.

20 | P a g e
Increase in intensity of cyclones and floods: Along with heavy rains during the North east monsoon in the state, it experiences atmospheric depression and cyclones hit the state. With climate change as the cyclone intensities increase, this has implications on agriculture in the coastal zones. The cyclone frequency though is not noticeably increasing, the wind speed of the cyclone is increasing. This means, a larger area and deeper inland areas are likely to inundate with salt water from the sea as higher storm surge heights form. Districts along the Tamil Nadu coast are at risk.
Increase in heavy precipitation events: This is likely to lead to flash floods, leading to deterioration in soil health due to heavy loss of top soil due to erosion in hilly areas, and decline in soil organic matter content thereby impacting agriculture in these areas. The other risk that the agriculture system may have to deal with is the emergence of new pests and diseases. All this may lead to increased cost of cultivation with more number of irrigation and climate sensitive inputs Crop specific Impacts
Rice: Increase in temperature at different growth stages of paddy crop influence its yields, with different magnitude. The impact on yields of increase in temperature by 20C is minimal during the early vegetative stages and becomes higher as one goes along and is maximum during the flowering and grain-filling stages of rice and this is detrimental to rice production (Priya and Geethalakshmi, 2008)
Another study using projections of PRECIS model (HadCM3) for A1B scenario for Kharif (SWM) indicate that in 2020, a likely decrease by 10 to 15 per cent in rice yield is expected due to increase in temperature and change in rainfall (Geethalakshmi and Dheebakaran, 2008). In 2050, 30 to 35 per cent yield reduction and in 2080, up to 80 per cent yield reduction are expected during this season. Though, the reduction is found in all most all the districts, it is more pronounced in the major rice growing districts of the State such as Thanjavur and Nagapattinam.
The same study for the Northeast monsoon (Rabi season) indicates that there is increase in rice yield up to 10 per cent in 2020. This might be due to the positive effect of slight increase in temperature during the Rabi season, where the crop suffers due to low air and water temperatures at present. As the major rainy season and the winter season of Tamil Nadu fall in the Rabi season, most of the time the water temperatures are lower. Increase of 1 to 2 degree must have created a positive impact during 2020. In 2050, Rabi rice yields expected to be almost same as that of the current productivity and further increase in temperature during 2080 had negative impact and may reduce the yields up to 25 per cent in most of the districts of Tamil Nadu.
Maize: The change in climate is expected to create both positive as well as negative impacts on maize cultivation. Impact of maize yield was studied for major maize growing districts of Tamil Nadu using INFOCROP model for climate change scenarios developed for 2020, 2050 and 2080 (Geethalakshmi, 2009). Analysis projected reduction in yield by 3.0, 9.3 and 18.3 per cent by 2020, 2050 and 2080 respectively from the current yield levels.
Sorghum: Impact of sorghum yield on climate change was studied for major sorghum growing districts of Tamil Nadu using INFOCROP model for the climate change scenarios developed for 2020, 2050 and 2080 (Geethalakshmi, 2009). The results indicate decline in yields by 4.5, 11.2

21 | P a g e
and 18.7 per cent respectively by 2020, 2050 and 2080 from the current yield levels if no management intervention is made. The yield reduction might be mainly because of more increase in night time temperature (minimum temperature) compared to the magnitude of increase in maximum temperature and variation in the expected rainfall.
To understand the response of cotton and red gram crops to future climate change, INFOCROP model was run using base year weather data and B2 scenario for different time periods starting from 2070 to 2100. The results indicate that the climate change is expected to negatively impact the cotton and red gram productivity. Water Resources:Tamil Nadu constitutes about 4 percent of India’s land area and is inhabited by 6 percent of India’s population, but has only 2.5 percent of India’s Water resources. More than 95 percent of the surface water and 80 percent of the Ground water have been put into use. Major uses of water include human/animal consumption, irrigation and industrial use. The demand for water in Tamil Nadu is increasing at a fast rate both due to increasing population and also due to larger per capita needs triggered by economic growth. The per capita availability of water resources however, is just 900 cubic meters as compared to all national average of 2,200 cubic meters. Agriculture is the largest consumer of water in the State, using 75 per cent of the State’s water resources. Demands from other sectors such as domestic and industries have been growing significantly. The State is heavily dependent on monsoon rains. The annual average rainfall is around 930 mm. (47 percent during the north-east monsoon, 35 percent during the south-west monsoon, 14 percent in the summer and 4 percent in the winter). Actual rainfall for the year 2010-11 is 1165.10 mm, out of which 48 percent is through the Northeast Monsoon, 32 percent is through the Southwest Monsoon and the remaining 20 percent is through summer and winter rainfall. Since the State is entirely dependent on rains for recharging its water resources, monsoon failures lead to acute water scarcity and severe droughts. Demand- Supply Gap: The total water potential of the State including cross border contribution from Andhra Pradesh, Karnataka and Kerala is 1775.60 TMC (47,680 MCM). This also includes ground water potential of about 20,649 MCM. The sectoral demand for water in 2011 was 49,773 MCM, which is about 2000 MCM more than the potential availability. The demand is projected to increase to 48,766 MCM and 55,649 MCM in 2020 and 2045 respectively. The gap between supply and demand by 2020 is expected to be 5,211 MCM (11 percent) and it is likely to go up to 17 percent by 2050, if there is no intervention. Therefore all possible measures have to be taken to reduce the gap. Over-exploitation of Ground Water: As per the available data, up to 80 percent of the ground water is being used out of total available. This has led to the decline in ground water table in most of the blocks. According to the estimates for 2009, out of 385+1 blocks, 138+1(Chennai District) are over exploited, 33 are critical, 67 are semi-critical and in 11 blocks the quality is bad. Decreasing Southwest Monsoon and Increasing Northeast Monsoon: From the Pie chart showing the annual average rainfall of the State, it is evident that the Northeast monsoon rainfall has increased from 34 percent to 63 percent and the Southwest rainfall has decreased from 48 percent to 24 percent, in a span of 10years.

22 | P a g e
Floods:Tamil Nadu generally receives copious rains during the Northeast monsoon. The heavy downpour in a short duration results in severe flood causing great risk of damage to life and property of the people and to the states assets like irrigation infrastructure, roads, etc. Every year coastal districts such as Cuddalore, Nagapattinam, Thanjavur and Thiruvarur are the most vulnerable to floods. Urban flooding is another significant problem in Tamil Nadu. The capital city Chennai and its suburban areas are worst affected by flood every year because of improper drainage and encroachment of water bodies and waterways. In the last three decades, Chennai Metropolitan Area experienced heavy floods during the years 1976, 1985, 1996, 1998, 2005, 2007 and 2008. The 2005 flooding was caused by torrential rain over four weeks in October and early November, and was compounded by more monsoonal storms that hit the region in late November. Droughts:Tamil Nadu, a coastal state in south India, is also prone to droughts. The climate of the state ranges from dry sub humid to semiarid. An assessment of droughts in Tamil Nadu from 1977 to 1991 reveals recurrent drinking water shortages in major parts of the state and the Chennai city in particular. The worst drought years in the past 32 years are identified as 1980, 1982, 1983, 1987, 1989, 2002, 2003, 2004, 2006 and 2009. The drought of 1980 destroyed the groundnut crop in over 1, 00,000 hectares in the districts of Chengalpattu and Vellore. According to a study of rain pattern in peninsular India by the Indian Council of Agricultural Research (ICAR), the frequency of deficit rainfall and resultant drought is once in every 2.5 years in Rayalaseema and Telangana, three years in entire Tamil Nadu, four years in Vidarbha and north interior Karnataka, and once in five years in coastal Andhra Pradesh, south interior Karnataka and central part of Maharashtra. Low Water Use Efficiency:The overall efficiency in surface irrigation like canals and tanks is only 40 percent (as compared to 75 percent in Israel) whereas in well irrigation it is 70 percent. Researchers opine that this level of overall efficiency can be increased to 50 to 60 percent in surface irrigation and to 85 percent in well irrigation. If the overall efficiency were increased in phases from 40 percent to 50 percent and 60 percent, this would annually save about 3,000 MCM for every 10 percent increase in efficiency. Likely Implications of Climate Change on Water Resources:Evaluating the potential impacts of climate change on water resources (precipitation) requires the application of hydrological simulation modelling techniques, driven by scenarios of changes in temperature, precipitation and potential evapotranspiration derived from global and regional climate modelling studies. Precipitation is one of the least well-represented processes in climate models at present, and the uncertainty in projections of climate change impacts on water resources is therefore high. The following section summarises a review of various studies carried out to understand the likely availability of water in the future in a changing climate scenario. Rainfall and water balance projections in Mid Century:In support to the National Water Mission’s National Action Plan on Climate Change (NAPCC), the Asian Development Bank has carried out a study during 2011, to assess the likely changes in water balance projections for the Cauvery river basin which occupies about one third portion of geographical area of Tamil Nadu and is the main river basin in the state, shared along with the state of Karnataka.The study used SWAT (Soil and Water Assessment Tool) model with inputs from PRECIS Regional Climate Model run on IPCC A1B SRES. One realisation of the HADCM3 QUMP (Quantifying
23 | P a g e
Uncertainty in Model Predictions, Q14) has provided the boundary conditions for the PRECIS run. The projections under the A1B scenario indicate the following: Average Annual changes: Annual Rainfall - For the A1B scenario no significant change is forecasted in the annual rainfall to the mid-century. Annual precipitation is highest in the Cauvery delta and in the northwest of the basin where over 1000 mm occurs. Most precipitation in the northwest of the basin is as a result of the southwest monsoon, while in the delta it is largely associated with the northeast monsoon. Projections for Southwest monsoon: Southwest monsoon Rainfall - For the southwest monsoon, the indications of the PRECIS A1B results are that there will be a reduction in precipitation by up to 10 percent by mid-century. The implications of this projection are increased demand for irrigation water in the upper basin, coupled with a reduction in surface water availability for the delta part. The surface water resource available to the Cauvery delta is likely to decrease during the southwest monsoon under this scenario. Groundwater demand: Groundwater demand will probably increase to compensate for the estimated weakening of the Southwest monsoon. Changes in evapotranspiration: Marginal increase have been predicted leading to increase in water demand for crops during Southwest monsoon season. Surface runoff: Run off is projected to decrease during Southwest monsoon season. Projections for Northeast monsoon:
1. For the northeast monsoon the PRECIS A1B scenario indicates a 10 percent to 20 percent increase in precipitation in the Cauvery delta. Drainage is already a problem in the lower parts of the delta, and increased northeast monsoon precipitation coupled with higher sea levels will exacerbate the problems.
2. Changes in ground water recharge: The ground water estimation predicts an increase in salinity issues.
3. Flood risk: Increased rainfall, rainfall intensities and sea-level rise will increase flood risk during the Northeast monsoon. Flooding is already a problem and will likely become more significant in the future.
Rainfall Projections in End Century:IIT Madras in collaboration with Tamil Nadu Agricultural University carried out a study to assess the likely rainfall scenario in the mid-century that is likely to emerge due to climate change. This study was part of the CLIMARICE project that was supported by the Norwegian Government. The climate change data used for this study was simulated by the GCM run by the International Pacific Research Centre (IPRC) Hawaii. Climate change simulations were made using GFDL doubling of CO2 concentration in the end-century (A1B scenario) and the GCM results were downscaled to 25km resolution using IPRC-RegSIM model. The results are shown in the following figures.

24 | P a g e
Figure 9: Annual rainfall base line and projections
Source: Climate Change Action Plan, Tamil Nadu (Draft)
Figure 10: Annual rainfall days in base line and end century scenario
Source: Climate Change Action Plan, Tamil Nadu (Draft)

25 | P a g e
Figure 11: Average rainfall intensity Source: Climate Change Action Plan, Tamil Nadu (Draft)
From these figures, it can be deduced that;
1. Annual rainfall is predicted to increase considerably towards the end of century (2081-2100) in Tamil Nadu. This is in agreement with the basin level study carried out by ADB (2012) and by Gosain et.al. (2011) and several other studies that project an increase in rainfall for most parts of Tamil Nadu.
2. Though there is likely to be increase in rain fall annually, but, number of rainy days is likely to decrease by half in the end century scenario with respect to the base line
3. Annual rainfall intensities are likely to increase by 7-12 mm/day 4. Rainfall intensities during south west monsoon is likely to remain at 3-6 mm/day in the
coastal areas but in the rest of state it is likely to increase to increase to 9-16 mm/day 5. Rainfall intensity during the north east monsoon is likely to increase by 9-22 mm/day by
the end of the century across the state, with heavier precipitation towards the coast 6. Annual rain fall intensity is again likely to increase by 8-14 mm/day all across the state by
the end of the century. Ground Water Projections
1. Climate Change is projected to have adverse impact on the ground water resources of the State. The coastal districts and islands are more sensitive to Climate Change than the

26 | P a g e
inlands. The factors that are likely to create impact on ground water resources due to climate change are as follows:
2. Rise in sea level due to increase in global temperature will result in shifting of shore lines
towards inland, thus affecting the freshwater interface in the coastal aquifer. The fresh water resources in thirteen coastal districts in Tamil Nadu are affected due to seawater intrusion. The fresh ground water in Rameswaram and other islands in the State will be affected due to sea level rise.
3. The contribution of rainfall to the ground water recharge determines the quantum of ground water available for various uses. Hence, the occurrence of flood and drought due to climate change affects the ground water recharge.
4. Climate change is likely to induce changes in hydro meteorological parameters like evaporation, evapotranspiration, wind direction and wind speed etc. The changes are likely to have direct or indirect impact on ground water resources. Area irrigated by tanks will get affected severely due to evaporation losses in the tanks, which in turn would result in over dependence on ground water. Since 1980 onwards, number of over exploited blocks has increased from 21 percent to 48 percent over a span of 30 years.
Impact of Climate Change on Forests and Biodiversity:The forest cover in the State is 23625 Km2 (Forest Survey of India [FSI] report 2009), which is 18.16 percent of the total geographical area of the state. The forests are spread along the Western Ghats and in Eastern Ghats in Tamil Nadu.The state ranks 13th among the Indian States and Union Territories with reference to total recorded forest area. In terms of forest canopy density in 2009, very dense forests occupied 12 percent (2948 sq km) of the total forest area in the state. The medium dense forest covered41 percent (10321 sq km), Open forests covered 46 percent (10356 sq km), and Scrubs covered 5% of the total forest area respectively. Between 2007 and 2009, satellite observations indicate an increase in very dense forest cover by 22 Km2 (FSI, 2011). Simultaneously there has been an increase in open forest cover by 118 sq km, the medium dense forest cover has decreased by 22 km2 and scrub area has decreased by 40 km2. FSI estimates indicate that in2009, the growing stock in Tamil Nadu was144.404 million cum of which 48 percent growing stock is in trees outside forests. Nine major forest types exist in Tamil Nadu (2009). Ecosystems and associated services are sensitive to changes in climate and anthropogenic changes. Forests as discussed earlier are subject to multiple stresses, climate change brings an additional stress that can result in serious impacts on the forests. Increasing temperatures usually result in increase in the frequency of forest fires and pest and disease infestation in forests. Intermittent occurrences of drought and floods also result in increase in soil erosion and degradation of watershed, thereby affecting the forest cover. The changes in characteristics of ecosystems coupled with habitat degradation and fragmentation is likely to further weaken the ability of forests to continue to provision ecosystem goods and services. Studies on impacts of climate change on India’s forests in 2030’s and 2080’s using IBIS with climate inputs from PRECIS run on A1B IPCC emission scenarios, indicate shifts in forest boundary, changes in species-assemblage or forest types, changes in net primary productivity,

27 | P a g e
possible forest die-back in the transient phase, and potential loss or change in biodiversity (INCCA, 2010). Enhanced levels of CO2 are also projected to result in an increase in the net primary productivity (NPP) of forest ecosystems over more than 75 percent of the forest area. It is projected that in 2030’s most of the forest biomes in India will be highly vulnerable to the projected change in climate and 70 percent of the vegetation in India is likely to find itself less than optimally adapted to its existing location, making it more vulnerable to the adverse climatic conditions as well as to the increased biotic stresses.An India wide study carried out by Chaturvedi et al (2010), using IBIS with climate inputs from PRECIS run on A2 IPCC emission scenario, indicates, that the forests within the Tamil Nadu state are highly vulnerable due to climate change. The vulnerability index is varying between 4-7, which is associated with medium to low forest crown cover, i.e., fragmented forests making it vulnerable to pest attacks and diseases prone and at risk to frequent fires. Impacts on grassland, mangroves, wetland, and coral reefs: According Sukumar et al (2004), increasing atmospheric CO2 levels are projected to favour C3 plants over C4 grasses, but the projected increase in temperature would favour C4 plants. C3 plants include cool, temperate grasses and practically all woody dicots, while C4 plants include warm, tropical grasses, many types of sedge and some dicots. The C4 plants that constitute much of the biomass of tropical grasslands, including the arid, semi-arid and moist grasslands in India, thrive well under conditions of lower atmospheric CO2 levels, higher temperatures and lower soil moisture, while C3 plants exhibit the opposing traits. Mangroves form an important part of the forest ecosystem mainly distributed along the east coast. Studies indicate that the extent and composition of mangroves may undergo major change, depending on the rate of climate change and anthropogenic activities. Impact on mangrove forests will depend upon the rate of sea level rise and sediments supply from rivers, storm surges, and fresh-water flows in rivers. Sea-level rise would submerge the mangroves as well as increase the salinity of the wetland. Impact on Non-timber forest produce (NTFP): NTFP contributes to about 20 to 40 percent of the annual income of forest dwellers who are mostly disadvantaged and landless communities with a dominant population of tribal. Depleting resource base either because of diversion of forest land for non-forest use, or due to unsustainable harvesting practices has been the major ecological challenge. Various research data suggest change in temperature and rainfall pattern affect the NTFP production-both qualitatively and quantitatively (for example, lac,honey,)which in turn affect the dependent economy of the local people. Climate Change Scenario in Watersheds: Climate Related Risk: Like Rajasthan, risk of occurrence of drought / consecutive drought is common in all the watersheds. While the risk of consecutive drought is observed in three watersheds, occurrence of drought is common in the remaining seven watersheds. Probability of occurrence of drought is likely in 2-3 years with a high risk. Delay in monsoon, shift in rainy days, intermitted dry spell is also common in most of the watersheds, resulting crop failure, less productivity, scarcity in water availability for saving standing crops etc. Occurrence of excess rainfall in short span is also

28 | P a g e
observed in watersheds like Anjukulipatty – Dinduigal and Ayyampalayam – Dindigul. Excess rainfall in these areas wash out top soil resulting poor nutrient availability for crops. Extreme temperature situation is also reported in most of the watersheds which increases evapo-transmission and minimize soil moisture content. High wind speed and fog is also observed in some of the watersheds. Table 5: Existing Climate Risk, Impact and Probability of Occurrence Matrix
Risk Impact of Climate Variability Likelihood Probability Risk Category
Drought Reduction in crop yield Once in 2-3 years High Migration of community Poor family income Food shortage High plant mortality Drinking water scarcity Fodder shortage Scarce water availability for domestic use Intermittent dry spell Low soil moisture Almost every year High Livestock affected / low animal productivity Water accessibility / irrigation demand Low crop yield Excess rainfall Soil erosion in sloppy land Once in 5 years Medium Crop damage Low yield High pest and disease attack Delayed on set of monsoon Shift in sowing and harvesting period Frequent High Scarcity of fodder Negative effect in crop yield& quality scarcity of water Unseasonal rainfall Damage to standing crops Once in 3 – 4 years Medium Low production / productivity Uncertainty in onset of monsoon Delay in sowing, shortened LGP Once in 3-4 years Medium High wind speed Affects vegetable crops Every year Medium Lowers ground water table Physical damage to crops Soil erosion Reduction in soil moisture content Frequent irrigation need Reduction in yield Extreme Temperature Increased evapo- transpiration Frequent High Reduced soil-moisture content More crop water demand Frequent irrigation requirements Reduction in crop yield Low night temperature and dew Affects vegetable crops production Every Year Medium Increased pest / plant disease Reduced flower quality Cold wave High mortality of animals In the last 4 years Medium Hail storm Destruction at flowering state (mango trees) Once in 3-4 years Low Flood / Flash Flood Soil erosion Occasional Low Crop damage / high mortality Low productivity
Source: Climate Vulnerability Assessment Study in the proposed ten Watersheds of Tamil Nadu.
Community Opinion on Climate Variability and its Impact: Community oriented participatory assessment reveals that, people in the watershed have been facing severe water scarcity. While excess rainfall hampers the crops during monsoons, water
29 | P a g e
scarcity pose threat to standing crops. Increase in day temperature with poor water availability induces high crop mortality in the watersheds. Extreme Weather Event: The watersheds witness extreme weather events, like drought, flood, high temperature and precipitation in recent years. People in watersheds faced drought situation in different years like drought in 2002-03, 2011, 2012, and 2013. In some watersheds, drought occurred in 1998-2000. About four watersheds witnessed severe drought during 1960-70s. Along with drought, people in the watersheds also experience flood in different years. Future Climate Projections: As per the analysis of future climatic situation in the watersheds, the deviation in maximum temperature is expected to be in the range of 0.490C to 0.630C by 2030 and likely to increase in the range of 0.910C to 1.050C in different watersheds by 2050. Maximum temperature in the watersheds expected to increase by 20C to 30C by 2100. Minimum temperature also likely to increase by 30C to 3.5-40C during the same period of time. Expected deviation from the mean in minimum temperature is likely to be in the range of 0.490C to 0.750C by 2030 and within 0.910C to 1.670C by 2050. Likelihood of change in rainfall as projected in 2030 and 2050 scenario, reveals that by 2030, expected change in rainfall will be within -1 mm to 8.34 mm and by 2050 it will be in the range of 3.2 mm to 10.56 mm in different watersheds. climate analysis covering the above features and suggested interventions to address the identified risks. A copy of the report in respect of Anjukuttipalli watershed in Tamil Nadu is enclosed as Appendix 1. Based on the individual watershed-wise analysis, a climate proofing table, has been prepared covering climate variability, direct impact, indirect impact, non-climatic stresses, sensitivities, existing adaptive capacity and suggested adaptation strategies. A copy of the model climate proofing table for Tamil Nadu is enclosed as Appendix 2 1.3 Economic, Social, Developmental and Environmental Context: 1.3.1 Project State of Tamil Nadu: Tamil Nadu, a southern state of India, has 6 per cent of the national population, but has only 4 per cent of land area and 3 per cent of water resources of the country. Tamil Nadu is one of the water starved States, where the per capita availability of water resources is 900 cubic meters per year as compared to all India average of 2,200 cubic meters. The annual average rainfall for the state is around 921.50 mm (48% during north-east monsoon, 35% during south-west monsoon, 14% during summer and 3% during winter). The Gross Cropped Area which was 6.226 million Ha (including area under Horticulture crops) during 2001-02 has come down to 5.753 million hectors during 2010-11. Of this, 3.348 million hectares (58%) are under irrigated condition and 2.405 million Hectors (42%) are rain-fed. The net cultivable area which was 5.172 million hectors during 2001-02 has come down to 4.954 million ha during 2010-11. As against the net cropped area of 4.954 million hectares, 2.912 million hectares (59 per cent) is irrigated through different sources. In the absence of perennial rivers, rainfall is the only source of water in the state and that too inconsistent due to vagaries of monsoon. There is an urgent need for replenishing the ground water aquifer with each and every drop of rain water to ward-off impending severe water scarcity and for sustainable development. Rain water harvesting and run off management structures such as check dams, percolation ponds, farm ponds, Water Absorption Trenches (WATs), recharge shafts

30 | P a g e
etc. are required to be constructed in order to improve the moisture regime of the watershed for increased land use). Table 6: Land Degradation Scenario of Rajasthan and Tamil Nadu
Land Degradation Scenario Tamil Nadu Water Erosion 4926 Wind Erosion 0 Water Logging 96 Salinity / Alkalinity 96 Soil Acidity 78 Complex Problem 138 Degraded Area 5334 Geographical Area 13006 Degraded Area (Percentage) 41.0
Source: Department of Agriculture and Cooperation, Ministry of Agriculture, Government of India Note: There are several estimates for the extent of degraded lands reported by various agencies in the country. These estimates vary largely due to variation in approaches and methodologies of estimation. In absence of comprehensive and periodic scientific surveys, the figures reported by National Bureau of Soil Survey & Land Use Planning, Nagpur based on studies and several estimates (2005) for various land degradation have been considered as logically concluded and are being used for various purposes.
Tamil Nadu, the Southern state of India, is located between 8.05’ and 13.34’ North latitudes and 76.14’ and 80.21 East longitudes. It covers an area of about 13 Mha and accounts for about 4 per cent of the total geographical area of the country. The State forms part of the peninsular shield and composed of geologically ancient rock of diverse origins, i.e., of different soils. About three – fourth of the area of the state is unclassified crystalline rocks of Archaeon age and the rest is sedimentary rocks. The State can broadly be divided into three major physiographic divisions and 10 land forms. The climate is Semi-arid in the plains and humid to Sub-humid in the hills with annual rainfall from 750 mm in some parts of the plains to over 2400 mm in the high hills. In all 94 soil families, classified into six orders. Soil depth is not a limiting factor for crop growth in Tamil Nadu (14% shallow and very shallow soils). The texture of soils of Tamil Nadu covers a wide range
from sand to clay (18% sandy surface 53% loamy and 22% clay). The soil drainage is not a major problem for crop production in the state (14% poorly to imperfectly drained soils, 64% moderately drained to well-drained soil and 15% of TGA excessively drained soils). The soil calcareousness affects 34 per cent of the area in the Tamil Nadu State. Regarding Land Capability classification in Tamil Nadu, 79 per cent of the area is suitable for cultivation and 21 per cent of the area is not suitable for cultivations. Of the lands suited for cultivation, good land (class II) covers about 34 per cent, moderately good land (class III) covers about 30 per cent and fairly good land (class IV) covers about 15 per cent of the area of the state.

31 | P a g e
Table 7: Type of Soil and Districts falling under Different Agro-Climatic Zones of Tamil Nadu
Agro-climatic Zone Districts Soil Types North Eastern Zone Kancheepuram, Tiruvallur, Cuddalore, Vellore
and Tiruvannamalai Red sandy loam, clay loam, saline coastal-alluvium
Northern Western Zone
Dharmapuri, Salem and Namakkal Non-Calcareousred, non-calcareous brown,calcareous black
Western Zone Erode, Coimbatore, Tiruppur, Karur, Namakkal, Dindigul and Theni
Red loam, black
Cauvery Delta Zone Trichy, Perambalur, Pudukkottai, Thanjavur, Nagapattinam, Tiruvarur and Part of Cuddalore
Red loam, alluvium
South Zone Madurai, Sivaganga, Ramanathapuram, Virudhunagar, Tirunelveli and Thoothukudi
Coastal alluvium, black, red sandy soil, deep red soil.
Hugh Rainfall Zone Kanyakumari Saline coastal alluvium, deep red loam
Hill Zone The Nilgiris and Kodaikanal (Dindigul) Lateritic Source: State Agriculture Profile, Tamil Nadu
Physiography: Physio-graphically, the state can be dived into four major regions namely, Coastal Plains, Eastern Ghats, Central Plateau and Western Ghats. The south-west monsoon feeds the Plateau and the retreating north-east monsoon brings rain to the east coast. The temperature in state ranges from 2◦C in the hills to 45◦C in other areas. The average rainfall ranges from 925mm to 1,170 mm. Geo-morphologically, three major units are recognised from west to east in Tamil Nadu. The western part comprises the Western Ghats roughly trending North-South and marked by a continuous range of Hills, extending from Nagercoil in the south up to Nilgiri-Bilgirirangan Hills in the north and further northwards through Karnataka. The elevation of these Hills ranges between 1275 m and 2637 m. The prominent Hills are Mahendragiri, Agasthiarmalai, Anaimalai, Palani and Nilgiris. Doddabetta with an elevation of 2637 m is the highest peak in the Nilgiri Hills. The east-west trending Palghat Gap is a prominent physiographic break in the Western Ghats. The central part of the state is a vast track of dissected pediments and pediplains. Residual Hills in this part viz., Shevaroy, Kalrayan, Chitteri, Kollimalai, Pachchaimalai and Javadi demarcate the extensions of Eastern Ghats, while Karandamalai, Sirumalai and Kodaikanal Hills form another set of residual Hills, further south. The eastern part of Tamil Nadu and Pondicherry and Karaikkal are marked by a coastal plain with associated landforms like vast tidal flats, continuous beach ridges, estuaries and lagoons and a narrow but fairly continuous beach. Water Resources: Tamil Nadu accounts for 4 per cent of the land area and 6 per cent of the population, but only 3 per cent of the water resources of the country. Most part of the State is located in the rain shadow region of the Western Ghats and hence receives limited rainfall from the South-west monsoon. The total surface water potential of the state is 36 km or 24864 M cum. There are 17 major river basins in the State with 61 reservoirs and about 41,948 tanks. Of the annual water potential of 46540 million cubic metres (MCM), surface flows account for about half of it. Most of the surface water has already been tapped, primarily for irrigation which is the largest user. About 24 lakh hectares are irrigated by surface water through major, medium and minor schemes. The utilisation of surface water for irrigation is about 90 per cent.
32 | P a g e
The utilisable groundwater is around 22,423 MCM and current level of utilisation expressed as net ground water draft of 13.558 MCM is about 60 per cent of the available recharge, while 8875 MCM (40 per cent) is the balance available for use. Over the last five years, the percentage of safe blocks has declined from 35.6 per cent to 25.2 per cent while the semi-critical blocks have gone up by a similar percentage. Over-exploitation has already occurred in more than a third of the blocks (35.8 per cent) while eight blocks (2 per cent) have turned saline. The water level data reveals that the depth of the wells range from an average of 0.93 metres in Pudukkottai district to 43.43 metres in Erode. According to the Central Groundwater Board, there has been a general decline in groundwater level in 2003 due to the complete desaturation of shallow aquifers. Forests: The Forest cover in the state is about 23,625 km2 which is 18.16% of the state’s geographical area2. In terms of forest canopy density classes, the state has 2,948 km2 area under very dense forest, 10,321 km2 area under open forest. The protected areas extend to 3305 KM² constituting 2.54% of the geographic area and 15% of the recorded forest area. Tamil Nadu ranks 14th among all the States and Union Territories of India in terms of protected area. There are 8 wildlife sanctuaries over 2, 82,685.57 ha and 12 bird sanctuaries over 17,074.59 ha., 5 National Parks over 30784.23 ha., 3 Tiger Reserves, 4 Elephant Reserves and 3 Biosphere Reserves for in situ conservation of wild fauna and flora. The recorded forest area is 22, 877 km2 which constitutes 17.59% of the geographical area of the state. Reserved Forests comprise 84.75%, Protected Forests 9.54% and Unclassed Forests constitute 5.71%. Forest type mapping using satellite data has been undertaken by Forest Survey of India with reference to Champion & Seth Classification. As per this assessment, the state has 38 forest types which belong to nine forest type groups, viz., Tropical Wet Evergreen, Tropical Semi Evergreen, Tropical Moist Deciduous, Littoral & Swamp, Tropical Dry Deciduous, Tropical Thorn, Tropical Dry Evergreen, Sub Tropical Broadleaved Hill and Montane Wet Temperate Forests. The tree cover of the state has been estimated using trees outside forests (ToF) inventory data collected over a period of six years, i.e., 2004-10. The estimated tree cover in the state is 4,718 km2 which is 3.63% of its geographical area. Agriculture: The State has been classified into seven distinct agro-climatic zones based on rainfall distribution, irrigation pattern, soil characteristics, cropping pattern and other physical, ecological and social characteristics including administrative divisions.Agriculture still continues to be a dominant sector and provides livelihood to nearly 45 percent of the people. But its share has eroded to 8.0 percent of GSDP in 2011-12 from 13.0 percent in 2002-03. Global development experience reveals that one percent growth in agriculture is at least two or three times more effective in reducing poverty than the type of same growth emanating from non-agricultural sector. During the period 2000-11, this sector registered negative growth in five years and positive growth in six years shows the vulnerability of the sector and is also a cause of distress arising due to the instability in production and productivity. A comprehensive package combining several components to revitalize the sector should be designed to enhance the productivity working within the water constraints and stabilizing or enabling inter and intra seasonal risk proofing of rain fed production systems. Diversification of Agriculture into Animal husbandry, Non-food crops, Horticulture, Floriculture and Sericulture has the potential to enhance the farm incomes. The food consumption basket is getting increasingly diversified and though cereal baskets dominate, this dominance is being 2Based on interpretation of satellite data of October 2008-May 2009

33 | P a g e
eroded by rising expenditure on fruits, vegetables, milk, egg, meat and fish, which is the “High Value” segment, and this transformation, is in tune with development expectations. There are 13 coastal districts and 591 fishing villages with a total marine fisher population of about 8.92 lakh, of which 2.60 lakh fishermen are actively engaged in fishing. Hence, it becomes imperative to enhance the incomes of the fisher folk by augmenting marine and inland fish production through innovative technologies. The output from the agriculture sector should be reflected in higher rural incomes leading to improved health and nutrition status. Non-farm income such as post-harvest operations, maintenance of farm equipment, etc. offer a virtuous cycle connecting expansion of farm activity to that of rural nonfarm income opportunities. Table 8: Agriculture Profile of Tamil Nadu
S. No. Particulars 2011-12 1 Cropping Intensity 1.18 2 Percentage of Cultivated area to Total area 45.19 3 Net area sown per capita (ha) (2011 Census) 0.07 4 Percentage of area sown more than once to net area sown 18.13 5 Percentage of net area irrigated to net area sown 59.45 6 Percentage of gross area irrigated to gross area sown 59.75 7 Yield-rate per hectare (in Kgs.) Rice 3918 Cholam 1277 Cumbu 2452 Ragi 2716 Maize 6042 Cotton (Bales of 170 Kg Lint in terms of Lint) 481 Sugarcane (Cane in Tonnes/Hect.) 113 Groundnut (in Nuts per Ha.) 2751 8 Tractors (2007 Livestock Census) per thousand hectare of net area sown 2010-11 (P) 16
LIVESTOCK AND ANIMAL HUSBANDRY (2007 Livestock Census)
1 Livestock served per veterinary institution in numbers 9160 2 Number of villages served per veterinary institution 5
Source: State Statistical Hand Book, 2013, Government of Tamil Nadu Economy: It is one of the economically progressive States in the country. During the 10th plan period, the State achieved a growth rate of 9.7 percent. The per capita income at current price estimated to be Rs. 84,496/- and Rs. 54550/- at constant price (NSDP 2011-12, base year 2004-05). The Net State Domestic Product (NSDP) at current price estimated to be Rs. 5, 72, 01, 979 Lakh and Rs. 3, 69, 29, 105 lakh in constant price (2011-12, base year 2004-05). Natural Disaster Profile: The State with an area of 130, 0582 km, has a coastline of about 1,076 km which is about 15% of the coastline of the country. More than 40% of the fisher population live within 1 km of coast and 50% of them live within 2km of the coast. The geographical setting of the State makes it vulnerable to natural disasters such as cyclones, floods and earthquake-induced tsunami. About 8% of the state is affected by five to six cyclones every year, of which two to three are severe. Cyclonic activities on the east coast are more severe than on the west coast, and occur mainly between April-May and October-November. The State is also subjected to annual flooding, including flash floods, cloudburst floods, monsoon floods of single and multiple events, cyclonic floods, and those due to dam bursts or failure. The State is also prone to very

34 | P a g e
severe damaging earthquakes, and remain more vulnerable to earthquake-induced tsunamis, since 2004 Indian Ocean tsunami, which affected the coast of Tamil Nadu, destroyed much of the marine biology and severely damaging the ecosystem. Poverty Status: The State is having 44.07 Lakh persons (17.1%) below the poverty line3. The State has been successful in reducing poverty from 28.9 percent (2004-05) to 17.1 percent (2009-10) within a period of 3-4 years. Health Status: The State is having a birth rate of 15.9 (rural-16.0 and urban-15.7, year 2011) per 1000 population which has reduced from the birth rate of 16.5 during 2005. The death rate remains at 7.4 per thousand, which is more or less constant from 2005 to 2011. However, death rate in rural is relatively higher (8.1 per thousand, year 2011) than that of urban (6.4 per thousand, year 2011). Infant Mortality Rate (IMR) remain at 22 per thousand live birth (year 2011) and it has reduced from 2005 figure of 37. Expectation of life at birth, which was 26.21 for male and 27.13 for female during 1891 to 1901, has reached to 67.10 and 70.90, by 2006-10 for male and female respectively. The state is having 30 District Hospitals, 231 Sub Divisional Hospitals, 385 Mobile Medical Units, 1,204 Primary Health Centres,8,706 Sub-Centres and 385 Community Health Centres (as of March 2011). Education Status: The State is having literacy rate of 80.3 percent (provisional census 2011). Themale literacy rate is about 86.8 percent and the female literacy rate is 73.9 percent. The state is having 34,871 primary schools,9,969 middle schools and 10,827 high & higher secondary schools (as of 2011-12). In 2011-12, students’ strength inthe state was about 3.17 million in primary schools, 2.15 million in middle schools and 6.14 million inhigh and higher secondary schools. 1.3.2 Project State of Rajasthan: Wastelands cover almost 30 per cent of the total geographical area of the State, with pasture lands as the major land use. As a result, the extent of net area cultivated is about 44 per cent of the total area of the state, which is slightly lower than the national average of 45 per cent. The water scarcity and fluctuations in rainfall across agro-climatic regions are the major constraints for further expansion of area under cultivation. It also points to the necessity of switching from a water-intensive to a less water-consuming cropping pattern. This is important in determining household income and thus access to food. Rajasthan is below the all-India average in agricultural productivity.
3Poverty Estimation of 2009-10

35 | P a g e
Erratic and low rainfall with varying intensity and uneven distribution of heavy intensity rainfall in short spell characterizes this area. In addition, the steep slopes with sandy soils make livelihoods of small and marginal farmers from natural resources a very challenging task. A major portion of rainfall goes off as runoff, which also takes the top layer of soil away from the fields. The water tables in general are very deep and are declining further on account of overdraft. Combination of all these factors makes agriculture a very difficult proposition in the region. Hence, the central focus of this project is on works related to water and soil conservation and watershed development.
Table 9: Land Degradation Scenario of Rajasthan and Tamil Nadu
Land Degradation Scenario Rajasthan Water Erosion 3137 Wind Erosion 6650 Water Logging 53 Salinity / Alkalinity 1418 Soil Acidity - Complex Problem 110 Degraded Area 11368 Geographical Area 34224 Degraded Area (Percentage) 33.2
Source: Department of Agriculture and Cooperation, Ministry of Agriculture, Government of India Note: There are several estimates for the extent of degraded lands reported by various agencies in the country. These estimates vary largely due to variation in approaches and methodologies of estimation. In absence of comprehensive and periodic scientific surveys, the figures reported by National Bureau of Soil Survey & Land Use Planning, Nagpur based on studies and several estimates (2005) for various land degradation have been considered as logically concluded and are being used for various purposes. According to Economic and Human Development Indicators of UNDP, 2011, Rajasthan contributes about 5.67 percent of the total population of the country with a sex ratio of 926 which is below the national average. Under six sex ratio is 883 against the national average of 914. Contribution of Agriculture sector to NSDP has been 19.60 percent (India: 14.62 percent), whereas service sector contribution is about 63.71 percent. The Human Development Index value of the State is 0.434 with a rank of 17 (2007-08). The State is having a literacy rate of 67.06 percent (India: 74.04 percent) with a female literacy rate of 52.66 percent (India: 65.46 percent). About 24.8 percent, i.e., 16.7 million people are below the poverty line (2009-10). The multi-dimensional Poverty Index (MPI) value of the State estimated to be 0.338 with 62.8 percent multidimensional poverty headcount, i.e., 42.5 million multi-dimensional poor in the State (estimation in 2005). Prevalence of calorie malnourishment is 14 percent and about 40.4 percent under five children are underweight (2005-06).

36 | P a g e
Economy: The Rajasthan economy has shown a healthy growth path during the recent years. GSDP (at current prices) has almost doubled from Rs1, 17,274crore in FY05 to Rs3, 03,358 crore in FY11. This has made Rajasthan one of India’s faster growing states with the average growth rate of around 7.43% (real GSDP) during FY05-FY11. The services sector contributes around 47% in GSDP followed by the industry and agriculture sectors at 27% and 26% respectively. Over the last ten year period (FY01-10) the share to the GSDP has changed from 27% to 26%, from 28% to 27% and 45% to 47% in the agriculture, industry and services sectors respectively. Rajasthan stands at 10th in agriculture, 11th in infrastructure, 12th in consumer markets, 14th in macro economy, 15th in investment environment, and 17th in primary education. Rajasthan stands at lower side of the capita income level. Per-capita income in the state is Rs39967 (FY2011) which is much below the national average of Rs54527 (FY2011). Agriculture: Agriculture and allied sector plays an important role in State’s economy. It contributes around 26% in GSDP. Around two third of Rajasthan’s population is still dependent on agricultural activities for their livelihood. Agriculture in Rajasthan is largely dependent on rains, only 35% of the total agricultural area is irrigated. Out of the total area irrigated 65 to 70% area is under wells and tube well irrigation. Table 10: Agriculture Statistics of Rajasthan
Agriculture Indicators Value Population dependent on agriculture Two Thirds Agriculture GDP at current prices Rs79994.97 Crore Growth of Agriculture GDP ( Avg. from FY2001 to FY 2011) 8.30% Agricultural sectors contribution in GSDP 26% Food Grain production (Thousand Tonnes) 11283.4 State’s contribution to national food grain production 5.17% State’s rank in food grains production 7th Yield Kg/Hectare (of total food grains) 890 Total agricultural area irrigated 35% Area under wells and tube well irrigation 60-70% Rice Production (Thousand Tonnes) 228.3 Wheat Production (Thousand Tonnes) 6326.5 Coarse Cereals Production (Thousand Tonnes) 3828.1 Pulses production (Thousand Tonnes) 900.5 Oil Seeds production (Thousand Tonnes) 4469.2 Cotton production (Lint) 284.4 Sugarcane production 135.4
Source: PHD RESEARCH BUREAU, Compiled from RBI and Economic Review of Rajasthan 2009-10 Note: The data above pertains to 2009-10 Rajasthan is the leading producer of coarse cereals, pulses, gram, oilseeds and seed spices. It ranks first in the livestock population in the country and third in terms of per hectare yield of Mustard.

37 | P a g e
Table 11: Food Grain Production Scenario of Rajasthan
Year Rajasthan Rajasthan’s Share in India 2001 10.04 5.10 2002 14.00 6.58 2003 7.54 4.31 2004 17.99 8.44 2005 12.15 6.13 2006 11.45 5.49 2007 14.21 6.54 2008 16.06 6.96 2009 16.68 7.11 2010 11.28 5.17
Source: PHD Research Bureau, Compiled from RBI, Ministry of Agriculture Rajasthan’s production of food grains has increased from 10.04mn tones in FY2001 to 16.68mn tonnes in FY2009 however; production has declined to 11.28mn tonnes in 2010. The share of Rajasthan’s food grain production in India’s total food grain production has shown a downward trend in the recent years. Poverty: Rajasthan has been able to reduce its poverty by substantial amount over a period of time. Its overall poverty is less than the national average i.e. 22.1% as against 27.5% respectively. Its poverty in rural sector i.e. 18.7% is far more less than the national average of 28.3%. But the situation is opposite when it comes to urban poverty, Rajasthan has 32.9% as against the national average of 25.7%. Several projects have been initiated to eradicate poverty in the state. Education: Rajasthan’s literacy rate according to 2011 census was 67.06%, male and female literacy rates being 80.51% and 52.66% respectively. Although the female literacy rate has improved over the last decade, it lags behind the national average of 65.46%, whereas the male literacy is close to the national average of 82.14%. Health: The Health infrastructure in the state comprises of 127 hospitals, 199 dispensaries, 1504 Rural PHCs, 37 Urban PHCs, 368 CHCs, 118 Maternity and Child Health Centres, 13 Urban Aid Posts, 11487 Sub Health Centres and 43864 inpatient beds as on December 31st 2009. There is a provision of Rs 663.53 Crores for medical and health sector including Ayurveda in the Rajasthan budget FY12. Table 12: Health Indicators of Rajasthan
Indicators Value Life Expectancy at Birth (2002-06) 62 years Infant Mortality Rate (2008) 63 per 1000 live births Maternal Mortality Rate (2008) 388 per 1,00,000 live births Total Fertility Rate (2008) 3.3 children born per woman Per Capita Health Expenditure NHA-04-05 Rs. 761
Source: PHD Research Bureau, PHD Chamber of Commerce and Industry, April 2011.

38 | P a g e
There is low per capita health expenditure in Rajasthan and a high IMR (Infant Mortality Rate). This is not a very good sign; its per capita expenditure is greater than that of Bihar and Jharkhand only. It has the third highest IMR in the group. Its performance is not that impressive. In terms of life expectancy at birth of major states in India, Rajasthan is amongst the bottom states. Although there have been various efforts towards improving health standards yet this low longevity levels indicate much more effort needs to be put in. In terms of availability of safe drinking water in urban Rajasthan it stands good with 93.5% of its urban population having an access to safe drinking water unlike the rural Rajasthan where only 60% of its population has an access to safe drinking water. On an aggregate, 68.2% of its people have an access to safe drinking water.

39 | P a g e
1.4 Project / Programme Objectives: List the main objectives of the project/programme The overall objective of this program is “to improve climate resilience and build adaptive capacities of the communities to climate change in the rain-fed areas of Tamil Nadu and Rajasthan”. The program will deliver this objective and will have these four outcomes Objective 1: Improving adaptation to climate variability / change in farm sector with better management
and maintenance of soil and water regime enabling better crop / pasture land productivity and resultant increase in income of small and marginal farmers.
Objective 2: Promoting climate resilient farming system and diversification of livelihoods engaging
community and their associations in the concrete adaptation pathway. Objective 3: Reducing climate change vulnerability and process of marginalization with integration of
risk mitigation products, like crop, weather and market advisory; and information system. Objective 4: Creation of knowledge management system on climate change adaptation and sharing the
learning to wider audience for replication and technology cascading.
1.5 Project / Programme Components and Financing: Fill in the table presenting the relationships among project components, activities, expected concrete outputs, and the corresponding budgets. If necessary, please refer to the attached instructions for a detailed description of each term. For the case of a programme, individual components are likely to refer to specific sub-sets of stakeholders, regions and/or sectors that can be addressed through a set of well-defined interventions / projects. Table 13: Project / Programme Components
Project / Programme Component
Expected Concrete Outputs Expected Outcomes
Amount (US$)
Component 1: Improved soil and water regime for better crop productivity
Output 1.1: Soil health improved through summer / deep ploughing
Outcome 1: Soil and water regime improved and crop productivity enhanced
170,585
Output 1.2: Increased water availability through farm pond, catch pit, well recharge pit and other water harvesting structures
Component 2: Increased adaptation to climate change through
Output 2.1: Increased availability of fodder/fuel through afforestation & pasture land development
Outcome 2: Improved climate resilient farming
655,670

40 | P a g e
climate resilient farming system approach and diversification of livelihoods
Output 2.2: Improved resilience through adoption of climate resilient farming/livelihood systems
system and increased livelihood security
Output 2.3: Better energy management through adoption of energy efficient systems
Component 3: Integration of risk mitigation products like crop, weather and market advisory for the farmers
Output 3.1: Installation of Automatic Weather Stations and generation of agro-advisories
Outcome 3: Reduced climate change vulnerability with improved risk mitigation measures
195,917
Output 3.2: Geo-hydrological study and crop-water budgeting
Component 4: Creation of knowledge management system for climate proofing of watershed project and livelihoods
Output 4.1: Government takes up certain prescriptions and project learning for large scale implementation.
Outcome 4: Project learning and created knowledge base benefitted similar projects implemented in other States.
109,283
Output 4.2: Cross learning and replication of practices and lesson learnt with improved knowledge and understanding by stakeholders
5. Project / Programme Execution Cost 107,400 6. Total Project / Programme Cost 1238,855 7. Project/Programme Cycle Management Fee Charged by Implementing Entity 105,300 Amount of Financing Requested 1,344,155 Amount in US $ Million 1.344
1.6 Projected Calendar: Indicate the dates of the following milestones for the proposed project/programme Table 14: Projected Calendar
Milestones Expected Dates Start of Project/Programme Implementation June 2015 Project/Programme Closing June 2018 Terminal Evaluation January 2019
41 | P a g e
PART II: PROJECT / PROGRAMME JUSTIFICATION A. Describe the project / programme components, particularly focusing on the concrete adaptation
activities of the project, and how these activities contribute to climate resilience. For the case of a programme, show how the combination of individual projects will contribute to the overall increase in resilience. In India, watershed programmes in rainfed and drought prone areas have been emphasized and both the proposed project States for concrete adaptation, i.e., Tamil Nadu and Rajasthan have been implementing watersheds under differentschemes, including Integrated Watershed Management Programme (IWMP). However,the proposed adaptation project / programmewill add value to the current initiative without duplication of the current scheme based support system. Improved resilience to climate variability and adaptation to climate related unfavourable situation remain to be the core of the proposed intervention. Characteristically, these value added watersheds will be distinct and model of replication in three ways,i.e., Firstly, it takes into account resilience factors and lessons of climate variability and change pilotedin different locations, more specifically in a rainfed condition and corroborating with community perception and requirement;Secondly,bridging the identified gaps in order to arrest / minimize the impact of drought / dry spells and improve resilience; Thirdly, it models the future climate scenario to factor in sensitivity, exposure as well as mal-adaptation: to design climate proofing measures for the watershed. In this way it is going to enhance the adaptive capacity of the community in general and farmers in particular. The project looks at resilience of the watersheds much beyond the usual soil and water conservation focused drought proofing measures and is beyond the business-as-usual practice and can be considered as concrete adaptation. The justifications by each project / programme outcome are discussed below.
Activities like farm pond, recharge pits would depend on site conditions and could be classified as those under Area Approach; rest activities would be oriented to address vulnerable households, especially with small and marginal landholding and under SC/ST category. The family set up per se includes women members. Certain activities like biogas and improved cook stove would be highly beneficial for women. Activities have been proposed considering their technical feasibility in the project areas and could be finetuned, if need be, as per specific site conditions Outcome 1: Improved soil and water regime for better crop productivity and resultant increase in
income of farmers.
The discussed analysis clearly shows that there is likelihood of more water scarcity and incidence of drought in the coming decades apart from delay in onset of monsoon most of the time (current monsoon of 2014 is the bright example). This will significantly reduce crop production and productivity, affect household food security and increase poverty. The non-climatic stress will be over grazing, higher bore-well density and indiscriminate ground water extraction. There will be lowering of water table and reduction of vegetation cover during climate stressed scenario. The eco-system services will have
PROJECT/PROGRAMME PROPOSAL TO THE ADAPTATION FUND

42 | P a g e
severe constraints and low or no return on agricultural investment will prompt large scale migration and over exploitation of available resource base, leading to non-recoverable resource depletion stage. Current practice of over dependence on water intensive crops, methods of flood irrigation will enhance the vulnerability further. So, adaptation to such situation by the farming community, especially small and marginal farmers is essential. In order to improve the climate resilience and better adaptation to the situation, the projects looks at improving soil and water regime through various vegetative and mechanical measures. The suggested following measures, adhering to the technical specifications, will minimize water stress situation, enhance water availability in the watersheds and make it climate resilient and adaptive to the situation.
a. Farm pond:
High intensity rains falling in a shorter period would lead to higher runoff. Farm pond helps in arresting / storing the runoff water locally that can be utilized during critical water need of the crop or for livestock during dry periods. Farm ponds will be useful in maintaining soil-moisture regime. Size of the farm ponds are proposed of different sizes, e.g. 12 m x 12 m x 3m, 17.2 m x 17.2 m x 2.8 m depending on the Catchment area, type of crop and amount of rainfall. The farm ponds are made in such a location in the farm that runoff is well intercepted and there is adequate command area under the farm pond. Some of the farm ponds are lined with polythene sheet to minimize losses from percolation.
b. Catch Pit
During monsoons, runoff water is collected in the Catch Pits along with silt. This will enhance the moisture availability to the crops.The capacity of a Catch pit is determined depending upon the expected runoff or water yield from the catchment. Catch Pits of size 3 x 3 x 1.2 m are dug at many places in the corners of the fields / suitable place in slope areas. From economic point of view, a catch pit should be located where the adequate volume of water can be stored with least earth work and the sub-soil should allow minimum seepage as far as possible and should also have a favourable outlet for excess runoff disposal from the pits.
c. Well recharge pit
Dug well recharge pits support Ground water recharge through existing dug wells in favorable catchments like agricultural fields, facilitate improvement in groundwater situation in the affected areas, increase the sustainability of wells during lean period and also increases overall agricultural productivity and drinking water availability. Created at the lowest point of the farm and connected to the well through pipeline. This would help in collecting the runoff water from the entire farm and diverting into the existing well and would aid in increasing the water level and water yields in the well. Circular pit of 5 m dia can be made with a depth of 4 feet. Inside the pit circular rings made up of cement are placed. Inside the pit filtration materials are placed to filter the soil as well as impurities. The clean water is let into the existing wells through the connection pipes
e. Summer ploughing:
Scientific rationality of summer ploughing and the evidence of long-term impact on soil fertility and productivity : After the harvest of the crops raised during monsoon season, the bulk density of the soil increases due to soil compaction. This impedes the movement of air, water, and nutrients in the soil profile. Ploughing in advance, i.e., in the mid-summer

43 | P a g e
for kharif crops is known as summer ploughing. Summer ploughing helps to kill weeds, hibernating insects and disease-causing organisms by exposing them to the summer heat. Summer ploughing for groundnut found to be advantageous. From the climate analysis, it could be seen that the quantum of rainfall received during the SWM is slightly increasing over time. To capture the increased amount of rainfall effectively in the soil column, the hard topsoil should be opened up. Ploughing the soil in advance of the start of the monsoon season (summer ploughing) would help in opening the hard topsoil, which would lead to increased rate of infiltration besides reducing the soil borne pests, diseases and weeds and controlling soil erosion. The farmers in the watersheds will be oriented on beneficial dimensions of summer ploughing and its benefit will be optimized with their involvement. Advantages of summer ploughing in improving the productivity of land water and crops was also reported by Khan et al. (2002)
Khan etal (2004) has reported reduction in weed incidence, pest and disease attack, in the summer ploughed field. The weed load in terms of weed number/m2 and weed weight was lower by 64.243% and 62.543% respectively in summer ploughed field compared to conventional field. It was also reported that soil Nematodes growth was adversely affected due to summer ploughing and there was a reduction of 61.3 – 64 per cent of plant parasitic nematodes. Additional income achieved due to higher yield of monsoon season crops. Barriers that farmers currently face in adopting summer ploughing: In both Tamil Nadu and Rajasthan states, due to extremely dry condition in the summer season, the soils become too hard to operate. Hence there is need for heavy machines such as high power tractor with strong disc plough to work on the soil, which are not readily available in the villages when it is needed. As the farmers are resource poor, they also do not have adequate resources to take up this operation
f. Deep Tillage:
Performing tillage operations in the summers below the normal tillage depth (>25 cms) to modify adverse physical and chemical properties of the soil is termed as deep tillage. In most of the dry land regions, there exists a hard pan below 15 or 20 cm of soil depth, which limits the infiltration of rainwater as well as the moisture holding capacity to support for crop production. One of the reasons for low yields in the dry lands is the limited amount of moisture available at crop root zone. From the examination of Length of Growing Period (LGP) and the dry spells within the LGP, it could be understood that, whether it is early / normal / late onset of growing season, the cessation happens towards the end of December and the number of dry spell week’s ranges from 3.25 to 3.85. Under such situation, the LGP can be increased by one week to 10 days, if deep tillage is done as it helps in increasing the rooting depth of the plant. The available moisture to the plant will be increased if the rooting depth is increased and would help in supporting for the crop development for more number of days after the cessation of rainfall. In a situation of increasing intensity of rainfall during SW monsoon deep tillage will help in retention of higher moisture in the root zone for a longer period of time.

44 | P a g e
Deep tillage helps to disrupt dense subsoil layers and increase infiltration and root distribution for more soil water. A study reveals that the mean annual grain yield increases approximately by 10% in deep tilled plots compared with stubble mulch tillage because of increased infiltration and, possibly, rooting. Increased yields with deep tillage for two of 14 crops accounted for > 50% of the cumulative yield benefit, which was attributed to improved drainage of rain that flooded untilled plots. Deep plowing may be an economical soil profile modification treatment to use with conservation systems4.
g. Earthen Embankments with spillway:
These structures are constructed across natural drainage line to collect and impound surface runoff from the catchment during monsoon. These also facilitate percolation of stored water into the soil substrata for raising the groundwater level. Three units are proposed each with Full tank reservoir level of 1.5 m and average dead storage capacity of 2700 cu m.
h. Masonry Gabion:
The gabions are constructed with stones/ rubbles bound together with binding wire. An apron is made on the downstream side of the gabion to resist scouring. Concrete masonry work is done on apron and foundation for stability of the structure and maximum groundwater recharge. 20 m long structure is proposed with 1 m height and 1m keying on each side.
i. L.D.P.E. sheet lining for seepage control in existing structures:
4 R.L. Baumhardt and O.R. Jones, Long-term Benefits of Deep Tillage on Soil Physical Properties and Crop Yield.
An earthen embankment with spillway
Masonry gabion structure

45 | P a g e
LDPE lining is proposed on the upstream side of water impounding structures like earthen embankments to control seepage and percolation losses. The stored water could be utilised for critical irrigation to crops. Polyethene sheets of ~200 micron would be used as lining material for the purpose.
j. Masonry check dam/ Water Harvesting Structure:
The activity shall include (a) desilting of submergence area of anicuts (1500 cu m) for maximizing water storage capacity and (b) repair/ construction of low cost masonry check wall/ sub-surface dykes (7) - The sub-surface dykes have an advantage that they do not cause land submerge or obstruct flow/silt spread along the drainage line.
k. Recharge pit on upslope side of gully plugs/ Open Recharge Pit in drainage line:
The upslope side of silted up gully plugs and drainage lines of higher order offer good scope for undertaking recharge pits. The excavated earth is deposited beside the gully plug across the gully with side spillway or deposited on the bank sides. Open recharge pits are made with 4:1 (H:V) u/s slope and 2:1 d/s slope. Recharge pits of 6300 cu m length and 2880 cu m of open recharge pits have been planned in the project. These low cost measures would help in effective recharge of ground water
Specific Activities to implement the measures:
1. Site selection for construction of percolation pond and other recharge/ harvesting structures - completed;
2. Construction of farm pond/tank in feasible areas within the watershed; 3. Orientation of farmers on periodicity and timing of field operations like deep tillage, crop planning,
maintenance of structures, etc.
Activities proposed above will facilitate improvement in soil and water regime, better crop productivity and resultant increase in income of farmers, which is the main outcome envisaged. Activities which envisage harvesting of run-off water like farm pond, earthen embankment, masonry check dam etc., would be beneficial for providing life saving irrigation to crops during critical periods. Small structures like recharge pit, catch pit and well recharge pit would enable recharging of ground water by catching rain water. Summer/deep ploughing would maintain the soil moisture and prevent excess evaporation. Outcome 2: Increased adaptation to climate change through climate resilient farming system
approach and diversification of livelihoods The programme envisages improving in existing cropping system to reduced dependency on water intensive crops and introduction of hardy varieties apart from introducing farming techniques that are efficient in the water scarce situations.
a. Afforestation and Pasture land development: There is a tendency with the farmers to bring pasture land under tillage in Rajasthan. Preserving and promoting pasturelands and upgrading their productivity could be an important climate
LDPE lining in earthen embankment structure

46 | P a g e
proofing tool. Pasture models like community pastures and group pastures are being promoted in the watersheds. Three types of intervention approach are being followed presently in the projects, viz. (i) Silvopastoral model in which there would be 150~200 plants per hectare primarily to source tree-fodder for small ruminants apart from good quality grass; there is a total ban on grazing, (ii) pasture land under controlled grazing/deferred grazing (protection for around eight months in a year) and (iii) pasture under open grazing - plantation, especially of non-palatable species being taken up in natural notches and thorny bushes (thoor, ber, etc.); the area would be brought under controlled grazing/deferred grazing model in parts by the community in due course.
In this scenario, rigorous tree seeding at 2 m interval on contour is proposed in place of conventional silvopastoral model with 150~200 plants per hectare; tree rotation policy would be introduced in these patches in due course to meet the need for fodder, fuel wood and timber at local level. The seeds of local tree species will be sown to increase vegetation canopy and minimize erosion. The partly-filled CCTs (with silt, fallen tree leaves and other biomass/ humus) and around would be preferred for tree seeding/ planting. Site-specific pits of 1 cft are planned to ensure better survival and growth of seedlings. In one watershed, water absorption granules would be tried out for better survival under moisture stress. Refilling of alternate CCTs and tree seeding is proposed for higher slopes in 3 watersheds. Tree seeding is considered highly cost effective compared to planting. Palatable and less palatable species would be promoted in completely protected and open/ deferred grazing areas respectively.
Other activities in the proposal include the following: • Gradonies proposed in 4 watersheds- A gradonie is a bench terrace with inverse
slope of around 1.5 m width. Creeper vegetables (Pumpkin, Bitter/Ridge/Bottle gourd, etc.), Castor seeding, Cow pea, good-quality grasses, etc. would be grown on gradonies.
• 11500 (stone pitched) thanwla/ Crescent Bund for supporting existing tree vegetation/ rootstocks – the activity is all the more significant in areas where there is high risk of grazing and establishing vegetation through planting or seeding is a big challenge.
• Plantation of fuel/fodder trees in silvipasture sites, beside stone bunds and on upstream of gully plugs for gully stabilizationand to strengthen/ protect the structures from sudden flush/ storm water.
• Introduction of high palatable grasses like Dhaman,Karad, Deenanath through grass seeding in 162 ha area;
• Avenue Plantation: 1000 nos. of species like Ardoo, Neem, Sesam, Pongaemea, etc. planned along road side, school premises, etc.
• Pitcher irrigation (Gheda):Gheda is a locally fabricated earthen pot with good porosity. Gheda is installed as a single unit or in pair with an inclination towards the plant root. It is filled with water that either passesthrough a hole on the Gheda or seeps through and moistens the root zone.
• Fencing:To protect the pasture land from grazing round the year (complete protection) or during the 6~8 month period of grass-growth (deferred grazing), the locally available thorny xerophytes, viz. ThoorEuphorbia caducifolia) would be planted along the boundary as bio-fencing. Total unit is 11200 RMT proposed in 3 watersheds. Where Thoor is not available in plenty, but stones are locally available, stone fencing is proposed for protection of pasture. Total unit is 1840 RMT is proposed in the project.
• Creation of pasture groupas an institution mechanismfor conservation and sustainable use of pasture land resources, e.g. grass, timber, fuel, etc. The fodder

47 | P a g e
bank is planned to cover likely deficit in fodder availability during the drought period or summer season in the area.
b. Agro-forestry:
Agro-forestry is a collective name for land use systems and practices in which woody perennials are deliberately integrated with crops and/or animals on the same land management unit. The integration can be either in a spatial mixture or in a temporal sequence. Agro-forestry systems offer and facilitate the framer with the extra earning because it enhances the production ability of the land. Diversification of forest and cultivating crops also reduces resources and labor costs and also minimizes the risks involved in the cultivations of crops. Mix up of long lasting forest crops with annual agricultural income creates big profits on the annual basis too. Agro-forestry system increases the fertility of soil and also helps in preventing soil erosion. Special attention to be given in Rajasthan for forage crops and that grasses that bind the soil.Agroforestry systems are believed to provide a number of ecosystem services.Four major ecosystem services and environmental benefits of agroforestry are (1) carbon sequestration, (2) biodiversity conservation, (3) soil enrichment and (4) air and water quality maintenance/improvement5. Past and present evidence clearly indicates that agroforestry, as part of a multifunctional working landscape, can be a viable land-use option that, in addition to alleviating poverty, offers a number of ecosystem services and environmental benefits. This realization should help promote agroforestry and its role as an integral part of a multifunctional working landscape. State of the World’s Forest, 2005 highlights a number of experiences on economic benefit of agroforestry6.
The activity would include bund planting and tree seeding of species like bamboo, drumstick, neem, sesam, etc.
c. Fodder Development
Fodder is an important component in any dairy unit for the sustainability of the unit. During drought, animals are sold as the farmers are unable to maintain the same due to non availability of fodder. Hence the fodder development is very important. Napier grass, also called as elephant Grass
5J. Shibu, Agroforestry for ecosystem services and Environmental Benefits: an overview, Springer Science, 7 April 2009. 6Realising the economic benefit of agroforestry: experiences, lessons and challenges.
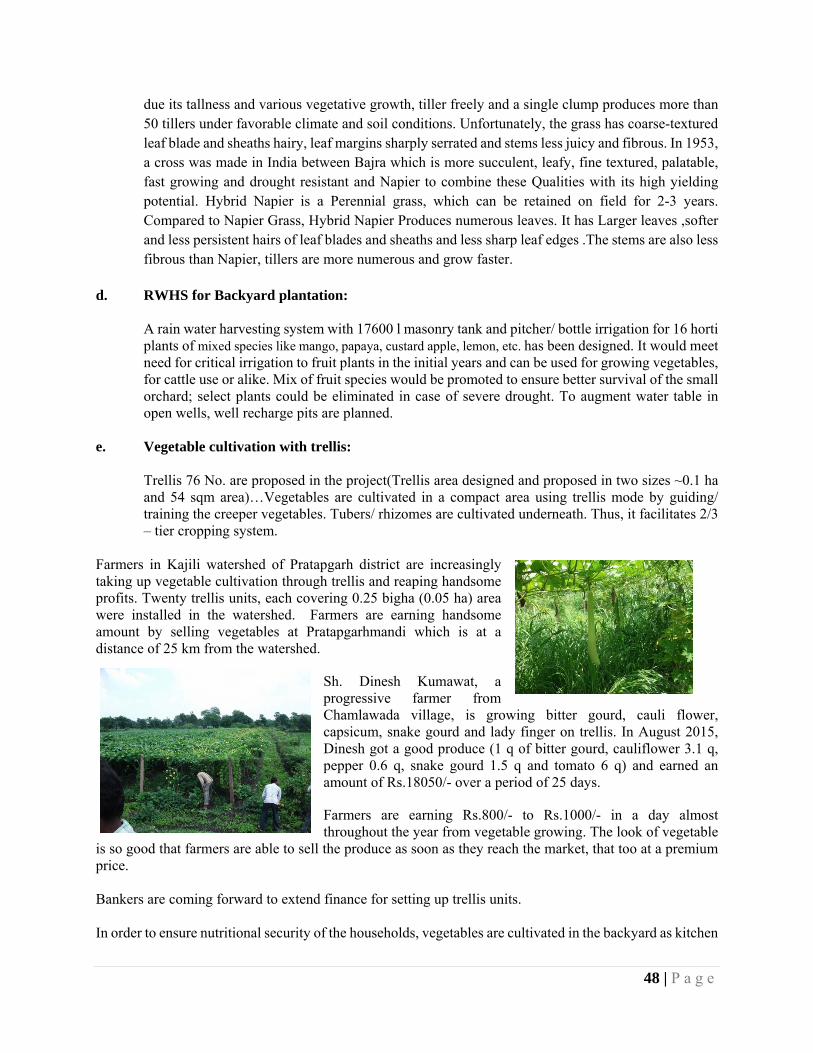
48 | P a g e
due its tallness and various vegetative growth, tiller freely and a single clump produces more than 50 tillers under favorable climate and soil conditions. Unfortunately, the grass has coarse-textured leaf blade and sheaths hairy, leaf margins sharply serrated and stems less juicy and fibrous. In 1953, a cross was made in India between Bajra which is more succulent, leafy, fine textured, palatable, fast growing and drought resistant and Napier to combine these Qualities with its high yielding potential. Hybrid Napier is a Perennial grass, which can be retained on field for 2-3 years. Compared to Napier Grass, Hybrid Napier Produces numerous leaves. It has Larger leaves ,softer and less persistent hairs of leaf blades and sheaths and less sharp leaf edges .The stems are also less fibrous than Napier, tillers are more numerous and grow faster.
d. RWHS for Backyard plantation:
A rain water harvesting system with 17600 l masonry tank and pitcher/ bottle irrigation for 16 horti plants of mixed species like mango, papaya, custard apple, lemon, etc. has been designed. It would meet need for critical irrigation to fruit plants in the initial years and can be used for growing vegetables, for cattle use or alike. Mix of fruit species would be promoted to ensure better survival of the small orchard; select plants could be eliminated in case of severe drought. To augment water table in open wells, well recharge pits are planned.
e. Vegetable cultivation with trellis:
Trellis 76 No. are proposed in the project(Trellis area designed and proposed in two sizes ~0.1 ha and 54 sqm area)…Vegetables are cultivated in a compact area using trellis mode by guiding/ training the creeper vegetables. Tubers/ rhizomes are cultivated underneath. Thus, it facilitates 2/3 – tier cropping system.
Farmers in Kajili watershed of Pratapgarh district are increasingly taking up vegetable cultivation through trellis and reaping handsome profits. Twenty trellis units, each covering 0.25 bigha (0.05 ha) area were installed in the watershed. Farmers are earning handsome amount by selling vegetables at Pratapgarhmandi which is at a distance of 25 km from the watershed.
Sh. Dinesh Kumawat, a progressive farmer from Chamlawada village, is growing bitter gourd, cauli flower, capsicum, snake gourd and lady finger on trellis. In August 2015, Dinesh got a good produce (1 q of bitter gourd, cauliflower 3.1 q, pepper 0.6 q, snake gourd 1.5 q and tomato 6 q) and earned an amount of Rs.18050/- over a period of 25 days.
Farmers are earning Rs.800/- to Rs.1000/- in a day almost throughout the year from vegetable growing. The look of vegetable
is so good that farmers are able to sell the produce as soon as they reach the market, that too at a premium price. Bankers are coming forward to extend finance for setting up trellis units. In order to ensure nutritional security of the households, vegetables are cultivated in the backyard as kitchen

49 | P a g e
garden. Five to six selected vegetables, as per farmer’s preference are grown in the kitchen garden. f. Seed Bank : Maize, Wheat and Soybean are the major crops in the project areas of Rajasthan. Seed Replacement Rate (SRR) in the project areas is lesser than the State average (25, 36 and 12 for the said crops). Seed Bank is planned to increase the SRR and also to act as a source for planting in case seed reserves elsewhere are destroyed. The seed bank will be managed by the community. It would store quality seeds including local species like a gene bank. This would help in conserving the biodiversity in the project area and around.
Other climate resilient farming systems would include:
Promoting varieties of maize and wheat of short duration and low water requirement, promotion of improved Farm Implements and equipment (BBF implement, Zero Tiller, Weeder, Fertigation, Reaper, Thresher, etc.) through custom-hiring so as to reduce exposure/ vulnerability to bad weather and to reduce drudgery;
Use of high yielding and drought tolerant varieties: High yielding varieties with drought resistant and temperature tolerant character are highly suitable for the selected watershed as it experiences frequent droughts.
Need based fertilizer application: Soil test based and crop requirement based fertilizer
application would improve the crops yield besides maintaining the soil health. Growing alternate crops / fodder sorghum during SWM: Using the quantum of rainfall
received during the SWM, minor millet crops like barn yard Millet can be grown which are drought hardy and needs less water. Instead of keeping the land fallow, a fodder sorghum crop can be grown to create fodder reserve for the animals.
Inter-cropping / Mixed Cropping / Rotational Cropping: Intercropping is the practice
of growing two or more crops in proximity. The most common goal of intercropping is to produce a greater yield on a given piece of land by making use of resources that would otherwise not be utilized by a single crop. Planning will be done carefully taking into account the local soil, climate, crops, and varieties.
promoting package of practices incl. seed treatment, INM, IPM, organic farming, etc.

50 | P a g e
g. Promotion of Alternate Fodder:
The land area available per household / per capita for cultivation is expected to decline in the future years due to change in socio economic characteristic and induced impact due to climate variability. Under such context, allocating sizable area of land for fodder production would lead to addition stress on cultivation of food crops. Hence, alternate (conventional and non-conventional) fodder crops will be promoted to meet the challenges in fodder requirement of the future. Azolla will be promoted as alternate fodder which doubles its biomass in 10 days with very less water requirement. Its consumptionwill also increase omega fatty acid content in the animal products.
Azzola as an Alternate Fodder
h. Integrated Farming System:
Under changing climatic condition frequent crop failures can happen due to increased frequency of extreme weather events. Growing crops and animal (goat/sheep/dairy/poultry) together will help in increasing the adaptive capacity of the community by raising the productivity, profitability and sustainability of the farm. Integrated farming system will help in efficient recycling of by-products from one component to another which will lead to environmental safety. Apart from that, it will support in income and employment generation throughout the year.
i. Soil Nutrient Management:
Variability in rainfall and intense rain in short duration leaves the top soil eroded. As a result, soil organic matter content goes down and imbalance in soil nutrient affects crop production and productivity. The project will minimize this risk and adapt to the situation by managing organic matter content in the soil through application of vermin-compost and/or bio-fertilizers at a frequent interval. Vermin-compost contains adequate quantities of N, P, K and several micronutrients essential for plant growth (Banaet al., 1993) which will maintain the soil health.
Vermicompost pit unit Vermicompost Sesbania (Green Manure) Vermicompost is a preferred nutrient source for organic farming. It is eco-friendly, non-toxic, consumes low energy input for composting and is a recycled biological product (Edwards, 1998).

51 | P a g e
In case of requirement, bio-fertilizers such as Azospirillum / Phospobacterumwill also be applied to the soil to increase the availability of nutrients to the plants. Alternatively, green manure crops such as Sesbaniawill be grown during the SWM period with minimum rainfall and incorporated into the soil at the age of 40 days when the crop is in peak flowering stage. This will increase the water holding capacity of the soil by increasing organic matter content.
j. Micro Irrigation (Drip irrigation / Micro sprinklers):
Micro-irrigation refers to low-pressure irrigation systems that spray, mist, sprinkle or drip. Drip irrigation is the targeted application of water directly to the root zone, fertilizer, and chemicals that when used properly can provide great benefits such as: increased revenue from increased yields (up to 80%), increased revenue from increased quality, decreased water costs, decreased labor costs, decreased energy costs, decreased fertilizer costs, decreased pesticide costs and improved environmental quality. Micro irrigation reduces water use by 40 – 60 % and enhances efficient use of available water minimizing losses. In a water scarce situation, which is more frequent in rainfed condition, water efficient management of available water is highly essential and adoption of micro irrigation will be helpful contextually. It will reduce wastage of water, keep standing crop survive and increase production in an environmental friendly manner.
Drip Irrigation Sprinkler Irrigation
k. Fertigation:
Increase in temperature would result in increasing the soil temperature and soil microbial activity, which would lead to quick decomposition and release of greenhouse gases such as Carbon dioxide, Nitrous oxide, and Methane besides reducing the nutrient use efficiency. Application of liquid fertilizer through drip irrigation, popularly known as fertigation will be helpful to supply required nutrient to the plant. This method will improve nutrient use efficiency, minimise waste of fertiliser and hence reduced cost of production and increase yield of crops.
l. Tank silt /Farm yard manure application
Application of tank silt will help for in situ moisture conservation by improving the soil structure, texture and infiltration rate. It will also improve the available soil nutrient status that would lead to increased crop yields.
m. Vegetable Cultivation in poly houses
Poly house Technology is the technique to protect the plants from the adverse climatic conditions such as wind, cold, precipitation, excessive radiation, extreme temperature, insects and diseases. It is also of vital importance to creating a Green houses, where the environmental conditions are so modified that one can grow any plant in any place at any time by providing sustainable

52 | P a g e
environmental conditions with minimum labour. Green houses are framed or inflated structures covered with transparent or translucent material large enough to grow crops under partial or fully controlled environmental conditions to get optimum growth and productivity This technology is useful in improving the productivity of crops qualitatively and quantitatively by 3-5 times as compared to open environment. These polyhouses help to facilitate round the year production of desired crops and permits off-season production by way of controlling light, temperature, humidity, carbon dioxide level and nature of root medium.
n. Backyard poultry
Backyard poultry production is an age old practice in rural India. Most of the backyard poultry production comprises rearing of indigenous birds with poor production performances. The potentiality of indigenous birds in terms of egg production is only 70 to 80 eggs/ bird/ year and meat production is also very less. However, the backyard poultry production can be easily boosted up with improved varieties of chicken and can promise better production of meat and egg.To improve the socio-economic status of the traditional farmers and resilience to climate change, backyard poultry is a handy enterprise with low-cost initial investment, but high economic return along with guarantee for improving protein deficiency among the poor.In this system of rearing, the birds are kept inside sheds for the first four months and later are allowed to forage in the morning till they attain good weight after which they are sold.
o. Compost Pit
Through composting complex materials are converted into simple inorganic element as available nutrient. This conversion process takes away all energy and available nutrients from the soil affecting the crop. Composting is beneficial to farmers for several reasons. It allows for the recycling of kitchen scraps and the creation of a natural fertilizer for garden plants and vegetables. Composting is an effective and environmentally friendly solution for turning yard waste and kitchen scrap into a beneficial soil amendment.
o. Kitchen Garden
A kitchen garden is where herbs and vegetables are grown around the house for household use. Since early times a small plot near to the house has been used for growing a variety of vegetables according to the season. Local varieties such as radish, broad leaf mustard, chilli, beans, pumpkins etc. are all grown in the kitchen garden.
p. Biogas (Application of bio-slurry)
Biogas is a clean, non-polluting and low - cost fuel. It contains about 55 to 75 per cent methane. The dung is mixed with water (4:5) and loaded into the digester in a biogas plant. The gas generation takes place slowly and in two stages. In the first stage, the complex, organic
Source: https://en.wikipedia.org/wiki/Anaerobic_digestion

53 | P a g e
substances contained in the waste are acted upon by a certain kind of bacteria, called acid formers and broken up into small-chain simple acids. In the second stage, these acids are acted upon by another kind of bacteria, called methane formers and produce methane and carbon dioxide, which is inflammable.
Biogas would be produced from cattle dung and other organic matter by a process called "anaerobic digestion" in a biogas plant. The digested material, which comes out of the plant is an enriched manure.
Proper application of bio-slurry has been proven to provide higher yields than regular manure. It also provides a viable solution to nutrient depletion of many agricultural soils in developing countries. The nutritional value of the slurry can greatly be improved if urine can also be collected in the digester. The use of bio-slurry thus considerably boosts agri- and horticultural production. The composition of bio-slurry depends on the feeding and the amount of water added to the dung. When the dung is mixed with equal amounts of water, after digestion the composition of slurry is recorded as: water 93% and dry matter 7%. The Nitrogen (N), Phosphorus (P) and Potassium (K) are the most required nutrients to the plants. NPK content in liquid slurry is 0.25%, 0.13% and 0.12% respectively.
Being fully fermented, bio-slurry is odorless and does not attract flies. It repels termites and pests that are attracted to raw dung. It reduces weed growth. Application of bio-slurry has proved to reduce weed growth by up to 50%. It is an excellent soil conditioner, adds humus, and enhances the soil’s capacity to retain water. It is pathogen-free. The fermentation of dung in the reactor kills organisms causing plant disease.
All major plant nutrients (such as NPK) are preserved during fermentation process so that plants can immediately absorb these nutrients. It can also be applied as ready-to-use manure. After being stored for a few days or mixed in a 1:1 composition with water, bio-slurry can be applied directly to vegetables or fruit crops around the household. Bio-slurry application along with installation of regular irrigation channels is beneficial for the growth of vegetables especially root vegetables, paddy, sugarcane, fruit trees, and nursery saplings. Mushroom cultivation also benefits greatly from bio-slurry application. Spraying bio-slurry (with or without a little addition of pesticide) can effectively control red spiders and aphids attacking vegetables, wheat and cotton. The effect of bio-slurry with 15- 20% pesticide in pest-control is proven to produce the same results asusing pure pesticides. Dressing of barley seeds with bio-slurry is an extremely effective way to control the barley yellow mosaic virus, which is one of the most destructive diseases in barley growing areas. Dried digested slurry has great potential to be used as feed supplement for cattle, pigs, poultry, and fish. Bio-slurry application as organic fertilizer supports nutrient cycles as well as checks soil degradation and erosion. In addition, the biogas process is carbon neutral, thus contributing to the global reduction of greenhouse gas emissions for better care of Mother Nature.
Source: http://www.biru.or.id/en/index.php/bio-slurry/
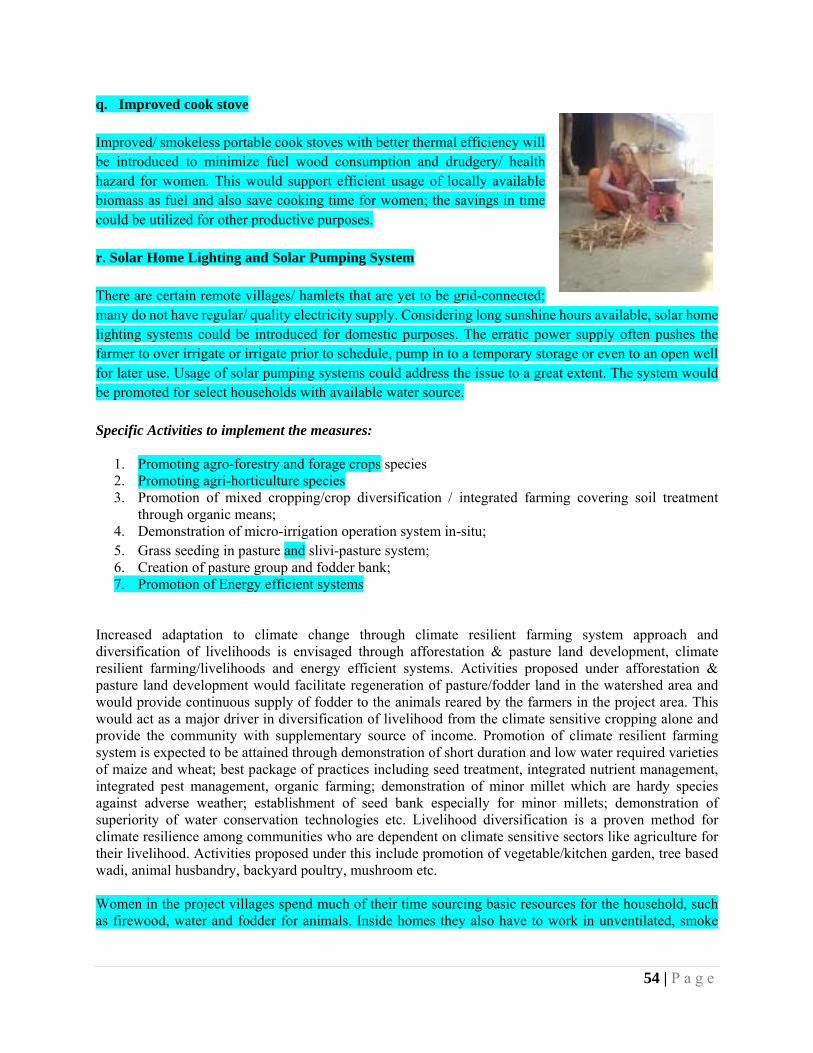
54 | P a g e
q. Improved cook stove
Improved/ smokeless portable cook stoves with better thermal efficiency will be introduced to minimize fuel wood consumption and drudgery/ health hazard for women. This would support efficient usage of locally available biomass as fuel and also save cooking time for women; the savings in time could be utilized for other productive purposes.
r. Solar Home Lighting and Solar Pumping System
There are certain remote villages/ hamlets that are yet to be grid-connected; many do not have regular/ quality electricity supply. Considering long sunshine hours available, solar home lighting systems could be introduced for domestic purposes. The erratic power supply often pushes the farmer to over irrigate or irrigate prior to schedule, pump in to a temporary storage or even to an open well for later use. Usage of solar pumping systems could address the issue to a great extent. The system would be promoted for select households with available water source.
Specific Activities to implement the measures:
1. Promoting agro-forestry and forage crops species 2. Promoting agri-horticulture species 3. Promotion of mixed cropping/crop diversification / integrated farming covering soil treatment
through organic means; 4. Demonstration of micro-irrigation operation system in-situ; 5. Grass seeding in pasture and slivi-pasture system; 6. Creation of pasture group and fodder bank; 7. Promotion of Energy efficient systems
Increased adaptation to climate change through climate resilient farming system approach and diversification of livelihoods is envisaged through afforestation & pasture land development, climate resilient farming/livelihoods and energy efficient systems. Activities proposed under afforestation & pasture land development would facilitate regeneration of pasture/fodder land in the watershed area and would provide continuous supply of fodder to the animals reared by the farmers in the project area. This would act as a major driver in diversification of livelihood from the climate sensitive cropping alone and provide the community with supplementary source of income. Promotion of climate resilient farming system is expected to be attained through demonstration of short duration and low water required varieties of maize and wheat; best package of practices including seed treatment, integrated nutrient management, integrated pest management, organic farming; demonstration of minor millet which are hardy species against adverse weather; establishment of seed bank especially for minor millets; demonstration of superiority of water conservation technologies etc. Livelihood diversification is a proven method for climate resilience among communities who are dependent on climate sensitive sectors like agriculture for their livelihood. Activities proposed under this include promotion of vegetable/kitchen garden, tree based wadi, animal husbandry, backyard poultry, mushroom etc. Women in the project villages spend much of their time sourcing basic resources for the household, such as firewood, water and fodder for animals. Inside homes they also have to work in unventilated, smoke

55 | P a g e
filled rooms. Lack of water within easy reach (15-20 minutes’ walk from the home) and indoor smoke pollution increases drudgery and reduces quality of life. The activities such as improved cook stoves, biogas unit and solar lighting proposed under the project will ease the burden on women and improve their socio-economic status. These measures will have a positive impact on women’s workload, due to a decrease in time currently spent in firewood gathering and fetching water from long distance and the saved time could efficiently be used for increasing the adaptive capacity of the households. Adaptation benefit is derived from improvement of the quality of life of women in vulnerable households. Increased income, use of clean energy will lead to increased resilience at household and community levels and higher resilience will improve their ability to face climatic stresses and weather-related disasters. Most of the project villages in the project area are either not grid connected or power supply is irregular and hence farmers are not in a position to provide even life saving irrigation during critical periods of the crops especially during drought years. Demonstration of solar pump is definitely helpful in lifting water for life saving irrigation, thereby saving the crop from failure due to inadequate/low rainfall and consequent drought. Evidence of scientific-based benefits from major proposed activities and current drivers that prevent adoption together with sustainability measures overtime are set out in the table given below.
Activity Evidence of scientific-based benefits Current drivers that prevent the
adoption
Sustainability measures overtime
Agro-forestry
Woody perennials are deliberately integrated with crops and/or animals on the same land management unit. The integration can be either in a spatial mixture or in a temporal sequence. - Extra earning for the farmer - Enhances the production ability of the land. - Diversification of forest and cultivating
crops also reduces resources and labor costs - Minimizes the risks involved in the
cultivations of crops. - Mix up of long lasting forest crops with
annual agricultural income creates big profits on the annual basis too.
- Increases the fertility of soil and helps in preventing soil erosion.
- Special attention to be given in Rajasthan for forage crops and that grasses that bind the soil.
- Provides following ecosystem services such as carbon sequestration, biodiversity conservation, soil enrichment and air and water quality maintenance/improvement.
Supporting literature- ‘Multifunctional
Forestry takes atleast 3 – 5 years to give returns. Non-availability of suitable forest genotypes for agro forestry condition
Selection & finalisation of species for agro-forestry and forage crops in consultation with farmers (consultation meetings in every watershed villages)

56 | P a g e
Agroforestry system in India’ by Deep Narayan Pandey. http://www.currentscience.ac.in/Downloads/article_id_092_04_0455_0463_0.pdf
Agro horticulture
Growing fruit crops such as Amla, Pomegranate, Guava, Sapota, Mango, etc. in between the annual crops is known as agri-horticulture. It provides better microclimate for the annual crops besides providing off season employment and income to the farm family.
Consecutive drought for more than three years becomes an issue in maintaining the horticulture saplings alive
Selection & finalisation of species for agri-horticulture in consultation with farmers (consultation meetings in every watershed villages) & Technical feasibility
Climate Resilient Farming System for Crop productivity / Farm income,
Lack of investment power
Soft loans to the needy farmers
High yielding and drought tolerant varieties
High yielding varieties with drought resistant and temperature tolerant character are highly suitable for the selected watersheds considering drought risk. Supported literature – ‘Ec ological Farming-Drought resistance Agriculture’ http://www.greenpeace.org/international/Global/international/publications/agriculture/2010/Drought_Resistant_Agriculture.pdf
High seed cost and unavailability of seeds when the farmers need it.
Making the seeds available linking the Department of Agriculture Extension system
Need based fertilizer application
Soil test based and crop requirement based fertilizer application would improve the crops yield besides maintaining the soil health.
Lack of knowledge on the nutrient requirement of the crops
Sensitization progrmmes organized at the beginning of the cropping season. Organizing soil testing campaigns to test the soil and give the farmers soil health card with recommendation for the nutrient application for the crops they plan to grow.
Cultivating
Growing alternate crops / fodder sorghum during SWM in Tamil Nadu. Using the quantum of rainfall received during the SWM, minor
Influence of market demand
Identification suitable alternative crops

57 | P a g e
alternate crops
millet crops like barnyard Millet can be grown which are drought hardy and needs less water. Instead of keeping the land fallow, a fodder sorghum crop can be grown to create fodder reserve for the animals.
Low profits that are specific to the location that can provide fodder and grain and popularizing it among the farming community
Inter-cropping / Mixed Cropping / Rotational Cropping
Intercropping is the practice of growing two or more crops in proximity. The most common goal of intercropping is to produce a greater yield on a given piece of land by making use of resources that would otherwise not be utilized by a single crop. Planning will be done carefully taking into account the local soil, climate, crops, and varieties.
Lack of knowledge Technical and Financial Feasibility Assessment for mixed cropping / crop diversification etc
Promotion of Alternate Fodder
Azolla is a fern species and one of the potential alternative green fodder. This grows as floating plant in small area of open water trough. It grows very fast and self-replicates through vegetative propagation on water within 3-4 days of harvesting. When fed, it improves the Omega fatty acid content in the egg and meat, good for health. This can be used a good nutritive supplement for animal and poultry feed
Availability of azolla seed inoculums. Lack of knowledge to cultivate azolla
Capacity building programmes organized to teach the farmers the cultivation techniques of Azolla. Developing mother inoculums nurseries in the village itself in progressive farmers fields. Creation of pasture group and fodder bank Grass seeding in pasture+slivi-pasture system
Integrated Farming System
Integrating animal component with agriculture. Provides additional income and employment throughout the year. Serves as alternative livelihood option for the farmers in the crisis time Supporting literature - ‘Integrated Farming Systems for Smallholders in India – Models and Issues for Semi-arid Tropical Conditions’ http://conference.ifas.ufl.edu/ifsa/papers/A/d4.doc
Lack of funds to establish the IFS at their own fields
Provision of interest free soft loans

58 | P a g e
Soil Nutrient Management
Fertile top soil is lost due to erosion. Indiscriminate application of chemical fertilizers, pesticides and irrigation degrades soil health and productivity. Supporting literature ‘Integrated nutrient management for sustainable crop production, improving crop quality and soil health, and minimizing environmental pollution’ http://www.iuss.org/19th%20WCSS/Symposium/pdf/0920.pdf
Less importance given under rainfed lands, especially in the tribal belts.
Balanced fertilizer application, controlling erosion and addition of organic manures to the soil
Micro Irrigation
Drip irrigation help in saving in water usage and minimises wastage of other inputs. Supporting literature ‘’Spread and Economics of Micro-irrigation in India: Evidence from Nine States’ http://www.eidparry.com/ContentFiles/Downloads/newspaper-articles/spread-and-economics-of-micro-irrigatio-in-india-evidence-from-nine-states.pdf
Maintenance need of micro irrigation system
Demonstration of micro-irrigation systems
Outcome 3: Reduced climate change vulnerability with improved risk mitigation measures Specific Activities to implement the measures:
1. Installation of Automatic Weather Station and 2. Dissemination of crop advisory services. 3. Sediment Observation Unit 4. Geo-hydrological study and crop water budgeting
Installation of Automatic Weather Station and dissemination of crop advisory services Installation of Automatic Weather Station on a cluster basis and dissemination of crop-weather advisory to farmers based on real time data, are the major components proposed. It is proposed to disseminate the advisories through mobile with a tie-up with a suitable Technology Service Provider. For this purpose the information generated from the automatic weather stations from the project area will be linked to the TSP for agro advisory services. Accordingly, farmers will be able to take suitable decision with regard to input planning and farm management. From adaptation point, it will be one of the project input to cope with the situation and remain better prepared. In addition, it is also proposed to undertake crop-water budgeting with an objective to utilize the available water in the watershed area most judiciously. For this purpose, suitable equipments like run-off measurement device, sediment observatory etc., will be installed in the watershed area. As per “Economic Impact of Agromet Advisory Services (AAS)” published by Agricultural Meteorology Division, India Meteorological Department, Shivajinagar, Pune in its quarterly Newsletter April-June 2013, “The agromet advisory services rendered by India Meteorological Department (IMD) through various channels have resulted in significant increases in farm productivity resulting in increased availability of food and higher income generation. The services helped the farmers not only in

59 | P a g e
increasing their productions but also reducing their losses due to changing weather patterns and others problems. Economic assessment by the National Centre for Agriculture Economics and Policy Research (NCAP) on AAS estimated 10-25% economic benefit obtained by the farmers. The economic benefit of the agromet services runs in crores. The Ministry of Earth Sciences (MoES) had engaged National Council of Applied Economic Research (NCAER) to carry out a comprehensive study on “Impact Assessment and Economic benefits of Weather & Marine Services.” This study was carried out during September & October 2010 and restricted to main end users i.e. farmers for Agrometeorological Advisory Services. The field study was carried out in 12 states and 1 Union territory. According to the report only 10 to 15 percent of the farmers are benefitting from the SMS services and about 24% farmers are aware about Agromet Services. It was revealed that economic profit estimates can vary between Rs. 50,000 Crore (where 24% farmers receive weather information) to 211,000 Crore (where all farmers receive weather information). This shows that its economic returns depend on the proportion of farmers receiving information.” ------------ A pilot study was conducted to assess the economic impact of weather forecast-based advisories issued to 15 of the 127 Agrometeorological Advisory Service (AAS) units of the Ministry of Earth Sciences, Government of India. Six seasons comprising three Kharif (summer) and three Rabi (winter) during 2003–2007 were chosen. The major crops chosen for the study included food grains, oilseeds, cash crops, fruit and vegetable crops. The sample set consisted of 80 farmers, comprising 40 responding and 40 non-responding farmers. The main aim was to study the percentage increase/decrease in the yield and net return due to AAS. Results obtained suggest that the AAS farmers accrued a net benefit of 10–15% in the overall yield and a reduction by 2–5% in the cost of cultivation over the non-AAS farmers. Courtesy: Parvinder Maini* and L. S. Rathore, Economic impact assessment of the Agrometeorological Advisory Service of India, CURRENT SCIENCE, VOL. 101, NO. 10, 25 Nov 2011. In order to penetrate the weather/ agro advisory services in the field and with more accuracy, the proposal includes installation of Automatic Weather Station (AWS) in select watersheds on a cluster basis and dissemination of agro advisory issued by a Technology Service Provider based on the weather forecast. The weather forecast would be more realistic with data input from the AWS installed in the watershed. Agro advisory customized accordingly would equip the farmers better to plan/ time field activities and adapt to climatic aberration. The selection of watersheds for the activity has been done also considering post-project O & M concern. Weather Advisory subscription (3 years) on crop, weather & market information In order to help the farmers in taking timely decisions in crop planning, timing field operations and marketing the produce, it is proposed to promote Weather Advisory services in the project area. The Weather Advisory subscription would offer:
o Daily Market Prices and Arrivals Update for two Crops and three Markets for each crop; Highest, Lowest prices and Arrivals covered;
o Crop Advisory/Best Practices for two Crops; Relevant timing on Sowing, Growing,

60 | P a g e
Harvesting, etc.; o Weather Forecasts on Temperature, Rainfall Probability and Relative Humidity;
Additional weather bulletins in case of sudden events; o Agriculture & Rural News - Daily news update and crop specific events; o relevant news at Local, Regional, National, International level.
. Sediment observation unit and data analysis Sediment monitoring would help in Sequential monitoring of runoff and sediment
losses to check the effectiveness of various soil and water conservation measures;
getting basic information for planning of water resources for their optimal utilization; and
monitoring the environmental changes due to natural/ biotic interferences.
The SOP would be installed considering the following:
o preferably at the exit point of watershed. o site should be accessible, free from back water effects. o There should be no turn on upstream and downstream of the structure. o The section should be straight at least up to 30 m and control section should be masonry
structure. o The site should be stable and not subjected to degradation. o The site should have a stream length stretch of 150 m both in upstream and downstream.
The instrumentation shall include the following:
Sl# Parameter Instrument/ Methodology 1 Rainfall
measurement Tipping bucket type automatic rain gauge
2 Run-off measurement
Automatic Stage Level Recorder with USB type data logger 1. The data collected is accurate with high precision. 2. There is no temporal variation of data. 3. The USB type data logger is easy, user may directly put the same in USB port of PC/Laptop. The data is available in MS excel sheet format. 4. The lithium battery is easily available.
3. Sediment Measurement
Automatic Suspended Sampler 1. The data collected is highly accurate; no chances of human error as sediment collection is automatic. 2. There are no chances of the temporal variation of the data, as the timing is fixed from minutes to year. Besides, it is reprogrammable. 3. Suitable for even the most remote locations. 4. Very simple and easy to operate.

61 | P a g e
5. Applicable for small to medium watershed. 4. Monitoring
Station Silt Observation Post with stilling basin. 1. The stilling basin provided in the SOP compensates the effects scouring and surface water waves due to wind movement. 2. The SOP represents the actual flow through the stream. The length of at least 30m converts the flow from to laminar flow (flow having no turbulence) & steady state condition. 3. There is no storage effect in SOP, as the discharge flows through the SOP and hence gives the accurate data of stage (level of water) and sedimentation. 4. Safety House provided is safe from social problems like theft of machine etc. (if any)
Geo-hydrological study and crop water budgeting
An in-depth study of hydro-geological regime for a watershed helps in proper treatment planning/reorientation based on the need and potential for runoff harvesting/ recharge. In most of the watersheds, there has been a significant change in cropping practice with much dependence/ exploitation of ground water resources. A crop water budgeting based on hydro-geological study with community participation could ensure sustaining positive impact from the watershed development programme on a long run. If adopted in the watershed area and around, it could lead to better aquifer management. The activities would broadly include the following: Define and map the hydro-geological regime based on the geological features of the
watershed; Analyse the present and past meteorological parameters; Analyse the demand, supply and groundwater balance in the area; Assess the impact of project interventions on local groundwater system; Chalking out a sustainable water management plan/ crop calendar; Developing a tool on crop planning on the basis of rainfall; Share the study results with the watershed community and train/ sensitise them on water
management issues along with the NGO (EE) concerned. Generation of weather information is pre-requisite for developing weather based agro advisory system. Based on the past weather data as well as weather forecast for next one week to 10 days, considering the stage of the crop, weather based agro advisories are issued. Hence establishment of weather stations become mandatory. It is proposed to disseminate the advisories through mobile with a tie-up with a suitable Technology Service Provider. For this purpose the information generated from the automatic weather stations from the project area will be linked to the TSP for agro advisory services. Accordingly, farmers will be able to take suitable decision with regard to input planning and farm management. From adaptation point, it will be one of the project input to cope with the situation and remain better prepared.

62 | P a g e
Geo-hydrological studies will be undertaken in the watershed area by means of the datagenerated through installation of equipment like run-off measurement device, sedimentation observatory etc. Together with the data on rainfall, crop-water requirement etc., crop-water budgeting will be prepared and crop planning will suitably be done. Geo-hydrological study has been proposed in the State of Rajasthan, where crop failures due to low and erratic rainfall and consequent drought are common. It is envisaged to undertake a proper crop planning including contingency crop plan, especially for Rabi/ winter crop, based on geo-hydrological study and crop water budgeting so as to minimize risk of crop failures. Outcome 4: Creation of knowledge management system for climate change adaptation in
rainfed areas The project will have a strong knowledge management system which would enable documentation and large scale dissemination of knowledge and lessons learned from the project to different stakeholders, including policy makers and planners. Based on the project learning, operational manual, policy briefs, audio visual materials, etc. will be developed for knowledge dissemination. Project will organize seminars, interactive workshops, exposure visits, etc. for cross learning and dissemination of information. The operational manual will be developed both in English and local language with illustrations so that it can be used as training instrument to train different stakeholders. Policy brief prepared as part of the knowledge management system will help policy makers to be sensitive to climate change adaptation in rainfed areas on watershed basis and help in mainstreaming such adaptation initiatives in natural resource management projects/programmes. This output will extend over the life time of the project and will highlight the impact of climate change on natural resources and agricultural development in Tamil Nadu and Rajasthan. Specific Activities to implement the measures:
1. Design workshop for the development of operational manual. 2. Developing appropriate knowledge products, including photo stories, presentations and briefing
notes, etc. for use in policy advocacy activities aimed at policy makers 3. Conducting exposure visits to the project areas to enable sharing between stakeholders, farmers,
and local communities. 4. Producing audio-visual material describing the
projects’ products and results. 5. Disseminating knowledge products, targeting
outlets that are relevant for policy makers 6. Ensuring good media coverage for programme
activities. 7. Conducting regular policy advocacy activities
throughout the life of the programme, including at relevant national and regional events.
1. Grassland Ecology study:

63 | P a g e
The grass and herbage standing crop on pasture lands / grazing /grasslands lands are valued for multiple uses such as livestock production, wildlife food and cover, and soil protection against erosion (Benkobi et al. 2000). In Rajasthan, which is part of the arid and semi- arid region, agriculture is predominantly rain fed and livestock rearing is one of the primary livelihoods. However, in the districts like Udaipur, which is mainly mountainous, and semi - arid, fodder for livestock is comparatively scarce mainly due to over grazing and regular fire in these pasture/ grazing/ grass lands and forested areas. Another major reasons being disappearance or lack of proper management, protection and conservation practices. This has led to not only lack of fodder, but also heavy degradation in quality in the form of less or non palatable fodder species, predominance of less nutritive grass or other fodder species, invasion of exotic species, loss of soil due to poor or no ground cover in the pasturelands.
All types of pasture lands/ fodder producing areas within each of the selected watersheds are proposed to be ecologically assessed through systematic random sampling. The pasturelands would include common grazing/ pasture land, community/ group
protected pastureland (group of private land owners getting together and protecting their land for fodder) and private pastureland and other revenue waste within the watershed. Since most of the pasture lands are on hilly and undulating terrain/ topography, the initial step would be to stratify these into hill top, top slope, middle slope, lower slope and foot hills / flat areas. The sampling would be done covering all terrain and topography types, starting from hill top to the foot of the hills. The interval or distance between two samples would be minimum of 50 m on either side. Care would be taken to cover the entire pasture land type and have a spatially distributed sampling in addition to sampling areas at sites with variation from the general terrain and topography, viz. water bodies, streams, agriculture edges and others.
Biomass assessment and sample collection of grass productivity
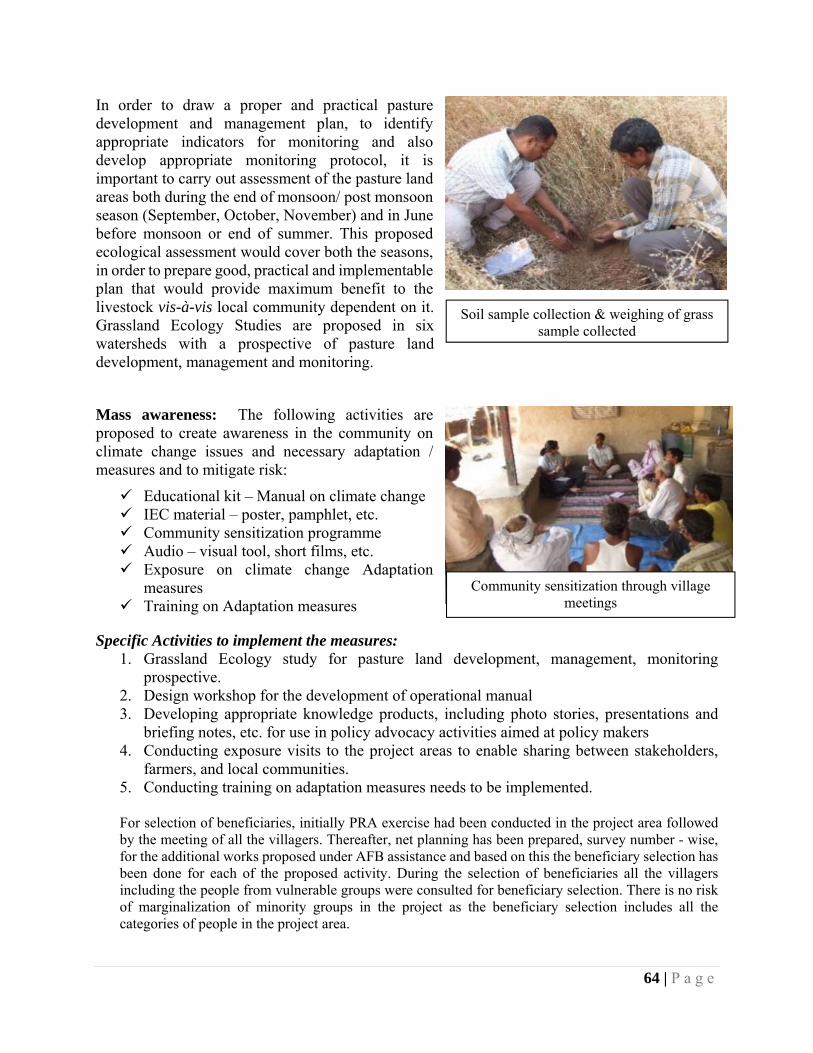
64 | P a g e
In order to draw a proper and practical pasture development and management plan, to identify appropriate indicators for monitoring and also develop appropriate monitoring protocol, it is important to carry out assessment of the pasture land areas both during the end of monsoon/ post monsoon season (September, October, November) and in June before monsoon or end of summer. This proposed ecological assessment would cover both the seasons, in order to prepare good, practical and implementable plan that would provide maximum benefit to the livestock vis-à-vis local community dependent on it. Grassland Ecology Studies are proposed in six watersheds with a prospective of pasture land development, management and monitoring.
Mass awareness: The following activities are proposed to create awareness in the community on climate change issues and necessary adaptation / measures and to mitigate risk:
Educational kit – Manual on climate change IEC material – poster, pamphlet, etc. Community sensitization programme Audio – visual tool, short films, etc. Exposure on climate change Adaptation
measures Training on Adaptation measures
Specific Activities to implement the measures: 1. Grassland Ecology study for pasture land development, management, monitoring
prospective. 2. Design workshop for the development of operational manual 3. Developing appropriate knowledge products, including photo stories, presentations and
briefing notes, etc. for use in policy advocacy activities aimed at policy makers 4. Conducting exposure visits to the project areas to enable sharing between stakeholders,
farmers, and local communities. 5. Conducting training on adaptation measures needs to be implemented. For selection of beneficiaries, initially PRA exercise had been conducted in the project area followed by the meeting of all the villagers. Thereafter, net planning has been prepared, survey number - wise, for the additional works proposed under AFB assistance and based on this the beneficiary selection has been done for each of the proposed activity. During the selection of beneficiaries all the villagers including the people from vulnerable groups were consulted for beneficiary selection. There is no risk of marginalization of minority groups in the project as the beneficiary selection includes all the categories of people in the project area.
Community sensitization through village meetings
Soil sample collection & weighing of grass sample collected

65 | P a g e
Apart from PRA, FGD exercise, including women, was also conducted in each watershed. These included assessment of climate vulnerability and community based adaptation measures through tools like seasonal calendar, local cropping pattern, weather event and its adverse impact on livelihood, etc. Activities like Improved cook stove, Backyard poultry, RWHS, Solar home lighting system, Biogas unit, etc. were planned accordingly considering possible drudgery reduction for women and improvement in livelihood and households.
B. Describe how the project / programme provides economic, social and environmental benefits,
with particular reference to the most vulnerable communities, and vulnerable groups within communities, including gender considerations. Describe how the project / programme will avoid or mitigate negative impacts, in compliance with the Environmental and Social Policy of the Adaptation Fund.
The project would be implemented in resource poor rainfed regions of Tamil Nadu and Rajasthan. Community in this region are dependent on agriculture with mostly grow single crop in a year due to limited rainfall. Hence, most of these farmers are financially very weak thereby making them vulnerable to the impact of climate change. The major beneficiaries of the project will be small and marginal farmers (with less than 2 ha of land holding), besides landless labourers and women living in the identified project locations spread over in about 25, 000 ha. The equitable distribution of benefits to the eligible beneficiaries out of the project components will be ensured through prioritization of beneficiaries for each activity (need based) on the basis of detail livelihoods profile, vulnerability mapping / assessment, housing index and need assessment. People belonging to different socio-economic categories, those will be benefitted from the intervention, are as follows.
Table 15: Beneficiary Category of the Project
Name of the Watersheds by State Small Farmer
Marginal Farmer
BPL Households
SC Households
ST Households
Women Headed
Households Rajasthan Dhuvala 206 295 78 122 5 25 Nayagaon-I 134 144 85 47 98 8 Nayagaon-II 139 224 164 71 37 13 Balua 146 644 680 20 798 8 Vagda 335 5 240 14 132 70 Jhabla 107 108 80 0 219 20 Malvi 773 4 543 0 729 30 Mandli 64 534 422 55 346 42 Chainpuria 219 208 298 67 403 55 Khad 123 185 326 0 301 6 2246 2351 2916 396 3068 277 Tamil Nadu Chithalai Thirumangalam 69 98 52 39 - 57 Bettamugilalam 100 225 25 60 150 22 Chinnapoolampatti –Kalligudi 106 27 25 38 ‐ 14 Srirrampuram-Malvarpatty 565 286 109 10 ‐ 22 Vannikonendal-Kurukkalpatti 215 210 1905 625 0 159 Anjukulipatty 522 108 826 340 ‐ 32 Ayyampalayam 729 298 653 103 ‐ 26 Peikulam-Kalligudi 70 107 33 8 ‐ 25 Salivaram 200 82 249 107 33 - Thally Kothanur 350 345 152 128 - - 2926 1786 4029 1458 183 357 Grand Total 5172 4137 6945 1854 3251 634

66 | P a g e
Source: Beneficiary Mapping during Participatory Field Survey Note: BPL‐Below Poverty Line; SC‐Scheduled Caste; ST – Scheduled Tribe
Sustainability Development Criteria: The project meets various sustainability development criteria such as social wellbeing, economic benefit, environmental advantage, institutional and financial benefits. With the restoration of local eco-system, eco-system services are expected to contribute building better resilience. Detail of benefits envisaged from different sustainability criteria is discussed in the table below. Table 16: Sustainability Parameters of the Project and Key Benefits
Sustainability Criteria
Key benefits Baseline scenario
Social
Agri-horticulture provides Off season employment and income to the farm family and reduces the vulnerability of the poor and also enhances their nutritional security
Reduced agriculture (production) threatens food security in the region.
The necessary labour for watershed rehabilitation and protection will be from the location itself
Landless labour and marginal farmers migrate from rural areas.
Since SHG / JLG will be linked to SHG groups where women membership is high gender equity will be maintained.
Gender inequity
Economic
Drip irrigation will reduce the cost of production as labour for weed control and reduce water consumption
Poor water use efficiency and high input cost.
Intercropping method will produce a greater yield on a given piece of land and enhance the farm income
Mono cropping, mixing different crop seeds and sowing by broadcasting
Through fertigation, nutrient use efficiency is increased, cost on fertilizer is reduced and yield of most of the crops are increased.
Indiscriminate use of fertilizers.
Environmental
Deep tillage is done as it helps in increasing the rooting depth of the plant. The available moisture to the plant will be increased if the rooting depth is increased and would help in supporting for the crop development for more number of days after the cessation of rainfall.
Poor root penetration and low LGP
Agro forestry also helps in sequestering atmospheric carbon dioxide and helps in reducing emission and global warming
High level of vulnerability
Some of the trees / shrubs suitable for agro forestry in the study region which are creating favourable micro climate for the crops in addition to minimizing soil erosion.
Lower water table negatively impacting water quality, increasing soil pollution.
Production and use of organic manures like vermi-compost reduces use of high cost chemical fertiliser
Indiscriminate use of fertilizers.
Institutional Creation of community based organisation such as village watershed committee (VWC), SHG, user groups, farmer interest group oriented towards climate changes adaptation scenario
Low level of awareness on climate change adaptation among watershed community.
As discussed above on different sustainability criteria, implementation of the project will not cause any negative social and environmental impacts. Local communities have been consulted in design of the project and components proposed are in line with the prevalent regulations, policies and standards of National and Sub-national (State) Governments. Components proposed under the project have been designed with consideration towards the environmental and social principles as outlined in the Environmental and Social Policy of Adaptation Fund.

67 | P a g e
Project activities for addressing the climate threat have been identified based on the recommendations of the climate expert validated through series of community consultations. Most of the activities proposed are based on low cost technologies and the cost for majority of activities are in the range of US $ 125 to 200. Only very few activities which are included with the purpose of demonstration such as vegetable cultivation in poly house (US $ 1250), solar pumpsets (US $ 2083), drip/sprinkler (US $ 667), improved farm implement bank (US $ 4167), gradonis (US $705) etc., are slightly expensive activities. Watershed-wise and activity-wise details of physical quantity, design, unit cost etc., are presented in Annexure 3. Majority of the activities with AF support are individual farm based activities aimed at improving resilience of farmers against the climate variability/change and implementation of them are not expected to have any significant adverse impact on environment and society. On the contrary, the activities are meant for betterment of the community and improvement of the environment. Notwithstanding the above, as an abundant precaution, suitable mechanism will be put in place to identify and assess risks during project implementation and a management plan will be worked out in case significant risks warranting suitable mitigation, are identified at implementation stage.
C. Describe or provide an analysis of the cost-effectiveness of the proposed project / programme.
Component/sub-component
Current addressing mechanism and shortcomings
How this project trying to address this
Cost effectiveness
Improved soil and water regime for better crop productivity
Soil health improved through summer / deep ploughing,
Technologies like summer/deep ploughing, are not being adopted by farmers due to lack of proper guidance and awareness on their benefits
The project would motivate farmers, whose land are unproductive on account of compaction and poor fertility status, by providing support for undertaking the activity for one year, so that farmers could adopt the same perpetually
The cost of summer/deep ploughing is a nominal US $ 33 per ha In the absence of summer/deep ploughing, farmer will have to go for more number of ploughing during the on-set of monsoon, provision of life saving irrigation ion the event of monsoon failure etc., which are cost intensive alternatives.
Increased water availability through farm pond, catch pit, well recharge pit and other water harvesting structures
Since these investments are low cost are not supported under any of the Government programme, despite being highly beneficial.
Considering the immense benefit of such low cost structures in conservation of water, the project would support these structures
Large number of small and low cost structures like well recharge pit/ catch pit are proposed, with an average cost of US $ 100 per structure as against high cost surface water structures like farm pond (US $ 1567),

68 | P a g e
Component/sub-component
Current addressing mechanism and shortcomings
How this project trying to address this
Cost effectiveness
which 15 times costly alternative option. Only limited number of farm ponds are proposed that too in three watersheds in Rajasthan, owing to the grave water situation in such areas.
Increased adaptation to climate change through climate resilient farming system approach and diversification of livelihoods
Increased availability of fodder/fuel through afforestation & pasture land development
Conscious interventions are not being done in regeneration of fodder/fuel in large tracts of common pasture land available especially in Rajasthan
Project proposes to regenerate fodder/fuel in the pasture land through a variety of interventions such as construction of stone pitched thawla/crescent bud, grass seeding, planning of fodder trees, establishment of fodder bank etc
In the natural pasture eco-system, through adoption of good management practices, regeneration of existing root stocks of many wild fodder/fuel species would easily be possible. This could be supplemented through planting/seeding with extra saplings/seeds. Separate fodder plots development as an alternative is resource and cost intensive considering requirement of fodder of 20 to 25 kg per day per animal. If fodder has to be purchased, farmer will have to incur an amount of INR 20 to 25 per day per animal, which works out to INR 9125 (USD 152) per animal per year.
Improved resilience through adoption of climate resilient farming/livelihood systems
Integration of climate concerns in farming systems is absent in the project villages. Further, integrated and holistic approach is totally lacking in the existing schemes of Government, which
The project proposes to demonstrate climate resilient technologies like micro-irrigation, soil fertility improvement, tolerant varieties, seed bank, nutritional security, livelihood diversification etc., as models.
The approach is basically intended to enhance skill and knowledge of farmers so that they will be able to adopt their production system according to climatic situation.

69 | P a g e
Component/sub-component
Current addressing mechanism and shortcomings
How this project trying to address this
Cost effectiveness
mostly addresses crop specific issues only
Climate resilient farming/livelihood system proposed encompasses agronomic practices which are less costly as low external inputs are applied compared to conventional farming.
Better energy management through adoption of energy efficient systems
Penetration of energy efficient systems like solar pump, bio-gas etc., are very low in watershed areas.
The project proposes to popularise energy efficient systems like solar pumpsets, bio-gas etc., by demonstrating its efficacy.
Energy security and clean energy are important for rural household. The energy saving devices will reduce the recurring expenditure for fuel and will not pollute the environment The improved chullah will help to save at least 3 kg of firewood (on an average) per day, thereby reducing the drudgery of women for fire wood collection besides smoke related health hazards Gas produced from biogas is much cheaper than LPG, which is presenting costing around INR 650 (USD 11). In addition, slurry is a better alternative to organic manure
Integration of risk mitigation products like crop, weather and market advisory for the farmersInstallation of Automatic Weather Stations and generation of agro-advisories
Crop-weather advisories although are available, it is not based on local real time data and are beyond means of ordinary farmers.
The project proposes to install Automatic Weather Station on a cluster basis and provide real time data to Technology Service Provider for analysis, interpretation and dissemination back to the farming community in the very same cluster of watersheds.
Timely advice related to agriculture and other natural resource dependent livelihood will reduce chances of greater cash loss due to adverse weather and disaster.

70 | P a g e
Component/sub-component
Current addressing mechanism and shortcomings
How this project trying to address this
Cost effectiveness
Geo-hydrological study and crop-water budgeting
There is a tendency to exploit the water conserved in the watershed area, particularly by the large farmers who have access to financial resources
It is proposed to install equipments for run-off measurement, soil moisture tension etc., and carry out watershed specific Geo-hydrological studies and come out with crop-water budget appropriate to the watershed based on the existing cropping pattern
The scientific approach of crop-water budget could ensure equitable distribution of the public good (water) amongst the farmers depending on the proposed cropping pattern
Creation of knowledge management system for climate proofing of watersheds Government takes up prescriptions and project learning for large scale implementation.
Presently, no suitable models for climate proofing of watersheds are available in the country. Further, location specific information related to climate resilient farming systems are not available for large enough scale
Information and knowledge dissemination materials would be published and circulated. Sensitisation meetings, training and network meetings would be conducted.
The wide range experience sharing will be made through circulation of low cost public education materials like pamphlets, posters, manual etc. Exposure visits and peer learning also will be encouraged.
Cross learning and replication of practices and lesson learnt with improved knowledge and understanding by stakeholders
The cost of implementation of watershed project including climate proofing components in Tamil Nadu (NABARD and AFB components put together) is estimated to be $2,636,488 whereas in Rajasthan the same works out to $3,006,919. Based on the coverage of watershed area, per hectare cost comes to $194.19 for Tamil Nadu, while for Rajasthan it is $253.49. In order to demonstrate cost effectiveness of climate proofing of watershed projects, the cost has been compared with alternative options available in the project area. Taking up of minor irrigation projects is one of the alternatives which can results in insulating the project area from the adverse impact of climate change. One such minor irrigation project in Rajasthan namely Earthen Dam with Spillway is found to be costing $4366.67 per hectare. Similarly in Tamil Nadu, construction of check dam is observed to have per hectare cost $4900. Thus it is amply clear that cost of climate proofing of project works out to hardly around 5% of cost of alternatives options, thus proving to be highly cost efficient. An assessment of the cost effectiveness at the level of activities proposed in the project is given below: Sl.No Description of
treatments Cost Effectiveness
I Improvement in soil water regime
A Area Treatment-Crop Cultivated Area

71 | P a g e
1 Farm Pond The cost of farm pond is about USD 250 (15mx 20mx 1m) and would result in conservation of3.0 lakh litre of water in one filling. Farm ponds are very effective for water conservation and providing life saving irrigation (2 to 3 irrigation), tackle the problem of water availability in climate change scenario. The same would also help in reducing the top soil loss from the farmers field and same can be reapplied in the field. This in-situ water conservation measure is effective as compared to ground water harvesting structures (wells and borewells) and lined tanks. Works for farm pond construction are mainly manual one and very cost effective.
2 Drainage system in crop cultivated area
The activity is proposed in one watershed Chainpuria (Rajasthan) and controlling excess runoff and crop damage due to the same. The measure is a low cost one and would constructed along the contour lines with minor gradient. The activity primarily earthwork and done with manual labour is very cost effective without any material requirement. The cost of the measure is USD 1560 and would be useful for about 15 ha of cropped areas (i.e. USD 104)
3 Catch pit The average cost of these structure is US$ 17 and is constructed with manual labour and local material i.e. stone and gravels.
4 Well recharge pit Well recahrge pits are effective means of insitu water conservation and diversion of surface runoff into open wells through filtrations. All the material except for pipe inlet to the well is locally available and the cost of each stature is about USD 75. The approach is well tested and has found to be effective in safe recharge of groundwater as compared to more cost intensive approaches like recharge shaft for artificial ground water recharge.
5 Summer ploughing This includes ploughing the soil in advance of the start of the monsoon season. This will help in opening the hard top soil which would lead to increased rate of infiltration besides reducing the soil borne pests and diseases. Soil erosion will also be controlled and will also control the weeds. The cost of the intervention is USD 29 per ha and creates conducive atmosphere for crop growth.
6 Deep tillage Performing tillage operations below the normal tillage depth to modify adverse physical and chemical properties of the soil. One of the reasons for low yields is the limited amount of moisture available to crop roots. The available moisture will be increased if the rooting depth is increased. The intervention is very cost effective @ USD 3 per ha.
B Drainage line treatment
1 Earthen Embankment with spillway
Earthen embankment normally constructed across small streams / gullies helps in arresting flow of water and create water storage which helps in recharge the downstream area. Excess water during heavy rainfall is safely conveyed through spillway without causing damage to the main structure. Since the embankment is constructed with earth dug-up from the site duly compacted, the structure is inexpensive compared to stone pitched / cement check dams.

72 | P a g e
2 Masonry Gabion The structure help in reduction of stream velocity and thereby the erosion. Over the period the growth of vegetation around the structure helps stabilization of gullies and streams as well as conservation of water and soil. The construction is done by the local masons and the average cost is USD 1000 to 2500 depending on thedimensions of stream / gully
3 L.D.P.E Sheet lining for seepage control in existing structures
The use of LDPE for lining of water bodies helps in control of seepage and extend the availability of water for crop cultivation. The measure is proposed for existing structures and major component is material component (LDPE).
4 Masonry Check Dam/ Water Harvesting structure
Constructions of check dams help in controlling gully erosion. It serves to slow the movement of water, allowing increased percolation into the soil.
5 Recharge pit on upslope side of gully plugs
The intervention has observed to be very effective for found water recharge, soil conservation and stability of structure. It cost about USD 2 /- structure and only involve manual labour for construction
6 Open Recharge Pit in drainage line
Open Recharge Pit in drainage line (~ 4 x 1 x 0.45 m) helps in water harvesting in case of seasonal streams as well as conservation of soil within the catchment. These structures shall intercept excess runoff from high intensity rainfall events that are on a rise. The intervention cost is USD 2 /- per structure and only involves manual labour
II Climate Resilient Farming System and improved livelihood
A Afforestation & Pasture land development
1 Gradonis (bench terracing) - demo
The structure helps to reduce run-off or its velocity and to minimize soil erosion. To conserve soil moisture and fertility and to facilitate modem cropping operations i.e. mechanization, irrigation and transportation on sloping land. USD 705/- per ha. The same is planned for demonstration purpose.
2 Refilling of alternate CCTs and tree seeding
This RCCT Technology reduces soil erosion to minimum level and the plant growth on such trenches is very promising with very high survival rate (90% to 95%) with increase in height of plant from 45 cm basic height to 2m within only 6 months. This method can be adopted in low rainfall area. This method is suitable for plantation of all species and easy, simple for laborers.
3 (Stone pitched) Thawala/ Crescent Bund for regeneration of plants
The bunds helps in water conservation upto 10 cum and help in reduction of surface runoff to the extent of 70%. Construction involves manual labour only.
4 Tree seeding The intervention helps in improving vegetative cover and very cost effective. The intervention proposed would cost about USD 2.9 per 100 m of plantation.
5 Plantation of fuel/fodder trees in SP site/ stone bund
The intervention helps in bund stabilization as well as for fodder availability

73 | P a g e
6 Grass seeding in pasture + silvi pasture land
The methods proposed involves direct seeding and would help in ensuring fodder security. The cost proposed is USD 9.0 which would ensure fodder availability of minimum of 2 cattles for one season.
6 1 cft (0.3x0.3x0.3 m) pitting and tree seeding
The cost proposed are mainly towards the labour component for pit digging and for 100 such units the same is about USD 75.8 which include seed cost component of USD 1.67
7 Plantation of fodder trees for gully stabilization
the intervention would help in gully stabilization and soil conservation. The damage to the surrounding areas and land degradation would be halted due to the same. Further same would provide the fodder.
7 Use of Water absorption Material during plantation
The same is proposed as demonstration in one watershed (Mandali Watershed in Rajasthan). The same is proposed as 10 g material per plant @ Rs200/- per kg (i.e. USD 3.3 per kg). This would help in moisture conservation.
8 Thoor bio-fencing/ barrier
This intervention effectively uses locally available plant material and has found to be useful as bio-fence. The barbed wire fence costs about US$ 3.3 per running meter, whereas the biofence costs about US$ 0.3 per running meter
9 Stone Fencing bund This intervention effectively uses locally available plant material and the cost proposed is at USD 4.6 per cum. The construction does not involve in material cost as proposed cost is only towards lobour cost.
10 Creation of Pasture group and fodder bank
The proposed activity is planned at group level and their by is very cost effective the cost proposed is US$ 833 per group
11 Bund planting/ Tree seeding
The intervention would help in bund stabilization and protect the bund and reduce the cost for its reconstruction
12 Korangad development
The Korangad system proposed aims to revive traditional fodder cultivation practices in southern India (Tamil Nadu). The system uses marginal / fallow lands for fodder cultivation, creates sustainable availability of fodder, conserves soil moisture and is very effective pasture management system. The cost of Korangad Development is proposed as US$ 41.6 per acre (i.e. US$ per ha)
13 Nursery for forestry species
The intervention would promote local availability of planting material and reduce transportation cost. Create livelihood opportunity for self help groups in the watershed areas.
14 Green coverage (Gliricidia sepium)
Gliricidia sepium is a fast growing, tropical, leguminous tree. The tree leaves are useful for green manuring and tree can be pruned to provide fodder, green manure, firewood or stakes for new fences. The intervention would help in promoting the plan species in the watershed areas.

74 | P a g e
15 Azolla development Azolla can be promoted as alternate fodder which doubles its biomass in 10 days with very less water requirement. It also increases omega fatty acid content in the animal products. Each unit of the same would cost about USD 25 to 70/- depending on the size of unit and cattle feed requirement. Compared to other nutritional supplementation it is one of the most cost effective method.
16 Agro-forestry in channel/castor seeding
Intervention planned is to reduce the erosion in the channel for stabilization of gullies and channels. Local plant species suitable for agro-climatic region would be selected for the purpose.
B Other Climate resilient farming/ Livelihood Support
1 Wadi/ Horti-Plantation
Horticulture plantation comprising of 2 to 3 plant species are taken in a single parcial of land measuring about 0.4 ha as against monocropped orchard. Staggering of harvesting season coupled with availability of produce during the extended period helps in insulating the farmer from the price fluctuation. Plantation of forestry species around the wadi makes micro climate suitable for better growth and higher productivity.
2 Vegetable cultivation with Trellis
Perennial vegetables which are creeper in nature are cultivated by making trellis consisting of metal wire tied to poles in between every rows. The vegetable crop is allowed to creep on to these trellis and spread out so that plants are in a better position to absorb sunlight and resultant higher photosynthesis. This system has proved to be superior to the conventional system of growing vegetable on a pendal. higher yield and better income are assured through these systems. These are proposed as demonstration models for scaling up.
3 Kitchen Garden The intervention would be helpful in providing nutritional security for the farming community.
4 RWHS for Backyard plantation
The interventions are planned for roof water harvesting and are low cost interventions for fulfiling needs of plantation crops in the backyards.
5 Well recharge The proposed intervention in Rajasthan Watersheds would channelize surface runoff for well recharge. The per structure cost is USD 133.33.
6 Enhancing water use efficiency by use of micro irrigation/ UG pipes & outlets
The intervention planned area for demonstration purpose and would help in improving water use efficiency
7 Seed bank Seed bank promotes seed availability at the watershed level thereby reducing cost of seed, maintain quality parameters and ensure timely availability. The cost proposed is US$ 3000 per seed bank. The activity is planned at group level thereby making it cost effective.
8 Short duration and low water required variety of maize and
Due to early maturity of these crops which are grown in the winter season, the water requirement would be lower. Due to early maturity these crop escape the likely drought like situation during harvesting period.

75 | P a g e
wheat promotion of mixed cropping
9 Improved Farm Implements and equipment (BBF implement, Zero Tiller; Weeder; Fertigation; Reaper, Thresher etc.)
The Broad Bed and Furrow system is a modern version of the very old concept of encouraging controlled surface drainage by forming the soil surface into beds. The recommended BBF system consists of broad beds about 100 cm wide separated by sunken furrows about 50 cm wide. The preferred slope along the furrow is between 0.4 and 0.8 percent. Two, three, or four rows of crop can be grown on the broad bed, and the bed width and crop geometry can be varied to suit the cultivation. BBF helps in draining off excess water in the field and soil, provides congenial condition for the plant growth and development. These systems along with other measures such as zero tillage practices promote conservation tillage and improve crop productivity
10 Best package of practices incl. seed treatment, INM, IPM, organic farming, etc.
The purpose of these measures of reduce the use of chemical fertilizer, reduce cost of production and make farming more sustainable. The measures would help promoting organic and non chemical measures of nutrient and pest/ disease management
11 Silage making demo
12 Improved animal husbandry practices including feed management, mineral bricks, silage, AI services of improved desi breed, etc.,
The same would be very useful for cattle health management requirements and providing veterinary services.
13 Backyard Poultry units
The proposed intervention is for demonstration purpose for depicting of alternative livelihood options
14 Vermicompost Production of organic manures using earthworms is found to be very effective in improving the soil productivity due to its physico-chemical properties coupled with enzymatic actions. Compared to chemical fertilizers vermi compost is cheaper and could be produced by the farmers in their own farms. Further, vermi-compost is environmental friendly and does no harm to the ecosystem as against chemical fertilizers.
15 Integrated Farming System
Farming system wherein series of crops integrated with other compatible activities like animal husbandry, fisheries, etc. helps in judicious use of resources while augmenting financial returns from all the activities. The system having symbiotically related activities enables in reducing cost of cultivation / recurring cost thereby maximizing profit as compared to mono-cropped / single activity based system
16 Tank silt application Application of tank silt will help for insitu soil moisture conservation by improving the soil structure, texture, and infiltration rate. It will also improve the available soil nutrient status that would lead to increased crop yields.
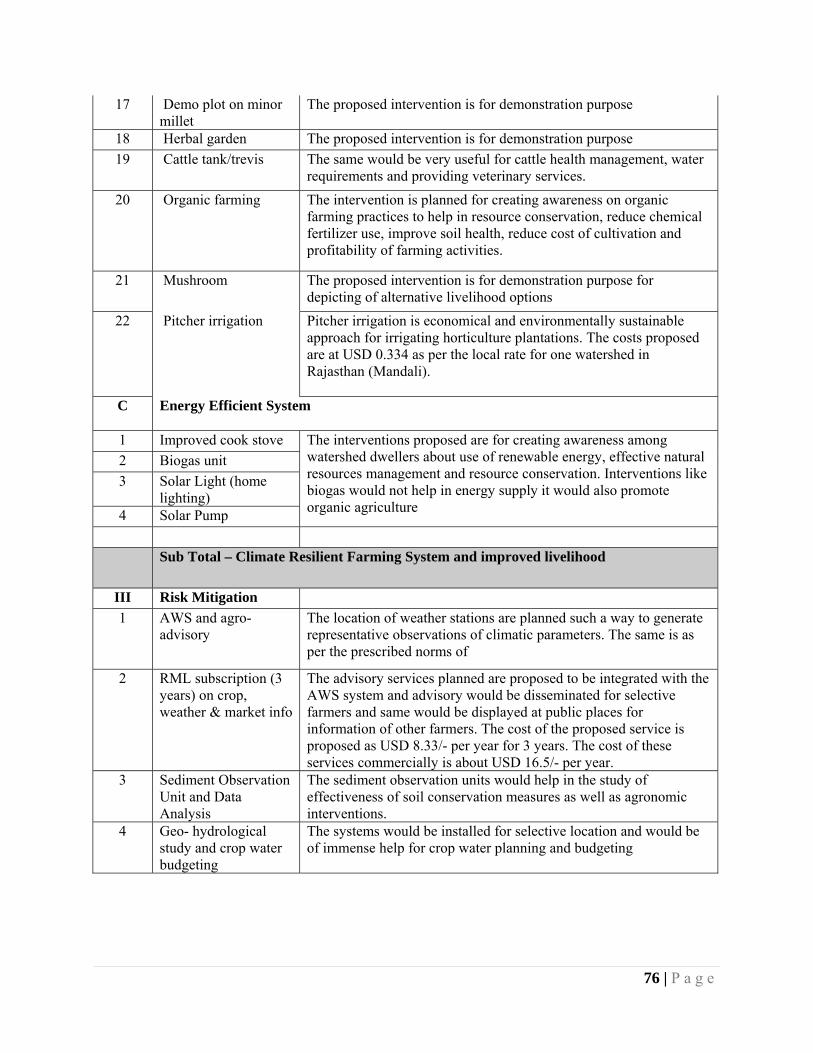
76 | P a g e
17 Demo plot on minor millet
The proposed intervention is for demonstration purpose
18 Herbal garden The proposed intervention is for demonstration purpose
19 Cattle tank/trevis The same would be very useful for cattle health management, water requirements and providing veterinary services.
20 Organic farming The intervention is planned for creating awareness on organic farming practices to help in resource conservation, reduce chemical fertilizer use, improve soil health, reduce cost of cultivation and profitability of farming activities.
21 Mushroom The proposed intervention is for demonstration purpose for depicting of alternative livelihood options
22 Pitcher irrigation Pitcher irrigation is economical and environmentally sustainable approach for irrigating horticulture plantations. The costs proposed are at USD 0.334 as per the local rate for one watershed in Rajasthan (Mandali).
C Energy Efficient System
1 Improved cook stove The interventions proposed are for creating awareness among watershed dwellers about use of renewable energy, effective natural resources management and resource conservation. Interventions like biogas would not help in energy supply it would also promote organic agriculture
2 Biogas unit
3 Solar Light (home lighting)
4 Solar Pump
Sub Total – Climate Resilient Farming System and improved livelihood
III Risk Mitigation
1 AWS and agro-advisory
The location of weather stations are planned such a way to generate representative observations of climatic parameters. The same is as per the prescribed norms of
2 RML subscription (3 years) on crop, weather & market info
The advisory services planned are proposed to be integrated with the AWS system and advisory would be disseminated for selective farmers and same would be displayed at public places for information of other farmers. The cost of the proposed service is proposed as USD 8.33/- per year for 3 years. The cost of these services commercially is about USD 16.5/- per year.
3 Sediment Observation Unit and Data Analysis
The sediment observation units would help in the study of effectiveness of soil conservation measures as well as agronomic interventions.
4 Geo- hydrological study and crop water budgeting
The systems would be installed for selective location and would be of immense help for crop water planning and budgeting

77 | P a g e
IV Knowledge management
Knowledge Management Components proposed in the project helps in taking the learnings from project to the larger community thereby enabling them to adopt such practices demonstrated by the project. This creates a multiplier effect in technology adoption, income augmentation, and finally resulting in larger community adapting to climate change. Viewed in this context, the cost proposed for this component in the project not only gets recovered in the system immediately.
D. Describe how the project / programme is consistent with national or sub-national sustainable
development strategies, including, where appropriate, national or sub-national development plans, poverty reduction strategies, national communications, or national adaptation programs of action, or other relevant instruments, where they exist. India is having both National and International obligations for taking up climate change adaptation and mitigation strategies and minimizing negative impact of climate change and disaster. India,apart from being a developing country party to the Kyoto Protocol, is also vulnerable to the adverse effects of climate change and hence eligible to receive funding from the Adaptation Fund Board. The proposed location of the project, as discussed in this proposal, is climatically vulnerable to a number of factors and hence central and state Government priorities have been to improve the adaptive capacity to cope with the situation.
The National Action Plan on Climate Change recognises the threat of climate change and has identified the agriculture sector as heavily affected by the predicted impacts of climate change. In addition, a large proportion of the rural population, particularly the poor, depend on agriculture and livestock for their livelihood. Accordingly, the Government of India has developed a “sustainable agriculture mission” committed to promote and implement all measures that would increase the resilience of agriculture to climate change, focusing on watershed development as a thrust area. The plan mainly aims to support climate adaptation in agriculture through the development of climate-resilient crops and agricultural practices. The National Action Plan on Climate Change (NAPCC) has identified eight core national missions, under which “National Mission for Sustainable Agriculture” aims to support climate adaptation in agriculture through the development of climate-resilient crops. The “National Mission on Strategic Knowledge for Climate Change” looks to gain a better understanding of climate science, impacts and challenges. It also encourage private sector initiatives to develop adaptation and mitigation technologies. The Outcome 4 of current proposed project is having a direct linkage with the “National Mission on Strategic Knowledge for Climate Change” and “National Mission for Sustainable Agriculture” is having a direct linkage with the project outcome-1, project outcome-2 and project outcome-3. In line with the NAPCC, State Action Plan on Climate Change (SAPCC) also have strategy outlines, focusing on adaptation and mitigation strategies along with dealing with disaster. As per RAPCC (Rajasthan Action Plan on Climate Change), Rajasthan is having a vision of enhancing resilience in the State for addressing current and likely impacts of climate change on key sectors, enhance adaptive capacities of the vulnerable communities while tapping potential opportunities for mitigation7. The strategies adopted by Rajasthan, looks at knowledge creation and its management / dissemination which
7Rajasthan Action Plan on Climate Change, Chapter 2: RAPCC Vision and Approach.

78 | P a g e
fulfills Outcome-4 of this project8. The proposed Project Outcome 1-3 best fit to the RAPCC broad strategies under Agriculture and Animal Husbandry9. Tamil Nadu State Action Plan on Climate Change (TNSAPCC) is having a vision to foster an integrated approach to inclusive, sustainable, and climate resilient growth and development. The State aims at achieving this vision through pursuing (a) mainstreaming of climate concerns into all aspects of development policy and implementation, and (b) ensuring complementarity with and contributing to the national agenda on climate change. Keeping in mind the overall motto of the TNSAPCC –‘Inclusive Growth for Improved Resilience’, different approaches and strategies are suggested for the achievement of the Vision10. All the Outcomes, proposed in this proposal well align with the State Vision and Mandate. The Outcome-4 of this proposal well in line with the State mandate for Knowledge Management11 and Outcome 1-3 aligns with the proposed State strategies for Agriculture and Allied Sectors12 and Water Resources13. Apart from action plans and strategies for its realization, Government of India has been taking measures for adaptation and mitigation through watershed development which confirms that it has been a national priority. Integrated Watershed Management Programme (IWMP), Desert Development Programme (DDP) and Integrated Wastelands Development Programme (IWDP) of the Department of Land Resources, Govt. of India are some of such interventions that bears the similar objectives like this project. Key Policies of Central and State Government, which supports such interventions and on which this project is based are as follows.
Table 17: Project Consistency with National and State Sustainable Development Strategies SN Central/State
Government Policy Responsible Agency Project Component Consistent with the Policy
1 12th Five year plan Planning Commission, Govt.
of India
Twelfth Five Year Plan lays considerable focus on climate change adaptation in agriculture sector (para 7.85 of 12th FYP document). The plan identified some policy and programmatic interventions which can help farmers and other stakeholders adapt to climate change and reduce the losses. Amongst the key actions for adapting Indian agriculture to climate change are improved land management practices, development of resource conserving technologies, development of crop varieties that can withstand climate-stress, effective risk management through early warning, The proposed concept is in-line with the adaptation strategies contained in the 12th Five Year Plan.
2 National Water Mission
Ministry of Water Resources, Govt. of
India
Key Consistencies: 1. Designing incentive structures to promote water
neutral or water positive technologies; 2. Integrated water resource management helping to
conserve water 3. Optimise water use by increasing water use
efficiency by 20% 4. Enhancing storage, both above and below ground,
special effort to increase water storage capacity;
8Rajasthan Action Plan on Climate Change, Chapter 12: Strategic Knowledge on Climate Change. 9Rajasthan Action Plan on Climate Change, Chapter 7: Agriculture and Animal Husbandry. 10Tamil Nadu State Action Plan on Climate Change, Chapter 3: Overarching State Framework. 11Tamil Nadu State Action Plan on Climate Change, Chapter 11: Knowledge Management. 12Tamil Nadu State Action Plan on Climate Change, Chapter 5: Agriculture and Allied Sectors. 13Tamil Nadu State Action Plan on Climate Change, Chapter 6: Water Resources.

79 | P a g e
3 National Mission on Strategic Knowledge for Climate Change
Cross cuts all the Ministries & Department
Key Consistencies: 1. Identifying challenges of and response to climate
change 2. Research on socio-economic impacts of climate
change, including impact on health and livelihoods 3. Development of innovative technologies for
adaptation and mitigation; 4. Research to support policy and implementation
4 Second National Communication on
Climate Change (May 2012)
Govt. of India The suggested strategies as per the Second National Communication on Climate Change (May 2012) indicates that “adaptations can be at the level of the individual farmer, society, farm, village, watershed, or at the national level.” Some of the possible adaptation options suggested include, agronomic adaptation/ crop adaptation, crop diversification, water harvesting and recycling, awareness creation among farmers, resource conservation technologies, augmenting production and its sustainability and improved risk management through early warning system. As may be seen from the project components that majority of them are aligned to the adaptation options suggested in the Second National Communication on Climate Change
5 National Mission of Sustainable
Agriculture (NMSA)
Ministry of Agriculture
The NMSA aims to promote and implement all measures that would increase the resilience of agriculture to climate change, focusing on watershed development as a thrust area. The plan mainly aims to support climate adaptation in agriculture through the development of climate-resilient cropping system, and agricultural practices.
6 National Action Plan on Climate Change
and State Action Plan on Climate Change
Various Ministries with Government of
India and State Government (Tamil Nadu and Rajasthan)
The National Action Plan on Climate Change and the State Action Plans on Climate change recognises the threat of climate change and has identified the agriculture & water sector as heavily affected by the predicted impacts of climate change. In addition, a large proportion of the rural population, particularly the poor, depend on agriculture and livestock for their livelihood.
7 Integrated Watershed Management
Programme (IWMP)
Ministry of Rural Development
The main objectives of the IWMP are to restore the ecological balance by harnessing, conserving and developing degraded natural resources such as soil, vegetative cover and water. The outcomes are prevention of soil erosion, regeneration of natural vegetation, rain water harvesting and recharging of the ground water table. This enables multi-cropping and the introduction of diverse agro-based activities, which help to provide sustainable livelihoods to the people residing in the watershed area.
Source: Various Documents (published/Web) of Government of India, Government of Rajasthan and Government of Tamil Nadu. Success of climate change adaptation in rainfed areas on watershed basis with fund support from AFB would add value to the on-going programme of Govt. of India in terms of making it adaptation focused and improving the resilience to climate variability.
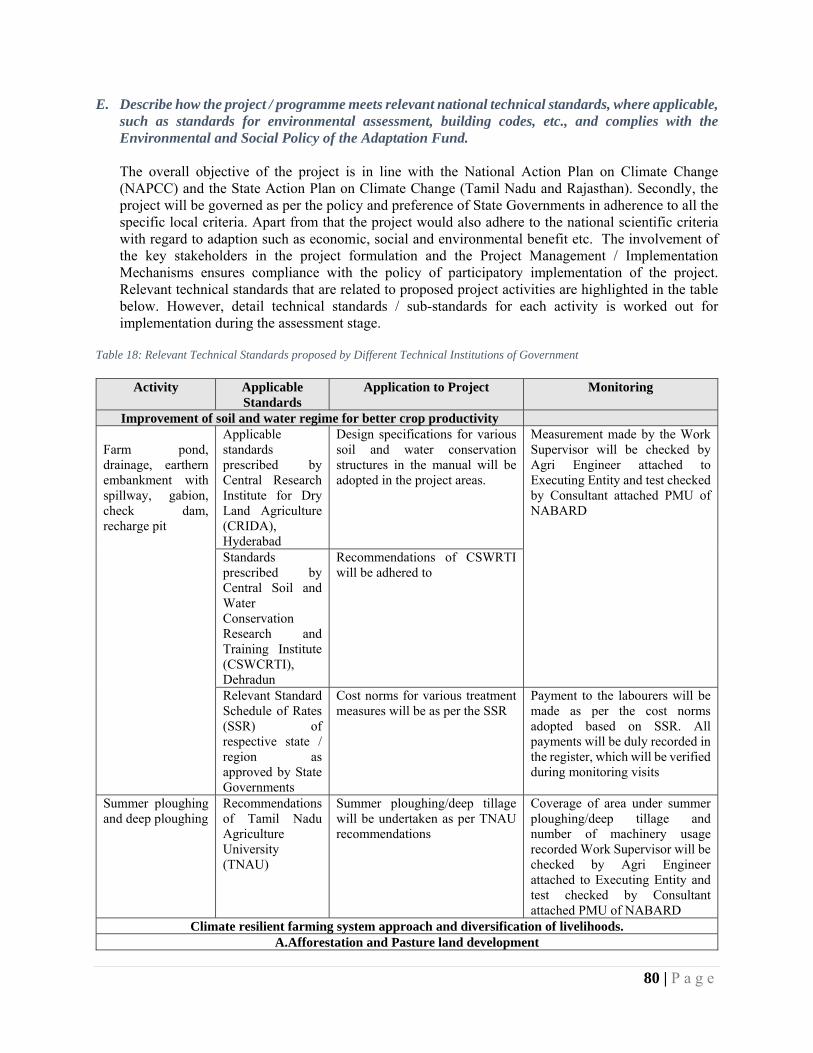
80 | P a g e
E. Describe how the project / programme meets relevant national technical standards, where applicable, such as standards for environmental assessment, building codes, etc., and complies with the Environmental and Social Policy of the Adaptation Fund. The overall objective of the project is in line with the National Action Plan on Climate Change (NAPCC) and the State Action Plan on Climate Change (Tamil Nadu and Rajasthan). Secondly, the project will be governed as per the policy and preference of State Governments in adherence to all the specific local criteria. Apart from that the project would also adhere to the national scientific criteria with regard to adaption such as economic, social and environmental benefit etc. The involvement of the key stakeholders in the project formulation and the Project Management / Implementation Mechanisms ensures compliance with the policy of participatory implementation of the project. Relevant technical standards that are related to proposed project activities are highlighted in the table below. However, detail technical standards / sub-standards for each activity is worked out for implementation during the assessment stage.
Table 18: Relevant Technical Standards proposed by Different Technical Institutions of Government
Activity Applicable Standards
Application to Project Monitoring
Improvement of soil and water regime for better crop productivity Farm pond, drainage, earthern embankment with spillway, gabion, check dam, recharge pit
Applicable standards prescribed by Central Research Institute for Dry Land Agriculture (CRIDA), Hyderabad
Design specifications for various soil and water conservation structures in the manual will be adopted in the project areas.
Measurement made by the Work Supervisor will be checked by Agri Engineer attached to Executing Entity and test checked by Consultant attached PMU of NABARD
Standards prescribed by Central Soil and Water Conservation Research and Training Institute (CSWCRTI), Dehradun
Recommendations of CSWRTI will be adhered to
Relevant Standard Schedule of Rates (SSR) of respective state / region as approved by State Governments
Cost norms for various treatment measures will be as per the SSR
Payment to the labourers will be made as per the cost norms adopted based on SSR. All payments will be duly recorded in the register, which will be verified during monitoring visits
Summer ploughing and deep ploughing
Recommendations of Tamil Nadu Agriculture University (TNAU)
Summer ploughing/deep tillage will be undertaken as per TNAU recommendations
Coverage of area under summer ploughing/deep tillage and number of machinery usage recorded Work Supervisor will be checked by Agri Engineer attached to Executing Entity and test checked by Consultant attached PMU of NABARD
Climate resilient farming system approach and diversification of livelihoods. A.Afforestation and Pasture land development

81 | P a g e
Gradonis (bench terraces), refilling CCT, stone pitched tawla, etc
Applicable standards prescribed by CRIDA and CSWCRTI
Design specification and recommendations will be adopted
Measurement made by the Work Supervisor will be checked by Agri Engineer attached to Executing Entity and test checked by Consultant attached PMU of NABARD
Tree seeding, plantation of fuel/fodder, grass seeding, thor fencing, nursery for forest sp, agro-forestry etc
Prescribed Standards of Forest Departments of Tamil Nadu and Rajasthan
Fuel/fodder plants, agro-forestry, nursery etc., will be developed as per the specifications of the respective Forest Departments
Coverage of area, type of species, cost of saplings under agro-foresty, grass seeding, fuel/fodder etc., recorded Work Supervisor will be checked by Agri Engineer attached to Executing Entity and test checked by Consultant attached PMU of NABARD
B. Other Climate Resilient Farming/Livelihood Demonstration of short duration crops, improved farm implements, best package of practices, drip, micro sprinkler, demo plot on minor millets, seed bank, vegetable, kitchen garden
Prescribed Standards by Indian Council of Agriculture Research (ICAR) and Package of practices of the respective States
Prescriptions of ICAR and package of practices of respective Agriculture Universities will be adhered to
Dedicated staff in the Executing Entity will motivate the identified beneficiaries to undertake demonstration activities. Records of all activities undertaken will be maintained by the EE.
Animal Husbandry, backyard poultry, silage etc
Package of practices of Animal Husbandry Departments of respective States
Recommendations of AH Department will be adopted
Dedicated staff in the Executing Entity will motivate the identified beneficiaries to undertake demonstration activities. Records of all activities undertaken will be maintained by the EE
C. Energy Efficient Systems Biogas, solar pump, solar lighting
Relevant Indian Standards (IS) coded as prescribed by Bureau of Indian Standards (BIS)
The relevant prescription on standards by BIS for pumpsets, solar lighting etc
Activities undertaken will be recorded and maintained by the EE
Risk Mitigation Automatic Weather Station, Equipments for sediment monitoring, run-off measurement
Relevant Indian Standards (IS) coded as prescribed by Bureau of Indian Standards (BIS)
Equipments conforming to relevant standards will be procured
EE will ensure procurement of equipments conforming to relevant standards and same will be verified by PMU during monitoring visits
There has been detailed scanning of the policy environment existing at the national and state level. Major acts and policies of Government are in line with the project demands and no such deviation is marked at this stage, after detail analysis of Government policies and priorities. Existing policies and different standards of Government are reviewed, and, for this project it can be ensured that the proposed strategies/interventions will be in line with the national technical standards and Environment and Social Principles underlined in the Environmental and Social Policy of Adaptation Fund. Further, during

82 | P a g e
implementation, required social and environmental safeguard measures will be taken to meet the AFB requirements.
F. Describe if there is duplication of project / programme with other funding sources, if any.
Different projects of similar nature are under implementation in both the proposed States, with the support of different Government agencies and international supporting agencies. The major adaptation projects / programmes under implementation in the states of Tamil Nadu and Rajasthan are given below:
i. Climate proofing of rainfed areas on watershed basis in co-operation with GIZ in Tamil Nadu and Rajasthan: two watershed projects each in both the states are under implementation.
ii. Indo- German Watershed Development Programme (IGWDP) Rajasthan in collaboration
with KfW : 31 projects under implementation
iii. Watershed Projects under Watershed Development Fund of NABARD: In Tamil Nadu 154 projects (with State Government collaboration) and in Rajasthan 17 projects are under implementation.
iv. Improving Pasture Management and Livestock rearing, by AFPRO / GIZ in Rajasthan
v. Sustainable Livelihoods and Adaptation to Climate Change, implemented by World Bank /
GEF.
vi. Climate Change Adaptation in Rural Areas of India, commissioned by BMZ.
The present project areas have been delineated separately with the consent of the respective State Governments (State Level Nodal Agency - SLNA). While selecting the project area, it has been ensured that the same does not have any overlap with any other projects of similar nature/funding. The present project concept has been designed based on the learning from the Climate proofing of rainfed areas on watershed basis implemented in collaboration with GIZ by NABARD in Tamil Nadu and Rajasthan. The pilot project undertaken with GIZ followed the climate proofing tool developed by GIZ for integrating climate change adaptation into the development planning. Some of the lessons learned are outlined below. Under IGWDP, 31 projects are under implementation in Rajasthan, of which 7 projects have been taken up for climate proofing with AF support. The interventions for climate proofing of these 7 watershed were designed based on the learnings from the 2 watershed projects implemented with GIZ support in Rajasthan. In addition, 3 watersheds implemented by NABARD under Watershed Development Fund (WDF) have also been considered for AF support. This is expected to enable in development of appropriate models for climate proofing of watersheds in Rajasthan under 2 types of cofounding arrangements viz.KfW funded IGWDP and NABARD funded watershed under WDF Similarly 10 watersheds have been selected in Tamil Nadu funded under WDF for consideration under AF support based on the learnings from the projects implemented in collaboration with GIZ. Under this programme, the State Government of Tamil Nadu is also one of the stakeholders and the outcome of this project would help in influencing the policy of State Govt. in upscaling/mainstreaming.

83 | P a g e
As regards, improving Pasture Management and Livestock rearing, by AFPRO / GIZ in Rajasthan, the learnings under this programme have helped in finetuning the design of interventions related to pasture development in Rajasthan. While selecting the project area, care has been taken not to have overlapping with any of the ongoing programmes including Sustainable Livelihoods and Adaptation to Climate Change, implemented by World Bank / GEF and Climate Change Adaptation in Rural Areas of India, commissioned by BMZ. However, Stakeholders under these programmes will be involved at various stages during implementation to capture good practices/learnings and their application in the project.
1. Scientific assessment of climate change and its impacts and future projections coupled with discussion with community (timely line analysis with elderly population of villages), PRA made meaning impact to understand the community’s perception on climate change and design the participatory strategy for adaptation measures.
2. The entry point for integrating an adaptation strategy was a difficult decision in the beginning. After deliberation with the community and other stakeholders, it was decided to integrate adaptation strategy during the Full Implementation Phase (FIP) after the capacities of the all the stakeholders are built to the same level during the Capacity Building Phase (CBP).
3. Planning and designing of water harvesting structures taking into account the spatial and temporal distribution of rainfall of the areas rather than total rainfall was also another learning point.
4. Integration of climate resilient low cost agricultural practices such as deep ploughing, summer tillage, grass seeding, etc. in the watershed projects together with capacity building of the community on adoption of climate resilient farming.
The pilot project learning after implementation at Rajasthan and Tamil Nadu will be now up scaled under the AFB support for large scale impact and transformation. As such there are no duplications of projects/ programmes with other funding sources in the proposed project area. The proposed project will be immensely benefitted from convergence approach which is mostly related to different services, established learning and experiences and policy measures that have been taken by Government. The 12th Plan document of Government of India also urges for building synergy among different implementing bodies, foster convergence for inclusive growth and sustainability of the initiatives. This project will adhere to this national principle and take measures accordingly, without duplication of funding sources. Some of the schemes / programmes that are under implementation and having convergence potential with the proposed adaptation project are as follows.
On-going /Proposed
Project
Objectives Complementarities Geographical coverage
Concerned Agency
National Rural Employment Guarantee
To introduce actions for soil and water conservation in a landscape with an
The scheme envisages creation of l land based assets/structures aimed
All over India Ministry of Rural Development

84 | P a g e
On-going /Proposed
Project
Objectives Complementarities Geographical coverage
Concerned Agency
aim of creating local employment
at soil & water conservation
Integrated Watershed Development Programme
To restore ecological balance in a watershed by harnessing, conserving and developing degraded natural resources such as soil, water and vegetative cover and thereby help provide sustainable livelihoods to the local people
The present project supported by AFB on a pilot basis could be upscaled through out India through IWMP, owing to the high budgetary support it receives (US $ 897 mill during 2013-14)
All over India Ministry of Rural Development
National Rural Livelihood Mission (NRLM)
Creat efficient and effective institutional platforms of the rural poor for enabling them to increase household income through sustainable livelihood enhancement and improved access to financial services
Self Help Groups (SHGs) of women in the watershed area could be linked to NRLM for sustainable livelihood support
All over India Ministry of Rural Development
Co-ordination with Ministry of Rural Development during the implementation stage is utmost important for realizing the full potential of synergy/complementarity indicated above. This will be achieved through regular interaction in the Project Sanction Committee (PSC) at national level in which MoRD representative is a member. Similarly, State Level Nodal Agency (SLNA) representative is a member in the State level PSC.
G. If applicable, describe the learning and knowledge management component to capture and disseminate lessons learned. Component 4 of this project describes both the cross-cutting and specific knowledge management functions that will be undertaken in this project. The transfer of knowledge generated through the project is crucial since this will be the first of climate change adaptation project targeting the agricultural sector in both the states that takes into account current as well as future climate change scenarios. The projects is expected to generate crucial learnings in terms building climate resilient

85 | P a g e
agriculture adaptation options.The knowledge will include adaptation techniques at the farm level, best practices, benefits of early warning information through mobiles, sustainable agricultural practices that improve adaptation ability and resilience; and other policy recommendations and technical guidelines produced by the project. The project will have an internal Knowledge Management System (KMS) which will generate scientific data, analyse it and build up the knowledge base. During the project cycle, developed knowledge could be “tacit” and also “explicit”. Direct involvement of different personnel will get the benefit of acquiring tactic knowledge whereas generated explicit knowledge will be dissemination for replication of promising practices and benefit of larger mass. Data related to different aspects of the project (by activity, outcome, benefit, impact etc.), focusing on adaptation and resilience parameters, will be captured through various means like (1) systematic independent studies like grass land ecological study, mid-term impact study etc, (2) periodic data on weather and crop advisories generated by service provider (3) monitoring reports generated by internal and external monitors (4) feed back during exposure visit/training and (5) regular review meeting. Generated knowledge / learning will be scientifically recorded on regular basis in the form of reports, data, proceedings, registers, photo, video clippings etc. Generated knowledge / learning will be disseminated in the following ways:
a. Peer learning seminars / workshops in both the project states and at National level; b. Wider dissemination of the operational manual in English and local language of both the
states; c. Producing audio visual materials and its circulation to different stakeholders for learning; d. Hosting best practices in the existing national websites on climate change adaptation and
resilient measures. e. Establishing Village Knowledge Centres
Present KM system in the project location is basically driven by Government Departments like Agriculture, Animal Husbandry, Tamil Nadu Agriculture University etc., particularly focusing on package of practices of crops/animals, agro-advisories etc. The knowledge inputs from these Departments will be captured by the Project team of EEs, who are working in close co-ordination with local Agriculture/Animal Husbandry Departments. Officials of these Government Departments will be invited to seminars, workshops, review meetings etc., on an on-going way. Sustainability of the Knowledge product over a period of time will be ensured by the Village Watershed Committee (VWC) in association with EE. The service provided will ensure sustainability of crop-weather advisories, through levying the required subscription fees from the farmers.
The programme has a learning and knowledge management component which captures the progress as well as success stories. A wide range of IEC materials like pamphlets, posters and manuals will be developed. Exposure visits and peer learning for new projects working on climate proofing will be arranged. Regular awareness programme/ camps will be conducted by actively involving local CBOs, SHGs, VWC and Panchayati Raj institutions. The EEs (NGOs) have already their presence in the project location and have established rapport with local community as well as line departments and local research institutions.
The Village Knowledge Centre (VKC) is a place to render distant services from a single window point to rural masses especially in remote areas of the country through modern Information and Communication Technology. The knowledge centre will be connected to a central studio using technologies viz WiMax/VSAT/leased line. There will be live interactive sessions in real time by the central speaker with audience at remote villages or content already prepared on any subject

86 | P a g e
that the rural communities might need or desire, will be disseminated. The purpose of setting up of a VKC is to bring access to a range of services, content and information to people living in remote villages or areas which do not provide such access otherwise.
The VKC programme is meant for reaching the benefits of the Information Technology directly to the communities at the grass root level for promoting single window delivery of need‐based services relating to the life cycle needs of rural population, viz. rain water harvesting, nutritional information including primary processing of fruits and vegetables, rural sanitation, preventive and curative aspects of health and hygiene, skill development and linkage with market requirements and demands, capacity building among village based organisations and people or on any issue that the rural communities would desire.
H. Describe the consultative process, including the list of stakeholders consulted, undertaken
during project preparation, with particular reference to vulnerable groups, including gender considerations, in compliance with the Environmental and Social Policy of the Adaptation Fund.
State Level Consultation: In each proposed watershed area, stakeholder consultation meetings were organised. Apart from that, the concept of climate change adaptation in rainfed area on watershed basis was discussed in the workshops organized at Chennai (Tamil Nadu) & Jaipur (Rajasthan). Stakeholders participated in the consultation and discussion process are state watershed department (SLNA), technical institutions like agricultural university, civil society organisations, bilateral agencies, state department of environment etc. Inputs were given by all the stakeholders who participated in the workshop. To understand the climate variability, trends observed already in the proposed area as well as climatic trends expected in the next 30 years were discussed based on learnings from pilot areas. State level workshop in Rajasthan was organized on 19th to 21st July 2014 where participants from various disciplines attended and provided there inputs. Similarly, on 25.7.2014 and 26.7.2014, State level consultation workshop was organized in Tamil Nadu for the same purpose. A combined workshop of NGOs, Climate Expert, NABARD officials involved in implementation of the projects from both the States (Rajasthan and Tamil Nadu), was held during 11-12 September 2014 at Madurai and items of investments and budget were finalized during this consultation meet. The roles ascribed to stakeholders in State level consultations are to provide feedback on the climate analysis report prepared by the Climate Expert, cross check the appropriateness of risks identified for various livelihoods, comment on the suggested adaptation options by the Expert etc. Accordingly, the choice of participants comprise of Officials of state Government, Scientists from Agriculture Universities, Experts and representatives of NGOs, who have domain knowledge and field level experience on climate related adaptation activities. The consultation technique adopted was presentation of watershed-wise climate analysis and climate proofing table by the Climate Expert, followed by feedback from the participants and fine-tuning of the report.

87 | P a g e
Table 19: Consultation Meetings Organised with different stakeholders in Rajasthan& Tamilnadu
Activity Completed on
Stakeholder analysis with NGOs (EEs) 12 May 2014 Strategy Meet with PMU, RO and lead NGOs 13 May 2014 1-day strategy meet with selected NGOs (EEs) 22 May 2014 Orientation workshop for field teams (with specific focus on PRA/ FGD)
24 May 2014
Field visit by Climate Expert and meeting with NGO representatives in watersheds
Meeting of climate expert with NABARD PMU/ RO/ HO, Lead NGO and EEs done on 19-20 July; field visit with lead NGO and select EEs made on 21 July 2014.
Workshop to finalise the (AFB) project activities – with participation of VWCs, EEs and IE
19-21 July, 2014
Workshop to finalise the project activities with VWCs, EEs and IE in Tamil Nadu
12 September 2014
Details on the stakeholders meeting held at watershed level are given in the Annexure 2.
Consultation with Scientific Community: Tamil Nadu Agricultural University (TNAU) has been fully involved in the climate analysis, field survey and consultation both in Tamil Nadu and Rajasthan. Scope of the involvement include identification of watershed-wise climate related risks, analysis of current climate, extreme weather event analysis and future climate change projections. In addition to climate analysis, the scope covers field level survey for identification of risks under various livelihoods and suggest appropriate interventions to mitigate the same. The outcome of the consultation, is watershed-wise report on climate analysis covering the above features and suggested interventions to address the identified risks. A copy of the report in respect of Anjukuttipalli watershed in Tamil Nadu is enclosed as Appendix 1. Based on the individual watershed-wise analysis, a climate proofing table, has been prepared covering climate variability, direct impact, indirect impact, non-climatic stresses, sensitivities, existing adaptive capacity and suggested adaptation strategies. A copy of the model climate proofing table for Tamil Nadu is enclosed as Appendix 2 .Similar analysis has also been made for Rajasthan and considering voluminous nature of the document, the same is not included in the proposal. The above analysis and outcome are the basis for deciding various adaptation interventions under the project.
Watershed Level Consultation: In the proposed project area, series of consultations with farmers and landless persons have been carried out for understanding the problems of degradation of natural resources, low productivity of crops, issues connected with livelihood and to arrive at appropriate treatment measures. These consultations have been undertaken in the month of May 2014 in Tamil Nadu and Rajasthan. On the basis of these information detailed projects report have been formulated.
The roles ascribed to stakeholders in watershed level consultations were to cross check the scientific analysis of climate with the community through recall of extreme weather events, history line; field level impacts on crop and other livelihood, climate and non-climatic risks on livelihood, existing coping capacity, cross verification of suggested interventions with the community etc. Accordingly, the choice of participants comprise of farmers particularly small and marginal, women, landless, representatives of SCs and STs etc. The consultation techniques adopted were Participatory Rural Appraisal (PRA), Focused Group Discussion (FGD) etc. The outcome of the community consultation helped in validating the climate analysis, identify risks associated with various livelihoods, understand the senisitivities and fine-tune and firm-up the adaptation interventions .

88 | P a g e
During the above consultation climate change related issues affecting the community also have been brought forth. Detailed climate analysis and focused discussions with the community with reference to climate change scenario have been undertaken with multi-stakeholder participation. Detailed community assessment through participatory techniques like PRAs, FDGs etc. was conducted in each watershed along with climate analysis by an expert. During these consultations, any potential environmental and social impacts and risks in compliance with the environmental and social policy of Adaptation Fund were identified and this proposed developed based on such findings.
I. Provide justification for funding requested, focusing on the full cost of adaptation reasoning.
General Baseline Scenario The traditional soil water conservation measures and farming have been followed in India for rainfed areas based on the current climate scenario. The farmers generally adjust the sowing date for adapting to moisture stress or try sporadic measures to save the crop which result in failure. In most cases they migrate to nearby towns/cities, during years of crop failures keeping the land barren. This completely makes the investment in watershed structures infructuous. Justification The project will support farmers in applying appropriate water management practices, ensuring that agricultural production can withstand the stresses caused by climate change. This includes upgrading of rainfed and irrigated agriculture through applying rainwater harvesting systems and complementary interventions-climate resilient agronomic practices / techniques etc. The programme also envisages crop diversification and diversification of livelihood. These components are not traditionally part of the conventional programme and the assistance is sought for such additionalities for climate change adaptation. The implementation of the proposed project would form part of the ongoing watershed programme (each watershed about 1,000 ha) for each of 20 watersheds for which funding is provided by NABARD for business as usual activities from its dedicated funds like Watershed Development Fund in Tamil Nadu and funds under Indo-German Watershed Development Programme in Rajasthan. It may be noted that full implementation phase of all the 20 projects has already been sanctioned and fund commitments to the extent of USD 2.85 million has been made. On the basis of this experience, it is now proposed to upscale to an area of about 25,000 ha, in 20 watersheds, 10 each in Tamil Nadu and Rajasthan. Interventions proposed from Adaptation Fund Support are designed in such a manner to deliver the expected outcomes independently, irrespective of the outcome of co-funded components. The proposed interventions to be funded from the Adaptation Fund would therefore be in a position to deliver the major outcomes such as: improved soil and water regime for better crop productivity and resultant increase of income of farmers; Increased adaptation to climate change through climate resilient farming system approach & diversification of livelihoods; and integration of risk mitigation products like Weather Advisory for the farmers. The list containing major components and budget thereof to be funded by NABARD and AFB are given under Part III(Para E). Summary of component-wise baseline scenario and additionality components proposed to be funded under AF is given in the table below:

89 | P a g e
Table 20: Justification for Funding Request-Project Additionality
Component Baseline (without AF) Additionality (with AF) Outcome 1: Improved soil and water regime for better crop productivity and resultant increase of income of farmers.
With increasing impact of climate change on the weather parameters the traditional business as usual treatment measures and livelihood in the watershed will get affected.
The interventions and structures are designed with a climate change consideration, resulting in better adaptation to the short term climate variability and long term climate change. The interventions include, deep tillage, summer ploughing, application of tank silt, farm pond, check dam, recharge pit, gully plugs, etc
Outcome 2: Increased adaptation to climate change through climate resilient farming system approach and diversification of livelihoods
An increased risk owing to mono cropping, intensive input application, in efficient water use etc. in the context of increasing evidence of changes in climate variables. This will bring in a scenario of over exploitation of the natural resources.
Climate resilient cropping system with strong elements of diversification leading to sustainable livelihoods for the grass root communities. Agro-forestry, agro-horticulture, silvi-pasture, drought tolerant varieties, inter-cropping, alternate fodder, integrated farming system, micro irrigation, organic farming, energy efficient systems etc.
Outcome3: Integration of risk mitigation products like weather advisory for the farmers
Unpredictable and short term climate variability leading to loss of crop and livestock (e.g. extreme events like drought, late onset of monsoon etc.). Inefficient water management with very poor climate considerations
Reduced risk due to dissemination of timely weather based crop advisory based on real time data and crop-water budgeting based on geo-hydrological studies.
Outcome 4: Creation of knowledge management system for climate change adaptation in rainfed areas
Lack of climate consideration in development planning. Rural livelihood programmes without climate consideration leading to maladaptation during programme implementation.
Mainstreaming climate proofing into development planning of watershed projects. Operational manual, peer learning, audio visual tools, policy brief etc.
J. Describe how the sustainability of the project/programme outcomes has been taken into account
when designing the project / programme.
During designing of the project, taking views of different stakeholders consulted in different phases of proposal development, sustainability parameters are taken in to account. Sustainability of the project outcomes, beyond the life of the project is ensured through different strategies that are proposed in this project. The strategies, to be taken up (as discussed in this proposal) focus on different sustainability parameters and it is assumed to be achieved through participatory and community ownership approach. Capital investments, to be incurred under the project will have revenue generating options for its sustenance. The community infrastructures will be managed and maintained by the community, once they realise the benefits of the initiatives. For sustainability, the project will take two prong approach, i.e., sustenance of the process by the community, realising the benefits of adaptation measures and secondly, accessing resources from Government and other agencies, under different schemes / programme and managing / maintaining the project outcome and building upon it further.

90 | P a g e
Further, study reveals that long term sustainability of the watershed program can be achieved if there is improvement in the level of income of the beneficiaries. The dynamic model developed by the authors show that it is possible to achieve this if the watershed can generate a profit over its lifespan of the net present value. Study further emphasizes the importance of comprehensive approach of watershed development for its long term sustainability and significant impacts on the society14. Examining contextually, the proposed intervention will sustain for a longer period as it is going to benefit the target mass, both directly and indirectly, supporting them enhancing their income. Apart from that, as the strategy to be adopted is comprehensive and integrated, it can be safely said that project will sustain after its life. However, sustainability parameters of the project and key elements that would contribute towards sustainability of project outcomes are discussed below.
Environmental Sustainability Environment of the watershed will gain from this intervention due to several environmental protection measures for developing resilience and adaptation to climate variability. The soil health will improve through application of organic manure, which is a key input for maintaining plant nutrient. Carbon sequestration through agro-forestry models will have positive impact and sustainable source of eco-system service for the community. So, its management and maintenance will be done by the community. The water harvesting structures, percolation tanks, sunken ponds etc. will help not only to arrest run off and minimise water loss, but also will main the soil moisture regime and hence reducing plant morbidity and mortality. With better harvest, even during dry spells, return on investment will be higher for the farmers and hence asset maintenance will continue. Agri-horticulture will add value, having both environmental and economic benefit for the target mass. The project activities will prepare the watershed area to be better resilient and adaptive to the extremes of climate change. Here the adaptation activities will not only result in better water availability and ground water recharge, it will also concentrate on sustainable water use in the form of micro irrigation, community based irrigation management etc. With optimisation of available water utility through scientific water management practices and increment in ground water level, it is expected that in due course, water availability in the area will increase substantially, benefitting to the local environmental concerns. Agro-forestry will help to minimise community dependency on the local forest and support long term eco-system services. The traditional watersheds only look at current Soil Water Management (SWM) measures. The climate forecast data obtained by setting up Automatic Weather Station and crop advisory based on the weather data, will be integrated in the design parameters so that the watershed remains resilient in aggravated climate scenario. Social &Institutional Sustainability Social and Institutional sustainability, revolves around the community living in the watershed and their institutions / organisations. From the inception of the project, these communities have been involved, even in the design stage, as discussed earlier. As the project aims at building the institutional / organisational capacity to adapt to the climate change situation and ensures their involvement in different stages of implementation, it can be assumed that the initiated process will be continued by the communities. Apart from this, for institutional sustainability, there will be resource generation and management strategies which will help the institutions to grow in the longer run and sustain the process.
14G. Kausik, B. Anindya, G.S.Prasanna, G.Abrita; Sustainability of Watersheds in India: A Dynamic Analysis
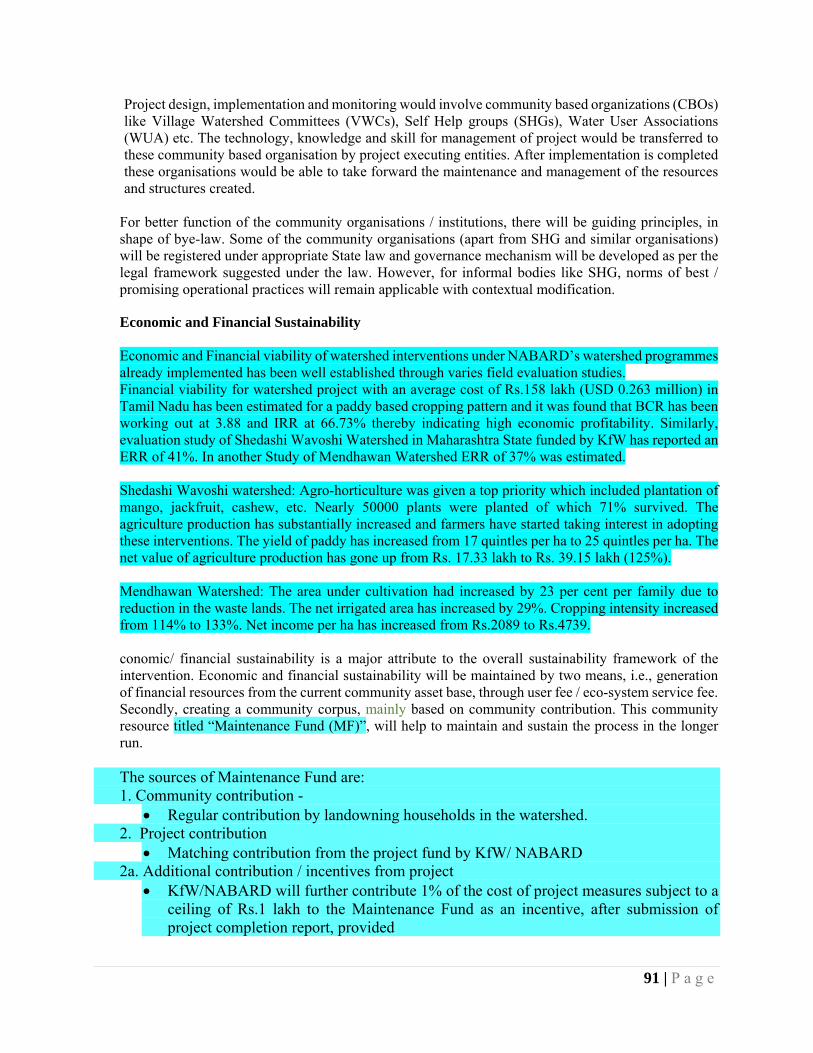
91 | P a g e
Project design, implementation and monitoring would involve community based organizations (CBOs) like Village Watershed Committees (VWCs), Self Help groups (SHGs), Water User Associations (WUA) etc. The technology, knowledge and skill for management of project would be transferred to these community based organisation by project executing entities. After implementation is completed these organisations would be able to take forward the maintenance and management of the resources and structures created.
For better function of the community organisations / institutions, there will be guiding principles, in shape of bye-law. Some of the community organisations (apart from SHG and similar organisations) will be registered under appropriate State law and governance mechanism will be developed as per the legal framework suggested under the law. However, for informal bodies like SHG, norms of best / promising operational practices will remain applicable with contextual modification.
Economic and Financial Sustainability Economic and Financial viability of watershed interventions under NABARD’s watershed programmes already implemented has been well established through varies field evaluation studies. Financial viability for watershed project with an average cost of Rs.158 lakh (USD 0.263 million) in Tamil Nadu has been estimated for a paddy based cropping pattern and it was found that BCR has been working out at 3.88 and IRR at 66.73% thereby indicating high economic profitability. Similarly, evaluation study of Shedashi Wavoshi Watershed in Maharashtra State funded by KfW has reported an ERR of 41%. In another Study of Mendhawan Watershed ERR of 37% was estimated. Shedashi Wavoshi watershed: Agro-horticulture was given a top priority which included plantation of mango, jackfruit, cashew, etc. Nearly 50000 plants were planted of which 71% survived. The agriculture production has substantially increased and farmers have started taking interest in adopting these interventions. The yield of paddy has increased from 17 quintles per ha to 25 quintles per ha. The net value of agriculture production has gone up from Rs. 17.33 lakh to Rs. 39.15 lakh (125%). Mendhawan Watershed: The area under cultivation had increased by 23 per cent per family due to reduction in the waste lands. The net irrigated area has increased by 29%. Cropping intensity increased from 114% to 133%. Net income per ha has increased from Rs.2089 to Rs.4739. conomic/ financial sustainability is a major attribute to the overall sustainability framework of the intervention. Economic and financial sustainability will be maintained by two means, i.e., generation of financial resources from the current community asset base, through user fee / eco-system service fee. Secondly, creating a community corpus, mainly based on community contribution. This community resource titled “Maintenance Fund (MF)”, will help to maintain and sustain the process in the longer run. The sources of Maintenance Fund are: 1. Community contribution -
Regular contribution by landowning households in the watershed. 2. Project contribution
Matching contribution from the project fund by KfW/ NABARD 2a. Additional contribution / incentives from project
KfW/NABARD will further contribute 1% of the cost of project measures subject to a ceiling of Rs.1 lakh to the Maintenance Fund as an incentive, after submission of project completion report, provided

92 | P a g e
▪ project measures are successfully completed within time limit as per sanction and
▪ entire amount of sanctioned Maintenance Fund is released to the VWC. 3. Other receipts
Accrued interest (net of bank charges, if any) in the project measures account maintained by VWC shall be passed on to Maintenance Fund account on 31 March of every year.
Returns/proceeds from community assets and/or economic activities by VWC like ▪ fodder cutting charges, ▪ auction of grass/ fruits in common land, ▪ water uses charges, ▪ membership fee from Federation, etc.
Fine and other charges on breach of social discipline like grazing in protected area. Other contributions.
The identified families would continue to contribute annual contribution to the Maintenance Fund after project completion till such period that the corpus becomes substantial for its effective usage. The community looks after collection and utilization of the fund.
The maintenance fund is maintained as a corpus and is utilized as below:
(i) Up to 50 percent of the accumulated MF can be drawn for lending to the watershed community through SHGs/Federation.
(ii) Rest of the accumulated fund is kept in fixed deposit in the bank/ Post Office.
(iii) Only the net interest accrual on the deposits shall be drawn for maintenance purpose so that the corpus is maintained.
The Village Watershed Committee (VWC) consists of persons nominated by a consensus, by the Gram Sabha attended by all adult members of the village, representing all the sections in the village and also the different geographical areas. It should have due representation of women (minimum, 30%). This body actually “owns” the project and is responsible for the planning, implementation, monitoring and maintenance of the project.
Village Watershed Community (VWC) is the main Community Based Organisation (CBO) involved in maintenance and management of the project along with EE..Right from identification of the watershed, capacity of the VWC is built by NABARD through exposure visit, series of structured capacity building programmes aimed at provision of technical inputs, management inputs, accounts related inputs, etc. A well laid down training module is in place for this purpose. This mechanism of built in arrangement for maintenance coupled with VWC empowered in undertaking post watershed activities is expected to sustain the project activities over a longer period of time. The cost of project measures sanctioned would be credited by NABARD directly to the bank account
of VWC jointly operated by PFA and VWC. VWC discusses issues related to project implementation during its periodic meetings All payments for project implementation are made with due endorsement by the VWC. Prescribed registers and records are maintained by the VWC for all the financial transactions. Annual audit of the VWC account is done through certified auditors.

93 | P a g e
The project will actively involve local level organisations, including PRIs, for implementation. The PRIs, line departments and other developmental partners will play important role in convergence of their developmental activities with the proposed activities during/ post-project for better sustenance. Policies and governance arrangement will be developed for fund generation and its management, in line with the statutory norms of the Government. The financial management practices will be in line with the rules that are applicable for registered bodies. The office bearers of community organisations will be trained / oriented on such aspects so that they can discharge their responsibility efficiently. Scope for Replication and Scaling up The biggest up scaling platform of at the level of government of India is the Integrated Watershed Management Programme (IWMP). The IWMP programme also works under the similar guidelines and thus will be the most plausible next step for up scaling. As may be seen from there the community based institutions will be empowered taking forward the benefits achieved during the project period in a sustainable manner.
K. Provide an overview of the environmental and social impacts and risks identified as being relevant to the project / programme.
Table 21: E&S Risk assessment as per ESP of AF
Checklist of environmental and
social principles
Adherence of the Project to Environmental and Social Principles
Potential impacts and risks – further assessment and
management required for compliance
Compliance with the Law
The project complies with Environment (Protection) Act, 1986 and Forest Conservation Act, 1980.
Further the project complies with state specific Panchayat Raj and Gram Swaraj Act (local governance); and other administrative orders of Subnational Government.
Further fallowing land tenancy laws are also complied with
o Tamil Nadu Cultivating Tenants Protection Act, 1955 – tenural rights are assigned to the cultivating tenants based on tenancy agreement entered with land lord in the prescribed form. Names of the tenant farmers are recorded in the revenue records along with the name of land lord. The state government also enacted Rent Relief Act 1990, providing relief to the cultivating tenants in the event of natural calamities.
o Land Tenancy Act Rajasthan: provision for long term tenure/ lease period upto 30 years.
No further assessment required for compliance
None

94 | P a g e
Access and Equity The project provides fair and equitable access to the project beneficiaries and will not be impeding access to any of the other requirements like health clean water, sanitation, energy, education, housing, safe and decent working conditions and land rights.
The proportion of benefits that will flow to each category of landholder will be determined in consultation with the Village Watershed Committees.
In order to address any issues related to access and equity in terms of selection of sites for creation of structure during implements, the selection of sites would be done through VWC sub-committee on Environment.
No further assessment required for compliance
None
Marginalized and Vulnerable Groups
The Technical assessment and Baseline and Project Benefit Assessment includes identification of impact on marginalised groups. Project activities are so designed that marginal and landless would also derive benefits from the proposed projects. Their participation has been ensured for selection of project interventions and beneficiaries for livelihood activities. No further assessment required for compliance
Low to None
Human Rights The project does not foresee any violation of human rights No further assessment required for compliance
None
Gender Equity and Women’s Empowerment
Project would ensure participation by women fully and equitably, receive comparable socio-economic benefits and that they do not suffer adverse effect. The beneficiary related activities, e.g. training, exposure visits, will include women so as to enable them to develop their capacities and strengthen their skill base. In addition the Village Watershed Committees (VWCs) that will be formed will have representation of women so that they also participate in the project related decision making process. Consultative process during project development had participation of 34% of women members and their concerns are taken into consideration for design interventions. The interventions planned would have positive impact on women empowerment and would ensure gender equity due to certain livelihoods such as kichen garden, nurseries for forestry / horticulture species, seed bank etc. are designed for implementation with women self help groups (SHGs). No further assessment required for compliance
None
Core Labour Rights Payments to labour under the project will be made as per Government approved norms duly following minimum wage rate and hence ensuring core labour rights. No further assessment required for compliance
None

95 | P a g e
Indigenous Peoples Not applicable to this project No further assessment required for compliance
None
Involuntary Resettlement
The project does not displace any community and hence issue of resettlement does not arise. Selection of the sites for interventions have been done on participatory basis/ net planning. The sights which are likely to have any impact on involuntary settlement or impact of access to livelihood, those sites have not been selected. No further assessment required for compliance
None
Protection of Natural Habitats
Project does not affect any of the natural habitats. No further assessment required for compliance
None
Conservation of Biological Diversity
The project would not cause any impact on bio-diversity values. No further assessment required for compliance
None
Climate Change The project is basically for enhancing the adaptive capacity of the rainfed farming systems and livelihoods against adverse impact of climate change and is not expected to contribute to GHG emissions. No further assessment required for compliance
None
Pollution Prevention and Resource Efficiency
Project is not expected to create any environmental pollution and aims for higher resources efficiency for better management of available natural resources like water, soil, plantation species (locally available), etc. Any pollution due to plastic bags used for carrying saplings, components of micro irrigation system, waste from LDPE etc. would be addressed and safe disposal mechanism would be created during project implementation. No further assessment required for compliance
None to low
Public Health No adverse impact on public health related issues is envisaged. No further assessment required for compliance
None
Physical and Cultural Heritage
No adverse impact on cultural heritage related issues is identified. No further assessment required for compliance
None
Lands and Soil Conservation
Catchment area treatment is envisaged to help in land and soil conservation and will not create any damage to land & soil resources. No further assessment required for compliance
None
The suggested measures are time tested, contribute to enrich the environment and help to improve the socio-economic condition of people living in the project area. Project dimensions contribute towards environmental promotion, restoration and improving overall ecosystem services in the watershed. Apart from that, in social front, it collectivise the operation, making it participatory and community oriented.

96 | P a g e
Promotion and strengthening of people’s institutions / organisation will help to improve responsibility sharing, collective action and taking up common issues in the watershed for its mitigation. So, in social front, it will help in community building and safeguarding / promoting community environment. As the project will be implemented in a rainfed semi-arid condition, risk of climate variability and its impact is always there during the project period. Since majority of interventions are localised and likely to pose no environmental and social risks. Therefore the project is classified as category C project. However, since the project interventions are mainly aimed at livelihood interventions of large number of population and considering its likely impact on ESS parameters such as access and equity, marginalized and vulnerable groups, gender equity & women’s empowerment, pollution prevention, etc. would be tracked during the project implementation also. In view of the same a Environmental & Social Management Plan (ESMP) is proposed and given in the Annexure 4.

97 | P a g e
PART III: IMPLEMENTATION ARRANGEMENTS
A. Adequacy of project / programme management arrangements.
For this project, National Bank for Agriculture and Rural Development (NABARD)will be the implementing entity (NIE) and would not function as Executing Entity (EE). For the execution of the project, NIE has identified EEs in each proposed State who have required experience and expertise in watershed management and climate change adaptation. The identified EEs have years of experience in watershed management and actively involved in participatory community development process in their respective operational States. NABARD has identified the EEs through rigorous institutional appraisal system. NABARD as NIE will oversee the implementation of the additional climate proofing measures under the programme. Required technical support and guidance to the EEs will be provided by the NIE for qualitative execution of the project in order to realize adaptation and resilience objective.
The arrangement for collaboration and project execution is driven by the use of existing institutions / organisations and their experience and capabilities. As per the project management arrangement, the ground level project implementation will be taken up by the NGO partners, identified by NABARD based on pre-defined selection criteria.The Executing Entities will be supported by a dedicated Project Management Unit (PMU),established at the concerned NABARD Regional Offices at the State level (one in Rajasthan and one in Tamil Nadu). The PMUs will be staffed with technical and managerial human resources from different disciplines, i.e., NRM, agriculture, engineering, project management, social development and finance. The implementation will be

98 | P a g e
guided by a Steering Committee consisting of Heads of respective NABARD Regional Offices, Development Policy Department of NABARD Head Office, experts in climate change adaptation and civil society representatives.
Role of NABARD as NIE: NABARD will bear full responsibility for the overall management of the project, and will bear all financial,
monitoring, and reporting responsibilities to the Adaptation Fund. NABARD would be involved in periodic
monitoring (on-site and off-site) of the project. Periodicity and structure of monitoring is given below:
1. On-site detailed round of monitoring would be done on a quarterly basis by Programme Monitoring
Units (PMUs), located at Udaipur (Rajasthan) a Madurai (Tamil Nadu).
2. In addition, six monthly basis monitoring would be done by NABARD Regional Offices (Rajasthan
and Tamil Nadu). The frequency of monitoring would be increased if considered necessary
3. The Project Sanctioning Committee (PSC) as constituted under WDF and IGWDP would function
as State Level Review Committee (SLRC) for guidance and review of implementation of projects
at State Level. The PSC will have State Government representatives from Agriculture/Horticulture

99 | P a g e
Department, Dept of Rural Development, State Level Nodal Agency (SLNA) for watershed, etc.,
and would convene meetings on half-yearly basis.
4. Quarterly report submission formats would be designed for submission by executing entities for
desk appraisal of progress. This will be structured as a part of the off-site monitoring surveillance
system and would be designed to generate warning signals, if any
5. Progress reporting would be done to AFB each half year or more frequently as per the requirement
of AFB
Role of Executing Entities Executing Entities shall ensure that
1. The works are executed in accordance with the sanctioned project document and other conditions
stipulated at the time of sanction or from time to time by NABARD.
2. The Village Watershed Committee (VWC) and the EE shall be jointly responsible for satisfactory work
execution.
3. The EEs shall maintain competent technical staff for project implementation.
4. The VWC will obtain in writing the concurrence and agreement of all parties on whose lands the
treatments or any conservation measures are to be undertaken according to the work plan.
5. The VWC shall review the progress of work at least once every month in a formal meeting convened
for that purpose.
6. At least once every quarter the VWC shall present to the entire Gram Sabha convened for the purpose a
report on the progress of work as well as utilisation of funds.
7. The VWC and the EE shall be jointly responsible for maintenance of all records relating to the watershed
development project.
8. The EE/VWC is also required to collect, maintain and furnish specific information for the purpose of
monitoring the impact of various project measures on the cropping pattern, ground water recharge and its
use, survival of sapling planted etc. in the watershed.
The line departments, like Animal husbandry, Agriculture, Forest, etc. are involved at local level for convergence of activities like Animal health camps, seed distribution, saplings, afforestation, etc. Panchayati Raj institutions are also involved in convergence of different developmental schemes like MGNREGA for land development. The Tamilnadu Watershed Development Agency (TAWDEVA),nodal agency in the State for watersheds, provides technical inputs during implementation stage and are involved in regular monitoring and review.

100 | P a g e
NABARD and EEs have already established linkages with scientific institutions like Krishi Vigyan Kendra (KVK), Agriculture University, College of Veterinary and Animal sciences, etc. that would be involved in technology transfer, training and extension activities. Involvement of private sector with the project beneficiaries will mostly be limited as supplier of goods and services such as fertilisers, seeds, seedlings, etc. Private sector Technical Service Provider lie Reuter Market Light (RML) will be involved in analysis of the weather data and provision of crop-weather advisories to the community in the project area. B. Measures for financial and project / programme risk management.
During the project selection and assessment stage, utmost care was taken to map the associated risk to the project (inception to exit) at different stages. Some specific geographical area related risks, which were expected to affect the project, were excluded and areas that are suitable for implementation (geographically and socio-politically) were selected. Interest of the community, their aspirations and need of the project in that locality were also mapped so that project deliver in a requisite manner. With due consultation with different stakeholders and based on the experience of the NIE and EEs, associated risks to the project can be categorized in to (1) risk from within and (2) risk from external sources Risk from Within: Internal risk can be assumed from (1) capacity gap, (2) poor internal project management, (3) inadequate project progress tracking and (4) lack of mid-course correction. As the project will be executed by the expert agencies with the support and guidance of NIE, capacity related risks to the project is negated. Apart from this, there will be trained and experienced human resources from different disciplines will be associated in project execution, at EE level. So, capacity related issues will not be observed during execution. To strengthen the internal management and support system, three tier project monitoring and supervision structure is proposed, i.e., at the VWC level, at the PMU level and at PSC level. VWC will review the progress on a monthly basis and report to the Gram Sabha on a quarterly basis. While PMU will take stock of the project output at quarterly basis, PSC, with high level technical expertise will keep an eye on project direction, outcome of the intervention and critical gaps. From time to time, steering committee members will review and take necessary corrective measures. Thirdly, project progress will be tracked at three different levels, i.e. at the EE level, at the PMU level and also at the PSC level. Any deviation from the plan will be identified and corrective measures will be initiated on immediate basis. All these efforts will help to keep the project on track and do the required mid-course correction for achieving the suggested outcomes. Risk from External: External risk to the project assumed to be basically from the socio-political situation in the intervention area and Government policies. At present, Government policies are favourable to such interventions and expected to continue for a longer period due to national and international obligations. As watershed as a medium for promotion of resilience and adaptation is well recognized by both State and central Government, proposed project will able to harness the benefit of the current policy and likelihood of its change, affecting the initiative can be overruled. Looking at current socio-political situation of the intervention area, major changes are not expected due to stable Government in both the State, pro-poor initiatives of both State and central Government, high focus on climate change and promotion of development agenda. So, Socio-political situation is expected to be favourable to the project and will become more suitable when results of the project become visible. At the design stage, project has controlled the “scope” and “schedule” related risk whereas resource related risk seems a less possibility due to the expected support of Adaptation Fund Board. If any such resource related risks appears during the implementation like funds flow, adequacy of funds for the planned activities etc., it will be taken up at the NIE level and if required, support of AFB

101 | P a g e
will be sought. At the design stage of the project, measures taken to manage the expected “constraints” related risk through exploring opportunities (Government schemes, credit support from bank, etc.), framing realizable objective and related outcome, removal of cost intensive and low output activities, identifying feasible alternatives wherever it is required etc. The concerned State Government department has expressed its interest and commitment for this project as a pilot programme for adaptation to climate change. There are however political, institutional and technical risks associated with the implementation of the project at a very low degree. The assessed risks at this stage is based on the assumptions of different stakeholders associated in designing of this project, careful analysis of the socio-political environment of the project area and based on existing policies of State and central Government. Some of the major perceived risks and mitigation strategies are as given under.
Table 22: Level of Risk and Mitigation Strategy Risk Level Mitigation Strategy
Lack of adequate human capital and skills at implementers level
Low Sensitization and capacity building at various levels of implementation
Adequacy of funding support to the suggested additional measures
Low Expected funding from Adaptation Fund Board would meet the requirement.
Unforeseen events that affect the crops like locust and extreme weather which could not be forecasted.
Medium Risk mapping with in the project boundaries using the various climate scenarios to cover all contingencies.
Lack of coordination and consultation among the project partners
Low Information and Knowledge management and periodic stakeholder interactions and feedback mechanism. The proposed PMU will act as connecting hub and coordinate with the partners as well as with the NIE.
Implementation delays Low Intensive monitoring mechanism and mid-term evaluation missions
C. Describe the measures for environmental and social risk management, in line with the
Environmental and Social Policy of the Adaptation Fund.
The proposed project area, in both the State, share certain common characters of varied degree like, fragile and degraded environment, dry land cropping system with low resilience to climate variability, poor adaptive capacity, high incidence of poverty and lack of water resources. Farmers with small and marginal holding continue to remain vulnerable to climate and other risks in these areas. In Rajasthan, agriculture is declining andin Tamil Nadu, agricultural growth has come to a stage of stagnation. Situation in both the states is basically related to availability of low water resource and impact of climate variability in more recent decades. In agreement with other dryland areas, adaptation strategies and interventions are vital to improve productivity, sustain income, reduce vulnerability, minimise rural poverty and improve resilience. The project, with the discussed scope, will promote better understanding of the root causes of the problems and ways to address it. It will support in the promotion of recommended scientific practices and adaptation strategies/ approaches, based on the findings of agricultural research institutions. In addition, learning from other national and international research and implementation initiatives, work of international agricultural research institutions, such as the International Crop Research Institute for

102 | P a g e
the Semi-Arid Tropics (ICRISAT), and other research groups doing local adaptive work (e.g. NGOs, private sector, and other initiatives, including those of NABARD and GIZ), will be promoted. With regards to environmental and social impacts and risks and ways to mitigate and manage these, preliminary work has been done by the NIE and its partner agencies. In Tamil Nadu a random sample of 80 farmers/landless villagers have been interviewed through participatory rural appraisal techniques. In Rajasthan key informants and 25 other farmers have been similarly interviewed. As indicated under Stakeholder consultation in the proposed project area (Part II- H): “In the proposed project area, a series of consultations with farmers and landless persons have been carried out for understanding the problems of degradation of natural resources, low productivity of crops, issues connected with livelihood and to arrive at appropriate treatment measures. During the above consultation, climate change related issues affecting the community also discussed at length. On the basis of these information detailed projects report is formulated. As indicated under section 1.4: Climate Change Adaptation in Watersheds: NABARD has supported 16 states with watershed development interventions, implemented through state governments, voluntary agencies/corporate entities. These have focused on resource poor areas, vulnerable groups and have sought to introduce mitigation measures to adjust to climate change. These pilot projects have provided considerable experience in how best to implement a successful project, the expected timing and sequencing of actions, cost and technical norms, and the expected benefits. This experience has also provided us with good understanding of the complexity of working with marginal and vulnerable people, including those from ethnic minority groups, landless groups, and others with marginal capacity to participate in rural life or to take up new opportunities. On the basis of this experience it is now proposed, through the project, to upscale to an area of about 25,000 ha, in 20 watersheds, 10 each in Tamil Nadu and Rajasthan. As per the potential impact and risks with reference to Environmental and Social Policy (November 2013) of the Adaptation Fund Board, the project is categorized as “Category C” with no adverse Environmental or Social Impacts. Project strategy for risk management in line with the environment and social policy is discussed in Table 20.
Table 23: Risk Management in line with the Environmental and Social Policy
Environmental and Social Principles Compliance Measures
Compliance with the Law The project is in compliance with major domestic environmental law / policies / rules like (1) National Forest Policy-1988, (2) The Environment (Protection) Act, 1986 and Rules, 1986, (3) The Forest (Conservation) Act, 1980 and Rules, 1981. Further the project activities are in compliance with state specific Panchayat Raj and Gram Swaraj Act (local governance); land tenancy laws and other administrative orders of Subnational Government. Since the project interventions are localized and applicability of compliance requirement is minimal. However, the watershed community would be sensitized about legal provision under these laws/ policies applicable at national / sub-national level.
Access and Equity By design, the project is inclusive in nature and meant to minimize the misery of vulnerable segments and improve their adaptive capacity. Inclusive strategy of the project will ensure fair and equitable access to benefits. Going by the nature of the project, its scope to impede basic services is remote. Rather, the project will facilitate in improving basic services, through collaboration and convergence, like health care, provision of clean water and sanitation, energy, education, housing, safe and decent working conditions, and land rights. The project measures are selected through community consultation and process called net planning. Under net planning even though interventions are localized each location is visited by village watershed committee (VWC) consisting of

103 | P a g e
watershed dwellers and location of the proposed treatment measure is selected at the field level through consultation and input from technical personnels / engineers. The process ensures participation of marginalized community also and eliminates any likely issues arising related to access and equity.
Marginalised and Vulnerable Groups Impact of the project on marginalised and vulnerable segment is assessed and observed that this project will create a scope for their upliftment. The project looks at participatory approach of implementation rather than any imposition on any segment of the population. The project is planned to benefit the disadvantage section more by involving them in the process. The beneficiaries selection process aimed at the addressing the concerns of marginalized and vulnerable groups. The consultation process (participatory rural appraisal) had representation from marginal and vulnerable groups such as women (34%), landless (15%) and Scheduled Caste (12.3%) and Scheduled Tribes (15.74).
Human Rights The project does not affect the life and liberty of any individual or group. Neither does the project discriminate against any particular community or group or persons on grounds of gender, caste, ethnicity, ability or birth. The project upholds the fulfilment of the human rights of the villages and the target groups that it seeks to work with. The project does not violate any of the basic human rights that are available to all human beings. The entire process is planned as participatory and voluntary in nature. This is expected to result in to informed participation of community members in to program implementation
Gender Equity and Women Empowerment Project has special focus on women empowerment and certain activities are directed towards social and economic empowerment of women. The project activities proposed under the project aims at improving the livelihood and income security specifically for women in the watershed areas. Water conservations measures, increased fodder availability, plantation of forestry species, etc. would help in women empowerment in a positive way. Further vegetable cultivation, kitchen garden, seed bank initiatives would be mainly women centric and would help in food and nutritional security.
Core labour Rights The labour rights in the context of the project include: determination of work and adherence to minimum and time payment of wages; hours of work and their timing based on season; rest and worksite facilities; participation in planning; avoidance of child labour; and grievance & redressal system. The project will work within the framework of the labour laws that are applicable to any site that employs casual labour. The record of work done for each labour engaged will be maintained and the wages will be paid. The hours of work and the timing of the working hours will be determined in consultation with the labour and the prevailing practices in the area. Positive discrimination in favour of women will be used to provide fair and equal opportunity to women who seek employment as labour and gain from the wages earned by her. All forms of negative discrimination in respect of employment and occupation will be eliminated Project will not engage child labour in any of its activities and all forms of forced or compulsory labour will be eliminated.
Indigenous People Current project is consistence with applicable international and national instruments and looks at benefiting the indigenous people through project inputs.
Involuntary Settlement The project activities will be undertaken at the level of household and community level. The activities proposed these activities will improve the economic condition of household in watershed areas and build climate resilience and thereby arresting the need for relocation on economical or livelihood reasons.

104 | P a g e
The criteria for selection of sites for individual interventions included the fact that in case there is any possibility or likelihood of involuntary resettlement due to project activities that particular site will not be selected.
Protection of Natural Habitats Objectively, project looks at restoration and promotion of natural habitats as a strategy for greater resilience and adaptation capacity.
Conservation of Biological Diversity Conservation of biological diversity is an integral part of the project. Only the tested and approved species will be promoted under alternative / mixed cropping system. Project will not introduce any known invasive species.
Climate Change Project is for improving climate resilience and building adaptive capacity of the community. The suggested measures under the project will minimize greenhouse gas emission in the longer run. None of the project activities will lead to significant increase in greenhouse gas emission or other drivers of climate change.
Pollution Prevention and Resource Efficiency
Proposed adaptation measures are environmental friendly and release of pollutant is having limited or no scope in the project. For construction related activities, material resource use is also limited and project is not energy intensive. Procurement of saplings of fodder/fruit trees in plastic bag may generate some amount of plastic wastes. Although, quantities of such wastes are minimal, proper disposal mechanisms of these non-degradable wastes will be incorporated as part of project strategy.
Public Health Project is not having any negative impact on public health Physical and Cultural Heritage Because of the project, physical cultural heritage / resources at the community
level is not going to be affected. Land and Soil Conservation Proposed project is having ample scope of promoting land and soil conservation
as it will be a major part of the overall intervention framework. Environmental and Social Policy Delivery ProcessScreening of Environmental and Social Risks by the Implementing Entity
The proposed project is screened and potential environmental and social risk is not identified, rather project will improve the environmental condition of the locality. Based on the screening, the project is ranked to be of “Category C”.
Environmental and Social Assessment The proposed project does not have the potential to cause environmental or social harm, rather it will support in improving the current environmental and social status. The project is of “Category C” and hence, environmental and social assessment and related management plan may not be a prerequisite.
Environmental and Social Management Plan
Current environmental and social assessment does not identify any environmental or social risks at impactable level. The project is of “Category C”. In order to address any issues related to E&S risk likely to arise at implementation stage ESMP has been prepared and given in the Appendix.
Monitoring, Reporting and Evaluation The monitoring framework will have scope for measuring key environmental and social indicators, in terms of both qualitative and quantitative for measurement of outcomes and reporting. The reduction in the identified social and environmental risk (though such risks found not prevailing at present), identified during implementation, will also be mapped. Apart from physical and financial achievements, progress in addressing environmental and social management plan will also be captured in the monitoring system and reported. Apart from regular monitoring, mid-term and terminal evaluation will also evaluate the project performance with respect to environmental and social risks. Reporting mechanism is presented as part of ESMP document. The document also include Public Disclosure and Grievance Mechanism
D. Monitoring and evaluation arrangements including budgeted M&E plan.
The project has been designed based on the standard result framework and indicators have been identified. It would introduce a monitoring, evaluation and knowledge management system to facilitate compilation and dissemination of relevant project knowledge about issues, experiences and insights to all stakeholders.

105 | P a g e
The project would introduce vulnerable group specific disaggregated system of data collection and reporting for each project component, based on the requirement of AFB. The monitoring system would be designed to meet the requirement of capturing implementation progress against planned targets as set out in the Annual Work Plan and Budget (AWPBs).The monitoring system will periodically look in to (1) quality of inputs, (2) adequacy of the inputs, (3) physical progress of activities, (4) financial achievement, (5) project outputs, (6) project outcomes etc. Overall, the monitoring and evaluation frame of the project will examine the formative aspect (process monitoring) and summative aspects (impact monitoring) of the project.
The Monitoring and Evaluation of the project and knowledge management component would be the responsibility of the Project Management Unit (PMU) and Regional Offices of NABARD. The results-based approach will be adopted, involving regular recording of, and accounting for progress against AWPB targets; and routine, periodic assessments of movement towards impact. The same would be achieved through on-site and off-site monitoring by a dedicated team. Three tier project monitoring and supervision structure is proposed, i.e., at the VWC level, at the PMU level and at PSC level. VWC will review the progress on a monthly basis and report to Gram Sabha on a quarterly basis. While PMU will take stock of the project output at quarterly basis, PSC, with high level technical expertise will keep an eye on project direction, outcome of the intervention and critical gaps. From time to time, steering committee members will review and take necessary corrective measures. Thirdly, project progress will be tracked at three different levels, i.e. at the EE level, at the PMU level and also at the PSC level. Any deviation from the plan will be identified and corrective measures will be initiated on immediate basis.
Budgeted M&E Plan: Budgeted M&E plan and indicators to be monitored in different period is presented in the Table 24.

106 | P a g e
Table 24: Budgeted M&E Plan of the Project
Monitoring and Evaluation Plan
Type of M&E Activity
Responsible Parties Budget (US$)does not include staff
time
Time Frame
Project Inception Workshop
EE/NIE 800 Within first three months
Half-yearly report EE/NIE 200 End of every six months
Annual report EE/NIE 200 End of each year
Project review & monitoring Meeting
Dept. of Govt /EE/NABARD 0 Monthly
End term evaluation External Evaluator/Representatives of MOE/ Dept. of Govt /
3,000 At end of Project cycle
Technical Consultants/
Project Director
Final Audit EE/NIE 400 3 months after end of the Project
Total Amount 4,600
Considering large number of EEs, it is proposed that the entire M& E cost of US $ 6,600 will be born out of the NIE cost as given in the break down budget of NIE indicated under table 30. E. Include a results framework for the project proposal, including milestones, targets and indicators. Table 25: Project Result Framework of activities supported by AFB
Outcome/O
utput Indicator Baseline Target Source of
Verification
Risks and Assumptio
ns Component 1: Improved soil and water regime for better crop productivity and resultant increase of income of small and marginal farmers Outcome 1: Soil and water regime improved and crop productivity enhanced
Livelihood vulnerability of percentage of farmers reduced through increased water availability
Farmers are vulnerable due to poor soil water regime and crop productivity
At least 60% farmers living in the project villages directly benefited from reduced vulnerability to climate change related impacts
Measurement Book Micro plans prepared by the VWCs Progress Report
Assumptions: VWC takes active interest in project execution Risks: Availability of the labour during the working

107 | P a g e
season due to competing demands
Output 1.1: Soil health improved through summer / deep ploughing,
Area covered under summer ploughing / deep tillage
Summer ploughing /deep ploughing not done
summer ploughing – 1607 ha; Deep ploughing – 966 ha
Measurement Book Progress Report
Farmers understand the importance and adopt the practice sustainably
Output 1.2: Increased water availability through farm pond, catch pit, well recharge pit and other water harvesting structures
Earthen Embankment with spill way Masonry Gabion, LDPE sheet lining Number of farm ponds/check dam/WHS constructed, desilting Number of catch pit, well recharge pit constructed
Poor soil moisture and less number of water harvesting structures
Earthen Embankment - 3 nos. Masonry Gabion- 1 nos. LDPE - 4 nos. 6 nos. of farm ponds; Check dam/ WHS – 4 nos; desilting – 1500 cum, 800 Nos. of catch pit & well recharge pit constructed Recharge Pit on upslope side 6300 cum and open recharge pit in drainage line – 2880 cum.
Measurement Book Progress Report
Farm pond and other WHS are constructed as per approved design
Component 2: Increased adaptation to climate change through climate resilient farming system approach and diversification of livelihoods; Outcome 2: Improved climate resilient farming system and increased livelihood security
Number of farmers adapted climate resilient farming system
Farmers are not following climate resilient farming systems
At least 50% farmers adopt climate resilient farming system
Progress report Surveys and interviews
Assumptions: Farmers willing to adopt climate resilient technologies

108 | P a g e
Risks: Lack of capacity and resources for adoption
Output 2.1: Increased availability of fodder/fuel through afforestation & pasture land development
Area covered under structures like Gradonis, refilling of CCT, crescent bund etc for regeneration of plants Number of tree seeding on bund, fodder/fuel trees planted, avenue plantation, pitting and tree seeding Use of water absorption material (near plants) Picher irrigation Thor fencing, stone fencing Pasture group and fodder bank
No systematic efforts in afforestation and pasture land development
7 ha of Gradonis, 17000 RM- refilling of CCT 11500 nos crescent bund etc. Tree seeding on bund – 9000 RM Tree plantation – 60 ha 25750 nos. of fodder/fuel trees planted 80000 pitting and tree seeding 162 ha covered under grass seeding -5000 nos. water absorption material Pitcher irrigation – 3000nos -Thor fencing – 11200, stone fencing renovation – 340 RM Plugging of stone wall fence 1000 nos. -10 nos of fodder banks established in Rajasthan
Progress report Surveys and interviews
Saplings of fodder/fuel trees and grass seeds are available in required quantity

109 | P a g e
Bund planting/tree seeding Fodder Development Korangad Development Nursery for forest species Green coverage (Glyceridia plantation) Azolla Development -Agro forestry in channel
-Bund plantation/castor seeding-10500RM Riparian buffer plantation -1000 plants -Fodder development /chaff cutter 1007nos Plantation in 2.8 ha area -1 nursery for forest plants -Glyrecidia plantation in 1121 units -589 units of Azolla -15000 castor seeding unit
Output 2.2: Improved resilience through adoption of climate resilient farming/livelihood systems
Wadi/Horti plantation Vegetable with trellis Kitchen garden RWHS for backyard plantation Well recharge Micro irrigation/UG pipe
Farming system not diversified and hence not resilient to climate change
-3820 wadi/horti plantation 66 units of Vegetable with trellis -1217 kitchen garden units 16 nos RWHS for backyard plantation -41 well recharge pit -170 units of set up under micro-irrigation
Progress report Surveys and interviews
Farmers’ willingness to diversify farming system Availability of vegetable seeds and other inputs

110 | P a g e
Seed bank Mixed cropping of Maize and Wheat Improved farm implements Best package of practices Silage making demo Improved AH practices Backyard Poultry Vermicomposting Area covered under Integrated Farming Systems/organic farming Tank silt replication
22 seed banks 105 units of Mixed cropping of Maize and Wheat 2 sets of farm implements 350 units Best package of practices 20 nos of Silage making demo
-. Livestock field school – 2 500 Artificial insemination 24 feed management units 2 programmes on improved animal husbandry practices 12 cattle shed, 50 large animal breed improvement programme 198 units of of backyard poultry 1693 no of vermicompost and organic farming unit 50 units of Integrated Farming Systems/ 447 ha covered under tank silt application 450 soil test kits
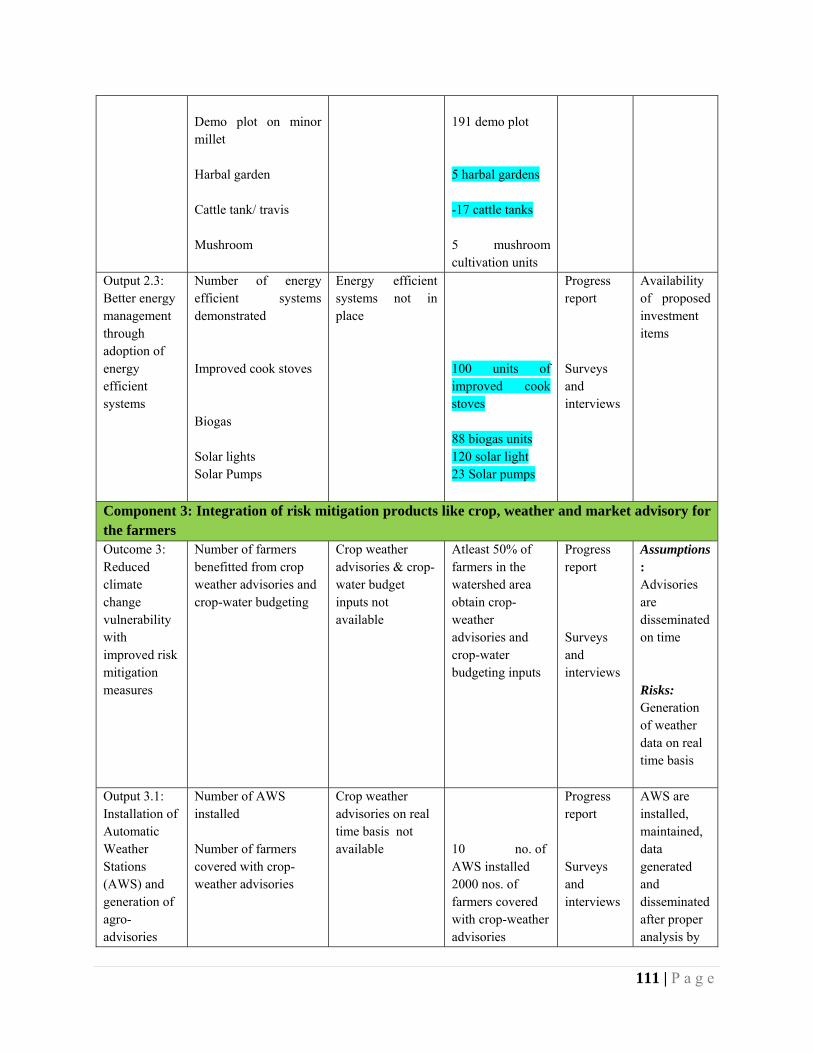
111 | P a g e
Demo plot on minor millet Harbal garden Cattle tank/ travis Mushroom
191 demo plot 5 harbal gardens -17 cattle tanks 5 mushroom cultivation units
Output 2.3: Better energy management through adoption of energy efficient systems
Number of energy efficient systems demonstrated Improved cook stoves Biogas Solar lights Solar Pumps
Energy efficient systems not in place
100 units of improved cook stoves 88 biogas units 120 solar light 23 Solar pumps
Progress report Surveys and interviews
Availability of proposed investment items
Component 3: Integration of risk mitigation products like crop, weather and market advisory for the farmers Outcome 3: Reduced climate change vulnerability with improved risk mitigation measures
Number of farmers benefitted from crop weather advisories and crop-water budgeting
Crop weather advisories & crop-water budget inputs not available
Atleast 50% of farmers in the watershed area obtain crop-weather advisories and crop-water budgeting inputs
Progress report Surveys and interviews
Assumptions: Advisories are disseminated on time Risks: Generation of weather data on real time basis
Output 3.1: Installation of Automatic Weather Stations (AWS) and generation of agro-advisories
Number of AWS installed Number of farmers covered with crop-weather advisories
Crop weather advisories on real time basis not available
10 no. of AWS installed 2000 nos. of farmers covered with crop-weather advisories
Progress report Surveys and interviews
AWS are installed, maintained, data generated and disseminated after proper analysis by

112 | P a g e
Sediment onservation units
4 sediment observation units
involving experts
Output 3.2: Geo-hydrological study and crop-water budgeting
Number of geo-hydrological studies undertaken Number of crop-water budgeting plan prepared
Crop-water budget plan not prepared
Geo-hydrological study and crop water budgeting undertaken in all the 20 watersheds
Progress report Study report/water budget plan
Instruments for measurement of run-off, soil moisture tension etc., are installed
Component 4:Creation of knowledge management system for climate proofing of watersheds Outcome 4: Project learning and created knowledge base benefitted similar ..projects implemented in other States
Number of reading kit/manual on climate proofing prepared Number of studies undertaken Number of awareness camps/sensitation programme conducted
No awareness material are available
Reading kit/manual on climate proofing are available for wider dissemination Awareness camps/sensitation programmes conducted for creating better awareness among stakeholders
Progress report Reports/ documents/short films
Assumptions: All material are of high quality, and accessible to stakeholders.
Risks:Inadequate participation
Output 4.1: Resource materials prepared for dissemination among various stakeholders
Number of reading kit/manual on climate proofing prepared Posters nad pamplets Number of audio-visual (short films) produced
No awareness material are available
22 no. of reading kit/manual on climate proofing prepared 20 nos of kits 20 nos. of audio-visual (short films) produced
Progress report Reports/ documents/short films
All documents are of high quality,
Output 4.2: Community and other stakeholders are sensitised about the programme
Number of sensitisation/awareness camps/capacity building programmes Exposure visits
No awareness/sensitization programmes conducted
62 nos. of sensitisation/awareness camps/capacity building programmes 36 exposure visits
Progress report Programme reports
All stakeholders participate In the programmes

113 | P a g e
Training on NRM/Cliamte change IEC activities Veternary camp/silage making/para extension workers Skill training Informations board Village knowledge centre
62 training programmmes 8 IEC programmes 9 camps 10 programmes 12 boards 1 Village knowledge centre
Output 4.3: Conduct of Grassland ecological study in Rajasthan
Number of studies undertaken
No study report available
12 Grass land ecology study under taken in Rajasthan
Study report
Study is undertaken by qualified person
Result framework of activities supported by NABARD is presented in table 26 Table 26: Project Result Framework of activities supported by NABARD
Outcome/Output
Indicator Baseline Target Source of Verificati
on
Risks and Assumptio
ns Component 1: Soil and Water Conservation for improvement of soil and water regime in the watershed area Outcome 1: Soil and water regime improved on account of soil & water conservation measures
Area covered with various soil and water conservation measures
High degree of soil erosion and poor interception of run-off water
At least 50% farmers living in the project villages directly benefited from soil and water conservation measures
Measurement Book Micro plans prepared by the VWCs Progress Report
Assumptions: VWC takes active interest in project execution Risks: Availability of the labour during the working season due

114 | P a g e
to competing demands
Output 1.1: Soil erosion reduced and in-situ moisture conservation improved through construction of field/stone/contourbund
Area covered under field/stone/contour bunds
Soil conservation works not undertaken
Field bund-8.94 lakh CuM Stone bund-0.35 lakh CuM Contour bund-0.88 lakh ha
Measurement Book Progress Report
Availability of stones locally for stone bund Availability of labour during the working season
Output 1.2: Increased water availability through farm pond, sunken pond and well recharge pit
Number/quantity of farm ponds/sunken pond/well recharge pits constructed
Less number of water harvesting structures and poor water availability
158 nos. of farm ponds 36 nos of sunken pond constructed 5715 CuM. of well recharge pit excavated
Measurement Book Progress Report
Farm pond and other WHS are constructed as per approved design
Output 1.3: Run-off water intercepted through construction of gabion, gully plug, stone outlet, waste weir, loose boulder structures, WAT, CCT, SCT & box trench
Number/quantity of gabion, gully plug, stone outlet, waste weir, loose boulder structures, WAT, CCT, SCT & box trench
Poor interception of overland flow and resultant soil loss due to heavy run-off
7 nos of gabion, 0.46 lakh CuM of gully plug, 6114 nos of stone outlet, 303 nos of waste weir & 67 nos of loose boulder structures 0.50 lakh CuM of WAT, 2.26 lakh CuM of CCT, 0.11 lakh M of SCT & 0.32 lakh CuM of box trench
Measurement Book Progress Report
Gabion, gully plug, stone outlet, waste weir, loose boulder structures, WAT, CCT, SCT & box trench are constructed as per approved design
Component 2: Productivity enhancement and diversification of agriculture;
Outcome 2: Improved productivity and diversified farming
Number of farmers adopted diversified farming system
Farmers are not following diversified farming systems
At least 50% farmers adopt diversified farming system
Progress report
Assumptions: Farmers willing to adopt
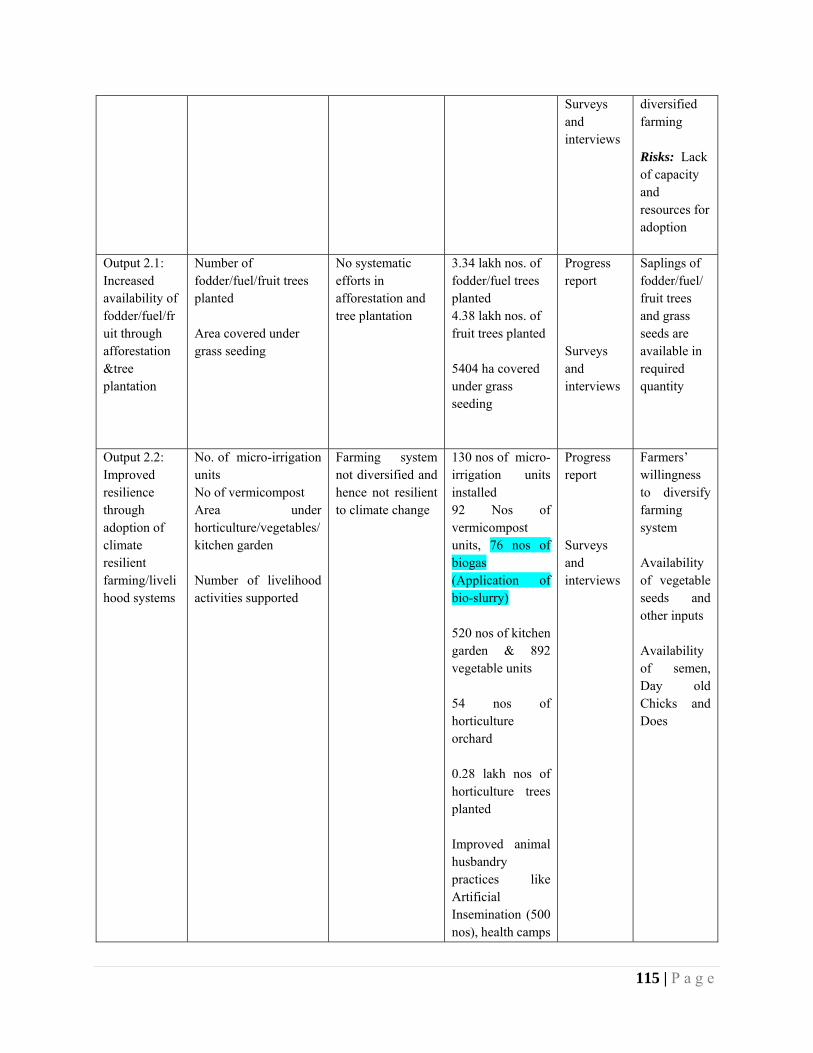
115 | P a g e
Surveys and interviews
diversified farming Risks: Lack of capacity and resources for adoption
Output 2.1: Increased availability of fodder/fuel/fruit through afforestation &tree plantation
Number of fodder/fuel/fruit trees planted Area covered under grass seeding
No systematic efforts in afforestation and tree plantation
3.34 lakh nos. of fodder/fuel trees planted 4.38 lakh nos. of fruit trees planted 5404 ha covered under grass seeding
Progress report Surveys and interviews
Saplings of fodder/fuel/ fruit trees and grass seeds are available in required quantity
Output 2.2: Improved resilience through adoption of climate resilient farming/livelihood systems
No. of micro-irrigation units No of vermicompost Area under horticulture/vegetables/kitchen garden Number of livelihood activities supported
Farming system not diversified and hence not resilient to climate change
130 nos of micro-irrigation units installed 92 Nos of vermicompost units, 76 nos of biogas (Application of bio-slurry) 520 nos of kitchen garden & 892 vegetable units 54 nos of horticulture orchard 0.28 lakh nos of horticulture trees planted Improved animal husbandry practices like Artificial Insemination (500 nos), health camps
Progress report Surveys and interviews
Farmers’ willingness to diversify farming system Availability of vegetable seeds and other inputs Availability of semen, Day old Chicks and Does

116 | P a g e
(62 nos), breeding (95 nos) Demonstration units of goatery (133 nos), poultry (585 nos), azolla (140 nos) & dairy (10 nos) 22 nos of solar pumps
Output 2.3: Better energy management through adoption of energy efficient systems
Number of energy efficient systems demonstrated
Energy efficient systems not in place
9 nos of biogas 350 nos of cook stoves 75 nos of solar panel 150 nos of smokeless challah
Progress report Surveys and interviews
Availability of proposed investment items
Component 3: Awareness and Capacity building on watershed management Outcome 3: Community and other stakeholdersbenefitted from training/capacity building/exposure programmes
Number of sensitisation/awareness camps/capacity building programmes/exposure visits
No awareness sensitization programmes conducted
Sensitation programmes/training/exposure visitsconducted for creating better awareness among stakeholders
Progress report Reports/ Documents/Photos
Assumptions:Resource persons available locally
Risks:Inadequate participation
Output 3.1: Community and other stakeholders are sensitised and their capacity built
Number of sensitisation/awareness camps/capacity building programmes/exposure visits
No awareness/sensitization programmes conducted
216 nos. of sensitisation/awareness for women development 74 nos exposure visits 177 nos training/ capacity building programmes
Progress report Programme reports
All stakeholders participate in the programmes
F. Demonstrate how the project / programme aligns with the Results Framework of the Adaptation Fund
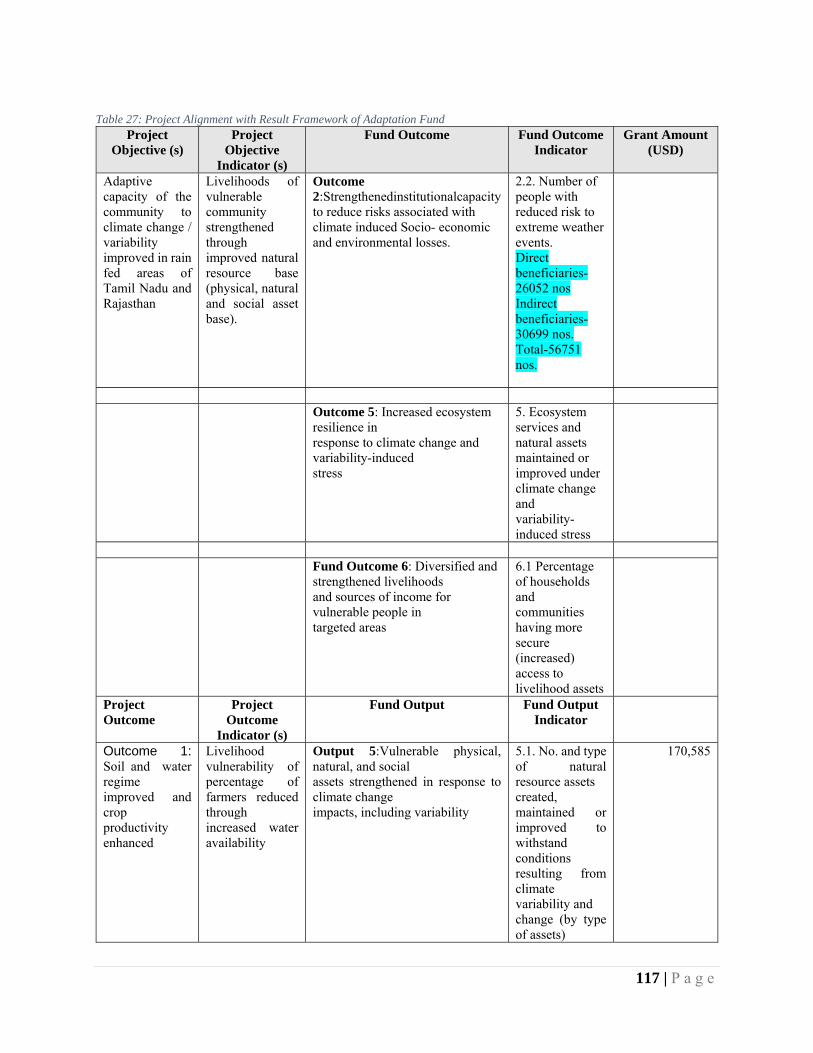
117 | P a g e
Table 27: Project Alignment with Result Framework of Adaptation Fund
Project Objective (s)
Project Objective
Indicator (s)
Fund Outcome Fund Outcome Indicator
Grant Amount (USD)
Adaptive capacity of the community to climate change / variability improved in rain fed areas of Tamil Nadu and Rajasthan
Livelihoods of vulnerable community strengthened through improved natural resource base (physical, natural and social asset base).
Outcome 2:Strengthenedinstitutionalcapacity to reduce risks associated with climate induced Socio- economic and environmental losses.
2.2. Number of people with reduced risk to extreme weather events. Direct beneficiaries-26052 nos Indirect beneficiaries-30699 nos. Total-56751 nos.
Outcome 5: Increased ecosystem
resilience in response to climate change and variability-induced stress
5. Ecosystem services and natural assets maintained or improved under climate change and variability-induced stress
Fund Outcome 6: Diversified and
strengthened livelihoods and sources of income for vulnerable people in targeted areas
6.1 Percentage of households and communities having more secure (increased) access to livelihood assets
Project Outcome
Project Outcome
Indicator (s)
Fund Output Fund Output Indicator
Outcome 1: Soil and water regime improved and crop productivity enhanced
Livelihood vulnerability of percentage of farmers reduced through increased water availability
Output 5:Vulnerable physical, natural, and social assets strengthened in response to climate change impacts, including variability
5.1. No. and type of natural resource assets created, maintained or improved to withstand conditions resulting from climate variability and change (by type of assets)
170,585

118 | P a g e
summer ploughing – 1607 ha; Deep ploughing – 966 ha Earthen Embankment - 3 nos. Masonry Gabion- 1 nos. LDPE - 4 nos. 6 nos. of farm ponds; Check dam/ WHS – 4 nos; desilting – 1500 cum, 800 Nos. of catch pit & well recharge pit constructed Recharge Pit on upslope side 6300 cum and open recharge pit in drainage line – 2880 cum
Output 6: Targeted individual and
community livelihood strategies strengthened in relation to climate change impacts, including variability
6.1.1.No. and type of adaptation assets (physical as well as knowledge) created in support of individual or community livelihood strategies
Outcome 2: Improved climate resilient farming system and increased
Number of farmers adapted climate resilient farming system
Output 6: Targeted individual and community livelihood strategies strengthened in relation to climate change impacts, including variability
6.1.2. Type of income sources for households Generated under climate change scenario.
673,670

119 | P a g e
livelihood security
-Agriculture -Agroforestry -Agro Horticulture -AH -Backyard poultry -Tree plantation Kitchen garden/vegetable garden
Outcome 3:Reduced climate change vulnerability with improved risk mitigation measures
Number of farmers benefitted from crop weather advisories and crop-water budgeting
Output 2.2: Targeted population groups covered by adequate risk reduction systems.
2.2.1. Percentage of population covered by adequate risk-reduction systems
195,917
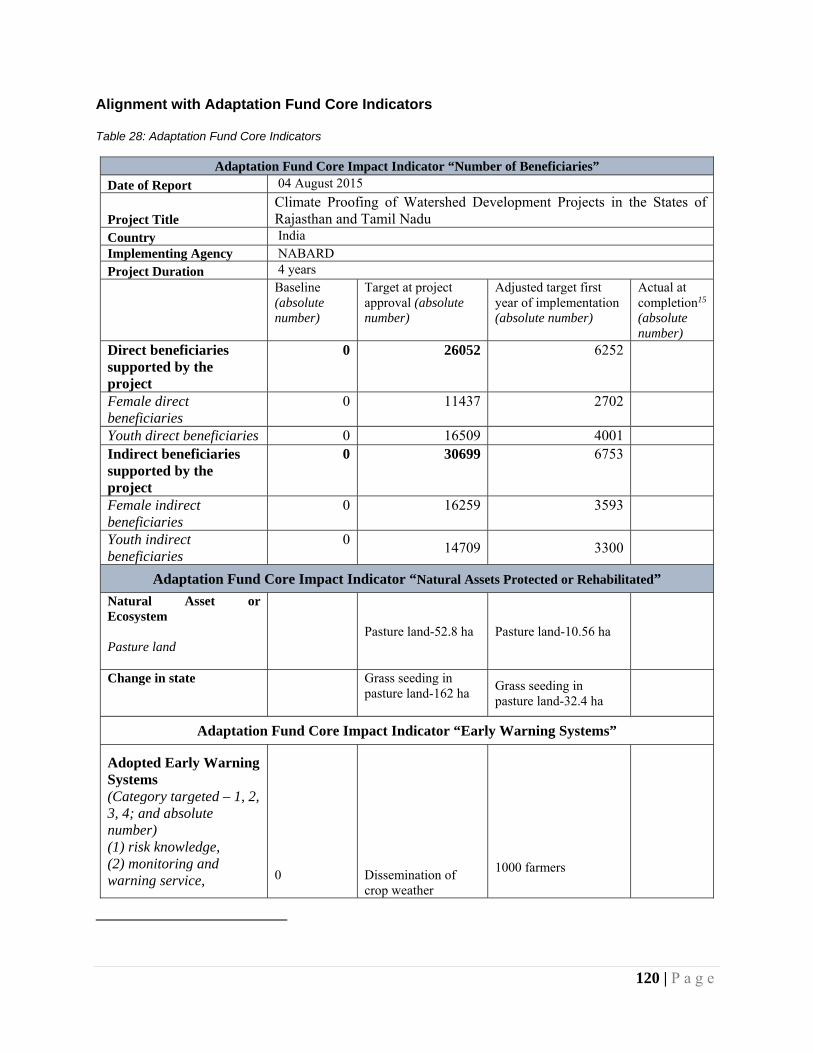
120 | P a g e
Alignment with Adaptation Fund Core Indicators Table 28: Adaptation Fund Core Indicators
Adaptation Fund Core Impact Indicator “Number of Beneficiaries”
Date of Report 04 August 2015
Project Title Climate Proofing of Watershed Development Projects in the States of Rajasthan and Tamil Nadu
Country India Implementing Agency NABARD Project Duration 4 years
Baseline (absolute number)
Target at project approval (absolute number)
Adjusted target first year of implementation (absolute number)
Actual at completion15 (absolute number)
Direct beneficiaries supported by the project
0 26052 6252
Female direct beneficiaries
0 11437 2702
Youth direct beneficiaries 0 16509 4001 Indirect beneficiaries supported by the project
0 30699 6753
Female indirect beneficiaries
0 16259 3593
Youth indirect beneficiaries
014709 3300
Adaptation Fund Core Impact Indicator “Natural Assets Protected or Rehabilitated”
Natural Asset or Ecosystem Pasture land
Pasture land-52.8 ha Pasture land-10.56 ha
Change in state
Grass seeding in pasture land-162 ha
Grass seeding in pasture land-32.4 ha
Adaptation Fund Core Impact Indicator “Early Warning Systems”
Adopted Early Warning Systems (Category targeted – 1, 2, 3, 4; and absolute number) (1) risk knowledge, (2) monitoring and warning service,
0
Dissemination of crop weather
1000 farmers

121 | P a g e
(3) dissemination and communication, (4) response capability. (report for each project component)
advisories – 2000 farmers
G. Include a detail budget with budget notes, a budget on Implementing Entity management fee use,
and an explanation and a breakdown of the execution costs. Table 29: Detail Budget
Sl.No
Description of treatments Rajasthan Tamil Nadu
Total
I Improvement in soil water regime
A Area Treatment‐Crop Cultivated Area
1 Farm Pond 7500 7500
2 Catch pit 4756 4756
3 Well recharge pit 55517 55517
4 Summer ploughing 44392 44392
5 Deep tillage 2818 2818
Sub Total – Crop cultivation 7500 107483 114983
B Drainage line treatment
1 Earthen Embankment with spillway 11985 11985
2 Masonry Gabion 2091 2091
3 L.D.P.E Sheet lining for seepage control in existing structures 7174 7174
4 Masonry Check Dam/ Water Harvesting structure 18376 18376
5 Recharge pit on upslope side of gully plugs 11108 11108
6 Open Recharge Pit in drainage line 4868 4868
Sub Total Drainage line treatment 55602 0 55602
Total – improvement in soil water regime
63102 107483 170585
II Climate Resilient Farming System and improved livelihood
A Afforestation & Pasture land development
1 Gradonis (bench terracing) ‐ demo 5028 5028
2 Refilling of alternate CCTs and tree seeding 2196 2196
3 (Stone pitched) Thawala/ Crescent Bund for regeneration of plants 4333 4333

122 | P a g e
4 Tree seeding 1149 1149
5 Plantation of fuel/fodder trees in SP site/ stone bund 11788 11788
6 Grass seeding in pasture + silvi pasture land 1613 1613
7 Avenue plantation 1202 1202
8 1 cft (0.3x0.3x0.3 m) pitting and tree seeding 7214 7214
9 Plantation of fodder trees for gully stabilization 9411 9411
10 Use of Water absorption Material during plantation 250 250
11 Pitcher irrigation (gheda) 667 667 1334
12 Thoor bio‐fencing/ barrier 3767 3767
13 Stone Fencing bund 6248 6248
14 Creation of Pasture group and fodder bank 8333 8333
15 Bund planting/ Tree seeding 1956 1956
17 Fodder development/chaff cutter 50673 50673
18 Korangad development 292 292
19 Nursery for forestry species 417 417
20 Green coverage (Glyceridia) 9342 9342
21 Azolla development 12127 12127
22 Agro‐forestry in channel/castor seeding 375 375
Sub Total – Afforestation & Pasture land development
65155 73893 139048
B Other Climate resilient farming/ Livelihood Support
1 Wadi/ Horti‐Plantation 22432 22432
2 Vegetable cultivation with Trellis 31109 31109
3 Kitchen Garden 2000 25546 27546
4 RWHS for Backyard plantation 18664 18664
5 Well recharge 8268 8268
6 Enhancing water use efficiency by use of micro irrigation/ UG pipes & outlets 30000 28166 58166
7 Seed bank 5667 250 5917
8 Short duration and low water required variety of maize and wheat promotion of mixed cropping 1850 1850

123 | P a g e
9
Improved Farm Implements and equipments (Broad Based Farrow ‐ BBF implement, Zero Tiller; Weeder; Fertigation; Reaper, Thresher etc.) 8333 8333
10 Best package of practices incl. seed treatment, INM, IPM, organic farming, etc. 12375 12375
11 Silage making demo 617 617
12 Azolla Cultivation 9458 9458
13
Improved animal husbandry practices including feed management, mineral bricks, silage, AI services of improved desi breed, etc., 27808 27808
14 Backyard Poultry units 4333 1700 6033
15 Vermicompost 67672 67672
16 Integrated Farming System 24700 24700
17 Tank silt application 53125 53125
18 Demo plot on minor millet 14417 14417
19 Herbal garden 1667 1667
20 Cattle tank/trevis 9267 9267
21 Organic farming 833 833
22 Mushroom 833 833
Sub Total – Other livelihood 182914 228176 411090
C Energy Efficient System
1 Improved cook stove 2750 2750
2 Biogas unit 6069 23130 29199
3 Solar Light (home lighting) 14000 14000
4 Solar Pump 57500 2083 59583
Sub Total – Energy Efficient System 80319 25213 105532
Sub Total – Climate Resilient Farming System and improved livelihood
328388 327282 655670
III Risk Mitigation
1 AWS and agro‐advisory 43333 43333 86666
2 RML subscription (3 years) on crop, weather & market info 25000 25000 50000
3 Sediment Observation Unit and Data Analysis 5250 4000 9250
4 Geo‐ hydrological study and crop water budgeting 25000 25000 50000
Sub Total Risk Mitigation 98583 97333 195916
IV Knowledge management

124 | P a g e
1 Grassland ecology study 6000 6000
2 Educational kit – Manual of Climate Change Adaptation 15000 3333 18333
3 Posters and pamphlet on climate change adaptation 4167 3417 7584
4 Community sensitisation Programs 9833 9833
5 Audio Visual Tools – short films 11833 7500 19333
6 Exposure visits, peer learning 15333 12500 27833
7 Training on NRM/Climate Change 2833 2833
8 Awareness and mobilisation/capacity building 8367 8367
9 IEC activity in the project area 3500 3500
10 Veterinary camp/silage making/para extension worker 1000 1000
11 Skill training 833 833
12 Information board 1000 1000
13 Village Knowledge Centre 2833 2833
Sub Total Knowledge management 64999 44283 109282
Grand Total 555072 576381 1131453
Project/Programme Execution cost 107400
Total Project/ Programme Cost 1238855
Project/programme Cycle Management Fee charged by the Implementing Entity 105300
Amount of Financing Requested 1344155 Budget Notes:
A) Project Measures:
Table 30: Budget notes for climate proofing watershed projects in Tamil Nadu:
Sl No
Project component Explanation
I Improvement of Soil water regime A Area Treatment-Crop Cultivated
Area
Catch pit The average cost of these structure is US$ 21.6 per structure for 220 such structures. It involves

125 | P a g e
the cost of manual labour and local material i.e. stone and gravels.
Well Recharge Pit In situ water conservation and runoff control measures with 580 units @ US$ 95.7 per unit
Summer Ploughing To open hard top soil, summer ploughing in 1607 ha area @ US$27.6 per ha has been proposed
Deep Tillage To break the hard sub- soil pan an cost of US$2.91 for 966 ha area has been proposed
II Climate Resilient Farming System and improved livelihood A Afforestation & Pasture land development Fodder Development In order to make the fodder available to animals,
1007 unit of fodder development has been proposed @ US$50.3 per fodder unit
Korangad development
Effective utilisation & conservation of soil moisture in fallow land by planting tree, etc. in 2.8 ha area (7acre) at different location @US$41.6 per unit.
Nursery for forestry species
One unit of Nursery for fodder species @US$416.6 per unit
Green coverage (Glyceridia)
1121 unit of Glyceridia plantation (a leguminous plant use for green maturing) at different location @ US$8.33 per unit.
Azolla Development A food supplements to animal has been proposed at an average cost of 36.3 per unit for 334 units of different size.
Agro-forestry in channel/castor seeding
15000 castor seeding unit have been proposed at minimal cost of US$ 0.025 per unit
B Other Climate resilient farming/ Livelihood Support Kitchen Garden 617 unit of kitchen garden of different size have
been proposed @ US$ 41.4 per unit Enhancing water use efficiency
by use of micro irrigation/ UG pipes & outlets
To improve water use efficiency 52 unit have been proposed @US$541.6 per unit
Back Yard Poultry unit 68 Backyard poultry units to provide additional source of income to families @US$25 per unit have been proposed
Vermicompost In order to promote organic farming 1693 vermicompost units/pits @an average cost of US $40.46 per unit/pit of different size as have been proposed
Integrated Farming System To promote diversified farming 50 units of integrated farming @US$494 have been proposed
Tank silt application 447 ha @US$114 per ha to improve soil texture, structures etc proposed. 2. 450 soil test unit @US$5 per unit
Demo plot on minor millet A farm based intervention with millet, pulse, oilseed crop @ US$73.5 per ha for unit for 187 ha.

126 | P a g e
Along with 4 demonstration unit @US$166.6 for four unit
Seed Bank To ensure availability of seed during the season one unit of seed bank @ US$250 has been proposed
Herbal Garden 5 units of herbal garden @ US$333.3 per unit Cattle tank/trellis To promote veterinary services 17 cattle tank
units @545 per unit proposed Mushroom 5 Mushroom cultivation units @US$166.6 to
provide nutritional security
Pitcher Irrigation 1000 pitcher for pitcher irrigation @US$0.66per pitcher, to be used in highly water scarcity areas
C Energy Efficient System Biogas Unit To provide energy through organic source, 73
biogas unit @US $316.8 have been proposed Solar Lamp One unit of solar lamp on demonstration basis
has been proposed @US$2083.3. III Risk Mitigation AWS and agro-advisory
5 Automatic weather Station and agro advisory @US $ 8666.6
RML subscription (3 years) on crop, weather & market info
1000 agro advisory unit to disseminate the useful information to community @US$25 per unit have been proposed
Sediment Observation Unit and Data Analysis
Sedimentation to conserve the soil. An amount of US$4000 lump sum has been proposed in three watershed projects
Geo- hydrological study and crop water budgeting
10 Geo hydrological unit to plan various water efficient techniques in watershed area have been proposed @US$2500 per unit
IV Knowledge Management Educational kit – Manual of
Climate Change Adaptation
Distribution of 4 sets of educational kit and manual on climate change in two watershed. An amount of US$833.3 has been proposed
Posters and pamphlet on climate change adaptation
To create awareness among the community about the climate change, 10 sets of Pamphlets, Posters will be distributed to the community @341.6 per set
Audio Visual Tools – short films
Audio visual tools, short films etc, to be shown to the community in 9 different location @US$833.3 per unit for 9 units
Exposure visits, peer learning
15 exposure visit of farmers of different watershed will be arranged a@ an average cost of US$833.3 per exposure visit
Awareness and mobilization/capacity building
39 awareness generation, sensitisation, capacity building etc., programme will be arranged @US$214.53 per camp/programme
IEC activity in the project area
8 IEC activities @US$437.5 per unit proposed
Veterinary camp/silage making/para extension worker
9 veterinary camps @US$111.1 proposed
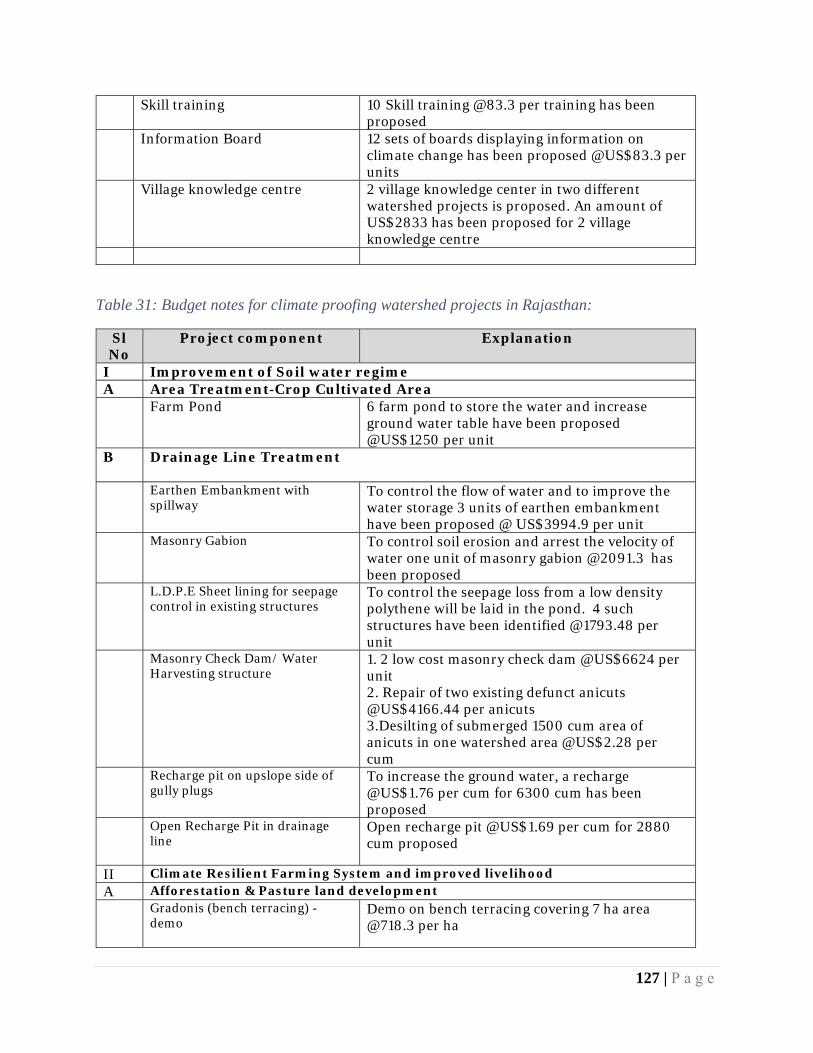
127 | P a g e
Skill training
10 Skill training @83.3 per training has been proposed
Information Board 12 sets of boards displaying information on climate change has been proposed @US$83.3 per units
Village knowledge centre 2 village knowledge center in two different watershed projects is proposed. An amount of US$2833 has been proposed for 2 village knowledge centre
Table 31: Budget notes for climate proofing watershed projects in Rajasthan:
Sl No
Project component Explanation
I Improvement of Soil water regime A Area Treatment-Crop Cultivated Area Farm Pond 6 farm pond to store the water and increase
ground water table have been proposed @US$1250 per unit
B Drainage Line Treatment
Earthen Embankment with spillway
To control the flow of water and to improve the water storage 3 units of earthen embankment have been proposed @ US$3994.9 per unit
Masonry Gabion
To control soil erosion and arrest the velocity of water one unit of masonry gabion @2091.3 has been proposed
L.D.P.E Sheet lining for seepage control in existing structures
To control the seepage loss from a low density polythene will be laid in the pond. 4 such structures have been identified @1793.48 per unit
Masonry Check Dam/ Water Harvesting structure
1. 2 low cost masonry check dam @US$6624 per unit 2. Repair of two existing defunct anicuts @US$4166.44 per anicuts 3.Desilting of submerged 1500 cum area of anicuts in one watershed area @US$2.28 per cum
Recharge pit on upslope side of gully plugs
To increase the ground water, a recharge @US$1.76 per cum for 6300 cum has been proposed
Open Recharge Pit in drainage line
Open recharge pit @US$1.69 per cum for 2880 cum proposed
II Climate Resilient Farming System and improved livelihood A Afforestation & Pasture land development Gradonis (bench terracing) -
demo
Demo on bench terracing covering 7 ha area @718.3 per ha

128 | P a g e
Refilling of alternate CCTs and tree seeding
Refilling of CCT to reduce the soil erosion at 17000 rmt @US $0.13 per rm has been proposed
(Stone pitched) Thawala/ Crescent Bund for regeneration of plants
To reduce the surface runoff, a structure like Thawala, Crescent proposed 1. 8500 stone pitched/box trench @US$0.42 per pitching(Thawala) 2.Crescent bund in of 3000 m length @Us0.24 meter proposed
Tree seeding
1. Plantation of seed in bund of 9000mt, @ US$0.02per rmt 2. Plantation of plant seed around bushes in 60ha area @US$14.81 per ha
Plantation of fuel/fodder trees in SP site/ stone bund
Plantation of agro forestry tree in fellow area, 14000 tree to be planted @US$0.84 per tree
Grass seeding in pasture + silvi pasture land
Grass seeding to prevent soil loss in 162 ha @ US$9.96 per ha
Avenue plantation
1000 plants is watershed area @US$1.20 per plants
1 cft (0.3x0.3x0.3 m) pitting and tree seeding
80000 pitting @ US$0.09 per pit
Plantation of fodder trees for gully stabilization
Fodder tree plantation on the bund. 10750 tree plantation @US$0.87 per tree
Use of Water absorption Material during plantation
To conserve moisture near plant, water absorption material in 5000 nos @ US$0.05 per unit
Pitcher irrigation (gheda)
Under Pitcher irrigation 2000 pitcher has been proposed @ US$0.33 per pitcher
Thor bio-fencing/ barrier
1. Bio-fencing with locally available material proposed for 1200 mt @ US$0.66 per mt 2.Thor Fencing for 10000 mt @ US$0.29 per mt
Stone Fencing bund
1. Stone fencing revocation for 340 mt @US$8.32 per mt. 2.Plugging of stone wall fence 1000 nos @3.42 per stone fence
Creation of Pasture group and fodder bank
Creation of 10 Pasture group @US$833 per group
Bund plantation 1.Riparian buffer plantation for MPTS for bank stabilisation 1000 plants @US$1.13 per plants 2. Forestry plantation, castor seeding in 10500 mt @0.07 per mt
B Other Climate resilient farming/ Livelihood Support Wadi/ Horti-Plantation
Plantation of horticulture plants at an average cost of US$5.87 per plants for 3820 plants
Vegetable cultivation with Trellis
66 units of vegetable cultivation with trellis @US$471.3 per unit

129 | P a g e
Kitchen Garden
600 kitchen garden units as a nutritional security @3.33 per unit.
RWHS for Backyard plantation
16 Water harvesting structures @US $1166.50 per unit
Well recharge
41 well recharge pit near well to increase the ground water table @US$201.66 per pit
Enhancing water use efficiency by use of micro irrigation/ UG pipes & outlets
Enhancing water use efficiency by Drip and sprinkler irrigation at an average cost of 254.2 per unit for 118 units
Seed Bank 1. To ensure timely supply of quality seed, one seed unit @US$3000 proposed 2.Seed multiplication in 20 ha area @ US$133.3 per ha.
Short duration and low water required variety of maize and wheat promotion of mixed cropping
105 units to promote short duration low water required variety of maize and wheat @US $ 17.62 per unit
Improved Farm Implements and equipment (BBF implement, Zero Tiller; Weeder; Fertigation; Reaper, Thresher etc.)
In order to promote farm mechanisation, two sets of improved farm equipment to be given to farmers @US $4166.6 per set
Best package of practices incl. seed treatment, INM, IPM, organic farming, etc.
Promotion of organic farming through compost pit, INM, IPM etc., 350 such units to be promoted @US$35.36 per unit
Silage making demo
A demo on silage making. 20 such demo units to be set up @30.83 per units
Azolla Cultivation 1. 245 Azolla cultivation unit @US$25 per unit 2. 10 training programme on Azolla Cultivation @ US$333.3 per training programme
Improved animal husbandry practices including feed management, mineral bricks, silage, AI services of improved desi breed, etc.,
1. Livestock field school – 2 livestock field school @US$2000 per school 2. 500 Artificial insemination @US$1.66 per AI 3. 24 feed management units @US$70 per programme 4. 2 programmes on improved animal husbandry practices @US$7007 per programme 5. 12 cattle shed, shelter management units @US$592.89 per unit 6.50 large animal breed improvement programme @3.33 per AI
Backyard Poultry 130 backyard poultry units @33.33 per unit C Energy Efficient System
Improved cook stove
Awareness about renewable energy, management of natural resources @US$27.5 per unit for 100 such units
Biogas Unit 15 Biogas unit @US$404.6 per unit

130 | P a g e
Solar Light (home lighting)
120 solar home lighting unit @US$116.6 per unit
Solar Pump
22 Solar lamp for community @2613.6 per unit
III Risk Mitigation AWS and agro-advisory
5 Automatic weather Station and agro advisory @US $ 8666.6
RML subscription (3 years) on crop, weather & market info
1000 agro advisory unit to disseminate the useful information to community @US$25 per unit have been proposed
Sediment Observation Unit and Data Analysis
Sedimentation to conserve the soil. An amount of US$5250 lump sum has been proposed for one watershed projects
Geo- hydrological study and crop water budgeting
10 Geo hydrological unit to plan various water efficient techniques in watershed area have been proposed @US$2500 per unit
IV Knowledge management
Grassland ecology study
12 Grass land ecological study @US$500 per study
Educational kit – Manual of Climate Change Adaptation
Distribution of 18 sets of educational kit and manual on climate change. An amount of US$833.33 has been proposed
Posters and pamphlet on climate change adaptation
To create awareness among the community about the climate change, 10 sets of Pamphlets, Posters will be distributed to the community @416.66 per set
Community sensitisation Programs
23 awareness generation, sensitisation, capacity building etc programme will be arranged @US$427.53 per camp/programme
Audio Visual Tools – short films
Audio visual tools, short films etc, to be shown to the community in 11 different location @US$1075.8 per unit for 11 units
Exposure visits, peer learning
21 exposure visit of farmers of different watershed will be arranged @ an average cost of US$730.15 per exposure visit
Training
62 Training programme on storage technique, JLG formation etc., have been proposed @US$45.69 per unit
(B) Breakdown of Execution Cost: Table 32: Breakdown of Execution Cost
Sl No. Budget Head Rate (Rs.)
No. Total Amount
USD
1
Field coordinator: 20 nos. @ $167/month for 3years
8400 20 5040000 84000
2
Travel (local and for facilitation) @ $20/ month (for 20 field coordinators) for 3years 1200 20
864000 14400

131 | P a g e
3
Reporting and Data @ $ 20 per year (for 20 watersheds) for 3 years
1200 20 72000 1200
4
Watershed Level Meetings (half yearly) @ $ 65 per meeting per watershed
3900 20 468000 7800
Total 6444000 107400 (C) Budget of Implementing Entity Management Fee. Table 33: Detail Budget of Implementing Entity Management Fee.
Sl No. Budget Head Rate No. Total
Amount USD
PMU Costs 1 PMU Staff 28500 4 3420000 57000 2 Review meetings 2700 20 162000 2700 3 Travel (local and for facilitation) 5000 4 720000 12000 4 Report preparation 5000 6 90000 1500 5 M&E Cost 276000 4600 6 Online monitoring system 1000000 16667
NABARD Cost 6 Financial Management 300000 5000
7 Performance Management - Progress Monitoring- Field Monitoring
300000 5000
6 Miscellaneous 50000 833
Total 6318000 105300
The implementation mechanism proposed is through Executing Entities numbering 14 nos, who will be directly responsible for execution of project activities in all the 20 watersheds. For facilitating execution of project activities, one field co-ordinator for every watershed is proposed and their expenses are provided in the EE budget. The execution by the EE will closely be monitored by a dedicated field level unit of NABARD known as Programme Management Unit (PMU) located at Madurai (Tamil Nadu) and Udaipur (Rajasthan). Two Consultants will be stationed in each of these PMUs or respective ROs, who will exclusively be attending to the works related to AFB projects. Since the eligible programme execution cost provided @9.5% of the project measures, is inadequate to meet many of the execution costs, owing to large number of Executing Entities (EEs), it is proposed that NABARD will be meeting costs like review meetings, report preparation, M & E cost etc., Further, NABARD also will be charging lesser amount towards financial management and performance management compared to earlier projects in view of the special nature of the proposed project and importance attached to it being co-funded by NABARD. As against the total cost of the project at US $ 5.64 million, NABARD will be co-funding the project to the tune of US $ 3.84 (68%) under its dedicated fund/programme like Watershed Development Fund (WDF) and Indo-German Watershed Development Programme (IGWDP). The

132 | P a g e
detailed activity-wise and watershed-wise budget for Rajasthan and Tamil Nadu are presented in Annexure 2. The process of execution consisting of sanction, disbursement, progress reporting, monitoring, review, etc., will be clearly defined and segregated for the co-funding by NABARD and AFB funding. Although EEs involved for the NABARD and AFB portions are same, it will be ensured that the EEs maintain a separate books of accounts, records, registers and all other documents, necessary for tracing flow of fund and end use of the fund. A separate set of manpower is available at the level of EE and PMU for attending to the works related to regular watershed projects. In order to avoid mix-up of data, a separate reporting system will be devised by NABARD for reporting progress under AFB funded items of investments. In order to track real time progress, it is proposed to introduce on-line monitoring system in the projects supported by AFB. The outcome/output envisaged under each of the activities funded by AFB, will be monitored separately by the Field Coordinator attached to EE and by the Consultants attached to PMU, thereby ensuring achievement of the same irrespective of success of activities funded by NABARD. H. Include a disbursement schedule with time bound milestones. Table 32: Proposed disbursement schedule.
Sr No
Particulars Year 1 Year 2 Year 3
Total Scheduled Date
November 15 (After signing
agreement) Nov-16 Nov-17
To Executing Agency 1 Project Funds 396009 396009 339437 1131455
2 Project execution cost
37590 37590 32220 107400
3 Total Project Cost 433599 433599 371657 1238855 To National Implementing Entity
4 Implementing Entity Fee
36855 36855 31590 105300
Total amount requested
470454 470454 403247 1344155
Upon Agreement signature
One Year after Project Starta/
Year 2b/ Total
Scheduled Date November 2015 November 2016 November 2017 June 2018 Project Funds 433599 433599 371657 1238855 Implementing Entity Fee 36855 36855 31590 105300 Total 470454 470454 403247 1344155

133 | P a g e

134 | P a g e
Annexure 1 Technical Standards and specification of Major structures
Sr No Particulars Technical specification 1 Farm ponds
Top – (l x b) 20m x 20m Bottom –( l x b) 14.4m x 14.4m Depth - 2.8 m Farm pond are constructed in a 4% slope area in square and rectangular shape
2 Recharge Pit Recharge pits are constructed for recharging the shallow aquifers. These are constructed 1 - 2 m. wide and 2 - 3 m. deep which are backfilled with boulders, gravels and coarse sand.
3 Catch pit In this method, pits of size 1 x 1 x 1 m are dug at many places in the corners of the fields or at any suitable place in slope areas. At the time of monsoon, runoff water is collected in the pits along with silt. This will enhance the moisture availability to the crops
4 Summer Ploughing Dry lands that are left un-ploughed in summer cause severe soil erosion at times of rainfall with high intensities. Summer ploughing with depth of 25-30cm depth helps, To reduce or prevent soil erosion To improve the soil fertility and moisture absorbing capacity of
soil To reduce or arrest weed growth To control insects
5 Deep Tillage A deep tillage of 15-30 cm depth is necessary for deep/moderate rooted crop. It improves soil moisture content. It is advisable to go for deep ploughing only for long duration, deep rooted crops.
6 Earthen Embankment with masonry spillway
Density of masonry (t/m3)- s -2.40 Head over the crest (m.)- h -0.60 Height of structure from Bed (m)- H -1.51 Top width of structure (m.)- Tw= h/(s-1)1/2 -0.51

135 | P a g e
Bottom width of structure(m)- Bw= b= Tw+0.8H -1.70
7 L.D.P.E Sheet lining for seepage control in existing structures
To prevent the seepage loss, a shallow pond will be dug and sheet will be laid on it Length - 60mt Bottom width - 2mt Top Width - 2mt Average height - 2mt Low density plastic sheet – 250 micron
8 Masonry Check Dam Masonry check-dams are permanent structures used for both controlling gully erosion and water harvesting Specifications of these structures are given as below It should handle peak runoff rate Design should be based on topographic and storage-height
considerations It should able to stabilize the gully Selection of site should be appropriate in terms of economical
and most feasible construction, benefiting maximum number of farmers.
9 Gradonis (bench terracing) - demo
A Gradonis (bench terracing) is formed across steep sloppy land where soil depth is considerable in order to control run off and minimize soil erosion. 1. Earthwork for excavation of trench – 3mt length x 1mt width x 0.3mt depth 2. Stone pitching of Bund - 3mt length x 0.3 mt width x 0.1mt depth
10 Stone Pitching (Thanwala) The bunds helps in water conservation upto 10 cum and help in reduction of surface runoff to the extent of 70%. Making semi-circular thanwala around root with min. 1 m dia.

136 | P a g e
Annexure 2
Details of Stakeholder consultation meetings held during project preparation
Sl. No.
Watershed Villager Participants Of the total, No. of
Date Mal
e Femal
e Tota
l SC ST
Landless
Watersheds in Rajasthan
1 Dhuvala 20-May-14 24 3 27 2 0 02 Nayagaon-I 28-May-14 28 7 35 7 12 103 Nayagaon-II 29-May-14 24 26 50 12 9 144 Balua 30-May-14 36 14 50 0 50 45 Vagda 28 & 30 May-14 38 12 50 0 46 06 Jhabla 28~29 May-14 19 8 27 0 27 0
7 Malvi 28~29 May-14 21 2 23 0 17 0
8 Mandali 27~28 May-14 89 39 128 9 103 09 Chainpuriya 26-May-14 52 13 65 0 61 010 Khad 29-May-14 38 17 55 0 55 3
Total Rajasthan 369 141 510 30 380 31Watersheds in Tamil Nadu
1 Vannikonendal Kurkalpatti 27.5.2014 73 32 105 22 0 22
2 Peikulam 29.5.2014 45 42 87 27 0 29
3 Chinnapoolampatti 28.5.2014 41 57 98 42 0 42
4 Chithalai 30.5.2014 57 45 102 18 0 22
5 Anjukulipatti 27.5.2014 373 63 436 28 0 51
6 Srirampuram Malvarpatti 26.5.2014 136 155 291 29 0 86
7 Ayyampalayam 28.5.2014 112 98 210 40 16 42
8 Tallikothanur 29.5.2015 109 47 156 23 0 12
9 Bettamugilalam 27.5.2014 80 48 128 15 10 8
10 Salivaram 29.5.2014 93 52 145 7 6 12
Total Tamil Nadu 1119 639 1758 251 32 326
Total 1488 780 2268 281 412 357

137 | P a g e
Annexure 3
Budget Details components and number of units
Sr.No
Description of treatments
Tamil Nadu Rajasthan
Unit Quantity
Grant Amount from AFB (Rs)
Amount $
Unit Quantity
Grant Amount from AFB (Rs)
Amount $
Grand total
I Improvement in soil water regime
A Area Treatment-Crop Cultivated Area
1 Farm Pond No. 6 45000
0 7500 7500
2 Drainage system in crop cultivated area
0
3 Catch pit No 220 28535
2 4756 4756
4 Well recharge pit Nos 580 34113
83 5551
7 55517
5 Summer ploughing Ha 1607 26635
00 4439
2 44392
6 Deep tillage Ha 966 16905
0 2818 2818
Sub Total – Crop cultivation 3373 65292
85 1074
82 6
450000
7500 114982
B Drainage line treatment 0
1 Earthen Embankment with spillway Nos. 3 71909
8 1198
5 11985
2 Masonry Gabion No. 1 12548
3 2091 2091
3 L.D.P.E Sheet lining for seepage control in existing structures
No/Cum
4 43043
6 7174 7174
4 Masonry Check Dam/ Water Harvesting structure
No/Cum
1507 11025
75 1837
6 18376
5 Recharge pit on upslope side of gully plugs
Nos./rm
6300 66648
0 1110
8 11108
6 Open Recharge Pit in drainage line cu m 2880 29210
4 4868 4868
Sub Total Drainage line treatment 1069
5 33361
76 5560
3 55603
Total – improvement in soil water regime
3373 65292
85 1074
82 0
10701
3786176
63103
170585
II Climate Resilient Farming System and improved livelihood
0
A Afforestation & Pasture land development
0
1 Gradonis (bench terracing) - demo rm/Ha
7 30170
0 5028 5028
2 Refilling of alternate CCTs and tree seeding
Rmt. 1700
0 13175
0 2196 2196
3 (Stone pitched) Thawala/ Crescent Bund for regeneration of plants
No 1150
0 25999
0 4333 4333
4 Tree seeding Rmt. 9060 68910 1149 1149
5 Plantation of fuel/fodder trees in SP site/ stone bund
Nos 1400
0 70730
0 1178
8 11788
6 Grass seeding in pasture + silvi pasture land
Ha 162 96804 1613 1613

138 | P a g e
Sr.No
Description of treatments
Tamil Nadu Rajasthan
Unit Quantity
Grant Amount from AFB (Rs)
Amount $
Unit Quantity
Grant Amount from AFB (Rs)
Amount $
Grand total
7 Avenue plantation Nos 1000 72140 1202 1202
8 1 cft (0.3x0.3x0.3 m) pitting and tree seeding
Nos 8000
0 43285
0 7214 7214
9 Plantation of fodder trees for gully stabilization
Nos 1075
0 56464
5 9411 9411
10 Use of Water absorption Material during plantation
No. 5000 15000 250 250
11 Pitcher irrigation (gheda) Nos 1000 40000 667 Nos 2000 40000 667 1333
12 Thoor bio-fencing/ barrier Rmt. 1120
0 22600
0 3767 3767
13 Stone Fencing bund cum/nos
1340 37490
6 6248 6248
14 Creation of Pasture group and fodder bank
Nos 10 50000
0 8333 8333
15 Bund planting/ Tree seeding No/rmt
11500
117375
1956 1956
17 Fodder development/chaff cutter Nos 1007 30404
00 5067
3 50673
18 Korangad development Acre 7 17500 292 292 19 Nursery for forestry species Nos 1 25000 417 417
20 Green coverage (Glyceridia) Nos 1121 56050
0 9342 9342
21 Azolla development Nos 334 72760
0 1212
7 12127
22 Agro-forestry in channel/castor seeding
Nos 1500
0 22500 375 375
Sub Total – Afforestation & Pasture land development
1847
0 44335
00 7389
2 0
174529
3909370
65156
139048
B Other Climate resilient farming/ Livelihood Support
0
1 Wadi/ Horti-Plantation Nos 3820 13459
00 2243
2 22432
2 Vegetable cultivation with Trellis Nos 66 17445
10 3110
9 31109
3 Kitchen Garden Nos 617 15327
50 2554
6 No. 600
120000
2000 27546
4 RWHS for Backyard plantation Nos 16 11198
40 1866
4 18664
5 Well recharge Nos 41 49609
2 8268 8268
6 Enhancing water use efficiency by use of micro irrigation/ UG pipes & outlets
Nos/Acre
52 16900
00 2816
7 No. 118
1800000
30000 58167
7 Seed bank Nos 1 15000 250 Ha/no
21 34000
0 5667 5917
8 Short duration and low water required variety of maize and wheat promotion of mixed cropping
No. 105 11100
0 1850 1850
9
Improved Farm Implements and equipment (BBF implement, Zero Tiller; Weeder; Fertigation; Reaper, Thresher etc.)
Set 2 50000
0 8333 8333

139 | P a g e
Sr.No
Description of treatments
Tamil Nadu Rajasthan
Unit Quantity
Grant Amount from AFB (Rs)
Amount $
Unit Quantity
Grant Amount from AFB (Rs)
Amount $
Grand total
10 Best package of practices incl. seed treatment, INM, IPM, organic farming, etc.
Nos 350 74250
0 1237
5 12375
11 Silage making demo Nos 20 37000 617 617
12 Azolla Cultivation Nos 255 56750
0 9458 9458
13
Improved animal husbandry practices including feed management, mineral bricks, silage, AI services of improved desi breed, etc.,
Nos 590 16684
86 2780
8 27808
14 Backyard Poultry units Nos 68 10200
0 1700 Nos 130 26000
0 4333 6033
15 Vermicompost Nos 1683 40603
28 6767
2 67672
16 Integrated Farming System Nos 50 14820
00 2470
0 24700
17 Tank silt application HA/Nos
897 31875
00 5312
5 53125
18 Demo plot on minor millet Ha 191 86500
0 1441
7 14417
19 Seed bank 0
20 Herbal garden Nos 5 10000
0 1667 1667
21 Cattle tank/trevis Nos 17 55600
0 9267 9267
22 Organic farming Nos 10 50000 833 833 23 Mushroom Nos 5 50000 833 833
Sub Total – Other livelihood 3596 13690
578 2281
76 0 6790
10852828
182914
411090
C Energy Efficient System 0
1 Improved cook stove Nos 100 16500
0 2750 2750
2 Biogas unit Nos 73 13878
00 2313
0 Nos 15
364140
6069 29199
3 Solar Light (home lighting) Nos 120 84000
0 1400
0 14000
4 Solar Pump Nos 1 12500
0 2083 Nos 22
3450000
57500
59583
Sub Total – Energy Efficient System
74 15128
00 2521
3 0 257
4819140
80319
105532
Sub Total – Climate Resilient Farming System and improved livelihood
2214
0 19636
878 3272
81 0
181576
19581338
328389
655670
III Risk Mitigation 0
1 AWS and agro-advisory Nos 5 26000
00 4333
3 Nos 5
2600000
43333 86667
2 RML subscription (3 years) on crop, weather & market info
Nos 1000 15000
00 2500
0 Nos 1000
1500000
25000 50000
3 Sediment Observation Unit and Data Analysis
0 24000
0 4000 Nos 1 31500
0 5250 9250
4 Geo- hydrological study and crop water budgeting
Nos 10 15000
00 2500
0 Nos 10
1500000
25000 50000

140 | P a g e
Sr.No
Description of treatments
Tamil Nadu Rajasthan
Unit Quantity
Grant Amount from AFB (Rs)
Amount $
Unit Quantity
Grant Amount from AFB (Rs)
Amount $
Grand total
Sub Total Risk Mitigation 1015 58400
00 9733
3 0 1016
5915000
98583
195917
IV Knowledge management 0
1 Grassland ecology study No 12 36000
0 6000 6000
2 Educational kit – Manual of Climate Change Adaptation
4 20000
0 3333 - 18 90000
0 1500
0 18333
3 Posters and pamphlet on climate change adaptation
Set 10 20500
0 3417 - 10 25000
0 4167 7583
4 Community sensitisation Programs 0 Nos 23 59000
0 9833 9833
5 Audio Visual Tools – short films Nos 9 45000
0 7500 - 11
710000
11833
19333
6 Exposure visits, peer learning Nos 15 75000
0 1250
0 - 21
920000
15333 27833
7 Training on NRM/Climate Change Nos 62 17000
0 2833 2833
8 Awareness and mobilisation/capacity building
Nos 39 50200
0 8367 8367
9 IEC activity in the proect area nos 8 21000
0 3500 3500
10 Veterinary camp/silage making/para extension worker
Nos 9 60000 1000 1000
11 Skill training Nos 10 50000 833 833 12 Information board units 12 60000 1000 1000
13 Village Knowledge Centre Nos 0 17000
0 2833 2833
Sub Total Knowledge management 116 26570
00 4428
3 157
3900000
65000
109283
Grand Total 2664
4 34663
163 5763
80
193450
33182514
555075
1131455

141 | P a g e
TOTAL Costing (USD) (Tamil Nadu and Rajasthan) 35% 35% 30%
Component Total cost
Beneficiaries contribution
Fund support by NABARD
Fund support sought from AFB
Upon Agreement
1st Year
2nd Year
Improvement in Soil Moisture Regime 2041236 301952 1568698 170585 59705 59705 51176 Climate Resilient Farming System 1459505 137975 647860 655670 229485 229485 196701 Risk mitigation 195917 0 0 195917 68571 68571 58775 Knowledge Management 135557 12007 14267 109283 38249 38249 32785 Others (NABARD Supported) 1811193 198981 1612211 0 0 0 0 TOTAL 5643407 650915 3843036 1131455 396009 396009 339437 Project/Programme Execution cost 107400 37590 37590 32220 Total Project/ Programme Cost 1238855 433599 433599 371657 Project/programme Cycle Management Fee charged by the Implementing Entity 105300 36855 36855 31590 Amount of Financing Requested 1344155 470454 470454 403247

142 | P a g e
Annexure 4
Environmental and Social Management Plan (ESMP) Project/Programme Category: REGULAR Country/ies: INDIA Title of Project/Programme: Climate proofing of watershed development projects
in the states of Tamil Nadu and Rajasthan Type of Implementing Entity: NIE Implementing Entity: NATIONAL BANK FOR AGRICULTURE AND RURAL
DEVELOPMENT (NABARD) Executing Entity/ies: MULTIPLE NGOS Amount of Financing Requested:
US$ 1,344,155 (in U.S Dollars Equivalent)
1.0 Introduction The overall objective of this program is “to improve climate resilience and build adaptive capacities of the communities to climate change in the rain-fed areas of Tamil Nadu and Rajasthan”. The proposed project focuses on climate-proofing rain-fed agricultural areas in 20 watersheds in Tamil Nadu and Rajasthan. Its overall objective is to deliver specific and concrete adaptation measures to increase the adaptive capacity of farmers and the resilience of the targeted watersheds. The proposed interventions are expected to bring the following benefits:
1. Improving soil and water regime and boost crop productivity 2. Increasing adaptation through climate resilient farming system approach and diversification of
livelihoods 3. Integrating risk mitigation products such as crop, weather and market advisory and other financial
products for farmers 4. Creating a knowledge management system for climate proofing of watersheds.
2.0 Project Description The project would implemented through civil society organisations (CSOs)/ NGOs. The implementation would be supervised by village watershed committee at community level at each watershed level. 3.0 Project Components Project components and expected concrete outputs are as indicated below:
Project / Programme Component
Expected Concrete Outputs Expected Outcomes
Component 1: Improved soil and water regime for better crop productivity
Output 1.1: Soil health improved through summer / deep ploughing
Outcome 1: Soil and water regime improved and crop productivity enhanced
Output 1.2: Increased water availability through farm pond, catch pit, well recharge pit and other water harvesting structures

143 | P a g e
Component 2: Increased adaptation to climate change through climate resilient farming system approach and diversification of livelihoods
Output 2.1: Increased availability of fodder/fuel through afforestation & pasture land development
Outcome 2: Improved climate resilient farming system and increased livelihood security
Output 2.2: Improved resilience through adoption of climate resilient farming/livelihood systems Output 2.3: Better energy management through adoption of energy efficient systems
Component 3: Integration of risk mitigation products like crop, weather and market advisory for the farmers
Output 3.1: Installation of Automatic Weather Stations and generation of agro-advisories
Outcome 3: Reduced climate change vulnerability with improved risk mitigation measures
Output 3.2: Geo-hydrological study and crop-water budgeting
Component 4: Creation of knowledge management system for climate proofing of watershed project and livelihoods
Output 4.1: Government takes up certain prescriptions and project learning for large scale implementation.
Outcome 4: Project learning and created knowledge base benefitted similar projects implemented in other States.
Output 4.2: Cross learning and replication of practices and lesson learnt with improved knowledge and understanding by stakeholders
4. Environmental & Social Risk Screening & Management:
4.1 Compliance with the law: The project is in compliance with major domestic environmental law / policies / rules like (1) National Forest Policy-1988, (2) The Environment (Protection) Act, 1986 and Rules, 1986, (3) The Forest (Conservation) Act, 1980 and Rules, 1981. Further the project activities are in compliance with state specific Panchayat Raj and Gram Swaraj Act (local governance); land tenancy laws and other administrative orders of Subnational Government.
Management
Since the project interventions are localized and applicability of compliance requirement is minimal. However, the watershed community would be sensitized about legal provision under these laws/ policies applicable at national / sub-national level.
4.2 Access and Equity: The project envisages providing access to three types of vulnerable populations i.e. Small and Marginal Farmers, Landless, Women, Scheduled Caste, Scheduled Tribe households and this aspect is proposed to be monitored regularly. Management: It shall be ensured that the project is not impeding access to any of the other requirements like health, clean water, sanitation, energy, education, housing, safe and decent working conditions and land rights.

144 | P a g e
Implementation of water harvesting structures would be done in such a manner that the benefits generated out of same are equally distributed and positive discrimination would be towards marginalized communities. Ground water recharge and harvested rainwater would be managed through water user groups to address any equity issues that may arise. It will also ensure maximum coverage of the families living in the recharge zone and benefitting from this activity. Access and Use of Common Properties Common property resources created out of project interventions such as plantations in common land, percolation ponds, drainage line treatments, check dams, weather stations etc. would be managed by Village Watershed Committee. Management: The management of common property resources would be done by VWC in such a manner that the issues related distributions of benefits/ usufruct rights would not pose any equity issued. The existing management system under watershed project would also be applicable to this project. The registers for management of the plantations would be also be maintained under the project. 4.3 Marginalized and Vulnerable Groups The activities will help in creating a long term asset base in villages, plus an enhanced natural resource base and also will help in creating livelihoods and income for vulnerable groups. The project is planned to have a positive social impact on the vulnerable communities in the project area. It is pertinent to state herewith the NABARD has been implementing NRM based interventions such as watershed programmes and tribal development projects and has developed a mechanism for community based management of NRM projects. This mechanism includes participation of community in design, implementation, monitoring and post implementation sustainability. These programme have be successful in addressing issues related to marginalized and vulnerable groups and their participation in the entire process. Similarly, under the proposed project, selection process of beneficiaries for various interventions has taken care to include proportionate representation of members from these vulnerable groups. At the village level, project planning, implementation and monitoring has been done with the participation of all village level groups. Care has been taken to ensure that there is proper representation from different age groups, caste, class, religion and ethnicity of the villages. Management: The selection criteria for beneficiaries under the project included positive discrimination towards marginal and vulnerable community in their identification in the following manner:
- Families with sole dependence on agriculture / primary sector which are climate sensitive as only source of income and livelihoods.
- Small and marginal farmers (less than 2 ha area)

145 | P a g e
- Women headed families where productive men have migrated to cities and thus females are taking care of farming and thus bear direct burden of degradation of natural resources due to falling effects of climate change /variability
- Poor households (Including Scheduled caste & Scheduled tribe households) considering poverty and marginalization perspectives of the villagers.
During the implementation the Village Watershed Committee would monitor any issues related to rights of marginalized and vulnerable groups. 4.4 Human Rights The project does not affect the life and liberty of any individual or group. Neither does the project discriminate against any particular community or group or persons on grounds of gender, caste, ethnicity, ability or birth. The project upholds the fulfilment of the human rights of the villages and the target groups that it seeks to work with. However, due care will be taken not to violate human rights during implementation stage. 4.5 Women and Gender Empowerment Project is planned to ensure participation by women fully and equitably, receiving comparable socio-economic benefits and those they do not suffer adverse effects. Towards this end, women will be involved in decision making process through adequate representation of women in various committees. Capacity building of women also will be taken care of through appropriate training modules. Adequate representation of women beneficiaries will be ensured for capacity building activities like training, exposure visits. Inadequate representation of women in various committees, disproportionate selection of women beneficiaries and insufficient measures for empowerment through skill and capacity development etc., are the possible risks identified. Many interventions like water harvesting, fodder development, renewable energy etc. are going to have direct impact in reducing the drudgery of women. The above measures will ensure participation by women fully and equitably, receive comparable socio-economic benefits so that they do not suffer adverse effects. Women will also gain in terms of reduced drudgery on account of increased availability of fodder, fuel and water, which are planned as important project measures under the project. Management
The representation of women in various committees and project interventions would be monitored through VWC and EE. The monitoring and reporting formats would include parameters related to the same.

146 | P a g e
Participation of women in the various meetings organized by VWC for planning, implementation would be monitored through meetings register
NABARD would have specific focus on the issues related to women empowerment and gender during field monitoring.
4.6 Labour Rights Non-adherence to minimum wage, hours of work, worksite facilities, child labour are the major anticipated risks The project will ensure that core labour rights are respected and labour laws that are applicable to any site that employs casual labour are followed. Freedom of association and the effective recognition of the right to collective bargaining will be respected. The wages will be determined on task allotted and the wage rate will be calculated on the basis of prevailing minimum wage rate for the task. The record of work done for each labour engaged will have to be maintained and the wages paid accordingly. The hours of work and the timing of the working hours will be determined in consultation with the labour and the prevailing practices in the area. Positive discrimination in favour of women may be used to provide fair and equal opportunity to women who seek employment as labour and gain from the wages earned by her. All forms of negative discrimination in respect of employment and occupation would be eliminated. Project should not engage child labour in any of its activities and all forms of forced or compulsory labour may be eliminated. Management
The VWCs would be sensitized on the issues related to labour rights
Registers would be maintained for labour payments and same would be verified with respect to payments as per the schedule of rates, work quantity by VWC and EE. It would also be monitoring parameter during field monitoring by NABARD.
Name, designation and number of the concerned official of EE to whom the labour and employment related grievances can be addressed shall be displayed in the project area.
4.7 Involuntary Resettlement The project activities will be undertaken at the level of household and community level. The activities proposed these activities will improve the economic condition of household in watershed areas and build climate resilience and thereby arresting the need for relocation on economical or livelihood reasons. The criteria for selection of sites for individual interventions included the fact that in case there is any possibility or likelihood of involuntary resettlement due to project activities that particular site will not be selected. Monitoring: Any issues arising out of project interventions during implementation in terms of involuntary settlement in terms of physical settlement and livelihood resettlement would be monitored by EE. The NABARD would also monitor the same during field visits. 4.8 Species and Habitats

147 | P a g e
The interventions are not expected to any species and habitats negatively by would result in positive impact on ecosystem. 4.9 Conservation of Biodiversity The project interventions in fact promoting biodiversity. The project will not be introducing any exotic or invasive species of crops/animals in the project area. Selection plantation species, fodder species etc. would be done in technical consultation with Agricultural University and state government departments concerning agriculture, forestry and horticulture. Management: EEs would ensure consultations related to selection of plant species with agricultural university and state government departments concerning agriculture, forestry and horticulture. Maharanapratap Agriculture University at Udaipur (Rajasthan) and Tamil Nadu Agricultural University (TNAU) at Coimbatore (Tamil Nadu) would be involved in providing the technical support. 4.10 Pollution preventions & resources: Waste Disposal The project activities especially related to micro irrigation installation, LDPE linings and procurement of saplings of fodder/fruit trees in plastic bag may generate some amount of plastic wastes. Although, quantities of such wastes are minimal, proper disposal mechanisms of these non-degradable wastes will be incorporated as part of project strategy. Water Resource Ground water will be positively impacted due to better recharge in the catchment area of the watershed due to catchment area treatment. No adverse impact on ground water is visualized. Management: EEs and VWCs would ensure proper disposal mechanisms of these non-degradable wastes. 4.11 Public Health Project is not having any negative impact on public health. 4.12 Physical and cultural infrastructure There is no plan for any alteration to physical and cultural heritage in this project. On the contrary the project mentions need to revive traditional wisdom and useful climate resilient livelihood/ agriculture traditions of local communities.

148 | P a g e
4.13 Soil Conservation Most of the project interventions such as soil and water conservation measures, planting of horticulture and fodder trees, etc., are aimed at improving crop coverage in the area, which in turn is expected to protect the land from further soil erosion. 5.0 Consultations and Public Disclosure Different stakeholders, in each project location, have been identified and involved in the project design stage. This project is finalised based on the inputs received from different stakeholders during different rounds of meetings / consultations. In the State and watershed level project inception workshops, the results of the environmental and social screening and environmental and social assessment findings will be shared. The project management plan will also be shared with different stakeholders and documents will be in public domain for easy reference of stakeholders. Apart from this, project performance reports including the status of implementation of environmental and social measures will be available for stakeholder’s review. Apart from executing entities, community and other stakeholders will be intimated about any significant change in the project plan. Monitoring: NIE / NABARD would monitor the process related to consultation and public disclosure on ESMP. 6.0 Grievance Mechanism Though, project will not have negative impact or affect people negatively. Still, a grievance mechanism will be in place so that people can share their concerns and it can be addressed amicably.
All the project villages will have display board stating the name of the project and names of NIE and Executing Agency. The names of contact persons and their mobile numbers will also be displayed on these boards.
The VWC will pro-actively disclose the grievance mechanism that exists in the project. All grievances received either orally or in written form will be recorded in the Complaint Register
maintained in EE office. Each such complaint will be identified by a complaint number and will be followed up and the resolution of the grievance will also be recorded and the same is reported to NIE.
Information related to grievance mechanism will be provided in the language that is easily understood by the members of the village community.
7.0 Institutional Arrangements 7.1 The institutional arrangement includes the distribution of roles and responsibilities in the implementation of ESMP. The key players and their responsibilities will be as follows:
Organisation/ Designation Responsibility Field Coordinators & Executing Entities
Identification of any ESS safeguard requirements specific to watershed projects based on the ESMP.
Preparation of ESMP and awareness creation at watershed level through the process of community consultation
Presentation of ESI Screening and ESMP in the meetings of the Gram Sabha.

149 | P a g e
Coordinate with experts in geo-hydrology, agriculture engineering, forestry for the Screening of impact biodiversity, soil conservation, selection of plant species, etc.
Public disclosure at watershed level. Creation of Grievance mechanism at EE level Reporting and disposal of grievances in timely manner
NIE (NABARD) Monitor and review the process ESMP implementation Set up the grievance mechanism at IE level Disposal of grievances Reporting of the ESS parameters to AF Sample check and verify the ESI Screening and ESMP in the
project villages 7.2 Capacity Development Separate capacity building and training programme for EE staff and field coordinators would be held before inception workshop. 7.3 Monitoring and Reporting The implementation Schedule of the ESMP will be as follows:
Activities Time Year 1 Year 2 Year 3
Q1 Q2 Q3 Q4 Q5 Q6 Q7 Q8 Q9 Q10 Q11 Q12Capacity Building of Project Team
ESMP of sub projects Monitoring and Reporting of ESMP
Environment and Social Audit
Environmental and social audit would be part of Annual Report 8.0 Cost for ESI Screening and ESMP The preparation and implementation of sub project ESI Screening and ESMP will have costs that have been built in to the project budget. The cost implications and their source of funds will be as follows:
ESI Screening /ESMP related activity
Source from where Cost will be met
Capacity Building of Project Team Will be absorbed in the Programme Management Cost Preparation project specific ESMP Built in the Programme Execution Cost Monitoring and Reporting Built in the Programme Execution Cost Conduct of Environment and Social Audit
Built in to Project Annual Report

150 | P a g e
09.00 Format for individual climate proofing watershed Project ESMP 9.1 Management Plan
Environment And Social Risk identified in ESI Screening
Mitigation Measure Implementation Schedule for the mitigation measure
Responsibility for execution of the mitigation measure
Species and Habitats Bio diversity Soil Erosion Water Quality Soil Disposal
Water Resources Waste Disposal
Public Health
Landscape
Physical and Cultural Infrastructure
Vulnerable Groups Loss of Agriculture Land Access and Use of Commons
Workers Safety Access and Equity Labour Rights
Human Rights Gender and Women Empowerment
Involuntary Resettlement
Irrigation Infrastructure Vehicles and Equipment during Construction Activity
9.2 Monitoring Plan The monitoring plan will comprise of the parameters for monitoring and the frequency with which the monitoring will be carried out. The recording and reporting procedures will also form part of the monitoring plan.
Mitigation Measure Monitoring Parameter
Responsibility for monitoring
Recording and Reporting Frequency
Species and Habitats Bio diversity

151 | P a g e
Soil Erosion Water Quality Soil Disposal
Water Resources Waste Disposal
Public Health
Landscape
Physical and Cultural Infrastructure
Vulnerable Groups Loss of Agriculture Land Access and Use of Commons
Workers Safety Access and Equity Labour Rights
Human Rights Gender and Women Empowerment
Involuntary Resettlement
Irrigation Infrastructure Vehicles and Equipment during Construction Activity

Appendix 1 Anjukulipatty - Dinduigal Location of the Project area Anjukulipatty watersheds is located in Shanarpatty block of Dinduigal Taluk in Dinduigal District, Tamil Nadu. It is situated between 100 12’ and 100 17’ 30” North Latitude and between 780 4’ and 780 6’ 30” East longitude. Average maximum temperature of this watershed is 340C and minimum temperature is 22.50C. Highest maximum temperature of 34.10C is recorded in the month of April and the lowest minimum temperature of 17.30C is recoded in the month of January. Annual average rainfall received in the region is 935.4 mm of which 471.8 mm is received during the Northeast monsoon which contributes to 49.9 % annual average rainfall. Total area covered under this watershed is 1398.32.5 ha which supports for a population of 7786 as per 2011census. Literacy level is 87.86%. Out of total population cultivators constitute 5.95% and the agricultural laborers constitute another 60.69 %. Major soil types present are Red soil, sandy clay, clay loam and alluvial soil. Major crops grown are Groundnut, Maize, sorghum, onion, tomato and fodder crops. Main source of water in this area is Borewell and well.
Figure 1. Location of the Project area
1

Climate related risks in the Case Study Watersheds It is widely recognized that Climate related risks and their impacts are not just a future threat. Past and current experiences in dealing with climate variability and extreme events irrespective of attribution to climate change hold valuable lessons for reducing vulnerability and enhancing resilience for future climate related adverse impacts. Climate resilient watershed planning requires extensive high quality data and information on climate, and on agriculture, environmental and social systems affected by climate, with a view to carrying out realistic vulnerability assessment and looking towards the near future. Analysis of historical weather data of the study region in relation to frequency of occurrence of extreme weather events such as drought, excess rainfall, extremes in temperature and wind speed and its impact on agricultural productivity helped in ranking the climate related risks and the results are presented in Table 1.
Table 1. Climate related Risks
Risk event Consequence Likelihood probability
Risk Rank
Drought Reduction in crop yields Almost 2/3 year High 1 Consecutive drought
Increased no. of irrigation. More water requirement.
Once in 3 years in the recent decade
Medium 2
Excess rainfall Soil erosion as a result of highly sloppy land
Once in 5 years Medium 2
Temperature extremes
Increased evaporation Frequent Medium 2
Intermittent dry spell
Reduced crop productivity
Almost every year Medium 2
High wind speed Physical damage to crops
Often Low 3
High temperature
Mortality of maximum number or mango trees
Rare. First time Low 3
Hail storm Destruction of flowers and flower shedding in mango trees
Once in three years or four years
Low 3
High temperature coupled with continuous
Tree is affected by fungus infection
Once in 4 years Low 4
2

rainfall Among the risk events, drought ranked first, as the frequency of occurrence is almost every year and impacted on crop yield. Continuous drought caused by lowest rainfall caused by increased no of irrigations which leads to more water requirement which happened once in three years in the recent decade. Temperature extremes both high and low cause increased evaporation both from soil and plants cause irregular growth and development of crop and trees. Intermittent dry spell almost in every year resulted in reduced in crop production which leads to low yield production. High wind speed during summer and south west monsoon damage physical structures of the crops and trees such as flower shedding, leaf damage, fruit fall. High temperature during summer resulted in mortality of maximum number of mango tress due to water stress and subsequent pest and disease infestation, lack of nutrient absorb, etc, which happened for the first time in this area. Occasional hail storm once in three or four years cause destruction flowers, flower shedding in mango trees. High temperature followed with continuous rainfall resulted in fungus infection leads to disease spread to all trees and reduce productivity of the tree. Though the excess rainfall occurred at a frequency of once in five years, the impact on yield is very high depending on the stage of the crop and ranked second in climate related risks. II. Analysis of Current Climate
1. Characterization of current climate For understanding the current climate, daily rainfall, maximum and minimum temperatures data were obtained from Regional Meteorological Centre, Chennai for the period from 1969-2005. The geographical position of the data point is 10°5’ Latitude and 77 ° 5’ Longitude.
A. Rainfall a. Annual rainfall The study region receives an annual average rainfall of 935.4 mm. Annual rainfall recorded from 1981 – 2010 is presented in the figure 2 that shows high inter annual variability over a period of 30 years. The annual rainfall ranged from 484.5 mm to 1493.4 mm with a standard deviation of 238.7 mm and CV of 25.5 %. This indicates that receiving annual average rainfall of 935.4 mm is slightly uncertain and in most of the years, annual rainfall oscillated between 674.2 to 1151.7 mm (-1 SD to +1 SD). In the recent past, most of the years had lesser than average rainfall.
Figure 2. Annual Rainfall (1981 - 2010)
3

Annual Rainfall deviation from the long period average (LPA) of 953.4 mm is presented in the figure 3. Based on the India Meteorological Department (IMD) classification, if the rainfall received in that particular year is within + 19% of the LPA, that year is called as a normal rainfall year, <-19% to -59% of the LPA is deficit rainfall year, <-59% of LPA is grouped under scanty rainfall year. On the other hand, if the rainfall is >+19% to +59% of LPA, it is excess rain fall year and >+59% LPA is termed as wet year. Out of 30 years of rainfall considered for the analysis, 17 years had normal rainfall, 4 years had excess rainfall and 9 years had deficit rainfall (Figure 3). There is no definite periodicity of normal / excess / deficit rainfall years. However, there are raising and falling epochs observed. Consecutive drought years are also quite common which would impact not only agriculture but also the water availability in the region (both agriculture and non agriculture including domestic purposes). Almost once in every 5 years, there was a severe consecutive drought for a period of 1-2 years. Worst drought hit in the area during 1982, 1986, 1988, 1995, 2001, 2003, 2006, 2008 and then again during 2009.
Figure 3. Annual Rainfall deviation from Normal
4

b. Monthly and Seasonal rainfall Distribution of mean rainfall during different months of a year is presented in Figure 4. The region receives uni-model rainfall with its major peak during NEM. There is also considerable amount of rainfall during SWM and pre-monsoon (Summer) seasons. Major rainfed crop season falls between September to December. Peak rainfall is received in the month of November followed by October.
Figure 4. Normal monthly rainfall distribution
The entire year has been divided into following 4 major seasons:
5

i. Cold Weather Period (CWP) /Winter: January – February ii. Hot Weather Period (HWP) / Summer: March – May iii. South West Monsoon (SWM): June – September iv. North East Monsoon (NEM): October – December
The amount of rainfall received in the study region during the above four seasons over a period of 30 years from 1981 – 2010 is presented in Figure 5. Among the four different seasons, maximum amount of rainfall with high dependability is received in NEM season. NEM and SWM seasons have a mean rainfall of 471.8 and 284.8 mm respectively. From the above graph, it is clear that even with high probability (80%), the quantum of rainfall expected in NEM season is close to 300 mm which indicates that rainfed cropping with less climatic risk is possible only during NEM in the selected watershed.
Figure 5. Rainfall distribution in different seasons (1981-2010)
c. Rainfall analysis during monsoon season Rainfall received during the SWM and NEM are presented as a bar chart. To takeout the year to year variability and to study the trend, a five year moving average line was drawn (figure 6). Rainfall deviation from the normal during SWM and NEM is presented in Figure 7. Moving average of SWM clearly indicates that the quantum of rainfall received during the SWM is slightly decreasing over time. In the case of NEM, there is clear epochs of increasing and decreasing trends are noticed.
Figure 6. Five years moving average of Rainfall in SWM & NEM (1981-2010) SWM NEM
6

Figure 7. Rainfall Deviation (% from the Normal) in SWM & NEM (1981 –
2010) SWM NEM
Among the 30 years, 19 years received either normal / above normal / excess rainfall during the southwest monsoon. Six years recorded deficit rainfall and 3 years had scanty rainfall. In the absolute terms, only during 10 years, the SWM received more than average rainfall. This indicates that cropping during SWM is highly risky and hence the amount of rainfall received may be properly stored in the soil for utilizing it in the NEM season crop. In contrast, during NEM, among the 30 years, 13 years had normal rainfall and 4 years had excess rainfall, 3 years were wet years and 11 years received either deficit (10 years) or scanty rainfall (1 year). Water conservation measures and protective irrigation are essential to ensure good yields during NEM. Table 2. SWM Rainfall diagnostics of Anjululipatty watershed in Tamil Nadu Year Date of
Monsoon onset
Date of withdrawl of Monsoon
LGP Rainfall during SWM
No.of rainy days
Wet spell weeks
Dry spell weeks
7

1981 19-Jun 18-Sep 92 348 23 2 8
1982 1-Jun 23-Sep 115 231.9 15 1 11
1983 7-Jun 22-Sep 108 344.9 25 1 10
1984 7-Jun 29-Sep 115 277 23 1 11
1985 6-Jun 28-Sep 115 449.6 18 3 11
1986 1-Jun 29-Sep 121 203 15 0 14
1987 2-Jun 29-Sep 120 231.5 16 0 12
1988 2-Jun 27-Sep 118 431.3 27 2 8
1989 1-Jun 28-Sep 120 458.9 26 4 11
1990 2-Jun 26-Sep 117 194.1 16 0 11
1991 1-Jun 27-Sep 119 319.8 18 2 11
1992 1-Jun 30-Sep 122 402.7 21 2 12
1993 4-Jun 30-Sep 119 315.8 16 2 10
1994 15-Jul 30-Sep 78 240.1 9 3 8
1995 17-Jun 19-Sep 95 368.6 19 2 8
1996 9-Jun 29-Sep 113 435.2 23 2 10
1997 5-Jun 21-Sep 109 315.9 20 1 10
1998 10-Jun 28-Sep 111 338.1 21 3 11
1999 10-Jul 28-Sep 81 114.3 9 0 9
2000 1-Jun 28-Sep 120 387.5 19 2 12
2001 26-Jul 24-Sep 61 117.2 12 0 4
2002 1-Jun 28-Sep 120 183.3 17 0 13
2003 15-Jun 28-Sep 106 115.9 14 0 15
2004 1-Jun 29-Sep 121 411.4 27 2 12
2005 5-Jun 27-Sep 115 309.8 21 1 10
2006 5-Jun 26-Sep 114 98.1 10 0 15
2007 7-Jun 30-Sep 116 263.2 18 2 13
2008 2-Jun 9-Sep 100 167.9 15 0 11
8

2009 16-Jun 28-Sep 105 159.4 15 1 12
2010 4-Jun 29-Sep 118 308.7 22 2 9
Table 2. NEM Rainfall diagnostics of Anjukulipatty watershed in Tamil Nadu Year Date of
Monsoon onset
Date of withdrawl of Monsoon
LGP Rainfall during SWM
No.of rainy days
Wet spell weeks
Dry spell weeks
1981 8-Oct 22-Dec 76 432 28 2 4
1982 2-Oct 12-Dec 72 235.5 16 1 5
1983 9-Oct 26-Dec 79 663.6 30 5 3
1984 4-Oct 31-Dec 89 249.7 13 3 10
1985 1-Oct 17-Dec 78 270.4 15 1 9
1986 2-Oct 28-Dec 88 249.6 20 2 8
1987 3-Oct 24-Dec 83 650.3 30 4 3
1988 10-Oct 7-Dec 59 138.5 10 1 6
1989 1-Oct 12-Dec 73 525.6 29 4 1
1990 1-Oct 6-Dec 67 440.1 21 3 4
1991 1-Oct 17-Dec 78 319.1 24 2 5
1992 3-Oct 20-Dec 79 400.5 22 1 5
1993 6-Oct 24-Dec 80 1095.9 38 7 0
1994 1-Oct 22-Dec 83 537.9 26 3 6
1995 2-Oct 10-Dec 70 249.9 12 2 6
1996 8-Oct 18-Dec 72 364.5 22 1 5
1997 4-Oct 23-Dec 81 878.4 47 5 1
1998 3-Oct 13-Dec 72 530.2 25 3 3
1999 1-Oct 25-Dec 86 515.8 34 3 6
2000 1-Oct 29-Dec 90 353.7 18 2 6
2001 10-Oct 23-Dec 75 387 23 1 4
9

2002 6-Oct 10-Dec 66 490.1 25 3 5
2003 2-Oct 30-Nov 60 360.3 26 3 2
2004 2-Oct 15-Dec 75 431.2 31 3 5
2005 3-Oct 18-Dec 77 977.2 30 3 2
2006 8-Oct 12-Dec 66 423.5 30 3 2
2007 14-Oct 21-Dec 69 693.8 25 4 5
2008 12-Oct 16-Dec 66 423.3 26 3 5
2009 10-Oct 22-Dec 74 237.3 21 2 5
2010 2-Oct 13-Dec 74 629.5 33 6 3
Table 2. Rainfall diagnostics of Anjukulipatty watershed in Tamil Nadu for the second season (Rainfed season) crop (September – January) Year Date of
Monsoon onset
Date of withdrawl of Monsoon
LGP Rainfall during SWM
No.of rainy days
Wet spell weeks
Dry spell weeks
1981 2-Sep 22-Dec 112 432 40 3 6
1982 4-Sep 12-Dec 100 235.5 26 2 7
1983 1-Sep 26-Dec 113 663.6 36 6 6
1984 16-Sep 31-Dec 98 249.7 19 3 11
1985 2-Sep 17-Dec 107 270.4 23 3 9
1986 1-Sep 28-Dec 113 249.6 26 3 8
1987 15-Sep 24-Dec 99 650.3 32 4 3
1988 5-Sep 7-Dec 94 138.5 20 1 8
1989 1-Sep 12-Dec 103 525.6 41 4 2
1990 8-Sep 6-Dec 90 440.1 29 3 6
1991 5-Sep 17-Dec 104 319.1 30 2 6
1992 3-Sep 20-Dec 109 400.5 32 3 7
1993 5-Sep 24-Dec 109 1095.9 43 7 3
1994 6-Sep 22-Dec 108 537.9 33 5 8
10

1995 6-Sep 10-Dec 96 249.9 18 2 9
1996 1-Sep 18-Dec 109 364.5 30 2 5
1997 5-Sep 23-Dec 109 878.4 53 7 3
1998 1-Sep 13-Dec 104 530.2 31 4 6
1999 20-Sep 25-Dec 94 515.8 37 4 5
2000 9-Sep 29-Dec 105 353.7 25 3 7
2001 11-Sep 23-Dec 103 387 30 1 6
2002 5-Sep 10-Dec 97 490.1 30 4 7
2003 5-Sep 30-Nov 87 360.3 29 2 6
2004 3-Sep 15-Dec 104 431.2 48 7 5
2005 1-Sep 18-Dec 109 977.2 38 7 6
2006 3-Sep 12-Dec 101 423.5 38 3 3
2007 4-Sep 21-Dec 109 693.8 29 3 10
2008 1-Sep 16-Dec 107 423.3 29 3 10
2009 14-Sep 22-Dec 100 237.3 27 1 10
2010 13-Sep 13-Dec 92 629.5 39 6 4
Onset of monsoon: When two or more rainy days consecutively occur after June 1st with minimum of 25 mm of rainfall in the first rain spell was considered as onset of monsoon.
Figure 7. Frequency of SWM onset
11

Figure 7. Frequency of NEM onset
Table 3.SWM Rainfall behaviour based on onset week
Monsoon Onset weeks
Frequency of onset (No.)
Rainfall (mm)
Rainy days (No.)
LGP (days)
LGP (Weeks)
Wet spell (Weeks)
Dry spell (Weeks)
Normal (Weeks)
Jun 1-7 21 300.3 19.3 116.3 16.6 1.3 11.3 4.0
Jun 8-14 2 386.65 22 112 16 2.5 10.5 3.0
Jun 15-21 4 248.0 17.8 99.5 14.2 1.3 10.8 2.2
Jul 6-12 1 114.3 9 81 11.6 0 9 2.6
Jul 13-19 1 240.1 9 78 11.1 3 8 0.1
Jul 20-26 1 117.2 12 61 8.7 0 4 4.7
12

Out of 30 years, the frequency of onset of SWM was maximum (70 %) during first week of June (June 1-7) followed by June third week (13 % - June 15-21). According to the analysis during 70 per cent of the times the average SWM rainfall is around 300 mm in 19 rainy days with a LGP of 116 days (16.6 weeks). Out of which around 11.3 weeks dry spell could occur resulting in reduced crop productivity depending upon the stage of the crop in which it is exposed to water stress. There is also possibility for wet spell of around 1.3 weeks which may be advantageous to crop growth, however, if it coincides with critical crop growth stage such as flowering then it would affect the productivity. In general, when the onset is delayed beyond 3rd week of june the LGP gets reduced with reduction in number of rainydays.
Table 3.NEM Rainfall behaviour based on onset week
Monsoon Onset weeks
Frequency of onset (No.)
Rainfall (mm)
Rainy days (No.)
LGP (days)
LGP (Weeks)
Wet spell (Weeks)
Dry spell (Weeks)
Normal (Weeks)
Oct 1-7 21 494.8 25.5 77.2 11.0 3.1 4.5 3.5
Oct 8-14 9 418.2 23.9 70.7 10.1 2.4 4.3 3.3
Out of 30 years, the frequency of onset of NEM was maximum (70 %) during first week of October (Oct 1-7) followed by October second week (30 % - Oct 8-14). According to the analysis during 70 per cent of the times the average NEM rainfall is around 495 mm in 26 rainy days with a LGP of 77 days (11 weeks). Out of which around 4.5 weeks dry spell could occur resulting in reduced crop productivity depending upon the stage of the crop in which it is exposed to water stress. There is also possibility for wet spell of around 3.1 weeks which may be advantageous to crop growth, however, if it coincides with critical crop growth stage such as flowering then it would affect the productivity.
Table 3. Rainfall behaviour based on onset week for the September – January – second season crop
Monsoon Onset weeks
Frequency of onset (No.)
Rainfall (mm)
Rainy days (No.)
LGP (days)
LGP (Weeks)
Wet spell (Weeks)
Dry spell (Weeks)
Normal (Weeks)
13

Sep 1-7 22 486.0 32.9 104.7 15.0 3.8 6.4 4.8
Sep8-14 5 409.5 30 98 14 2.8 6.6 4.6
Sep 15-21 3 471.9 29.3 97 13.9 3.7 6.3 3.9
Out of 30 years, the frequency of onset of NEM was maximum (73 %) during first week of September (Sep 1-7) followed by September second week (16 % - Sep 8-14). According to the analysis during 73 per cent of the times the average NEM rainfall is around 486 mm in 33 rainy days with a LGP of 104 days (15 weeks). Out of which around 6.4 weeks dry spell could occur resulting in reduced crop productivity depending upon the stage of the crop in which it is exposed to water stress. There is also possibility for wet spell of around 3.8 weeks which may be advantageous to crop growth, however, if it coincides with critical crop growth stage such as flowering then it would affect the productivity.
B. Temperature Temperatures play a major role in determining the growth, productivity and duration of the crop growth. Increase in mean temperature would reduce the crop duration and there by decrease the time available for the plants to photosynthesis and accumulate the food material into the sink (grain). Increase in daytime temperature will have greater influence on rate of photosynthesis / respiration related gas exchanges. Moreover, it would also increase the crop water requirement by increasing the rate of evapotranspiration. If the day temperatures exceed 32 - 35 0C during the flowering phase, it will have impact on pollination and grain setting. Increase in night time temperature will have larger impact on yield of the crops as the photosynthates accumulated during the day time hours will be wasted during night hours as a result of increased respiration rate. Production of annual crops will be affected by the increase in mean temperature of 2 – 4 0C expected towards the end of the century. In future warmer climate, time of planting has to be adjusted in such a way that the flowering phase do not coincide with the hot days, to ensure better yields. Mean maximum and minimum temperatures prevailed during SWM and NEM in addition to annual mean temperature in the study region were analyzed for its trend considering 37 years data set and the results are presented in Figure 8.
Figure 8. Trend Line for Maximum & minimum Temperature
Maximum Temperature Minimum Temperature
Annual Annual
14

SWM SWM
NEM NEM
Season Maximum Temperature Minimum Temperature
Trend equation R2 value Trend equation R2 value Annual y = 0.007x + 30.49 0.05784 Y = 0.015x + 20.15 0.2799 SWM y = 0.009x + 30.40 0.04556 Y = 0.011x + 21.29 0.16494 NEM y = 0.005x + 28.27 0.01964 Y = 0.012x + 19.25 0.07844
Trend analysis results clearly state that minimum temperatures are increasing at a faster rate compared to maximum temperature. Mean maximum/minimum temperatures recorded during annual, SWM and NEM are 30.49/20,15, 30.40/21.29 and 28.27/19.250C respectively. Increase in maximum temperature is more during 15

SWM period and the observed rate of increase is 0.9 0C over a period of 100 years while it was only 0.5 0C during NEM. In the case of minimum temperature, the rate of increase in NEM is observed to be higher (1.2 0C) compared to SWM season (1.1 0C) during the past century. As the major crop growing season is falling in NEM, if the trend of higher rate of increase in night time temperature continues, it would definitely decline the productivity of many annual crops. Extreme Weather Events Analysis
Weather has the most significant influence on agriculture. Besides this, extreme weather events like drought / dry spell, frost, storms and even aberration in weather cause obvious impacts. The study area has comfortable temperatures during the crop growing season. The major constraint for crop production is only rainfall/ water. Table 4. Extreme events (Droughts, floods, cyclones, storms and other)
Year Event Implication on
Livelihood Implications on Social Life 1979 Flood Crops immersed 4 persons and few cattle
washed away by flood
1984 Flood Crops damaged Mango trees were uprooted in many fields.
1990 Flood Crops damaged 8 persons and few cattle washed away by flood
2002-03
Drought Water scarcity, Loss in crop production, Numerous coconut trees infected by pests
Migration
2005 Flood Crops damaged Lack of feed for cattles. 2012-
13 Drought Decrease in crop
production, Numerous coconut trees has been wilted
Migration
III. Future Climate projections
Development of Future climate Projections: The future climate change scenario was developed using Regional Climate Models (RCM) viz., PRECIS which was developed by Hadley centre, UK met office that can be used over any part of the globe. Special Report on Emission Scenario (SRES)- A1B scenario was selected which is likely to happen in Indian sub continent. From the large number of
16

generated output from the models, only maximum temperature, minimum temperature and rainfall were retrieved. Models were run for 129 years from 1971 to 2099.Decadal means of maximum and minimum temperatures were generated to understand the variation more clearly. Decadal mean for the maximum and minimum temperatures along with its deviation from the base line data (Referred as year 2010) along with expected change in rainfall is presented in Table 5.
Table 5. Expected decadal variations in Temperature, Rainfall and CO2 Timeline Expected
Maximum Temp
Deviation Expected minimum Temp
Deviation Expected changes in Rainfall
Expected CO2 level
2010 34.0 0 22.5 0 0 370
2020 34.46 0.46 23.0 0.5 2 385
2030 34.55 0.55 23.17 0.67 5 420
2040 34.72 0.72 23.56 1.06 7 470
2050 34.97 0.97 24.09 1.59 7 500
2060 35.43 1.43 24.56 2.06 9 520
2070 35.85 1.85 25.03 2.53 10 535
2080 36.23 2.23 25.44 2.94 11 550
2090 36.85 2.85 26.08 3.58 13 565
2100 37.67 3.67 26.63 4.13 13 588
Survey results
Assets and Action
Sl.No Livelihood - Assets
Risk Actions Actors
1 Agriculture Water scarcity Irrigation facilities, well digging,
Self, project and panchayat,
17

bore well, Farmes club Field Bunding, check dam
Project, Farmers, Panchayat
2 Goat rearing
Diseases (Sore mouth, Diarrhea, water discharge from eyes,
Vaccination, Take care, Treatment, poundage
Self, Veterinary Hospital
3 Buafflo rearing
Diseases (ring disease due to water scarcity), galgoto, Hoof disease, infection
Vaccination, take care, Treatment, poundage
Self, Animal Department
5 Labour Low wages ,money not given in time, lack of labour work
Migration, enhance the working days, generate new employment scheme, increase wages.
Panchayat, Government
Viral fever, Malaria, Dengu, Chikengunia
Primary health centre
Seasonal Calendar
S. No. Climatic change Jan Feb Mar Apr May Jun Jul Aug Sep Oct Nov Dec
1 Rainfall measures *** * *** *** *** 2 Mist ** **
3 Drought period without rainfall *** *** ***
4 Dieses of domestic animals ** *** ***
5 Fodder scarcity for domestic animals *** *** ***
6 Water scarcity ** *** ***
18

7 Human ailments *** ** ** 8 Temperature ** *** *** **
Livelihood Calendar
S. No. Agriculture Jan Feb Mar Apr May June July Aug Sep Oct Nov Dec 1 Tomato P P P W H/S 2 Groundnut P P W H / S 3 Brinjal P P W H/S 4 Cotton P W H S 5 B Gram H/S H/S P P H/S 6 Fruits P 7 Milk production I D D D D
I I I
8 Meat D D D D 9 Sales of animals S S 10 Millets SO SO H/S H/S
19

20

1.Climate Proofing Table -Anjukulipatti
Climate variability
Direct impacts Indirect impacts
Non Climatic Stress
Sensitivities Existing /local adaptive capacities to deal with climatic stresses
Suggested Adaptation Strategies
Consecutive drought
Depletion of surface/ ground water Soil erosion Low soil moisture content Scarcity of water for domestic and farming Low crop yield Lesser availability of fodder Perennial mango trees dried up
Scarcity of food grains, fodder. Economic growth dips Famers face poverty Distress sale of livestock Increase in drudgery Migration?
Forest fire in the fringe forest areas leading to crop raiding by wild animal Cost of food materials increases. High dependence on money lenders for credit. Migration of people and scarcity for labour
>75% of the area under rainfed condition More small and marginal farmers– highly vulnerable even to small changes Poor awareness/ access to Govt. schemes
Earning family members migrate to other districts for alternate employment Collection of NTFP in the nearby forest areas Growing goats for sale in the distress period Integrated farming system (crop + livestock) Livelihood support/ Loan waiver from Govt schemes like Puthu Valvu Thittam
Ground water recharge through 1. Field Bunding, Farm
Pond, , Well Recharge pits, Loose rock bold structures, sunken ponds, water absorption trenches (WAT)
Arresting soil erosion in the sloppy land (26 – 30 % slope) through
1. water absorbtion trenches, Gabion Check dams,
2. Planting Glyricidia along the field bunds and in the boundaries of water harvesting structures
Promoting vegetation in the pasture land to provide fodder during drought through

1. Promotion of tree species planting in the pasture land such as Neem/ Acha/ Subabul/ Velvel/ Glyrecidia/ Kodukkapuli and broadcasting the seeds of grass and leguminous species in the pasture land
Fodder and water management for animals through
1. Fodder saving: Silage making on demonstration
2. Fodder supplementation by Promoting Azolla cultivation
Capacity building and developing institutional arrangement for :
1. Promotion of organic farming to conserve the soil fertility
2. Sharing information on Government schemes and subsidies available

Increasing availability of seeds and fodder during drought period through
1. Creation of community Fodder Bank and seed bank linking Farmers club and SHGs
Increasing water use efficiency by
1. Promoting micro irrigation (Drip and sprinkler) for critical irrigation
2. Mulching with coir pith Promoting crop insurance & livestock insurance as climate risk transfer mechanism. To create alternate livelihood against climatic risk and off season employment generation:
1. Agro-forestry of multipurpose tree species and horticulture plantation;
2. Developing micro enterprises from vegetable cultivation,

dairy and poultry and so on
Alternative energy source: Biogas Practicing climate responsive farming for maximizing input use efficiency: Using weather based Agro-advisory services through Automatic weather station (AWS) for farm decision making Financial inclusion and credit facilitation through banking plan
a.
Excess rainfall
Destruction of crop Excessive top soil erosion Formation of gullies and ravines in pasture lands and exposure of bed rock surface due to loss of top soil Damage to Standing crop
Reduced Income from crops due to lower productivity Top soil nutrients loss and poor soil fertility Increased investments for fertilizers and soil nutrients
Land use changes from pastures to agriculture lands
Runoff interception/ recharge capacity not adequate
R&M of field bunds/Farm ponds, checks dams by individual farmers
Maximizing runoff interception through 1. Creation and maintenance of water harvesting structures by Farmers and VWC 2.Plantation in the slopes and Grass seeding 3. Planting of tree species in the stream banks to protect from damage

Breaching of existing water harvesting structures Increase in siltation in water harvesting structures Increased incidence of pest and diseases
Less ground water recharge from water harvesting structures due to silt accumulation
Intermittent dry spell
Moisture availability reduces
Reduction in crop productivity
Low income Watering of mango using tanker Mulching
Planting of drought tolerant mango varieties to withstand extreme temperature Micro irrigation
High wind velocity
Physical damage to agriculture crops, Withering of mango flowers, breaking of mango tree branches
Reduction of yield Loss of income Indebtedness with moneylenders
Planting of neem and tamarind, teak around the boundary of mango orchard
Developing wind breaks in the watershed area

Appendix 2: Climate Proofing Table
2.Climate Proofing Table for AYYAMPALAYAM WATERSHED
Climate variability
Direct impacts
Indirect impacts
Non Climatic Stress
Sensitivities Existing /local adaptive capacities to deal with climatic stresses
Suggested Adaptation Strategies
Activities proposed
Drought Depletion of soil moisture
Scarcity of fodder
High dependence
High dependence
Restructuring the right side supply channel of
Cultivation of minor millets
Hail storm Physical damages to horticultural plantation Damage to fruits
Loss of yield Reduction of income
- Dependent on plantation horticulture for livelihood
- Scientific management of plantation Crop Insurance
High temperature coupled with continuous rainfall
Soil moisture evaporation
Withering of flowers mango plantations Loss of mango yield Reduction of income
- - Spraying chemicals to minimize the flower withering
Improved resistant varieties of mango Scientific management of orchards

content and ground water & water scarcity Withering of more coconut and mango trees Low yield and Lesser availability of fodder
Soil becomes more vulnerable to erosion leading to low fertility
on money lenders for credit. Pilferage and minor crimes High mental stress due to borrowing Increase in migration of labour.
on rain fed crop Poor irrigation management in right side supply channel of Maruthanathi Low soil fertility Lack of desilting in tanks and channels Negligence of traditional practices and drought hardy varieties
Dependence on tree Fodder Few farmers Switching to low water requiring crops like fodder sorghum
Maruthanathi for efficient irrigation Ground water recharge through recharge pits Protecting the existing trees with pot irrigation and mulching tree bottom with coir dust Introducing short duration drought hardy tree crops like Soobabul and tamarind Introducing Cashew and Aonla plantation in suitable areas Encouraging azolla cultivation Capacity building programme on innovative technologies Promoting crop insurance & livestock insurance Creating alternate livelihood options like mushroom cultivation, Value addition of
Azolla cultivation Integrated farming system Kurangad development Summer ploughing Deep tillage Well recharge pits Tank silt/ FYM application Drip irrigation Sprinkler irrigation Fodder development

coconut waste, Aonla and mango Promoting Biogas as alternate energy source Introducing weather based Agro-advisory services and Village knowledge centre Financial inclusion and credit facilitation through banking plan
a.
Intermittent dry spell
Less soil moisture and poor crop growth leading to low yield
Low income to farm families
No specific non climatic
stress
Low soil organic matter and poor moisture holding capacity
Irrigation (Open well) at critical period
by some farmers
Soil mulching by few farmers
Encouraging Micro irrigation systems particularly to coconut, mango, aonla and vegetables Encouraging vegetable cultivation under shade nets to minimize the impact of dry spells
Excess rainfall
More top soil erosion in the foot hills of Mankaradu, Peeli karadu
Low soil fertility Reduced Income to farm families
Land use changes from fallow to agriculture lands
Sloppy terrain with soil prone to erosion. Lack of contour bunding
Raising stone walls in few places to minimize erosion
Maximizing runoff interception through loose boulder structures Introducing soil binding grasses like vetti ver in sloppy terrains

Shedding of flowers in mango and cashew, sudden shedding in coconut leading to poor yield Breaching of existing water harvesting structures
Establishing shelter facilities to live stocks
Temperature extremes
Leaf scorching, flower shedding leading to low and poor quality yield. High incidence of Foot and mouth and other
Low income to farmers and more live stock mortality. Low animal productivity and mortality
High mental tension due to loss incurred
Lack of heat management technologies Lack of shade net cultivation
Confining animals under thatched roofs and tree shade
Introducing shade net cultivation and micro sprinklers Introducing live stock insurance Better livestock management practices

diseases in animals
Delayed onset of monsoon
Low Moisture availability at critical growth stage of the crop Poor pasture growth
Poor flowering and seeding Poor crop productivity & Crop Failure
- Choice of varieties suitable for the condition are not cultivated Lack of cultivation of alternative crops
Left as fallow land
Agronomic interventions to increase the crops productivity Short duration varieties suitable for late sowing condition Crop diversification: Growing alternate crops that mature in 60 – 70 days Intercropping in horticulture farms
High wind speed
Damage to crops in particular to horticulture Plants Low yield Poor quality
Low income Mental stress due to crop loss in one
day
Lack of wind barriers around
the farm Lack of crop
insurance
Artificial support to
trees during heavy wind
periods
Introducing crop insurance Establishing wind barriers

3.Climate Proofing Table -Sriramapuram
Climate variability
Direct impacts Indirect impacts
Non Climatic Stress
Sensitivities Existing /local adaptive capacities to deal with climatic stresses
Suggested Adaptation Strategies
Drought Yield decrease Lesser availability of fodder Poor access to quality drinking water
Loss of income Overgrazing of pasture Soil becomes more vulnerable to erosion
No use of drought resistant varieties High dependence on money lenders for credit.
High dependency on agricultural production Lack of market access High dependence on rain fed crop
Knowledge of robust crop varieties Livestock as insurance (local breeds of livestock)
Efficient irrigation systems (sprinkler, drip irrigation) Summer ploughing and deep tillage to observe more rain water, Tanksilt application to enhance the soil fertility . Promoting Azolla cultivation and Kitchen garden

Reduced vegetative cover Water scarcity
Reduction in soil fertility Distress sale of livestock Lack of drinking water
shifted more on livelihood; Health/ Education get neglected Increase in migration
Poor irrigation management Low soil fertility Poor vegetative cover Poor awareness on quality of water for domestic use
Lack of meteorological information Diverse cropping patterns Integrated farming system (crop + livestock)
Ground water recharge through Recharge pits . Promotion of Vermi compost unit to enhance the soil fertility Integrated farming system (crop + livestock) Sharing information on Government schemes and subsidies available Increasing availability of seeds and fodder during drought period through Kurangardu development. Promoting crop insurance & livestock insurance as climate risk transfer mechanism. To create alternate livelihood against climatic risk and off season employment generation: Alternative energy source: Biogas , Practicing climate responsive farming for maximizing input use efficiency: Using weather based Agro-advisory services through Automatic weather station (AWS) for farm decision making

Delayed on set of monsoon
Incidences of pests / diseases Poor pasture growth Salinization of soil Increasing competition with weed species for water.
Poor seeding Poor crop productivity & Crop Failure Late crops: missing market advantage
Health problems Forestry conservation activities are affected
Poverty Choice of varieties suitable for the condition are not cultivated Lack of cultivation of alternative crops
Overuse of pesticides Traditional late sown varieties (Short duration varieties of Maize)
Alternate crops (pulses / fodder sorghum Agronomic interventions to increase the crops productivity Mulching, mixed cropping etc Short duration varieties suitable for late sowing condition
Intermittent dry spell
Reduction in crop productivity
Moisture availability less
Low income - Irrigation (Open well) at critical period by some
farmers
Micro irrigation devices for critical irrigation .
Temperature extremes
Reduced crop yield
Loss of income
High dependency on agricultural production Lack of market access
Knowledge of robust crop varieties Diverse cropping patterns
Crop insurance Agricultural extensions Training on adjusted agricultural practices
Heavy wind Physical damage of
Loss of income
High dependency on agricultural production
Tree shelters around fields and houses
Soil conservation Growing shelter Belts / wind breaks: Casurina

crops / Crop loss Reduction of crop yield Soil erosion
Migration
Lack of vegetation / trees
Cold wave Crop Damage Increased Livestock Mortality
Soil erosion Poor quality of food grain
Less market price Traditional methods being used for crop
protection Temporary cattle shed being built
Livestock insurance Crop insurance
Flood Soil erosion Loss of fertile top soils
Loss of agricultural land
Pressure of grazing (goat) and tree cutting
Sandy soils/ exposed topsoil due to lack of vegetation
Small rainwater harvesting structures Field bunds
Farm ponds and stone bunds
4.Climate Proofing Table for Bettamugilalam Watershed.
Climate variability
Direct impacts Indirect impacts
Non Climatic tress
Sensitivities Existing /local adaptive capacities to deal with climatic stresses
Suggested Adaptation Strategies
Consecutive Drought
Low soil moisture
Low farm income
Borrowing loans from
High dependence on rain fed crop
Selling live stock to generate liquid
Establishing well recharge pit Summer ploughing

content and depletion of ground water leading to Scarcity of water for farming and domestic Low crop yield Lesser availability of fodder Higher livestock mortality
Soil becomes less fertile lossing structure. Reduction in soil fertility Distress sale of Agricultural land and livestock
local money lenders. Neglecting Education to children
Poor irrigation management Low soil fertility Poor awareness on quality of water for domestic use Poor institutional mechanism for proper land management Poor awareness/ access to Govt. schemes
cash during stress time
Micro irrigation Creating alternate income source through mushroom cultivation, bee keeping, making furniture from Lantana camara value addition to minor millets. Capacity building programe on above mentioned alternate livelihood opportunities Encouraging Integrated Farming system ( Agriculture + Floriculture + Horticulture+ Livestock + Vermicompost)
Excess rainfall/ increase in rainfall intensity
More top soil erosion Formation of gullies and ravines in pasture lands and exposure of bed rock surface due to loss of top soil Total crop loss due to flooding
Top soil nutrients loss and poor soil fertility Reduced Income from crops due to lower productivity Increased investments for fertilizers
Land use changes from pastures to agriculture lands Productivity loss Demand for food grains
Sloppy terrain with soil prone to erosion Livestock diseases Loss of interest in Agriculture
Renovation of existing Water Harvesting Structures by individual farmers Tree plantation to avoid excess runoff
Maximizing runoff interception by contour bunding/ trenching and Plantation in the slopes and Grass seeding Fodder supplementation by Promoting Azolla cultivation Promoting Compost pits and Vermicompost units for increasing, soil fertility Agricultural productivity and to minimize Inorganic Fertilizers usage.

Increase in siltation in water harvesting structures Increased incidence of pest and diseases
and soil nutrients Less ground water recharge from water harvesting structures due to silt accumulation
Improving productivity of soil through application of Tank silt.
High wind speed
Affects vegetable crops, Lowers ground water table
Agricultural production loss
High mental stress due to crop loss
No proper wind shelter belts around agricultural fields
Crop support using wooden poles
Promoting Wind Barrier trees like casuarinas, silver oak
Low night temperature and occurrence of dew
Affects vegetable crops production, more pest and disease, Reduced flower quality
Low income to farm families
High mental stress due to
crop loss
Lack of innovative techniques and knowledge to
prevent damage during dew
- Imparting training on recent techniques Spraying using mineral oil
Intermittent dry spell
Low soil moisture Reduction in crop productivity
Low income to farmers
- Lack of soil mulching
Irrigation (Open well) at critical period by some
farmers
Increasing water use efficiency by Promoting Drip irrigation Shade net cultivation

and low quality produces Low animal productivity
5. Climate Proofing Table for Salivaram Watershed.
Climate variability
Direct impacts Indirect impacts
Non Climatic tress
Sensitivities Existing /local adaptive capacities to deal with climatic stresses
Suggested Adaptation Strategies
Consecutive Drought
Low soil moisture content and depletion of ground water leading to Scarcity of water for farming and domestic
Low farm income . Reduction in soil fertility
Borrowing loans from local money lenders.
High dependence on rain fed crop Poor irrigation management Low soil fertility Poor awareness on quality of water for domestic use
Selling live stock to generate liquid cash during stress time
Establishing well recharge pit Summer ploughing Micro irrigation Creating alternate income source through mushroom cultivation, bee keeping, making furniture from Lantana camara, Sericulture and value addition to minor millets.

Low crop yield Lesser availability of fodder Higher livestock mortality
Poor Technical awareness for proper land management Poor awareness/ access to Govt. schemes
Capacity building programe on above mentioned alternate livelihood opportunities Encouraging Integrated Farming system
Excess rainfall/ increase in rainfall intensity
More top soil erosion Formation of gullies and ravines in pasture lands and exposure of bed rock surface due to loss of top soil Total crop loss due to flooding Increase in siltation in water harvesting structures Increased incidence of
Top soil nutrients loss and poor soil fertility Reduced Income from crops due to lower productivity Increased investments for fertilizers and soil nutrients Less ground water recharge from water harvesting structures due
Land use changes from pastures to agriculture lands Productivity loss Demand for food grains
Sloppy terrain with soil prone to erosion Livestock diseases Loss of interest in Agriculture
R&M of field bunds/ checks by individual farmers Tree plantation to avoid excess runoff
Maximizing runoff interception contour bunding/ drenching and Plantation in the slopes and Grass seeding Fodder supplementation by Promoting Azolla cultivation Promoting Compost pits and Vermicompost units for increasing Agricultural productivity and to minimize Inorganic Fertilizers usage. Improving productivity of soil through application of Tank silt.

pest and diseases
to silt accumulation
High wind speed
Affects vegetable crops, Lowers ground water table
Agricultural production loss
High mental stress due to crop loss
No proper wind shelter belts around agricultural fields
Crop support using wooden poles
Promoting Wind Barrier trees like casuarinas, silver oak
Low night temperature and occurrence of dew
Affects vegetable crops production, more pest and disease, Reduced flower quality
Low income to farm families
High mental stress due to
crop loss
Lack of innovative techniques and knowledge to
prevent damage during dew
- Imparting training on recent techniques like; Spraying using mineral oil
Intermittent dry spell
Low soil moisture Reduction in crop productivity and low quality produces Low animal productivity
Low income to farmers
- Lack of soil mulching
Irrigation (Open well) at critical period by some
farmers
Increasing water use efficiency by Promoting Drip irrigation for critical irrigation Shade net cultivation

General:
1. Changing the system of cultivation; Eg. SRI in paddy and SSI in sugarcane 2. Replacing the existing local varieties with improved varieties 3. Soil Mngt/land mngt 4. Introducing Bio inoculants and biocontrol agents; Azolla, Azospirillum, PPFM spray for drought resistance, T.viridae and Pseudomonas
for pest control 5. Organic farming: Vermicompost, Panchagavya
6.Climate Proofing Table for Thally Kothanur Watershed.
Climate variability
Direct impacts Indirect impacts
Non Climatic tress
Sensitivities Existing /local adaptive capacities to deal with climatic stresses
Suggested Adaptation Strategies
Consecutive Drought
Low soil moisture content and depletion of ground water leading to Scarcity of water for
Low farm income Reduction in soil fertility
Borrowing loans from local money lenders.
High dependence on rain fed crop Poor irrigation management Low soil fertility Poor awareness on quality of water for domestic use
Selling live stock to generate liquid cash during stress time
Establishing well recharge pit Summer ploughing Micro irrigation Creating alternate income source through mushroom cultivation, bee keeping, making furniture from Lantana camara, Sericulture and value addition to minor millets.

farming and domestic Low crop yield Lesser availability of fodder Higher livestock mortality
Poor Technical awareness for proper land management Poor awareness/ access to Govt. schemes
Producer Groups for Sericulture farmers Capacity building programe on above mentioned alternate livelihood opportunities Encouraging Integrated Farming system (Agrl.crop, livestock, Vermicompost)
Excess rainfall/ increase in rainfall intensity
More top soil erosion Formation of gullies and ravines in pasture lands and exposure of bed rock surface due to loss of top soil Total crop loss due to flooding Increase in siltation in water harvesting structures
Top soil nutrients loss and poor soil fertility Reduced Income from crops due to lower productivity Increased investments for fertilizers and soil nutrients Less ground water recharge from water
Land use changes from pastures to agriculture lands Productivity loss Demand for food grains
Sloppy terrain with soil prone to erosion Livestock diseases Loss of interest in Agriculture
R&M of field bunds/ checks by individual farmers Tree plantation to avoid excess runoff
Maximizing runoff interception contour bunding/ drenching and Plantation in the slopes and Grass seeding Fodder supplementation by Promoting Azolla cultivation Promoting Compost pits and Vermicompost units for increasing Agricultural productivity and to minimize Inorganic Fertilizers usage. Improving productivity of soil through application of Tank silt.

Increased incidence of pest and diseases
harvesting structures due to silt accumulation
High wind speed
Affects vegetable crops, Lowers ground water table
Agricultural production loss
High mental stress due to crop loss
No proper wind shelter belts around agricultural fields
Crop support using wooden poles
Promoting Wind Barrier trees like casuarinas, silver oak
Low night temperature and occurrence of dew
Affects vegetable crops production, more pest and disease, Reduced flower quality
Low income to farm families
High mental stress due to
crop loss
Lack of innovative techniques and knowledge to
prevent damage during dew
- Imparting training on recent techniques Spraying using mineral oil
Intermittent dry spell
Low soil moisture Reduction in crop productivity and low quality produces Low animal productivity
Low income to farmers
- Lack of soil mulching
Irrigation (Open well) at critical period by some
farmers
Increasing water use efficiency by Promoting Drip irrigation Shade net cultivation

General:
1. Changing the system of cultivation; Eg. SRI in paddy and SSI in sugarcane 2. Replacing the existing local varieties with improved varieties 3. Soil Mngt/land mngt 4. Introducing Bio inoculants and biocontrol agents; Azolla, Azospirillum, PPFM spray for drought resistance, T.viridae and Pseudomonas
for pest control 5. Organic farming: Vermicompost, Panchagavya
7.Climate Proofing Table -Madurai
Climate variability
Direct impacts Indirect impacts Non Climatic Stress Sensitivities Existing /local adaptive capacities to deal with climatic stresses
Suggested Adaptation Strategies
Consecutive Drought
Low soil moisture content Water level goes down Water scarcity both human being and live stock Cultivable area reduced
Low income generation Deeping of well and bore well Selling livestock Production of milk and meat reduced Purchased drinking water
High rate of extraction of wood (esp. from pasture lands) for fuel wood during summer. High dependence on money lenders for credit. Focus shifted more on livelihood; Health/ Education get neglected
High dependence on rain fed crop Poor irrigation management Low soil fertility Poor awareness on quality of
Fodder trees with multi-purpose utility conserved Integrated farming system (crop + livestock)
a. Soil mulch Soil mulching practices Soil water conservation measures-s, like summer ploughing, Tank silt

Production and productivity reduced Lesser availability of fodder Reduced vegetative cover Excess heat leads to surface hardening – soil Solarization Low income
Reduction in soil fertility
Increase in migration
water for domestic use Poor social control on grazing Poor awareness/ access to Govt. schemes
Sale of small ruminants at needy time Livelihood support/ Loan waiver from Govt schemes Traditional water bodies with local regulation practices
application, Well recharge pits Rainwater water harvesting Application of Organic manures Increasing fodder cultivation Adopting insurance coverage Adopting Reverse osmosis plant for drinking water
Delayed onset of monsoon
Low Moisture availability at critical growth stage of the crop Poor pasture growth
Low income to farm families and low spending power
Borrowing from money lenders
Choice of varieties suitable for the condition are not cultivated Lack of cultivation of alternative crops
Traditional late sown varieties (Short duration varieties of Maize)
Agronomic interventions to increase the crops productivity; Short duration varieties suitable for late sowing condition Crop diversification: Growing alternate crops that mature in 60 – 70 days

Extreme temperature
Crop Damage and low yield Increased Livestock Mortality
Soil Fertility reduction
Low income
More mental stress
Lack of temperature resilient agro techniques
Avoiding grazing during
hot sun
Seed hardening Soil mulch cover Inter cropping in Livestock insurance Crop insurance
Intermittent dry spell
Less Moisture availability Late crop establishment Poor flower establishment
Reduction in crop productivity
Poor quality produces Less /poor marketing
Poor price
Low income Poor bank repayment Migration for job
Irrigation (Open well) at critical period by some
farmers Crop spray for
avoiding transpiration
loss
Micro irrigation devices Use of Soil mulches Integrated farming system
High rainfall Soil erosion Crop damage Silting in water harvesting structure Poor recharging in soil Damaging of water conservation structures Flower shedding Fruit damage
Development of pest and disease Low income
More cost of cultivation -
Low irrigation management
- Improved shelter facilities to live stock Creating drainage facilities in fields Creating water storage structures

Livestock diseases
8. Climate Proofing Table -Nellai
Climate variability
Direct impacts Indirect impacts
Non Climatic Stress
Sensitivities Existing /local adaptive capacities to deal with climatic stresses
Suggested Adaptation Strategies
Drought/ Consecutive Drought
Low soil moisture content Depletion of surface/ ground water
Scarcity of food grains, fodder & fuel wood Overgrazing of pasture
High dependence on money lenders for credit. Focus shifted more on
High dependence on rain fed crop (Out of 1487 ha, 991.8 ha is purely rainfed) Poor irrigation management
Dry Fodder (paddy straw, sorghum straw, groundnut haulm, Blackgram stalk ) saved for dry season
Ground water recharge through 2. Field Bunding, Farm Pond, ,
Well Recharge pits, Check dams on drainage line
Promoting vegetation in the pasture land to provide fodder during drought through

Scarcity of water for domestic and farming Low crop yield Lesser availability of fodder Poor access to quality drinking water Reduced vegetative cover Excess heat leads to surface hardening – soil Solarization
Soil becomes more vulnerable to erosion Reduction in soil fertility Distress sale of livestock Increase in migration/ lesser availability of agril. Labour Increase in drudgery
livelihood; Health/ Education get neglected Increase in migration
Low soil fertility Poor vegetative cover Poor awareness on quality of water for domestic use Poor social control on grazing Poor institutional mechanism for proper land management Poor awareness/ access to Govt. schemes
Integrated farming system (crop + livestock) Sale of Sheep and Goats at needy time Livelihood support/ Loan waiver from Govt schemes Traditional water bodies with local regulation practices Distress sale of livestock
2. Protecting the existing trees with pitcher irrigation /drip irrigation
3. Promotion of tree species planting in the pasture land such as Neem/ Acha/ Subabul/ Velvel/ Glyrecidia/ Kodukkapuli and broadcasting the seeds of grass and leguminous species in the pasture land
4. Planting fodder trees along the fencing area and field bunds
Fodder and water management for animals through
3. Fodder saving: Silage making 4. Fodder supplementation by
Promoting Azolla cultivation 5. Developing common drinking
water facilities for livestock digging cattle ponds, trough, tank etc.
Capacity building and developing institutional arrangement for : Regulating grazing practices such as Rotational grazing, social fencing, protection of pasture land and benefit sharing

Sharing information on Government schemes and subsidies available Increasing availability of seeds and fodder during drought period through 1.Creation of community Fodder Bank Increasing water use efficiency by Promoting micro irrigation and solar pumping system on demonstrative mode; Promoting crop insurance & livestock insurance as climate risk transfer mechanism. To create alternate livelihood against climatic risk and off season employment generation:
3. Agro-forestry of multipurpose tree species and horticulture plantation;
4. Developing micro enterprises from vegetable cultivation, dairy and poultry and so on
Alternative energy source: Biogas Practicing climate responsive farming for maximizing input use efficiency: Using weather based Agro-advisory services through Automatic weather station (AWS) for farm decision making

Financial inclusion and credit facilitation through banking plan
b.
Intermittent dry spell
Moisture availability less
Reduction in crop productivity
- Low income Irrigation through Bore well and Water tanker at critical period by some farmers
Micro irrigation devices Using Drought resistant crops Spraying of Bio Anti-transpirants
Delayed onset of monsoon/ Late setting of season
Delay in sowing and sometimes no sowing due to fear of late monsoon setting Low Moisture availability at critical growth stage of the crop Poor pasture growth
Reduction of net sown area Shortened LGP Poor flowering and seeding Poor crop productivity & Crop Failure
Lack of early warning system at local level
Choice of varieties suitable for the condition are not cultivated Lack of cultivation of alternative crops Unscientific management of rain fed crops
Traditional late sown varieties.
Agronomic interventions to increase the crops productivity 1. Short duration varieties suitable for late sowing condition
Excess rainfall/ increase in rainfall intensity
More top soil erosion Formation of gullies and ravines in pasture lands and exposure
Top soil nutrients loss and poor soil fertility Reduced Income from crops due to
Land use changes from pastures to agriculture lands
Runoff interception/ recharge capacity not adequate
R&M of field bunds/Farm ponds, checks dams by individual farmers
Maximizing runoff interception through 1. Creation and maintenance of water harvesting structures by Farmers and VWC 2.Plantation in the slopes and Grass seeding
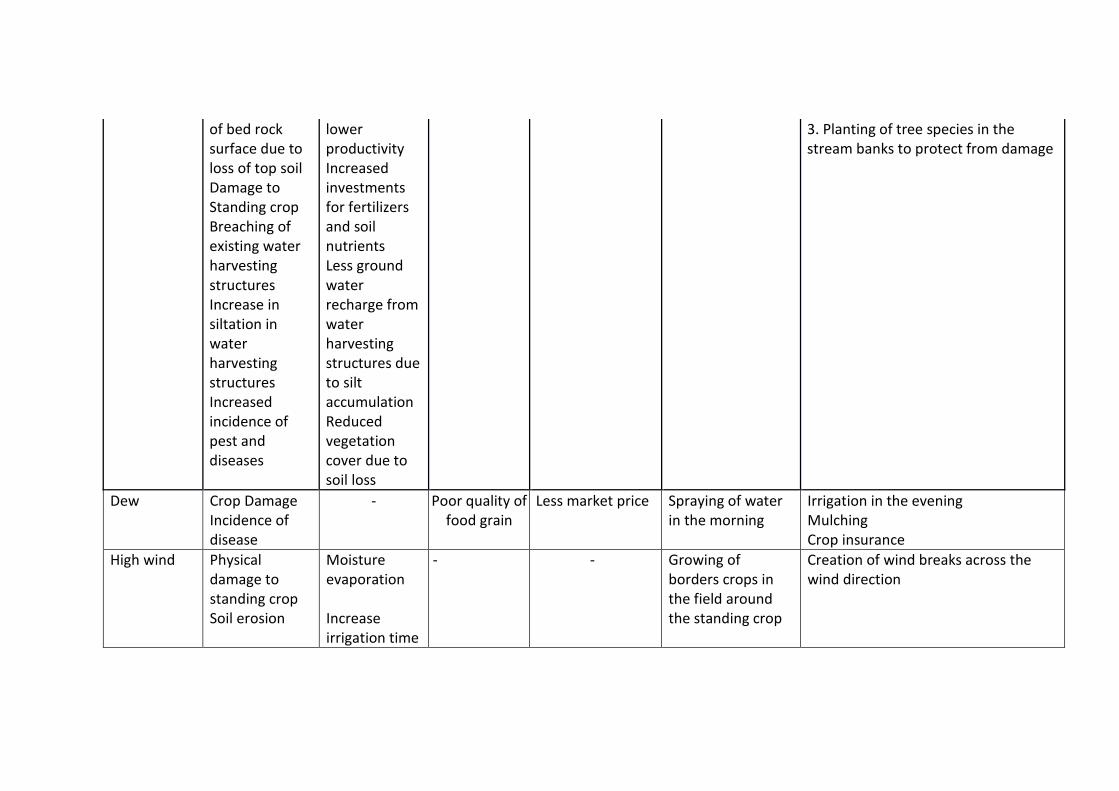
of bed rock surface due to loss of top soil Damage to Standing crop Breaching of existing water harvesting structures Increase in siltation in water harvesting structures Increased incidence of pest and diseases
lower productivity Increased investments for fertilizers and soil nutrients Less ground water recharge from water harvesting structures due to silt accumulation Reduced vegetation cover due to soil loss
3. Planting of tree species in the stream banks to protect from damage
Dew Crop Damage Incidence of disease
- Poor quality of food grain
Less market price Spraying of water in the morning
Irrigation in the evening Mulching Crop insurance
High wind Physical damage to standing crop Soil erosion
Moisture evaporation Increase irrigation time
- - Growing of borders crops in the field around the standing crop
Creation of wind breaks across the wind direction

Reduction of yield
Growing trees around field boundaries
Temperature extremes
Increased soil evaporation
more crop water demand Reduction / Loss of yield Fertility loss
Crop Insurance Introduction of tolerant varieties