Prediction of field atrazine persistence in an allophanic soil with Opus2
12
Pest Management Science Pest Manag Sci 60:447–458 (online: 2003) DOI: 10.1002/ps.832 Prediction of field atrazine persistence in an allophanic soil with Opus2 Karin M ¨ uller, 1∗ Roger E Smith, 2 Trevor K James, 1 Patrick T Holland 3 and Anis Rahman 1 1 AgResearch Limited, Ruakura Research Centre, Private Bag 3123, Hamilton, New Zealand 2 ARS-USDA, Fort Collins, Colorado, USA 3 HortResearch, Ruakura Research Centre, Private Bag 3123, Hamilton, New Zealand Abstract: A modified version of the model Opus was applied to measurements of soil water dynamics and atrazine (6-chloro-N 2 -ethyl-N 4 -isopropyl-1,3,5-triazine-2,4-diamine) persistence in a Bruntwood silt loam soil (Haplic Andosol, FAO system) in Hamilton, New Zealand. The modified model, Opus2, is briefly described and parameter estimation for the simulations is discussed. Soil water dynamics were more accurately described by applying measured soil hydraulic properties than by estimating them using pedotransfer functions. A parameter sensitivity analysis revealed that degradation was the most relevant process in simulating pesticide behaviour by Opus2. The Arrhenius equation incorporated in Opus2 did not correctly describe the effect of temperature on degradation rates obtained at 10, 20 and 30 ◦ C. However, as the Arrhenius coefficient is a very sensitive parameter and soil temperature variation was relatively narrow in the field, the Arrhenius coefficient was approximated from the laboratory study. The simulation results obtained were superior to modelling at constant temperature. Field measured persistence of atrazine in the topsoil was underpredicted using the half-life determined in the laboratory at 10 ◦ C. Modelling with a lag phase followed by accelerated degradation by use of a sigmoidal degradation equation in Opus2 significantly improved the modelling results. Nevertheless, degradation processes in the laboratory under controlled conditions did not accurately represent field dissipation, however well the laboratory degradation data could be described by simple kinetic equations. The study indicates the importance of improving field techniques for measuring degradation, and developing laboratory protocols that yield degradation data that are more representative of pesticide dynamics in field soils. 2003 Society of Chemical Industry Keywords: atrazine; degradation; leaching; parameterisation; Opus2 1 INTRODUCTION Experimental studies provide reliable information on pesticide fate and mobility, but are site-specific, time- consuming and expensive. Consequently, simulation models are increasingly used as management tools for risk mitigation. Risk assessment of water pollution by pesticide leaching and runoff can lead to regulations and/or recommendations for pesticide applications with considerable environmental and economic impact. In Europe and the USA modelling has been incorporated into the pesticide registration process. 1–3 However, a model cannot be developed and tested to cover all field situations, and, therefore, validations must be carried out for particular sets of conditions. 4 According to Smith 5 three major sources of error have to be considered in the modelling process: struc- tural, parameter and stochastic error. Structural error, also called model error, 4 results from incorrect mathe- matical description of processes, 6 oversimplifications 7 or negligence of significant processes. 8,9 However, some degree of structural error is inevitable, because models are, by definition, only an image of reality. Users have the responsibility for choosing appropriate models, being aware of their limitations and the gen- eral purposes the models have been developed for. The second important source of error in pesticide mod- elling is parameter uncertainty, and refers to poorly chosen parameter values. This may be due to the lack of independently derived parameter values. 10 Accord- ing to Addiscott et al 11 there are four ways of model parameterisation: (1) direct measurement, eg soil tem- perature (2) direct fitting, eg derivation of parameters of the van Genuchten equation from water-release data (3) indirect fitting, eg determination of degrada- tion rate coefficients by fitting the model equation to ∗ Correspondence to: Karin M ¨ uller, AgResearch Limited, Ruakura Research Centre, Private Bag 3123, Hamilton, New Zealand E-mail: [email protected] Contract/grant sponsor: New Zealand Foundation for Research, Science and Technology Contract/grant sponsor: Ministry of Agriculture and Forestry, New Zealand (Received 21 May 2003; revised version received 8 August 2003; accepted 8 October 2003) Published online 16 December 2003 2003 Society of Chemical Industry. Pest Manag Sci 1526–498X/2003/$30.00 447
-
Upload
independent -
Category
Documents
-
view
1 -
download
0
Transcript of Prediction of field atrazine persistence in an allophanic soil with Opus2
Pest Management Science Pest Manag Sci 60:447–458 (online: 2003)DOI: 10.1002/ps.832
Prediction of field atrazine persistencein an allophanic soil with Opus2Karin Muller,1∗ Roger E Smith,2 Trevor K James,1 Patrick T Holland3
and Anis Rahman1
1AgResearch Limited, Ruakura Research Centre, Private Bag 3123, Hamilton, New Zealand2ARS-USDA, Fort Collins, Colorado, USA3HortResearch, Ruakura Research Centre, Private Bag 3123, Hamilton, New Zealand
Abstract: A modified version of the model Opus was applied to measurements of soil water dynamicsand atrazine (6-chloro-N2-ethyl-N4-isopropyl-1,3,5-triazine-2,4-diamine) persistence in a Bruntwood siltloam soil (Haplic Andosol, FAO system) in Hamilton, New Zealand. The modified model, Opus2, isbriefly described and parameter estimation for the simulations is discussed. Soil water dynamics weremore accurately described by applying measured soil hydraulic properties than by estimating them usingpedotransfer functions. A parameter sensitivity analysis revealed that degradation was the most relevantprocess in simulating pesticide behaviour by Opus2. The Arrhenius equation incorporated in Opus2did not correctly describe the effect of temperature on degradation rates obtained at 10, 20 and 30 ◦C.However, as the Arrhenius coefficient is a very sensitive parameter and soil temperature variation wasrelatively narrow in the field, the Arrhenius coefficient was approximated from the laboratory study.The simulation results obtained were superior to modelling at constant temperature. Field measuredpersistence of atrazine in the topsoil was underpredicted using the half-life determined in the laboratoryat 10 ◦C. Modelling with a lag phase followed by accelerated degradation by use of a sigmoidal degradationequation in Opus2 significantly improved the modelling results. Nevertheless, degradation processes inthe laboratory under controlled conditions did not accurately represent field dissipation, however wellthe laboratory degradation data could be described by simple kinetic equations. The study indicates theimportance of improving field techniques for measuring degradation, and developing laboratory protocolsthat yield degradation data that are more representative of pesticide dynamics in field soils. 2003 Society of Chemical Industry
Keywords: atrazine; degradation; leaching; parameterisation; Opus2
1 INTRODUCTIONExperimental studies provide reliable information onpesticide fate and mobility, but are site-specific, time-consuming and expensive. Consequently, simulationmodels are increasingly used as management tools forrisk mitigation. Risk assessment of water pollutionby pesticide leaching and runoff can lead toregulations and/or recommendations for pesticideapplications with considerable environmental andeconomic impact. In Europe and the USA modellinghas been incorporated into the pesticide registrationprocess.1–3 However, a model cannot be developedand tested to cover all field situations, and, therefore,validations must be carried out for particular sets ofconditions.4
According to Smith5 three major sources of errorhave to be considered in the modelling process: struc-tural, parameter and stochastic error. Structural error,
also called model error,4 results from incorrect mathe-matical description of processes,6 oversimplifications7
or negligence of significant processes.8,9 However,some degree of structural error is inevitable, becausemodels are, by definition, only an image of reality.Users have the responsibility for choosing appropriatemodels, being aware of their limitations and the gen-eral purposes the models have been developed for. Thesecond important source of error in pesticide mod-elling is parameter uncertainty, and refers to poorlychosen parameter values. This may be due to the lackof independently derived parameter values.10 Accord-ing to Addiscott et al11 there are four ways of modelparameterisation: (1) direct measurement, eg soil tem-perature (2) direct fitting, eg derivation of parametersof the van Genuchten equation from water-releasedata (3) indirect fitting, eg determination of degrada-tion rate coefficients by fitting the model equation to
∗ Correspondence to: Karin Muller, AgResearch Limited, Ruakura Research Centre, Private Bag 3123, Hamilton, New ZealandE-mail: [email protected]/grant sponsor: New Zealand Foundation for Research, Science and TechnologyContract/grant sponsor: Ministry of Agriculture and Forestry, New Zealand(Received 21 May 2003; revised version received 8 August 2003; accepted 8 October 2003)Published online 16 December 2003
2003 Society of Chemical Industry. Pest Manag Sci 1526–498X/2003/$30.00 447
K Muller et al
an independent data set and (4) fitting to the dataset to be simulated. Parameter uncertainty increasesfrom option one to option four. Another parameterisa-tion method, the ‘educated guess’, refers to choosingparameter values based on the expertise, experienceand knowledge of the modeller. Even in cases of themost desirable option of direct parameter measure-ment, uncertainty can be considerable due to mea-surement errors,12 due to the use of simplistic modelsfor deriving parameter values (eg linear adsorptionisotherm)13 or due to the fact that the parameter val-ues experimentally determined inadequately describethe field situation.1,14 The natural heterogeneity of aparameter in time or space, the stochasticity, is thethird component of modelling errors.11 Stochastic-ity is generally viewed as an uncertainty that is notreducible.
The influence of input parameters on simulationresults can be assessed through sensitivity analyses.15
Different sensitivity analysis strategies may be applied,including one-at-a-time sensitivity analysis, factorscreening, local (point estimates of parameter values)and global sensitivity (entire parameter set) analysis.They vary in complexity and their usefulness dependson the setting.16,17
The model Opus is a one-dimensional numericalsoil-water and pesticide transport model.18 Opus isthe precursor to Opus2, which has been appliedin this study and accounts for more complexpesticide degradation and sorption schemes thanOpus. Significant enhancements for Opus2 over Opusinclude the option to model both linear and non-linearpesticide sorption as well as alternative degradationalgorithms. The model Opus has been tested fordifferent conditions,18–22 but it has not been evaluatedfor predicting pesticide transport and persistencein allophanic soils which have many distinctiveproperties that are rarely found in soils derivedfrom other parent materials. They are distributedover approximately 0.8% of the earth’s surface, areusually very fertile and thus are subjected to increasingpressure by agriculture intensification. To maximisethe productivity of volcanic ash soils and to minimisetheir deterioration, management practices need to bebased on an understanding of their unique physical,chemical, and mineralogical properties. Andosols havethe tendency to bind organic matter, due to the highcontent of the reactive allophane clay, resulting in highorganic carbon contents. Their physical properties arealso in striking contrast to those of other mineralsoils, including a high porosity and a low bulkdensity. A significant chemical feature of these soilsis their high anion exchange capacity.23 All theseproperties influence pesticide transport and dissipationin allophanic soils.
The aim of this study was to evaluate the transportand degradation of a typical pesticide in an allophanicsoil under New Zealand conditions. Results of afield experiment on an allophanic soil were comparedwith simulations using a modification of the Opus
model, Opus2. The model was used to evaluateparameter applicability and sensitivity, as well as toevaluate alternative degradation and sorption models.A detailed description of the field trial and a spatialanalysis of the data is given in Muller et al.24
2 MATERIAL AND METHODSOpus2 was applied to a field leaching experiment withthe herbicide atrazine. The study was performed in theWaikato Research Orchard located near Hamilton,New Zealand. The soil at the site is formed fromvolcanic ashes (Bruntwood silt loam), and can beclassified as a Haplic Andosol according to the FAOclassification.
2.1 Soil propertiesSoil particle size distribution was determined by thehydrometer method of Day,25 the bulk density withundisturbed soil cores, soil particle density by apycnometer, the porosity using the data of particle andbulk density and the organic carbon content accordingto the method of Merry and Spouncer.26
The saturated hydraulic conductivity was measuredwith undisturbed soil cores using the constant headmethod of Klute and Dirksen.27 The equilibrium soilwater contents were determined during drainage atmatric heads of 2.5, 5.0, 10, 20, 40, 100 and 1500 kPausing standard laboratory techniques. The saturatedwater content θs was estimated in dependence onthe total porosity. The residual water content θr wasdetermined by fitting the modified Brooks–Coreyequation28 through the measured water content ata matric head of 1500 kPa.
2.2 Field experimentAtrazine was applied as a 500 g litre−1 SC (Gesaprim500FW, Novartis, Basel) at its normal field applicationrate of 3 kg AI ha−1. The downward migration of theatrazine pulse was monitored using vertical soil cores.Sampling occurred 2 h after application and on sixoccasions after each significant amount of rainfall(>20 mm). Transects were sequentially sampled usingthirty cores 0.5 m apart along the 15.5 m longtransects. Atrazine residues were extracted from the20 cm long cores in 10 depths and analysed by high-performance liquid chromatography. Further detailedinformation concerning the set-up of the trial andmeasurements is provided by Muller et al.24
2.3 Laboratory incubation studyLaboratory experiments were performed with atrazinein topsoil of the Bruntwood silt loam soil atthree incubation temperatures (10, 20 and 30 ◦C)to independently derive parameter values for thedegradation algorithms of Opus2, as well as aparameter for correcting the temperature impact ondegradation, the Arrhenius equation activation energycoefficient EA. Richter et al29 have derived a non-linearregression solution for determining the Arrhenius
448 Pest Manag Sci 60:447–458 (online: 2003)
Prediction of field atrazine persistence with Opus2
coefficient EA using sets of data from incubation atmultiple temperatures:
EA = ln(k2/k1)·R·10−3(
1T2
− 1T1
), (1)
where R is the gas constant (8.314 J K−1 mol−1) andT is the incubation temperature in K. Details on thelaboratory degradation study can be found in Mulleret al.24
2.4 Model description and parameterisationWe used a modified version of the model Opus,18
Opus2 to simulate the movement of atrazine.The model Opus has been described in detailelsewhere.19,20,22,30 Thus, only a brief model descrip-tion is given. The model modifications realised inthe version Opus2, namely pesticide sorption anddegradation algorithms, are depicted in more detail.The estimation of evapotranspiration uses the Ritchiemethod.31 The water flux calculations are based onthe Richard’s equation. The flow and transport equa-tions are numerically solved using the method of finitedifferences. The functional relations for soil retentionand hydraulic conductivity are a modification of theBrooks and Corey28 relationship.32 This formula usesfive parameters to describe the hydraulic characteris-tics of a soil horizon: saturated hydraulic conductivityKs, saturated water content θs, residual water contentθr, air entry pressure �b and a pore-size distributionindex λ. In cases where no measured data on soil waterretention are available, a default option for determina-tion of soil hydraulic parameter values is included inOpus2. This option is based on regression functionsusing generic soil properties such as grain size distri-bution, organic matter content and bulk density. Thepedotransfer function available in the program Opus2was developed by Rawls et al.33
Opus2 calculates advective transport through thesoil, but does not explicitly consider dispersion ofsolutes. Pesticide sorption is described by equilibriumadsorption with a linear or non-linear (Freundlich orLangmuir) isotherm (in the modified Opus2 versionused here), or kinetic adsorption. The parameters usedto calculate sorption are the organic C-dependentequilibrium sorption coefficient KOC, the Freundlichor Langmuir isotherm exponent n and the organicmatter content of each horizon. The modifiedmodel Opus2 includes three algorithms for describingpesticide degradation. First-order kinetics [eqn (2)]and the two-stage exponential degradation algorithm[eqn (3)] assume that degradation is exponential:
C(t) = C0e−k1t (2)
C(t) = C0(1 − α)e(−k1t) + C0αe(−k2t), (3)
with C0 being the initial pesticide concentration andk1 defining the degradation rate. The parameter k1
equals ln(2)/t1/2, with t1/2 being the pesticide’s half-life. The second equation calls for two additional
parameters, a second degradation rate k2, and α, apartition parameter that divides the available pesticideconcentration into two fractions that are degradedat the different degradation rates k1 and k2. Themore complex exponential degradation equation canphysically explain simple temporal variation of thedegradation process such as an initial acclimationphase of microbial activity or the deceleration ofdegradation due to sorption processes. Equation (3) issubject to the limit (α − 1)k1 − αk2 ≤ 0 in order toavoid negative degradation in the initial period.
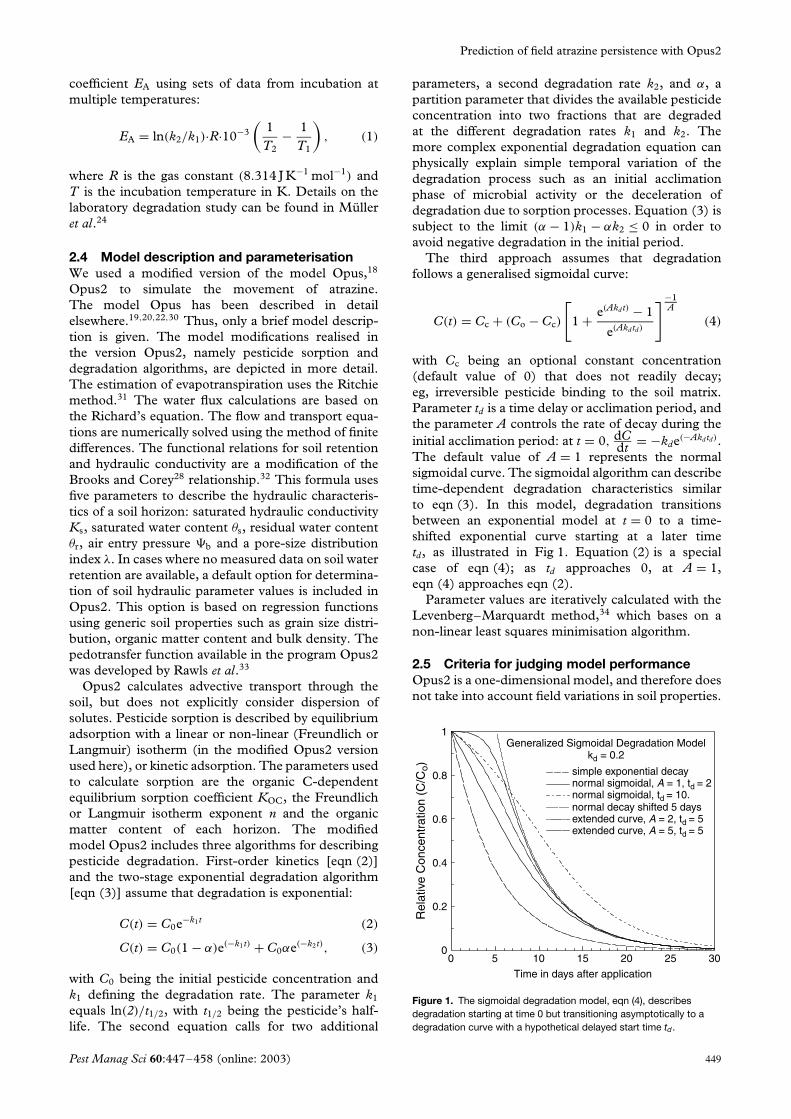
The third approach assumes that degradationfollows a generalised sigmoidal curve:
C(t) = Cc + (Co − Cc)
[1 + e(Akdt) − 1
e(Akdtd)
]−1A
(4)
with Cc being an optional constant concentration(default value of 0) that does not readily decay;eg, irreversible pesticide binding to the soil matrix.Parameter td is a time delay or acclimation period, andthe parameter A controls the rate of decay during theinitial acclimation period: at t = 0, dC
dt = −kde(−Akdtd).The default value of A = 1 represents the normalsigmoidal curve. The sigmoidal algorithm can describetime-dependent degradation characteristics similarto eqn (3). In this model, degradation transitionsbetween an exponential model at t = 0 to a time-shifted exponential curve starting at a later timetd, as illustrated in Fig 1. Equation (2) is a specialcase of eqn (4); as td approaches 0, at A = 1,eqn (4) approaches eqn (2).
Parameter values are iteratively calculated with theLevenberg–Marquardt method,34 which bases on anon-linear least squares minimisation algorithm.
2.5 Criteria for judging model performanceOpus2 is a one-dimensional model, and therefore doesnot take into account field variations in soil properties.
0 5 10 15 20 25 300
0.2
0.4
0.6
0.8
1
Rel
ativ
e C
once
ntra
tion
(C/C
o) simple exponential decaynormal sigmoidal, A = 1, td = 2normal sigmoidal, td = 10.normal decay shifted 5 daysextended curve, A = 2, td = 5extended curve, A = 5, td = 5
Generalized Sigmoidal Degradation Modelkd = 0.2
Time in days after application
Figure 1. The sigmoidal degradation model, eqn (4), describesdegradation starting at time 0 but transitioning asymptotically to adegradation curve with a hypothetical delayed start time td.
Pest Manag Sci 60:447–458 (online: 2003) 449
K Muller et al
Modelling relies on the assumption that the soil is alayer-wise homogeneous medium. In reality soils areheterogeneous with properties showing a stochasticbehaviour. Nevertheless, we used the average of theobserved data for comparing with our simulationresults, to provide insight into the regularity of theobservations in comparison with transport theory.
Measured soil water content and atrazine con-centrations were compared with the results of theOpus2 simulations using graphical and statisticalmethods. As neither the simulated nor the measuredsoil water contents exhibit a normal distribution,the paired Wilcoxon-test was chosen for comparingmeasured and simulated values in the soil profile.35
The goodness-of-fit of the atrazine concentrations wasjudged by a criterion proposed by Parrish and Smith,36
which states that model predictions should be withina factor of two of the measured concentrations. Theperformance of the model was also evaluated by alter-nate measures. The root mean square error (RMSE),proposed by Loague and Green4 counts errors ofunderpredictions and overpredictions with the RMSEof the measured and predicted values being normalisedto the mean of the measured data. Lower values forthe RMSE indicate a higher correspondence betweenobserved and simulated values with a limit of zero. Thenon-normalised root mean square error (NRMSE)is also sometimes found in the literature,37 and isincluded to facilitate comparisons with other studies.The coefficient of residual mass (CRM) as calculatedby Persicani et al38 also has an optimal fit limit ofzero. A positive value indicates an underestimationby the model; a negative value shows that the modeloverestimates the observed data. The model efficiency(EF) as calculated according to Clemente et al39 hasan optimal fit value of one.
2.6 Sensitivity analysisA sensitivity analysis was performed to assess theinfluence of the main input parameters of the pesticidemodel on simulation results. The reference outputparameter was the calculated mass of atrazine leftin the soil profile after a simulation period oftwo months. Results from sensitivity analyses havebeen shown to depend on the selected referencevalues. We therefore chose reference values close
to the actual field situation. For sorption, theeffects of the equilibrium adsorption coefficient KOC
(reference: 46.5 ml g−1 Corg) and of soil organic carboncontents in the first soil layer (reference: 8.7%) weretested. The degradation of atrazine was studied bychanging two parameters for the first-order kineticsapproach: the decay coefficient for the dissipationof a pesticide kl (reference: 0.053 day−1) and theArrhenius equation activation energy EA (reference,default value in Opus: 20 kJ mol−1), four parametersfor the two-stage exponential degradation model: thetwo decay coefficients k1 (reference: 0.064 day−1) andk2 (reference: 0.181 day−1), α (reference: −0.5) andEA (reference: 20 kJ mol−1). The two decay coefficientsare interrelated and thus were altered simultaneously.For the sigmoidal approach three parameters werevaried: EA (reference: 20 kJ mol−1), td (reference:14 day−1) and the degradation rate coefficient kd
(reference: 0.125 day−1). A step-by-step sensitivityanalysis was performed, by analysing the divergenceof the output parameter to its reference value for eachinput parameter one by one.40 The values for theinput parameters were changed in a range of ±100%in steps of ±20%. The coefficient of sensitivity S wascalculated, which expresses the relative variation of themodel response O to the relative variation rate of theparameter p:13
S = �O/O�p/p
. (5)
3 RESULTS AND DISCUSSION3.1 Soil propertiesKey soil characteristics were determined adjacent tothe experimental area and are presented in Table 1.The clay content is moderate and somewhat variablethrough the profile (range 15–25%), whereas theorganic carbon content is high in the soil surface(8.7%) and declines significantly with depth. The bulkdensity is fairly low throughout the profile (average of0.77 g cm−3) due to the high content of allophanicclays. Soil hydraulic parameter values were derivedfrom laboratory measurements and are summarisedfor the six soil horizons of the profile in Table 2(means of three replicates).
Table 1. Soil properties of the Bruntwood silt loam, Hamilton (means of three replicate determinations)
HorizonDepth
(m)Sand(%)
Silt(%)
Clay(%)
OCa
(%)ϕb
(g cm−3)
ρc
(g cm−3)
Porosity(%)
Ap 0.00–0.05 39.0 36.0 25.0 8.7 2.32 0.75 68ApBw 0.05–0.20 35.0 40.0 25.0 5.9 2.36 0.77 67Bw 0.20–0.45 40.0 45.0 15.0 1.9 2.42 0.77 68Bg 0.45–0.64 48.0 27.0 25.0 0.3 2.47 0.74 70Brg1 0.64–0.76 34.0 41.0 25.0 0.2 2.43 0.77 68Brg2 0.76–0.95 34.0 45.0 21.0 0.2 2.45 0.81 67
a OC: soil organic carbon content.b ϕ: soil particle density.c ρ: soil bulk density.
450 Pest Manag Sci 60:447–458 (online: 2003)
Prediction of field atrazine persistence with Opus2
Table 2. Soil parameter values of the Bruntwood silt loam for the
simulations with Opus2 (means of three replicate determinations)
HorizonKs
a
(mm h−1)
θsb
(mm mm−1)
θrc
(mm mm−1)
ψbd
(mm)λe
(−)
Ap 38 0.65 0.05 −275 0.23ApBw 30 0.65 0.15 −1000 0.45Bw 83 0.68 0.27 −500 0.30Bg 33 0.65 0.13 −500 0.13Brg1 29 0.64 0.09 −150 0.14Brg2 83 0.63 0.11 −500 0.43
a Ks: saturated hydraulic conductivity.b θs: saturated water content.c θr: residual water content.d ψb: air entry pressure.e λ: pore-size distribution index.
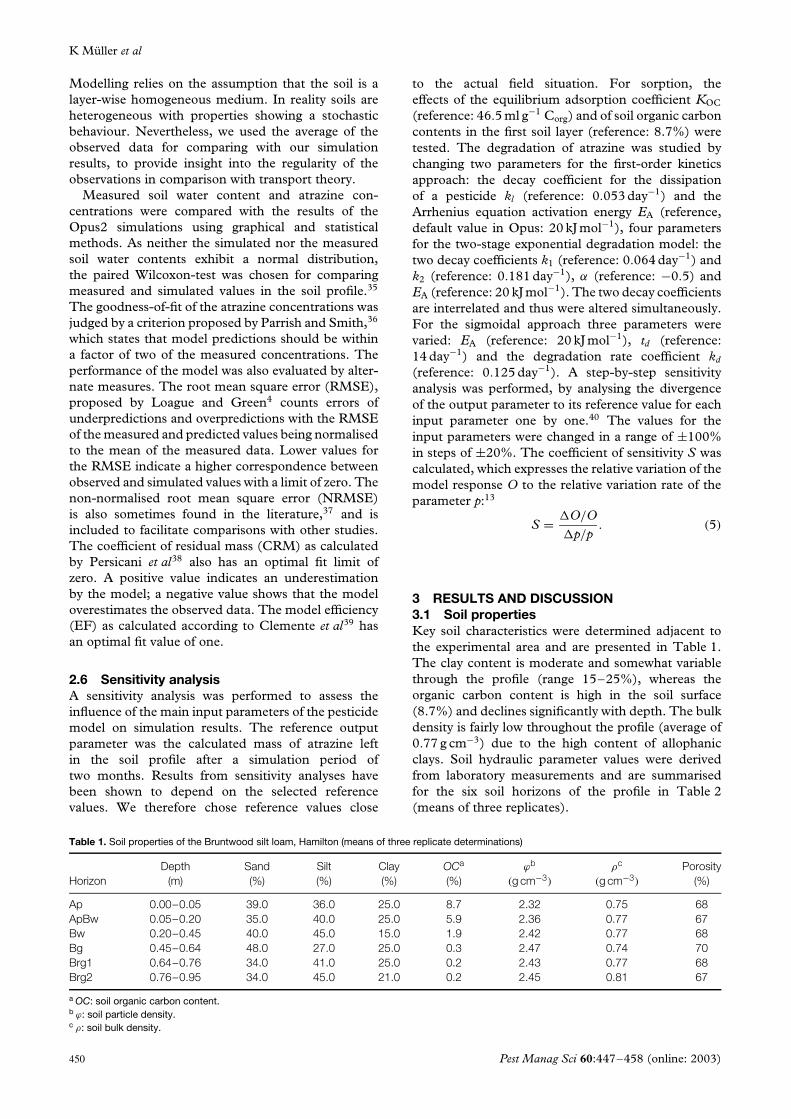
3.2 Field studyThe results of the field study are discussed andpublished elsewhere.24 Here, only a brief overviewof the field results is given. Rainfall accumulatedto 427 mm during the investigation period. Averageambient temperature was 11 ◦C with an average dailymaximum temperature of 15.7 ◦C. Soil temperaturesat 10 and 30 cm depth averaged 12 and 13 ◦C withrelatively small ranges of variation (CV 21 and 16%),respectively (Fig 2).
Seventy per cent of the atrazine applied persistedin the upper 0.02 m of the soil for 12 days (Table 3).After 56 days and 427 mm of rainfall, the centre ofthe pesticide mass was still at 0.02 m. The specialcharacteristics of the soil (high organic carbon content,allophanic clay) had a strong influence on atrazinetransport via matrix flow. Atrazine loss from the first0.2 m of the soil profile during the investigation periodof 54 days was equivalent to 90% of applied activeingredient. Herbicide mass between replicate samplesfrom the same sampling depth and day differedsubstantially. This was mainly due to variations inherbicide concentrations rather than in water contentof replicate samples, implying that soil propertiesaffecting degradation and adsorption showed largervariability than those controlling soil water retention.24
The spatial variability of the atrazine dissipation
Tem
pera
ture
(°C
)
-5
0
5
10
15
20
25
Rai
n (m
m)
0
10
20
30
40
50
60
Daily rainfall Hourly and average ambient temperature
26/06/0012/06/0029/05/0015/05/001/05/00
Tem
pera
ture
(°C
)
-5
0
5
10
15
20
25
26/06/0012/06/0029/05/0015/05/001/05/00
Hourly and average soil temperature at 30 cm depthHourly and average soil temperature at 10 cm depth
Figure 2. Average soil and air temperatures and rainfall distributionduring the investigation period.
are discussed in detail in the first part of thispaper.24
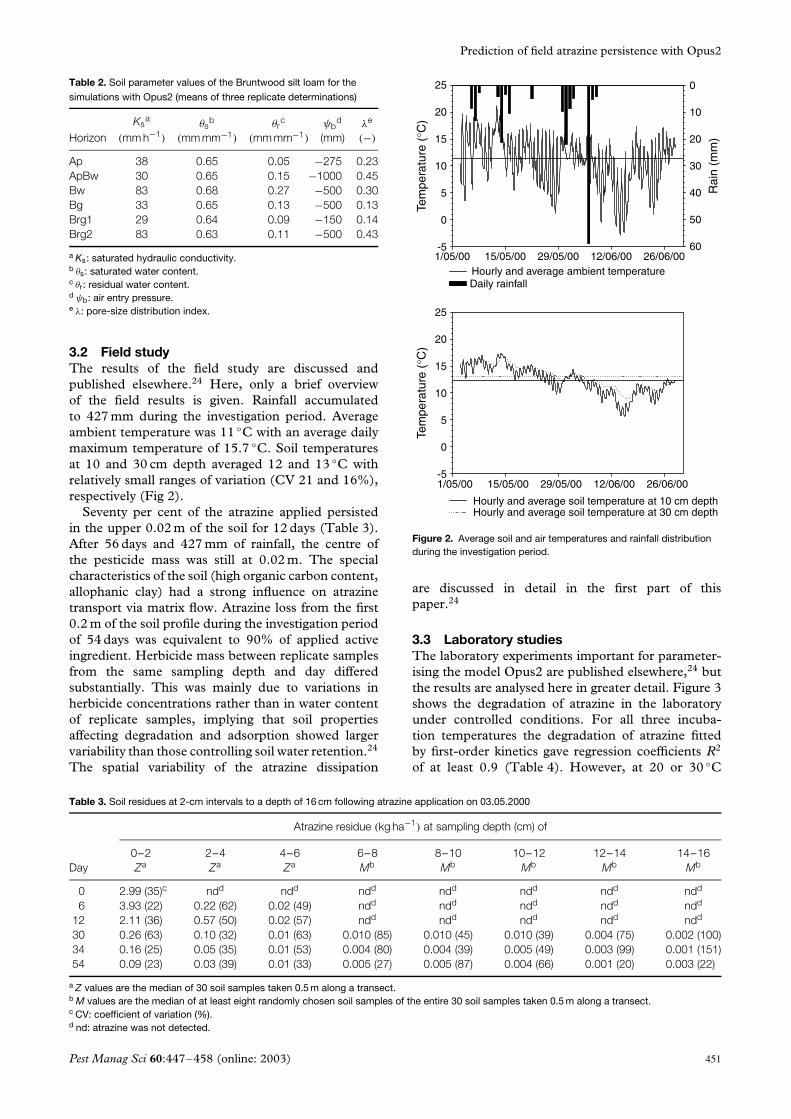
3.3 Laboratory studiesThe laboratory experiments important for parameter-ising the model Opus2 are published elsewhere,24 butthe results are analysed here in greater detail. Figure 3shows the degradation of atrazine in the laboratoryunder controlled conditions. For all three incuba-tion temperatures the degradation of atrazine fittedby first-order kinetics gave regression coefficients R2
of at least 0.9 (Table 4). However, at 20 or 30 ◦C
Table 3. Soil residues at 2-cm intervals to a depth of 16 cm following atrazine application on 03.05.2000
Atrazine residue (kg ha−1) at sampling depth (cm) of
Day0–2Za
2–4Za
4–6Za
6–8Mb
8–10Mb
10–12Mb
12–14Mb
14–16Mb
0 2.99 (35)c ndd ndd ndd ndd ndd ndd ndd
6 3.93 (22) 0.22 (62) 0.02 (49) ndd ndd ndd ndd ndd
12 2.11 (36) 0.57 (50) 0.02 (57) ndd ndd ndd ndd ndd
30 0.26 (63) 0.10 (32) 0.01 (63) 0.010 (85) 0.010 (45) 0.010 (39) 0.004 (75) 0.002 (100)34 0.16 (25) 0.05 (35) 0.01 (53) 0.004 (80) 0.004 (39) 0.005 (49) 0.003 (99) 0.001 (151)54 0.09 (23) 0.03 (39) 0.01 (33) 0.005 (27) 0.005 (87) 0.004 (66) 0.001 (20) 0.003 (22)
a Z values are the median of 30 soil samples taken 0.5 m along a transect.b M values are the median of at least eight randomly chosen soil samples of the entire 30 soil samples taken 0.5 m along a transect.c CV: coefficient of variation (%).d nd: atrazine was not detected.
Pest Manag Sci 60:447–458 (online: 2003) 451
K Muller et al
Table 4. Regressions for degradation of atrazine under controlled temperature and 60% maximum-water-holding capacity in the Bruntwood silt
loam soil, described by first-order kinetics, two-stage exponential model and sigmoidal degradation model with coefficients of regression (R2)
AlgorithmT
( ◦C)k1
(day−1)
k2
(day−1)
td(day)
A(−) R2
First-order kinetics: eqn (2) 10 0.009 — — — 0.9820 0.053 — — — 0.9830 0.080 — — — 0.92
Two-stage exponential model: eqn (3); α = −0.5 10 0.006 0.002 — — 0.9620 0.064 0.171 — — 0.9930 0.108 0.347 — — 0.98
Sigmoidal degradation: eqn (4) 10 0.009 — 10 142 0.9520 0.125 — 14 0.05 1.0030 0.256 — 9 0.06 0.99
0 10 20 30 40 50 60
Rel
ativ
e co
ncen
trat
ion
(C/C
0)
0.0
0.2
0.4
0.6
0.8
1.0
1.2
20°C30°C10°C
Time (day)
sigmoidal modelfirst-order kinetics
Figure 3. Atrazine degradation as measured in the laboratory in theBruntwood silt loam at 10, 20 and 30 ◦C.
degradation followed a more complex pattern withan initial lag phase followed by exponential decaythat slowed down towards the end of the incubationperiod. It was more accurately described by the sig-moidal model with removal of systematic deviations(R2 = 0.99; Fig 3 and Table 4).
Temperature had a significant impact on atrazinedegradation in the laboratory (Fig 3). Calculating theArrhenius coefficient EA with eqn (1) from the incu-bation data between 10 and 20 ◦C, 10 and 30 ◦Cand 20 and 30 ◦C gave values of 115, 77 and35 kJ mol−1, respectively. Thus, the effects of tem-perature on degradation were not well modelled bythe Arrhenius equation, ie EA was not a constant. Thepure physico-chemical kinetics as described by theArrhenius equation did not match temperature effectsobserved in the laboratory data sets, which were morecomplex, presumably due to multifaceted microbialresponses to temperature.
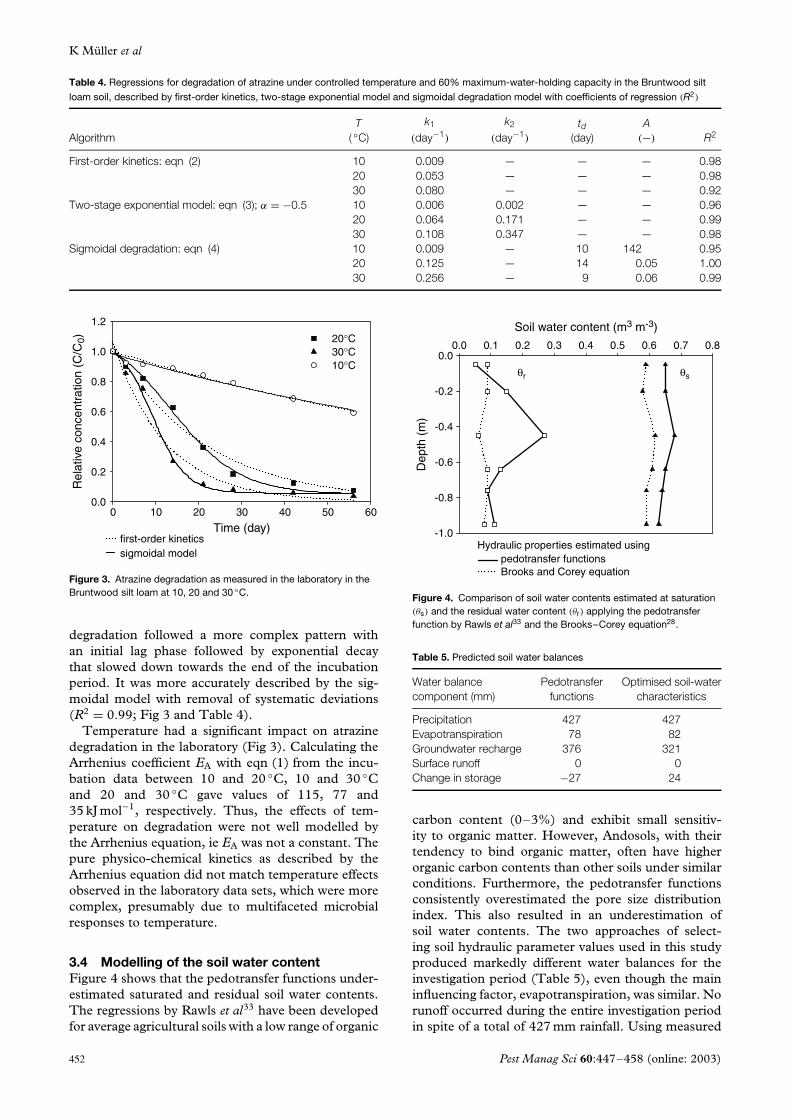
3.4 Modelling of the soil water contentFigure 4 shows that the pedotransfer functions under-estimated saturated and residual soil water contents.The regressions by Rawls et al33 have been developedfor average agricultural soils with a low range of organic
0.0 0.1 0.2 0.3 0.4 0.5 0.6 0.7 0.8
Dep
th (
m)
-1.0
-0.8
-0.6
-0.4
-0.2
0.0
θr
Soil water content (m3 m-3)
θs
Hydraulic properties estimated using
Brooks and Corey equationpedotransfer functions
Figure 4. Comparison of soil water contents estimated at saturation(θs) and the residual water content (θr) applying the pedotransferfunction by Rawls et al33 and the Brooks–Corey equation28.
Table 5. Predicted soil water balances
Water balancecomponent (mm)
Pedotransferfunctions
Optimised soil-watercharacteristics
Precipitation 427 427Evapotranspiration 78 82Groundwater recharge 376 321Surface runoff 0 0Change in storage −27 24
carbon content (0–3%) and exhibit small sensitiv-ity to organic matter. However, Andosols, with theirtendency to bind organic matter, often have higherorganic carbon contents than other soils under similarconditions. Furthermore, the pedotransfer functionsconsistently overestimated the pore size distributionindex. This also resulted in an underestimation ofsoil water contents. The two approaches of select-ing soil hydraulic parameter values used in this studyproduced markedly different water balances for theinvestigation period (Table 5), even though the maininfluencing factor, evapotranspiration, was similar. Norunoff occurred during the entire investigation periodin spite of a total of 427 mm rainfall. Using measured
452 Pest Manag Sci 60:447–458 (online: 2003)
Prediction of field atrazine persistence with Opus2
Table 6. Statistics of goodness-of-fit of soil water content for all
sampling days and the two parameterisation approaches for soil
water retention
Samplingday RMSEa NRMSEb CRMc
Default parameterisation 0 32.42 0.019 0.3126 23.44 0.011 0.233
12 23.88 0.012 0.01030 24.27 0.016 0.19934 17.07 0.005 0.07354 31.07 0.019 0.309All 21.37 0.010 0.155
Measured soil properties 0 14.20 0.003 0.1086 10.49 0.002 0.102
12 22.44 0.011 0.05630 11.64 0.004 0.03634 21.05 0.008 −0.16754 11.32 0.002 0.090All 16.78 0.009 0.010
a Root mean square error.b Non-normalised root mean square error (m3 m−3).c Coefficient of residual mass.
values to characterise the soil water characteristicfunction led to a positive change in water storage,which matched measured water contents. However,the use of the default pedotransfer function option pre-dicted water depletion from the profile. The extremelyhigh maximum water holding capacity of the Brunt-wood silt loam, arising from its high organic mattercontent, explains the high infiltration capacity of thesoil. Soils of this type were not part of the data basefrom which the Rawls et al33 pedotransfer regressionswere obtained.
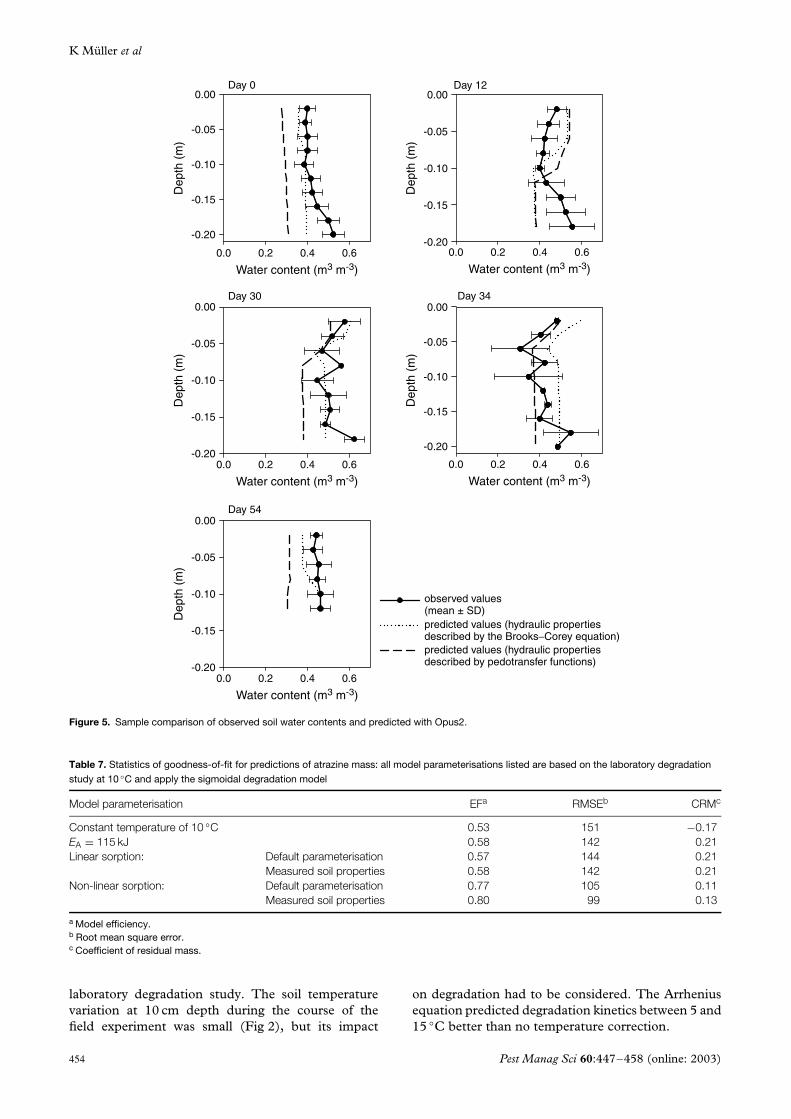
The statistics of the goodness-of-fit of the model pre-dictions for all sampling occasions and the two param-eterisation methods are shown in Table 6. They indi-cate that both simulations produced acceptable simu-lations with NRMSE values less than 0.02 m3 m−3.However, the predictions based on measured soilhydraulic properties gave better statistical values andalso appear visually to better capture the shape ofthe measured profiles, as illustrated in Fig 5 for fivesampling dates (03 May, 15 May, 02 June, 06 Juneand 26 June). Note that the model reports soil waterprofiles at the beginning of the day, and measurementsmade later in the day following a rainfall may reflecta significant period of water redistribution in the soilprofile. The first figure shows the initial conditionsbefore atrazine application. Both simulations resultedin an underestimation of the actual soil water content,as expressed by the positive CRM values (Table 6).Parameterising with default soil-input values gave sim-ulated soil water contents that were consistently lowerthan the measured values, and the fit to the mea-sured data was not as good as in the simulation runbased on actual soil hydraulic data. The results ofthe Wilcoxon test with significant differences betweenobserved and predicted soil water contents for thesimulation based on the pedotransfer functions and
insignificant differences for the other model param-eterisation (P ≥ 0.63) underline this observation. Allthree statistical measures emphasise the good perfor-mance of Opus2 when using measured soil data formodel parameterisation. The calculated RMSE was17%, the small positive CRM indicates a slight under-estimation and the model efficiency EF was 0.37. Thediscretisation of the soil into computational layers fornumerical solution of the partial differential equationsof the water flux has its highest resolution in the topsoil(here 0.01 m to a depth of 0.07 m).
In summary, this part of the study underlinesthe superiority of measured soil data for accuratesimulation of trends in soil water content of andosols.However, the use of pedotransfer functions maybe sufficiently accurate for simulating soil waterdistribution profiles, depending on the soil type andthe modelling purpose. Jarvis et al37 came to a similarconclusion in a case study with the model MACRObeing applied to a field data set by three users withdifferent approaches for parameterisation.
3.5 Modelling of atrazine dissipationThe KOC for atrazine in the Bruntwood silt loam is46.5 ml g−1Corg (Ahmad R, pers comm). The non-linear Freundlich sorption equation was applied usingthe results reported by Baskaran et al41 with a Horotiusoil (this soil is comparable to the topsoil of theBruntwood silt loam used in this study),42 whichrevealed a Kd value of 3.68 ml g−1 and a minimumvalue of 0.92 for the exponent parameter of theFreundlich equation.
The laboratory degradation study was performedwith the same soil as in the field experiment in orderto provide the parameter values degradation rates andEA for Opus2 simulations. Inverse modelling,43 whichis common practice when independent parameterassessment is not possible,9,10,44,45 was not plannedin this study. However, the observed temperatureresponse in the laboratory was non-linear between10 and 30 ◦C, in contrast to the assumption bythe Arrhenius equation implemented in Opus2. Toaccommodate this disagreement, modelling at aconstant temperature was compared to modelling withtemperature correction. The first option eliminatedeffects of EA. The laboratory degradation temperatureof 10 ◦C matched the average field temperature of11 ◦C best. The derived parameter values used inthe simulations are summarised in Table 4. For thesecond option, the degradation rate of 0.009 day−1
(Table 4) and an EA value of 115 kJ mol−1 derivedwith eqn (1) for the laboratory degradation ratesbetween 10 and 20 ◦C were chosen, because thistemperature range matched the field temperatures best(Fig 2).
Modelling with temperature correction was superiorto simulations performed at a constant temperature(Table 7). Degradation increase with temperaturehas been reported both for field and laboratorystudies,14,24,46 and has been confirmed by our
Pest Manag Sci 60:447–458 (online: 2003) 453
K Muller et al
Day 12
Day 30 Day 34
Day 54
Day 0
0.0 0.2 0.4 0.6
-0.20
-0.15
-0.10
-0.05
0.00
Dep
th (
m)
Water content (m3 m-3)
0.0 0.2 0.4 0.6-0.20
-0.15
-0.10
-0.05
0.00
Dep
th (
m)
Water content (m3 m-3)
0.0 0.2 0.4 0.6
-0.20
-0.15
-0.10
-0.05
0.00
Dep
th (
m)
Water content (m3 m-3)0.0 0.2 0.4 0.6
-0.20
-0.15
-0.10
-0.05
0.00
Dep
th (
m)
Water content (m3 m-3)
0.0 0.2 0.4 0.6-0.20
-0.15
-0.10
-0.05
0.00
Dep
th (
m)
Water content (m3 m-3)
predicted values (hydraulic propertiesdescribed by pedotransfer functions)
predicted values (hydraulic propertiesdescribed by the Brooks−Corey equation)
observed values(mean ± SD)
Figure 5. Sample comparison of observed soil water contents and predicted with Opus2.
Table 7. Statistics of goodness-of-fit for predictions of atrazine mass: all model parameterisations listed are based on the laboratory degradation
study at 10 ◦C and apply the sigmoidal degradation model
Model parameterisation EFa RMSEb CRMc
Constant temperature of 10 ◦C 0.53 151 −0.17EA = 115 kJ 0.58 142 0.21Linear sorption: Default parameterisation 0.57 144 0.21
Measured soil properties 0.58 142 0.21Non-linear sorption: Default parameterisation 0.77 105 0.11
Measured soil properties 0.80 99 0.13
a Model efficiency.b Root mean square error.c Coefficient of residual mass.
laboratory degradation study. The soil temperaturevariation at 10 cm depth during the course of thefield experiment was small (Fig 2), but its impact
on degradation had to be considered. The Arrheniusequation predicted degradation kinetics between 5 and15 ◦C better than no temperature correction.
454 Pest Manag Sci 60:447–458 (online: 2003)
Prediction of field atrazine persistence with Opus2
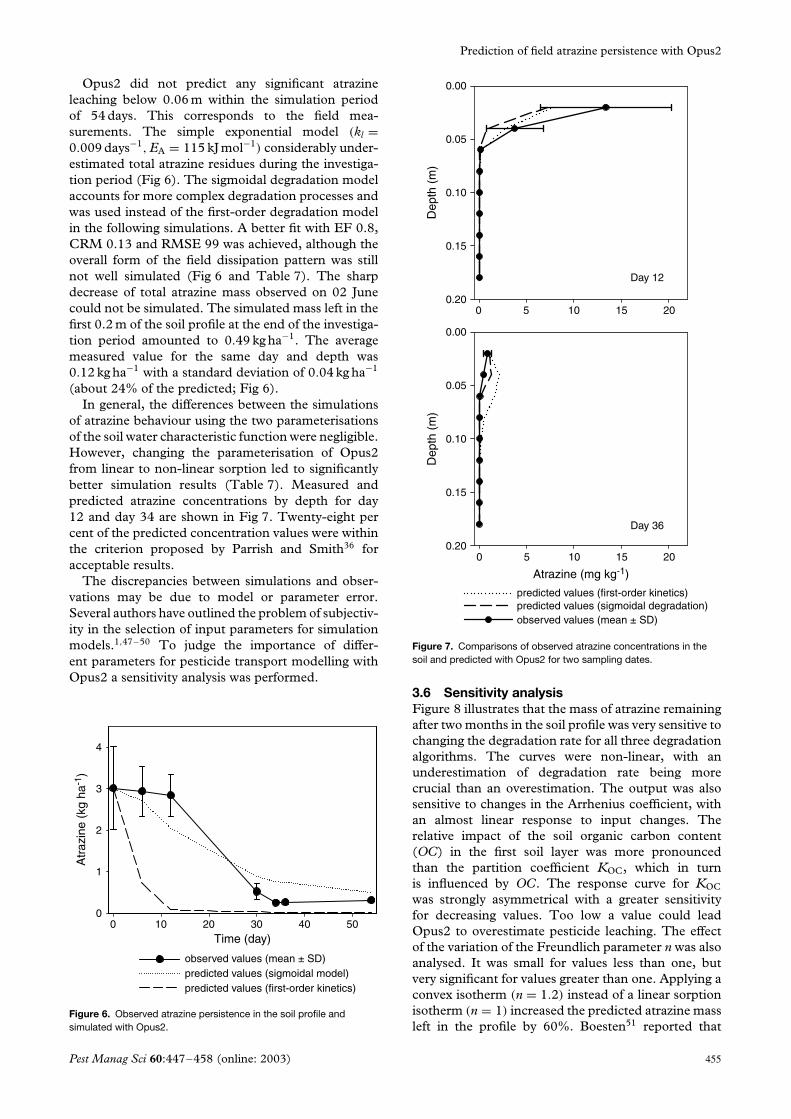
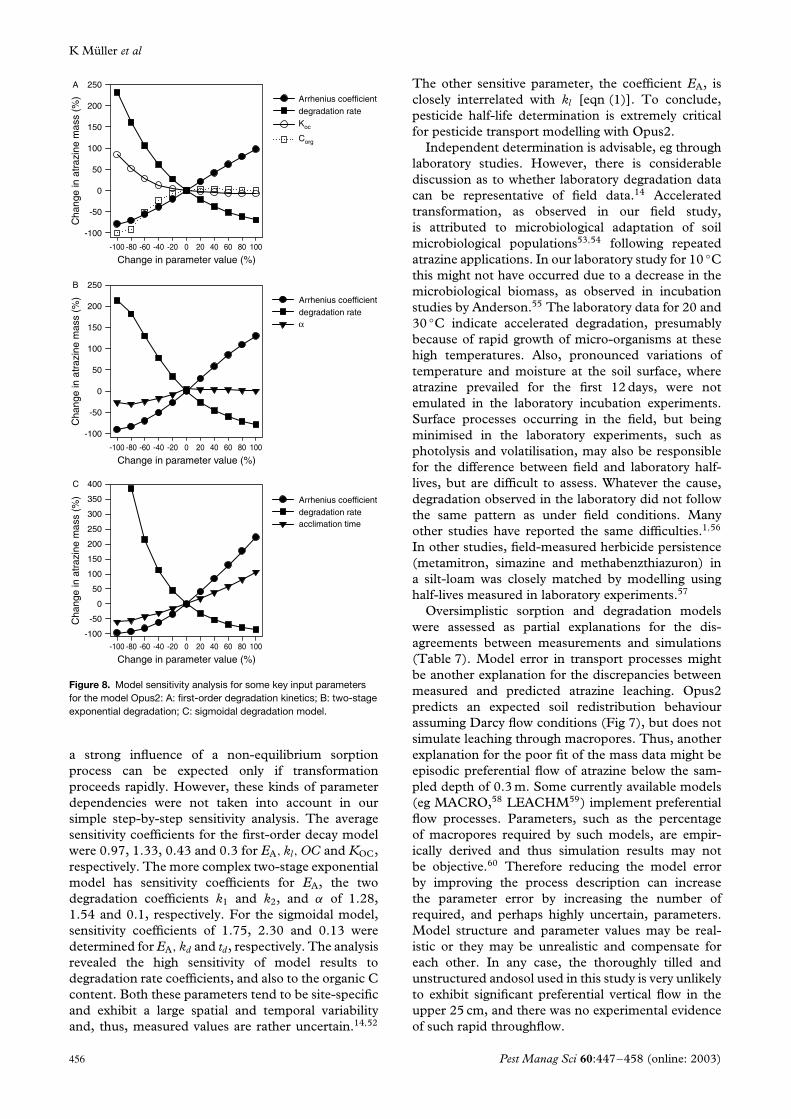
Opus2 did not predict any significant atrazineleaching below 0.06 m within the simulation periodof 54 days. This corresponds to the field mea-surements. The simple exponential model (kl =0.009 days−1, EA = 115 kJ mol−1) considerably under-estimated total atrazine residues during the investiga-tion period (Fig 6). The sigmoidal degradation modelaccounts for more complex degradation processes andwas used instead of the first-order degradation modelin the following simulations. A better fit with EF 0.8,CRM 0.13 and RMSE 99 was achieved, although theoverall form of the field dissipation pattern was stillnot well simulated (Fig 6 and Table 7). The sharpdecrease of total atrazine mass observed on 02 Junecould not be simulated. The simulated mass left in thefirst 0.2 m of the soil profile at the end of the investiga-tion period amounted to 0.49 kg ha−1. The averagemeasured value for the same day and depth was0.12 kg ha−1 with a standard deviation of 0.04 kg ha−1
(about 24% of the predicted; Fig 6).In general, the differences between the simulations
of atrazine behaviour using the two parameterisationsof the soil water characteristic function were negligible.However, changing the parameterisation of Opus2from linear to non-linear sorption led to significantlybetter simulation results (Table 7). Measured andpredicted atrazine concentrations by depth for day12 and day 34 are shown in Fig 7. Twenty-eight percent of the predicted concentration values were withinthe criterion proposed by Parrish and Smith36 foracceptable results.
The discrepancies between simulations and obser-vations may be due to model or parameter error.Several authors have outlined the problem of subjectiv-ity in the selection of input parameters for simulationmodels.1,47–50 To judge the importance of differ-ent parameters for pesticide transport modelling withOpus2 a sensitivity analysis was performed.
0 10 20 30 40 50
Atr
azin
e (k
g ha
-1)
0
1
2
3
4
predicted values (first-order kinetics)predicted values (sigmoidal model)observed values (mean ± SD)
Time (day)
Figure 6. Observed atrazine persistence in the soil profile andsimulated with Opus2.
0 5 10 15 20
0 5 10 15 20
Dep
th (
m)
Dep
th (
m)
0.00
0.05
0.10
0.15
0.20
0.00
0.05
0.10
0.15
0.20
predicted values (first-order kinetics)predicted values (sigmoidal degradation)observed values (mean ± SD)
Day 12
Day 36
Atrazine (mg kg-1)
Figure 7. Comparisons of observed atrazine concentrations in thesoil and predicted with Opus2 for two sampling dates.
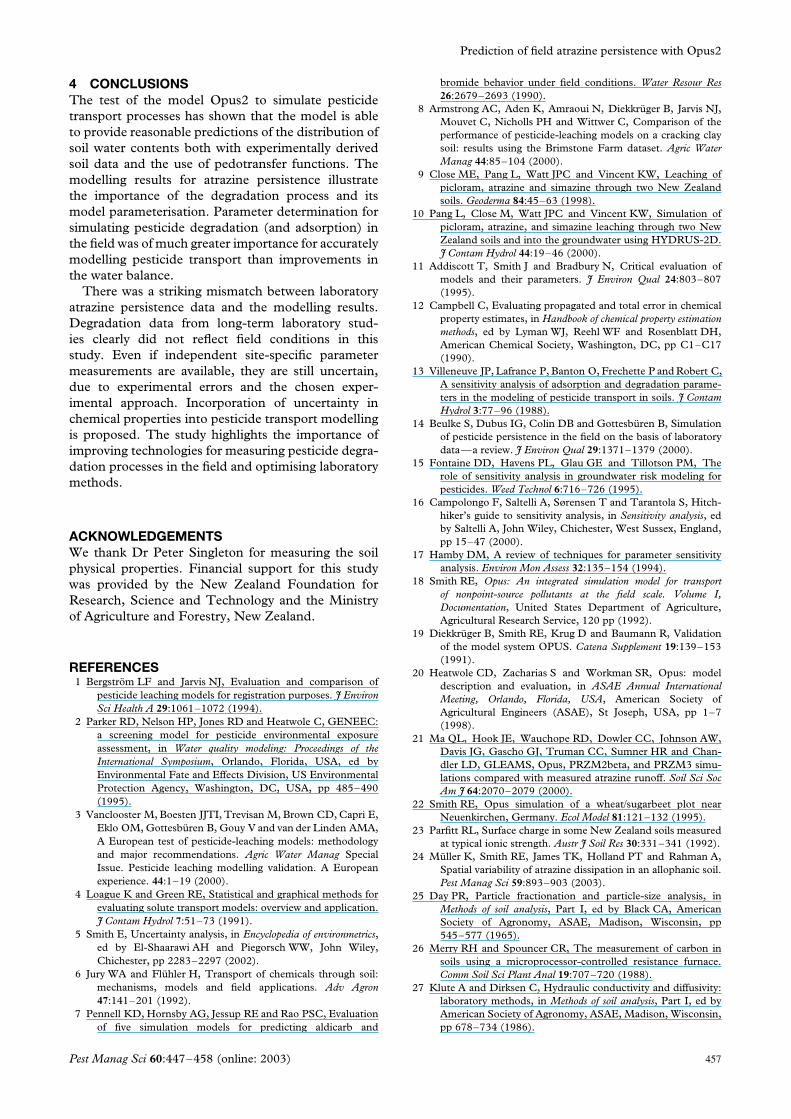
3.6 Sensitivity analysisFigure 8 illustrates that the mass of atrazine remainingafter two months in the soil profile was very sensitive tochanging the degradation rate for all three degradationalgorithms. The curves were non-linear, with anunderestimation of degradation rate being morecrucial than an overestimation. The output was alsosensitive to changes in the Arrhenius coefficient, withan almost linear response to input changes. Therelative impact of the soil organic carbon content(OC) in the first soil layer was more pronouncedthan the partition coefficient KOC, which in turnis influenced by OC. The response curve for KOC
was strongly asymmetrical with a greater sensitivityfor decreasing values. Too low a value could leadOpus2 to overestimate pesticide leaching. The effectof the variation of the Freundlich parameter n was alsoanalysed. It was small for values less than one, butvery significant for values greater than one. Applying aconvex isotherm (n = 1.2) instead of a linear sorptionisotherm (n = 1) increased the predicted atrazine massleft in the profile by 60%. Boesten51 reported that
Pest Manag Sci 60:447–458 (online: 2003) 455
K Muller et al
-100 -80 -60 -40 -20 0 20 40 60 80 100
Cha
nge
in a
traz
ine
mas
s (%
)
-100
-50
0
50
100
150
200
250
Arrhenius coefficientdegradation rateKoc
Corg
α
Arrhenius coefficientdegradation rateacclimation time
Arrhenius coefficientdegradation rate
A
Change in parameter value (%)
-100 -80 -60 -40 -20 0 20 40 60 80 100
Cha
nge
in a
traz
ine
mas
s (%
)
-100
-50
0
50
100
150
200
250B
Change in parameter value (%)
-100 -80 -60 -40 -20 0 20 40 60 80 100
Cha
nge
in a
traz
ine
mas
s (%
)
-100
-50
0
50
100
200
150
250
350
300
400C
Change in parameter value (%)
Figure 8. Model sensitivity analysis for some key input parametersfor the model Opus2: A: first-order degradation kinetics; B: two-stageexponential degradation; C: sigmoidal degradation model.
a strong influence of a non-equilibrium sorptionprocess can be expected only if transformationproceeds rapidly. However, these kinds of parameterdependencies were not taken into account in oursimple step-by-step sensitivity analysis. The averagesensitivity coefficients for the first-order decay modelwere 0.97, 1.33, 0.43 and 0.3 for EA, kl, OC and KOC,respectively. The more complex two-stage exponentialmodel has sensitivity coefficients for EA, the twodegradation coefficients k1 and k2, and α of 1.28,1.54 and 0.1, respectively. For the sigmoidal model,sensitivity coefficients of 1.75, 2.30 and 0.13 weredetermined for EA, kd and td , respectively. The analysisrevealed the high sensitivity of model results todegradation rate coefficients, and also to the organic Ccontent. Both these parameters tend to be site-specificand exhibit a large spatial and temporal variabilityand, thus, measured values are rather uncertain.14,52
The other sensitive parameter, the coefficient EA, isclosely interrelated with kl [eqn (1)]. To conclude,pesticide half-life determination is extremely criticalfor pesticide transport modelling with Opus2.
Independent determination is advisable, eg throughlaboratory studies. However, there is considerablediscussion as to whether laboratory degradation datacan be representative of field data.14 Acceleratedtransformation, as observed in our field study,is attributed to microbiological adaptation of soilmicrobiological populations53,54 following repeatedatrazine applications. In our laboratory study for 10 ◦Cthis might not have occurred due to a decrease in themicrobiological biomass, as observed in incubationstudies by Anderson.55 The laboratory data for 20 and30 ◦C indicate accelerated degradation, presumablybecause of rapid growth of micro-organisms at thesehigh temperatures. Also, pronounced variations oftemperature and moisture at the soil surface, whereatrazine prevailed for the first 12 days, were notemulated in the laboratory incubation experiments.Surface processes occurring in the field, but beingminimised in the laboratory experiments, such asphotolysis and volatilisation, may also be responsiblefor the difference between field and laboratory half-lives, but are difficult to assess. Whatever the cause,degradation observed in the laboratory did not followthe same pattern as under field conditions. Manyother studies have reported the same difficulties.1,56
In other studies, field-measured herbicide persistence(metamitron, simazine and methabenzthiazuron) ina silt-loam was closely matched by modelling usinghalf-lives measured in laboratory experiments.57
Oversimplistic sorption and degradation modelswere assessed as partial explanations for the dis-agreements between measurements and simulations(Table 7). Model error in transport processes mightbe another explanation for the discrepancies betweenmeasured and predicted atrazine leaching. Opus2predicts an expected soil redistribution behaviourassuming Darcy flow conditions (Fig 7), but does notsimulate leaching through macropores. Thus, anotherexplanation for the poor fit of the mass data might beepisodic preferential flow of atrazine below the sam-pled depth of 0.3 m. Some currently available models(eg MACRO,58 LEACHM59) implement preferentialflow processes. Parameters, such as the percentageof macropores required by such models, are empir-ically derived and thus simulation results may notbe objective.60 Therefore reducing the model errorby improving the process description can increasethe parameter error by increasing the number ofrequired, and perhaps highly uncertain, parameters.Model structure and parameter values may be real-istic or they may be unrealistic and compensate foreach other. In any case, the thoroughly tilled andunstructured andosol used in this study is very unlikelyto exhibit significant preferential vertical flow in theupper 25 cm, and there was no experimental evidenceof such rapid throughflow.
456 Pest Manag Sci 60:447–458 (online: 2003)
Prediction of field atrazine persistence with Opus2
4 CONCLUSIONSThe test of the model Opus2 to simulate pesticidetransport processes has shown that the model is ableto provide reasonable predictions of the distribution ofsoil water contents both with experimentally derivedsoil data and the use of pedotransfer functions. Themodelling results for atrazine persistence illustratethe importance of the degradation process and itsmodel parameterisation. Parameter determination forsimulating pesticide degradation (and adsorption) inthe field was of much greater importance for accuratelymodelling pesticide transport than improvements inthe water balance.
There was a striking mismatch between laboratoryatrazine persistence data and the modelling results.Degradation data from long-term laboratory stud-ies clearly did not reflect field conditions in thisstudy. Even if independent site-specific parametermeasurements are available, they are still uncertain,due to experimental errors and the chosen exper-imental approach. Incorporation of uncertainty inchemical properties into pesticide transport modellingis proposed. The study highlights the importance ofimproving technologies for measuring pesticide degra-dation processes in the field and optimising laboratorymethods.
ACKNOWLEDGEMENTSWe thank Dr Peter Singleton for measuring the soilphysical properties. Financial support for this studywas provided by the New Zealand Foundation forResearch, Science and Technology and the Ministryof Agriculture and Forestry, New Zealand.
REFERENCES1 Bergstrom LF and Jarvis NJ, Evaluation and comparison of
pesticide leaching models for registration purposes. J EnvironSci Health A 29:1061–1072 (1994).
2 Parker RD, Nelson HP, Jones RD and Heatwole C, GENEEC:a screening model for pesticide environmental exposureassessment, in Water quality modeling: Proceedings of theInternational Symposium, Orlando, Florida, USA, ed byEnvironmental Fate and Effects Division, US EnvironmentalProtection Agency, Washington, DC, USA, pp 485–490(1995).
3 Vanclooster M, Boesten JJTI, Trevisan M, Brown CD, Capri E,Eklo OM, Gottesburen B, Gouy V and van der Linden AMA,A European test of pesticide-leaching models: methodologyand major recommendations. Agric Water Manag SpecialIssue. Pesticide leaching modelling validation. A Europeanexperience. 44:1–19 (2000).
4 Loague K and Green RE, Statistical and graphical methods forevaluating solute transport models: overview and application.J Contam Hydrol 7:51–73 (1991).
5 Smith E, Uncertainty analysis, in Encyclopedia of environmetrics,ed by El-Shaarawi AH and Piegorsch WW, John Wiley,Chichester, pp 2283–2297 (2002).
6 Jury WA and Fluhler H, Transport of chemicals through soil:mechanisms, models and field applications. Adv Agron47:141–201 (1992).
7 Pennell KD, Hornsby AG, Jessup RE and Rao PSC, Evaluationof five simulation models for predicting aldicarb and
bromide behavior under field conditions. Water Resour Res26:2679–2693 (1990).
8 Armstrong AC, Aden K, Amraoui N, Diekkruger B, Jarvis NJ,Mouvet C, Nicholls PH and Wittwer C, Comparison of theperformance of pesticide-leaching models on a cracking claysoil: results using the Brimstone Farm dataset. Agric WaterManag 44:85–104 (2000).
9 Close ME, Pang L, Watt JPC and Vincent KW, Leaching ofpicloram, atrazine and simazine through two New Zealandsoils. Geoderma 84:45–63 (1998).
10 Pang L, Close M, Watt JPC and Vincent KW, Simulation ofpicloram, atrazine, and simazine leaching through two NewZealand soils and into the groundwater using HYDRUS-2D.J Contam Hydrol 44:19–46 (2000).
11 Addiscott T, Smith J and Bradbury N, Critical evaluation ofmodels and their parameters. J Environ Qual 24:803–807(1995).
12 Campbell C, Evaluating propagated and total error in chemicalproperty estimates, in Handbook of chemical property estimationmethods, ed by Lyman WJ, Reehl WF and Rosenblatt DH,American Chemical Society, Washington, DC, pp C1–C17(1990).
13 Villeneuve JP, Lafrance P, Banton O, Frechette P and Robert C,A sensitivity analysis of adsorption and degradation parame-ters in the modeling of pesticide transport in soils. J ContamHydrol 3:77–96 (1988).
14 Beulke S, Dubus IG, Colin DB and Gottesburen B, Simulationof pesticide persistence in the field on the basis of laboratorydata—a review. J Environ Qual 29:1371–1379 (2000).
15 Fontaine DD, Havens PL, Glau GE and Tillotson PM, Therole of sensitivity analysis in groundwater risk modeling forpesticides. Weed Technol 6:716–726 (1995).
16 Campolongo F, Saltelli A, Sørensen T and Tarantola S, Hitch-hiker’s guide to sensitivity analysis, in Sensitivity analysis, edby Saltelli A, John Wiley, Chichester, West Sussex, England,pp 15–47 (2000).
17 Hamby DM, A review of techniques for parameter sensitivityanalysis. Environ Mon Assess 32:135–154 (1994).
18 Smith RE, Opus: An integrated simulation model for transportof nonpoint-source pollutants at the field scale. Volume I,Documentation, United States Department of Agriculture,Agricultural Research Service, 120 pp (1992).
19 Diekkruger B, Smith RE, Krug D and Baumann R, Validationof the model system OPUS. Catena Supplement 19:139–153(1991).
20 Heatwole CD, Zacharias S and Workman SR, Opus: modeldescription and evaluation, in ASAE Annual InternationalMeeting, Orlando, Florida, USA, American Society ofAgricultural Engineers (ASAE), St Joseph, USA, pp 1–7(1998).
21 Ma QL, Hook JE, Wauchope RD, Dowler CC, Johnson AW,Davis JG, Gascho GJ, Truman CC, Sumner HR and Chan-dler LD, GLEAMS, Opus, PRZM2beta, and PRZM3 simu-lations compared with measured atrazine runoff. Soil Sci SocAm J 64:2070–2079 (2000).
22 Smith RE, Opus simulation of a wheat/sugarbeet plot nearNeuenkirchen, Germany. Ecol Model 81:121–132 (1995).
23 Parfitt RL, Surface charge in some New Zealand soils measuredat typical ionic strength. Austr J Soil Res 30:331–341 (1992).
24 Muller K, Smith RE, James TK, Holland PT and Rahman A,Spatial variability of atrazine dissipation in an allophanic soil.Pest Manag Sci 59:893–903 (2003).
25 Day PR, Particle fractionation and particle-size analysis, inMethods of soil analysis, Part I, ed by Black CA, AmericanSociety of Agronomy, ASAE, Madison, Wisconsin, pp545–577 (1965).
26 Merry RH and Spouncer CR, The measurement of carbon insoils using a microprocessor-controlled resistance furnace.Comm Soil Sci Plant Anal 19:707–720 (1988).
27 Klute A and Dirksen C, Hydraulic conductivity and diffusivity:laboratory methods, in Methods of soil analysis, Part I, ed byAmerican Society of Agronomy, ASAE, Madison, Wisconsin,pp 678–734 (1986).
Pest Manag Sci 60:447–458 (online: 2003) 457
K Muller et al
28 Brooks RH and Corey AT, Hydraulic properties of porousmedia, Hydrology Paper, Colorado State University, FortCollins, CO (1964).
29 Richter O, Diekkruger B and Nortersheuser P, Environmentalfate modelling of pesticides. From the laboratory to the field scale,VCH Verlagsgesellschaft mbH, Weinheim, Germany (1996).
30 Zacharias S, Heatwole CD, Persaud N, Bruggeman AC,Kumar D and Smith CN, Stochastic simulation of field-scalepesticide transport using Opus and GLEAMS. J Environ Qual28:411–423 (1999).
31 Ritchie JT, A model for predicting evaporation from a row cropwith incomplete cover. Water Resour Res 8:1204–1213 (1972).
32 Smith RE, Corradini C and Melone F, Modelling infiltrationfor multistorm runoff events. Water Resour Res 29:133–144(1993).
33 Rawls WJ, Brakensiek DL and Saxton KE, Estimation of soilwater properties. Trans ASAE 25:1316–1320, 1328 (1982).
34 Press WH, Teukolsky SA, Vetterling WT and Flannery BP,Numerical recipes in C, Cambridge University Press, Cam-bridge (1992).
35 Dufner D, Jensen U and Schumacher E, Statistik mit SAS, BGTeubner, Stuttgart (1992).
36 Parrish RS and Smith CN, A method for testing whether modelpredictions fall within a prescribed factor of true values, withan application to pesticide leaching. Ecol Model 51:59–72(1990).
37 Jarvis NJ, Brown CD and Granitza E, Sources of error in modelpredictions of pesticide leaching: a case study using theMACRO model. Agric Water Manag 44:247–262 (2000).
38 Persicani D, Gasparetti PSG and Bonvini M, Comparison ofmeasured and simulated atrazine mobility in two alluvialsoils. Soil Technol 9:281–298 (1996).
39 Clemente RS, Prasher SO and Salehi F, Performance test-ing and validation of PESTFADE. Agric Water Manag37:205–224 (1998).
40 Jakeman AJ, Ghassemi F and Dietricj C, Calibration andreliability of an aquifer system model using generalizedsensitivity analysis, in Model CARE90: Calibration andrealibility in groundwater modelling, ed by Kovar K, IAHS,Wallingford, p 539 (1990).
41 Baskaran S, Bolan NS, Rahman A and Tillman RW, Non-Equilibrium sorption during the movement of pesticides insoils. Pestic Sci 46:333–343 (1996).
42 Singleton P, Soils of Ruakura—a window on the Waikato, DSIRLand Resources, Hamilton, NL (1991).
43 Addiscott T, Smith JA and Bradbury N, Critical evaluation ofmodels and their parameters. J Environ Qual 24:803–807(1995).
44 Close ME, Watt JPC and Vincent KW, Simulation of picloram,atrazine, and simazine transport through two New Zealandsoils using LEACHM. Austr J Soil Res 37:53–74 (1999).
45 Gottesburen B, Estimation of pesticide parameters fromlysimeter studies using an inverse modelling approach, in9th IUPAC International Congress on Pesticide Chemistry—TheFood-Environment Challenge, London, UK, The Royal Societyof Chemistry, London, UK (1998).
46 James TK, Holland PT, Rahman A and Lu YR, Degradationof the sulfonylurea herbicides chlorsulfuron and triasulfuronin a high-organic-matter volcanic soil. Weed Res 39:137–147(1999).
47 Boesten JJTI and Gottesburen B, Testing PESTLA using twomodellers for bentazone and ethoprophos in a sandy soil.Agric Water Manag 44:283–305 (2000).
48 Boesten JJTI, Modeller subjectivity in estimating pesticideparameters for leaching models using the same laboratorydata set. Agric Water Manag 44:389–409 (2000).
49 Brown CD, Baer U, Gunther P, Trevisan M and Walker A,Ring test with the models LEACHP, PRZM-2 andVARLEACH: Variability between model users in predictionof pesticide leaching using a standard data set. Pestic Sci47:249–258 (1996).
50 Dubus IG, Beulke S and Brown CD, Review: Calibration ofpesticide leaching models: critical review and guidance forreporting. Pest Manag Sci 58:745–758 (2002).
51 Boesten JJTI, Modelling pesticide transport with a three-sitesorption sub-model: a field test. Neth J Agric Sci 35:315–324(1987).
52 Wauchope RD, Yeh S, Linders JBHJ, Klaskowski R, Tanaka K,Rubin B, Katayama A, Kordel W, Gerstl Z, Lane M andUnsworth JB, Review. Pesticide soil sorption parameters:theory, measurement, uses, limitations and reliability. PestManag Sci 58:419–445 (2002).
53 Visser S, Fujikawa J, Griffiths CL and Parkinson D, Effect oftopsoil storage on microbial activity, primary production anddecomposition potential. Plant and Soil 122:41–50 (1984).
54 Vink JPM, Pesticide biotransformation and fate in heteroge-neous environments, Thesis, Landbouwuniversiteit Wagenin-gen, Wageningen Agricultural University, Wageningen,Netherlands (1997).
55 Anderson JPE, Handling and storage of soils for pesticide experi-ments, in Pesticide effects on soil microflora, ed by Sommerville Land Greaves MP, Taylor and Francis, London, pp 45–60(1987).
56 Jarvis NJ, Stahli M, Bergstrom L and Johnsson H, Simulationof dichlorprop and bentazone leaching in soils of contrastingtexture using the MACRO model. J Environ Sci Health (PartA) 29:1255–1277 (1994).
57 Jarvis NJ, Simulation of soil water dynamics and herbicidepersistence in a silt loam soil using the MACRO model.Ecol Model 81:97–109 (1995).
58 Jarvis NJ, The MACRO model (Version 3.1). Technical descriptionand sample simulations, Swedish University of AgriculturalSciences, Department of Soil Science, Uppsala, 52 pp (1994).
59 Wagenet RJ and Hutson JL, LEACHM: Leaching estimation andchemistry model, Vol 2, Report, Water Resources InstituteContinuum, Centre for Environmental Research, CornellUniversity, Ithaca, NY (1987).
60 Nofziger DL, Chen JS and Haan CT, Evaluating CMLS as atool for assessing risk of pesticide leaching to groundwater. JEnviron Sci Health (Part A) 29:1133–1155 (1994).
458 Pest Manag Sci 60:447–458 (online: 2003)