DRAFT REPORT North Fork Vermilion River Atrazine Total ...
42
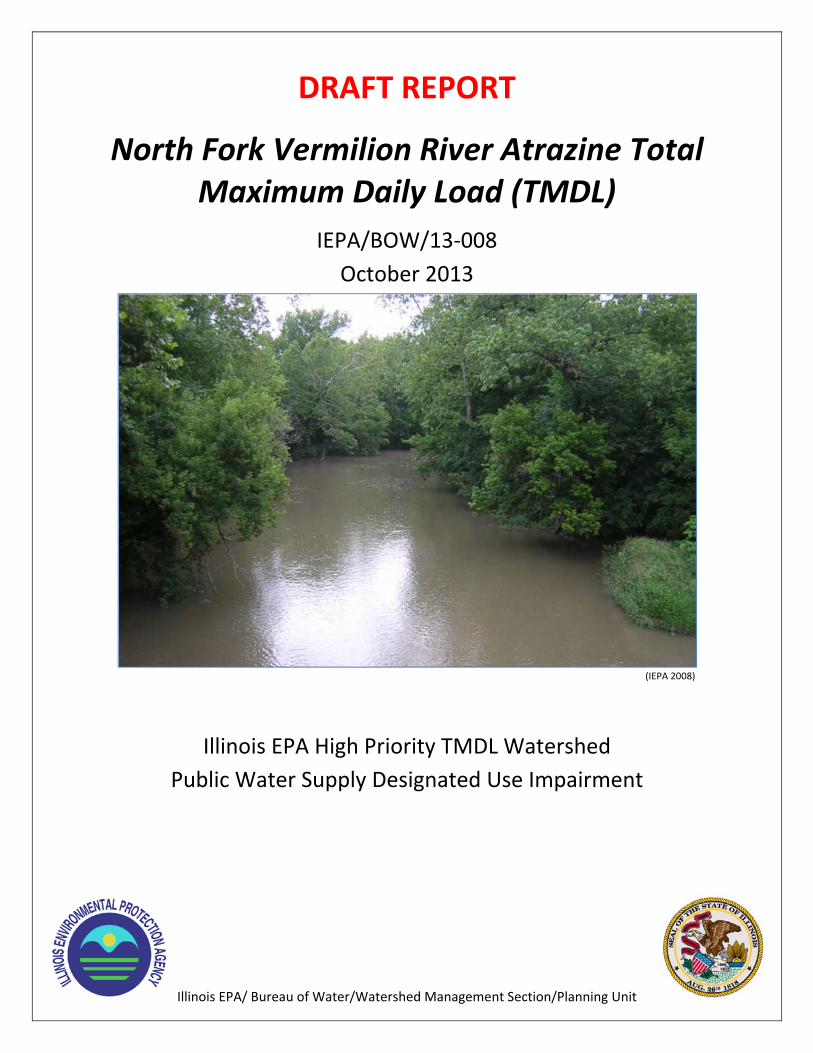
Illinois EPA/ Bureau of Water/Watershed Management Section/Planning Unit DRAFT REPORT North Fork Vermilion River Atrazine Total Maximum Daily Load (TMDL) IEPA/BOW/13‐008 October 2013 (IEPA 2008) Illinois EPA High Priority TMDL Watershed Public Water Supply Designated Use Impairment
-
Upload
khangminh22 -
Category
Documents
-
view
2 -
download
0
Transcript of DRAFT REPORT North Fork Vermilion River Atrazine Total ...
Illinois EPA/ Bureau of Water/Watershed Management Section/Planning Unit
DRAFT REPORT
North Fork Vermilion River Atrazine Total Maximum Daily Load (TMDL)
IEPA/BOW/13‐008
October 2013
(IEPA 2008)
Illinois EPA High Priority TMDL Watershed
Public Water Supply Designated Use Impairment

i
ContentsSection 1. Goals and Objectives for North Fork Vermilion River.............................................. 1
1.1 Total Maximum Daily Load (TMDL) Overview .................................................................. 1 1.2 TMDL Goals and Objectives for North Fork Vermilion River ........................................... 1
Section 2. North Fork Vermilion Watershed Descriptions ......................................................... 4 2.1 Watershed Location ................................................................................................................. 4 2.2 Land Use .................................................................................................................................... 4 2.4 Soils ............................................................................................................................................ 5 2.5 Watershed Groups/Projects ................................................................................................... 6
Section 3. Public Participation and Involvement ......................................................................... 7 3.1 Public Participation and Involvement ................................................................................... 7
Section 4. Water Quality Standards ............................................................................................... 8 4.1 Illinois Water Quality Standards ............................................................................................ 8 4.2 Designated Uses ..................................................................................................................... 10 4.3 Potential Pollutant Sources ................................................................................................... 10
Section 5. Watershed Characterization ....................................................................................... 11 5.1 Water Quality Data ................................................................................................................ 11 5.2 Stream Characteristics ........................................................................................................... 14 5.3 Point Sources ........................................................................................................................... 15 5.4 Nonpoint Sources ................................................................................................................... 15
Section 6. TMDL Development .................................................................................................... 16 6.1 TMDL Calculations ................................................................................................................ 16 6.2 Pollutant Sources and Linkages ........................................................................................... 16 6.3 TMDL Allocations for North Fork Vermilion River Watershed ..................................... 16
Section 7. Implementation Plan for North Fork Vermilion River ........................................... 18 7.1 Nonpoint Sources of Atrazine .............................................................................................. 19 7.2 Reasonable Assurance ........................................................................................................... 26 7.3 Monitoring Plan ...................................................................................................................... 31
Section 8. Acronyms and Abbreviations ..................................................................................... 32 Section 9. References ...................................................................................................................... 33

North Fork Vermilion River Draft TMDL- October 2013
ii
List of Tables Table 1. Impairment in the North Fork Vermilion River .............................................................. 2 Table 2. Corn Tillage Practices ........................................................................................................ 5 Table 3. Guidelines for Assessing Public Water Supply in Waters of the State (IEPA 2012) . 8 Table 4. MCL for North Fork Vermilion River Impairment ...................................................... 10 Table 5. Summary of Potential Sources for North Fork Vermilion River Watershed ........... 10 Table 6. IEPA Water Quality Data in the North Fork Vermilion Watershed ......................... 12 Table 7. Atrazine Exceedences (Syngenta Data) ......................................................................... 12 Table 8. Atrazine Exceedences 2009-2011 .................................................................................... 13 Table 9. Point Sources in North Fork Vermilion River Watershed .......................................... 15 Table 10. Target Loads for North Fork Vermilion River ........................................................... 17 Table 11. TMDL Summary for North Fork Vermilion River ..................................................... 18 Table 12. Filter Strip Flow Lengths Based on Land Slope ......................................................... 21 Table 13. Vermilion and Iroquois Counties USDA Service Center Contact Information ..... 30
List of Figures Figure 1. North Fork Vermilion River Watershed ........................................................................ 3 Figure 2. Landuse in North Fork Vermilion River Watershed ................................................... 4 Figure 3. North Fork Vermilion River Watershed K-Factor (IEPA 2008) .................................. 6 Figure 4. IEPA Water Quality Stations in the North Fork Vermilion Watershed .................. 11 Figure 5. Raw and Finished Atrazine Water Data for North Fork Vermilion River (Syngenta Data) ................................................................................................................................ 14 Figure 6. Buffer Strip Around NHD Stream Coverage Using ArcGIS Geoprocessing Tool 22 Figure 7. Erosion Prone Areas ....................................................................................................... 24 Figure 8. Buffer Strips in Watershed ............................................................................................ 24
List of Attachments Attachment 1. Atrazine Data
North Fork Vermilion River Draft TMDL- October 2013
iii
EXECUTIVE SUMMARY
The objective of this draft report is to provide information that will be used to support a Total Maximum Daily Load (TMDL) development process for atrazine in the North Fork Vermilion River.
Background
Section 303(d) of the 1972 Clean Water Act requires States to define impaired waters and identify them on a list which is referred to as the 303(d) list. The State of Illinois recently issued the Draft 2014 303(d) list, which is available on the web at: http:// www.epa.state.il.us/water/tmdl/303d-list.html. Section 303(d) of the Clean Water Act and EPA's Water Quality Planning and Management Regulations (40 CFR Part 130) require states to develop Total Maximum Daily Loads (TMDLs) for water bodies that are not meeting their designated uses or water quality standards. The Clean Water Act requires that a TMDL be developed for each pollutant listed for an impaired waterbody. A TMDL is a report that is submitted by the States to the EPA. TMDL Process
The TMDL process establishes the allowable loading of pollutants or other quantifiable parameters for a water body based on the relationship between pollution sources and instream conditions. This allowable loading represents the maximum quantity of the pollutant that the waterbody can receive without exceeding water quality standards. The TMDL also takes into account a margin of safety, which reflects scientific uncertainty, as well as the effects of seasonal variation. By following the TMDL process, States can establish water quality-based controls to reduce pollution from both point and nonpoint sources, and restore and maintain the quality of their water resources (USEPA, 1991).
The Illinois EPA will be working with stakeholders to implement the necessary controls to improve water quality in the impaired waterbodies and meet water quality standards. It should be noted that the controls for nonpoint sources (e.g., agriculture) will be strictly voluntary.
Methods
The information presented in this report was gathered from previously approved TMDL Report (IEPA 2008) for the watersheds, and includes: 1) detailed watershed characterization; 2) development of a water quality database and data analyses; and 3) synthesis of the watershed characterization information and the data analysis results to confirm the sufficiency of the data to support both the listing decision and the sources of impairment that are included on the Draft 2014 303(d) list of impaired waterbodies.
Results
Based on work completed to date, Illinois EPA has concluded that TMDL is warranted for the river to address atrazine impairment in the watershed as discussed below:
For North Fork Vermilion River (BPG-05) sufficient data to support the causes listed on the Draft 2014 303(d) List for atrazine and a TMDL is warranted. Potential sources of atrazine impairment include agricultural runoff, and crop production.
North Fork Vermilion River Draft TMDL- October 2013
1
Section 1. Goals and Objectives for North Fork Vermilion River
1.1 Total Maximum Daily Load (TMDL) Overview A Total Maximum Daily Load, or TMDL, is a calculation of the maximum amount of a pollutant that a water body can receive and still meet water quality standards. TMDLs are a requirement of Section 303(d) of the Clean Water Act (CWA). To meet this requirement, the Illinois Environmental Protection Agency (Illinois EPA) must identify water bodies not meeting water quality standards and then establish TMDLs for restoration of water quality. Illinois EPA lists water bodies not meeting water quality standards every two years. This list is called the 303(d) list and water bodies on the list are then targeted for TMDL development.
In general, a TMDL is a quantitative assessment of water quality problems, contributing sources, and pollution reductions needed to attain water quality standards. The TMDL specifies the amount of pollution or other stressor that needs to be reduced to meet water quality standards, allocates pollution control or management responsibilities among sources in a watershed, and provides a scientific and policy basis for taking actions needed to restore a water body.
Water quality standards are laws or regulations that states authorize to enhance water quality and protect public health and welfare. Water quality standards provide the foundation for accomplishing two of the principal goals of the CWA. These goals are:
Restore and maintain the chemical, physical, and biological integrity of the nation's waters Where attainable, to achieve water quality that promotes protection and propagation of fish,
shellfish, and wildlife, and provides for recreation in and on the water Water quality standards consist of three elements: The designated beneficial use or uses of a water body or segment of a water body The water quality criteria necessary to protect the use or uses of that particular water body An antidegradation policy Examples of designated uses are recreation and protection of aquatic life. Water quality criteria describe the quality of water that will support a designated use. Water quality criteria can be expressed as numeric limits or as a narrative statement. Antidegradation policies are adopted so that water quality improvements are conserved, maintained, and protected.
1.2 TMDL Goals and Objectives for North Fork Vermilion River The Illinois EPA has a three-stage approach to TMDL development. The stages are:
Stage 1 – Watershed Characterization, Data Analysis, Methodology Selection
Stage 2 – Data Collection (optional)
Stage 3 – TMDL Analysis, TMDL Scenarios, Implementation Plan
North Fork Vermilion River Draft TMDL- October 2013
2
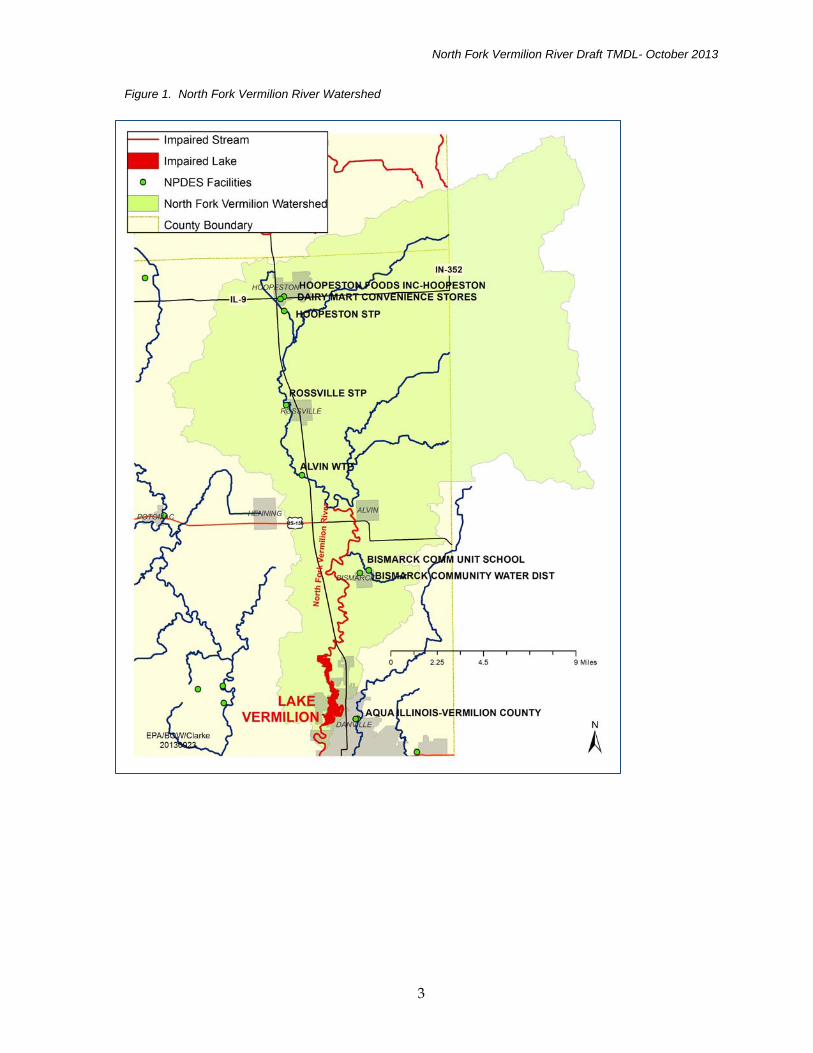
The impaired water body in the watershed is North Fork Vermilion River (BPG-05). This impaired water body is shown on Figure 1. Table 1 lists the water body ID, water body size, and potential causes of impairment for the water body (IEPA 2014). Atrazine is listed in the Draft 2014 IR and will be addressed in this TMDL. The river supplies water to Aqua Illinois to provide water to Danville, Catlin, Westville and unincorporated portions of Vermilion County
Table 1. Impairment in the North Fork Vermilion River
Water Body ID
Water Body Name Size
Causes of Impairment with Numeric Standards/ MCL
BPG-05 North Fork Vermilion River
10.2 Miles Atrazine
This TMDL applies to bold parameters only
A previous TMDL that includes North Fork Vermilion River for nitrate nitrogen was approved in December of 2006. The TMDL also included Lake Vermilion for phosphorus, nitrate nitrogen and total suspended solids. The final TMDL for North Fork Vermilion/ Lake Vermilion watershed is available at http://www.epa.state.il.us/water/tmdl/report/north-fork-vermilion/north-fork-vermilion.pdf. Information from the approved TMDL was used in this TMDL (IEPA 2008). The TMDL for the segment listed above will specify the following elements:
Loading Capacity (LC) or the maximum amount of pollutant loading a water body can receive without violating water quality standards
Waste Load Allocation (WLA) or the portion of the TMDL allocated to existing or future point sources
Load Allocation (LA) or the portion of the TMDL allocated to existing or future nonpoint sources and natural background
Margin of Safety (MOS) or an accounting of uncertainty about the relationship between pollutant loads and receiving water quality
These elements are combined into the following equation:
TMDL = LC = ΣWLA + ΣLA + MOS The TMDL developed must also take into account the seasonal variability of pollutant loads so that water quality standards are met during all seasons of the year. An allowance for increased atrazine loading (reserve capacity) was not included in this TMDL. North Fork Vermilion River is a drinking water source and atrazine is a chemical of concern; therefore, it is unlikely that changes to either the river or lake would result in an increased assimilative capacity. There are no plans to make changes such as increase the water capacity levels in Lake Vermilion. Reasonable assurance that the TMDL will be achieved is described in the implementation plan. The implementation plan for the watershed describes how water quality standards will be attained. This implementation plan includes recommendations for implementing best management practices (BMPs).
North Fork Vermilion River Draft TMDL- October 2013
3
Figure 1. North Fork Vermilion River Watershed

North Fork Vermilion River Draft TMDL- October 2013
4
Section 2. North Fork Vermilion Watershed Descriptions
2.1 Watershed Location North Fork Vermilion River watershed (Figure 1) is located in eastern Illinois, trends in a southern direction, and drains approximately 1,007 acres. Most of the Illinois watershed is in Vermilion Count with part in Iroquois County. The upper watershed is in the State of Indiana. The entire watershed is 188,000 acres, while the Illinois watershed makes up approximately 149,000 acres.
2.2 Land Use
Figure 2. Landuse in North Fork Vermilion River Watershed

North Fork Vermilion River Draft TMDL- October 2013
5
Landcover information is from the 2011 Illinois Cropland Data layer produced by the USDA National Agricultural Statistics Service (http://www.nass.usda.gov/research/Cropland/metadata/metadata_il11.htm ). The land cover data for North Fork Vermilion River watershed reveal that approximately 88 percent are devoted to agricultural activities. Other land uses include developed (7%) and forest (5%) (see Figure 2).
Tillage practices can be categorized as conventional till, reduced till, mulch-till, and no-till. The percentage of each tillage practice for corn by county is generated by the Illinois Department of Agriculture from County Transect Surveys. The most recent survey with county statistics was conducted in 2004 (IDOA 2004). Data specific to the watersheds were not available; however, the county practices were available and are shown in the following table.
Table 2. Corn Tillage Practices
Tillage System Vermilion County
Iroquois County
Conventional 89% 65% Reduced - Till 8% 15% Mulch - Till 2% 15% No - Till 0% 5%
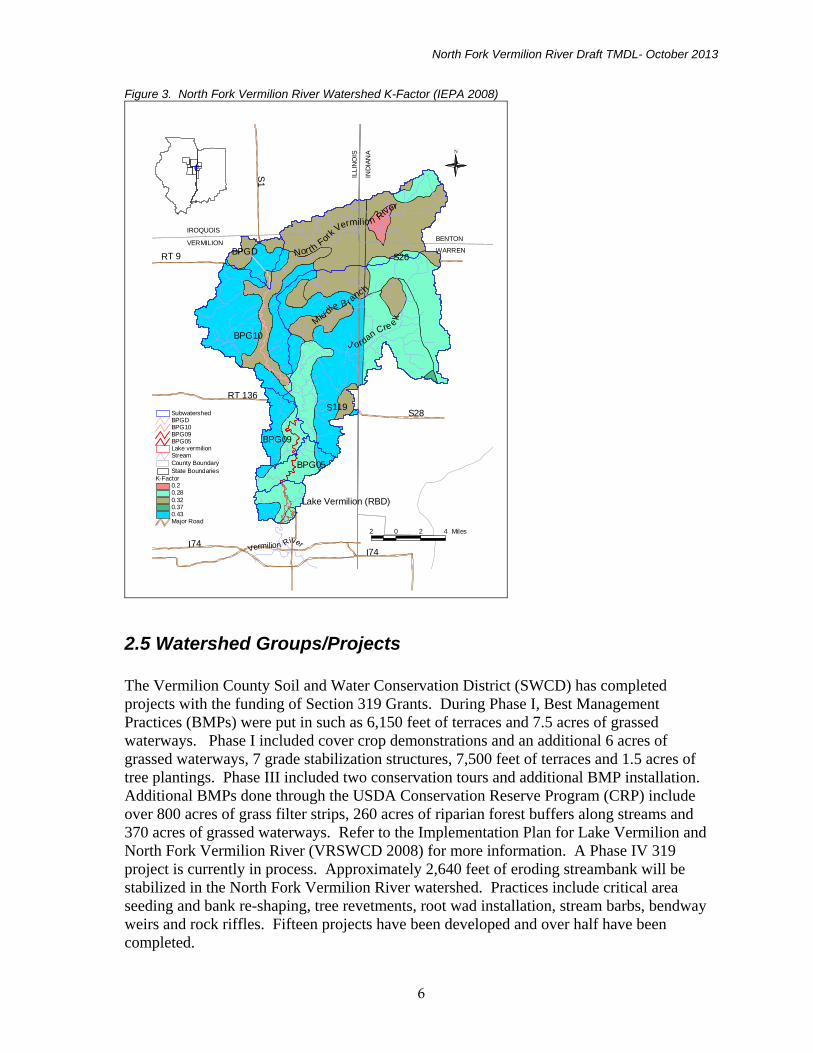
2.4 Soils Erosion factor K indicates the susceptibility of a soil to sheet and rill erosion by water. Factor K is one of six factors used in the Universal Soil Loss Equation (USLE) and the Revised Universal Soil Loss Equation (RUSLE) to predict the average annual rate of soil loss by sheet and rill erosion in tons per acre per year. The estimates are based primarily on percentage of silt, sand, and organic matter and on soil structure and saturated hydraulic conductivity (Ksat). Values of K range from 0.02 to 0.69. Other factors being equal, the higher the value, the more susceptible the soil is to sheet and rill erosion by water. Soils in the North Fork Vermilion River watershed have K factor values that range between 0.28 and 0.43 throughout the watershed (see Figure 3). Large K-factor values reflect greater potential soil erodibility. The more highly erodible soils are primarily distributed on both sides of North Fork Vermilion River in the central portion of the watershed (IEPA 2008).
North Fork Vermilion River Draft TMDL- October 2013
6
Figure 3. North Fork Vermilion River Watershed K-Factor (IEPA 2008)
J ordan Cre e
kMiddl
e B ra
nch
Nor th F
or
k Vermilion R
iver
BPG10
BPG09
BPG05
Lake Vermilion (RBD)
S1
S26
S28S119
RT 9
RT 136
BPGD
I74I74
N
2 0 2 4 Miles
Vermilion River
BENTON
WARREN
IROQUOIS
VERMILION
ILLI
NO
IS
IND
IAN
A
Major Road
K-Factor0.20.280.320.370.43
State BoundariesCounty BoundaryStreamLake vermilionBPG05BPG09BPG10BPGDSubwatershed
2.5 Watershed Groups/Projects The Vermilion County Soil and Water Conservation District (SWCD) has completed projects with the funding of Section 319 Grants. During Phase I, Best Management Practices (BMPs) were put in such as 6,150 feet of terraces and 7.5 acres of grassed waterways. Phase I included cover crop demonstrations and an additional 6 acres of grassed waterways, 7 grade stabilization structures, 7,500 feet of terraces and 1.5 acres of tree plantings. Phase III included two conservation tours and additional BMP installation. Additional BMPs done through the USDA Conservation Reserve Program (CRP) include over 800 acres of grass filter strips, 260 acres of riparian forest buffers along streams and 370 acres of grassed waterways. Refer to the Implementation Plan for Lake Vermilion and North Fork Vermilion River (VRSWCD 2008) for more information. A Phase IV 319 project is currently in process. Approximately 2,640 feet of eroding streambank will be stabilized in the North Fork Vermilion River watershed. Practices include critical area seeding and bank re-shaping, tree revetments, root wad installation, stream barbs, bendway weirs and rock riffles. Fifteen projects have been developed and over half have been completed.
North Fork Vermilion River Draft TMDL- October 2013
7
Section 3. Public Participation and Involvement
3.1 Public Participation and Involvement Public knowledge, acceptance, and follow through are necessary to implement a plan to meet recommended TMDLs. It is important to involve the public in the process as possible as early as possible to achieve maximum cooperation and counter concerns as to the purpose of the process and the regulatory authority to implement any recommendations.
Illinois EPA will hold a public meeting to present the TMDL for North Fork Vermilion River watershed on November 6, 2013 in Danville, Illinois.
North Fork Vermilion River Draft TMDL- October 2013
8
Section 4. Water Quality Standards
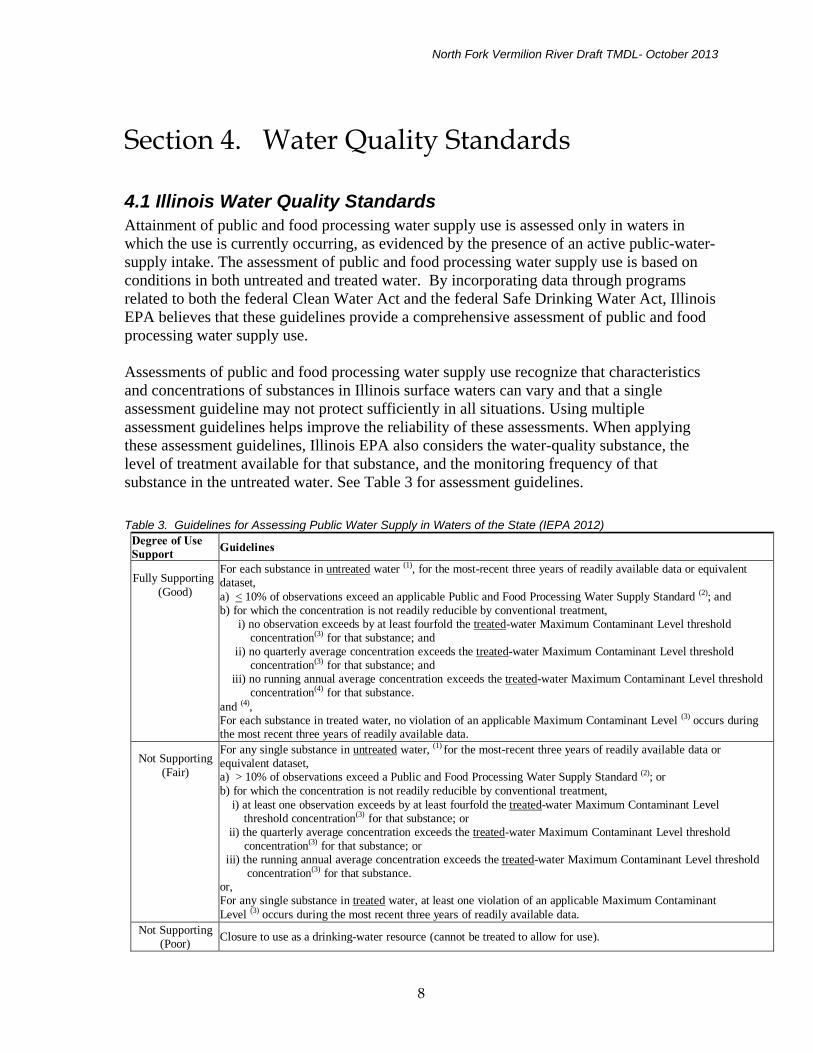
4.1 Illinois Water Quality Standards Attainment of public and food processing water supply use is assessed only in waters in which the use is currently occurring, as evidenced by the presence of an active public-water-supply intake. The assessment of public and food processing water supply use is based on conditions in both untreated and treated water. By incorporating data through programs related to both the federal Clean Water Act and the federal Safe Drinking Water Act, Illinois EPA believes that these guidelines provide a comprehensive assessment of public and food processing water supply use. Assessments of public and food processing water supply use recognize that characteristics and concentrations of substances in Illinois surface waters can vary and that a single assessment guideline may not protect sufficiently in all situations. Using multiple assessment guidelines helps improve the reliability of these assessments. When applying these assessment guidelines, Illinois EPA also considers the water-quality substance, the level of treatment available for that substance, and the monitoring frequency of that substance in the untreated water. See Table 3 for assessment guidelines.
Table 3. Guidelines for Assessing Public Water Supply in Waters of the State (IEPA 2012) Degree of Use Support Guidelines Fully Supporting
(Good)
For each substance in untreated water (1), for the most-recent three years of readily available data or equivalent dataset, a) < 10% of observations exceed an applicable Public and Food Processing Water Supply Standard (2); and b) for which the concentration is not readily reducible by conventional treatment,
i) no observation exceeds by at least fourfold the treated-water Maximum Contaminant Level threshold concentration(3) for that substance; and
ii) no quarterly average concentration exceeds the treated-water Maximum Contaminant Level threshold concentration(3) for that substance; and
iii) no running annual average concentration exceeds the treated-water Maximum Contaminant Level threshold concentration(4) for that substance.
and (4), For each substance in treated water, no violation of an applicable Maximum Contaminant Level (3) occurs during the most recent three years of readily available data.
Not Supporting
(Fair)
For any single substance in untreated water, (1) for the most-recent three years of readily available data or equivalent dataset, a) > 10% of observations exceed a Public and Food Processing Water Supply Standard (2); or b) for which the concentration is not readily reducible by conventional treatment,
i) at least one observation exceeds by at least fourfold the treated-water Maximum Contaminant Level threshold concentration(3) for that substance; or
ii) the quarterly average concentration exceeds the treated-water Maximum Contaminant Level threshold concentration(3) for that substance; or
iii) the running annual average concentration exceeds the treated-water Maximum Contaminant Level threshold concentration(3) for that substance.
or, For any single substance in treated water, at least one violation of an applicable Maximum Contaminant Level (3) occurs during the most recent three years of readily available data.
Not Supporting (Poor)
Closure to use as a drinking-water resource (cannot be treated to allow for use).
North Fork Vermilion River Draft TMDL- October 2013
9
1. Includes only the untreated-water results that were available in the primary computer database at the time data were compiled for these assessments. 2. 35 Ill. Adm. Code 302.304, 302.306 (http://www.ipcb.state.il.us/SLR/IPCBandIEPAEnvironmentalRegulations- Title35.asp). 3. 35 Ill. Adm. Code 611.300, 611.301, 611.310, 611.311, 611.325. 4. Some waters were assessed as Fully Supporting based on treated-water data only.
One of the assessment guidelines for untreated water relies on a frequency-of-exceedance threshold (10%) because this threshold represents the true risk of impairment better than does a single exceedance of a water quality criterion. Assessment guidelines also recognize situations in which water treatment that consists only of “...coagulation, sedimentation, filtration, storage and chlorination, or other equivalent treatment processes”(35 Ill. Adm. Code 302.303; hereafter called “conventional treatment”) may be insufficient for reducing potentially harmful levels of some substances. To determine if a Maximum Contaminant Level (MCL) violation in treated water would likely occur if treatment additional to conventional treatment were not applied (see 35 Ill. Adm. Code 302.305), the concentration of the potentially harmful substance in untreated water is examined and compared to the MCL threshold concentration. If the concentration in untreated water exceeds an MCL-related threshold concentration, then an MCL violation could reasonably be expected in the absence of additional treatment. Compliance with an MCL for treated water is based on a running 4-quarter (i.e., annual) average, calculated quarterly, of samples collected at least once per quarter (Jan.-Mar., Apr.-Jun., Jul.-Sep., and Oct.-Dec.). However, for some untreated-water intake locations sampling occurs less frequently than once per quarter; therefore, statistics comparable to quarterly averages or running 4-quarter averages cannot be determined for untreated water. Rather, for substances not known to vary regularly in concentration in Illinois surface waters (untreated) throughout the year, a simple arithmetic average concentration of all available results is used to compare to the MCL threshold. For substances known to vary regularly in concentration in surface waters during a typical year (e.g., atrazine), average concentrations within the relevant sub-annual (e.g., quarterly) periods are used. Table 4 present the MCL for the cause of impairment for North Fork Vermilion River. EPA has set an enforceable regulation for atrazine at 0.003 mg/L or 3 µg/L. The MCLs are from 35 Ill. Adm. Code 611, Subpart F: MCLs and Maximum Residual Disinfectant Levels (MRDLs). The MCL is the highest level of a contaminant that is allowed in drinking water. MCLs are set as close as feasible to the Maximum Contaminant Level Goals (MCLGs) using the best available treatment technology. If a facility exceeds the MCL, the facility must immediately investigate treatment options to reduce the level of the contaminant in the water supply. The MCLG is the level of a contaminant in drinking water below which there is no known or expected risk to human health. Some people who drink water containing atrazine well in excess of the MCL for many years could experience problems with their cardiovascular system or reproductive difficulties. For more information see the EPA website at http://water.epa.gov/drink/contaminants/basicinformation/atrazine.cfm. One of the primary ways that atrazine can affect your health is by altering the way that the reproductive system
North Fork Vermilion River Draft TMDL- October 2013
10
works (ATSDR 2003). Data regarding the health effects of atrazine in humans are limited and the bulk of the available toxicity data is from oral exposure studies in animals (ATSDR 2003). Table 4. MCL for North Fork Vermilion River Impairment
Parameter Units Public and Food Processing Water Supplies Atrazine µg/L 3 µg/L (Maximum Contaminant Level)
µg/L = micrograms per liter
4.2 Designated Uses The waters of Illinois are classified by designated uses, which include: General Use, Public and Food Processing Water Supplies, Lake Michigan, and Secondary Contact and Indigenous Aquatic Life Use. The designated use applicable to North Fork Vermilion River watershed is the Public and Food Processing Water Supplies Use. Drinking water for Danville, Catlin, Westville and unincorporated portions of Vermilion County is supplied by the Aqua Illinois Water Company. Catlin and Westville purchase water from Aqua Illinois.
The Public and Food Processing Water Supplies Use is defined by IPCB as standards that "are cumulative with the general use standards of Subpart B and must be met in all waters designated in Part 303 at any point at which water is withdrawn for treatment and distribution as a potable supply or for food processing."
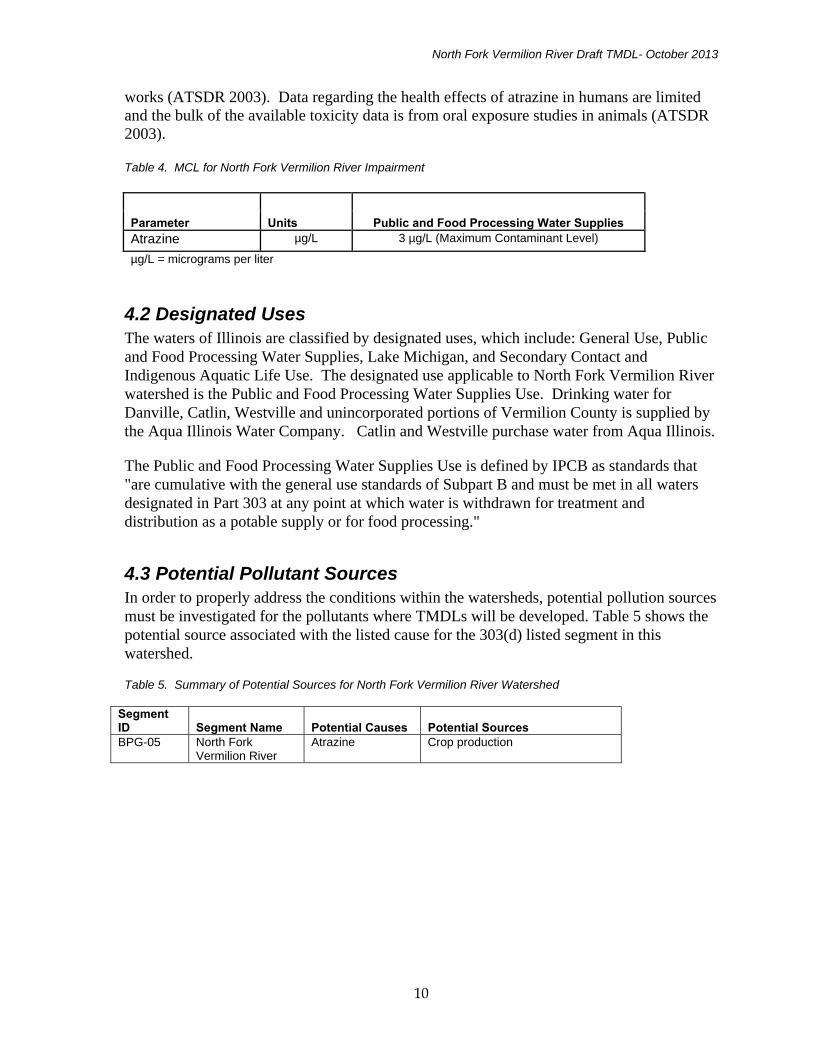
4.3 Potential Pollutant Sources In order to properly address the conditions within the watersheds, potential pollution sources must be investigated for the pollutants where TMDLs will be developed. Table 5 shows the potential source associated with the listed cause for the 303(d) listed segment in this watershed.
Table 5. Summary of Potential Sources for North Fork Vermilion River Watershed Segment ID Segment Name Potential Causes Potential Sources BPG-05 North Fork
Vermilion River Atrazine Crop production
North Fork Vermilion River Draft TMDL- October 2013
11
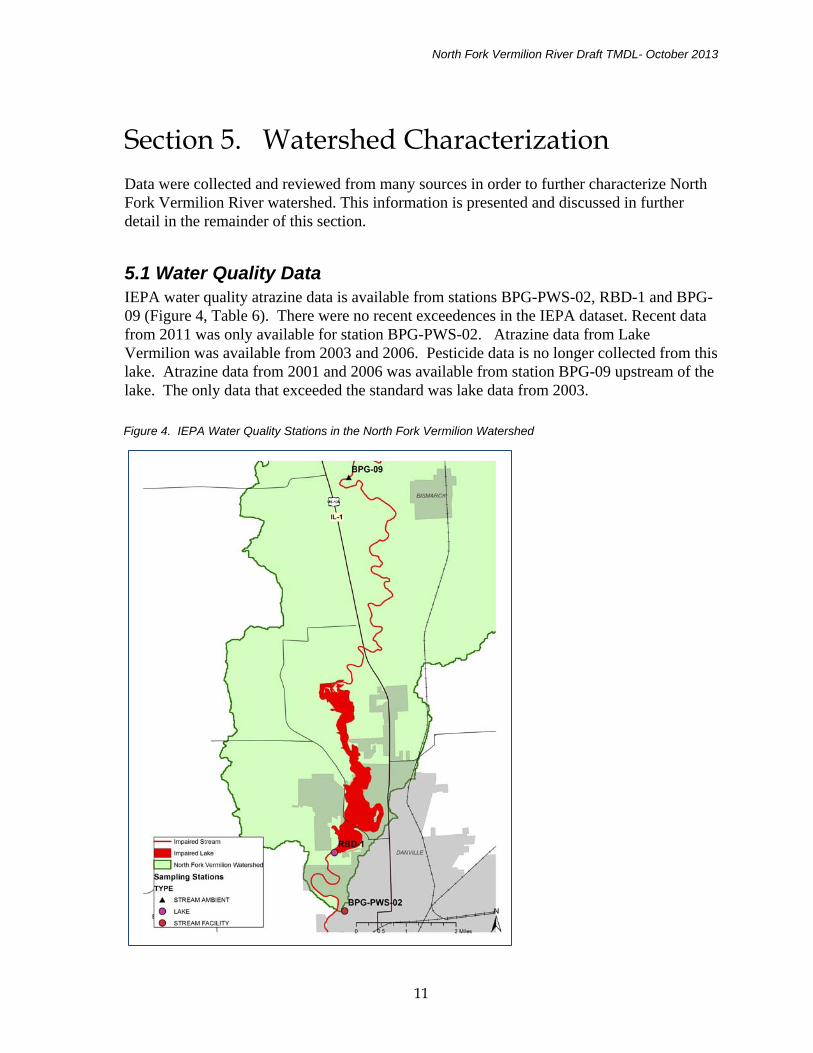
Section 5. Watershed Characterization Data were collected and reviewed from many sources in order to further characterize North Fork Vermilion River watershed. This information is presented and discussed in further detail in the remainder of this section.
5.1 Water Quality Data IEPA water quality atrazine data is available from stations BPG-PWS-02, RBD-1 and BPG-09 (Figure 4, Table 6). There were no recent exceedences in the IEPA dataset. Recent data from 2011 was only available for station BPG-PWS-02. Atrazine data from Lake Vermilion was available from 2003 and 2006. Pesticide data is no longer collected from this lake. Atrazine data from 2001 and 2006 was available from station BPG-09 upstream of the lake. The only data that exceeded the standard was lake data from 2003.
Figure 4. IEPA Water Quality Stations in the North Fork Vermilion Watershed
North Fork Vermilion River Draft TMDL- October 2013
12
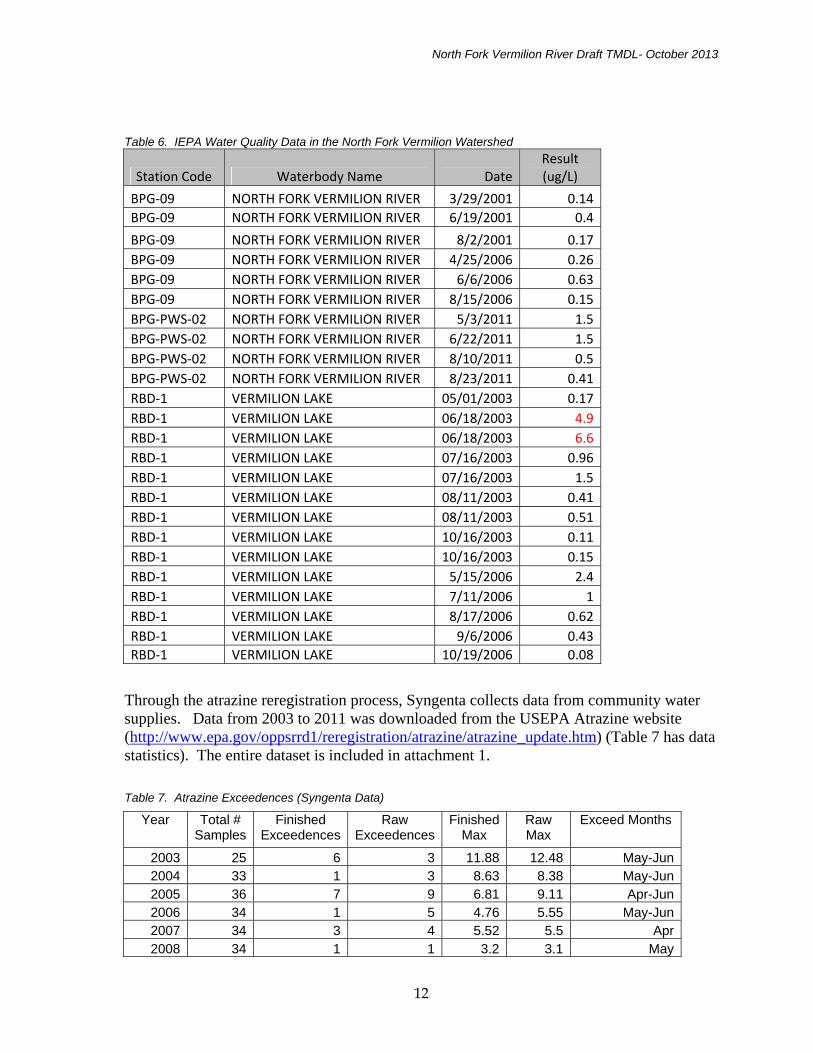
Table 6. IEPA Water Quality Data in the North Fork Vermilion Watershed
Station Code Waterbody Name DateResult (ug/L)
BPG‐09 NORTH FORK VERMILION RIVER 3/29/2001 0.14
BPG‐09 NORTH FORK VERMILION RIVER 6/19/2001 0.4
BPG‐09 NORTH FORK VERMILION RIVER 8/2/2001 0.17
BPG‐09 NORTH FORK VERMILION RIVER 4/25/2006 0.26
BPG‐09 NORTH FORK VERMILION RIVER 6/6/2006 0.63
BPG‐09 NORTH FORK VERMILION RIVER 8/15/2006 0.15
BPG‐PWS‐02 NORTH FORK VERMILION RIVER 5/3/2011 1.5
BPG‐PWS‐02 NORTH FORK VERMILION RIVER 6/22/2011 1.5
BPG‐PWS‐02 NORTH FORK VERMILION RIVER 8/10/2011 0.5
BPG‐PWS‐02 NORTH FORK VERMILION RIVER 8/23/2011 0.41
RBD‐1 VERMILION LAKE 05/01/2003 0.17
RBD‐1 VERMILION LAKE 06/18/2003 4.9
RBD‐1 VERMILION LAKE 06/18/2003 6.6
RBD‐1 VERMILION LAKE 07/16/2003 0.96
RBD‐1 VERMILION LAKE 07/16/2003 1.5
RBD‐1 VERMILION LAKE 08/11/2003 0.41
RBD‐1 VERMILION LAKE 08/11/2003 0.51
RBD‐1 VERMILION LAKE 10/16/2003 0.11
RBD‐1 VERMILION LAKE 10/16/2003 0.15
RBD‐1 VERMILION LAKE 5/15/2006 2.4
RBD‐1 VERMILION LAKE 7/11/2006 1
RBD‐1 VERMILION LAKE 8/17/2006 0.62
RBD‐1 VERMILION LAKE 9/6/2006 0.43
RBD‐1 VERMILION LAKE 10/19/2006 0.08
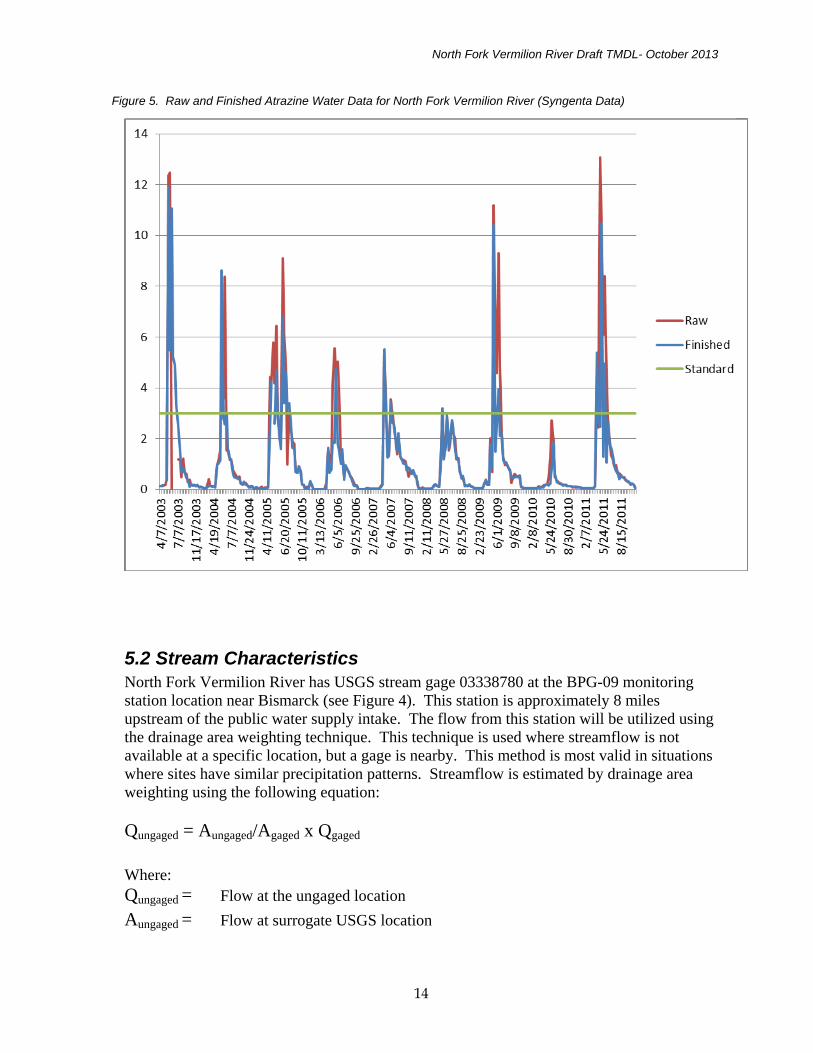
Through the atrazine reregistration process, Syngenta collects data from community water supplies. Data from 2003 to 2011 was downloaded from the USEPA Atrazine website (http://www.epa.gov/oppsrrd1/reregistration/atrazine/atrazine_update.htm) (Table 7 has data statistics). The entire dataset is included in attachment 1. Table 7. Atrazine Exceedences (Syngenta Data)
Year Total # Samples
Finished Exceedences
Raw Exceedences
Finished Max
Raw Max
Exceed Months
2003 25 6 3 11.88 12.48 May-Jun2004 33 1 3 8.63 8.38 May-Jun2005 36 7 9 6.81 9.11 Apr-Jun2006 34 1 5 4.76 5.55 May-Jun2007 34 3 4 5.52 5.5 Apr 2008 34 1 1 3.2 3.1 May
North Fork Vermilion River Draft TMDL- October 2013
13
Year Total # Samples
Finished Exceedences
Raw Exceedences
Finished Max
Raw Max
Exceed Months
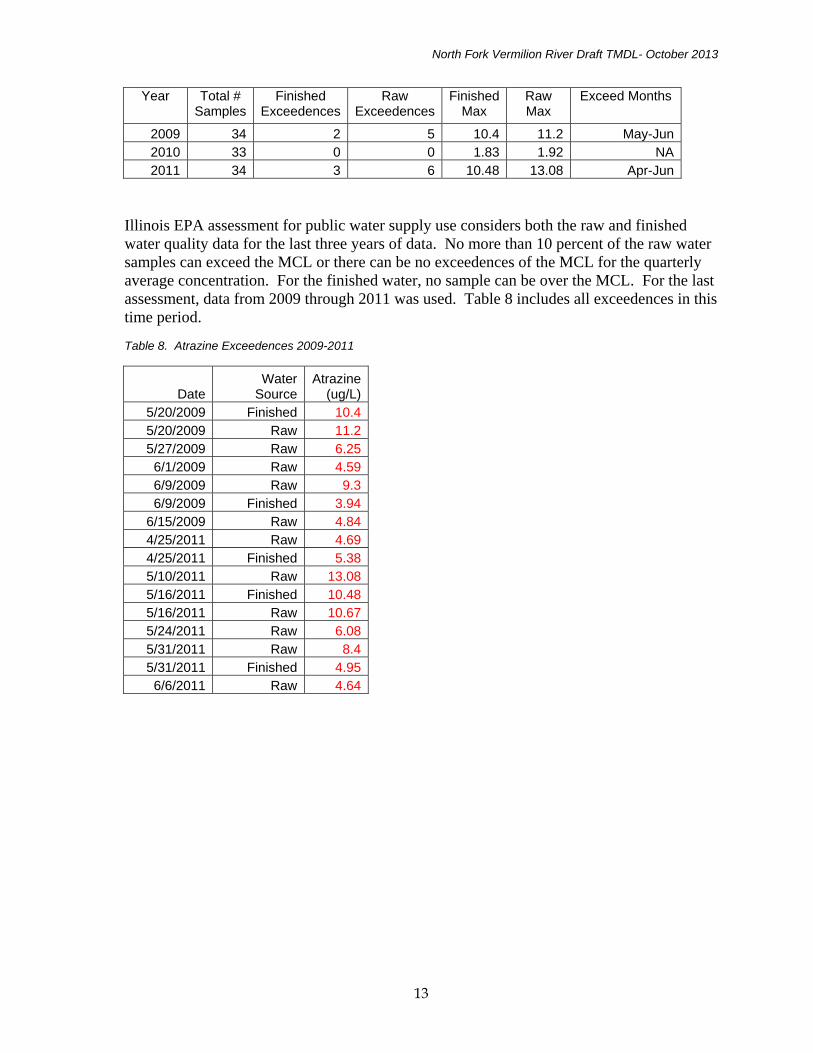
2009 34 2 5 10.4 11.2 May-Jun2010 33 0 0 1.83 1.92 NA2011 34 3 6 10.48 13.08 Apr-Jun
Illinois EPA assessment for public water supply use considers both the raw and finished water quality data for the last three years of data. No more than 10 percent of the raw water samples can exceed the MCL or there can be no exceedences of the MCL for the quarterly average concentration. For the finished water, no sample can be over the MCL. For the last assessment, data from 2009 through 2011 was used. Table 8 includes all exceedences in this time period. Table 8. Atrazine Exceedences 2009-2011
Date Water
Source Atrazine
(ug/L)5/20/2009 Finished 10.45/20/2009 Raw 11.25/27/2009 Raw 6.256/1/2009 Raw 4.596/9/2009 Raw 9.36/9/2009 Finished 3.94
6/15/2009 Raw 4.844/25/2011 Raw 4.694/25/2011 Finished 5.385/10/2011 Raw 13.085/16/2011 Finished 10.485/16/2011 Raw 10.675/24/2011 Raw 6.085/31/2011 Raw 8.45/31/2011 Finished 4.956/6/2011 Raw 4.64
North Fork Vermilion River Draft TMDL- October 2013
14
5.2 Stream Characteristics North Fork Vermilion River has USGS stream gage 03338780 at the BPG-09 monitoring station location near Bismarck (see Figure 4). This station is approximately 8 miles upstream of the public water supply intake. The flow from this station will be utilized using the drainage area weighting technique. This technique is used where streamflow is not available at a specific location, but a gage is nearby. This method is most valid in situations where sites have similar precipitation patterns. Streamflow is estimated by drainage area weighting using the following equation: Qungaged = Aungaged/Agaged x Qgaged
Where: Qungaged = Flow at the ungaged location
Aungaged = Flow at surrogate USGS location
Figure 5. Raw and Finished Atrazine Water Data for North Fork Vermilion River (Syngenta Data)
North Fork Vermilion River Draft TMDL- October 2013
15
Agaged = Drainage area at the ungaged location
Qgaged = Drainage area at surrogate USGS gage station
The drainage area at USGS gage 03338780 near Bismarck has a drainage area of 262 square miles while the watershed for the BPG-PWS-02 is 294 square miles.
5.3 Point Sources Permitted facilities must provide Discharge Monitoring Reports (DMRs) to Illinois EPA as part of their NPDES permit compliance. DMRs contain effluent discharge sampling results that are then maintained in a database by the state. There are six point sources in the watershed (Figure 1 and Table 9). It is assumed that these facilities do not use atrazine and are not a source. Loads from these sources are not applicable to this TMDL. Not applicable loads can be considered the same as a zero wasteload allocation for these facilities.
Table 9. Point Sources in North Fork Vermilion River Watershed
Permit Number
Facility Name
Outfall Description Receiving Water
Loading (lb/d)
ILG640101 Bismarck Community Water District
Settling Tank Tributary to N. Fork Vermilion River
NA
IL0067156 Bismarck Community Unit School
Sewage Treatment Plant Discharge
Tributary to N. Fork Vermilion River
NA
ILG640002 Alvin Water Treatment Plant
Clarified Sludge Blowdown and Filter Backwash
N. Fork Vermilion River
NA
IL0024406 Rossville Sewage Treatment Plant
Sewage Treatment Plant Discharge
N. Fork Vermilion River
NA
IL0024830 Hoopston Sewage Treatment Plant
Sewage Treatment Plant Discharge
Hoopston Branch/ N. Fork Vermilion River
NA
IL0075167 Hoopston Food Inc. Noncontact Cooling Water and Boiler Blowdown
Hoopston Branch/ N. Fork Vermilion River
NA
NA = Not applicable
5.4 Nonpoint Sources Atrazine is an herbicide that is widely used to kill weeds mostly on farms. It is used on crops such as sugarcane, corn, pineapples sorghum and macadamia nuts. Out of the 60-80 million pounds of atrazine used annually in the United States, 85% are used for corn fields (Sass and Colangelo 2006). It is a Restricted Use Pesticide (RUP) and can only be purchased or used by certified herbicide users. Atrazine is usually used in the spring and summer months (ATSDR 2003). To be effective if applied preemergence, atrazine must enter through the roots and acts in the shoots and leaves of the weed to stop photosynthesis. Atrazine adsorbs into the leaves and roots when applied postemergence. Corn can detoxify atrazine and are not affected. The application of atrazine to crops as an herbicide accounts for almost all of the atrazine that enters the environment, but some may be released from manufacture, formulation, transport and disposal (ATSDR 2003). In most cases atrazine will be broken down in the soil over one growing season but if carried by runoff into waterways, the breakdown is slowed. The more moisture in soil, the longer it takes to degrade. The approximate half-life in aerobic soil is 146 days but in water the half-life is
North Fork Vermilion River Draft TMDL- October 2013
16
742 days. Atrazine weakly adsorbs to soil particles. Refer to section 6.2 for pollutant sources and linkages.
Section 6. TMDL Development
6.1 TMDL Calculations TMDL atrazine loads are based on the atrazine maximum contaminant level (MCL) of 0.003 mg/L. The weighted stream flow from USGS gage 03338780 was used for the load calculations.
6.2 Pollutant Sources and Linkages Atrazine is a widely used product for selective control of broadleaf weeds in crops, specifically corn for this watershed. Atrazine is an inexpensive, effective herbicide for weeds and no alternative herbicide is as economical. Refer to Section 5.4 for more information on atrazine. Transport mechanisms include overland runoff, discharge from drainage tiles and contaminated dust that is delivered to the waterway through wet and dry atmospheric deposition. No known point sources of atrazine occur within the watershed and point source discharges of atrazine are assumed not to occur.
According to the 2011 Illinois Cropland Data layer produced by the USDA National Agricultural Statistics Service (http://www.nass.usda.gov/research/Cropland/metadata/metadata_il11.htm ), 48% of the crops in the North Fork Vermilion River watershed. Water from the river is used for human consumption. This water is impaired for public water supply use with atrazine as a pollutant.
6.3 TMDL Allocations for North Fork Vermilion River Watershed As explained in Section 1, the TMDLs address the following equation:
TMDL = LC = ΣWLA + ΣLA + MOS
where LC = Maximum amount of pollutant loading a water body can receive without violating water quality standards
WLA = The portion of the TMDL allocated to existing or future point sources LA = Portion of the TMDL allocated to existing or future nonpoint sources
and natural background MOS = An accounting of uncertainty about the relationship between pollutant
loads and receiving water quality
Each of these elements will be discussed in this section as well as consideration of seasonal variation in the TMDL calculation.
North Fork Vermilion River Draft TMDL- October 2013
17
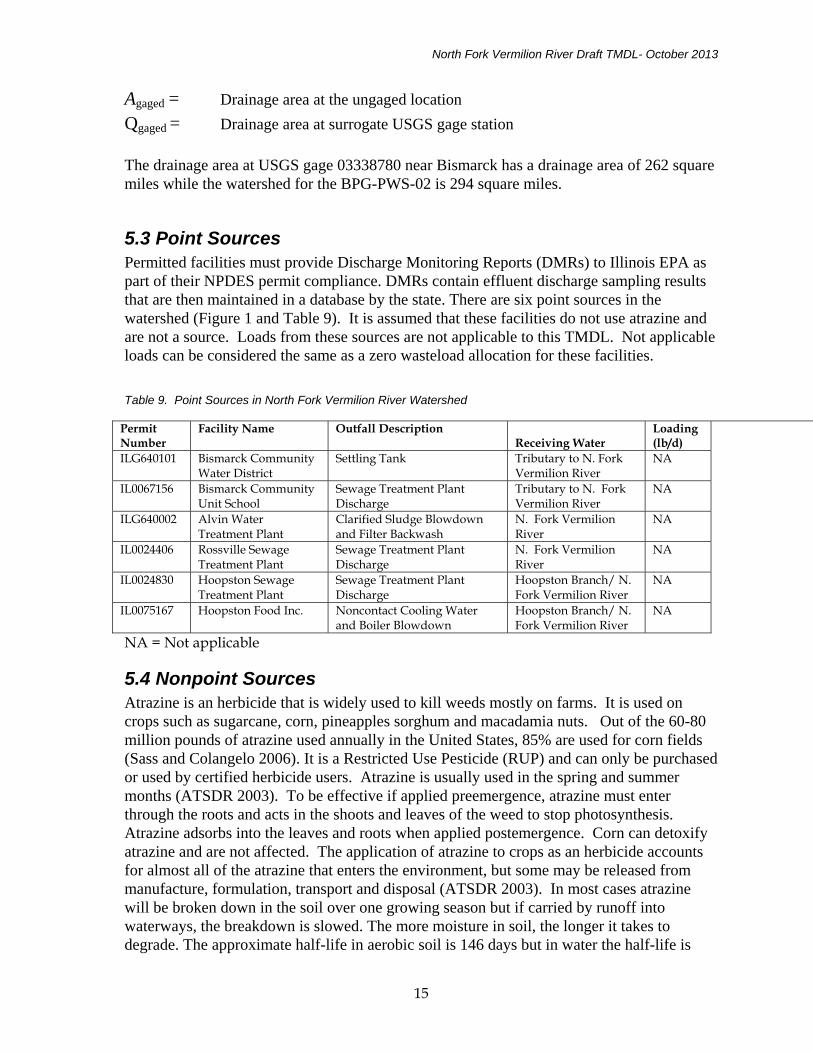
Loading Capacity The loading capacity (LC) of the waterbody is the amount of atrazine that can be allowed in the river and still meet the water quality standard of 0.003 mg/L atrazine. The target load or load capacity that can be generated and still maintain water quality standards were determined for each exceedance (see Table 10). Daily flow information was used from the USGS Bismarck location using the weighted approach. Using conversion factors, the loads were calculated. If there are any levels of atrazine beyond the 0.003 mg/L in the river samples, this will exceed the capacity.
Table 10. Target Loads for North Fork Vermilion River
Date Atrazine (ug/L)
Flow at 03338780 (cf/s)
Weighted Flow (cf/s)
Target Load or LC
(lb/day)
05/20/09 10.4 677 760 12.3
6/9/09 3.94 228 256 4.1
04/25/11 5.38 1000 1122 18.1
05/16/11 10.48 448 503 8.1
05/31/11 4.95 943 1058 17.1
05/20/09 11.2 677 760 12.3
05/27/09 6.25 229 257 4.1
06/01/09 4.59 156 175 2.8
06/09/09 9.3 228 256 4.1
06/15/09 4.84 191 214 3.5
04/25/11 4.69 1000 1122 18.1
05/10/11 13.08 250 281 4.5
05/16/11 10.67 448 503 8.1
05/24/11 6.08 190 213 3.4
05/31/11 8.4 943 1058 17.1
06/06/11 4.64 294 330 5.3
Seasonal Variation A season is represented by changes in weather; for example, a season can be classified as warm or cold as well as wet or dry. Since the pollutant source can be expected to contribute loadings in different quantities during different time periods (e.g., various portions of the growing season resulting in different runoff characteristics), the loadings for this TMDL will focus both on normal and maximum storage. Atrazine runoff from upstream is expected in spring and early summer when flows are higher. This critical period corresponds with normal to maximum stream levels.
Margin of Safety The margin of safety (MOS) can be implicit (incorporated into the TMDL analysis through conservative assumptions) or explicit (expressed in the TMDL as a portion of the loadings) or a combination of both. The MOS for the TMDL is implicit. The load reduction is based on exceedences during the months of May and June when exceedences were highest. This
North Fork Vermilion River Draft TMDL- October 2013
18
timeframe represents the critical condition when runoff and exceedences of atrazine are likely to occur.
Waste Load Allocation There are six point sources in the watershed. It is assumed that these facilities do not discharge atrazine and are not a source (refer to Section 5.3). Therefore, the waste load allocation (WLA) was set to zero for this TMDL.
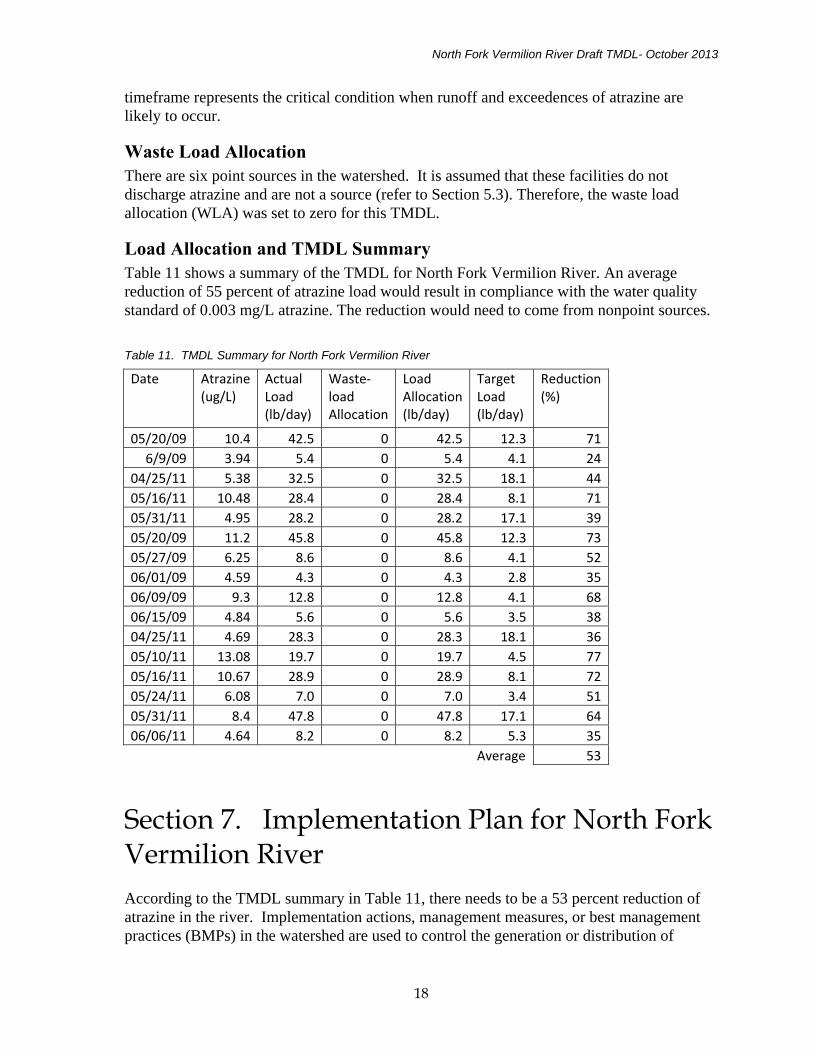
Load Allocation and TMDL Summary Table 11 shows a summary of the TMDL for North Fork Vermilion River. An average reduction of 55 percent of atrazine load would result in compliance with the water quality standard of 0.003 mg/L atrazine. The reduction would need to come from nonpoint sources.
Table 11. TMDL Summary for North Fork Vermilion River
Date Atrazine (ug/L)
Actual Load (lb/day)
Waste‐load Allocation
Load Allocation (lb/day)
Target Load (lb/day)
Reduction (%)
05/20/09 10.4 42.5 0 42.5 12.3 71
6/9/09 3.94 5.4 0 5.4 4.1 24
04/25/11 5.38 32.5 0 32.5 18.1 44
05/16/11 10.48 28.4 0 28.4 8.1 71
05/31/11 4.95 28.2 0 28.2 17.1 39
05/20/09 11.2 45.8 0 45.8 12.3 73
05/27/09 6.25 8.6 0 8.6 4.1 52
06/01/09 4.59 4.3 0 4.3 2.8 35
06/09/09 9.3 12.8 0 12.8 4.1 68
06/15/09 4.84 5.6 0 5.6 3.5 38
04/25/11 4.69 28.3 0 28.3 18.1 36
05/10/11 13.08 19.7 0 19.7 4.5 77
05/16/11 10.67 28.9 0 28.9 8.1 72
05/24/11 6.08 7.0 0 7.0 3.4 51
05/31/11 8.4 47.8 0 47.8 17.1 64
06/06/11 4.64 8.2 0 8.2 5.3 35
Average 53
Section 7. Implementation Plan for North Fork Vermilion River According to the TMDL summary in Table 11, there needs to be a 53 percent reduction of atrazine in the river. Implementation actions, management measures, or best management practices (BMPs) in the watershed are used to control the generation or distribution of

North Fork Vermilion River Draft TMDL- October 2013
19
pollutants. BMPs are either structural, such as filter strips; or managerial, such as conservation tillage, public outreach and education. The remainder of this section will discuss implementation actions and management measures for atrazine sources in the watershed.
7.1 Nonpoint Sources of Atrazine Atrazine is applied to agricultural land, specifically corn in this watershed. Surface runoff, tile drainage and atmospheric deposition deliver atrazine to the lake and river. BMPs evaluated that could be utilized to treat these nonpoint sources are careful pesticide application practices and controlling runoff. Fields closer to surface water can be targeted for BMPs. Another option is filtering water at the treatment plant.
Atrazine Pesticide Application Practices
Delay herbicide application if heavy rain is in the forecast. Pesticides are most susceptible to runoff during the first several hours after application. Atrazine is highly soluble in water and applications should be delayed as long as the soils are saturated and more rain is predicted (Purdue 2004). Atrazine should not be applied within 50 feet of abandoned/current wells, drainage wells or sinkholes. This applies to drinking water wells, irrigation wells, livestock water wells, abandoned wells and agricultural drainage wells. Sinkholes refer to surface depressions that permit direct runoff of surface water into groundwater. Atrazine should not be applied within 66 feet of the points where field surface water runoff enters streams or rivers. This applies to both perennial and intermittent streams. The USGS topographic maps (http://topomaps.usgs.gov/) show perennial streams as solid blue lines and intermittent streams as dashed blue lines. Atrazine should not be applied within 200 feet around a lake or reservoir. Filter strips are recommended around lakes. Atrazine should not be mixed or loaded within 50 feet of any waterbody, nor applied within 66 feet of a tile inlet in terraced fields unless it is incorporated and or greater than 30 percent residue is present. A 66 foot filter strip is recommended around the outlet.
The following information is taken from the label of the Syngenta herbicide AAtrex 4L in which atrazine is the active ingredient- www.syngentacropprotection.com/pdf/labels/SCP497AL38TT1112.pdf Environmental Hazards Atrazine can travel (seep or leach) through soil and can enter ground water which may be used as drinking water. Atrazine has been found in ground water. Users are advised not to apply atrazine to sand and loamy sand soils where the water table (ground water) is close to the surface and where these soils are very permeable, i.e., well-drained. Your local agricultural agencies can provide further information on the type of soil in your area and the location of ground water. This product must not be mixed/loaded, or used within 50 feet of all wells, including abandoned wells, drainage wells, and sink holes. Operations that involve mixing, loading, rinsing, or washing of this product into or from pesticide handling or application equipment or containers within 50 feet of any well are prohibited, unless conducted on an impervious pad constructed to withstand the weight of the heaviest load that may be positioned on or moved across the pad. Such a pad shall be designed and maintained to contain any product spills or equipment leaks, container or equipment rinse or

North Fork Vermilion River Draft TMDL- October 2013
20
wash water, and rain water that may fall on the pad. Surface water shall not be allowed to either flow over or from the pad, which means the pad must be self-contained. The pad shall be sloped to facilitate material removal. An unroofed pad shall be of sufficient capacity to contain at a minimum 110% of the capacity of the largest pesticide container or application equipment on the pad. A pad that is covered by a roof of sufficient size to completely exclude precipitation from contact with the pad shall have a minimum containment capacity of 100% of the capacity of the largest pesticide container or application equipment on the pad. Containment capacities as described above shall be maintained at all times. The above specified minimum containment capacities do not apply to vehicles when delivering pesticide shipments to the mixing/loading sites. Additional State imposed requirements regarding well-head setbacks and operational area containment must be observed. This product must not be mixed or loaded within 50 feet of intermittent streams and rivers, natural or impounded lakes and reservoirs. This product may not be applied aerially or by ground within 66 feet of the points where field surface water runoff enters perennial or intermittent streams and rivers or within 200 feet around natural or impounded lakes and reservoirs. If this product is applied to highly erodible land, the 66 foot buffer or setback from runoff entry points must be planted to crop, seeded with grass or other suitable crop. Tile-Outletted Terraced Fields Containing Standpipes One of the following restrictions must be used in applying atrazine to tile-terraced fields containing standpipes: 1. Do not apply this product within 66 feet of standpipes in tile-outletted terraced fields. 2. Apply this product to the entire tile-outletted terraced field and immediately incorporate it to a
depth of 2-3 inches in the entire field. 3. Apply this product to the entire tile-outletted terraced field under a no-till practice only when a
high crop residue management practice is practiced. High crop residue management is described as a crop management practice where little or no crop residue is removed from the field during and after crop harvest.
This pesticide is toxic to aquatic invertebrates. Do not apply directly to water, to areas where surface water is present, or to intertidal areas below the mean high water mark. Do not apply when weather conditions favor drift from treated areas. Runoff and drift from treated areas may be hazardous to aquatic organisms in neighboring areas. Do not contaminate water when disposing of equipment wash water.
Controlling Runoff
Leaving crop residue on the fields and No-till agriculture can reduce pesticide runoff over conventional tillage. The residue slows the movement of water across the field and can increase infiltration. According to county wide statistics, almost half of the corn crops are farmed conventionally. Changing from conventional to no- till will have a reduction in erosion and phosphorus for the watershed. So this practice could not only reduce phosphorus
North Fork Vermilion River Draft TMDL- October 2013
21
and total suspended solids, but atrazine also. This practice has the lowest costs of any practice in the watershed. Other practices to control runoff are terraces, contour farming and grade stabilization. Also allowing soils to dry before tilling or other operations can help reduce compaction and allow better infiltration.
Conservation practices such as buffers and riparian corridors can be used to control runoff. The ground has the filtering capacity to drain water and absorb atrazine. Buffers implemented along stream segments and around waterbodies slow and filter nutrients, pesticides and sediment out of runoff. Greater biological activity in a soil improves its ability to effectively deal with pesticides and pollutants, and that is more prevalent in a soil rich in plant roots and organisms (Grismer 2006). A recent study in Iowa indicated a 28 to 35 percent removal for the pesticide atrazine for a 15-foot long filter, compared to a 51 to 60 percent removal for a 30-foot filter (Leed et all 1994).
Riparian buffers, including both the stream channel and adjacent land areas, are important components of watershed ecology. Preserving natural vegetation along stream corridors and around waterbodies can effectively reduce water quality degradation associated with development. The root structure of the vegetation in a buffer enhances infiltration of runoff and subsequent trapping of nonpoint source pollutants. However, the buffers are only effective in this manner when the runoff enters the buffer as a slow moving, shallow "sheet;" concentrated flow in a ditch or gully will quickly pass through the buffer offering minimal opportunity for retention and uptake of pollutants.
Table 12. Filter Strip Flow Lengths Based on Land Slope
Percent Slope 0.5% 1.0% 2.0% 3.0% 4.0% 5.0% or greater
Minimum (feet) 36 54 72 90 108 117 Maximum (feet) 72 108 144 180 216 234
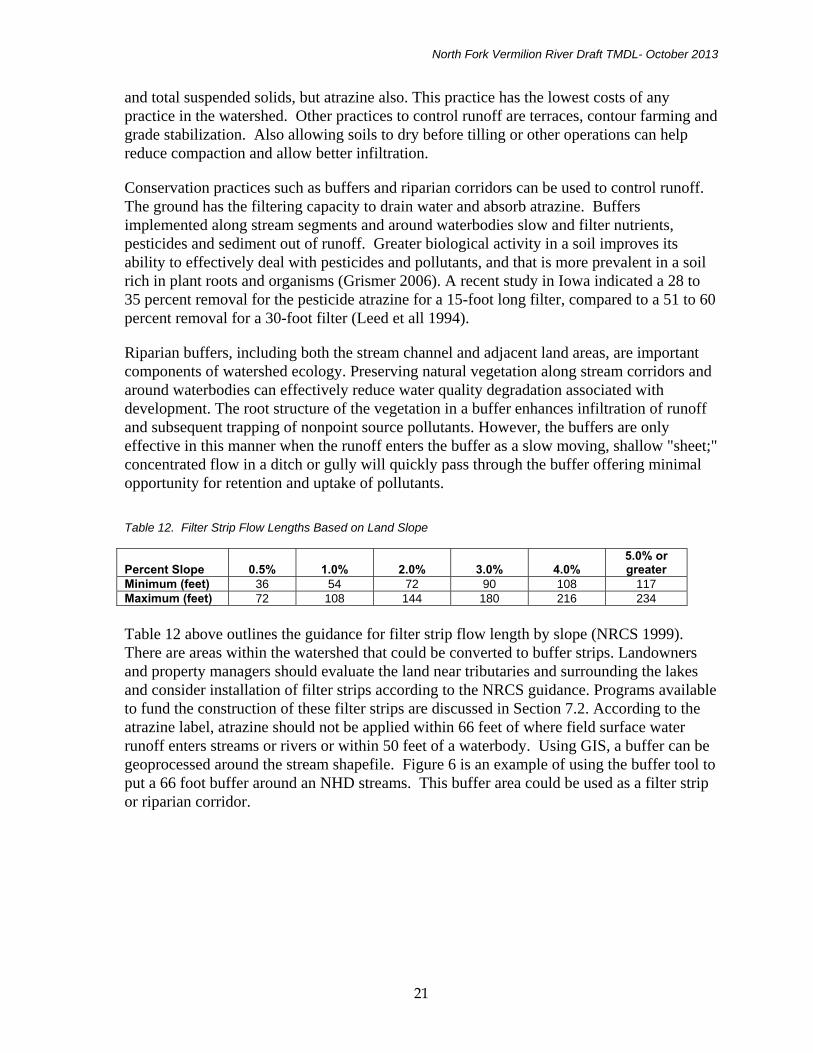
Table 12 above outlines the guidance for filter strip flow length by slope (NRCS 1999). There are areas within the watershed that could be converted to buffer strips. Landowners and property managers should evaluate the land near tributaries and surrounding the lakes and consider installation of filter strips according to the NRCS guidance. Programs available to fund the construction of these filter strips are discussed in Section 7.2. According to the atrazine label, atrazine should not be applied within 66 feet of where field surface water runoff enters streams or rivers or within 50 feet of a waterbody. Using GIS, a buffer can be geoprocessed around the stream shapefile. Figure 6 is an example of using the buffer tool to put a 66 foot buffer around an NHD streams. This buffer area could be used as a filter strip or riparian corridor.
North Fork Vermilion River Draft TMDL- October 2013
22
Figure 6. Buffer Strip Around NHD Stream Coverage Using ArcGIS Geoprocessing Tool
Buffers also provide streambank protection along with their filtering capacity. This is relevant to the lake since they are impaired for phosphorus and total suspended solids, for which a TMDL was developed (IEPA 2008). The rooting systems of the vegetation serve as reinforcements in streambank soils, which help to hold streambank material in place and minimize erosion. Due to the increase in stormwater runoff volume and peak rates of runoff associated with agriculture and development, stream channels are subject to greater erosional forces during stormflow events. Thus, preserving natural vegetation along stream channels minimizes the potential for water quality and habitat degradation due to streambank erosion and enhances the pollutant removal of sheet flow runoff from developed areas that passes through the buffer. The increased organic matter in these corridors should increase degradation of atrazine.
Converting land adjacent to waterbodies for the creation of riparian buffers will provide stream bank stabilization, stream shading, and nutrient uptake and trapping from adjacent areas. Minimum buffer widths of 25 feet are required for water quality benefits. Higher removal rates are provided with greater buffer widths. Riparian corridors typically treat a maximum of 300 feet of adjacent land before runoff forms small channels that short circuit treatment. In addition to the treated area, any land converted from agricultural land has the potential to reduce the amount of atrazine needed.

North Fork Vermilion River Draft TMDL- October 2013
23
The following information is taken from a the website- The Value of Buffers for Pesticide Stewardship and Much More (http://pesticidestewardship.org/Documents/Value%20of%20Buffers.pdf).
Permanent within-field buffers include grassed waterways, contour buffer strips and wind buffers. Grassed waterways are strategically placed where they intercept the water and slow it down, thus preventing gully and rill erosion. Contour buffer strips are planted to perennial vegetation alternated with cultivated strips and placed along the contour. These reduce the risk of concentrated flow, gully erosion and pesticide runoff. Wind buffers are a single or multiple rows of trees to protect crops from winds. They can also reduce pesticide drift and reduce runoff if they are planted dense enough. Wind buffers can also consists of tall grasses planted in thin rows perpendicular to prevailing winds.
Permanent edge-of-field buffers include field borders, filter strips and riparian forest buffers. Field borders are permanent perennial vegetation established on the edge of a crop field. It reduces the movement of pesticides and nutrients, traps eroding soils and reduces pesticide drift. Filter strips are areas of grass or other permanent vegetation located between crop field and a body of water and intended to reduce runoff. Riparian forest buffers are areas planted in trees and shrubs and located adjacent to waters.
Constructed wetlands provide additional benefits when implemented in combination with buffers. In fields that are tile drained, runoff bypasses buffers and may deliver subsurface drainage directly to streams. Wetlands can effectively degrade pesticides and denitrify nitrates when strategically located at tile outlets.
North Fork Vermilion River Draft TMDL- October 2013
24
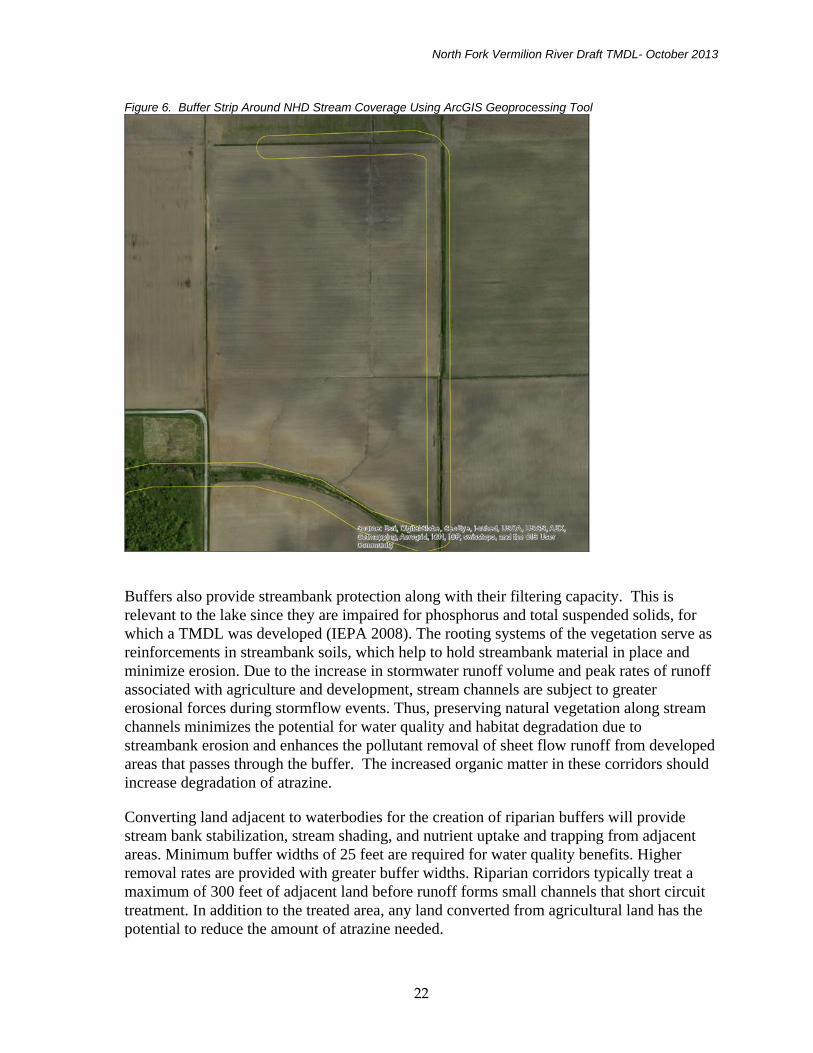
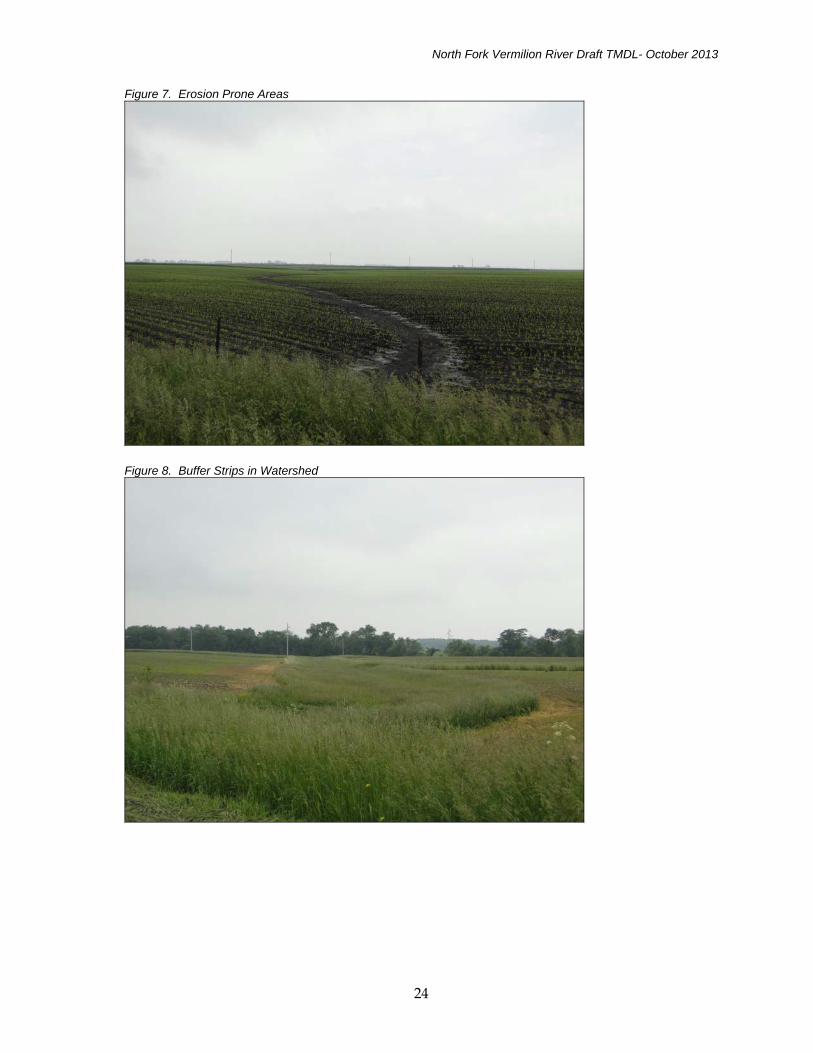
Figure 7. Erosion Prone Areas
Figure 8. Buffer Strips in Watershed
North Fork Vermilion River Draft TMDL- October 2013
25
Treatment Plant Upgrade
Removal of atrazine at the water treatment plant requires expensive chemical absorption procedures. Filters with activated carbon are used to absorb the atrazine. At most water plants, sand filters are used because they are cheaper and last longer, but they do not remove organics such as PCBs, pharmaceuticals and pesticides.
The Aquilla Water Supply District began additional treatment to remove atrazine by installing a powder-activated carbon hopper at the water treatment plant in 1999. This system came at a cost of $434,169. Information on the Aquilla Water Supply District is taken from the Implementation Plan for the TMDL for Atrazine in Aquilla Reservoir (TNRCC 2002). At the Ohio Bowling Green water plant, they have a granular activated carbon (GAC) pressure system. They have twelve GAC vessels and change out six vessels each year at a cost of $117,000. Total costs for installation was 4.5 million in the year 2000.
Atrazine Reduction Success Stories
Following high atrazine levels in 1994, the local watershed committee for Lake Springfield encouraged practices such as buffer zones of plants and vegetation along stream banks, taking farmland out of production, rotating corn and soybeans and improved chemical-application practices. The treatment plant spent more than $600,000 on powdered activated carbon from 1994 to 2003 to reduce atrazine. The yearly amount for treatment has decreased since atrazine levels in the watershed have decreased. The Lake Springfield Watershed Resources Planning Committee is made up of water treatment plant staff, farmers, conservation and environmental advocates, business people and lake residents.
Atrazine Lawsuit Settlement
The City of Greenville filed a class action suit against Syngenta in order for Syngenta to bear the costs of removing atrazine from the community water supply. The lawsuit was settled. Syngenta agreed to pay class members a total amount of $105 million. Illinois received $15 million to be shared by 143 water suppliers. Company officials said it agreed to the settlement terms in order to avoid business uncertainty and litigation expenses. Payment to each water supply is determined using a court approved formula based on the amount of water treated and the amount of atrazine in the water. Syngenta acknowledges no liability and continues to stand by the safety of atrazine. Water suppliers that received this settlement may choose to use funding towards atrazine reductions either in their watershed or at the treatment plant.
North Fork Vermilion River Draft TMDL- October 2013
26
7.2 Reasonable Assurance Reasonable assurance means that a demonstration is given that nonpoint source reductions in this watershed will be implemented. It should be noted that all programs discussed in this section are voluntary and some may currently be in practice to some degree within the watershed. The discussion in Section 7.1 provided information on recommended BMPs for nonpoint sources.
Available Cost-Share Programs There are several voluntary conservation programs established through the 2008 U.S. Farm, which encourage landowners to implement resource-conserving practices for water quality and erosion control purposes. These programs would apply to agricultural land and rural grasslands in the watershed. In addition, Illinois EPA has grant programs that can assist in implementation of nonpoint source controls. Each program is discussed separately in the following paragraphs.
Conservation Reserve Program (CRP) HUhttp://www.fsa.usda.gov/FSA/webapp?area=home&subject=copr&topic=crpU The CRP is a voluntary program for agricultural landowners. Through CRP, landowners can receive annual rental payments and cost-share assistance to establish long-term, resource conserving covers on eligible farmland.
The Commodity Credit Corporation (CCC) makes annual rental payments based on the agriculture rental value of the land, and it provides cost-share assistance for up to 50 percent of the participant's costs in establishing approved conservation practices. Participants enroll in CRP contracts for 10 to 15 years.
CRP protects millions of acres of American topsoil from erosion and is designed to safeguard natural resources. By reducing water runoff and sedimentation, CRP protects groundwater and helps improve the condition of lakes, rivers, ponds, and streams. Acreage enrolled in the CRP is planted to resource-conserving vegetative covers, making the program a major contributor to increased wildlife populations in many parts of the country.
The Farm Service Agency (FSA) administers CRP, while technical support functions are provided by NRCS, USDA's Cooperative State Research, Education, and Extension Service, State forestry agencies, local soil and water conservation districts, and private sector providers of technical assistance. Producers can offer land for CRP general sign-up enrollment only during designated sign-up periods. Environmentally desirable land devoted to certain conservation practices may be enrolled at any time under CRP continuous sign-up. Certain eligibility requirements still apply, but offers are not subject to competitive bidding. Further information on CRP continuous sign-up is available in the FSA fact sheet "Conservation Reserve Program Continuous Sign-up."
To be eligible for placement in CRP, land must be either:
North Fork Vermilion River Draft TMDL- October 2013
27
Cropland (including field margins) that is planted or considered planted to an agricultural commodity 4 of the previous 6 crop years, and which is physically and legally capable of being planted in a normal manner to an agricultural commodity; or
Certain marginal pastureland that is suitable for use as a riparian buffer or for similar water quality purposes.
In addition to the eligible land requirements, cropland must meet one of the following criteria:
Have a weighted average erosion index of 8 or higher; Be expiring CRP acreage; or Be located in a national or state CRP conservation priority area.
FSA provides CRP participants with annual rental payments, including certain incentive payments, and cost-share assistance:
Rental Payments – In return for establishing long-term, resource-conserving covers, FSA provides annual rental payments to participants. FSA bases rental rates on the relative productivity of the soils within each county and the average dry land cash rent or cash-rent equivalent. The maximum CRP rental rate for each offer is calculated in advance of enrollment. Producers may offer land at that rate or offer a lower rental rate to increase the likelihood that their offer will be accepted.
Maintenance Incentive Payments – CRP annual rental payments may include an additional amount up to $4 per acre per year as an incentive to perform certain maintenance obligations.
Cost-share Assistance – FSA provides cost-share assistance to participants who establish approved cover on eligible cropland. The cost-share assistance can be an amount not more than 50 percent of the participants' costs in establishing approved practices.
Other Incentives – FSA may offer additional financial incentives of up to 20 percent of the annual payment for certain continuous sign-up practices.
Conservation practices eligible for CRP funding which are recommended BMPs for this watershed TMDL include but are not limited to filter strips, grass waterways, riparian buffers, wetland restoration, and tree plantings.
Clean Water Act Section 319 Grants Section 319 was added to the CWA to establish a national program to address nonpoint sources of water pollution. Through this program, each state is allocated Section 319 funds on an annual basis according to a national allocation formula based on the total annual appropriation for the section 319 grant program. The total award consists of two categories of funding: incremental funds and base funds. A state is eligible to receive EPA 319(b) grants upon USEPA's approval of the state's Nonpoint Source Assessment Report and Nonpoint Source Management Program. States may reallocate funds through subawards

North Fork Vermilion River Draft TMDL- October 2013
28
(e.g., contracts, subgrants) to both public and private entities, including local governments, tribal authorities, cities, counties, regional development centers, local school systems, colleges and universities, local nonprofit organizations, state agencies, federal agencies, watershed groups, for-profit groups, and individuals.
USEPA designates incremental funds for the restoration of impaired water through the development and implementation of watershed-based plans and TMDLs for impaired waters. Base funds, funds other than incremental funds, are used to provide staffing and support to manage and implement the state Nonpoint Source Management Program. Section 319 funding can be used to implement activities which improve water quality, such as filter strips, streambank stabilization, etc.
Illinois EPA receives federal funds through Section 319(h) of the CWA to help implement Illinois' Nonpoint Source (NPS) Pollution Management Program. The purpose of the program is to work cooperatively with local units of government and other organizations toward the mutual goal of protecting the quality of water in Illinois by controlling NPS pollution. The program emphasizes funding for implementing cost-effective corrective and preventative BMPs on a watershed scale; funding is also available for BMPs on a non-watershed scale and the development of information/education NPS pollution control programs.
The Maximum Federal funding available is 60 percent, with the remaining 40 percent coming from local match. The program period is two years unless otherwise approved. This is a reimbursement program.
Section 319(h) funds are awarded for the purpose of implementing approved NPS management projects. The funding will be directed toward activities that result in the implementation of appropriate BMPs for the control of NPS pollution or to enhance the public's awareness of NPS pollution. Applications are accepted June 1 through August 1. Proposed 319 projects in TMDL watersheds receive high prioritization as long as they contain the required elements.
Environmental Quality Incentive Program (EQIP) HUhttp://www.il.nrcs.usda.gov/programs/eqip/index.htmlU EQIP is a voluntary conservation program that provides financial and technical assistance to farmers and ranchers who face threats to soil, water, air, and related natural resources on their land. Through EQIP, the NRCS develops contracts with agricultural producers to implement conservation practices to address environmental natural resource problems. Payments are made to producers once conservation practices are completed according to NRCS requirements.
Persons engaged in livestock or agricultural production and owners of non-industrial private forestland are eligible for the program. Eligible land includes cropland, rangeland, pastureland, private non-industrial forestland, and other farm or ranch lands. Persons interested in entering into a cost-share agreement with the USDA for EQIP assistance may file an application at any time.
North Fork Vermilion River Draft TMDL- October 2013
29
NRCS works with the participant to develop the EQIP plan of operations. This plan becomes the basis of the EQIP contract between NRCS and the participant. NRCS provides conservation practice payments to landowners under these contracts that can be up to 10 years in duration.
The EQIP objective to optimize environmental benefits is achieved through a process that begins with National priorities that address: impaired water quality, conservation of ground and surface water resources improvement of air quality reduction of soil erosion and sedimentation, and improvement or creation of wildlife habitat for at-risk species. National priorities include: reductions of nonpoint source pollution, such as nutrients, sediment, pesticides, or excess salinity in impaired watersheds consistent with TMDLs where available as well as the reduction of groundwater contamination and reduction of point sources such as contamination from confined animal feeding operations; conservation of ground and surface water resources; reduction of emissions, such as particulate matter, nitrogen oxides (NOx), volatile organic compounds, and ozone precursors and depleters that contribute to air quality impairment violations of National Ambient Air Quality Standards reduction in soil erosion and sedimentation from unacceptable levels on agricultural land; and promotion of at-risk species habitat conservation.
EQIP provides payments up to 75 percent of the incurred costs and income foregone of certain conservation practices and activities. The overall payment limitation is $300,000 per person or legal entity over a 6-year period. The Secretary of Agriculture may raise the limitation to $450,000 for projects of special environmental significance. Payment limitations for organic production may not exceed an aggregate $20,000 per year or $80,000 during any 6-year period for installing conservation practices.
Conservation practices eligible for EQIP funding which are recommended BMPs for this watershed TMDL include field borders, filter strips, cover crops, grade stabilization structures, grass waterways, riparian buffers, streambank shoreline protection, terraces, and wetland restoration.
The selection of eligible conservation practices and the development of a ranking process to evaluate applications are the final steps in the optimization process. Applications will be ranked based on a number of factors, including the environmental benefits and cost effectiveness of the proposal. More information regarding State and local EQIP implementation can be found at Uwww.nrcs.usda.gov/programs/eqip U.
Wildlife Habitat Incentives Program (WHIP) HUhttp://www.il.nrcs.usda.gov/programs/whip/index.htmlU WHIP is a voluntary program for people who want to develop and improve wildlife habitat primarily on private lands and nonindustrial private forest land. It provides both technical assistance and cost share payments to help:
Promote the restoration of declining or important native fish and wildlife species.
Protect, restore, develop, or enhance fish and wildlife habitat to benefit at-risk species.

North Fork Vermilion River Draft TMDL- October 2013
30
Reduce the impacts of invasive species in fish and wildlife habitat.
Protect, restore, develop, or enhance declining or impaired aquatic wildlife species habitat.
Participants who own or control land agree to prepare and implement a wildlife habitat development plan. The NRCS provides technical and financial assistance for the establishment of wildlife habitat development practices. In addition, if the landowner agrees, cooperating State wildlife agencies and nonprofit or private organizations may provide expertise or additional funding to help complete a project.
Participants work with the NRCS to prepare a wildlife habitat development plan in consultation with the local conservation district. The plan describes the participant's goals for improving wildlife habitat, includes a list of practices and a schedule for installing them, and details the steps necessary to maintain the habitat for the life of the agreement. This plan may or may not be part of a larger conservation plan that addresses other resource needs such as water quality and soil erosion.
The NRCS and the participant enter into a cost-share agreement for wildlife habitat development. This agreement generally lasts from 5 to 10 years from the date the agreement is signed for general applications and up to 15 years for essential habitat applications. Cost-share payments may be used to establish new practices or replace practices that fail for reasons beyond the participant's control.
WHIP has a continuous sign-up process. Applicants can sign up anytime of the year at their local NRCS field office. Conservation practices eligible for WHIP funding which are recommended BMPs for this watershed TMDL include but are not limited to filter strips, field borders, riparian buffers, streambank and shoreline protection, and wetland restoration.
Local Program Information Local contact information is listed in the Table 13 below. The USDA Danville Service Center is located at 1905A Route 150 in Danville, IL. The Watseka Service Center is located at 1001 East Grant Street in Watseka, IL.
Table 13. Vermilion and Iroquois Counties USDA Service Center Contact Information County/ Service Center Contact Email Address PhoneVermilion/ Danville Service Center
Local SWCD OfficeStephen Miller [email protected] 217/442-8511 x 3 Local FSA OfficeAnthony Augustine Michael Albin
[email protected] [email protected]
217/442-8511 x 2 217/345-3901
Local NRCS OfficeErin Busscher [email protected] 217/442-8511 x 3
Iroquois/ Watseka Service Center
Local SWCD OfficeThad Eshleman [email protected] 815/432-3946 x 3 Local FSA OfficeTamara Hubert Benjamin Josefik
[email protected] [email protected]
815/432-3946 815/844-6127
Local NRCS OfficeKelly German [email protected] 815/432-3946 x 3

North Fork Vermilion River Draft TMDL- October 2013
31
7.3 Monitoring Plan The purpose of the monitoring plan for North Fork Vermilion River watershed is to assess the overall implementation of management actions outlined in this section. This can be accomplished by conducting the following monitoring programs:
Track implementation of management measures in the watershed Estimate effectiveness of management measures Continued monitoring of North Fork Vermilion River Storm-based monitoring of high flow events Tributary monitoring
Tracking the implementation of management measures can be used to address the following goals:
Determine the extent to which management measures and practices have been implemented compared to action needed to meet TMDL endpoints
Establish a baseline from which decisions can be made regarding the need for additional incentives for implementation efforts
Measure the extent of voluntary implementation efforts Support work-load and costing analysis for assistance or regulatory programs Determine the extent to which management measures are properly maintained and
operated
Estimating the effectiveness of the BMPs implemented in the watershed could be completed by monitoring before and after the BMP is incorporated into the watershed. Additional monitoring could be conducted on specific structural systems such as a constructed wetland. Inflow and outflow measurements could be conducted to determine site-specific removal efficiency.
Illinois EPA monitors lakes every three years and conducts Intensive Basin Surveys every five years. Continuation of this state monitoring program will assess water quality as improvements in the watersheds are completed. Any available future sampling data can be used to assess whether water quality standards in North Fork Vermilion River are being attained.

North Fork Vermilion River Draft TMDL- October 2013
32
Section 8. Acronyms and Abbreviations BMP Best Management Practices CCC Commodity Credit Corporation CRP Conservation Reserve Program CWA Clean Water Act CWS Community Water Supply DMR Discharge Monitoring Report EPA Environmental Protection Agency EQIP Environmental Quality Incentive Program FSA Farm Service Agency GIS Geographic Information Systems IDNR Illinois Department of Natural Services IEPA Illinois Environmental Protection Agency IPCB Illinois Pollution Control Board ISGS Illinois State Geological Survey LA Loading Allocation LC Loading Capacity MCL Maximum Contaminant Level MG Million Gallons MGD Million Gallons per Day MOS Margin of Safety MRDL Maximum Residual Disinfectant Level NHD National Hydrography Dataset NPDES National Pollution Discharge Elimination System NPS Nonpoint Source NRCS Natural Resources Conservation Service PCB Polychlorinated Biphenyls SWCD Soil and Water Conservation District TMDL Total Maximum Daily Load USDA United States Department of Agriculture USEPA United States Environmental Protection Agency USFWS United States Fish and Wildlife Service WASCOB Water and Sediment Control Basins WHIP Wildlife Habitat Incentives Program WLA Wasteload Allocation
North Fork Vermilion River Draft TMDL- October 2013
33
Section 9. References Agency for Toxic Substances and Disease Registry (ATSDR). 2003. Toxicological profile for Atrazine. U.S. Department of Health and Human Services, Public Health Service. Atlanta, GA. Available online at http://www.atsdr.cdc.gov/ToxProfiles/TP.asp?id=338&tid=59. Grismer, Mark E. 2006. Vegetative Filter Strips for Nonpoint Source Pollution Control in Agriculture. Publication 8195, Regents of the University of California, Division of Agriculture and Natural Resources. Oakland, CA. Available online at http://anrcatalog.ucdavis.edu/pdf/8195.pdf Illinois Department of Agriculture (IDOA), 2004. 2004 Illinois Soil Conservation Transect Survey Summary. Available online at http://www.agr.state.il.us/pdf/soiltransectsurvey.pdf Illinois Environmental Protection Agency (IEPA), 2014. DRAFT Illinois Integrated Water Quality Report and Section 303(d) list, 2014. Water Resource Assessment Information and Listing of Impaired Waters. Available online at http://www.epa.state.il.us/water/tmdl/303d-list.html#2014. Illinois Environmental Protection Agency (IEPA), 2012. Illinois Integrated Water Quality Report and Section 303(d) list, 2012. Water Resource Assessment Information and Listing of Impaired Waters. Springfield, IL. Available online at http://www.epa.state.il.us/water/tmdl/303-appendix/2012/iwq-report-surface-water.pdf. Illinois Environmental Protection Agency (IEPA), 2008. North Fork Vermilion/ Lake Vermilion Watershed Total Maximum Daily Load (TMDL). Planning Unit, Watershed Management Section. August 2008. Available online at http://www.epa.state.il.us/water/tmdl/report/north-fork-vermilion/north-fork-vermilion.pdf. Illinois Environmental Protection Agency (IEPA), 2002. Source Water Assessment Program Fact Sheet: Consumers Illinois Water Company (Aqua Illinois). Division of Public Water Supplies. Published 5/02/02. Available online at http://dataservices.epa.illinois.gov/swap/factsheet.aspx. Natural Resources Conservation Service (NRCS), 1999. CORE4 Conservation Practices Training Guide. The Common Sense Approach to Natural Resource Conservation. U.S. Department of Agriculture. Available online at http://www.nrcs.usda.gov/technical/ECS/agronomy/core4.pdf Natural Resources Conservation Service (NRCS). 1999. Illinois Urban Manual: PRACTICE STANDARD -FILTER STRIP (acre) CODE 835. Available online at http://www.il.nrcs.usda.gov/technical/engineer/urban/standards/urbst835.html Purdue University. 2004. Atrazine Use and Weed Management Strategies to Protect Surface Water Quality. Purdue University Cooperative Extension Service, PPP-67. Available online at http://www.ppp.purdue.edu/Pubs/PPP-67.pdf.
Texas Natural Resource Conservation Commission (TNRCC). 2002. Implementation Plan for the TMDL for Atrazine in Aquilla Reservoir. TSSWCB TMDL Team and TNRCC Strategic Assessment Division, TMDL Team Field Operations Division, Region 4. Available online at http://www.tceq.state.tx.us/assets/public/implementation/water/tmdl/10aquilla/10-aquilla_imp.pdf.

North Fork Vermilion River Draft TMDL- October 2013
34
Vermilion County Soil and Water Conservation District (SWCD). 2008. Watershed Implementation Plan for Lake Vermilion and the North Fork Vermilion River. Association of Illinois Soil and Water Conservation Districts. Available online at http://www.epa.state.il.us/water/tmdl/implementation/vermilion-river/final-north-fork-and-lake-vermilion-plan.pdf.
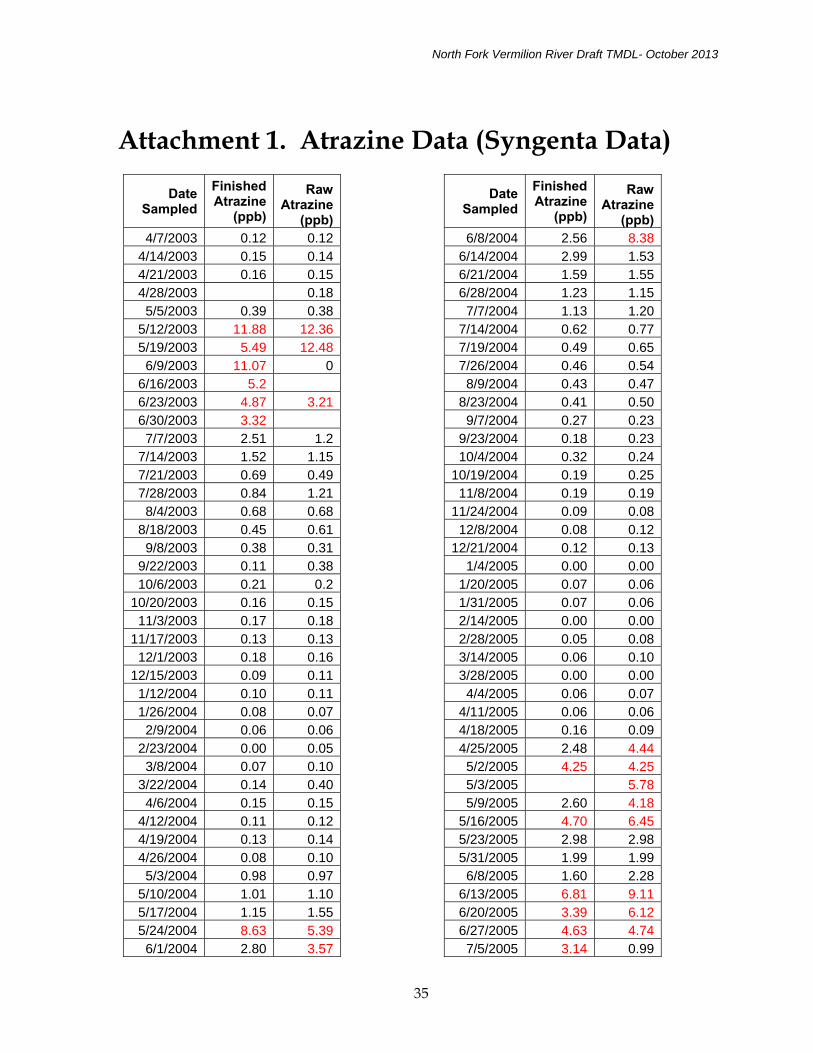
North Fork Vermilion River Draft TMDL- October 2013
35
Date Sampled
Finished Atrazine
(ppb)
Raw Atrazine
(ppb)4/7/2003 0.12 0.12
4/14/2003 0.15 0.144/21/2003 0.16 0.154/28/2003 0.185/5/2003 0.39 0.38
5/12/2003 11.88 12.365/19/2003 5.49 12.486/9/2003 11.07 0
6/16/2003 5.2 6/23/2003 4.87 3.216/30/2003 3.32 7/7/2003 2.51 1.2
7/14/2003 1.52 1.157/21/2003 0.69 0.497/28/2003 0.84 1.218/4/2003 0.68 0.68
8/18/2003 0.45 0.619/8/2003 0.38 0.31
9/22/2003 0.11 0.3810/6/2003 0.21 0.2
10/20/2003 0.16 0.1511/3/2003 0.17 0.18
11/17/2003 0.13 0.1312/1/2003 0.18 0.16
12/15/2003 0.09 0.111/12/2004 0.10 0.111/26/2004 0.08 0.072/9/2004 0.06 0.06
2/23/2004 0.00 0.053/8/2004 0.07 0.10
3/22/2004 0.14 0.404/6/2004 0.15 0.15
4/12/2004 0.11 0.124/19/2004 0.13 0.144/26/2004 0.08 0.105/3/2004 0.98 0.97
5/10/2004 1.01 1.105/17/2004 1.15 1.555/24/2004 8.63 5.396/1/2004 2.80 3.57
Date Sampled
Finished Atrazine
(ppb)
Raw Atrazine
(ppb)6/8/2004 2.56 8.38
6/14/2004 2.99 1.536/21/2004 1.59 1.556/28/2004 1.23 1.157/7/2004 1.13 1.20
7/14/2004 0.62 0.777/19/2004 0.49 0.657/26/2004 0.46 0.548/9/2004 0.43 0.47
8/23/2004 0.41 0.509/7/2004 0.27 0.23
9/23/2004 0.18 0.2310/4/2004 0.32 0.24
10/19/2004 0.19 0.2511/8/2004 0.19 0.19
11/24/2004 0.09 0.0812/8/2004 0.08 0.12
12/21/2004 0.12 0.131/4/2005 0.00 0.00
1/20/2005 0.07 0.061/31/2005 0.07 0.062/14/2005 0.00 0.002/28/2005 0.05 0.083/14/2005 0.06 0.103/28/2005 0.00 0.004/4/2005 0.06 0.07
4/11/2005 0.06 0.064/18/2005 0.16 0.094/25/2005 2.48 4.445/2/2005 4.25 4.255/3/2005 5.785/9/2005 2.60 4.18
5/16/2005 4.70 6.455/23/2005 2.98 2.985/31/2005 1.99 1.996/8/2005 1.60 2.28
6/13/2005 6.81 9.116/20/2005 3.39 6.126/27/2005 4.63 4.747/5/2005 3.14 0.99
Attachment 1. Atrazine Data (Syngenta Data)
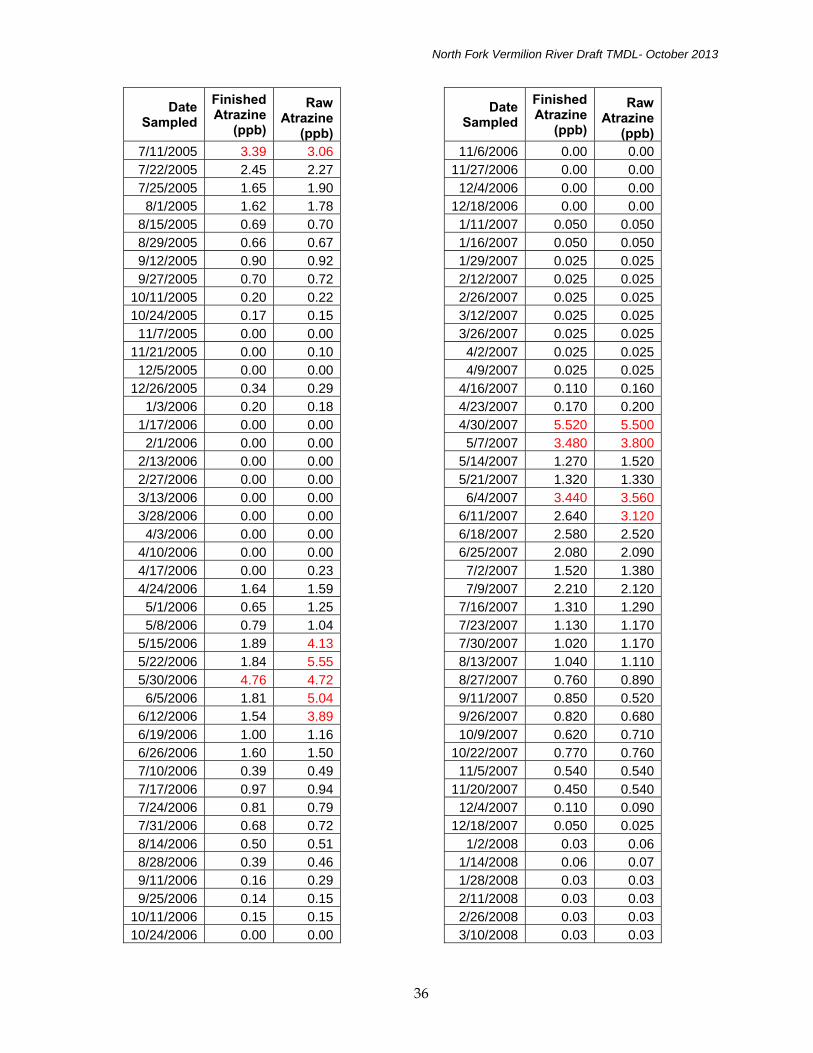
North Fork Vermilion River Draft TMDL- October 2013
36
Date Sampled
Finished Atrazine
(ppb)
Raw Atrazine
(ppb)7/11/2005 3.39 3.067/22/2005 2.45 2.277/25/2005 1.65 1.908/1/2005 1.62 1.78
8/15/2005 0.69 0.708/29/2005 0.66 0.679/12/2005 0.90 0.929/27/2005 0.70 0.72
10/11/2005 0.20 0.2210/24/2005 0.17 0.15
11/7/2005 0.00 0.0011/21/2005 0.00 0.10
12/5/2005 0.00 0.0012/26/2005 0.34 0.29
1/3/2006 0.20 0.181/17/2006 0.00 0.002/1/2006 0.00 0.00
2/13/2006 0.00 0.002/27/2006 0.00 0.003/13/2006 0.00 0.003/28/2006 0.00 0.004/3/2006 0.00 0.00
4/10/2006 0.00 0.004/17/2006 0.00 0.234/24/2006 1.64 1.595/1/2006 0.65 1.255/8/2006 0.79 1.04
5/15/2006 1.89 4.135/22/2006 1.84 5.555/30/2006 4.76 4.726/5/2006 1.81 5.04
6/12/2006 1.54 3.896/19/2006 1.00 1.166/26/2006 1.60 1.507/10/2006 0.39 0.497/17/2006 0.97 0.947/24/2006 0.81 0.797/31/2006 0.68 0.728/14/2006 0.50 0.518/28/2006 0.39 0.469/11/2006 0.16 0.299/25/2006 0.14 0.15
10/11/2006 0.15 0.1510/24/2006 0.00 0.00
Date Sampled
Finished Atrazine
(ppb)
Raw Atrazine
(ppb)11/6/2006 0.00 0.00
11/27/2006 0.00 0.0012/4/2006 0.00 0.00
12/18/2006 0.00 0.001/11/2007 0.050 0.0501/16/2007 0.050 0.0501/29/2007 0.025 0.0252/12/2007 0.025 0.0252/26/2007 0.025 0.0253/12/2007 0.025 0.0253/26/2007 0.025 0.0254/2/2007 0.025 0.0254/9/2007 0.025 0.025
4/16/2007 0.110 0.1604/23/2007 0.170 0.2004/30/2007 5.520 5.5005/7/2007 3.480 3.800
5/14/2007 1.270 1.5205/21/2007 1.320 1.3306/4/2007 3.440 3.560
6/11/2007 2.640 3.1206/18/2007 2.580 2.5206/25/2007 2.080 2.0907/2/2007 1.520 1.3807/9/2007 2.210 2.120
7/16/2007 1.310 1.2907/23/2007 1.130 1.1707/30/2007 1.020 1.1708/13/2007 1.040 1.1108/27/2007 0.760 0.8909/11/2007 0.850 0.5209/26/2007 0.820 0.68010/9/2007 0.620 0.710
10/22/2007 0.770 0.76011/5/2007 0.540 0.540
11/20/2007 0.450 0.54012/4/2007 0.110 0.090
12/18/2007 0.050 0.0251/2/2008 0.03 0.06
1/14/2008 0.06 0.071/28/2008 0.03 0.032/11/2008 0.03 0.032/26/2008 0.03 0.033/10/2008 0.03 0.03

North Fork Vermilion River Draft TMDL- October 2013
37
Date Sampled
Finished Atrazine
(ppb)
Raw Atrazine
(ppb)3/25/2008 0.03 0.034/7/2008 0.05 0.06
4/15/2008 0.12 0.174/21/2008 0.20 0.204/28/2008 0.14 0.145/5/2008 0.12 0.11
5/12/2008 0.84 1.065/19/2008 3.20 3.105/27/2008 1.18 1.666/2/2008 1.67 1.826/9/2008 2.92 2.88
6/16/2008 1.62 1.556/23/2008 2.02 1.817/2/2008 2.73 2.737/7/2008 2.35 2.23
7/14/2008 1.51 1.967/21/2008 1.27 1.197/28/2008 1.15 1.238/11/2008 0.75 0.718/25/2008 0.44 0.509/8/2008 0.54 0.49
9/22/2008 0.14 0.1910/6/2008 0.15 0.15
10/20/2008 0.13 0.1411/3/2008 0.21 0.18
11/17/2008 0.11 0.1212/1/2008 0.11 0.101/12/2009 0.05 0.051/26/2009 0.05 0.052/9/2009 0.05 0.05
2/23/2009 0.05 0.053/9/2009 0.05 0.05
3/23/2009 0.05 0.054/6/2009 0.19 0.22
4/13/2009 0.36 0.394/20/2009 0.17 0.174/27/2009 0.17 0.195/4/2009 1.8 2.01
5/11/2009 0.8 0.685/20/2009 10.4 11.25/27/2009 1.5 6.256/1/2009 2.53 4.596/9/2009 3.94 9.3
6/15/2009 2.11 4.84
Date Sampled
Finished Atrazine
(ppb)
Raw Atrazine
(ppb)6/22/2009 2.19 2.086/29/2009 1.15 1.37/6/2009 1.06 0.95
7/13/2009 1.03 1.057/20/2009 0.88 0.867/27/2009 0.72 0.768/10/2009 0.48 0.278/24/2009 0.46 0.529/8/2009 0.48 0.61
9/21/2009 0.51 0.5310/5/2009 0.48 0.52
10/19/2009 0.56 0.511/2/2009 0.13 0.11
11/16/2009 0.09 0.0511/30/2009 0.06 0.0612/14/2009 0.05 0.0612/28/2009 0.05 0.05
1/11/2010 0.05 0.051/25/2010 0.05 0.052/8/2010 0.05 0.05
2/22/2010 0.05 0.053/8/2010 0.05 0.05
3/22/2010 0.05 0.054/5/2010 0.09 0.12
4/12/2010 0.06 0.074/19/2010 0.1 0.114/26/2010 0.08 0.155/3/2010 0.17 0.17
5/10/2010 0.2 0.225/17/2010 0.16 0.45/24/2010 0.24 1.246/2/2010 0.84 2.726/8/2010 1.83 1.92
6/21/2010 0.6 0.526/29/2010 0.3 0.377/6/2010 0.26 0.3
7/12/2010 0.23 0.247/19/2010 0.2 0.247/27/2010 0.15 0.188/2/2010 0.18 0.19
8/16/2010 0.15 0.178/30/2010 0.12 0.149/13/2010 0.12 0.139/27/2010 0.13 0.12

North Fork Vermilion River Draft TMDL- October 2013
38
Date Sampled
Finished Atrazine
(ppb)
Raw Atrazine
(ppb)10/12/2010 0.1 0.0910/25/2010 0.11 0.11
11/8/2010 0.1 0.0911/22/2010 0.09 0.1
12/6/2010 0.08 0.0812/20/2010 0.08 0.08
1/10/2011 0.05 0.051/24/2011 0.05 0.052/7/2011 0.05 0.05
2/22/2011 0.05 0.053/7/2011 0.05 0.05
3/21/2011 0.05 0.054/4/2011 0.05 0.05
4/11/2011 0.05 0.054/18/2011 0.13 0.134/25/2011 5.38 4.695/2/2011 2.67 2.45
5/10/2011 2.48 13.085/16/2011 10.48 10.675/24/2011 1.29 6.08
Date Sampled
Finished Atrazine
(ppb)
Raw Atrazine
(ppb)5/31/2011 4.95 8.46/6/2011 1.06 4.64
6/13/2011 2.65 2.816/20/2011 1.8 1.916/27/2011 1.66 1.367/5/2011 1.33 1.18
7/11/2011 0.96 0.927/20/2011 0.72 0.967/25/2011 0.74 0.648/1/2011 0.41 0.64
8/15/2011 0.53 0.568/23/2011 0.48 0.488/29/2011 0.44 0.489/12/2011 0.38 0.379/29/2011 0.33 0.32
10/12/2011 0.32 0.2910/24/2011 0.19 0.2
11/7/2011 0.24 0.2412/5/2011 0.17 0.17
12/19/2011 0.05 0.06