Effects of low doses of atrazine on the neurobehavioural development of mice
Upload
independentCategory
view
3download
0
Pest Management Science Pest Manag Sci 59:893–903 (online: 2003)DOI: 10.1002/ps.693
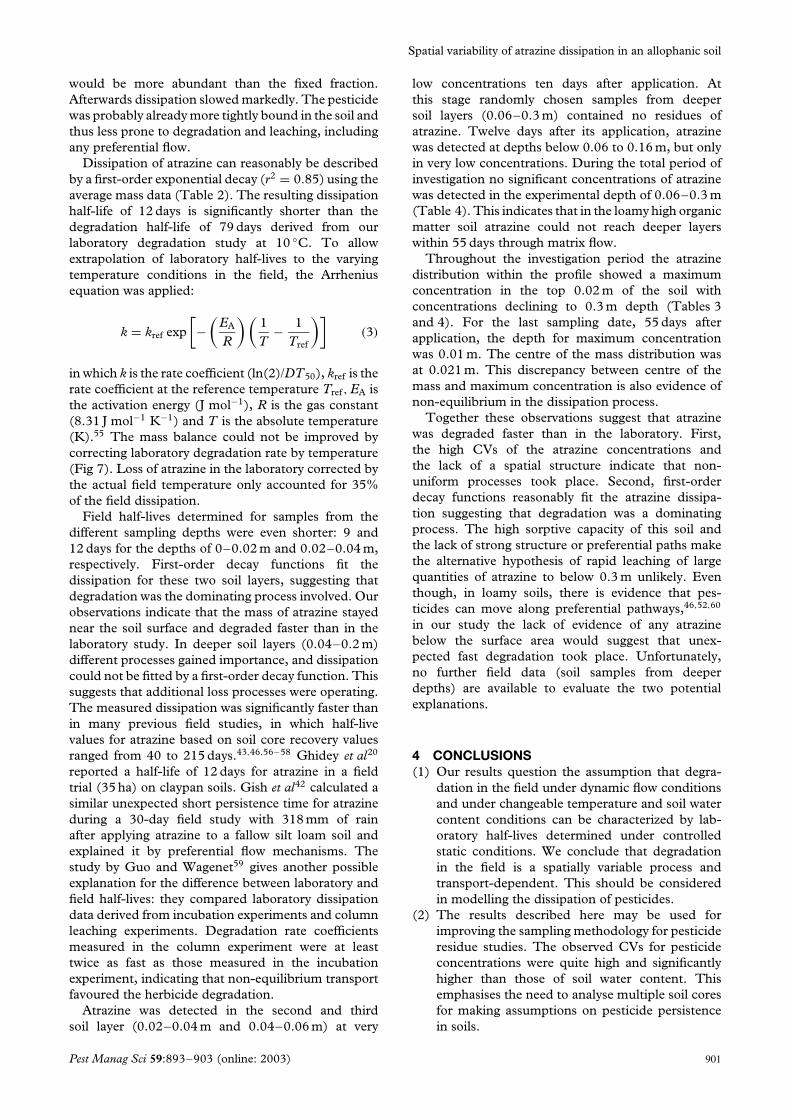
Spatial variability of atrazine dissipationin an allophanic soilKarin Muller,1∗ Roger E Smith,2 Trevor K James,1 Patrick T Holland3 andAnis Rahman1
1AgResearch Limited, Ruakura Research Centre, Private Bag 3123, Hamilton, New Zealand2ARS-USDA, Fort Collins, Colorado, USA3HortResearch, Ruakura Research Centre, Private Bag 3123, Hamilton, New Zealand
Abstract: The small-scale variability (0.5 m) of atrazine (6-chloro-N2-ethyl-N4-isopropyl-1,3,5-triazine-2,4-diamine) concentrations and soil water contents in a volcanic silt loam soil (Haplic Andosol, FAOsystem) was studied in an area of 0.1 ha. Descriptive and spatial statistics were used to analyse the data.On average we recovered 102% of the applied atrazine 2 h after the herbicide application (CV = 35%). Anincrease in the CV of the concentrations with depth could be ascribed to a combination of extrinsic andintrinsic factors. Both variables, atrazine concentrations and soil water content, showed a high horizontalvariability. The semivariograms of the atrazine concentrations exhibited the pure nugget effect, no patterncould be determined along the 15.5-m long transects on any of the seven sampling days over a 55-dayperiod. Soil water content had a weak spatial autocorrelation with a range of 6–10 m. The dissipationof atrazine analysed using a high vertical sampling resolution of 0.02 m to 0.2 m showed that 70% of theapplied atrazine persisted in the upper 0.02-m layer of the soil for 12 days. After 55 days and 410 mm ofrainfall the centre of the pesticide mass was still at a soil depth of 0.021 m. The special characteristicsof the soil (high organic carbon content, allophanic clay) had a strong influence on atrazine sorptionand mobility. The mass recovery after 55 days was low. The laboratory degradation rate for atrazine,determined in a complementary incubation study and corrected for the actual field temperature using theArrhenius equation, only accounted for about 35% of the losses that occurred in the field. Results suggestfield degradation rates to be more changeable in time and much faster than under controlled conditions.Preferential flow is discussed as a component of the field transport process. 2003 Society of Chemical Industry
Keywords: atrazine; spatial variability; persistence; leaching; preferential flow
1 INTRODUCTIONThe major processes involved in dissipation of pes-ticides applied to the soil surface are volatilisation,degradation (including microbiological and hydrolyticbreakdown), plant uptake, leaching to groundwaterand runoff to surface waters. Interactions betweenthe pesticide and the soil, such as sorption processes,influence the chemical’s fate in soil. Soil organic car-bon content (Corg) is widely used to estimate sorptionfor pesticide transport.1 For polar chemicals, suchas atrazine, clay content and composition as wellas the soil pH also affect sorption.2 Microbiologi-cal transformation is the most relevant process for thedegradation of atrazine in the soil environment.3,4
Its efficacy is mainly dependent on soil tempera-ture, soil water content and soil pH.5,6 Thus atrazineleaching mainly depends on soil water content, tex-ture, pH and organic carbon content of the soil as
well as soil hydraulic properties.7,8 In recent yearsthe rapid movement of pesticides along preferentialpathways such as cracks and root channels has beenconsidered as an important pathway for groundwatercontamination.7,9,10 Through preferential flow, pesti-cides move quickly to the subsoil irrespective of theirchemical properties.11 The exact conditions underwhich preferential flow occurs in the field are not yetfully understood,12 but there is likely to be an interac-tion between initial soil water content and preferentialflow.
Significant variability of soil physical and chemicalproperties has been reported in the past.13 Severalstudies have shown, for example, that water content ofthe upper soil layer is highly variable.14 Generally, theheterogeneity of soil properties is site-specific. It canbe very short ranged, long ranged or purely stochas-tic. Thus, it has to be determined for each site. Our
∗ Correspondence to: Karin Muller, AgResearch, Ruakura Research Centre, East Street, Private Bag 3123, Hamilton, New ZealandE-mail: [email protected]/grant sponsor: New Zealand Foundation for Research, Science and TechnologyContract/grant sponsor: Ministry of Agriculture and Forestry, New Zealand(Received 2 May 2002; revised version received 23 September 2002; accepted 25 November 2002)Published online 12 June 2003
2003 Society of Chemical Industry. Pest Manag Sci 1526–498X/2003/$30.00 893

K Muller et al
hypothesis was that heterogeneities in physical andchemical soil properties would have an impact on pes-ticide transport mechanisms, degradation and sorptionand would create non-uniform areas of pesticide con-centrations on the field scale (intrinsic factors).15
Observed variations in pesticide concentrations canalso result from a lack of uniformity in pesticide appli-cation (the extrinsic factor).
Conventional field experiments used to assess therisk of pesticide leaching are often based on widelyspaced sampling sites (eg up to 10 m apart).16,17 Thesampling, normally done using vertical increments of0.3 m or more,18 can be too coarse to track pesticidesin the upper few centimetres of the soil soon aftersurface application. Much interesting informationabout spatial variability of soil processes is also lostby bulking of soil samples.19 Spatial variability ofpesticide sorption has been analysed on larger scales(>1 ha).8,20–24 Small scale variability of pesticidepersistence has rarely been analysed in field trials.25,26
Studies concentrating on the persistence of pesticidesclose to the soil surface are even fewer in number.27
The aims of this investigation were to determineatrazine dissipation and movement near the soilsurface (0–0.2 m depth) and to study the small-scale (0.5 m) spatial variability of soil water contentand atrazine concentration. For this purpose a fieldexperiment was carried out with atrazine applicationand subsequent sampling at the 0.5 m scale on a0.1 ha area. As it can be difficult to distinguish thecontributions of degradation and transport processesto pesticide dissipation in a field trial, a complementarydegradation trial was conducted under controlledconditions in the laboratory. Atrazine was chosen forthis study because it is widely used in New Zealand’scropping system, where pastures regularly succeedcrops and herbicide residues from the preceding cropscan pose risks for Lolium perenne L and Trifolium spec,the two main components of the pasture.
2 MATERIALS AND METHODS2.1 Research areaThe study was conducted on the Waikato ResearchOrchard located near Hamilton, New Zealand. The
soil is volcanic (Bruntwood silt loam), which is aHaplic Andosol according to the FAO classification.The main soil characteristics were determined bysamples adjacent to the experimental area and arepresented in Table 1. Soil particle size distributionwas determined by the hydrometer method of Day,28
the bulk density with undisturbed soil cores, soilparticle density by a pycnometer, the porosity usingthe data of particle and bulk density and the organiccarbon content according to the method of Merry andSpouncer.29
The clay content is moderate and somewhat variablethrough the profile (range 15–25%), whereas theorganic carbon content is high in the soil surface(8.7%) and decreases significantly with depth. Thebulk density is fairly low throughout the profile(average of 0.77 g m−3) due to the high content ofallophanic clays.
The site was previously under maize (Zea mays L)that was harvested in April 2000. Harrow tillage wasperformed following harvest, aimed at levelling thesite. Precipitation and temperature were monitoredusing data from a weather station located within 1 kmof the site.
2.2 Pesticide applicationPrior to the application of atrazine, soil samples weretaken at the four corners of the experimental area todetermine background levels of atrazine in the upper0.2 m of the soil. After 10 mm rain the fallow soil wasregarded as settled and soil samples were taken toestablish the initial soil water content. Atrazine 500 glitre−1 SC (Gesaprim 500 FW; Novartis, Basel) wasapplied on 03 May 2000 at a rate of 3 kg AI ha−1
in 300 litre ha−1 water, using a hand-held carbon-dioxide-pressured precision sprayer equipment withTeeJet 11004TTVP nozzles operated at 230 kPa, awalking speed of 1 m s−1 and a boom width of 0.75 m.
2.3 Soil samplingThe downward migration of the atrazine pulse intothe soil was monitored using vertical soil samplescollected with a soil borer. The soil corer containeda 0.05 m ID × 0.3 m long tube. This soil sampling
Table 1. Soil properties of the Bruntwood silt loam, Hamilton
Sand Silt Clay ϕb ρc
Horizon Depth (m) (%) OCa (%) (g cm−3) (±SD)dPorosity
(%) (±SD)d
Ap 0.00–0.05 39 36 25 8.7 2.32 (±0.02) 0.75 (±0.02) 68 (±1.25)ApBw 0.05–0.20 35 40 25 5.9 2.36 (±0.02) 0.77 (±0.01) 67 (±0.49)Bw 0.20–0.45 40 45 15 1.9 2.42 (±0.01) 0.77 (±0.02) 68 (±0.83)Bg 0.45–0.64 48 27 25 0.3 2.47 (±0.02) 0.74 (±0.04) 70 (±1.30)Brg1 0.64–0.76 34 41 25 0.2 2.43 (±0.03) 0.77 (±0.01) 68 (±0.61)Brg2 0.76–0.95 34 45 21 0.2 2.45 (±0.04) 0.81 (±0.09) 67 (±3.86)
a OC, soil organic carbon content.b ϕ, soil particle density.c ρ, soil bulk density.d n = 3.
894 Pest Manag Sci 59:893–903 (online: 2003)

Spatial variability of atrazine dissipation in an allophanic soil
technique was chosen because ceramic solutionsamplers have proven inadequate for sampling thetotal soil concentration of pesticides.30
Forty-one soil samples were collected 2 h afterthe application so as to check atrazine coverage:31 samples 0.5 m apart along a transect andfurther 10 samples 0.5 m apart along a secondperpendicular transect. Sampling took place on sixother occasions after each significant amount of rainfall(>20 mm). Transects parallel to the initial transectwere sequentially sampled using 30 cores 0.5 m apartalong the 15.5 m long transects.
The soil cores were stored at −18 ◦C untilanalysis. They were cut into 0.02-m thick slices,each representing one sampling depth. The firstmillimetre of the circumference of each slice wasdiscarded in order to prevent cross-contaminationbetween the different sampling depths. Each core slicewas thoroughly homogenised before sub-sampling fordetermination of atrazine and water content.
2.4 Laboratory materials and methods2.4.1 Degradation studySoil from the surface layer (0–0.1 m) of the field trialsite was collected and used for a degradation exper-iment under controlled environmental conditions inthe laboratory. Aliquots of the soil (50 g dry weight)in 250-ml volumetric flasks were adjusted to 60% ofthe maximum water-holding capacity of the soil. Eachsoil sample was fortified with an aqueous dispersion(1 ml) of the formulated product, equivalent to theapplication rate of 3 kg AI ha−1 used in the field trial.The flasks were incubated at 10, 20 and 30 ◦C. Thesoil water content was adjusted to the pre-determinedweight twice a week. Two flasks were taken from eachtemperature after 0, 3, 7, 14, 21, 28, 42 and 56 daysand stored at −18 ◦C until analysis.
2.4.2 Field water contentThe gravimetric soil water content was determinedfor each soil slice using a random sub-sample ofapproximately 5 g of soil. The samples were dried at105 ◦C until no reduction in weight could be recorded.The volumetric water content was calculated using theaverage bulk density of the soil (Table 1).
2.4.3 Extraction of atrazineSoil samples (5–50 g, depending on weight of soilavailable) were placed in volumetric flasks and mixedwith methanol + purified water (70 + 30 by volume)at a ratio of 1 g of air-dried soil to 2 ml of solvent,and spiked with 20 µg terbuthylazine (N2-tert-butyl-6-chloro-N4-ethyl-1,3,5-triazine-2,4-diamine) as aninternal standard. The flasks were then shaken on anorbital shaker for 1 h at 230 rev min−1 and 20 ◦C. Thesuspensions were allowed to settle for at least 30 minand an aliquot of the supernatant solution was thendiluted 1 + 10 by volume with deionised water. Solidphase extraction was used to clean up and concentratethe samples. The samples were aspirated through
C18 columns (Alltech, Deerfield, 2.8 ml, 0.5 g C18
sorbent material). The adsorbed atrazine was elutedwith methanol (2 ml), the eluent collected, evaporatedunder a gentle stream of nitrogen and the residuedissolved in methanol + purified water (50 + 50 byvolume; 1 ml) for analysis by high performance liquidchromatography (HPLC).
2.4.4 AnalysisHPLC analysis was performed on a Shimadzu LC-6B system with a Luna C18 (4.6 mm ID × 15 cm)column. The mobile phase was methanol + water(60 + 40 by volume) at a flow rate of 1 ml min−1. Theinjection volume was 50 µl. The resulting retentiontimes for atrazine and terbuthylazine were 8.4 min and5.3 min, respectively. Detection was performed by UVabsorption at 220 nm. The identity of atrazine wasconfirmed at regular intervals by making additionalpeak measurements at wavelengths of 260 and 280 nm.
The samples for atrazine recoveries were preparedby adding known amounts of atrazine to 25 g ofuncontaminated soil (10 repetitions), at 8000 µg kg−1,which is about three times lower than the fieldapplication rate. The average recovery efficiency was91% with a coefficient of variation (CV) of 3.6%.
2.5 Statistical analysis2.5.1 Descriptive statisticsThe distribution of the two variables, atrazineconcentration and soil water content, was analysedstatistically with the assumption that, for a given depth,the variables were statistically independent regardlessof their spatial position. Statistical characteristicsof the data set used in this study were themedian, the standard deviation and the coefficientof variation. Furthermore, the Shapiro–Wilk test wasused to determine how nearly normal the data weredistributed. Spearman rank correlation coefficientsbetween soil water content and atrazine concentrationswere calculated.31
2.5.2 Spatial statisticsA geostatistical analysis was carried out to investigatethe spatial correlation structure or the distance overwhich both variables, the atrazine concentrationand the soil water content, were correlated. Thedissimilarity between the observations as a functionof their separation distance h can be describedusing semivariograms. The average dissimilarity ismeasured by the experimental semivariogram, whichis calculated as half of the average difference betweenthe components of every data pair separated by thevector h:
γ (h) = 12N(h)
N(h)∑i=1
[x(i) − x(i + h)]2 (1)
where N(h) is the number of data pairs available fora given distance h, x(i) is the value of the first of the
Pest Manag Sci 59:893–903 (online: 2003) 895

K Muller et al
pair and x(i + h) is the corresponding end value.32
Semivariograms were created up to half the maximumlag distance.33 The structure of spatial dependenceof the parameters can be determined by trial fittingdifferent models to the data. Exponential, spherical,Gaussian and linear models with and without anugget effect were tested. A detailed descriptionof the models and their parameters is given, forexample, by Cressie34 and by Deutsch and Journel.35
Applying Levenberg–Marquardt’s non-linear least-squares procedure36 the models were fitted to thederived experimental semivariogram. The value ofthe nugget effect (C0) was estimated by extrapolatingexperimental semivariogram estimates from the lagsclosest to zero. To judge which of the models isbest, the Akaike’s information criterion AIC was used.According to Webster and McBratney37 it can becalculated from the residual sum of squares R ofdeviations from the fitted model with:
AIC = n ln(R) + 2p (2)
where n is the number of points on the variogramat which the semivariance is estimated and p is thenumber of parameters in the model. The model tochoose is the one for which the value of AIC is smallest.
3 RESULTS AND DISCUSSION3.1 Degradation under controlled temperatureand soil moistureDegradation of atrazine in the laboratory was welldescribed by first-order kinetics with regressioncoefficients being greater than 0.9. Temperature hada significant effect on degradation (Table 2). Duringthe 56-day incubation period 40, 92 and 96% ofthe applied atrazine was degraded at 10, 20, 30 ◦C,respectively.
3.2 Variability of soil water content and atrazinein the field experimentThe 2D spatial variability of soil water content andatrazine concentrations was studied on each samplingday by analysing the 30 samples taken along one ofthe transects.
Table 2. Degradation half-lives of atrazine in the field and under
controlled temperature and 60% maximum-water-holding capacity in
the Bruntwood silt loam soil; regressions for the degradation
described by first-order kinetics and coefficients of regression (R2)
Temperature( ◦C)
Half-life(days)
Regression(x, days after application;
y, residue in µg kg−1) R2
10 79 log y = −0.0038x + 3.6337 0.9820 13 log y = −0.0215x + 3.6427 0.9830 9 log y = −0.0319x + 3.5146 0.92
7.5a 12 log y = −0.025x + 4.3513 0.85
a Average soil temperature (0–10 cm depth) during the field investiga-tion period.
3.2.1 Variability of soil water contentAll distributions of the soil water content, (θ), differedsignificantly from the normal distribution due to theoccurrence of outliers, with both very high and lowwater contents. Soil water content was influenced bysoil texture and topographic position (Fig 1).
Some water content profiles are represented inFig 2. Presence of vertical variability can be seen withθ increasing downward, eg on 03 May (CV = 10%),but also with fluctuating water contents, eg on 02June (CV = 11%). There is also a significant amountof horizontal variability, indicated by the error bars
40
50
60
70
80
depth 0 - 0.02 m
wat
er c
on
ten
t (m
3 m
-3)
40
50
60
70
80
depth 0.02 - 0.04 m
wat
er c
on
ten
t (m
3 m
-3)
0 2 4 6 8 10 12 14 16
0 2 4 6 8 10 12 14 16
0 2 4 6 8 10 12 14 16
40
50
60
70
80
depth 0.04 - 0.06 m
position along the transect (m)
wat
er c
on
ten
t (m
3 m
-3)
Figure 1. Spatial distribution of the soil water contents for 03 May forthe first three sampling depths.
896 Pest Manag Sci 59:893–903 (online: 2003)

Spatial variability of atrazine dissipation in an allophanic soil
0.20
0.15
0.10
0.05
00.4 0.5 0.6 0.7 0.8 0.9
water content (m3 m-3) d
epth
(m)
May 03, 2000
0.20
0.15
0.10
0.05
00.4 0.5 0.6 0.7 0.8 0.9
dep
th (m
)
June 02, 2000
0.20
0.15
0.10
0.05
00.4 0.5 0.6 0.7 0.8 0.9
June 26, 2000
dep
th (m
)
Figure 2. Observed soil water contents (mean ± standard deviation).
for the water content in each sampling depth. Thecoefficients of variation ranged between 9 and 19%.The CV values were for the most part consistentlylower at the first depth interval than at deeper depths.Solar radiation and wind on the surface could bea significant influence on the water content in thesurface layer, whereas preferential flow may explainthe variation in deeper layers.
For the spatial statistics of soil water content, thedata collected from the first three layers (0–0.06 m)were taken together to obtain a large enough dataset for a semivariogram analysis in the horizontaldirection.38,39 For the first two sampling days (03 May,09 May) the semivariograms show a pure nugget effect(C0). Nugget effects represent the spatial variabilitythat is not detected at the shortest sampling distance(0.5 m).40 No valid spatial structure could be inferredwith the four models tested. This might be due tothe limited sampling size or to the limited spatialresolution. The latter would mean that there is nospatial dependence at the scale of investigation since
all of the variance occurs within the smallest samplinginterval (the range of the semivariogram model a wouldbe smaller than 0.5 m in the horizontal direction).Observing the data presented in Fig 1, a failure due toan underlying trend across a transect can be excludedfor all three depths. Netto et al41 found the samelack of spatial structure for soil water content on abrown eluviated soil. The vertical (1.2 m transects)and horizontal (1.05 m depth) sampling resolutionswere with 0.1 m even finer than in the study presentedhere.
Semivariograms for θ on later sampling days (15May, 02 June, 06 June) show weak spatial horizontaldependence with apparently very high nugget effectsand with large range values (Fig 3). Accordingto the AIC selection criteria the spherical modelis the best fit to the experimental semivariances(AIC = −46.36). Nevertheless, there was considerableuncertainty in the model parameters as expressed bytheir high standard deviations (C0 0.6, c 0.7, a 12.4).Models including nugget effect best described theexperimental variances. The nugget values accountedfor 70% of the total sample variance. Thus, the highnugget values indicate largely random or inherentlyvariable soil water content in the experimental site.The range of a semivariogram provides an estimate ofthe extent of the spatial dependence. For the samplestaken on 15 May, 02 June and 06 June the rangeswere within 6–10 m. This distance represents theminimum average distance at which the maximumvariation occurred. Sills of the semivariograms weresimilar to the sample variance. The data gathered onthe first two sampling days showed no spatial structureat all, whereas data for later sampling days showed aweak autocorrelation. This may be explained by thestructure of the water phase being more incoherent insoils with lower water contents.
0 2 4 6 8 100.6
0.7
0.8
0.9
1.0
1.1
1.2
γ (h
)
lag [m]
Figure 3. Experimental semivariogram of the normalised soil watercontents for 15 May (sampling depth: 0–0.06 m). The dotted linerepresents the fitted theoretical variogram applying the exponentialmodel (γ (h) = 0.69 + 0.35(1 − e−3h/12.4)), the solid line representsthe spherical model (0.72 + 0.3(1.5h/9.93 − 0.5(h/9.93)3)).
Pest Manag Sci 59:893–903 (online: 2003) 897

K Muller et al
3.2.2 Variability of the atrazine concentrationsCoefficients of variation (CV) for atrazine concen-trations were quite high (≤100%, Tables 3 and 4).Walker and Brown24 concluded from their field exper-iment with simazine that the principal reason forthe variability in herbicide residues was the uneven-ness in the herbicide application. In contrast totheir conclusion, the observed increase in the CVof atrazine concentrations with depth demonstratesthat the residue variability in our study was a com-bined result from a non-uniform application (extrinsicfactor) and from natural variations in soil characteris-tics (intrinsic factors).15 Two hours after the pesticideapplication we took 41 samples to assess the perfor-mance of the application. The expected concentrationof atrazine in the top 0.02 m immediately after theapplication of 3 kg AI ha−1 can be calculated usingthe measured bulk density of 0.75 g cm−3 as 20 000 µgkg−1 soil. The mean measured atrazine concentrationwas 20 340 µg kg−1 soil with a standard deviation of7200 µg kg−1 soil and a CV of 35%. Since the variabil-ity of the atrazine surface deposition was considerable,the observed horizontal variability in atrazine concen-trations in the lower soil profile will be due to bothintrinsic and extrinsic factors. Pesticide applicationvariability is inherent. Drift while spraying, volatilisa-tion, etc inhibit an even application. A CV of 35%for pesticide application (n = 41) is acceptable andcomparable with other studies.23,25,42–45
Statistical moments for the atrazine mass aresummarized in Tables 3 and 4 for the different layersand sampling days. Inspecting the raw data presentedin Fig 4, the distribution of atrazine concentrationsreveals no trend across the transects for any of thesampling days. The assumption of non-stationarityof the data for the geostatistical analysis is fulfilled.Analysing the semivariances plotted against distance,the horizontal short distance correlation of atrazineconcentrations was non-significant for all samplingdays (Fig 5). No autocorrelation is observed, thesemivariograms having apparently only the purenugget effect. The semivariances oscillate aroundthe variance. This means that either the samplingwas still too coarse to capture the spatial structureof the atrazine distribution or that the variabilitywas stochastic in nature. With the exception of thesamples taken on 15 May, the concentrations declinedwith depth. Very often the pattern in the thirdsampling layer (0.04–0.06 m) can be traced backto the upper soil layers. The vertical variability wasgenerally larger than the horizontal variability. Alldistributions except those of the application day andof 15 May (depth 0.04–0.06 m) differed significantly(P < 0.05) from the normal distribution. This, andalso the large CV values, might be an indication ofsome non-uniform herbicide degradation, sorptionor transport. Several authors have reported verticalspatial variability in atrazine sorption or degradation
Table 3. Soil residues and rainfall data for the 55-day period following atrazine application on 03 May 2000
Atrazine residue (kg ha−1) at sampling depth (m)
0–0.02 0.02–0.04 0.04–0.06
Samplingdate Za CVb Wc Za CVb Wc Za CVb Wc
Interval rainfalld
(mm)
03.05.00 2.99 35 0.5109.05.00 3.93 22 0.92 0.22 62 0.16 0.02 49 0.01 49.315.05.00 2.11 36 0.77 0.57 50 0.29 0.02 57 0.02 68.802.06.00 0.26 63 0.00 0.1 32 0.09 0.01 63 0.00 111.106.06.00 0.16 25 0.00 0.05 35 0.06 0.01 53 0.00 122.926.06.00 0.09 23 0.01 0.03 39 0.05 0.01 33 0.16 27.7
a Z: Values are the median of 30 soil samples taken 0.5 m along a transect.b CV, coefficient of variation (%).c W, coefficient of the Shapiro–Wilk test.d Rainfall is the accumulated precipitation amount for the periods between sampling.
Table 4. Residues of atrazine in soil below 0.06 m for the 55-day period following atrazine application on 03 May 2000
Atrazine soil residues (kg ha−1) at sampling depth (m)
0.06–0.08 0.08–0.1 0.1–0.12 0.12–0.14 0.14–0.16
Sampling date Za CVb Za CVb Za CVb Za CVb Za CVb
15.05.00 0.01 85 0.01 45 0.01 39 0.004 75 0.002 10002.06.00 0.006 80 0.004 39 0.005 49 0.003 99 0.001 15126.06.00 0.005 27 0.005 87 0.004 66 0.001 20 0.003 22
a Z: Values are the median of at least 8 randomly chosen soil samples of the entire 30 samples taken 0.5 m along a transect.b CV, coefficient of variation (%).
898 Pest Manag Sci 59:893–903 (online: 2003)

Spatial variability of atrazine dissipation in an allophanic soil
0 2 4 6 8 10 12 14 16012345
20
30
40
5009/May/2000
atra
zin
e [m
g k
g-1
]
0 2 4 6 8 10 12 14 160
1
2
3
4
7
8
902/June/2000
atra
zin
e [m
g k
g-1
]
0 2 4 6 8 10 12 14 160.0
0.2
0.4
0.6
0.8
1.0
1.2
1.4
1.6
1.8
2.0
2.2
06/June/2000
atra
zin
e [m
g k
g-1
]
sampling position [m]
Figure 4. Distribution of the measured atrazine concentrations in thesoil profile on 09 May, 02 and 06 June in three depths: (�) 0–0.02 m,(ž) 0.02–0.04 m, (°) 0.04–0.06 m.
rates.4,22,26,46–48 However, the study described in thispaper focuses on horizontal spatial variability.
Chammas et al27 found both a high lateral andvertical variability for atrazine in their small-scalestudy. The variability for atrazine was much higher(CV 26–353%) than that for the conservative tracerchloride. The authors concluded that the variabilitywas due to preferential atrazine transport and alsoto the variability in sorption properties of the soil.Other studies20,22 showed that on larger scalesherbicide residues are significantly correlated with
0 2 4 6 8 10 1220
40
60
80
100
120
γ (h
)
lag [m]
Figure 5. Experimental semivariogram of the atrazine concentrationsfor May 03. The dotted line represents the variance of theconcentrations.
parameters controlling sorption, such as soil pHand organic carbon content. Less than 20% of thetotal semivariance in atrazine sorption coefficients wasfound at lag distances <10 m in a field trial (6.25 ha)conducted by Novak et al.8 Little sorption variabilitywas detected at the small scale, but atrazine sorptionwas influenced by landscape position and soil serieson larger scales. Similarly, in a field experiment ontwo scales (0.1 ha and 1 m2) Beck et al49 showed thatthe variation of isoproturon sorption coefficients wasless at the local scale than at the field scale. Lafranceand Banton50 showed through a stochastic approachthat the variability of soil parameters controlling waterflow could be greater than that of the sorption-relatedparameters. Previous research and modelling indicatethat the variability in sorption rates is less importantfor the small-scale horizontal variability of herbicideresidues.
The observed horizontal variability might alsobe caused by uneven atrazine degradation in thefield. This assumption is supported by the work ofWalker et al51 who reported non-uniform herbicidedegradation within a field (5 ha), incubating 30soil samples collected from the field, fortified withisoproturon in the laboratory. Half-lives (ie timefor 50% degradation of the initial amount of apesticide) ranged from 6.5 to 30 days. The variabilitywas ascribed to differences in the microbiologicalpopulation influenced by soil pH. Other authorsemphasizing the spatial variability of degradationwithin a single field are Beck et al49 and Vischettiet al.23
Another non-uniform process that could have takenplace is preferential flow, where the solutes aretransported through only a small portion of the soilvolume. The probability of sampling these pathwaysis very low even if multiple soil cores are analysed.Preferential flow mechanisms therefore, in addition toenhancing pesticide mobility, may lead to horizontalvariability and also to higher than expected pesticidemobility.11,27,52,53
Pest Manag Sci 59:893–903 (online: 2003) 899

K Muller et al
3.3 Correlation between soil water contentand atrazine concentrationsThere was a significant positive correlation (P <
0.01) between the two parameters for the samplescollected directly after the application and forthe samples collected one month after herbicideapplication (Table 5). For all other samples atrazineconcentrations were not significantly correlated withsoil water content. Several studies have indicated thatthe initial soil water content influences leaching ofpesticides54 by affecting the flow of infiltrating waterwhich, in turn, affects leaching of a pesticide applied tothe soil surface. Higher atrazine concentrations werefound in areas of high soil water content in the firstmonth of the experiment.
3.4 Dissipation of atrazine in the fieldexperimentThe average soil temperature was 7.5 ◦C and ambienttemperature averaged 15 ◦C during the investigationperiod. The rainfall distribution during the 55-dayexperimental period following pesticide application on3 May 2000 is shown in Fig 6. The total rainfallamounted to 410 mm. Soil samples were taken onMay 9, May 15, June 2, June 6, June 8 and June 26according to the rainfall distribution.
Background levels of atrazine were negligible, at0.66 µg kg−1 soil in the 0.08–0.16 m depth samples.
Table 5. Coefficient of correlation (rs) between soil water content and
atrazine concentration in the soil measured at the six sampling days
Samplingdate
Samplingdepth (m)
Coefficient ofcorrelationa
03.05.00 0–0.02 0.405∗∗
09.05.00 0–0.02 0.2060.02–0.04 0.1610.04–0.06 0.136
15.05.00 0–0.02 0.0950.02–0.04 0.2360.04–0.06 0.475∗∗0.06–0.08 0.3050.08–0.1 0.3450.1–0.12 0.642
0.12–0.14 0.714
02.06.00 0–0.02 0.761∗∗0.02–0.04 0.600∗∗0.04–0.06 0.686∗∗
06.06.00 0–0.02 0.581∗∗0.02–0.04 0.483∗∗0.04–0.06 0.445∗∗0.06–0.08 0.400
26.06.00 0–0.02 0.2330.02–0.04 0.2930.04–0.06 0.6790.06–0.08 0.738∗∗0.08–0.1 0.3410.1–0.12 0.533∗
0.12–0.14 0.001
a ∗P < 0.05, ∗∗P < 0.01.
0 10 20 30 40 500
20
40
60
80sampling days
dai
ly p
reci
pit
atio
n [
mm
]
days after application
0
100
200
300
400
500
cum
ulative p
recipitatio
n [m
m]
Figure 6. Daily precipitation, cumulative precipitation and samplingdays (marked with arrows) during the investigation period from 03May to 26 June, 2000.
In the other depths (0–0.08 m and 0.16–0.20 m) noatrazine could be detected. On average we recovered102% of the amount applied in the top 2 cm of the soilprofile 2 h after application.
The amount of atrazine in the profile was calculatedfrom the measured concentrations and the bulk densityfor each depth increment, and then summed to obtainthe total for the soil. The results from the secondsampling (6 days after application) were inconsistentas the average concentrations and resulting amountswere about 5% higher than those on the day ofthe atrazine application. Therefore, these data wereexcluded from the discussion of the individual resultsbut were included in the graphics and calculations.
Dissipation showed three phases (Fig 7). Within thefirst 12 days dissipation was slow. The average massof atrazine found 12 days after application showed areduction of 30% in the topsoil layer (0–0.02 m), after118 mm of rainfall during the elapsed time period(Table 3). During the following 18 days dissipationwas very fast: the average concentration in the first soillayer declined sharply to reach only about 10% of theoriginal concentration; the further rainfall amountedto 111 mm, which had occurred mainly in a singleevent on 30th of May to 1st of June (Fig 6). Thistime-period was the early stage of soil–herbicideinteraction, where the labile pool atrazine fraction
0
5
10
15
20
25
0 10 20 30 40 50
days after application
atra
zin
e (g
kg
-1)
Figure 7. Comparison of atrazine dissipation (�) in the field, (�) inthe laboratory and (- - - - ) predicted values using the laboratoryhalf-lives corrected for temperature changes applying theArrhenius equation.
900 Pest Manag Sci 59:893–903 (online: 2003)
Spatial variability of atrazine dissipation in an allophanic soil
would be more abundant than the fixed fraction.Afterwards dissipation slowed markedly. The pesticidewas probably already more tightly bound in the soil andthus less prone to degradation and leaching, includingany preferential flow.
Dissipation of atrazine can reasonably be describedby a first-order exponential decay (r2 = 0.85) using theaverage mass data (Table 2). The resulting dissipationhalf-life of 12 days is significantly shorter than thedegradation half-life of 79 days derived from ourlaboratory degradation study at 10 ◦C. To allowextrapolation of laboratory half-lives to the varyingtemperature conditions in the field, the Arrheniusequation was applied:
k = kref exp[−
(EA
R
)(1T
− 1Tref
)](3)
in which k is the rate coefficient (ln(2)/DT50), kref is therate coefficient at the reference temperature Tref , EA isthe activation energy (J mol−1), R is the gas constant(8.31 J mol−1 K−1) and T is the absolute temperature(K).55 The mass balance could not be improved bycorrecting laboratory degradation rate by temperature(Fig 7). Loss of atrazine in the laboratory corrected bythe actual field temperature only accounted for 35%of the field dissipation.
Field half-lives determined for samples from thedifferent sampling depths were even shorter: 9 and12 days for the depths of 0–0.02 m and 0.02–0.04 m,respectively. First-order decay functions fit thedissipation for these two soil layers, suggesting thatdegradation was the dominating process involved. Ourobservations indicate that the mass of atrazine stayednear the soil surface and degraded faster than in thelaboratory study. In deeper soil layers (0.04–0.2 m)different processes gained importance, and dissipationcould not be fitted by a first-order decay function. Thissuggests that additional loss processes were operating.The measured dissipation was significantly faster thanin many previous field studies, in which half-livevalues for atrazine based on soil core recovery valuesranged from 40 to 215 days.43,46,56–58 Ghidey et al20
reported a half-life of 12 days for atrazine in a fieldtrial (35 ha) on claypan soils. Gish et al42 calculated asimilar unexpected short persistence time for atrazineduring a 30-day field study with 318 mm of rainafter applying atrazine to a fallow silt loam soil andexplained it by preferential flow mechanisms. Thestudy by Guo and Wagenet59 gives another possibleexplanation for the difference between laboratory andfield half-lives: they compared laboratory dissipationdata derived from incubation experiments and columnleaching experiments. Degradation rate coefficientsmeasured in the column experiment were at leasttwice as fast as those measured in the incubationexperiment, indicating that non-equilibrium transportfavoured the herbicide degradation.
Atrazine was detected in the second and thirdsoil layer (0.02–0.04 m and 0.04–0.06 m) at very
low concentrations ten days after application. Atthis stage randomly chosen samples from deepersoil layers (0.06–0.3 m) contained no residues ofatrazine. Twelve days after its application, atrazinewas detected at depths below 0.06 to 0.16 m, but onlyin very low concentrations. During the total period ofinvestigation no significant concentrations of atrazinewas detected in the experimental depth of 0.06–0.3 m(Table 4). This indicates that in the loamy high organicmatter soil atrazine could not reach deeper layerswithin 55 days through matrix flow.
Throughout the investigation period the atrazinedistribution within the profile showed a maximumconcentration in the top 0.02 m of the soil withconcentrations declining to 0.3 m depth (Tables 3and 4). For the last sampling date, 55 days afterapplication, the depth for maximum concentrationwas 0.01 m. The centre of the mass distribution wasat 0.021 m. This discrepancy between centre of themass and maximum concentration is also evidence ofnon-equilibrium in the dissipation process.
Together these observations suggest that atrazinewas degraded faster than in the laboratory. First,the high CVs of the atrazine concentrations andthe lack of a spatial structure indicate that non-uniform processes took place. Second, first-orderdecay functions reasonably fit the atrazine dissipa-tion suggesting that degradation was a dominatingprocess. The high sorptive capacity of this soil andthe lack of strong structure or preferential paths makethe alternative hypothesis of rapid leaching of largequantities of atrazine to below 0.3 m unlikely. Eventhough, in loamy soils, there is evidence that pes-ticides can move along preferential pathways,46,52,60
in our study the lack of evidence of any atrazinebelow the surface area would suggest that unex-pected fast degradation took place. Unfortunately,no further field data (soil samples from deeperdepths) are available to evaluate the two potentialexplanations.
4 CONCLUSIONS(1) Our results question the assumption that degra-
dation in the field under dynamic flow conditionsand under changeable temperature and soil watercontent conditions can be characterized by lab-oratory half-lives determined under controlledstatic conditions. We conclude that degradationin the field is a spatially variable process andtransport-dependent. This should be consideredin modelling the dissipation of pesticides.
(2) The results described here may be used forimproving the sampling methodology for pesticideresidue studies. The observed CVs for pesticideconcentrations were quite high and significantlyhigher than those of soil water content. Thisemphasises the need to analyse multiple soil coresfor making assumptions on pesticide persistencein soils.
Pest Manag Sci 59:893–903 (online: 2003) 901

K Muller et al
(3) The study raises warning flags for future exper-imental efforts of this type. No valid spatialstructure at this scale for the pesticide concentra-tions could be inferred. Either the measurementresolution was still too coarse, as the ranges ofthe respective semivariogram models would besmaller than 0.5 m, or the horizontal variabilitiesof soil pesticide concentrations are of a stochasticnature. The spatial resolution of measurementsshould generally be much higher to derive poten-tial short-range correlation structures. If processeslike preferential flow govern the pesticide dissipa-tion, the small-scale geostatistics of soil propertieswould be required. Spatial distribution of variablescan be a basis for future stochastic simulations ofthe mass transfer in soil including preferentialflow.
(4) The high horizontal variability of pesticideconcentrations, the biphasic decay in the subsoiland the unexpected fast dissipation suggest thepresence of non-uniform processes. Experimentalmass recoveries for atrazine in June were small.Mass balances are a crucial point even in a fieldexperiment with a high sampling resolution, suchas this study. In future investigations a dye tracercould be used to visualize actual flow paths,61
to assist in deciding the depth to which samplesshould be collected for pesticide study, and toverify if preferential flow is likely to occur on thesite.
ACKNOWLEDGEMENTSWe thank Dr Peter Singleton for measuring the soilphysical properties. We also thank Mr Mike Trolove,Ms Judy Mellsop and Mr Dwayne Jensen for technicalhelp. Financial support for this study was provided bythe New Zealand Foundation for Research, Scienceand Technology and the Ministry of Agriculture andForestry, New Zealand.
REFERENCES1 Wagenet RJ and Rao PSC, Modelling pesticide fate in soils, in
Pesticides in the soil environment: processes, impacts and modelling,ed by Cheng HH, Soil Science Society of America, Madison,WI, pp 351–399 (1990).
2 Green RE and Karickhoff SW, Sorption estimates for modelling,in Pesticides in the soil environment: processes, impacts andmodelling, ed by Cheng HH, Soil Science Society of America,Madison, WI, pp 79–101 (1990).
3 Torstensson NTL, Microbial decomposition of herbicides insoil, in Herbicides, ed by Hutson DH and Roberts TR, JohnWiley & Sons, Chichester, UK, pp 249–270 (1987).
4 Vanderheyden V, Debongnie P and Pussemier L, Accelerateddegradation and mineralization of atrazine in surface andsubsurface soil materials. Pestic Sci 49:237–242 (1997).
5 James TK, Holland PT, Rahman A and Lu YR, Degradationof the sulfonylurea herbicides chlorsulfuron and triasulfuronin a high-organic-matter volcanic soil. Weed Res 39:137–147(1999).
6 Kulshrestha G and Singh SB, Influence of soil moisture andmicrobial activity on pendimethalin degradation. Bull EnvironContam Toxicol 48:269–274 (1992).
7 Flury M, Leuenberger J, Studer B and Fluhler H, Transport ofanions and herbicides in a loamy and a sandy field soil. WaterResour Res 31:823–835 (1995).
8 Novak JM, Moorman TB and Cambardella CA, Atrazine sorp-tion at the field scale in relation to soils and landscape position.J Environ Qual 26:1271–1277 (1997).
9 Brown CD, Hodgkinson RA, Rose DA, Syers K and Wilcock-son SJ, Movement of pesticides to surface waters from a heavyclay soil. Pestic Sci 43:131–140 (1995).
10 Traub-Eberhard U, Henschel KP, Kordel W and Klein W,Influence of different field sites on pesticide movement intosubsurface drains. Pestic Sci 43:121–129 (1995).
11 Kladviko EJ, Van Scoyoc GE, Monke EJ, Oates KM andPask W, Pesticide and nutrient movement into subsurfacetile drains on a silt loam soil in Indiana. J Environ Qual20:264–270 (1991).
12 Wang Z and Feyen J, Susceptibility and predictability of con-ditions for preferential flow. Water Resour Res 34:2169–2182(1998).
13 Nielsen DR, Biggar JW and Erh KT, Spatial variability of fieldmeasured soil water properties. Hilgardia 42:215–259 (1973).
14 Bardossy A and Lehman W, Spatial distribution of soil moisturein a small catchment. Part 1: Geostatistical analysis. J Hydrol206:1–15 (1998).
15 Rao RSC and Wagenet RJ, Spatial variability of pesticides infield soils: methods for data analysis and consequences. WeedSci 33:18–24 (1985).
16 Felding G, Leaching of phenoxyalkanoic acid herbicides fromfarmland. Sci Total Environ 168:11–18 (1995).
17 Smith CN and Parrish RS, A field study to evaluate leaching ofaldicarb, metolachlor, and bromide in a sandy loam soil. JEnviron Qual 22:562–577 (1993).
18 Hornsby AG, Rao PSC and Jones RL, Fate of aldicarb in theunsaturated zone beneath a citrus grove. Water Resour Res26:2287–2302 (1990).
19 James TK, Lauren DR and Rahman A, Measurement ofatrazine residues in soil and groundwater, in The 47thNew Zealand Plant Protection Conference, ed by Popay AJ,Palmerston North, pp 401–405 (1994).
20 Ghidey F, Alberts EE and Lerch RN, Spatial and temporalvariability of herbicides in a claypan soil watershed. J EnvironQual 26:1555–1563 (1997).
21 Lafrance P and Banton O, Impact of field-scale variationin pesticide adsorption parameter on the reliability ofsoil pesticide transport simulation, in Groundwater quality:Remediation and protection, IAHS, Prague, pp 125–132(1995).
22 Oliveira Jr RS, Spatial variability of imazethapyr in soil. WeedSci 47:243–248 (1999).
23 Vischetti C, Businelli M, Marini M, Capri E, Trevisan M,Del Re AAM, Donnarumma L, Conte E and Imbroglini G,Characterization of spatial variability structure in threeseparate field trials on pesticide dissipation. Pestic Sci50:175–182 (1997).
24 Walker A and Brown PA, Spatial variability in herbicidedegradation rates and residues in soil. Crop Protect 2:17–25(1983).
25 Dror I, Kliger L, Laufer A, Hadas A, Russo D and Yaron B,Behavior of atrazine and terbuthylazine in an irrigatedfield: I. Soil and management spatial variability. Agrochimica63:257–266 (1999).
26 Jacques D, Mouvet C, Mohanty B, Vereecken H and Feyen J,Spatial variability of atrazine sorption parameters and othersoil properties in a podzoluvisol. J Contam Hydrol 36:31–52(1999).
27 Chammas GA, Hutson JL, Hart JJ and DiTomaso JM,Microscale variability of atrazine and chloride leaching underfield conditions. Weed Technol 11:98–104 (1997).
28 Day PR, Particle fractionation and particle-size analysis, inMethods of soil analysis, Part I, ed by Black CA, AmericanSociety of Agronomists, Madison, WI, pp 545–577 (1965).
902 Pest Manag Sci 59:893–903 (online: 2003)

Spatial variability of atrazine dissipation in an allophanic soil
29 Merry RH and Spouncer CR, The measurement of carbon insoils using a microprocessor-controlled resistance furnace.Commun Soil Sci Plant Anal 19:707–720 (1988).
30 Barbee GC and Brown KW, Comparison between suction andfree drainage soil solution samples. Soil Sci 141:149–154(1986).
31 Dufner D, Jensen U and Schumacher E, Statistik mit SAS, BGTeubner, Stuttgart (1992).
32 Matheron G, Les variables regionalisees et leur estimation, Massonet Cie, Paris (1965).
33 Webster R, Quantitative spatial analysis of soil in the field, inAdvances in soil science, ed by Stewart BA, Springer Verlag,New York, pp 1–70 (1985).
34 Cressie NAC, Statistics for spatial data, John Wiley & Sons, NewYork, (1993).
35 Deutsch CV and Journel AG, GSLIB Geostatistical softwarelibrary and user’s guide, Oxford University Press, New York(1998).
36 Press WH, Teukolsky SA, Vetterling WT and Flannery BP,Numerical recipes in C, Cambridge University Press, Cam-bridge (1992).
37 Webster R and McBratney AB, On the Akaike InformationCriterion for choosing models of variograms of soil properties.J Soil Sci 40:493–496 (1989).
38 Deurer M, Duijnisveld WHM and Bottcher J, Spatial analysisof water characteristic functions in a sandy podzol under pineforest. Water Resour Res 36:2925–2935 (2000).
39 Russo D and Bouton M, Statistical analysis of spatial vari-ability in unsaturated flow parameters. Water Resour Res28:1911–1925 (1992).
40 Burrough PA, Multiscale sources of spatial variation in soil. I.The application of fractal concepts to nested levels of soilvariation. Soil Sci 34:577–597 (1983).
41 Netto AM, Pieritz RA and Gaudet JP, Field study on the localvariability of soil water content and solute concentration. JHydrol 215:23–37 (1999).
42 Gish TJ, Helling CS and Mojasevic M, Preferential movementof atrazine and cyanazine under field conditions. Trans ASAE34:1699–1705 (1991).
43 Heatwole CD, Zacharias S, Mostaghimi S and Dillaha TA,Movement of field-applied atrazine, metolachlor and bromidein a sandy loam soil. Trans ASAE 40:1267–1276 (1997).
44 Taylor AW, Freeman HP and Edwards WM, Sample variabilityand the measurement of dieldrin content of a soil in the field.J Agric Food Chem 19:1794–1796 (1971).
45 Wauchope RD, Chandler JM and Savage KE, Soil samplevariation and herbicide incorporation uniformity. Weed Sci11:98–104 (1977).
46 Dror I, Kliger L, Hadas A, Russo D and Yaron B, Behaviorof atrazine and terbuthylazine in an irrigated field: II.
Persistence, Dissipation and Redistribution. Agrochimica63:267–276 (1999).
47 Larsen L, Sørensen SR and Aamand J, Mecoprop, isoproturon,and atrazine in and above a sandy aquifer: vertical distributionof mineralization potential. Environ Sci Technol 34:2426–2430(2000).
48 Willems HPL, Lewis KJ, Dyson JS and Lewis FJ, Mineral-ization of 2,4-D and atrazine in the unsaturated zoneof a sandy loam soil. Soil Biol Biochem 28:989–996(1996).
49 Beck AJ, Harris GL, Howse KR, Johnston AE and Jones KC,Spatial and temporal variation of isoproturon residues andassociated sorption/desorption parameters at the field scale.Chemosphere 33:1283–1295 (1996).
50 Lafrance P and Banton O, Implication of spatial variabilityof organic carbon on predicting pesticide mobility in soil.Geoderma 65:331–338 (1995).
51 Walker A, Jurado-Exposito M, Bending GD and Smith VJR,Spatial variability in the degradation rate of isoproturon insoil. Environ Pollut 111:407–415 (2001).
52 Clemente RS, Prasher SO and Salehi F, Performance test-ing and validation of PESTFADE. Agric Water Manag37:205–224 (1998).
53 Persicani D, Gasparetti PSG and Bonvini M, Comparison ofmeasured and simulated atrazine mobility in two alluvialsoils. Soil Technol 9:281–298 (1996).
54 Flury M, Fluhler H, Jury WA and Leuenberger J, Susceptibilityof soils to preferential flow of water: a field study. Water ResourRes 30:1945–1954 (1994).
55 Boesten JJTI, Modeller subjectivity in estimating pesticideparameters for leaching models using the same laboratorydata set. Agric Water Manag 44:389–409 (2000).
56 Ghadiri H, Shea PJ, Wicks GA and Haderlie LC, Atrazinedissipation in conventional-till and no-till sorghum. J EnvironQual 13:549–552 (1984).
57 Ritter WF, Scarborough RW and Chirnside AEM, Contamina-tion of groundwater by triazines, metolachlor, and alachlor. JContam Hydrol 15:73–92 (1994).
58 Weed DAJ, Kanwar RS, Stoltenberg DE and Pfeiffer RL,Dissipation and distribution of herbicides in the soil profile. JEnviron Qual 24:68–79 (1995).
59 Guo L and Wagenet RJ, Evaluation of alachlor degradationunder transport conditions. Soil Sci Soc Am J 63:443–449(1999).
60 Flury M, Experimental evidence of transport of pesticidesthrough field soils—a review. J Environ Qual 25:25–45(1996).
61 Flury M, Leuenberger J, Studer B, Fluhler H, Jury WA andRoth K, Pesticide transport through unsaturated field soils:preferential flow, Ciba Ltd, Basel (1994).
Pest Manag Sci 59:893–903 (online: 2003) 903
Copyright © 2022 FDOKUMEN