Atrazine degradation in anaerobic environment by a mixed microbial consortium
8
Water Research 38 (2004) 2277–2284 Atrazine degradation in anaerobic environment by a mixed microbial consortium Pranab Kumar Ghosh a , Ligy Philip b, * a Department of Civil Engineering, Vellore Institute of Technology, Vellore, Pin-632 014, India b Department of Civil Engineering, Indian Institute of Technology Madras, Chennai Pin-600 036, India Received 1 May 2003; accepted 27 October 2003 Abstract Atrazine degradation by anaerobic mixed culture microorganism in co-metabolic process and in absence of external carbon and nitrogen source was studied at influent atrazine concentration range of 0.5–15 mg/l. Wastewater of desired characteristic was prepared by the addition of various constituents in distilled water spiked with atrazine. In co- metabolic process, dextrose of various concentrations (150–2000 mg/l) was supplied as external carbon source. The reactors were operated in sequential batch mode in which 20% of treated effluent was replaced by the same amount of fresh wastewater everyday, thus maintaining a hydraulic retention time (HRT) equal to 5 days. In co-metabolic process, 40–50% of influent atrazine degradation was observed. First-order atrazine degradation rate (expressed in day 1 ) was better in co-metabolic process (5.5 10 4 ) than in absence of external carbon source (2.5 10 5 ) or carbon and nitrogen source (1.67 10 5 ). In presence of 2000 mg/l of dextrose, atrazine degradation was between 8% and 15% only. Maximum atrazine degradation was observed from wastewater containing 300 mg/l of dextrose and 5 mg/l of atrazine. Influent atrazine concentration did not have much effect on the methanogenic bacteria which was clear from methane gas production and specific methanogenic activity (SMA). r 2004 Elsevier Ltd. All rights reserved. Keywords: Atrazine; Anaerobic; Biodegradation; Co-metabolism; Reaction rate; Sequential 1. Introduction Atrazine (2-chloro-4-ethylamino-6-isopropylamino-s- triazine), probably the most commonly used herbicide in the world [1], is quite persistent in neutral environment and is toxic to various living organisms [2]. Many studies were carried out so far on the biodegradation of atrazine in wastewater and bioremediation of atrazine contami- nated soil [3–6]. Most of these studies employed pure culture microorganisms except a few by mixed bacterial culture. Pure culture bacteria used atrazine as sole source of carbon and/or nitrogen, but degradation was partial and mineralization happened only in a few cases [7,8]. Atrazine biodegradation rate and the degree of degradation depended on the types of pure culture bacteria, presence and absence of various external carbon and nitrogen sources and their respective concentrations, carbon/nitrogen ratio, pH and moisture content [4–6]. The effects of above said factors on the rate and degree of atrazine biodegradation are contra- dictory. Furthermore, handling of pure culture bacteria in actual field condition is a cumbersome job and atrazine mineralization in situ condition was almost non-existent [9]. Mandelbaum et al. [10] observed mineralization of atrazine, only after mixing a number of pure culture strains among two hundred isolated strains. Earlier studies showed that atrazine was better degraded in anaerobic conditions than in aerobic one [11]. Many chlorinated aliphatic and aromatic com- pounds like Benzene Hexachloride (BHC) and DDT ARTICLE IN PRESS *Corresponding author. E-mail address: [email protected] (L. Philip). 0043-1354/$ - see front matter r 2004 Elsevier Ltd. All rights reserved. doi:10.1016/j.watres.2003.10.059
-
Upload
independent -
Category
Documents
-
view
4 -
download
0
Transcript of Atrazine degradation in anaerobic environment by a mixed microbial consortium

Water Research 38 (2004) 2277–2284
ARTICLE IN PRESS
*Correspond
E-mail addr
0043-1354/$ - se
doi:10.1016/j.w
Atrazine degradation in anaerobic environment by a mixedmicrobial consortium
Pranab Kumar Ghosha, Ligy Philipb,*aDepartment of Civil Engineering, Vellore Institute of Technology, Vellore, Pin-632 014, India
bDepartment of Civil Engineering, Indian Institute of Technology Madras, Chennai Pin-600 036, India
Received 1 May 2003; accepted 27 October 2003
Abstract
Atrazine degradation by anaerobic mixed culture microorganism in co-metabolic process and in absence of external
carbon and nitrogen source was studied at influent atrazine concentration range of 0.5–15mg/l. Wastewater of desired
characteristic was prepared by the addition of various constituents in distilled water spiked with atrazine. In co-
metabolic process, dextrose of various concentrations (150–2000mg/l) was supplied as external carbon source. The
reactors were operated in sequential batch mode in which 20% of treated effluent was replaced by the same amount of
fresh wastewater everyday, thus maintaining a hydraulic retention time (HRT) equal to 5 days. In co-metabolic process,
40–50% of influent atrazine degradation was observed. First-order atrazine degradation rate (expressed in day�1) was
better in co-metabolic process (5.5� 10�4) than in absence of external carbon source (2.5� 10�5) or carbon and
nitrogen source (1.67� 10�5). In presence of 2000mg/l of dextrose, atrazine degradation was between 8% and 15%
only. Maximum atrazine degradation was observed from wastewater containing 300mg/l of dextrose and 5mg/l of
atrazine. Influent atrazine concentration did not have much effect on the methanogenic bacteria which was clear from
methane gas production and specific methanogenic activity (SMA).
r 2004 Elsevier Ltd. All rights reserved.
Keywords: Atrazine; Anaerobic; Biodegradation; Co-metabolism; Reaction rate; Sequential
1. Introduction
Atrazine (2-chloro-4-ethylamino-6-isopropylamino-s-
triazine), probably the most commonly used herbicide in
the world [1], is quite persistent in neutral environment
and is toxic to various living organisms [2]. Many studies
were carried out so far on the biodegradation of atrazine
in wastewater and bioremediation of atrazine contami-
nated soil [3–6]. Most of these studies employed pure
culture microorganisms except a few by mixed bacterial
culture. Pure culture bacteria used atrazine as sole
source of carbon and/or nitrogen, but degradation was
partial and mineralization happened only in a few cases
[7,8]. Atrazine biodegradation rate and the degree of
ing author.
ess: [email protected] (L. Philip).
e front matter r 2004 Elsevier Ltd. All rights reserve
atres.2003.10.059
degradation depended on the types of pure culture
bacteria, presence and absence of various external
carbon and nitrogen sources and their respective
concentrations, carbon/nitrogen ratio, pH and moisture
content [4–6]. The effects of above said factors on the
rate and degree of atrazine biodegradation are contra-
dictory. Furthermore, handling of pure culture bacteria
in actual field condition is a cumbersome job and
atrazine mineralization in situ condition was almost
non-existent [9]. Mandelbaum et al. [10] observed
mineralization of atrazine, only after mixing a number
of pure culture strains among two hundred isolated
strains.
Earlier studies showed that atrazine was better
degraded in anaerobic conditions than in aerobic one
[11]. Many chlorinated aliphatic and aromatic com-
pounds like Benzene Hexachloride (BHC) and DDT
d.

ARTICLE IN PRESSP.K. Ghosh, L. Philip / Water Research 38 (2004) 2277–22842278
[1,1-dichloro-2,2-bis(p-chlorophenyl ethylene], which
were earlier considered as recalcitrant in aerobic process,
were successfully degraded in anaerobic condition
[12,13]. Literature showed that the aromatic structure
of lignin, benzoate and other aromatic acids were
metabolized to gaseous end products in mixed cultures,
under methanogenic conditions [14]. However, degrada-
tion rate of such compounds by anaerobic mixed
microbial culture was slow, as the energy required for
bacterial growth was not adequate from such toxic
compounds. In such cases, addition of easily biodegrad-
able organic compounds stimulated the growth of
anaerobic bacteria, and thereby enhanced the degrada-
tion rate by utilizing recalcitrant compound as second-
ary substrate in co-metabolic process. Christiansen et al.
[15] had investigated the influence of a supplemental
carbon source on the anaerobic dechlorination of
pentachlorophenol (PCP). Enhanced degradation rate
of atrazine was observed in both aerobic [5] and
anaerobic conditions [4], when external carbon sources
were supplied to pure and mixed bacterial culture.
Struther et al. [5] used citrate and sucrose as external
carbon source whereas Chung et al. [4] used four
different external carbon sources viz., methanol, sodium
acetate, acetic acid and glucose.
The present study explored the potential of anaerobic
microbial consortia to degrade atrazine under various
operating conditions. The effect of atrazine on
the performance of the anaerobic biosystem was
also evaluated in terms of methane production,
specific methanogenic activity (SMA) and COD removal
efficiency.
2. Materials and methods
2.1. Chemicals
All the chemicals used in the present investigation
were of analytical reagent grade (purity>98%). Rallis
India Limited, Mumbai, India, supplied atrazine of
technical grade (purity=98%). Five primary metabo-
lites of atrazine namely hydroxyl atrazine [2-hydroxy-4-
ethylamino-6-isopropylamino-s-triazine] (HA) (pur-
ity=98%), deethyl atrazine [2-chloro-4-amino-6-isopro-
pylamino-s-triazine] (DEA) (purity=99%), deisopropyl
atrazine [2-chloro-4-ethylamino-6-amino-s-triazine]
(DIA) (purity=99%), deethyl deisopropyl atrazine [2-
chloro-4,6-diamino-s-triazine] (DEIA) (purity=99%)
and deethyl deisopropyl hydroxyl atrazine [2-hydroxy-
4,6-diamino-s-triazine] (DEIHA) (purity=99.5%)
were procured from SUPELCO (Sigma Aldrich
Foreign Holding Company, USA). The synthetic waste-
water contained, K2HPO4=150; KH2PO4=50;
MgCl2 � 6H2O=300; CaCl2 � 2H2O=50; NH4Cl=200;
FeCl2 � 4H2O=5; ZnCl2=0.5; NiCl2 � 6H2O=0.5;
CoCl2 � 6H2O=0.5; MnCl2 � 4H2O=0.5 and yeast ex-
tract=50mg/l of distilled water. Dextrose of 150, 300,
500, 1000 and 2000mg/l and atrazine of 1, 5, 10 and
15mg/l were added to water along with the above
micronutrients to prepare specific characteristic waste-
water according to the requirement.
Sludge from an anaerobic digester at Bara Sewage
Treatment Plant, Jamshedpur, India, was used as
inoculum for the present study. The sludge was fed with
wastewater, for a month, to make the system acclima-
tized with the changed environment and was used for
further experiments.
2.2. Analyses
Unless otherwise specified, analyses of various para-
meters were done as per the procedure suggested in
standard methods for the examination of water and
wastewater [16]. Volatile fatty acid (VFA) and alkalinity
were determined as suggested by DiLallo and Albertson
[17]. Activity of sludge was determined as per the
procedure suggested by Valke and Vestrate [18] and
expressed as specific acetoclastic methanogenic activity
(SMA).
Biogas produced in anaerobic process was collected
by liquid displacement method and methane content was
determined by passing the total gas collected through
32% (w/w) KOH solution. Volume change due to
temperature variations was incorporated in the mea-
sured volumes. Periodically the biogas was analyzed in
ORSAT apparatus.
2.3. Atrazine extraction and determination
Atrazine was measured in both UV-Visible spectro-
photometer (Model: UV-160A, Shimadzu, Japan) and
gas chromatograph (GC) (Model: GC 14A, Shimadzu,
Japan). In both the methods, atrazine was extracted
from wastewater by liquid–liquid extraction method.
Dichloromethane or ethyl acetate was used as extractant
in case of UV-Visible spectrophotometer and GC,
respectively.
Ten ml of sample was taken in a 50ml conical
separating funnel after centrifuging for 10min. Five ml
of dichloromethane was added to the solution and
shaken vigorously for 3min. Excess pressure due to
volatilization of dichloromethane was released by open-
ing the bottom outlet keeping upward. The solution was
again shaken for 2min and finally for 1min with
releasing pressure after each shake. The whole content
was allowed to stand quiet to separate the water-
dichloromethane layer. Dichloromethane being heavier
(sp. gr. 1.32) remained in the bottom of the separating
layer. It was allowed to pass through a filter paper
topped with a bed of 2 gm of anhydrous sodium sulfate
kept on glass wool. The filtrate was collected in a 25ml
ARTICLE IN PRESSP.K. Ghosh, L. Philip / Water Research 38 (2004) 2277–2284 2279
volumetric flask. Above procedure was repeated twice,
using 5ml of dichloromethane each time. The collected
volume was adjusted to 10ml using dry nitrogen gas
before measuring the absorbance in UV-Visible spectro-
photometer. The spectra were taken at a range of 220–
250 nm keeping dichloromethane as reference. Max-
imum absorbance was observed at 228.8 nm. Extraction
efficiency of atrazine from water by this method was
9570.52%. Detection limit of atrazine was 0.1mg/l and
up to a concentration of 7.5mg/l, absorbance was linear.
Same procedure was followed for the extraction of
atrazine by ethyl acetate for GC analysis. Atrazine was
extracted from 25ml of wastewater thrice using 5ml of
ethyl acetate each time. Ethyl acetate being lighter than
water (specific gravity=0.9) remained in upper part of
separating funnel. Lower part (i.e. wastewater) of the
content of separating funnel was collected in a 25ml
volumetric flask without filtration, whereas the upper
part (ethyl acetate containing atrazine) was allowed to
pass through a filter paper topped with a bed of 2 gm of
anhydrous sodium sulfate kept on glass wool. Waste-
water portion was again transferred to the same
separating funnel and the procedure was repeated twice
using 5ml of ethyl acetate each time. Final volume was
adjusted to 10ml using dry nitrogen gas before analysis
in GC. Extraction efficiency of atrazine by this process
was 9370.55%. Electron capture detector (ECD,
Radioisotope Nuclide 63Ni) and 1.5% OV-17 column
of 3m length and 18
00internal diameter using pure
nitrogen as carrier gas was used for atrazine determina-
tion in GC. Initial and final column temperature was
210�C, injector temperature was 225�C, and carrier gas
flow was maintained at the rate of 70ml/min. 15ml ofextracted sample was injected into injection port for
atrazine determination. Detection limit of atrazine was
0.5mg.Before each run, instruments were standardized with
anticipated atrazine concentration range. For the
standardization of instrument, atrazine was dissolved
in respective solvents viz., dichloromethane or ethyl
acetate.
To check the build-up of atrazine in anaerobic
biomass, 20–50ml of biomass (as mixed liquor sus-
pended solid, MLSS) sample was centrifuged twice at
4000 rpm for 5min after resuspension in physiological
saline water. Atrazine was extracted three times with
15ml of methanol by agitating for 2 h in a rotary shaker.
Methanol was evaporated using dry nitrogen gas and
residue was redissolved either in dichloromethane of
10ml or in ethyl acetate of 5ml, for the determination of
atrazine in UV-Visible spectrometer or GC, respectively.
2.4. Determination of atrazine metabolites in HPLC
Atrazine metabolites were analyzed in High Perfor-
mance Liquid Chromatograph (HPLC) using Dionex
AD20, UV/VIS detector at a wavelength of 222 nm,
using Dionex Summit P580, HPLC pump. Analysis was
carried out as per the method reported by Chung et al.
[4]. A 20ml sample was collected and centrifuged. Five
ml supernatant was passed through Sep-pak C-18
cartridge (Waterst Sep-Paks, Milford, Massachusetts,
USA). The cartridge was washed by passing 5ml of
deionized water through it. The analytes were eluted
with 2ml methanol. Extraction efficiency by this method
was 98.571%. The analytes were filtered through a
0.20 mm nylon syringe filter. Concentration of
atrazine and its dealkylated metabolites were determined
with a 5mm reversed phase C-18 column (Keystone
Scientific Inc.). The injection volume was 50ml,the column temperature was 40�C, the mobile phase
was programmed to a 5-min gradient, a 20–40%
acetonitrile gradient with water, the flow rate was
1ml/min.
Column used for DEA, DIA and DEIA was C18,
Keystone, 0.5u, 4.6� 150mm2, (col#32). Hydroxy ana-
logue of atrazine was extracted by the above said solid
phase extraction procedure using sep-pak C 18 car-
tridge. Heated extraction method adopted by Chung
et al. [4] was not followed as atrazine hydrolyzed
rapidly at a temperature more than 70�C and at high
and low pH [2]. The mobile phase used a 10-min
gradient, a 100–70% acetonitrile gradient with
water, at a flow rate of 1.5ml/min. Hydroxy analogues
of atrazine (HA and DEIHA) were determined using a
10 mm amino phase column (Bondapak, Waters
Association). Detection limit of metabolites were
10 mg/l. Normalizing peak area method was adopted
for the quantification of various metabolites of atrazine
in HPLC. Atrazine was chosen as the reference
compound.
2.5. Reactors employed for the study
The whole experiment was carried out in anaerobic
suspended growth process at controlled temperature of
3571�C. Four reactors namely, R-0, R-1, R-2 and R-3
were operated to assess the atrazine degradation
potential of anaerobic mixed microbial culture and its
effect on the system at different feeding and operating
conditions. Reactor R-0 and reactor R-1 were operated
in sequential batch mode with a hydraulic retention time
(HRT) of 5 days (described below). Reactor R-0 was
operated as a control reactor fed with the same
strength wastewater as that of reactor R-1 but without
atrazine. Reactor R-2 and R-3 were operated in batch
mode.
Reactor R-1 had a working volume of 4 l and a HRT
of 5 days. Microbial mass in the reactor was maintained
at 4000mg/l expressed as MLSS. The first cycle of
operation of reactor R-1 was carried out with waste-
water containing 150mg/l of dextrose and 0.5mg/l of
ARTICLE IN PRESSP.K. Ghosh, L. Philip / Water Research 38 (2004) 2277–22842280
atrazine along with other nutrients. Next day onwards,
20% of treated effluent was discarded from the reactors,
at an interval of 24 h. and replaced by equal volume of
fresh wastewater. Operation was continued for 5 days to
complete a cycle. Second cycle was started after
discarding the whole supernatant and replacing by equal
amount of same strength wastewater. The reactor was
operated for such 5 consecutive cycles with a particular
strength wastewater. Average value of five cycles of
operation and the standard deviation are given in
Table 1. Next experiment was conducted in a similar
way with the wastewater containing 150mg/l of dextrose
and 1mg/l of atrazine. Reactor R-1 was fed with various
strength wastewaters (containing dextrose of 150–
2000mg/l) spiked with different atrazine concentrations
(0.5–15mg/l).
Reactor R-2 was operated without external carbon
source but with nitrogen supplement as nitrate. Reactor
R-3 was operated without external carbon and nitrogen
source. Both the reactors R-2 and R-3 were operated in
batch mode keeping initial microbial concentration
around 4000mg/l. A control reactor was operated in
batch mode without any biomass to quantify the abiotic
losses of atrazine.
Table 1
Performancea of reactor R-0 and R-1 on COD removal
Initial atrazine in R-1 (mg/l) Influent dextrose concentration
150 (mg/l) 300 (mg/l)
0.5 86.573.1 88.673.5
1 86.173.2 88.373.3
2 85.673.5 88.172.4
5 86.273.1 87.972.6
10 85.673.2 87.172.55
15 8473.4 85.272.4
No atrazine (Reactor R-0) 88.272.2 90.173.8
aPerformance is being expressed as percentage COD reduction. D
operation. Standard deviation is also given along with the value.bENP=Experiment was not performed.
Table 2
Atrazine reduction in co-metabolic process from R-1
Initial atrazine in R-1 (mg/l) Influent dextrose concentration
150 (mg/l) 300 (mg/l
0.5 43.270.18a 4470.17
1 44.270.22 44.870.20
2 44.770.16 46.070.19
5 45.370.23 48.070.18
10 44.270.18 46.870.17
15 43.570.17 44.670.12
aAverage percentage atrazine removal (of initial atrazine concentrabENP=Experiment not performed.
3. Results and discussion
3.1. Atrazine degradation in co-metabolic process
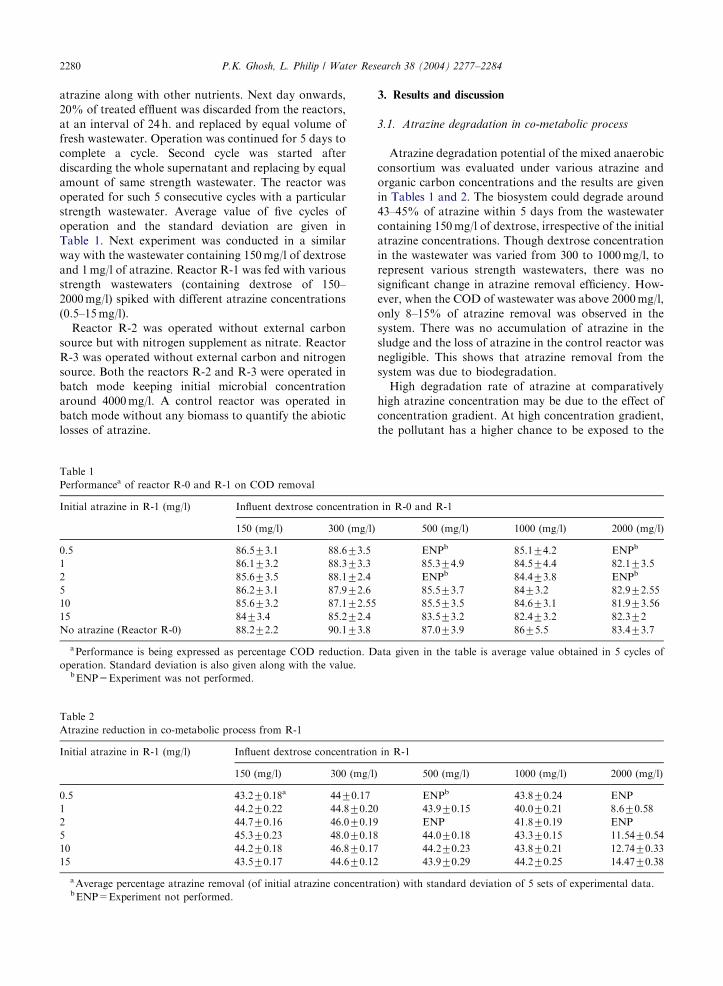
Atrazine degradation potential of the mixed anaerobic
consortium was evaluated under various atrazine and
organic carbon concentrations and the results are given
in Tables 1 and 2. The biosystem could degrade around
43–45% of atrazine within 5 days from the wastewater
containing 150mg/l of dextrose, irrespective of the initial
atrazine concentrations. Though dextrose concentration
in the wastewater was varied from 300 to 1000mg/l, to
represent various strength wastewaters, there was no
significant change in atrazine removal efficiency. How-
ever, when the COD of wastewater was above 2000mg/l,
only 8–15% of atrazine removal was observed in the
system. There was no accumulation of atrazine in the
sludge and the loss of atrazine in the control reactor was
negligible. This shows that atrazine removal from the
system was due to biodegradation.
High degradation rate of atrazine at comparatively
high atrazine concentration may be due to the effect of
concentration gradient. At high concentration gradient,
the pollutant has a higher chance to be exposed to the
in R-0 and R-1
500 (mg/l) 1000 (mg/l) 2000 (mg/l)
ENPb 85.174.2 ENPb
85.374.9 84.574.4 82.173.5
ENPb 84.473.8 ENPb
85.573.7 8473.2 82.972.55
85.573.5 84.673.1 81.973.56
83.573.2 82.473.2 82.372
87.073.9 8675.5 83.473.7
ata given in the table is average value obtained in 5 cycles of
in R-1
) 500 (mg/l) 1000 (mg/l) 2000 (mg/l)
ENPb 43.870.24 ENP
43.970.15 40.070.21 8.670.58
ENP 41.870.19 ENP
44.070.18 43.370.15 11.5470.54
44.270.23 43.870.21 12.7470.33
43.970.29 44.270.25 14.4770.38
tion) with standard deviation of 5 sets of experimental data.
ARTICLE IN PRESS
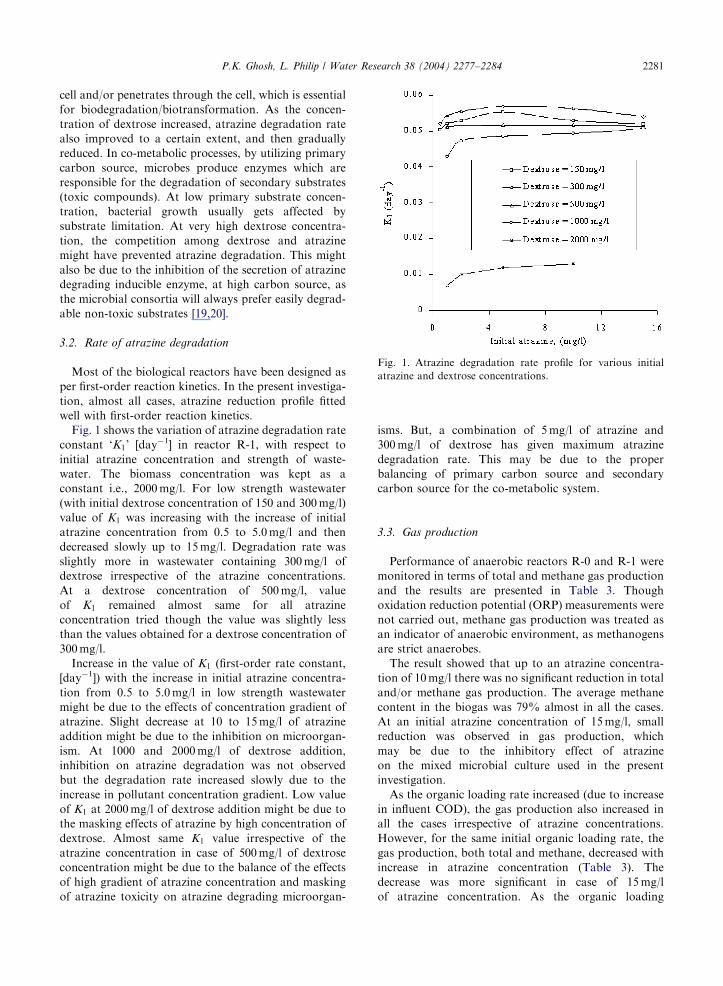
Fig. 1. Atrazine degradation rate profile for various initial
atrazine and dextrose concentrations.
P.K. Ghosh, L. Philip / Water Research 38 (2004) 2277–2284 2281
cell and/or penetrates through the cell, which is essential
for biodegradation/biotransformation. As the concen-
tration of dextrose increased, atrazine degradation rate
also improved to a certain extent, and then gradually
reduced. In co-metabolic processes, by utilizing primary
carbon source, microbes produce enzymes which are
responsible for the degradation of secondary substrates
(toxic compounds). At low primary substrate concen-
tration, bacterial growth usually gets affected by
substrate limitation. At very high dextrose concentra-
tion, the competition among dextrose and atrazine
might have prevented atrazine degradation. This might
also be due to the inhibition of the secretion of atrazine
degrading inducible enzyme, at high carbon source, as
the microbial consortia will always prefer easily degrad-
able non-toxic substrates [19,20].
3.2. Rate of atrazine degradation
Most of the biological reactors have been designed as
per first-order reaction kinetics. In the present investiga-
tion, almost all cases, atrazine reduction profile fitted
well with first-order reaction kinetics.
Fig. 1 shows the variation of atrazine degradation rate
constant ‘K1’ [day�1] in reactor R-1, with respect to
initial atrazine concentration and strength of waste-
water. The biomass concentration was kept as a
constant i.e., 2000mg/l. For low strength wastewater
(with initial dextrose concentration of 150 and 300mg/l)
value of K1 was increasing with the increase of initial
atrazine concentration from 0.5 to 5.0mg/l and then
decreased slowly up to 15mg/l. Degradation rate was
slightly more in wastewater containing 300mg/l of
dextrose irrespective of the atrazine concentrations.
At a dextrose concentration of 500mg/l, value
of K1 remained almost same for all atrazine
concentration tried though the value was slightly less
than the values obtained for a dextrose concentration of
300mg/l.
Increase in the value of K1 (first-order rate constant,
[day�1]) with the increase in initial atrazine concentra-
tion from 0.5 to 5.0mg/l in low strength wastewater
might be due to the effects of concentration gradient of
atrazine. Slight decrease at 10 to 15mg/l of atrazine
addition might be due to the inhibition on microorgan-
ism. At 1000 and 2000mg/l of dextrose addition,
inhibition on atrazine degradation was not observed
but the degradation rate increased slowly due to the
increase in pollutant concentration gradient. Low value
of K1 at 2000mg/l of dextrose addition might be due to
the masking effects of atrazine by high concentration of
dextrose. Almost same K1 value irrespective of the
atrazine concentration in case of 500mg/l of dextrose
concentration might be due to the balance of the effects
of high gradient of atrazine concentration and masking
of atrazine toxicity on atrazine degrading microorgan-
isms. But, a combination of 5mg/l of atrazine and
300mg/l of dextrose has given maximum atrazine
degradation rate. This may be due to the proper
balancing of primary carbon source and secondary
carbon source for the co-metabolic system.
3.3. Gas production
Performance of anaerobic reactors R-0 and R-1 were
monitored in terms of total and methane gas production
and the results are presented in Table 3. Though
oxidation reduction potential (ORP) measurements were
not carried out, methane gas production was treated as
an indicator of anaerobic environment, as methanogens
are strict anaerobes.
The result showed that up to an atrazine concentra-
tion of 10mg/l there was no significant reduction in total
and/or methane gas production. The average methane
content in the biogas was 79% almost in all the cases.
At an initial atrazine concentration of 15mg/l, small
reduction was observed in gas production, which
may be due to the inhibitory effect of atrazine
on the mixed microbial culture used in the present
investigation.
As the organic loading rate increased (due to increase
in influent COD), the gas production also increased in
all the cases irrespective of atrazine concentrations.
However, for the same initial organic loading rate, the
gas production, both total and methane, decreased with
increase in atrazine concentration (Table 3). The
decrease was more significant in case of 15mg/l
of atrazine concentration. As the organic loading

ARTICLE IN PRESS
Table 4
Activity of sludgea of reactor R-0 (without atrazine) and R-1 at
various atrazine concentration
Dextrose (mg/l) Atrazine concentration
0.0 (mg/l)b 0.5(mg/l) 5.0(mg/l) 15.0(mg/l)
150 0.3318 0.3267 0.3166 0.2608
300 0.3495 0.3419 0.3267 0.2760
500 0.3596 0.3545 0.3469 0.2912
1000 0.3672 0.3647 0.3596 0.3242
2000 0.3697 0.3697 0.3545 0.3495
aActivity of sludge expressed as Specific Acetoclastic
Methanogenic Activity (SMA) (Unit=g of CH4-COD/
gMLVSS-day).bColumn shows the SMA of the sludge of the reactor R-0
that was operated without atrazine.
Table 3
Total and methane gas production in reactors R-0 and R-1
Initial
atrazine
(mg/l)
Influent dextrose concentration in wastewater of reactor R-1
150mg/l 300mg/l 500 (mg/l) 1000 (mg/l) 2000 (mg/l)
Total
biogasaCH4 gas
a Total
biogas
CH4 gas Total
biogas
CH4 gas Total
biogas
CH4 gas Total
biogas
CH4 gas
0.5 20079b 16174 239710 18875 ENPc ENP 283712 19375 ENP ENP
1 19678 15575 240712 19074 274713 20276 281713 19378 370715 26078
2 197710 15475 24177 18873 ENP ENP 282712 19274 ENP ENP
5 20379 16373 246711 19275 270713 20076 283713 19375 368713 25977
10 194711 15376 237714 18775 267711 19875 280715 19175 367718 25678
15 18378 14974 22879 17773 251710 18676 278710 18476 366715 25579
Reactor
R-0
209712 17075 250710 19575 279710 20677 325715 23878 370713 26377
aAverage total and methane gas production (ml/g COD reduction at 35�C and atmospheric pressure).bResults shown represent the average of 5 sets of results with standard deviation.cENP=Experiment Not Performed.
P.K. Ghosh, L. Philip / Water Research 38 (2004) 2277–22842282
increased, the methane content of the total biogas was
decreased.
The total gas production per gram of COD reduction
was less for low strength wastewater and increased with
high strength wastewater. This might be due to solubility
of CO2 and CH4 in aqueous phase. Carbon dioxide has a
solubility of 665ml/l whereas methane has only a
solubility of 27.6ml/l of water at 1 atmospheric pressure
and at a temperature of 30�C [21]. As the working
volume of the reactor was constant, the amount of CO2
and CH4 in aqueous phase would be same in all the
cases. For high strength wastewater, the total gas
production was higher, whereas the liquid volume
remained same. Hence, the amount of gas being
solubilized also remained same. Because of this, more
CO2 was available in gaseous phase for high strength
wastewater, which might have lowered the percentage
methane content of the gas.
3.4. Sludge activity
SMA of the sludge from reactors R-0 and R-1 is given
in Table 4. The results showed that SMA of the reactor
sludge R-1, treating low strength wastewater (dextrose
content of 150–300mg/l) containing atrazine up to 5mg/
l was almost same as that of SMA of reactor sludge R-0,
while treating same strength wastewater. A little
reduction of SMA was observed when atrazine concen-
tration in the feed was 15mg/l. But the negative effect of
atrazine on SMA reduced as the dextrose concentration
in the wastewater increased. The values obtained were in
the range of 0.26–0.35 g of CH4-COD/gMLVSS-day for
a dextrose concentration of 150–2000mg/l.
For a good anaerobic sludge, the SMA value should
be in the range of 0.08–0.3 g CH4-COD/g VSS-day. The
SMA value of the sludge was within this range in all the
cases, irrespective of the dextrose and atrazine concen-
tration. SMA slightly increased with increase in influent
COD. This may be due to the masking of the toxic
effects of atrazine by the high concentration of organic
matter. There was a significant reduction in methano-
genic activity when the atrazine concentration was
increased to 15mg/l. This shows that a high atrazine
concentration has an adverse effect on the anaerobic
microbial consortium. Even at this atrazine concentra-
tion, for high strength and very high strength waste-
waters, the inhibition on SMA was insignificant. This
also reinforces the concept of masking effect of organic
matter on atrazine toxicity.

ARTICLE IN PRESS
0
2
4
6
8
10
12
14
16
18
0 20 40 60 80 100 120 140 160
Time, (day)
Atr
azin
e re
mai
ning
(m
g/l)
1 mg/l 1 mg/l (control)5 mg/l 5 mg/l (control)10 mg/l 10 mg/l (control)15 mg/l 15 mg/l (control)
Fig. 3. Kinetics of atrazine degradation in reactor R-3.
P.K. Ghosh, L. Philip / Water Research 38 (2004) 2277–2284 2283
3.5. Degradation of atrazine as sole carbon source/carbon
and nitrogen source
Atrazine degradation studies were carried out by
providing atrazine as sole carbon source (Reactor R-2)
and as sole carbon and nitrogen source (Reactor R-3)
and the results are given in Figs 2 and 3. Although there
was significant atrazine reduction in R-2 (50–60% after
35–100 days) and R-3 (30–45% after 150 days) there was
also a reduction in microbial mass (1–2%) in both the
reactors. Atrazine loss from the ‘‘control reactor’’ was
insignificant and no build up of atrazine in sludge
sample was observed.
Atrazine degradation was more in co-metabolic
process compared to other two cases viz., using atrazine
as sole (a) carbon source, and (b) carbon and nitrogen
source. Moreover, except in co-metabolic processes, the
cell mass in the reactor gradually decreased with respect
to time. This showed that the anaerobic consortia used
in the present investigation might not be comfortable in
using atrazine as the sole carbon and energy (reactor
R-2) as well as nitrogen source (reactor R-3). In absence
of primary substrate, microbial cell mass (cell decay)
might have served as primary carbon source [22]. Again,
for the same percentage of atrazine reduction, time taken
by the microorganism was the maximum in reactor R-3
among all the three reactors (R-1, R-2 and R-3).
The degradation rate of atrazine was far better in case
of co-metabolic process (reactor R-1) than in absence of
external carbon source (reactors R-2 and R-3). Stimula-
tion of the growth of atrazine degraders in presence of
external carbon source (dextrose) in reactor R-1 might
have been the reason for better atrazine reduction [9]. In
addition, it was observed that atrazine degradation rate
Fig. 2. Kinetics of atrazine degradation in reactor R-2.
in R-2 was faster than that in R-3. This might be due to
the difficulty of anaerobic mixed culture microorganisms
in breaking the aromatic ring of the atrazine molecule.
Atrazine degradation pathway also showed that nitro-
gen could be available to the microorganism only after
the ring cleavage. Better degradation of atrazine in R-2
might be due to the availability of nitrogen source.
The major metabolites observed in the effluent of all
the reactors (R-1, R-2 and R-3) were DIA and/or DEA
but only in small amounts (0.1–0.6%). No other primary
metabolite (dealkylated and hydroxy analogue) was
observed in any of the samples of reactor R-1, R-2 and
R-3. Reduction in atrazine concentration observed
might be due to mineralization of atrazine.
4. Conclusion
Atrazine degradation by anaerobic mixed culture
microorganisms was better in co-metabolic process than
in absence of external carbon and nitrogen source. There
was no significant inhibition effect on mixed anaerobic
microbial consortia even at an atrazine concentration of
15mg/l. However, high organic content of the waste-
water reduced the atrazine degradation rate. Atrazine
degradation was dependent on the strength of wastewater
and the amount of atrazine in the influent. Atrazine
concentration in the wastewater did not affect the gas
production or methanogenic activity significantly.
References
[1] Hayes TB, Collins A, Lee M, Mendoza M, Noriega N,
Stuart AA, Vonk A. Hermaphroditic, demasculinized
frogs after exposure to the herbicide atrazine at low
ecologically relevant dose. PANS 2002;99(8):5476–80.
ARTICLE IN PRESSP.K. Ghosh, L. Philip / Water Research 38 (2004) 2277–22842284
[2] Tomlin C. Pesticide Manual, 10th Edition, Crop Protec-
tion Publication, Reprint 1995, British Crop Protection
Council, The Royal Society of Chemistry. 1994.
[3] Behki RM, Khan SU. Degradation of atrazine by
Pseudomonas: N-dealkylation and dehalogenation of
atrazine and its metabolites. J Agric Food Chem
1986;34(4):746–9.
[4] Chung KH, Ro KS, Roy D. Fate the enhancement of
atrazine biotransformation in anaerobic wetland sediment.
Water Res 1996;30(2):341–6.
[5] Struthers JK, Jayachandran K, Moorman TB. Biodegra-
dation of atrazine by Agrobacterium radiobacter J14a and
use of this strain in Bioremediation of contaminated soil.
Appl Environ Microbiol 1998;64:3368–75.
[6] Protzman RS, Lee, Pak-Hing, Ong SK, Moorman TB.
Treatment of formulated atrazine rinsate by Agrobacter-
ium Radiobactor Strain J14a in a sequencing batch biofilm
reactor, Water Res 1999;33(6):1399–404.
[7] Mandelbaum RT, Allan D, Wackett LP. Isolation and
characterization of a Pseudomonas sp. that mineralizes the
s-triazine herbicide atrazine. Appl Environ Microbiol
1995;61:1451–7.
[8] Topp E, Zhu H, Nour SM, Houot S, Lewis M, Cuppels D.
Characterization of an atrazine degrading Pseudomeno-
bactor sp. isolated from Canadian and French Agricultural
soils. Appl Environ Microbiol 2000;66:2773–82.
[9] Kruger EL, Somasundaram RS, Kanwar RS, Coats JR.
Persistance and degradation of [14C] atrazine and [14C]
deisopropylatrazine as affected by soil depth and moisture
conditions. Environ Toxicol Chem 1993;12:1959–67.
[10] Mandelbaum RT, Wackett LP, Allan DL. Mineralization
of the s-triazine ring of atrazine by stable bacterial
mixed cultures. Appl Environ Microbiol 1993;59:
1695–701.
[11] Kearney PC, Kaufman DD, Alexander M. Biochemistry of
herbicide decomposition in soil. In Book: Soil Biochem-
istry. Vol. 1, New York, NY: Marcel Dekker, 1967.
[12] Burge WD. Anaerobic decomposition of DDT in soil.
Acceleration by volatile compounds of alfalfa. J Agric
Food Chem 1971;19:375–8.
[13] Sidderamappa R, Sethunathan N. Persistance of gamma-
BHC and beta-BHC in Indian rice soils under flooded
conditions. Pestic Sci 1975;6:395–403.
[14] Young LY, H.aggblom MM. The anaerobic microbiology
and biodegradation of aeromatic compounds. In: Kamely
D, Chakrabarty A, Omenn GS, editors. Book: Biotechnol-
ogy and Biodegradation. Gulf Publishing Company, 1990.
[15] Christiansen N, Hendriksen HV, J.arvinen KT, Ahring BK.
Degradation of chlorinated aromatic compounds in UASB
reactors. Water Sci Technol 1995;31(1):249–59.
[16] APHA, AWWA, Standard Methods for the Examination
of water and wastewater. 17th Edition. 1989.
[17] DiLallo R, Albertson OE. Volatile acids by direct titration.
J Water Pollut Control Federation 1961;33:356.
[18] Valke D, Vestrate W. A practical method to estimate the
acetoclastic methanogenic biomass in anaerobic sludge. J
Water Pollut Control Federation 1983;55:1191.
[19] Rozich AF, Colvin RJ. Effects of glucose on phenol
biodegradation by heterogeneous population. Biotechnol
Bioeng 1986;XXVIII:965–71.
[20] Crosby DG. Environment toxicology and chemistry.
Oxford: Oxford University Press; 1998.
[21] Lettinga G, Roersma R, Grin D. Anaerobic treatment of
raw domestic sewage at ambient temperatures using a
granular bed UASB reactor. Biotechnol Bioeng 1983;25:
1701–23.
[22] Criddle CS. The kinetics of cometabolism. Biotechnol
Bioeng 1993;41:1048–56.