Repair of Reinforced Concrete Elements using Fiber Reinforced Polymers
Upload
istanbultekCategory
view
3download
0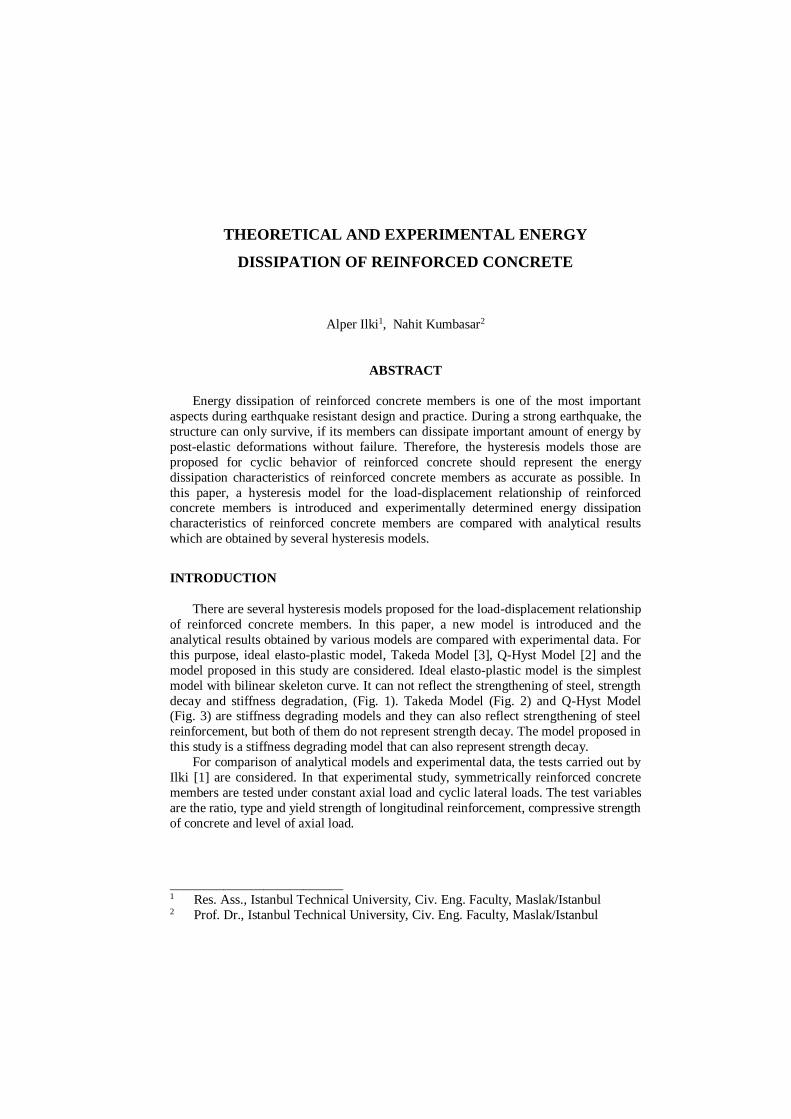
THEORETICAL AND EXPERIMENTAL ENERGY
DISSIPATION OF REINFORCED CONCRETE
Alper Ilki1, Nahit Kumbasar2
ABSTRACT
Energy dissipation of reinforced concrete members is one of the most important
aspects during earthquake resistant design and practice. During a strong earthquake, the
structure can only survive, if its members can dissipate important amount of energy by
post-elastic deformations without failure. Therefore, the hysteresis models those are
proposed for cyclic behavior of reinforced concrete should represent the energy
dissipation characteristics of reinforced concrete members as accurate as possible. In
this paper, a hysteresis model for the load-displacement relationship of reinforced concrete members is introduced and experimentally determined energy dissipation
characteristics of reinforced concrete members are compared with analytical results
which are obtained by several hysteresis models.
INTRODUCTION
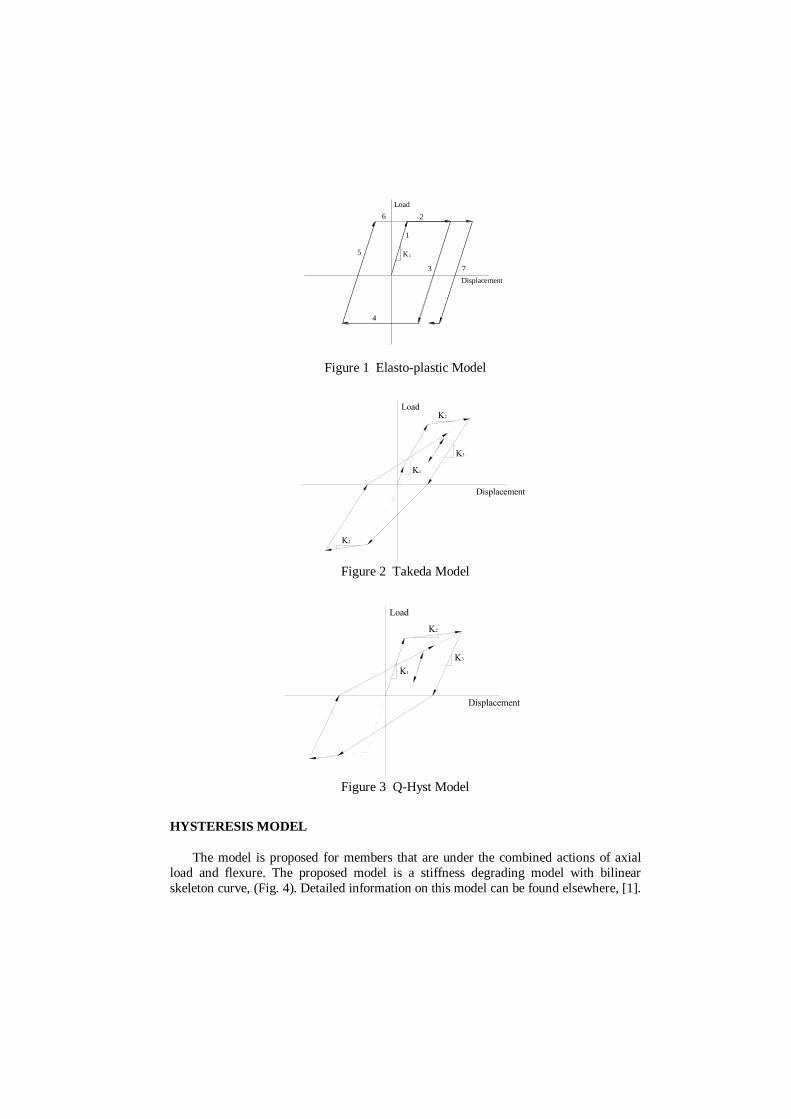
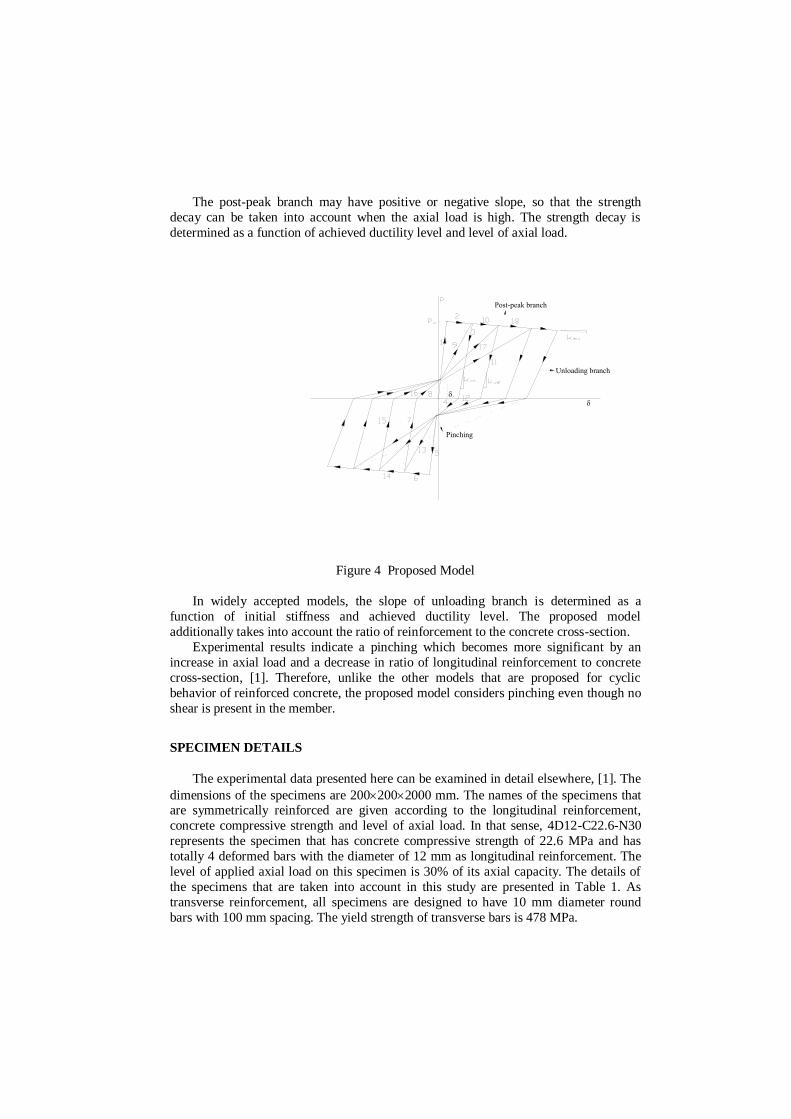
There are several hysteresis models proposed for the load-displacement relationship
of reinforced concrete members. In this paper, a new model is introduced and the
analytical results obtained by various models are compared with experimental data. For
this purpose, ideal elasto-plastic model, Takeda Model [3], Q-Hyst Model [2] and the
model proposed in this study are considered. Ideal elasto-plastic model is the simplest
model with bilinear skeleton curve. It can not reflect the strengthening of steel, strength
decay and stiffness degradation, (Fig. 1). Takeda Model (Fig. 2) and Q-Hyst Model (Fig. 3) are stiffness degrading models and they can also reflect strengthening of steel
reinforcement, but both of them do not represent strength decay. The model proposed in
this study is a stiffness degrading model that can also represent strength decay.
For comparison of analytical models and experimental data, the tests carried out by
Ilki [1] are considered. In that experimental study, symmetrically reinforced concrete
members are tested under constant axial load and cyclic lateral loads. The test variables
are the ratio, type and yield strength of longitudinal reinforcement, compressive strength
of concrete and level of axial load.
__________________________ 1 Res. Ass., Istanbul Technical University, Civ. Eng. Faculty, Maslak/Istanbul 2 Prof. Dr., Istanbul Technical University, Civ. Eng. Faculty, Maslak/Istanbul
1
2
3
4
5
6
7
Load
Displacement
K1
Figure 1 Elasto-plastic Model
Load
Displacement
K1
K2
K2
K3
Figure 2 Takeda Model
Load
Displacement
K1
K2
K3
Figure 3 Q-Hyst Model
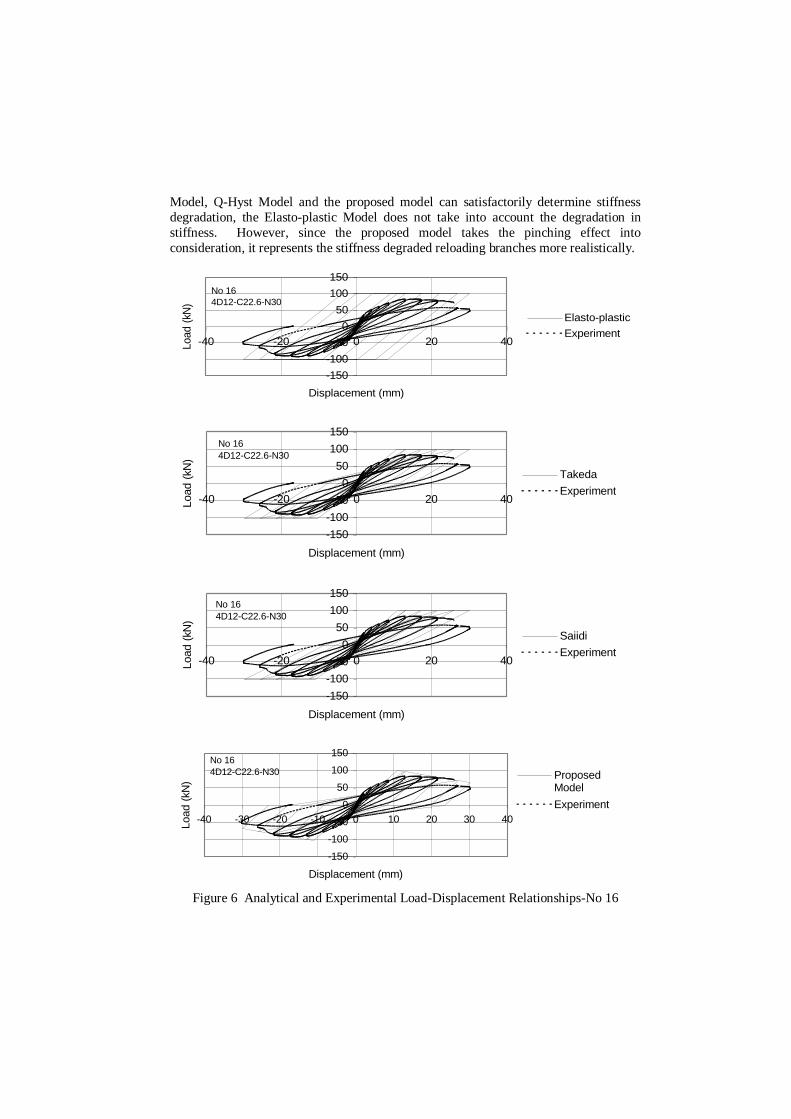
HYSTERESIS MODEL
The model is proposed for members that are under the combined actions of axial
load and flexure. The proposed model is a stiffness degrading model with bilinear
skeleton curve, (Fig. 4). Detailed information on this model can be found elsewhere, [1].
The post-peak branch may have positive or negative slope, so that the strength
decay can be taken into account when the axial load is high. The strength decay is
determined as a function of achieved ductility level and level of axial load.
unun
Post-peak branch
Unloading branch
Pinching
Figure 4 Proposed Model
In widely accepted models, the slope of unloading branch is determined as a
function of initial stiffness and achieved ductility level. The proposed model
additionally takes into account the ratio of reinforcement to the concrete cross-section.
Experimental results indicate a pinching which becomes more significant by an
increase in axial load and a decrease in ratio of longitudinal reinforcement to concrete
cross-section, [1]. Therefore, unlike the other models that are proposed for cyclic
behavior of reinforced concrete, the proposed model considers pinching even though no
shear is present in the member.
SPECIMEN DETAILS
The experimental data presented here can be examined in detail elsewhere, [1]. The
dimensions of the specimens are 2002002000 mm. The names of the specimens that are symmetrically reinforced are given according to the longitudinal reinforcement,
concrete compressive strength and level of axial load. In that sense, 4D12-C22.6-N30
represents the specimen that has concrete compressive strength of 22.6 MPa and has
totally 4 deformed bars with the diameter of 12 mm as longitudinal reinforcement. The
level of applied axial load on this specimen is 30% of its axial capacity. The details of
the specimens that are taken into account in this study are presented in Table 1. As
transverse reinforcement, all specimens are designed to have 10 mm diameter round
bars with 100 mm spacing. The yield strength of transverse bars is 478 MPa.
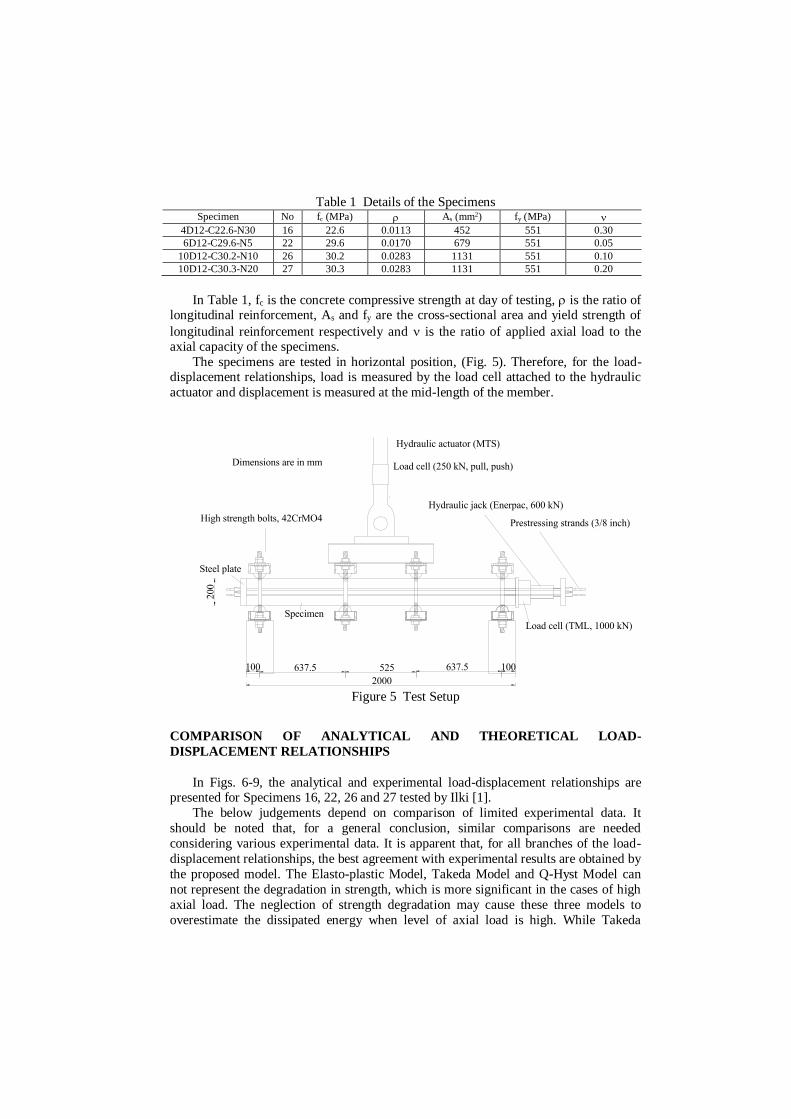
Table 1 Details of the Specimens Specimen No fc (MPa) As (mm2) fy (MPa)
4D12-C22.6-N30 16 22.6 0.0113 452 551 0.30
6D12-C29.6-N5 22 29.6 0.0170 679 551 0.05
10D12-C30.2-N10 26 30.2 0.0283 1131 551 0.10
10D12-C30.3-N20 27 30.3 0.0283 1131 551 0.20
In Table 1, fc is the concrete compressive strength at day of testing, is the ratio of longitudinal reinforcement, As and fy are the cross-sectional area and yield strength of
longitudinal reinforcement respectively and is the ratio of applied axial load to the axial capacity of the specimens.
The specimens are tested in horizontal position, (Fig. 5). Therefore, for the load-displacement relationships, load is measured by the load cell attached to the hydraulic
actuator and displacement is measured at the mid-length of the member.
2000
200
100 637.5 525 637.5 100
Steel plate
Specimen
Load cell (250 kN, pull, push)
Hydraulic actuator (MTS)
Hydraulic jack (Enerpac, 600 kN)
Dimensions are in mm
Load cell (TML, 1000 kN)
High strength bolts, 42CrMO4Prestressing strands (3/8 inch)
Figure 5 Test Setup
COMPARISON OF ANALYTICAL AND THEORETICAL LOAD-
DISPLACEMENT RELATIONSHIPS
In Figs. 6-9, the analytical and experimental load-displacement relationships are presented for Specimens 16, 22, 26 and 27 tested by Ilki [1].
The below judgements depend on comparison of limited experimental data. It
should be noted that, for a general conclusion, similar comparisons are needed
considering various experimental data. It is apparent that, for all branches of the load-
displacement relationships, the best agreement with experimental results are obtained by
the proposed model. The Elasto-plastic Model, Takeda Model and Q-Hyst Model can
not represent the degradation in strength, which is more significant in the cases of high
axial load. The neglection of strength degradation may cause these three models to
overestimate the dissipated energy when level of axial load is high. While Takeda
Model, Q-Hyst Model and the proposed model can satisfactorily determine stiffness
degradation, the Elasto-plastic Model does not take into account the degradation in
stiffness. However, since the proposed model takes the pinching effect into
consideration, it represents the stiffness degraded reloading branches more realistically.
-150
-100
-50
0
50
100
150
-40 -20 0 20 40
Displacement (mm)
Load (
kN)
Elasto-plastic
Experiment
No 16
4D12-C22.6-N30
-150
-100
-50
0
50
100
150
-40 -20 0 20 40
Displacement (mm)
Load (
kN)
Takeda
Experiment
No 16
4D12-C22.6-N30
-150
-100
-50
0
50
100
150
-40 -20 0 20 40
Displacement (mm)
Load (
kN)
Saiidi
Experiment
No 16
4D12-C22.6-N30
-150
-100
-50
0
50
100
150
-40 -30 -20 -10 0 10 20 30 40
Displacement (mm)
Load (
kN
)
ProposedModel
Experiment
No 16
4D12-C22.6-N30
Figure 6 Analytical and Experimental Load-Displacement Relationships-No 16
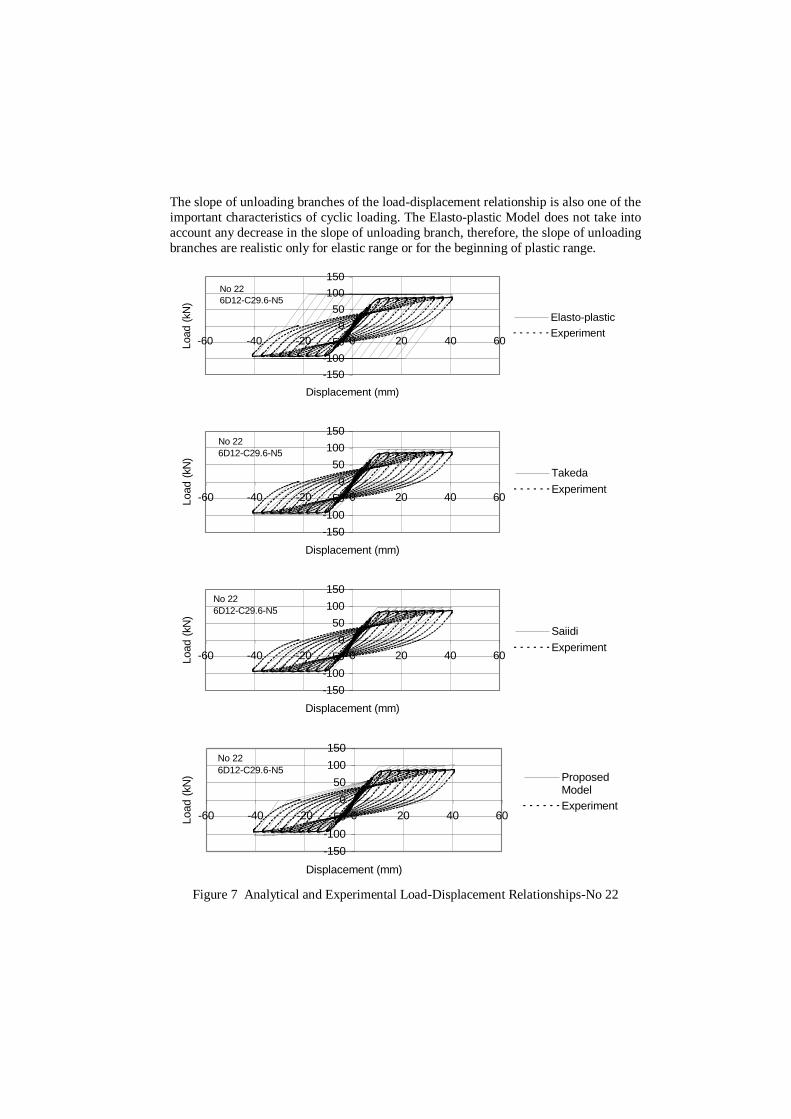
The slope of unloading branches of the load-displacement relationship is also one of the
important characteristics of cyclic loading. The Elasto-plastic Model does not take into
account any decrease in the slope of unloading branch, therefore, the slope of unloading
branches are realistic only for elastic range or for the beginning of plastic range.
-150
-100
-50
0
50
100
150
-60 -40 -20 0 20 40 60
Displacement (mm)
Load (
kN)
Elasto-plastic
Experiment
No 22
6D12-C29.6-N5
-150
-100
-50
0
50
100
150
-60 -40 -20 0 20 40 60
Displacement (mm)
Load (
kN
)
Takeda
Experiment
No 22
6D12-C29.6-N5
-150
-100
-50
0
50
100
150
-60 -40 -20 0 20 40 60
Displacement (mm)
Load (
kN
)
Saiidi
Experiment
No 22
6D12-C29.6-N5
-150
-100
-50
0
50
100
150
-60 -40 -20 0 20 40 60
Displacement (mm)
Load (
kN) Proposed
Model
Experiment
No 22
6D12-C29.6-N5
Figure 7 Analytical and Experimental Load-Displacement Relationships-No 22
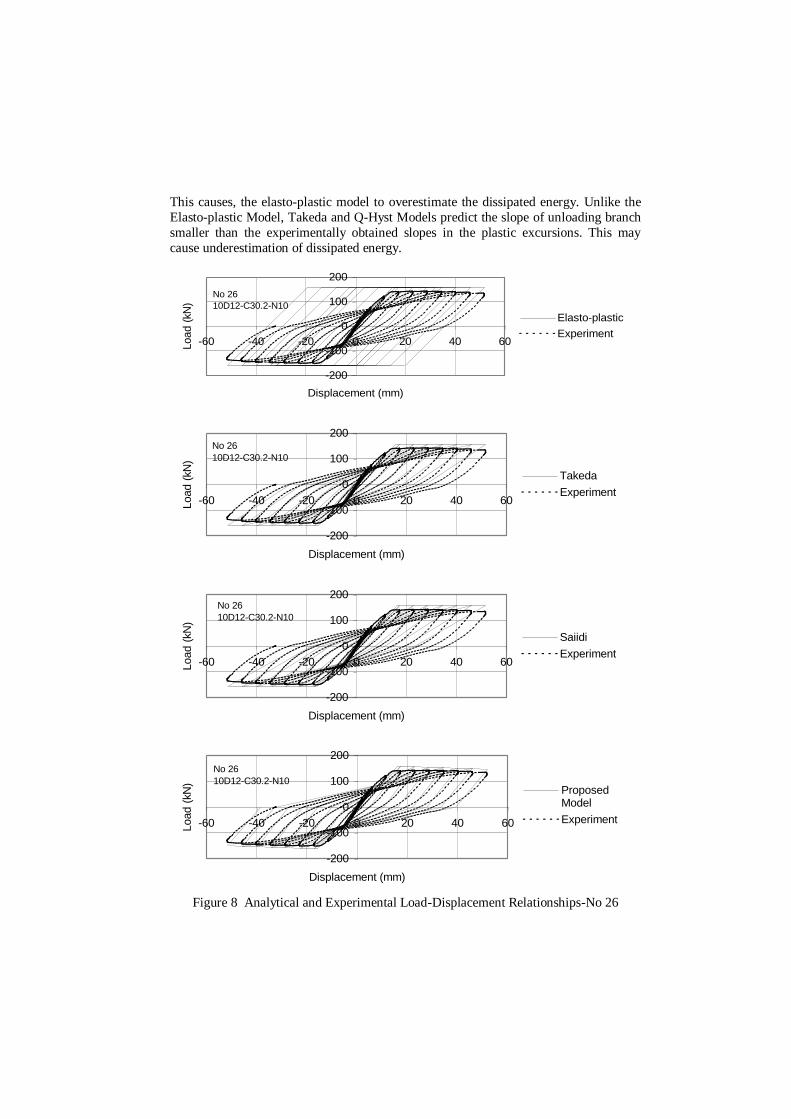
This causes, the elasto-plastic model to overestimate the dissipated energy. Unlike the
Elasto-plastic Model, Takeda and Q-Hyst Models predict the slope of unloading branch
smaller than the experimentally obtained slopes in the plastic excursions. This may
cause underestimation of dissipated energy.
-200
-100
0
100
200
-60 -40 -20 0 20 40 60
Displacement (mm)
Loa
d (
kN)
Elasto-plastic
Experiment
No 26
10D12-C30.2-N10
-200
-100
0
100
200
-60 -40 -20 0 20 40 60
Displacement (mm)
Load (
kN)
Takeda
Experiment
No 26
10D12-C30.2-N10
-200
-100
0
100
200
-60 -40 -20 0 20 40 60
Displacement (mm)
Load (
kN)
Saiidi
Experiment
No 26
10D12-C30.2-N10
-200
-100
0
100
200
-60 -40 -20 0 20 40 60
Displacement (mm)
Load (
kN)
ProposedModel
Experiment
No 26
10D12-C30.2-N10
Figure 8 Analytical and Experimental Load-Displacement Relationships-No 26
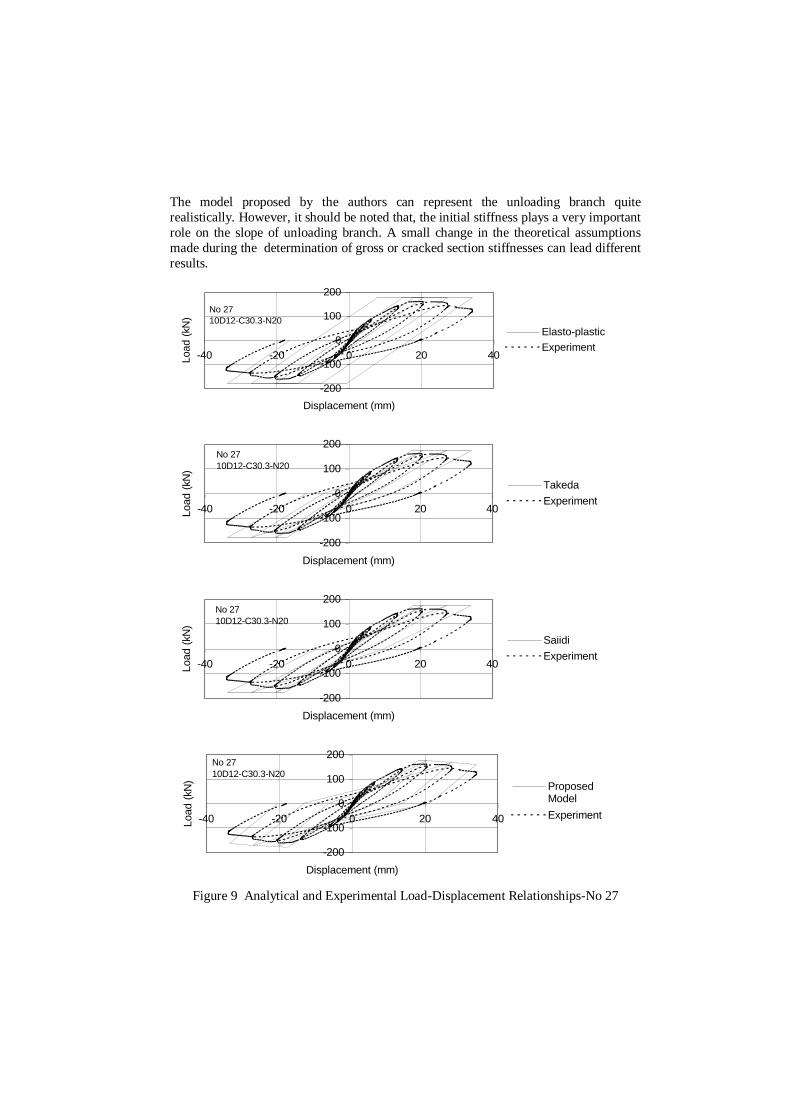
The model proposed by the authors can represent the unloading branch quite
realistically. However, it should be noted that, the initial stiffness plays a very important
role on the slope of unloading branch. A small change in the theoretical assumptions
made during the determination of gross or cracked section stiffnesses can lead different
results.
-200
-100
0
100
200
-40 -20 0 20 40
Displacement (mm)
Loa
d (
kN)
Elasto-plastic
Experiment
No 27
10D12-C30.3-N20
-200
-100
0
100
200
-40 -20 0 20 40
Displacement (mm)
Load (
kN
)
Takeda
Experiment
No 27
10D12-C30.3-N20
-200
-100
0
100
200
-40 -20 0 20 40
Displacement (mm)
Load (
kN
)
Saiidi
Experiment
No 27
10D12-C30.3-N20
-200
-100
0
100
200
-40 -20 0 20 40
Displacement (mm)
Load (
kN
)
ProposedModel
Experiment
No 27
10D12-C30.3-N20
Figure 9 Analytical and Experimental Load-Displacement Relationships-No 27
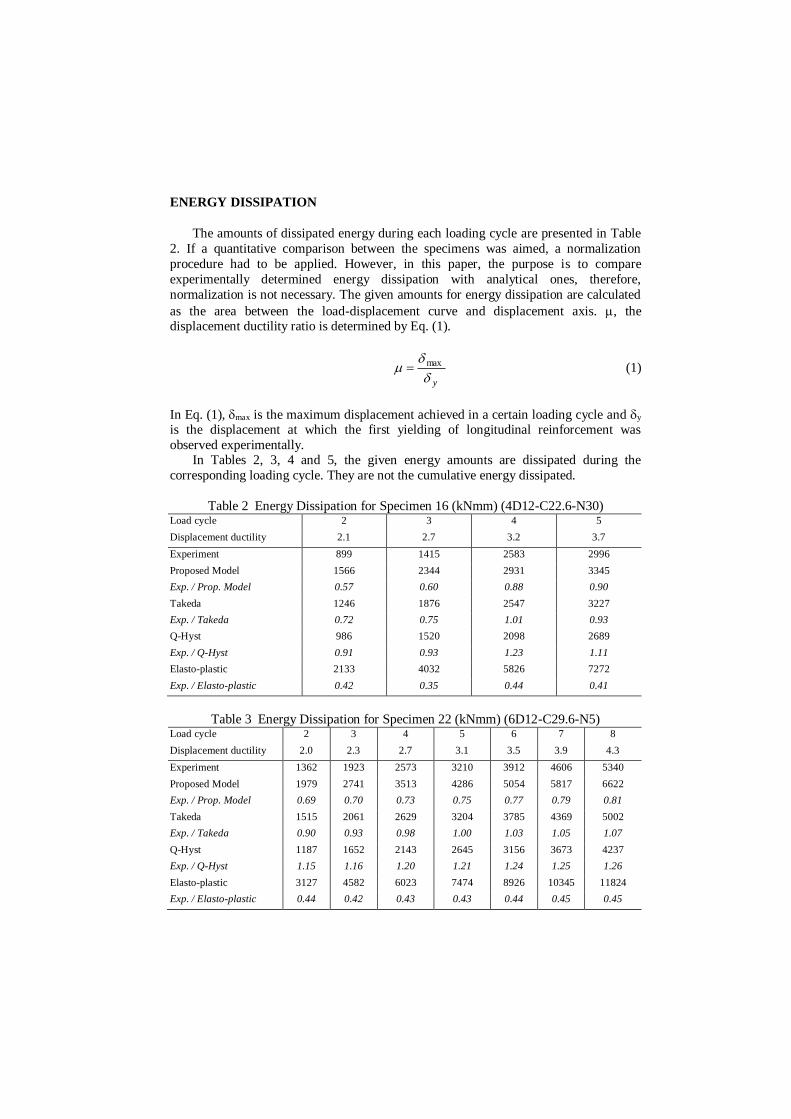
ENERGY DISSIPATION
The amounts of dissipated energy during each loading cycle are presented in Table
2. If a quantitative comparison between the specimens was aimed, a normalization
procedure had to be applied. However, in this paper, the purpose is to compare
experimentally determined energy dissipation with analytical ones, therefore,
normalization is not necessary. The given amounts for energy dissipation are calculated
as the area between the load-displacement curve and displacement axis. , the displacement ductility ratio is determined by Eq. (1).
y
max (1)
In Eq. (1), max is the maximum displacement achieved in a certain loading cycle and y is the displacement at which the first yielding of longitudinal reinforcement was
observed experimentally. In Tables 2, 3, 4 and 5, the given energy amounts are dissipated during the
corresponding loading cycle. They are not the cumulative energy dissipated.
Table 2 Energy Dissipation for Specimen 16 (kNmm) (4D12-C22.6-N30) Load cycle 2 3 4 5
Displacement ductility 2.1 2.7 3.2 3.7
Experiment 899 1415 2583 2996
Proposed Model 1566 2344 2931 3345
Exp. / Prop. Model 0.57 0.60 0.88 0.90
Takeda 1246 1876 2547 3227
Exp. / Takeda 0.72 0.75 1.01 0.93
Q-Hyst 986 1520 2098 2689
Exp. / Q-Hyst 0.91 0.93 1.23 1.11
Elasto-plastic 2133 4032 5826 7272
Exp. / Elasto-plastic 0.42 0.35 0.44 0.41
Table 3 Energy Dissipation for Specimen 22 (kNmm) (6D12-C29.6-N5) Load cycle 2 3 4 5 6 7 8
Displacement ductility 2.0 2.3 2.7 3.1 3.5 3.9 4.3
Experiment 1362 1923 2573 3210 3912 4606 5340
Proposed Model 1979 2741 3513 4286 5054 5817 6622
Exp. / Prop. Model 0.69 0.70 0.73 0.75 0.77 0.79 0.81
Takeda 1515 2061 2629 3204 3785 4369 5002
Exp. / Takeda 0.90 0.93 0.98 1.00 1.03 1.05 1.07
Q-Hyst 1187 1652 2143 2645 3156 3673 4237
Exp. / Q-Hyst 1.15 1.16 1.20 1.21 1.24 1.25 1.26
Elasto-plastic 3127 4582 6023 7474 8926 10345 11824
Exp. / Elasto-plastic 0.44 0.42 0.43 0.43 0.44 0.45 0.45
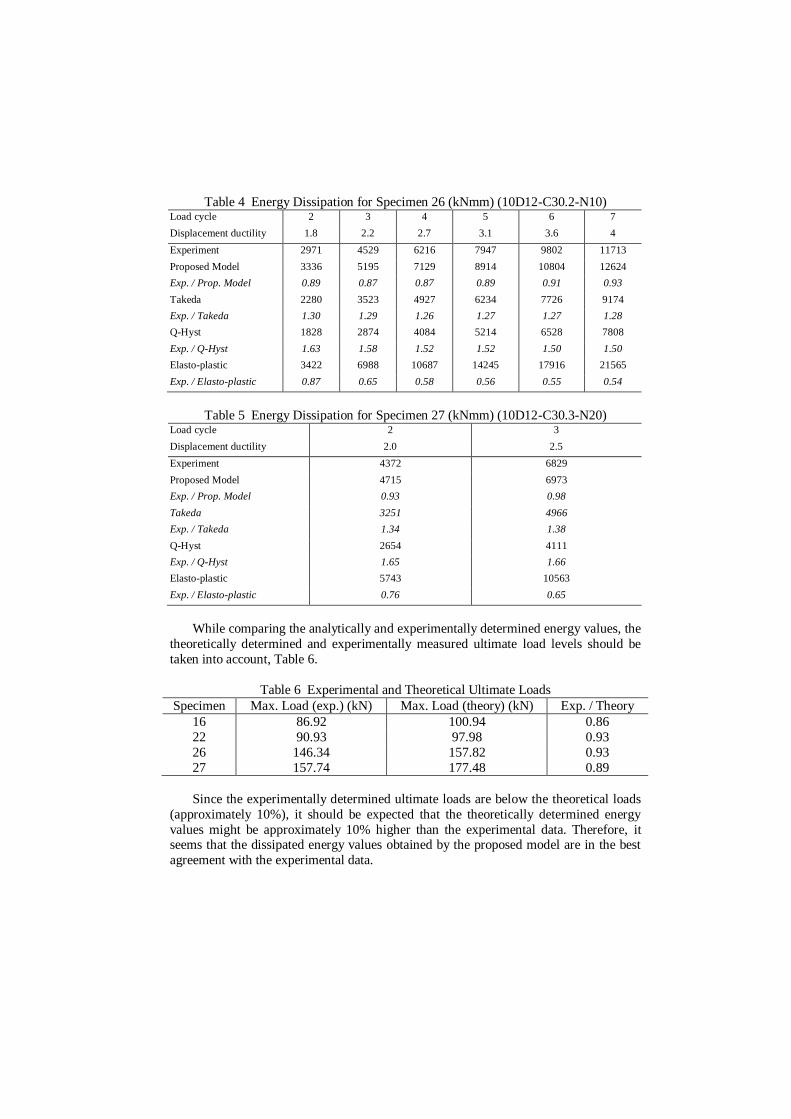
Table 4 Energy Dissipation for Specimen 26 (kNmm) (10D12-C30.2-N10) Load cycle 2 3 4 5 6 7
Displacement ductility 1.8 2.2 2.7 3.1 3.6 4
Experiment 2971 4529 6216 7947 9802 11713
Proposed Model 3336 5195 7129 8914 10804 12624
Exp. / Prop. Model 0.89 0.87 0.87 0.89 0.91 0.93
Takeda 2280 3523 4927 6234 7726 9174
Exp. / Takeda 1.30 1.29 1.26 1.27 1.27 1.28
Q-Hyst 1828 2874 4084 5214 6528 7808
Exp. / Q-Hyst 1.63 1.58 1.52 1.52 1.50 1.50
Elasto-plastic 3422 6988 10687 14245 17916 21565
Exp. / Elasto-plastic 0.87 0.65 0.58 0.56 0.55 0.54
Table 5 Energy Dissipation for Specimen 27 (kNmm) (10D12-C30.3-N20) Load cycle 2 3
Displacement ductility 2.0 2.5
Experiment 4372 6829
Proposed Model 4715 6973
Exp. / Prop. Model 0.93 0.98
Takeda 3251 4966
Exp. / Takeda 1.34 1.38
Q-Hyst 2654 4111
Exp. / Q-Hyst 1.65 1.66
Elasto-plastic 5743 10563
Exp. / Elasto-plastic 0.76 0.65
While comparing the analytically and experimentally determined energy values, the
theoretically determined and experimentally measured ultimate load levels should be
taken into account, Table 6.
Table 6 Experimental and Theoretical Ultimate Loads
Specimen Max. Load (exp.) (kN) Max. Load (theory) (kN) Exp. / Theory
16 86.92 100.94 0.86
22 90.93 97.98 0.93
26 146.34 157.82 0.93
27 157.74 177.48 0.89
Since the experimentally determined ultimate loads are below the theoretical loads
(approximately 10%), it should be expected that the theoretically determined energy
values might be approximately 10% higher than the experimental data. Therefore, it seems that the dissipated energy values obtained by the proposed model are in the best
agreement with the experimental data.
CONCLUSIONS
The conclusions derived in this study are based on limited number of data. For a
more general conclusion, the results should be verified by large number of data.
It is apparent that, among four different models, the best aggreement with
experimental load-displacement data is obtained by proposed model, (Figs. 6-9, Tables
2-6).
The elasto-plastic model can not represent load-displacement relationships
realistically, since it does not take into account stiffness degradation and strength decay. Both Takeda and Q-Hyst Models represent load-displacement relationship
satisfactorily. However, exclusion of strength decay leads to less realistic
representation.
When only the energy dissipation of Specimens 16 and 22 are considered (Tables 2-
3), it can be concluded that Takeda Model is in the best agreement with experimental
data. However it seems that, this is not because this model represents the load-
displacement relationship better than the proposed model. The model overestimates
dissipated energy because of not considering strength decay and underestimates
dissipated energy because of lower slopes of unloading branches than the experimental
slopes, (Figs. 6 and 7). As a result of these, although the load-displacement relationships
are not represented as realistic as the proposed model, the energy values obtained by
this model seem to be close to experimentally determined values fictitiously.
ACKNOWLEDGMENTS
This study is a part of the Ph.D. Thesis carried out by A. Ilki under the supervision of Prof.Dr. N. Kumbasar.
The experimental part of the study is financially supported by Turkish Science Council (INTAG-559) and
Istanbul Technical University Research Fund (Grant No : 920). The supports of Maya and Gok Construction
Companies are also acknowledged.
REFERENCES
[1] Ilki, A., (1999), Nonlinear Behavior of Reinforced Concrete Members Subjected to Reversed Cyclic Loads, Ph.D. Thesis (supervised by Prof.Dr. N.
Kumbasar) submitted to Istanbul Technical University.
[2] Saiidi, M., (1982), Hysteresis Models for Reinforced Concrete, ASCE Journal
of the Structural Division, V. 108, No. ST5, 1077-1087.
[3] Takeda, T., Sozen, M.A. and Nielsen N.N., (1970), Reinforced Concrete
Response to Simulated Earthquakes, ASCE Journal of the Structural Division,
V. 96, No. ST12, 2557-2573.
Copyright © 2022 FDOKUMEN