Analytical Modeling of Concrete Beams Reinforced with Carbon FRP Bars
Upload
independentCategory
view
1download
0
ORIGINAL ARTICLE
Glulam beams reinforced with FRP externally-bonded:theoretical and experimental evaluation
Juliano Fiorelli • Antonio Alves Dias
Received: 8 March 2010 / Accepted: 28 January 2011 / Published online: 11 February 2011
� RILEM 2011
Abstract The glued- laminated lumber (glulam)
technique is an efficient process for the rational use of
wood. Fiber-reinforced polymer (FRPs) associated
with glulam beams provide significant improvements
in strength and stiffness and alter the failure mode of
these structural elements. In this context, this paper
presents guidance for glulam beam production, an
experimental analysis of glulam beams made of Pinus
caribea var. hondurensis species without and with
externally-bonded FRP and theoretical models to
evaluate reinforced glulam beams (bending strength
and stiffness). Concerning the bending strength of the
beams, this paper aims only to analyze the limit state
of ultimate strength in compression and tension. A
specific disposal was used in order to avoid lateral
buckling, once the tested beams have a higher ratio
height-to-width. The results indicate the need of
production control so as to guarantee a higher
efficiency of the glulam beams. The FRP introduced
in the tensile section of glulam beams resulted in
improvements on their bending strength and stiffness
due to the reinforcement thickness increase. During
the beams testing, two failure stages were observed.
The first was a tensile failure on the sheet positioned
under the reinforcement layer, while the second
occurred as a result of a preliminary compression
yielding on the upper side of the lumber, followed by
both a shear failure on the fiber-lumber interface and a
tensile failure in wood. The model shows a good
correlation between the experimental and estimated
results.
Keywords Glulam � FRP � Reinforcement
1 Introduction
When applied to structural elements, the term glued-
laminated lumber (glulam) refers to the material
produced by gluing the edges and faces of wood
sheets along with the wood grain parallel to the axis
of the piece. Long sheets are obtained by joining
boards together longitudinally, gluing them face to
face and edge to edge to obtain the desired height and
width. The sheets can also be bent to produce a
curved shape during the gluing. All these factors
provide a wide variety of design choices, subjected
only to production and/or application cost constraints.
The use of FRP to reinforce beams not only
ensures improvements in the structural strength and
J. Fiorelli (&)
Sao Paulo University—USP, Pirassununga,
Av. Duque de Caxias Norte, 225,
CEP:13635-900 Pirassununga, SP, Brazil
e-mail: [email protected]
A. A. Dias
Sao Carlos School of Engineering—USP,
Av. Trabalhador Saocarlense, 400, Sao Carlos,
SP, Brazil
Materials and Structures (2011) 44:1431–1440
DOI 10.1617/s11527-011-9708-y
stiffness of the element, but also alters its failure
mode. Fiber reinforced polymers (FRP) are formed
from the linking of fibers to a adhesive, making a
composite which presents mechanical properties of
strength and stiffness higher than from each material
by itself. According to Norris and Saadatmanesh [1],
the fibers are responsible for the strength of the
composite, while the adhesive is responsible for the
stress transmissions.
Dagher [2] studied the reinforcement of glulam
beams with carbon fiber blades (1.5 mm thick),
aiming to evaluate the load capacity of these elements.
The fiber provided a better structural behavior to the
parts, leading to a broader use in civil engineering
applications. The carbon fiber blades were applied in
the bottom glue layer on the tensioned section,
resulting in strength increases. For the beams rein-
forced at 1.1% of their height, it was observed a 25%
increase in their load capacity, whereas for those
reinforced at 3.3%, a 60% increase was observed.
Fiorelli and Dias [3] presented a deterministic
model to calculate the stiffness and strength of fiber-
reinforced solid lumber beams. The stiffness was based
on the ‘‘transformed-section’’ analysis. When calcu-
lating the failure mode, the model considers compres-
sive failure of the upper fibers or tensile failure of the
lower fibers. To evaluate the ultimate moment, the
model considers the ultimate tensile and compressive
strength of the lumber. This model is based on the
Navier/Bernoulli hypothesis (plane sections remain
plane after straining). A comparison between the
experimental and estimated results demonstrated very
similar values for bending strength and stiffness.
Triantafillou and Deskovic [4] evaluated the
strength of solid wood beams reinforced with unidi-
rectional carbon fibers fixed with epoxy adhesive. It
was used a reinforcement varying from 0.55 to
0.75 mm thick, which resulted in a 20–40% increase
in the load capacity, respectively.
Lindyberg [5] evaluated 96 glulam beams with
dimensions of 13 9 30 9 670 cm, made of Western
Hemlock Lamstock and Douglas-fir, reinforced with
fiberglass at 1.1 and 3.3% of its height. The fiber was
applied to the last line of glue in the tensioned
section. The bending test was performed according to
ASTM D 198-96 Standard Test Methods of Static
Tests of Lumber in Structural Sizes. The author
pointed that the reinforcement above 3.3% is not
economically feasible since the increase in strength
and stiffness does not justify the investment.
Romani and Blab [6] present a model for design-
ing MLC fiber-reinforced beams, containing different
failure modes for the reinforced MLC beams. There
were assumed constant modulus of elasticity and
strength in tension and compression parallel to the
grain, as well as a linear elastic–plastic ideal behav-
iour. The authors state that the proposed model is
quite conservative, once the theoretical values were
up to 35% lower than the experimental ones. For the
theoretical calculation of the stiffness, the authors
used the transformed section method. Comparing
these results to those obtained experimentally, a good
agreement between these values could be noticed,
with variations of 5%, approximately.
Bergmeister and Luggin [7] studied carbon fiber-
reinforced glulam beams. During the trials, they
observed two stages of failure. The first was a tensile
failure on the sheet positioned under the reinforce-
ment layer, while the second consisted on a combi-
nation of compressive and shear failure.
Tingley and Kent [8] evaluated timber box beams
reinforced with aramid fibers. These fibers presented
modulus of elasticity of 59,000 MPa and tensile
strength exceeding 1,034 MPa. As a result, it was
observed a 21.5% increase in strength and 4.69%
increase in stiffness, compared to the results obtained
for beams without reinforcement. A compressive
failure occurred on the upper fibers of the reinforced
beams, after a large plastic deformation. On the other
hand, a tensile failure was observed for those with no
reinforcement.
Yahyaei-Moayyed and Taheri [9] present a study
about wooden beams reinforced with aramid fiber-
reinforced polymer (AFRP) composites. An extensive
experimental program was carried out to characterize
the creep response of both plain southern yellow pine
(SYP) and Douglas-fir (DF) wood species and
unidirectional aramid fiber-reinforced polymer
(AFRP) composites. AFRP reinforcement was suc-
cessfully used for flexural strengthening of timbers,
the maximum load-carrying capacity of reinforced
timber was dominant with the shear capacity of the
AFRP layer/wood bond interface, the flexural
strength of SYP and DF species were improved by
an average amount of 74 and 31%, respectively, and
the stiffness was increased by approximately 20 and
1432 Materials and Structures (2011) 44:1431–1440
11%. Additionally, a more desirable compressive
failure was observed, especially in DF woods.
On this context, the objective of this work is to
present a glulam beam fabrication method, a theo-
retical model to evaluate reinforced glulam beams
and an experimental analysis of timber beams made
of Pinus caribea var. hondurensis species without
and with FRP.
2 Glulam beam fabrication method
The beams were produced with Pinus caribaea var.
hondurensis wood with a mean density of 0.54 g/cm3
and mean moisture content of around 12%. The
boards were graded visually, following the Southern
Pine Inspection Bureau (SPIB) recommendations
[10] and subsequently submitted to a mechanical
classification, where the modulus of elasticity for
each lumber was determined. Lumbers of better
quality (fewer defects and higher elasticity modulus)
were placed on the region of maximum compressive
and tensile stress, according to the American Ply-
wood Association [11]. Finger-joints were used for
gluing the sheets according to DIN 68 140/1971 [12].
A phenol–resorcinol adhesive was used to glue the
beams, which were then submitted to pressures
ranging from 0.8 MPa to 1.0 MPa for 12 h, as well
as temperatures under 20�C and a 65% relative
humidity. Afterwards, the Glulam Fiber Reinforced
Polymer (GFRP) reinforcement was applied, using
epoxy adhesive AR-300. A lumber sheet was placed
under the reinforcement, not only to obtain fire
protection but also a better esthetic result.
3 Theoretical models
The theoretical models presented here refer to the
bending stiffness and strength of the glulam beams
concerning failure by tension and compression,
without considering lateral buckling.
3.1 Bending stiffness
Considering the linear range of stress–strain, the
bending stiffness of the beam (EI) can be calculated
through the transformed section method (Eq. 1),
using the beam width (b), and the properties of each
lumber sheet: their modulus of elasticity (Ei), thick-
ness (hi) and distance from the centre of the sheet to
the neutral axis (di):
EI ¼X Eibh3
i
12þ Eibhid
2i
� �ð1Þ
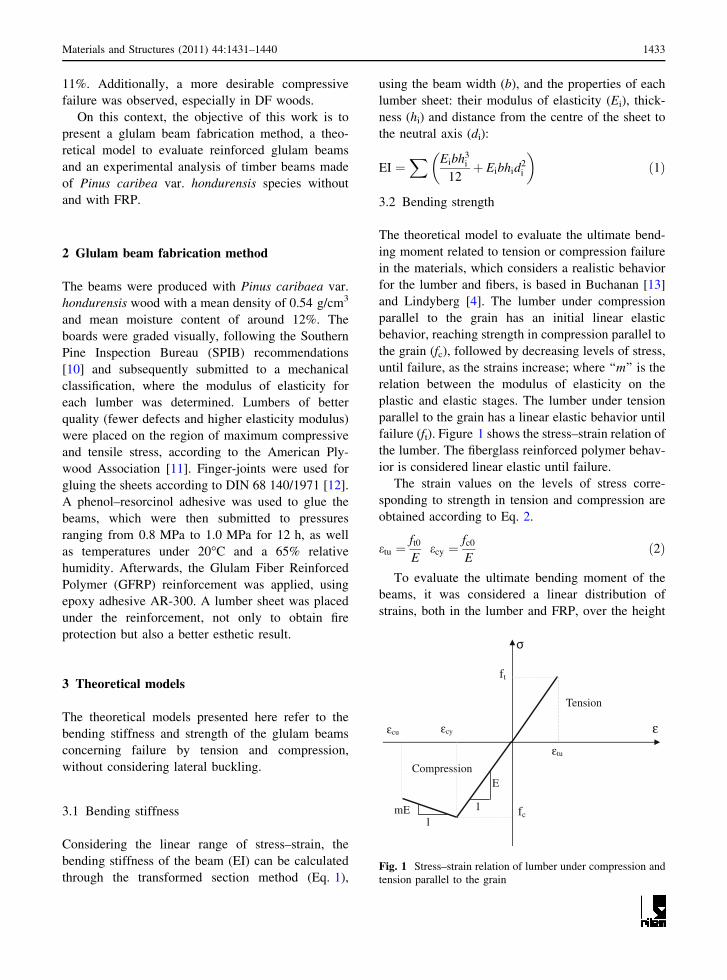
3.2 Bending strength
The theoretical model to evaluate the ultimate bend-
ing moment related to tension or compression failure
in the materials, which considers a realistic behavior
for the lumber and fibers, is based in Buchanan [13]
and Lindyberg [4]. The lumber under compression
parallel to the grain has an initial linear elastic
behavior, reaching strength in compression parallel to
the grain (fc), followed by decreasing levels of stress,
until failure, as the strains increase; where ‘‘m’’ is the
relation between the modulus of elasticity on the
plastic and elastic stages. The lumber under tension
parallel to the grain has a linear elastic behavior until
failure (ft). Figure 1 shows the stress–strain relation of
the lumber. The fiberglass reinforced polymer behav-
ior is considered linear elastic until failure.
The strain values on the levels of stress corre-
sponding to strength in tension and compression are
obtained according to Eq. 2.
etu ¼ft0
Eecy ¼
fc0
Eð2Þ
To evaluate the ultimate bending moment of the
beams, it was considered a linear distribution of
strains, both in the lumber and FRP, over the height
Compression
mE 1 1
E
εtu
ε
Tension
ft
εcy εcu
fc
Fig. 1 Stress–strain relation of lumber under compression and
tension parallel to the grain
Materials and Structures (2011) 44:1431–1440 1433
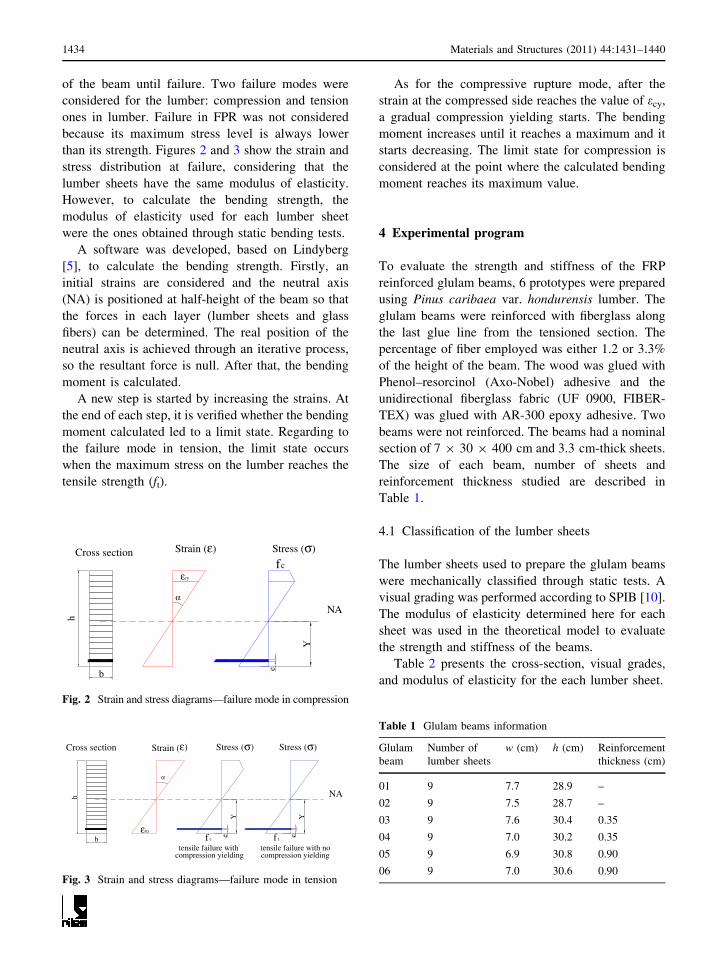
of the beam until failure. Two failure modes were
considered for the lumber: compression and tension
ones in lumber. Failure in FPR was not considered
because its maximum stress level is always lower
than its strength. Figures 2 and 3 show the strain and
stress distribution at failure, considering that the
lumber sheets have the same modulus of elasticity.
However, to calculate the bending strength, the
modulus of elasticity used for each lumber sheet
were the ones obtained through static bending tests.
A software was developed, based on Lindyberg
[5], to calculate the bending strength. Firstly, an
initial strains are considered and the neutral axis
(NA) is positioned at half-height of the beam so that
the forces in each layer (lumber sheets and glass
fibers) can be determined. The real position of the
neutral axis is achieved through an iterative process,
so the resultant force is null. After that, the bending
moment is calculated.
A new step is started by increasing the strains. At
the end of each step, it is verified whether the bending
moment calculated led to a limit state. Regarding to
the failure mode in tension, the limit state occurs
when the maximum stress on the lumber reaches the
tensile strength (ft).
As for the compressive rupture mode, after the
strain at the compressed side reaches the value of ecy,
a gradual compression yielding starts. The bending
moment increases until it reaches a maximum and it
starts decreasing. The limit state for compression is
considered at the point where the calculated bending
moment reaches its maximum value.
4 Experimental program
To evaluate the strength and stiffness of the FRP
reinforced glulam beams, 6 prototypes were prepared
using Pinus caribaea var. hondurensis lumber. The
glulam beams were reinforced with fiberglass along
the last glue line from the tensioned section. The
percentage of fiber employed was either 1.2 or 3.3%
of the height of the beam. The wood was glued with
Phenol–resorcinol (Axo-Nobel) adhesive and the
unidirectional fiberglass fabric (UF 0900, FIBER-
TEX) was glued with AR-300 epoxy adhesive. Two
beams were not reinforced. The beams had a nominal
section of 7 9 30 9 400 cm and 3.3 cm-thick sheets.
The size of each beam, number of sheets and
reinforcement thickness studied are described in
Table 1.
4.1 Classification of the lumber sheets
The lumber sheets used to prepare the glulam beams
were mechanically classified through static tests. A
visual grading was performed according to SPIB [10].
The modulus of elasticity determined here for each
sheet was used in the theoretical model to evaluate
the strength and stiffness of the beams.
Table 2 presents the cross-section, visual grades,
and modulus of elasticity for the each lumber sheet.
h
b
Y
e
εcy
fc
α
Strain (ε) Stress (σ)
NA
Cross section
Fig. 2 Strain and stress diagrams—failure mode in compression
f tf tb
h
εtu
YYe e
α
tensile failure with compression yielding
tensile failure with no compression yielding
Strain (ε) Stress (σ) Stress (σ)
NA
Cross section
Fig. 3 Strain and stress diagrams—failure mode in tension
Table 1 Glulam beams information
Glulam
beam
Number of
lumber sheets
w (cm) h (cm) Reinforcement
thickness (cm)
01 9 7.7 28.9 –
02 9 7.5 28.7 –
03 9 7.6 30.4 0.35
04 9 7.0 30.2 0.35
05 9 6.9 30.8 0.90
06 9 7.0 30.6 0.90
1434 Materials and Structures (2011) 44:1431–1440
4.2 Characterization of the fiberglass
The mechanical properties of strength and stiffness
(Table 3) of the fiberglass were determined according
to ASTM D 3039-95 [14] Standard Test Method for
Tensile Properties of Polymer Matrix Composite
Material, of the American Society for Testing and
Materials.
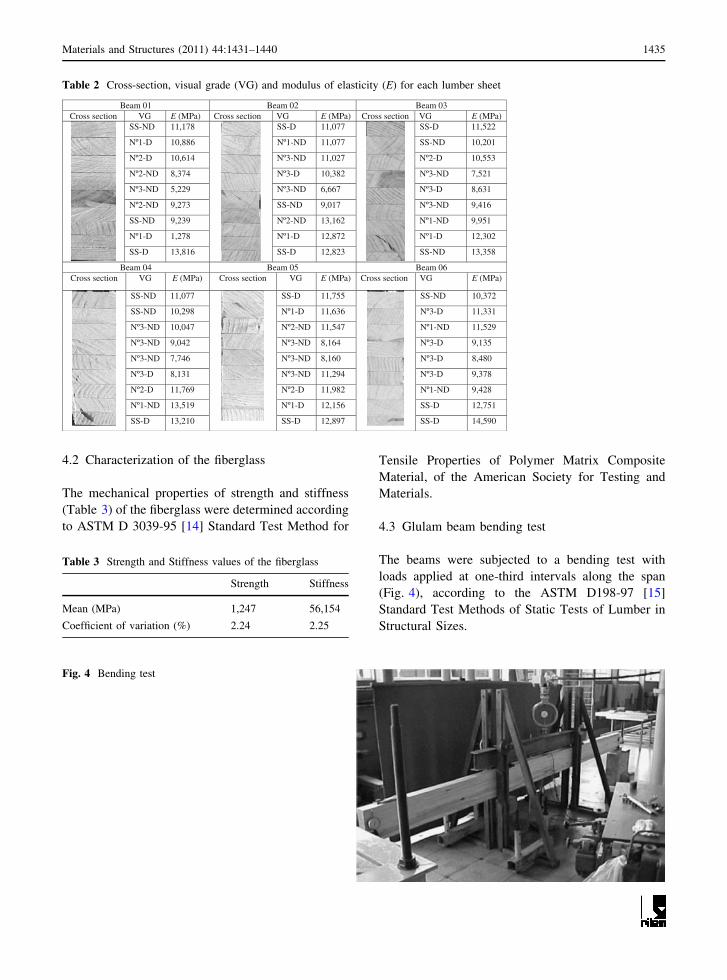
4.3 Glulam beam bending test
The beams were subjected to a bending test with
loads applied at one-third intervals along the span
(Fig. 4), according to the ASTM D198-97 [15]
Standard Test Methods of Static Tests of Lumber in
Structural Sizes.
Table 2 Cross-section, visual grade (VG) and modulus of elasticity (E) for each lumber sheet
30 maeB 20 maeB 10 maeBCross section VG E (MPa) Cross section VG E (MPa) Cross section VG E (MPa)
SS-ND 11,178 SS-D 11,077
SS-D 11,522
Nº1-D 10,886 Nº1-ND 11,077 SS-ND 10,201
Nº2-D 10,614 Nº3-ND 11,027 Nº2-D 10,553
Nº2-ND 8,374 Nº3-D 10,382 Nº3-ND 7,521
Nº3-ND 5,229 Nº3-ND 6,667 Nº3-D 8,631
Nº2-ND 9,273 SS-ND 9,017 Nº3-ND 9,416
SS-ND 9,239 Nº2-ND 13,162 Nº1-ND 9,951
Nº1-D 1,278 Nº1-D 12,872 Nº1-D 12,302
SS-D 13,816 SS-D 12,823 SS-ND 13,358
60 maeB 50 maeB 40 maeBCross section VG E (MPa) Cross section VG E (MPa) Cross section VG E (MPa)
SS-ND 11,077
SS-D 11,755
SS-ND 10,372
SS-ND 10,298 Nº1-D 11,636 Nº3-D 11,331
Nº3-ND 10,047 Nº2-ND 11,547 Nº1-ND 11,529
531,9 D-3ºN 461,8 DN-3ºN 240,9 DN-3ºN
084,8 D-3ºN 061,8 DN-3ºN 647,7 DN-3ºN
873,9 D-3ºN 492,11 DN-3ºN 131,8 D-3ºN
Nº2-D 11,769 Nº2-D 11,982 Nº1-ND 9,428
Nº1-ND 13,519 Nº1-D 12,156 SS-D 12,751
SS-D 13,210 SS-D 12,897 SS-D 14,590
Table 3 Strength and Stiffness values of the fiberglass
Strength Stiffness
Mean (MPa) 1,247 56,154
Coefficient of variation (%) 2.24 2.25
Fig. 4 Bending test
Materials and Structures (2011) 44:1431–1440 1435
The displacement was measured in the central
region of the beam with a dial indicator. The loading
speed was 10 MPa per minute, considering the
maximum stress. A specific disposal was used in
the load points in order to avoid lateral buckling,
once the tested beams have a higher ratio height-to-
width.
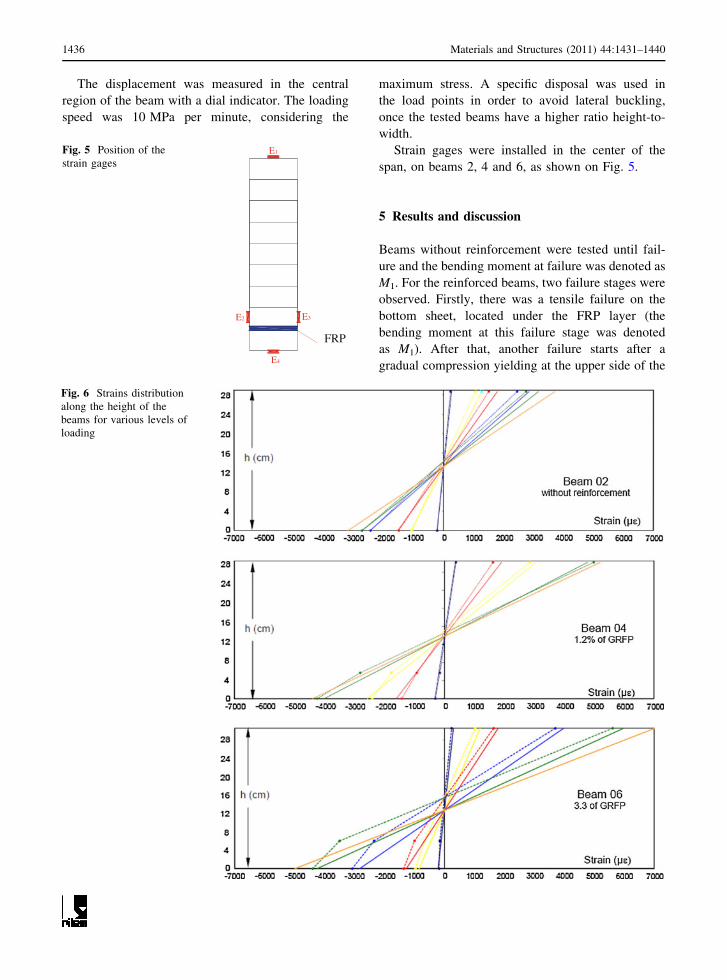
Strain gages were installed in the center of the
span, on beams 2, 4 and 6, as shown on Fig. 5.
5 Results and discussion
Beams without reinforcement were tested until fail-
ure and the bending moment at failure was denoted as
M1. For the reinforced beams, two failure stages were
observed. Firstly, there was a tensile failure on the
bottom sheet, located under the FRP layer (the
bending moment at this failure stage was denoted
as M1). After that, another failure starts after a
gradual compression yielding at the upper side of the
E2 E3
E1
E4
FRP
Fig. 5 Position of the
strain gages
Fig. 6 Strains distribution
along the height of the
beams for various levels of
loading
1436 Materials and Structures (2011) 44:1431–1440
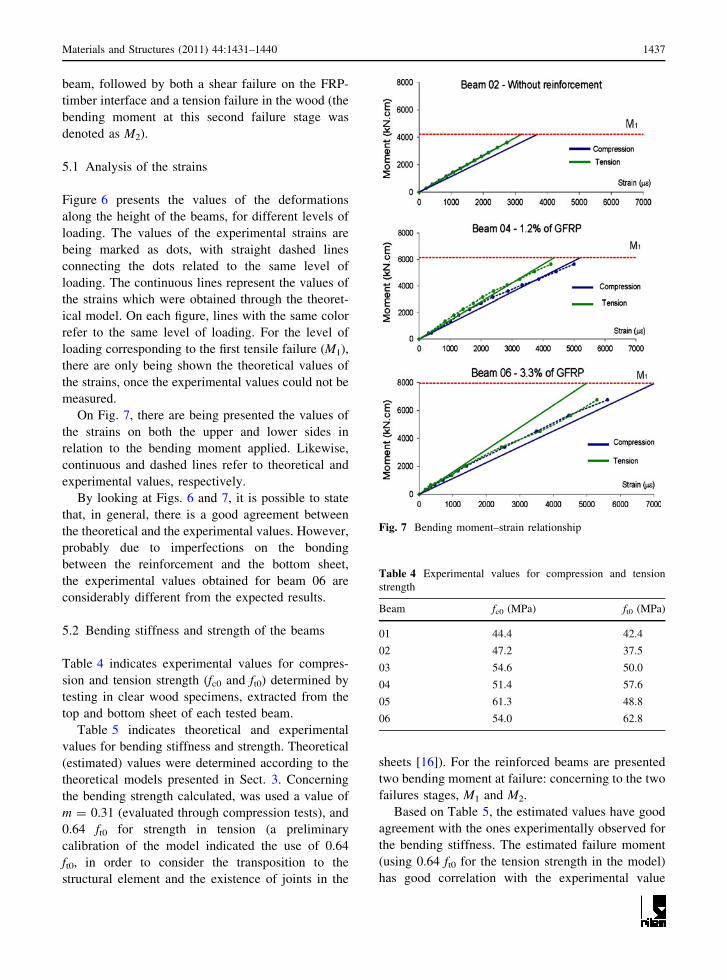
beam, followed by both a shear failure on the FRP-
timber interface and a tension failure in the wood (the
bending moment at this second failure stage was
denoted as M2).
5.1 Analysis of the strains
Figure 6 presents the values of the deformations
along the height of the beams, for different levels of
loading. The values of the experimental strains are
being marked as dots, with straight dashed lines
connecting the dots related to the same level of
loading. The continuous lines represent the values of
the strains which were obtained through the theoret-
ical model. On each figure, lines with the same color
refer to the same level of loading. For the level of
loading corresponding to the first tensile failure (M1),
there are only being shown the theoretical values of
the strains, once the experimental values could not be
measured.
On Fig. 7, there are being presented the values of
the strains on both the upper and lower sides in
relation to the bending moment applied. Likewise,
continuous and dashed lines refer to theoretical and
experimental values, respectively.
By looking at Figs. 6 and 7, it is possible to state
that, in general, there is a good agreement between
the theoretical and the experimental values. However,
probably due to imperfections on the bonding
between the reinforcement and the bottom sheet,
the experimental values obtained for beam 06 are
considerably different from the expected results.
5.2 Bending stiffness and strength of the beams
Table 4 indicates experimental values for compres-
sion and tension strength (fc0 and ft0) determined by
testing in clear wood specimens, extracted from the
top and bottom sheet of each tested beam.
Table 5 indicates theoretical and experimental
values for bending stiffness and strength. Theoretical
(estimated) values were determined according to the
theoretical models presented in Sect. 3. Concerning
the bending strength calculated, was used a value of
m = 0.31 (evaluated through compression tests), and
0.64 ft0 for strength in tension (a preliminary
calibration of the model indicated the use of 0.64
ft0, in order to consider the transposition to the
structural element and the existence of joints in the
sheets [16]). For the reinforced beams are presented
two bending moment at failure: concerning to the two
failures stages, M1 and M2.
Based on Table 5, the estimated values have good
agreement with the ones experimentally observed for
the bending stiffness. The estimated failure moment
(using 0.64 ft0 for the tension strength in the model)
has good correlation with the experimental value
Fig. 7 Bending moment–strain relationship
Table 4 Experimental values for compression and tension
strength
Beam fc0 (MPa) ft0 (MPa)
01 44.4 42.4
02 47.2 37.5
03 54.6 50.0
04 51.4 57.6
05 61.3 48.8
06 54.0 62.8
Materials and Structures (2011) 44:1431–1440 1437
(M1) in the first failure stage, presenting a maximum
variation of 29%.
Reinforced beams with a lumber sheet under the
reinforcement layer present an additional safety
after the tension failure in this sheet, as can be
seen on the results obtained in the second failure
stage (M2).
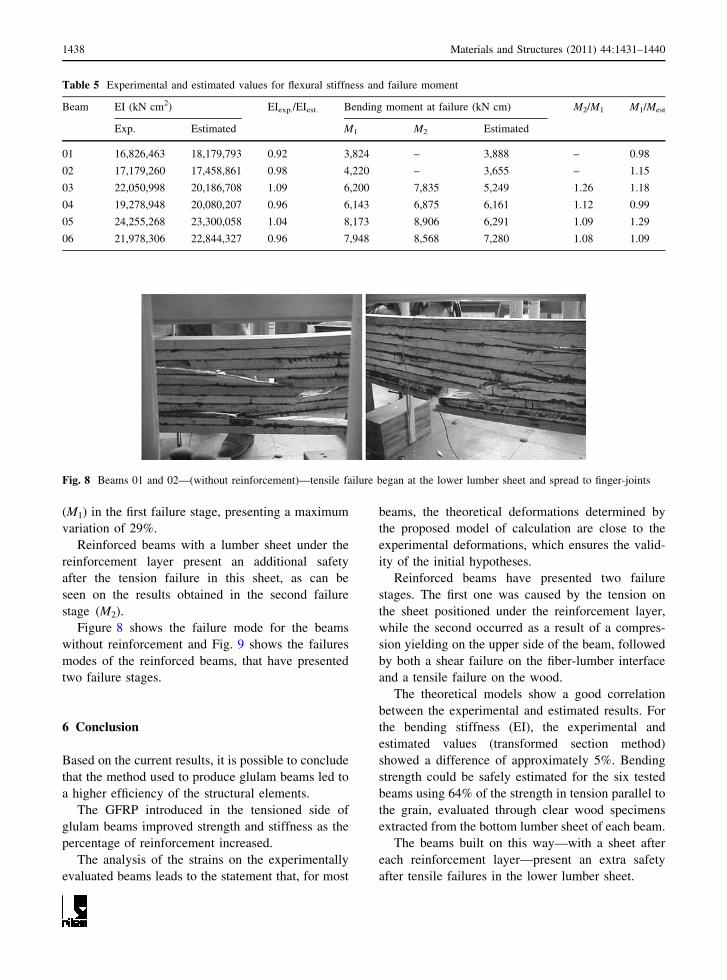
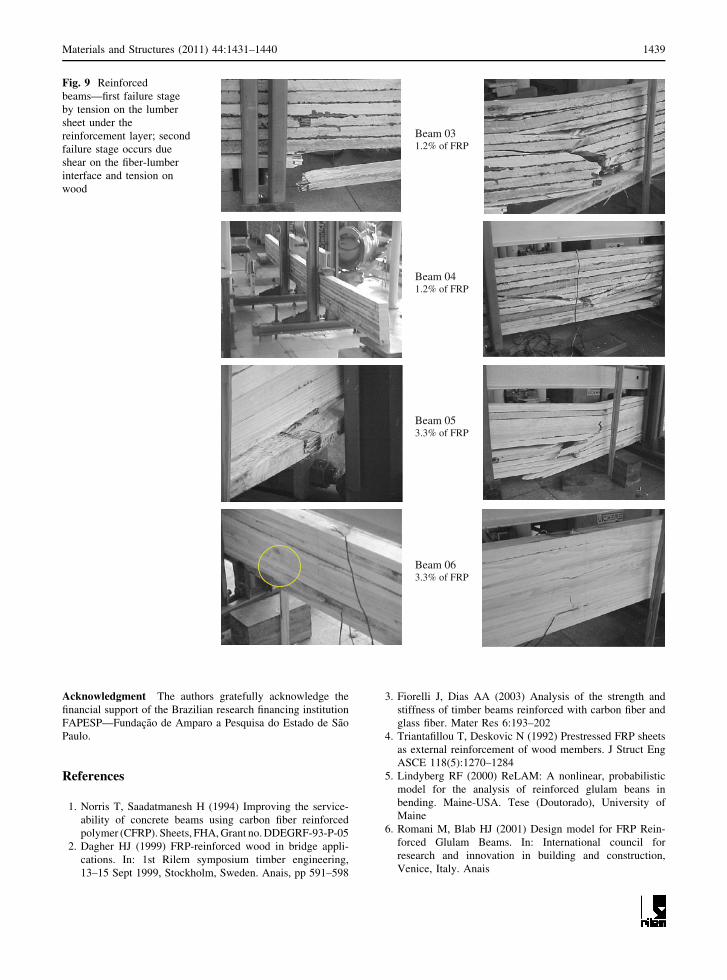
Figure 8 shows the failure mode for the beams
without reinforcement and Fig. 9 shows the failures
modes of the reinforced beams, that have presented
two failure stages.
6 Conclusion
Based on the current results, it is possible to conclude
that the method used to produce glulam beams led to
a higher efficiency of the structural elements.
The GFRP introduced in the tensioned side of
glulam beams improved strength and stiffness as the
percentage of reinforcement increased.
The analysis of the strains on the experimentally
evaluated beams leads to the statement that, for most
beams, the theoretical deformations determined by
the proposed model of calculation are close to the
experimental deformations, which ensures the valid-
ity of the initial hypotheses.
Reinforced beams have presented two failure
stages. The first one was caused by the tension on
the sheet positioned under the reinforcement layer,
while the second occurred as a result of a compres-
sion yielding on the upper side of the beam, followed
by both a shear failure on the fiber-lumber interface
and a tensile failure on the wood.
The theoretical models show a good correlation
between the experimental and estimated results. For
the bending stiffness (EI), the experimental and
estimated values (transformed section method)
showed a difference of approximately 5%. Bending
strength could be safely estimated for the six tested
beams using 64% of the strength in tension parallel to
the grain, evaluated through clear wood specimens
extracted from the bottom lumber sheet of each beam.
The beams built on this way—with a sheet after
each reinforcement layer—present an extra safety
after tensile failures in the lower lumber sheet.
Table 5 Experimental and estimated values for flexural stiffness and failure moment
Beam EI (kN cm2) EIexp./EIest. Bending moment at failure (kN cm) M2/M1 M1/Mest
Exp. Estimated M1 M2 Estimated
01 16,826,463 18,179,793 0.92 3,824 – 3,888 – 0.98
02 17,179,260 17,458,861 0.98 4,220 – 3,655 – 1.15
03 22,050,998 20,186,708 1.09 6,200 7,835 5,249 1.26 1.18
04 19,278,948 20,080,207 0.96 6,143 6,875 6,161 1.12 0.99
05 24,255,268 23,300,058 1.04 8,173 8,906 6,291 1.09 1.29
06 21,978,306 22,844,327 0.96 7,948 8,568 7,280 1.08 1.09
Fig. 8 Beams 01 and 02—(without reinforcement)—tensile failure began at the lower lumber sheet and spread to finger-joints
1438 Materials and Structures (2011) 44:1431–1440
Acknowledgment The authors gratefully acknowledge the
financial support of the Brazilian research financing institution
FAPESP—Fundacao de Amparo a Pesquisa do Estado de Sao
Paulo.
References
1. Norris T, Saadatmanesh H (1994) Improving the service-
ability of concrete beams using carbon fiber reinforced
polymer (CFRP). Sheets, FHA, Grant no. DDEGRF-93-P-05
2. Dagher HJ (1999) FRP-reinforced wood in bridge appli-
cations. In: 1st Rilem symposium timber engineering,
13–15 Sept 1999, Stockholm, Sweden. Anais, pp 591–598
3. Fiorelli J, Dias AA (2003) Analysis of the strength and
stiffness of timber beams reinforced with carbon fiber and
glass fiber. Mater Res 6:193–202
4. Triantafillou T, Deskovic N (1992) Prestressed FRP sheets
as external reinforcement of wood members. J Struct Eng
ASCE 118(5):1270–1284
5. Lindyberg RF (2000) ReLAM: A nonlinear, probabilistic
model for the analysis of reinforced glulam beans in
bending. Maine-USA. Tese (Doutorado), University of
Maine
6. Romani M, Blab HJ (2001) Design model for FRP Rein-
forced Glulam Beams. In: International council for
research and innovation in building and construction,
Venice, Italy. Anais
Beam 03 1.2% of FRP
Beam 04 1.2% of FRP
Beam 05 3.3% of FRP
Beam 06 3.3% of FRP
Fig. 9 Reinforced
beams—first failure stage
by tension on the lumber
sheet under the
reinforcement layer; second
failure stage occurs due
shear on the fiber-lumber
interface and tension on
wood
Materials and Structures (2011) 44:1431–1440 1439
7. Bergmeister K, Luggin W (2001) Innovative strengthening
of timber structures using carbon fibres. In: International
Association for Bridge and Structural Engineering, March
2001, Malta. Anais, pp 361–366
8. Tingley D, Kent S (2001) Structural Evaluation of fiber
reinforced hollow wood beams. In: International Associa-
tion for Bridge and Structural Engineering, March 2001,
Malta. Anais, pp 367–372
9. Yahyaei-Moayyed M, Taheri F (2011) Experimental and
computational investigations into creep response of AFRP
reinforced timber beams. Compos Struct 93:616–628
10. Southern Pine Inspection Bureau (1994) Standard Grading
Rules for Southern Pine Lumber. Pensacola, FL
11. American Plywood Association (2000) Glulam Product
Guide. Tacoma, Washington, EUA
12. Deutsches Institut Fur Normung (1971) DIN 68 140-Wood
Finger-Jointing. Berlin, Germany
13. Buchanan AH (1990) Bending strength of lumber. J Struct
Eng ASCE 116(5):1213–1229
14. American Society for Testing and Materials (1995) ASTM
D3039-Standard Test Method for tension properties of
polymer matrix composite materials, Philadelphia, PA
15. American Society for Testing and Materials (1997) ASTM
D198-Standard Test Methods of Static Tests of Lumber in
Structural Sizes. Philadelphia, PA
16. Fiorelli J, Dias AA (2006) Fiberglass-reinforced glulam
beams: mechanical properties and theoretical model. Mater
Res 9:263–269
1440 Materials and Structures (2011) 44:1431–1440
Copyright © 2022 FDOKUMEN