Structural performance of a FRP bridge deck
41
Prakash Kumar, K. Chandrashekhara and Antonio Nanni, “Structural Performance of a FRP Bridge Deck,” ASCE Journal of Composites for Construction, March 2001. 1 STRUCTURAL PERFORMANCE OF A FRP BRIDGE DECK Prakash Kumar and K. Chandrashekhara Department of Mechanical and Aerospace Engineering and Engineering Mechanics and Antonio Nanni Department of Civil Engineering University of Missouri – Rolla Rolla, MO 65409
-
Upload
independent -
Category
Documents
-
view
0 -
download
0
Transcript of Structural performance of a FRP bridge deck

Prakash Kumar, K. Chandrashekhara and Antonio Nanni, “Structural Performance of a FRP Bridge Deck,” ASCE Journal of Composites for Construction, March 2001.
1
STRUCTURAL PERFORMANCE OF A FRP BRIDGE DECK
Prakash Kumar and K. Chandrashekhara
Department of Mechanical and Aerospace Engineering and Engineering
Mechanics
and
Antonio Nanni
Department of Civil Engineering
University of Missouri – Rolla
Rolla, MO 65409

Prakash Kumar, K. Chandrashekhara and Antonio Nanni, “Structural Performance of a FRP Bridge Deck,” ASCE Journal of Composites for Construction, March 2001.
2
1. ABSTRACT
The purpose of this paper is to present fatigue and strength experimental
qualifications performed for an all-composite bridge deck. This bridge deck, made up of
fiber-reinforced polymer (FRP) was installed on the campus at University of Missouri at
Rolla on July 29th, 2000. The materials used for the fabrication of this 9.14 m (30 ft) long
by 2.74 m (9 ft) wide deck were 76 mm (3 in) pultruded square hollow glass and carbon
FRP tubes of varying lengths. These tubes were bonded using an epoxy adhesive and
mechanically fastened together using screws in seven different layers to form the bridge
deck with tubes running both longitudinal and transverse to the traffic direction. The
cross-section of the deck was in the form of four identical I-beams running along the
length of the bridge. Fatigue and failure tests were conducted on a 9.14 m (30 ft) long by
610 mm (2 ft) wide prototype deck sample, equivalent to a quarter portion of the bridge
deck. The loads for these tests were computed so as to meet American Association of
State Highway and Transportation Officials (AASHTO) H-20 truckload requirements
based on strength and maximum deflection. The sample was fatigued to 2 million cycles
under service loading and a nominal frequency of 4 Hz. Stiffness changes were
monitored by periodically interrupting the run to perform a quasi-static test to service
load. Results from these tests indicated no loss in stiffness up to 2 million cycles.
Following the fatigue testing, the test sample was tested to failure and no loss in strength
was observed. The testing program, specimen detail, experimental setup and
instrumentation, testing procedure, and the results of these tests are discussed in detail. A
finite-element model of the laboratory test was also developed. The results from the

Prakash Kumar, K. Chandrashekhara and Antonio Nanni, “Structural Performance of a FRP Bridge Deck,” ASCE Journal of Composites for Construction, March 2001.
3
model showed good correlation to deflections and longitudinal strains measured during
the tests. The design of the bridge deck has been discussed in detail.
Key Words: Composite materials, fiber-reinforced polymer (FRP), pultrusion,
bridge deck, fatigue, finite element analysis (FEA), I-beam.
2. INTRODUCTION
Maintenance of transportation infrastructure, especially bridges, is a growing
concern worldwide. The deteriorating condition of bridges and other infrastructure
facilities has been documented by several writers (Aref and Parsons (1996) and Karbhari
et al. (1997)) and has been recognized by highway agencies (Zureick et al. (1995)) as one
of the most complex problems in transportation infrastructure. Finding innovative, cost-
effective solutions for the repair and replacement of concrete and steel in bridges is a
necessity. Fiber-reinforced polymers (FRP) are being used in infrastructure as alternative
to conventional materials. Besides having high stiffness and strength-to-weight ratios,
excellent fatigue and corrosion resistance, faster installation time, and reduced
maintenance costs, composites also offer superior resistance to environmental
degradation as compared to traditional building materials (Liskey (1991)). All these
characteristics of FRP lead to several cost-performance benefits (Head (1992)) when
applied for transportation infrastructure applications.
Bridge deck appears to be one of the most promising applications for composites
in infrastructure. The use of bridge systems and decks made predominantly with FRP
composite materials has gained considerable momentum in the past few years with the
successful installation of several composite bridges around the United States by various

Prakash Kumar, K. Chandrashekhara and Antonio Nanni, “Structural Performance of a FRP Bridge Deck,” ASCE Journal of Composites for Construction, March 2001.
4
private companies in collaboration with federal, state, and county agencies. Kansas
Structural Composites and Kansas Department of Transportation built one of the first
FRP composite vehicular bridge installed in the U.S. (Plunkett (1997)). This 7.08 m (23
ft) long by 8.45 m (27.7 ft) wide bridge deck uses FRP honeycomb sandwich panels that
measure 559 mm (22 in) deep to span the length of the bridge and is designed to carry
HS-25 vehicular traffic. Hand lay-up process was used to assemble the panels with
glass/polyester fabrics. It took less then two days to complete the bridge, and testing
indicated a service load deflection of 1/1450 of the length, L, of the bridge. The Bonds
Mill Life Bridge over a small river in Stroud, England, utilizes pultruded glass fiber box
sections bonded together with epoxy (Seible (1998)). This 8.23 m (27 ft) long by 4.57 m
(15 ft) wide bridge has a capacity of 391 kN (88,000 lb) and has two sections that can be
lifted hydraulically to allow water traffic to pass underneath. The lightweight of
composite materials permitted use of smaller lift mechanism. Creative Pultrusions, in
association with West Virginia DOT and West Virginia University, manufactured an all-
composite structure consisting of a deck system and wide flange beams, both made of E-
glass/vinyl ester, to replace a timber deck in the Laurel Lick Bridge in Lewis County,
West Virginia (Lopez-Anido et al. (1998b)). The deck cross-section was made of double
trapezoids (trusses) and hexagons (shear keys) pultruded profiles. These profiles were
interlocked and bent to create the deck module. Martin Marietta Materials and Idaho
DOT built two FRP composite highway bridges (Foster et al. (1998)) each made of E-
glass continuous fiber in a polyester matrix and consisting of trapezoidal shaped beams
supporting it. This 9.14 m (30 ft) long by 5.49 m (18 ft) wide deck utilized pultruded E-
glass/vinyl ester square tubes glued together, running with the direction of traffic,

Prakash Kumar, K. Chandrashekhara and Antonio Nanni, “Structural Performance of a FRP Bridge Deck,” ASCE Journal of Composites for Construction, March 2001.
5
sandwiched between face sheets of glass/vinyl ester or glass/polyester laminae. This
structure was designed for HS-20 loading with a service load deflection L/800.
Composite bridges built in Delaware used a foam-core glass fiber-reinforced polymer
(GFRP) deck design (Chajes et al. (1998)). The decks were sandwiched structures made
up of a foam-filled, square, honeycomb type core that was sandwiched between upper
and lower face sheets. The deck sections were fabricated using the SCRIMP process
(Seaman Composite Resin Infusion Molding Process), a vacuum assisted resin fusion
process. A few other all-composite bridges have been installed like the “Tech 21 Bridge”
in Butler County, Ohio (Richards et al. (1998)). This 10.1 m (33 ft) long by 7.32 m (24
ft) wide by 838 mm (2.7 ft) deep two-lane bridge deck was expected to carry 2000
vehicles per day and comprised of trapezoidal tubes. The deck panels were adhered to
the U-girders prior to installation to form three modular sections, and these sections were
then installed and joined together.
While a viable alternative has been provided for new bridge construction by the
above discussed bridge designs, there is still a great need for further research on other
designs in order to expand the database of civil engineers related to durability, further
develop design, testing and manufacturing standards, and reduce the cost of the
composite materials. To accomplish this goal an all-composite bridge deck was built at
Lemay Center for Composites Technology at St. Louis, Missouri, and installed on the
campus at University of Missouri at Rolla on July 29th, 2000. A prototype deck section,
equivalent to a quarter portion of the bridge deck, was fabricated to test the feasibility of
the deck design. The objective of this paper is to discuss the quasi-static four-point

Prakash Kumar, K. Chandrashekhara and Antonio Nanni, “Structural Performance of a FRP Bridge Deck,” ASCE Journal of Composites for Construction, March 2001.
6
bending and fatigue tests of the prototype deck sample. The tests were conducted to
investigate the following:
Strength and stiffness of the deck sample in flexure under a simulated wheel load.
Fatigue behavior and residual strength during simulated cyclic wheel loading.
Failure modes from fatigue and static loadings.
Variations of deflection and strain measurements with number of cycles and mode
of failure after loading cycles were used to characterize the fatigue and strength
performance of the bridge deck. The deck was designed for H-20 truckloads as required
by American Association of State Highway and Transportation Officials (AASHTO
(1996)). The results obtained from the static tests were compared with those from the
finite element analysis (FEA) and a good correlation was achieved. The FEA analysis
also helped in investigating the areas of stress concentration and load distribution
throughout the bridge deck.
3. BRIDGE DECK DESIGN
The development of a sound composite bridge deck requires consideration of the
special needs of composite structural design, as well as the application of standard civil
engineering practice and validation to ensure public safety. This dictates the requirement
for significant amounts of material testing and experimental validation as existing design
techniques for composite structures are applied to bridge applications.

Prakash Kumar, K. Chandrashekhara and Antonio Nanni, “Structural Performance of a FRP Bridge Deck,” ASCE Journal of Composites for Construction, March 2001.
7
2.1. DESIGN PARAMETERS
This bridge deck was designed to AASHTO specifications for a 9.14 m (30 ft)
span vehicular traffic bridge using the configuration of the truck shown in Figure 1.
AASHTO bridge design specifications limit the deflection of the deck to 1/800 of the
span length, L, of the bridge deck. According to the specifications, the flexural members
of the bridge structures should be designed to have adequate stiffness to limit deflections
or any deformations that may adversely affect the strength or serviceability of the
structure. The live load distribution was based on one AASHTO H-20 truckload with
two back axles positioned equi-distant on either side of the center of the span. The
service load of an H-20 truck was calculated as 142.4 kN (32,000 lb) with 71.2 kN
(16,000 lb) on each back axle.
2.2. DESIGN OF BRIDGE DECK AND TEST SAMPLE
The bridge deck was fabricated using varying lengths of pultruded hollow tubes
composed of glass and carbon fibers in vinyl ester matrix. The tubes have a square cross-
section of 76 mm (3 in) and a thickness of 6.4 mm (0.25 in). Extensive analysis and
testing of single, double and four-layered GFRP tube assemblies were conducted to
evaluate the characteristics of the tubes (Kumar et al. (2000)). The static behavior of
single GFRP tubes were analyzed under flexure followed by testing of double tube
assemblies and a four-layered tube assembly. The double tube assemblies were prepared
using three different epoxy adhesives and tested to failure under flexure. The results of
the tests aided in the selection of the adhesive to be used for almost perfect bonding
Prakash Kumar, K. Chandrashekhara and Antonio Nanni, “Structural Performance of a FRP Bridge Deck,” ASCE Journal of Composites for Construction, March 2001.
8
between the tubes and also provided knowledge about the behavior of the tubes in an
assembly. Finally, a four-layered tube assembly was tested to failure under flexure. The
deflection, strain and failure modes of the various test coupons were analyzed. The
stiffness of the tubes and their assemblies demonstrated that they could be used in the
building of all composite bridge decks and for other infrastructure applications.
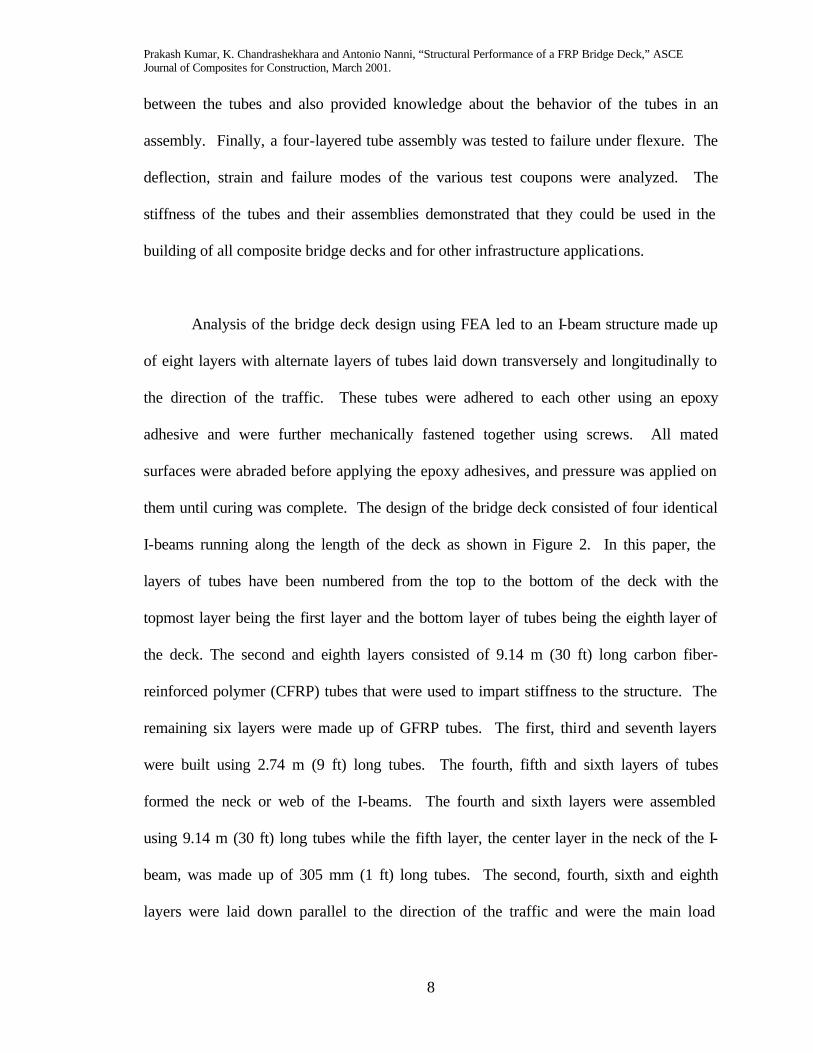
Analysis of the bridge deck design using FEA led to an I-beam structure made up
of eight layers with alternate layers of tubes laid down transversely and longitudinally to
the direction of the traffic. These tubes were adhered to each other using an epoxy
adhesive and were further mechanically fastened together using screws. All mated
surfaces were abraded before applying the epoxy adhesives, and pressure was applied on
them until curing was complete. The design of the bridge deck consisted of four identical
I-beams running along the length of the deck as shown in Figure 2. In this paper, the
layers of tubes have been numbered from the top to the bottom of the deck with the
topmost layer being the first layer and the bottom layer of tubes being the eighth layer of
the deck. The second and eighth layers consisted of 9.14 m (30 ft) long carbon fiber-
reinforced polymer (CFRP) tubes that were used to impart stiffness to the structure. The
remaining six layers were made up of GFRP tubes. The first, third and seventh layers
were built using 2.74 m (9 ft) long tubes. The fourth, fifth and sixth layers of tubes
formed the neck or web of the I-beams. The fourth and sixth layers were assembled
using 9.14 m (30 ft) long tubes while the fifth layer, the center layer in the neck of the I-
beam, was made up of 305 mm (1 ft) long tubes. The second, fourth, sixth and eighth
layers were laid down parallel to the direction of the traffic and were the main load

Prakash Kumar, K. Chandrashekhara and Antonio Nanni, “Structural Performance of a FRP Bridge Deck,” ASCE Journal of Composites for Construction, March 2001.
9
bearing members of the structure. The first, third, fifth and seventh layers were laid
down transverse to the direction of traffic. These layers had very limited load carrying
capacity and were used mainly to transmit load to the lower lying load carrying layers.
The prototype deck sample built for conducting the fatigue and failure tests had
the same number of layers of tubes laid down in a similar pattern as the bridge deck. The
test sample had dimensions of 9.14 m (30 ft) long by 610 mm (2 ft) wide by 610 mm (2
ft) high. It was equivalent to a quarter of the bridge deck and had the cross-section of a
single I-beam as shown in Figure 3. After results of the tests conducted on the prototype
deck sample were analyzed, it was observed that the performance of the sample exceeded
the design specifications. Consequently, one of the layers of GFRP tubes was deemed
unnecessary. It was decided to eliminate the topmost layer of GFRP tubes from the
original design while still meeting all the design criteria. This lead to the reduction of
cost, thickness and weight of the structure, as compared to the original design. Thus the
final design of the bridge deck consisted of seven layers of tubes with the CFRP tubes
forming the first and last layers of the deck. The final dimensions of the bridge deck
were 9.14 m (30 ft) long by 2.74 m (9 ft) wide by 533 mm (21 in) high. Thin polymer
concrete wearing surface or overlay was added to the top of the full-size bridge deck.
This polymer concrete overlay was required to have high tensile elongation due to the
flexible response of the FRP composite deck. It was also needed to develop good
adhesion to the GFRP deck surface, provide a non-skid surface, absorb energy and should
be easy to place on the deck surface. Upon evaluating the results of studies done by a few
authors (Lopez-Anido et al. (1998a)) in polymer concrete, it was decided to use Transpo

Prakash Kumar, K. Chandrashekhara and Antonio Nanni, “Structural Performance of a FRP Bridge Deck,” ASCE Journal of Composites for Construction, March 2001.
10
T48, an epoxy based system used on several FRP bridges, along with an aggregate of tan
Trowlrite. The aggregate was applied by hand after the epoxy layer was spread across
the bridge. The thickness of the wearing surface was roughly 6.4 mm (0.25 in).
However, for the prototype deck sample, the wearing surface was not included as it was
assumed that it would not significantly affect the structural response of the deck panel.
4. TEST PROGRAM
The overall philosophy of the composite deck test program was to determine
characteristics of the full-size bridge deck by analyzing the tests performed on relatively
smaller sections of same design. The design and dimensions of the prototype deck
sample used for testing has been discussed in the previous section. The objectives of
testing the sample were threefold: (1) to investigate feasibility of the proposed
configuration and to verify that the composite bridge meets all the design requirements
specified by AASHTO for a 9.14 m (30 ft) long bridge deck with an H-20 truckload; (2)
to investigate the local stresses and strains developed at the points of load application and
supports; (3) to provide the ground work for analyzing characteristics of the full-size
bridge deck. The results of the study on a quarter portion of the bridge deck can
reasonably be extrapolated to the full-size bridge deck. Three different tests were
performed on the deck sample for obtaining all the useful design performance
information and to study its structural behavior. Specifically, the following tests were
performed: (1) design load test (quasi-static loading up to the design load in the mid-span
of the deck); (2) fatigue or cyclic load test (fatigue loading under service loads to 2
million cycles with quasi-static load tests at periodic intervals to assess degradation); (3)
ultimate load test (static loading to failure with load at mid-span of the deck).

Prakash Kumar, K. Chandrashekhara and Antonio Nanni, “Structural Performance of a FRP Bridge Deck,” ASCE Journal of Composites for Construction, March 2001.
11
5. EXPERIMENTAL SETUP AND INSTRUMENTATION
The composite deck test sample was simply supported at the ends using two
rollers spaced at a distance of 8.54 m (28 ft) so that the beam extended 305 mm (1 ft)
beyond the support rollers at each end. The rollers were 610 mm (2 ft) long and were
supported in between rails resting on the floor. In case of the static load tests, namely the
design load test and the ultimate load test, a temporary setup was put up on the floor.
Load was applied using a 889.6 kN (200,000 lb) manual hydraulic jack aligned to the
center of the deck and overhanging from four screws fixed vertically to the floor. A
manually controlled hydraulic pump was used to load and unload the jack. Figure 4
shows the experimental setup of the bridge deck test sample for the static tests. In case of
the fatigue test, load was applied using a MTS electro-hydraulic actuator permanently
fixed to a framework. The actuator had a loading capacity of 97.9 kN (22,000 lb) and a
stroke of 152.4 mm (6 in). This test was controlled using a MTS 436 controller. Test
setup for the fatigue load test is shown in Figure 5. A 1.52 m (5 ft) long spreader beam
was utilized to apply the load at mid-span. This spreader beam was supported by the
deck sample via two stacks of 101.6 mm (4 in) thick steel plates used as loading patches.
These rectangular loading patches of 203 mm (8 in) by 508 mm (20 in), with the larger
dimension transverse to the direction of traffic, were used to simulate the action of wheel
loads of an H-20 truck on top surface of the deck. The loading patches were at a distance
of 1.22 m (4 ft) or 610 mm (2 ft) off-center, representative of the distance between the
two back axles of an H-20 truck. This setup led to a four-point bending load
configuration as shown in the schematic diagram in Figure 6.

Prakash Kumar, K. Chandrashekhara and Antonio Nanni, “Structural Performance of a FRP Bridge Deck,” ASCE Journal of Composites for Construction, March 2001.
12
Variations of deflection and strain measurements with number of cycles and mode
of failure after loading cycles were used to characterize the fatigue and strength
performance of the bridge deck. LVDTs (Linear variable differential transformers) were
installed at mid-span and at the two supports to measure deflections of the deck. The
LVDT at the center had a stroke length of 50.8 mm (2 in) while those at the supports had
a stroke length of 25.4 mm (1 in). Ten 6 mm (0.24 in) long 120 ohms electrical
resistance strain gauges were attached to the tubes of the bridge deck at several important
locations to obtain the strain readings. Longitudinal and transverse strains were
measured on the top and bottom deck surface at the center of the deck. Strain gauges
were also attached to other pertinent locations on different layers of FRP tubes. The
vertical load applied on to the test sample was measured using a 222 kN (50,000 lb) load
cell placed between the hydraulic jack and the spreader beam. In case of the fatigue test,
a 97.9 kN (22,000 lb) load cell was used which was a part of the MTS hydraulic actuator
loading system. A MTS 436 controller was used to control the load range, frequency of
loading and the number of cycles of the hydraulic actuator. Load, deflection, and strain
signals were continuously recorded during testing using a high-speed data acquisition
system.
6. EXPERIMENTAL PROCEDURE AND RESULTS
Three different tests were conducted on the prototype deck sample. Each of these
have been discussed separately.

Prakash Kumar, K. Chandrashekhara and Antonio Nanni, “Structural Performance of a FRP Bridge Deck,” ASCE Journal of Composites for Construction, March 2001.
13
5.1. DESIGN LOAD TEST
This was a preliminary test for observing behavior, assessing serviceability and
performance of the composite bridge deck up to a load of 111 kN (25,000 lb). It also
helped to investigate feasibility of the proposed configuration and to verify that the
composite bridge meets all AASHTO design requirements for an H-20 truckload. The
design load for quarter portion of the bridge deck was 94.8 kN (21,320 lb). The load of
111 kN (25,000 lb), being slightly higher than the design load, was chosen as the higher
limit for this test. The deck sample was tested under flexure in four-point loading
configuration at the mid-span. The deflection of the deck was 22 mm (0.86 in) at the
highest load limit and only a very slight bending of the deck could be observed by visible
inspection. As the load was increased beyond 80 kN (18,000 lb), a few cracking sounds
were heard which appeared to be cracking of the adhesive layer in between a few of the
tubes. Figures 7 and 8 show the plots for load versus deflection and strain for the design
load test respectively. The plots show that the deflection and strain behavior were linear
elastic throughout the test. The results were extremely encouraging as the deflection of
the test sample was only 6.6 mm (0.26 in) upon application of one fourth of the design
load of 35.5 kN (8,000 lb). The deck did not show any premature deterioration or
damage at this load.
5.2. FATIGUE OR CYCLIC LOAD TEST
The second test performed on the deck sample was a fatigue or cyclic load test,
the setup for which has been described in previous sections. Fatigue is an important issue

Prakash Kumar, K. Chandrashekhara and Antonio Nanni, “Structural Performance of a FRP Bridge Deck,” ASCE Journal of Composites for Construction, March 2001.
14
where the load on a structure is almost entirely transient. Normally, tests are run for no
more than 2 to 3 million cycles, even though, for many infrastructure applications, this
may represent only a few years of actual service. Sometimes, an attempt is made by
researchers to “accelerate” the fatigue damage by testing at loads much higher than the
service load. However, this approach is inadequate as different damage mechanisms may
dominate under different load levels. Taking this into consideration, this deck sample
was subjected to fatigue loading for 2 million cycles at a minimum/maximum load ratio
of R=0.045 with the maximum load of 48.93 kN (11,000 lb) and the minimum of 2.2 kN
(500 lb). The maximum load was slightly higher than the service load of 48.1 kN
(10,800 lb) for the deck sample. The loading cycles simulate passage of the back axles of
an H-20 truck over the points of application for that many number of cycles. Before
starting the fatigue test, a quasi-static flexure test up to a load of 88.96 kN (20,000 lb)
was performed. A similar quasi-static test was performed after every 400,000 cycles.
The static load tests served as a periodic measure of potential changes in the stiffness of
the structure due to the live load induced degradation. It also helped to periodically
inspect signs of deterioration, if any, of the deck sample caused by the fatigue loading.
The fatigue test was conducted under load control condition with the maximum
and minimum load kept constant at a frequency of 4 Hz. A total of six quasi-static
flexure tests were conducted on the sample during the course of this test after 0, 0.4, 0.8,
1.2, 1.6 and 2 million cycles. Figures 9 and 10 show comparison of the results from
deflection and strain measurements against the load applied during the static tests
respectively. The plots show that the deck deflection and strain responses remained fairly

Prakash Kumar, K. Chandrashekhara and Antonio Nanni, “Structural Performance of a FRP Bridge Deck,” ASCE Journal of Composites for Construction, March 2001.
15
constant for all the static load tests and no apparent loss in stiffness was demonstrated up
to the maximum applied load of 88.96 kN (20,000 lb). A thorough visual inspection of
the test sample was done at the time of each static load test and no sign of fracture or
debonding between the FRP tubes in any of the eight layers, due to the fatigue loading,
was observed. The fasteners holding on to the tubes, in addition to the adhesive, were
also inspected and were found to be in perfect condition. The height of the test sample
from the floor was recorded before starting a new set of 400,000 cycles and after its
completion. On comparison it revealed that no permanent bending of the deck sample
had taken place. No other form of damage was observed either during or after the
conclusion of the fatigue load test.
1.3. ULTIMATE LOAD TEST
The ultimate load capacity of the FRP bridge deck was performed to evaluate the
overall margin of safety and the mode of failure and to provide conclusive evidence as to
the strength of the bridge deck. It was tested to failure by the application of concentrated
static load in cycles under four point bending configuration at the mid-span of the deck.
The magnitude of the maximum load used in each successive load cycle was incremented
until failure of the deck was achieved. Based on the experience of tests performed
previously on a four-layered FRP tube assembly (Kumar et al. (2000)), it was expected
that a few tubes of the topmost layer might pop out due to the high compressive force on
them. As a precaution against any damage caused by such a type of failure, two long
wooden pieces were placed on the top surface of the deck and were chained to it. The
test setup has been described in detail in previous sections.

Prakash Kumar, K. Chandrashekhara and Antonio Nanni, “Structural Performance of a FRP Bridge Deck,” ASCE Journal of Composites for Construction, March 2001.
16
The test consisted of three loading cycles with the first two cycles resulting in
some damage to the deck and failure of the sample being attained in the last cycle. The
loading cycles were approximately from 0 to 88.96 kN (20,000 lb), 88.96 kN (20,000 lb)
to 133.45 kN (30,000 lb) and the final cycle was from 111 kN (25,000 lb) to 155.69 kN
(35,000 lb). The load versus center deflection and strain for the three cycles has been
shown in Figures 11 and 12 respectively. During the fatigue test, the sample had already
been tested six times under static loading up to a load of 88.96 kN (20,000 lb). The first
cycle did not result in any significant measurable, visible, or audible damage to the deck
panel. The graphs clearly demonstrate that the deck had a fairly good linear elastic
behavior during this cycle. It shows a consistent response on the reverse cycle with
almost no loss in stiffness of the deck. The data show that the deflection of the sample at
the design load of 35.5 kN (8,000 lb) was 7.9 mm (0.31 in) which was slightly more than
that recorded for the design load test, but was still much below the maximum allowable
deflection of 11.4 mm (0.45 in). The next two load cycles were the ones during which
damage to the deck sample was observed. During the second cycle, the deflection of the
test sample became prominent and could be easily perceived by visible observation. As
loading was done beyond 111 kN (25,000 lb), slight twisting of tubes of the fifth layer
was observed. These tubes laid down transverse to the direction of traffic and forming a
part of neck of the bridge I section, were aligned along the neutral axis of the deck
structure. These tubes were acted upon by compressive loading on its top surface and by
tensile loading on its bottom surface. This resulted in a twisting motion of the tubes in
this layer. The shape of the tubes changed from square to a parallelogram. The tubes at

Prakash Kumar, K. Chandrashekhara and Antonio Nanni, “Structural Performance of a FRP Bridge Deck,” ASCE Journal of Composites for Construction, March 2001.
17
the two ends of the deck sample were most affected by the twisting motion. Considerable
noise was heard as the load reached around 133.45 kN (30,000 lb) and the load was
promptly reduced. Upon reloading, the deck demonstrated a loss in stiffness. As the load
was increased beyond 133.45 kN (30,000 lb), significant damage was observed. In the
fifth layer, the tubes at the ends of the test sample showed considerable twisting. Due to
this twisting motion, breaking and cracking of the fibers at the corners of the tubes was
noticed. This is clearly shown in Figure 13, which is an exploded view of a few tubes in
the fifth layer. The noise coming from the sample had increased considerably. It was
observed that beyond the load of 169 kN (38,000 lb), the deflection was increasing
without any increase in the load on the sample. The loading had severely damaged the
FRP tubes in the fifth layer of the deck leading to a substantial reduction in the load
carrying capacity of the whole structure. At this point the load on top of the sample was
again reduced to about 111 kN (25,000 lb). On reloading, the sample demonstrated
substantial reduction in the stiffness. On reaching a load of 155.69 kN (35,000 lb) upon
reloading it was noticed that the deflection and strain on the sample was increasing while
the load on it remained constant. At this point it was decided that failure of the sample
had been achieved and the test was stopped. On releasing the load from on top of the
deck, it went back to almost its initial height. Other than the cracks and broken fibers
along the corners of the tubes in the fifth layer, there was no other permanent distortion
of the deck.
Unlike several other structures made out of conventional materials, the failure of
the deck did not result in its total collapse and it exhibited limited but safe post-failure

Prakash Kumar, K. Chandrashekhara and Antonio Nanni, “Structural Performance of a FRP Bridge Deck,” ASCE Journal of Composites for Construction, March 2001.
18
reserve strength. This behavior may be considered to be favorable for civil engineering
designs, as the failure was not truly catastrophic. On releasing the load from on top of
the deck, it went back almost to its initial height showing the flexibility or ductility of the
composite material. The mode of failure observed was transverse shear failure resulting
in the delaminations and cracking of fibers along the edges of the FRP pultruded tubes. It
may be noted that failure was accompanied by little or no visible sign of failure of the
bolts or adhesive failure between the adjacent tubes. The graphs of deflection and strain
against the applied load for the failure test clearly shows the linear and non-linear
behaviors of the deck at different stages of the loading. The sample demonstrated fairly
good linear elastic behavior up to a load of 133.45 kN (30,000 lb). Beyond this load the
deck behavior became non-linear and it started losing its stiffness. The largest overall
longitudinal strain recorded during this test was 1071 microstrain, located at the center of
bottom surface of the deck. Figure 14 shows the plot of the longitudinal strain recorded
on the tubes of the second layer, directly under the loading patch. The tubes in this layer
were under compression with the maximum of –736 microstrain. The extensive area
under the load-deflection curve in Figure 11 indicates that the FRP deck has excellent
energy absorption capability.
7. EVALUATION OF DECK PERFORMANCE
The results of the three different tests performed on the prototype deck sample
were used to determine characteristics of the full-size bridge deck. The test sample failed
at about 155.69 kN (35,000 lb), which is of the order of four times the design wheel load
for a quarter portion of the deck. This indicates extremely good performance of the deck
as far as strength is concerned. The mid-span deflections of the deck sample at the

Prakash Kumar, K. Chandrashekhara and Antonio Nanni, “Structural Performance of a FRP Bridge Deck,” ASCE Journal of Composites for Construction, March 2001.
19
design wheel load were 6.6 mm (0.26 in) and 7.9 mm (0.31 in) for the static test before
fatigue loading and the post-fatigue ultimate load test respectively. These mid-span
deflections of the deck sample were well within the 11.4 mm (0.45 in) range, which is the
maximum deflection based on length/800 design criteria specified by AASHTO
guidelines. From observations made during the test and on analyzing the failure mode, it
can be concluded that the load carrying capacity of the deck can be increased by
preventing the twisting of tubes in the fifth layer from the top of the deck. The twisting
of tubes caused the cracking and breaking of the fibers at the edges of the tubes while at
the same time almost no other form of distortion or failure was observed in any other
layer of tubes. The performance of the test sample with regards to AASHTO strength
and deflection requirements was much better then anticipated. Taking the test results into
consideration, it was decided to remove the topmost layer of GFRP tubes from the full-
size bridge deck, leading to reduction in the material, thickness, weight, and cost of the
deck while still meeting the AASHTO requirements.
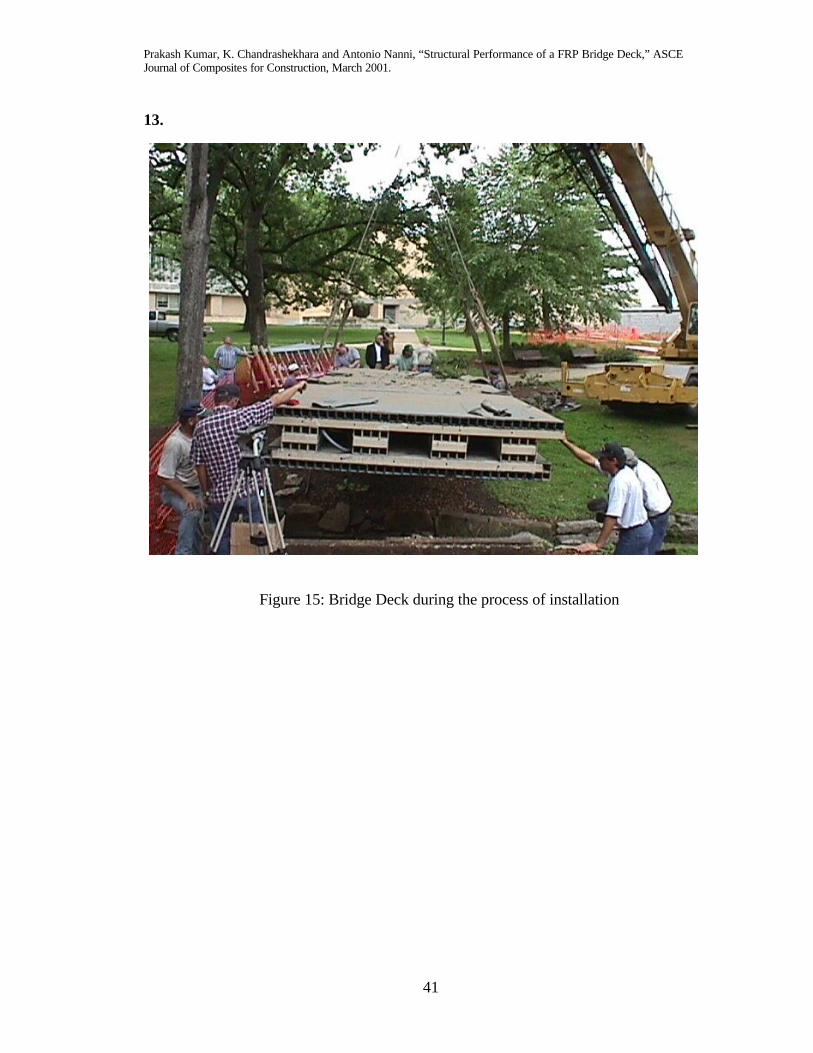
8. BRIDGE INSTALLATION
The bridge was installed at the UMR campus on July 29th, 2000. Figure 15 shows
the bridge during the process of installation. The bridge is equipped with integral fiber
optic sensors and the response of the bridge will be remotely monitored.
9. RECOMMENDATIONS AND FUTURE WORK
A number of issues still need to be investigated for optimizing the present bridge
design. The following recommendations and suggestions for future work are made based
on the investigations conducted within the scope of this project:

Prakash Kumar, K. Chandrashekhara and Antonio Nanni, “Structural Performance of a FRP Bridge Deck,” ASCE Journal of Composites for Construction, March 2001.
20
• The reason for failure of the test sample was due to the twisting of tubes in the
fifth layer of the deck sample. This twisting motion caused the tubes to loose
their shape and also lead to cracking of the fibers along the edges of the tubes. To
prevent this twisting motion and hence the cracking, pultruded tubes with
improved transverse properties are required.
• The ultimate load capacity of the deck can be increased by replacing the fifth
layer of GFRP tubes, laid down transverse to the direction of the traffic, with
GFRP tubes running lengthwise along the deck. This will result in providing
more strength and stiffness to the deck as the longitudinal tubes in the fifth layer
will then be one of the main load bearing members.
• In order that the all-FRP bridge deck behaves monolithically, adequate bonding
between the FRP tubes is necessary. To ensure this, further investigation into the
long term performance is required with regard to the adhesive used for bonding
the tubes.
• Research and testing is recommended for checking the feasibility of using
“hybrid” FRP tubes, having carbon and glass fibers in the required proportion, in
place of separate layers of GFRP and CFRP tubes. The resulting stiffness of the
hybrid tubes may result in providing equivalent amount of strength and stiffness

Prakash Kumar, K. Chandrashekhara and Antonio Nanni, “Structural Performance of a FRP Bridge Deck,” ASCE Journal of Composites for Construction, March 2001.
21
of the deck with lesser number of layers of tubes thus reducing the material used,
thickness, weight and cost of the bridge deck.
• Durability results and sensor data from tests with live loads should be used to
provide information required for determining the cost-effective measures to be
used in life-cycle planning, determining a maintenance strategy, establishing
guidelines and inspection techniques, standards and acceptance criteria for
composite bridges for use in the transportation infrastructure.
• Criteria for material selection of fasteners, used to bond the tubes together along
with the adhesives, should consider resistance and mechanical properties for load
bearing applications with FRP composite materials because bolt replacement can
be problematic if metal degradation occurs during service.
10. CONCLUSIONS
The following conclusions can be drawn from the investigations conducted on
quarter portion of the bridge deck:
• Testing of the prototype deck sample indicates that the design of bridge deck
using readily available, off-the-shelf pultruded glass and carbon FRP tubes can
meet the necessary strength and deflection design criteria as defined in the
AASHTO specifications.

Prakash Kumar, K. Chandrashekhara and Antonio Nanni, “Structural Performance of a FRP Bridge Deck,” ASCE Journal of Composites for Construction, March 2001.
22
• The deflection and strain histories show linear elastic bending and shear behavior
with a slightly non-linear envelope close to the failure load. The deflections and
strains are very symmetric up to the point of failure. The net central deflection
ranged within the allowable limits of length/800.
• The fatigue test served as simple baseline indicator of the long-term durability of
the composite deck. The sample showed almost no reduction in stiffness or
strength after 2 million cycles of fatigue loading in excess of the design wheel
load.
• The failure load of 133.45 kN (30,000 lb) was almost four times the design wheel
load of 35.5 kN (8,000 lb) for the quarter section of the bridge deck. The failure
was caused due to the twisting of tubes in the fifth layer from top of the deck
while at the same time almost no other form of distortion or failure was observed
in any other layer of tubes. Damage accumulated gradually at higher load levels,
which is reflected in the deflection and strain histories. Ultimate failure was non-
catastrophic which is advantageous from civil engineering point of view.
• The testing of quarter portion of the bridge deck in the laboratory provided
valuable information to resolve certain manufacturing and design issues such as
bonding between the tubes and number of layers of tubes to be used.
Furthermore, the data measured during the testing provided baseline information

Prakash Kumar, K. Chandrashekhara and Antonio Nanni, “Structural Performance of a FRP Bridge Deck,” ASCE Journal of Composites for Construction, March 2001.
23
by which to judge the bridge design and to compare later test data from the actual
installed full-size bridge deck.
Based on results of the present research and of extensive laboratory tests on FRP
tubes and their assemblies, all-composite bridge decks made of pultruded glass and
carbon tubes are judged to be a suitable replacement for short span bridges made of
conventional materials. Although this is not the most efficient design for an all-
composite bridge deck, it does represent a unique opportunity to implement composites
in a vehicular bridge.
11. ACKNOWLEDGEMENTS
The Missouri Department of Transportation, National Science Foundation –
CRCD program, Lemay Center for Composites Technology, and University
Transportation Center of University of Missouri at Rolla supported this work. The
authors would like to thank Mr. John Unser of Composite Products Inc. for providing the
test samples.
12. REFERENCES
American Association of State Highway and Transportation Officials. (1996).
“Standard Specifications for Highway Bridges”, AASHTO, Washington D.C., Sixteenth
Edition.
Aref, A. J. and Parsons, I. D. (1996). “Design and Analysis Procedures for a
Novel Fiber Reinforced Plastic Bridge Deck”, Advanced Composite Materials in Bridges
and Structures, CSCE, Montreal, Quebec, Canada, pp. 743-750.

Prakash Kumar, K. Chandrashekhara and Antonio Nanni, “Structural Performance of a FRP Bridge Deck,” ASCE Journal of Composites for Construction, March 2001.
24
Chajes, M., Gillespie, J., Mertz, D., Shenton, H. (1998). “Advanced Composite
Bridges in Delaware”, Proceedings of Second International Conference on Composites in
Infrastructure, Tuscon, Arizona, Vol.1, January 5-7, pp. 645-650.
Foster, D. C., Goble, G. C., Schulz, J. L., Commander, B. C., and Thomson, D. L.
(1998). “Structural Testing of a Composite Material Highway Bridge”, Proceedings of
International Composites Expo, Session 4-C, pp. 1-9.
Head, P. R. (1992). “Design Methods and Bridge Forms for the Cost Effective use
of Advanced Composites in Bridges”, Proceedings of 1st International Conference of
Advanced Composite Materials in Bridges and Structures, Sherbrooke, Quebec, Canada,
pp. 15-30.
Karbhari, V.M., Seible, F., Heigemier, G.A. and Zhao, L., (1997). “Fiber
Reinforced Composite Decks for Infrastructure Renewal - Results and Issues”,
Proceedings of International Composites Expo, Session 3-C, pp. 1-6.
Kumar, P., Chandraskekhara, K. and Nanni, A. (2000). “Testing and Evaluation
of Components for a Composite Bridge Deck”, Journal of Reinforced Plastics and
Composites (To be published).
Liskey, K. (1991). “Structural Applications of Pultruded Composite Products”,
Proceedings of Specialty Conference on Advanced Composite Materials in Civil
Engineering Structures, Las Vegas, NV, January 31 & February 1, ASCE, New York,
N.Y., pp. 182-193.
Lopez-Anido, R., Gangarao, H. V. S., Pauer, R. J., and Vedam, V. R. (1998a).
“Evaluation of Polymer Concrete Overlay for FRP Composite Bridge Deck”,
Proceedings of International Composites Expo, Session 13-F, pp. 1-6.

Prakash Kumar, K. Chandrashekhara and Antonio Nanni, “Structural Performance of a FRP Bridge Deck,” ASCE Journal of Composites for Construction, March 2001.
25
Lopez-Anido, R., Howdyshell, P. A., Stephenson, L. D., and Gangarao, H. V. S.
(1998b). “Fatigue and Failure Evaluation of Modular FRP Composite Bridge Deck.”
Proceedings of International Composites Expo, Session 4-B, pp. 1-6.
Plunkett, J. D. (1997). “Fiber-Reinforced Polymer Honeycomb Short Span Bridge
for Rapid Installation”, IDEA Project Final Report, Contract NCHRP-96-ID030,
Transportation Research Board, National Research Council.
Richards, D., Dumlao, C., Henderson, M., and Foster, D. C. (1998). “Methods of
Installation and the Structural Analysis of Two Short Span Composite Highway Bridges”,
Proceedings of International Composites Expo, Session 4-E, pp. 1-6.
Seible, F. (1998). “US Perspective of Advanced Composites Bridge Technology
in Europe and Japan”, Proceedings of Second International Conference on Composites in
Infrastructure, Vol.2, January 5-7, pp. 605-636.
Zureick, A. H., Shih, B., Munley, E. (1995). “Fiber-Reinforced Polymeric Bridge
Decks”, Structural Engineering Review, Vol.7, No.3, pp. 257-266.

Prakash Kumar, K. Chandrashekhara and Antonio Nanni, “Structural Performance of a FRP Bridge Deck,” ASCE Journal of Composites for Construction, March 2001.
26
LIST OF FIGURES
Figure 1: H-20 Truck.
Figure 2: Diagram showing (a) overall dimensions and (b) actual longitudinal cross-
section geometry of the full-size bridge deck.
Figure 3: Diagram showing (a) overall dimensions and (b) actual longitudinal cross-
section geometry of the bridge deck test sample.
Figure 4: Experimental setup for the four-point static tests on the bridge deck test sample.
Figure 5: Experimental setup for the fatigue load tests.
Figure 6: Schematic of the four-point bend geometry.
Figure 7: Load-deflection curve for design load test up to a load of 111 kN (25,000 lb).
Figure 8: Load-strain curve for design load test up to a load of 111 kN (25,000 lb).
Figure 9: Load-deflection curves for progressive increments of fatigue cycles up to 2
million cycles.
Figure 10: Load-strain curves for progressive increments of fatigue cycles up to 2 million
cycles.
Figure 11: Load-deflection curve from ultimate load test at center.
Figure 12: Load-strain curve from ultimate load test at the center.
Figure 13: Exploded view of a few tubes in the fifth layer of the deck.
Figure 14: Plot of longitudinal strain recorded on the tubes of the second layer directly
below the loading patch.
Figure 15: Bridge deck during the process of installation.

Prakash Kumar, K. Chandrashekhara and Antonio Nanni, “Structural Performance of a FRP Bridge Deck,” ASCE Journal of Composites for Construction, March 2001.
27
Figure 1: H-20 Truck Note: 1 ft = 12 in = 304.8 mm; 1 kip = 4.45 kN
8 K 1 4 ’ – 0 ” 1 6 K 1 6 K 3 ’ - 9 1 / 2 ”

Prakash Kumar, K. Chandrashekhara and Antonio Nanni, “Structural Performance of a FRP Bridge Deck,” ASCE Journal of Composites for Construction, March 2001.
28
(a) Schematic diagram of the full-size bridge deck showing the side view and the dimensions
Note: All dimensions are in inches; 1 ft = 12 in = 304.8 mm
(b) Longitudinal cross-section of full-size bridge deck
Figure 2: Diagram showing (a) overall dimensions and (b) actual longitudinal cross-
section geometry of the full-size bridge deck

Prakash Kumar, K. Chandrashekhara and Antonio Nanni, “Structural Performance of a FRP Bridge Deck,” ASCE Journal of Composites for Construction, March 2001.
29
(a) Schematic diagram of the bridge deck test sample showing side view and the
dimensions
Note: All dimensions are in inches; 1 ft = 12 in = 304.8 mm
(b) Longitudinal cross-section of bridge deck test sample
Figure 3: Diagram showing (a) overall dimensions and (b) actual longitudinal cross-
section geometry of the bridge deck test sample

Prakash Kumar, K. Chandrashekhara and Antonio Nanni, “Structural Performance of a FRP Bridge Deck,” ASCE Journal of Composites for Construction, March 2001.
30
Figure 4: Experimental setup for the four-point static tests on the bridge deck test sample

Prakash Kumar, K. Chandrashekhara and Antonio Nanni, “Structural Performance of a FRP Bridge Deck,” ASCE Journal of Composites for Construction, March 2001.
31
Figure 5: Experimental setup for the fatigue load tests

Prakash Kumar, K. Chandrashekhara and Antonio Nanni, “Structural Performance of a FRP Bridge Deck,” ASCE Journal of Composites for Construction, March 2001.
32
Figure 6: Schematic of four-point bend geometry Note: 1 ft = 12 in = 304.8 mm
4 ft
2 ft
Jack
Reaction Beam
Spreader BeamSpecimen
28 ft1 ft 1 ft
Load Cell
LVDT StrainGage
Loading Pad

Prakash Kumar, K. Chandrashekhara and Antonio Nanni, “Structural Performance of a FRP Bridge Deck,” ASCE Journal of Composites for Construction, March 2001.
33
Figure 7: Load-deflection curve for design load test up to a load of 111 kN (25,000 lb) Note: 1 in = 25.4 mm; 1 lb = 4.45 N
0
5 0 0 0
1 0 0 0 0
1 5 0 0 0
2 0 0 0 0
2 5 0 0 0
3 0 0 0 0
0 0 . 2 0 . 4 0 . 6 0 . 8 1D e f l e c t i o n ( i n )

Prakash Kumar, K. Chandrashekhara and Antonio Nanni, “Structural Performance of a FRP Bridge Deck,” ASCE Journal of Composites for Construction, March 2001.
34
Figure 8: Load-strain curve for design load test up to a load of 111 kN (25,000 lb) Note: 1 in = 25.4 mm; 1 lb = 4.45 N
0
5 0 0 0
1 0 0 0 0
1 5 0 0 0
2 0 0 0 0
2 5 0 0 0
3 0 0 0 0
0 1 0 0 2 0 0 3 0 0 4 0 0 5 0 0
M i c r o s t r a i n

Prakash Kumar, K. Chandrashekhara and Antonio Nanni, “Structural Performance of a FRP Bridge Deck,” ASCE Journal of Composites for Construction, March 2001.
35
Figure 9: Load-deflection curves for progressive increments of fatigue cycles up to 2 million cycles
Note: 1 in = 25.4 mm; 1 lb = 4.45 N
0
5000
10000
15000
20000
25000
0 0.2 0.4 0.6 0.8Deflection (in)

Prakash Kumar, K. Chandrashekhara and Antonio Nanni, “Structural Performance of a FRP Bridge Deck,” ASCE Journal of Composites for Construction, March 2001.
36
0
5 0 0 0
1 0 0 0 0
1 5 0 0 0
2 0 0 0 0
2 5 0 0 0
0 1 0 0 2 0 0 3 0 0 4 0 0M i c r o s t r a i n
Figure 10: Load-strain curves for progressive increments of fatigue cycles up to 2 million cycles
Note: 1 in = 25.4 mm; 1 lb = 4.45 N

Prakash Kumar, K. Chandrashekhara and Antonio Nanni, “Structural Performance of a FRP Bridge Deck,” ASCE Journal of Composites for Construction, March 2001.
37
0
5000
10000
15000
20000
25000
30000
35000
40000
0 1 2 3 4Deflection (in)
Figure 11: Load-deflection curve from ultimate load test at center Note: 1 in = 25.4 mm; 1 lb = 4.45 N

Prakash Kumar, K. Chandrashekhara and Antonio Nanni, “Structural Performance of a FRP Bridge Deck,” ASCE Journal of Composites for Construction, March 2001.
38
0
5 0 0 0
1 0 0 0 0
1 5 0 0 0
2 0 0 0 0
2 5 0 0 0
3 0 0 0 0
3 5 0 0 0
4 0 0 0 0
0 2 0 0 4 0 0 6 0 0 8 0 0 1 0 0 0M i c r o s t r a i n
Figure 12: Load-strain curve from ultimate load test at center Note: 1 in = 25.4 mm; 1 lb = 4.45 N

Prakash Kumar, K. Chandrashekhara and Antonio Nanni, “Structural Performance of a FRP Bridge Deck,” ASCE Journal of Composites for Construction, March 2001.
39
Figure 13: Exploded view of a few tubes in the fifth layer of the deck
Cracking of the edges

Prakash Kumar, K. Chandrashekhara and Antonio Nanni, “Structural Performance of a FRP Bridge Deck,” ASCE Journal of Composites for Construction, March 2001.
40
Figure 14: Plot of longitudinal strain recorded on the tubes of second layer directly below the loading patch
Note: 1 in = 25.4 mm; 1 lb = 4.45 N
0
5000
10000
15000
20000
25000
30000
35000
40000
-750 -550 -350 -150Microstrain
Prakash Kumar, K. Chandrashekhara and Antonio Nanni, “Structural Performance of a FRP Bridge Deck,” ASCE Journal of Composites for Construction, March 2001.
41
13.
Figure 15: Bridge Deck during the process of installation