DBI 2022 Investor Day Deck
103
APRIL 8, 2022
-
Upload
khangminh22 -
Category
Documents
-
view
1 -
download
0
Transcript of DBI 2022 Investor Day Deck

APRIL 8, 2022

© 2022 Designer Brands All rights reserved.2
FORWARD LOOKING STATEMENTS
This presentation contains statements concerning our current expectations, assumptions, plans, estimates, judgments and projections about our business and
our industry and other statements that are not historical facts.
You can identify these forward-looking statements by the use of forward-looking words such as "outlook," "could," "believes," "expects," "potential," "may,"
"will," "should," "would," "approximately," "plans," "estimates," "anticipates," "targets” or the negative version of those words or other comparable words. These
statements are based on the Company's current views and expectations and involve known and unknown risks, uncertainties and other factors that may
cause actual results, performance or achievements to be materially different from any future results, performance or achievements expressed or implied by
the forward-looking statements. These factors include, but are not limited to: risks and uncertainty related to the ongoing coronavirus ("COVID-19")
pandemic, any future COVID-19 resurgence, and any other adverse public health developments; uncertain general economic conditions, including inflation
and supply chain pressures, domestic and global political and social conditions and the potential impact of geopolitical turmoil or conflict, and the related
impacts to consumer discretionary spending; our ability to anticipate and respond to fashion trends, consumer preferences and changing customer
expectations; maintaining strong relationships with our vendors, manufacturers, licensors, and retailer customers; risks related to losses or disruptions
associated with our distribution systems, including our distribution centers and fulfillment center and stores, whether as a result of the COVID-19 pandemic,
reliance on third-party providers, or otherwise; our reliance on our loyalty programs and marketing to drive traffic, sales and customer loyalty; failure to retain
our key executives or attract qualified new personnel; risks related to the loss or disruption of our information systems and data and our ability to prevent or
mitigate breaches of our information security and the compromise of sensitive and confidential data; our ability to protect our reputation and to maintain
the brands we license; risks related to restrictions imposed by our credit facility that could limit our ability to fund operations; our competitiveness with respect
to style, price, brand availability and customer service; our ability to provide customers with cost-effective shopping platforms; risks related to our
international operations, including international trade, our reliance on foreign sources for merchandise, exposure to political, economic, operational,
compliance and other risks, and fluctuations in foreign currency exchange rates; our ability to protect the health and safety of our associates and our
customers, which may be affected by current or future government regulations related to stay-at-home orders and/or orders related to the operation of
non-essential businesses; our ability to comply with privacy laws and regulations, as well as other legal obligations; and uncertainty related to future
legislation, regulatory reform, policy changes, or interpretive guidance on existing legislation. Risks and other factors that could cause our actual results to
differ materially from our forward-looking statements are described in the Company's latest Annual Report on Form 10-K or other reports filed with the
Securities and Exchange Commission.
All forward-looking statements included herein are only made as of the date of this presentation. We undertake no obligation to publicly update or revise
any forward-looking statements, including any financial targets and estimates, whether as a result of new information, future events, or otherwise.

© 2022 Designer Brands All rights reserved.3
TODAY’S PRESENTERS
Christina JacksonLeader of Diversity, Equity & Inclusion, DBI
Jared PoffChief Financial Officer, DBI
Roger RawlinsChief Executive Officer, DBI
Jim WeinbergEVP & Chief Merchandising Officer, DSW
Julie RoySVP & Chief Marketing Officer, DSW
Bill JordanPresident & Chief Growth Officer, DBI
Sarah RosenSVP Marketing & Communications,
Camuto Group

Roger Rawlins, Chief Executive Officer
4

5

© 2022 Designer Brands All rights reserved.6
WHO WE WERE
1 Unparalleled Number of Brands
20+ years of creating value by building award-winning retail dominance,
infrastructure, and scale
2 Significant Retail Footprint Coast to Coast
3 Loyalty Program

© 2022 Designer Brands All rights reserved.7
WHY WE HAD TO EVOLVE
Value creation in traditional retailing diminished over last 10 years
Since 2011, 5 retail groups acquired 20% of market
Technology Drove Changes in Customer Behavior
Brands Have Gone Direct-to-Consumer
0.2% 11.7%5.9%1.5%0.7%
Brands DTC

© 2022 Designer Brands All rights reserved.88

© 2022 Designer Brands All rights reserved.9
DESIGNER BRANDS TODAY
1Brand Focused
• Producing Owned Brands
• National Brand Partners
2 Customer First
3 Significant Footprint Provides DTC Infrastructure

© 2022 Designer Brands All rights reserved.10
HOW WE WILL GROW
Customer Focus Brand Building Speed & Efficiency

© 2022 Designer Brands All rights reserved.11
LEVERAGING KEY CAPABILITIES TO DRIVE GROWTH
Doubling sales of Owned
Brands in all channelsMaintaining sales in
National Brands

© 2022 Designer Brands All rights reserved.12
TRANSFORMED, DIFFERENTIATED, UNIQUE
Leading with Owned Brands:
Transformed from retailer to brand builder
Evolving partnerships with National Brands through value add and must have capabilities
Knowing our nearly 30M customers like our best friends: Leveraging data analytics from omni-channel
Delivering shareholder value through topline growth, margin expansion, and cash generation

Julie Roy, Chief Marketing Officer for DSW13

14 © 2022 Designer Brands All rights reserved.
CustomerWe know WHO YOU ARE
We know WHAT YOU WANT
We design FOR YOU
We meet you WHERE YOU ARE

© 2022 Designer Brands All rights reserved.1515

16 © 2022 Designer Brands All rights reserved.
Capturing
Target
Customers
Contextual
Considerations
Purchase Motivators
Media Consumption
Interests & Preferences
Channel Engagement &
Footwear Preferences
Category Engagement
Demographics

© 2022 Designer Brands All rights reserved.1717 © 2022 Designer Brands All rights reserved.
CAPTURING OUR TARGET CUSTOMERS
Vince Camuto Mix No. 6
Married Female
Working Professional
Well Above Average HHI
Inspiration from:
Older Gen-Z/Young Millennial
College Student/Young
Professional
No Kids, Lower HHI
Focused on:
Trend, Style, Quality, Comfort,
& Fit
Affordable Luxury
Cooking
Brunching
Vacation Getaways
Focused on:
Style & Trend: Favoring Trendy
Brands with Attainable Price
Points
Engaging socially on:
Beauty
Music
Gaming
Influencers
Customer Reviews
Fit Rating
FOMO
Social Validation

18 © 2022 Designer Brands All rights reserved.
Engaging with
consumers how
and where they spend their time

© 2022 Designer Brands All rights reserved.19

Experts at attracting
new customers
20 © 2022 Designer Brands All rights reserved.

© 2022 Designer Brands All rights reserved.21
DRIVING RECORD CUSTOMER ACQUISITION
Increase in Loyalty Members Enrolled Annually
2017 to 2021
56%

© 2022 Designer Brands All rights reserved.22
~87% of demand
Nearly 30M members
Over 30% of members for 10+ years
Award-winning program

© 2022 Designer Brands All rights reserved.23
~87% of demand
Nearly 30M members
Over 30% of members for 10+ years
Award-winning program
43%Greater spend from customers that
buy an Owned Brand at DSW

© 2022 Designer Brands All rights reserved.24
INCREASING CUSTOMER SATISFACTION
“Ever since my daughter-in-law introduced me to
DSW, that is the only shoe store I go to, and it’s
been over 10 years!”
“There is legitimately no other shoes place on
this Earth that cares for you and gives back
to others like DSW does.”
“I bought Vince Camuto ten years ago and the experience and quality then to now is the same.
Thank you for the consistency in your brand.
Vince is walking me from my twenties to my
marriage … it’s poetic. Thank you for all the
great date shoes and my I Do shoes.”
9/10NPS Customer
Satisfaction Score

© 2022 Designer Brands All rights reserved.25
ALWAYS focused on enhancing our capabilities to better serve our customer
… and power our DTC growth
Omni Capabilities
& ExperienceLoyalty Brand BuildingPersonalization

© 2022 Designer Brands All rights reserved.26
WAREHOUSE REIMAGINED
Marrying $1B digital platform with omni-led store redesign
Optimize capacity
Amplify brands
Deliver an elevated
omni-channel experience
Create ease & convenience

Jim Weinberg, Chief Merchandising Officer, DSW
Sarah Rosen, SVP Marketing & Communications, Camuto Group
28

© 2022 Designer Brands All rights reserved.29

© 2022 Designer Brands All rights reserved.30
LEVERAGING KEY CAPABILITIES TO DRIVE GROWTH
Doubling sales of Owned
Brands in all channelsMaintaining sales in
National Brands

© 2022 Designer Brands All rights reserved.31
SPRING 2022 CAMPAIGN
31

© 2022 Designer Brands All rights reserved.32
DON’T LOOK IN THE REARVIEW MIRROR.
FOCUS ON THE ROAD AHEAD. TAKE THE WHEEL. TAKE CHARGE.
BELIEVE. BE YOU. BE INVINCIBLE.32

© 2022 Designer Brands All rights reserved.3333

34

© 2022 Designer Brands All rights reserved.35
+ ++ =Attention to
detail, expert
craftsmanship
& inspired
style for every
occasion
CRAFT/QUALITY/STYLE
VALUE
PROPOSITION
Content
“I’m passionate
about creating
a product
that infuses
great style &
comfort with
unparalleled
value.”
—Vince Camuto
HERITAGE
AUTHENTIC
STORY
Content
IT'S TIME TO
LIVE
INVINCIBLE!Bold designs
that boost
confidence,
encourage
creativity &
promote fashion
choice
ASPIRATIONAL
CAMPAIGN
MESSAGE
Content
To inspire
everyone to
express
their best
selves, one
shoe
at a time
SELF-EXPRESSION
BRAND
MISSION
Content
To become
the world’s
most-beloved
fashion
footwear
brand
BELOVED!
BRAND
VISION
Status
WHAT SETS VINCE CAMUTO APART? OUR FORMULA.
35

© 2022 Designer Brands All rights reserved.36
CRAFT/QUALITY/STYLE CONTENT
EXPERT CRAFTSMANSHIPPREMIUM QUALITY ALWAYS DESIGNED36

© 2022 Designer Brands All rights reserved.37
HERITAGE CONTENT
OUR LEGACY RICH INSPIRATION VC ATELIER/EXCLUSIVES 37

© 2022 Designer Brands All rights reserved.38
ASPIRATIONAL CONTENT
AD CAMPAIGN VIDEO BEHIND-THE-SCENES38

© 2022 Designer Brands All rights reserved.39
SELF-EXPRESSION CONTENT
INFLUENCER/CELEB TREND AUTHORITY OCCASION & EVERYDAY39

BRAND-BUILDING MEDIA
Amplify INVINCIBLE messaging
& acquire NEW customers with
a full funnel strategy.
EXPAND OUR REACH
BUILD NEW AUDIENCES
LEAD WITH VIDEO
TEST NEW PARTNERS
BRAND STORY
ACROSS-CHANNELS
40

© 2022 Designer Brands All rights reserved.41
BRAND SOCIAL PRESENCEBRAND SOCIAL PRESENCE
Brand storytelling, style
inspiration & dynamic
audience engagement.
ALWAYS-ON
INVINCIBLE INSPIRATION
LIVE SELLING, Q&As,
TAKEOVERS
STAND OUT WITH VIDEO
TEST & REACT PRODUCT
& LIFESTYLE CONTENT
GROW FOLLOWING & AUDIENCE
REINFORCE BRAND LOVE & LOYALTY
41

© 2022 Designer Brands All rights reserved.42
INFLUENCER MARKETING
Amplify INVINCIBLE story through
trusted voices & deliver VC
inspiration to millions of followers.
BUILD NEW AUDIENCES
AT SCALE
ESTABLISH
#INVINCIBLEVC COMMUNITY
DOMINATE FASHION
LANDSCAPE
PROMOTE SELF EXPRESSION,
DIVERSITY & INCLUSION
EXPAND FOOTPRINT
ACROSS CHANNELS
42

© 2022 Designer Brands All rights reserved.43
CELEBRITY PARTNERSHIPS
Reach new audiences & drive
brand building buzz via gifting
& partnerships.
ALIGN VC WITH
OF-THE-MOMENT TALENT
LEVERAGE RELEVANT
AUDIENCES AT SCALE
BUILD BRAND AWARENESS
DRIVE ENGAGEMENT
& CONSIDERATION
REINFORCE BRAND
LOVE & LOYALTY

ENTER TO WIN
LISTEN NOW
EXPERIENTIAL GIFTING
INVINCIBLE campaign comes
to life through a memorable,
music-themed experience.
RECORD PLAYER
INVINCIBLE-THEMED PLAYLIST
DRIVE EMOTIONAL BRAND
CONNECTION & CONTENT
GENERATION
FUEL BRAND AMBASSADORS
CELEBRITY, VIP, INFLUENCER
& STYLISTS
EXTEND TO CUSTOMER
SOCIAL, SITE & EMAIL INTEGRATION
44
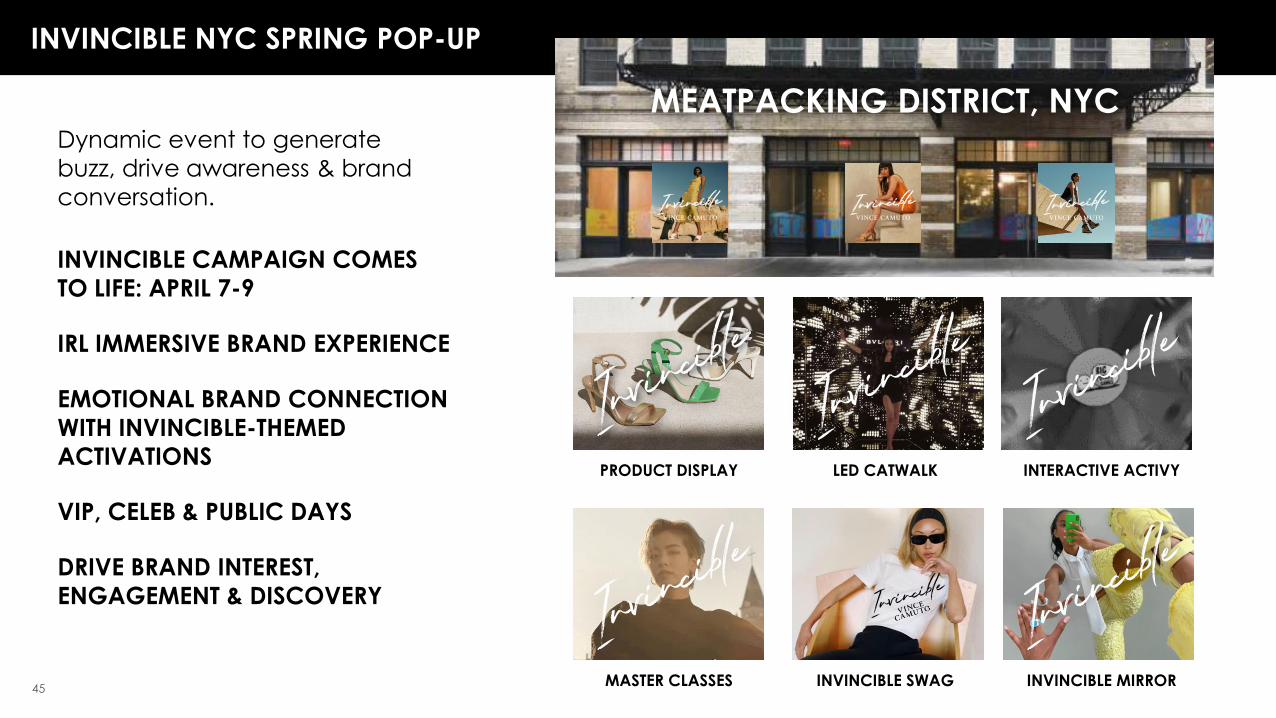
INVINCIBLE NYC SPRING POP-UP
Dynamic event to generate
buzz, drive awareness & brand
conversation.
INVINCIBLE CAMPAIGN COMES
TO LIFE: APRIL 7-9
IRL IMMERSIVE BRAND EXPERIENCE
EMOTIONAL BRAND CONNECTION
WITH INVINCIBLE-THEMED
ACTIVATIONS
VIP, CELEB & PUBLIC DAYS
DRIVE BRAND INTEREST,
ENGAGEMENT & DISCOVERY
INVINCIBLE MIRRORINVINCIBLE SWAG
PRODUCT DISPLAY INTERACTIVE ACTIVY
MASTER CLASSES
LED CATWALK
MEATPACKING DISTRICT, NYC
45

VC SHOP-IN-SHOPS
QR CODE
ASSOCIATE
ENGAGEMENT
& BRAND
STORYTELLING
ENHANCED
SUPPORT
EMAIL, SOCIAL,
PDP ALTS &
SITE CONTENT
EXCLUSIVE
CAMPAIGN
IMAGERY
OUR DTC APPROACH
SHOP NOW
46

NORDSTROM
WHOLESALE MARKETING
NORDSTROM MEDIA NETWORK
BRAND PAGE LAUNCH
PAID SOCIAL CAMPAIGN
INFLUENCER CONTENT
EXCLUSIVE CAMPAIGN IMAGERY
MONTHLY EMAILS, SOCIAL, PDP ALTS
BRAND TRAINING GUIDES
CUSTOM INFLUENCER CAMPAIGNS
AMAZONDILLARD’S
A+ CONTENT
PAY-PER-CLICK ADS
DISPLAY ADS
VINE CUSTOMER REVIEWS 47

© 2022 Designer Brands All rights reserved.48
THIS IS OUR APPROACH ACROSS ALL OUR OWNED BRANDS
48

© 2022 Designer Brands All rights reserved.49


© 2022 Designer Brands All rights reserved.51

© 2022 Designer Brands All rights reserved.52

© 2022 Designer Brands All rights reserved.53

© 2022 Designer Brands All rights reserved.54
HUSH PUPPIES

© 2022 Designer Brands All rights reserved.55
LEVERAGING KEY CAPABILITIES TO DRIVE GROWTH
Doubling sales of Owned
Brands in all channelsMaintaining sales in
National Brands

© 2022 Designer Brands All rights reserved.56

© 2022 Designer Brands All rights reserved.57

© 2022 Designer Brands All rights reserved.58

© 2022 Designer Brands All rights reserved.59

© 2022 Designer Brands All rights reserved.60

© 2022 Designer Brands All rights reserved.61
WELL-POSITIONED FOR THE FUTURE

Bill Jordan, President & Chief Growth Officer, DBI
62

© 2022 Designer Brands All rights reserved.63
SPEED & EFFICIENCY
Sourcing Supply Chain

© 2022 Designer Brands All rights reserved.64
SOURCING VISION
Speed in Design Cycle Country Diversification Sustainability AUC Decrease
Eliminate 2 months in
production cycle
Decrease overall exposure
to China
Provide alternative factory
options to protect against
global events
Expand test and learn
capabilities in order to quickly
capitalize on trends
Sourcing

© 2022 Designer Brands All rights reserved.65
SUSTAINABILITY Sourcing
What We Have Added
3D Technology

© 2022 Designer Brands All rights reserved.66
AUC DECREASE
*AUC includes mix changes. Actual AUC's will be calculated by brand/class to ensure we get the 10% savings.
19.4
23.2
Pairs Plan
2021A 2024E
~20%
AUC* Plan
2021A 2024E
(10%)
Sourcing
Pairs Plan AUC*

© 2022 Designer Brands All rights reserved.67
SUPPLY CHAIN VISION Supply Chain
2-3 Day & Same Day
Delivery DTC
Extend Supply
Chain Capabilities
to Key Brands
StoresShared Inventory
Availability

© 2022 Designer Brands All rights reserved.68
BRINGING 2-3 DAY DELIVERY TO LIFE Supply Chain
East Coast Fulfillment
ConsolidationOrder Management
System UpgradeWest Coast
Distribution CenterHub Facilities
Parcel Carriers/ Rate Shopping
Net Savings Faster Delivery to Customers & Replenishment to DSW Stores

© 2022 Designer Brands All rights reserved.69

© 2022 Designer Brands All rights reserved.70
SHARING INVENTORY AVAILABILITY
Brand.com
BOPISBrand.com
Returns
Shipping
Directly to
Brand.com
Customers
Brand.com
DSW
© 2022 Designer Brands All rights reserved.71
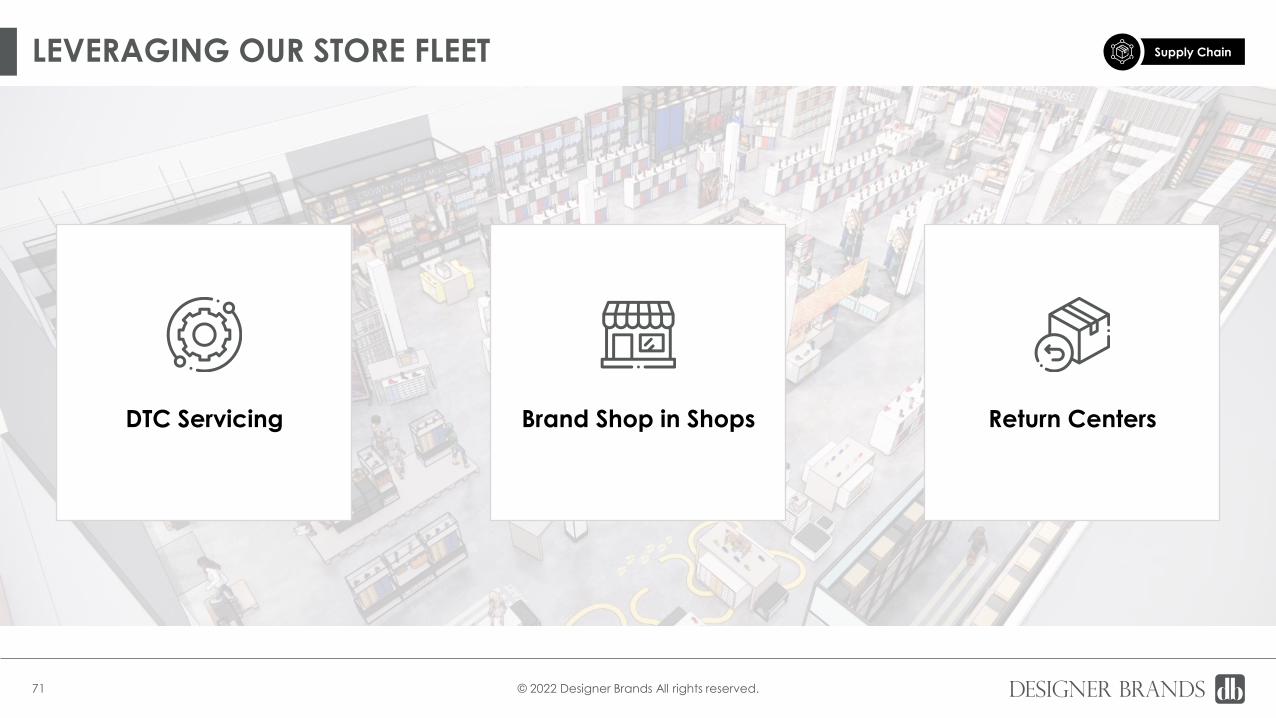
LEVERAGING OUR STORE FLEET Supply Chain
DTC Servicing Brand Shop in Shops Return Centers

© 2022 Designer Brands All rights reserved.72
SPEED & EFFICIENCY
Sourcing Supply Chain
• Deliver product in a shorter timeframe at
less cost
• Allow National Brands to leverage our
DTC infrastructure for their customers

Christina Jackson, Leader of Diversity, Equity & Inclusion at DBI73

© 2022 Designer Brands All rights reserved.74
CREATING VALUE OVER THE LONG-TERM
Our Goal: Being Difference Makers
Improving the well-being of our planet
and its people
Promoting diversity, equity, & inclusion,
supporting our communities
Helping to create a sustainable world

© 2022 Designer Brands All rights reserved.75
WHAT WE’VE ACCOMPLISHED SO FAR…

© 2022 Designer Brands All rights reserved.76
…BUT WE AREN’T FINISHED YET
Reaching New Heights as We Build
for the Future
Building strong pipeline of diverse talent in the
design and footwear industry1
Conserving resources and supporting
the underserved2
Reviewing our practices internally & leading from
the top3

© 2022 Designer Brands All rights reserved.77
Goal: Change the Face of the Footwear Industry
SUPPORTING THE NEXT GENERATION OF DESIGNERS
Helping to move the needle on representation of Black
designers (currently only 3%)
Partnering with Dr. D’Wayne Edwards
• Investing $2M in the first Black-owned footwear factory in the U.S.
• Increasing representation of Black designers in footwear industry
• Designed by students and sold directly at DSW
1

© 2022 Designer Brands All rights reserved.78
DBI IS SYNONYMOUS WITH SHOE DONATION
Partnership with Soles4Souls
Program Goals:
Donations ReceivedPairs of Shoes,
Rewards, Dollars
1
Customer Growth MetricsOverall Donators +
New/Unique
2
AmplificationImpressions, Press, Reach
3
Recent Milestones:
~6.0M pairs of shoes donated since May 2018
~180M pounds of carbon dioxide emissions saved
~7.5M pounds of textiles saved from landfills
2

© 2022 Designer Brands All rights reserved.79
8,577 families can receive a full year of food, shelter, and educationResonates Strongly with Customers, Associates, and Our Mission
Empowering
MicrobusinessesInspiring Global &
Local Service Trips
2

© 2022 Designer Brands All rights reserved.80
WE ARE WALKING THE WALK
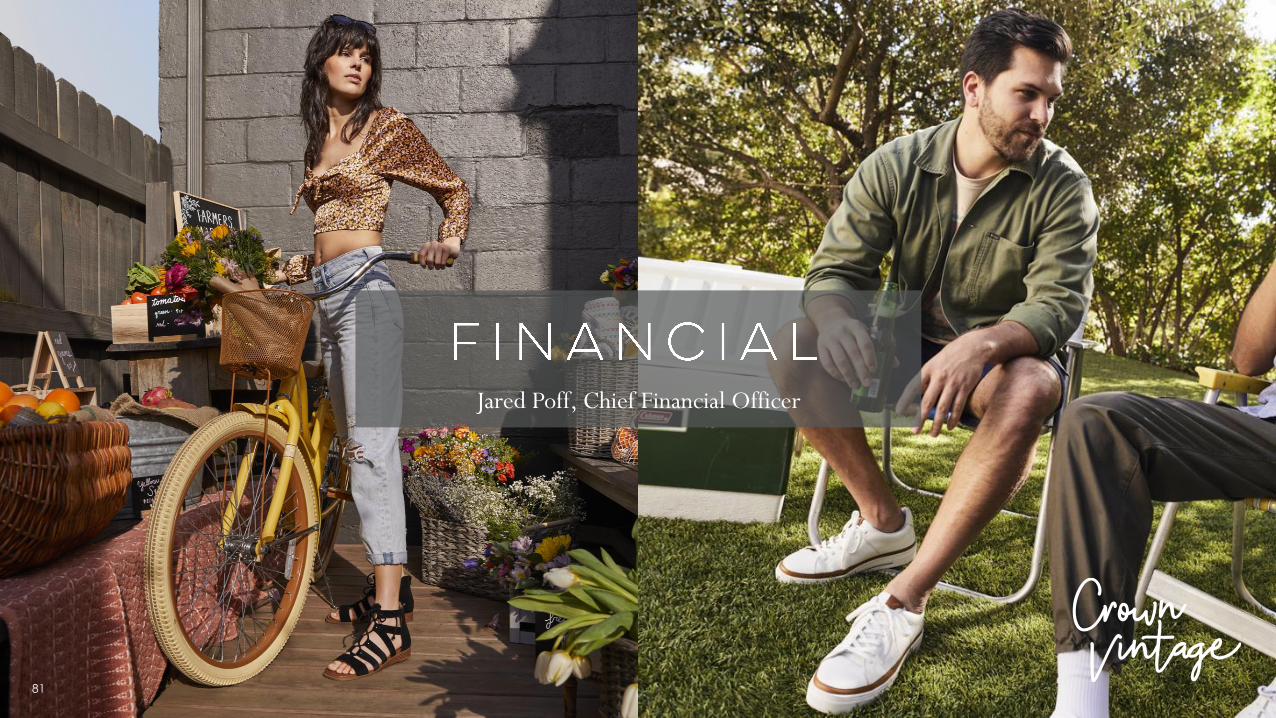
Jared Poff, Chief Financial Officer
81

© 2022 Designer Brands All rights reserved.82
SUSTAINED GROWTH
3,493
3,197
MSD Growth
2019 2021 2022 Guidance
Sales
$1.27
$2.00
$1.80 – $1.90
2019 2021 2022 Guidance
EPSSales GAAP Diluted EPSNumbers shown in millions
© 2022 Designer Brands All rights reserved.83
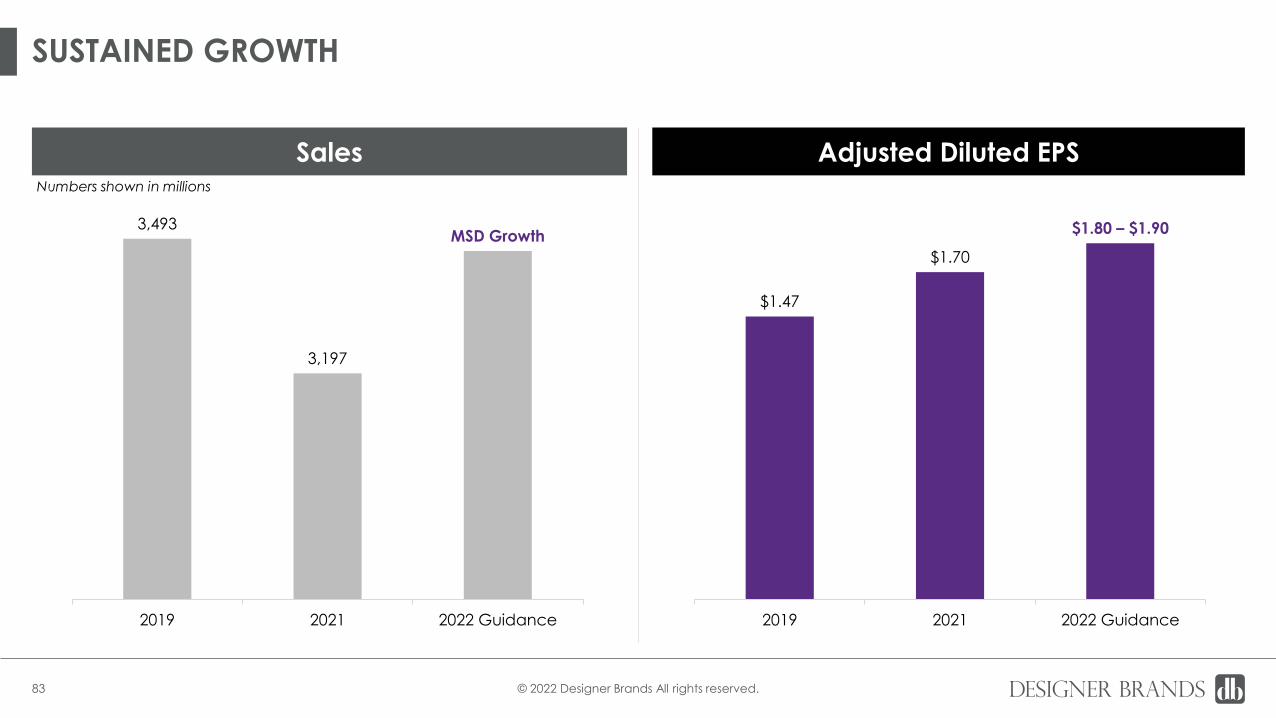
SUSTAINED GROWTH
3,493
3,197
MSD Growth
2019 2021 2022 Guidance
Sales
$1.47
$1.70
$1.80 – $1.90
2019 2021 2022 Guidance
EPSSales Adjusted Diluted EPSNumbers shown in millions

© 2022 Designer Brands All rights reserved.84
STRONG PERFORMANCE IN 2021
FY21 Sales
$3.2B
FY21 Digital
Demand
$1B
FY21 Gross
Profit
$1.1B
FY21 Gross
Margin
33.4%
FY21
Operating
Income
$205M
Black Friday 2021
Highest Single Day Demand
3Q21 DBI
Quarterly
Gross Margin
36.7%
3Q21 DBI
Quarterly Op.
Income
$104M
3Q21
Quarterly
Diluted EPS
$1.04
3Q21 DBI
Quarterly
Gross Profit
$314M
3Q21 DBI
Quarterly Net
Income
$80M
2Q21 US
Retail Comp
Sales
94.3%
2Q21 US
Retail Gross
Profit
$257M
2Q21 DBI
Gross Profit
$285M
Reported Results

© 2022 Designer Brands All rights reserved.85
STRONG PERFORMANCE IN 2021
FY21 Sales
$3.2B
FY21 Digital
Demand
$1B
FY21 Gross
Profit
$1.1B
FY21 Gross
Margin
33.4%
FY21 Adj.
Operating
Income
$214M
Black Friday 2021
Highest Single Day Demand
3Q21 DBI
Quarterly
Gross Margin
36.7%
3Q21 DBI
Quarterly Adj.
Op. Income
$102M
3Q21
Quarterly Adj.
Diluted EPS
$0.86
3Q21 DBI
Quarterly
Gross Profit
$314M
3Q21 DBI
Quarterly Adj.
Net Income
$67M
2Q21 US
Retail Comp
Sales
94.3%
2Q21 US
Retail Gross
Profit
$257M
2Q21 DBI
Gross Profit
$285M
Achievements in Fiscal 2021

© 2022 Designer Brands All rights reserved.86
SOURCES OF REVENUE GROWTH
Targeting $4.0B in net sales by 2026
DSW
VC.com
Wholesale$3.2B
$4.0B

© 2022 Designer Brands All rights reserved.87
GROWING DTC
2021 2026E
Owned Brands – 19% Owned Brands – 29%
DTC Channel – 14% DTC Channel – 21%
© 2022 Designer Brands All rights reserved.88
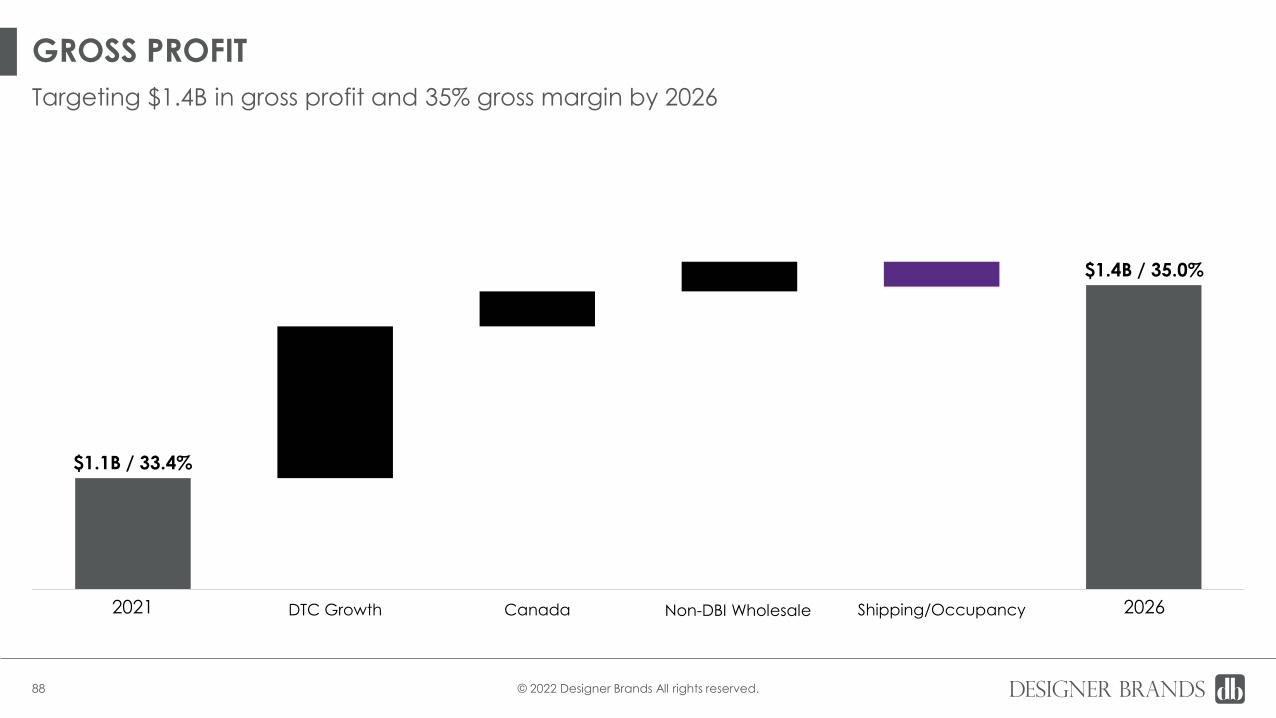
GROSS PROFIT
Targeting $1.4B in gross profit and 35% gross margin by 2026
$1.1B / 33.4%
FY'21 DTC Growth Canada Camuto non-DBI
Wholesale
Shipping/Occupancy FY'262021 2026
$1.4B / 35.0%
Non-DBI Wholesale

© 2022 Designer Brands All rights reserved.89
OWNED BRANDS DRIVING MARGIN UPSIDE
Numbers shown in billions(Excludes Canada)
2021 2026 Targets
Net Sales
Owned Brands $0.6 $1.2 98% Growth
National Brands $2.3 $2.4 3% Growth
Merchandise Margin
Owned Brands 65.2% 66.2% 100 bps
National Brands 49.4% 48.0% (140) bps

© 2022 Designer Brands All rights reserved.90
OPERATING MARGIN IMPROVEMENT
-
Shipping & Labor
Inflation
~200 BPS
ImprovementAnticipated by 2026
+Owned Brand Growth
Sourcing Cost
Reductions
Store Optimization
14% Decline in Sq Ft

© 2022 Designer Brands All rights reserved.91
OPPORTUNITY FOR OPERATING MARGIN EXPANSION
6.7% to 9%+
$205
$306$356
2021 2024E 2026E
6.4%
8.2%8.8%
2021 2024E 2026E
GAAP Operating Income GAAP Operating Margin

© 2022 Designer Brands All rights reserved.92
OPPORTUNITY FOR OPERATING MARGIN EXPANSION
6.7% to 9%+
$214
$306$356
2021 2024E 2026E
6.7%
8.2%8.8%
2021 2024E 2026E
Adjusted Operating Income Adjusted Operating Margin

© 2022 Designer Brands All rights reserved.93
$1.27
$2.00
2019 2021 2022 Guidance 2024E 2026E
GAAP EPS
GAAP EPS CAGR of ~7%
Over Next Five Years
$1.80 - $1.90
FUTURE GROWTH
EPS Guidance Raised to
$1.80-$1.90 for FY2022
$2.75 - $2.85
$2.45 - $2.55
© 2022 Designer Brands All rights reserved.94
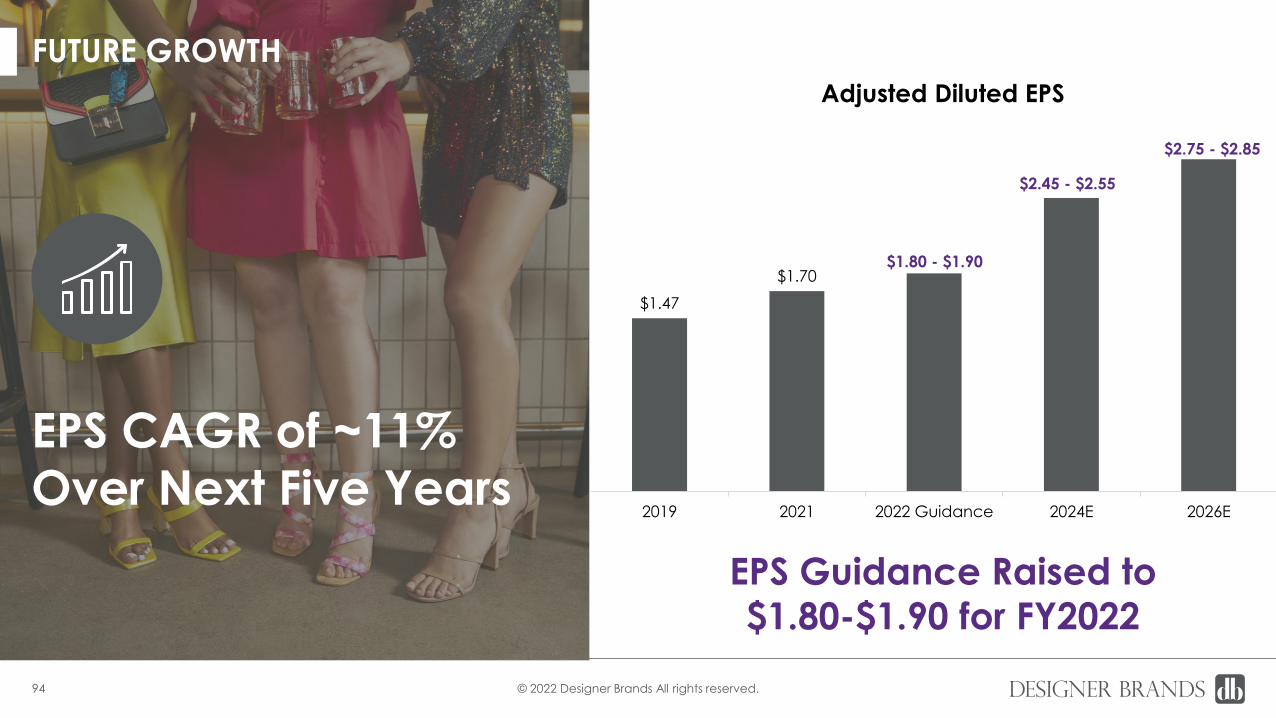
$1.47
$1.70
2019 2021 2022 Guidance 2024E 2026E
Adjusted Diluted EPS
EPS CAGR of ~11%
Over Next Five Years
FUTURE GROWTH
EPS Guidance Raised to
$1.80-$1.90 for FY2022
$2.75 - $2.85
$2.45 - $2.55
$1.80 - $1.90

© 2022 Designer Brands All rights reserved.95
CAPITAL ALLOCATION
Capex Investment Dividends Share Repurchases Opportunistic M&A
Generating $1B of Cash from Operating Activities Over Next 5 Years

© 2022 Designer Brands All rights reserved.96
GENERATING STRONG RETURNS FOR SHAREHOLDERS
Owned Brand Growth
9% Operating Margins
+
Strong Free Cash Flow
Share Buybacks & Dividends
+
25% Expected Annual
Total Shareholder
Return CAGR

Roger Rawlins, Chief Executive Officer97

© 2022 Designer Brands All rights reserved.98
TRANSFORMED, DIFFERENTIATED, UNIQUE
Leading with Owned Brands:
Transformed from retailer to brand builder
Evolving partnerships with National Brands through value add and must have capabilities
Knowing our nearly 30M customers like our best friend: Leveraging data analytics from omni-channel
Delivering shareholder value through topline growth, margin expansion, and cash generation

Q & A SESSION

APPENDIX

© 2022 Designer Brands All rights reserved.101
NON-GAAP RECONCILIATIONS
NON-GAAP RECONCILIATIONS
(unaudited and in thousands, except per share amounts)
2019 2021
Fiscal Year First Quarter Second Quarter Third Quarter Fourth Quarter Fiscal Year
Operating profit $ 127,299 $ 17,005 $ 61,412 $ 104,308 $ 22,496 $ 205,221
Non-GAAP adjustments:
Integration and restructuring expenses 17,722 1,742 1,094 - 1,153 3,989
Acquisition-related costs and target acquisition costs (credits) - - 5,333 (2,107) - 3,226
Impairment charges 7,771 - 1,174 - 546 1,720
Total non-GAAP adjustments 25,493 1,742 7,601 (2,107) 1,699 8,935
Adjusted operating profit $ 152,792 $ 18,747 $ 69,013 $ 102,201 $ 24,195 $ 214,156
Operating profit as a percentage of net sales 3.6% 2.4% 7.5% 12.2% 2.7% 6.4%
Adjusted Operating profit as a percentage of net sales 4.4% 2.7% 8.4% 12.0% 2.9% 6.7%
Net income $ 94,497 $ 17,026 $ 42,860 $ 80,184 $ 14,411 $ 154,481
Non-GAAP adjustments:
Integration and restructuring expenses 17,722 1,742 1,094 - 1,153 3,989
Acquisition-related costs and target acquisition costs (credits) - - 5,333 (2,107) - 3,226
Impairment charges 7,771 - 1,174 - 546 1,720
Foreign currency losses (gains) 259 (806) 244 (172) 801 67
Total non-GAAP adjustments before tax 25,752 936 7,845 (2,279) 2,500 9,002
Tax effect of non-GAAP adjustments (6,664) (308) (1,871) 560 (672) (2,291)
Valuation allowance on deferred tax asset (3,949) (8,182) (5,395) (11,873) (4,500) (29,950)
Total adjustments, after tax 15,139 (7,554) 579 (13,592) (2,672) (23,239)
Adjusted net income $ 109,636 $ 9,472 $ 43,439 $ 66,592 $ 11,739 $ 131,242
Diluted earnings (loss) per share $ 1.27 $ 0.22 $ 0.55 $ 1.04 $ 0.19 $ 2.00
Adjusted diluted earnings per share $ 1.47 $ 0.12 $ 0.56 $ 0.86 $ 0.15 $ 1.70

© 2022 Designer Brands All rights reserved.102
NET SALES BY PRODUCT AND SERVICE CATEGORIES
(in thousands) 2021 2020 2019
Net sales:
U.S. Retail segment:
Women's footwear $ 1,772,729 $ 1,161,836 $ 1,853,265
Men's footwear 620,631 386,338 539,917
Kids' footwear 234,806 151,121 158,261
Accessories and other 141,540 101,028 193,952
2,769,706 1,800,323 2,745,395
Canada Retail segment:
Women's footwear 117,045 92,623 133,762
Men's footwear 60,972 45,665 63,140
Kids' footwear 48,503 37,233 40,995
Accessories and other 8,289 7,138 11,120
234,809 182,659 249,017
Brand Portfolio segment:
Wholesale 240,491 197,940 379,698
Commision income 17,657 18,509 26,424
Direct-to-consumer 27,876 21,299 15,453
Other - 10,898 26,710
286,024 248,646 448,285
Other - 62,909 122,090
Total segment net sales 3,290,539 2,294,537 3,564,787
Elimination of intersegment sales (93,956) (59,818) (72,100)
Total net sales $ 3,196,583 $ 2,234,719 $ 3,492,687

© 2022 Designer Brands All rights reserved.103
NET SALES BY BRAND CATEGORIES2021
(in thousands) US Retail Canada Retail Brand Portfolio Other / Eliminations Consolidated
Owned Brands:
Direct-to-consumer $ 421,398 $ - $ 27,876 $ - $ 449,275
External customer wholesale and commission income - - 164,192 - 164,192
Intersegment wholesale and commission income - - 93,956 (93,956) -
Total owned brands 421,398 - 286,024 (93,956) 613,466
National Brands 2,348,308 - - - 2,348,308
Canada Retail (1) - 234,809 - - 234,809
Total net sales $ 2,769,706 $ 234,809 $ 286,024 $ (93,956) $ 3,196,583
2020
(in thousands) US Retail Canada Retail Brand Portfolio Other / Eliminations Consolidated
Owned Brands:
Direct-to-consumer $ 260,618 $ - $ 21,299 $ - $ 281,917
External customer wholesale and commission income - - 156,631 - 156,631
Intersegment wholesale and commission income - - 59,818 (59,818) -
Total owned brands 260,618 - 237,748 (59,818) 438,549
National Brands 1,539,705 - - - 1,539,705
Canada Retail (1) - 182,659 - - 182,659
Other (2) - - 10,898 62,909 73,807
Total net sales $ 1,800,323 $ 182,659 $ 248,646 $ 3,091 $ 2,234,719
2019
(in thousands) US Retail Canada Retail Brand Portfolio Other / Eliminations Consolidated
Owned Brands:
Direct-to-consumer $ 460,808 $ - $ 15,453 $ - $ 476,261
External customer wholesale and commission income - - 334,022 - 334,022
Intersegment wholesale and commission income - - 72,100 (72,100) -
Total owned brands 460,808 - 421,575 (72,100) 810,283
National Brands 2,284,587 - - - 2,284,587
Canada Retail (1) - 249,017 - - 249,017
Other (2) - - 26,710 122,090 148,800
Total net sales $ 2,745,395 $ 249,017 $ 448,285 $ 49,990 $ 3,492,687
(1) We currently do not break out Canada Retail by brand categories
(2) Other represents discontinued revenue channels.