Float-Over of Arthit PP Deck
11
OTC 19230 Float-Over of Arthit PP Deck A. Kocaman and DJ Kim, J. Ray McDermott Engineering LLC, Houston, Texas; Seto Jian, J. Ray McDermott, Singapore Copyright 2008, Offshore Technology Conference This paper was prepared for presentation at the 2008 Offshore Technology Conference held in Houston, Texas, U.S.A., 5–8 May 2008. This paper was selected for presentation by an OTC program committee following review of information contained in an abstract submitted by the author(s). Contents of the paper have not been reviewed by the Offshore Technology Conference and are subject to correction by the author(s). The material does not necessarily reflect any position of the Offshore Technology Conference, its officers, or members. Electronic reproduction, distribution, or storage of any part of this paper without the written consent of the Offshore Technology Conference is prohibited. Permission to reproduce in print is restricted to an abstract of not more than 300 words; illustrations may not be copied. The abstract must contain conspicuous acknowledgment of OTC copyright. Abstract In December 2007, the 17,500-metric ton, Arthit PP deck was installed over the substructure in a single piece by a using J. Ray McDermott’s (J. Ray) transportation and installation barge Intermac-650 (I-650), specially designed for float-over installation. The Arthit Field is located in the Gulf of Thailand in 80 meters of water. A number of technical challenges were overcome to accomplish the successful and safe float-over. A single-piece deck installation using the float-over technique provides significant advantages over other methods of deck installation for heavy topsides, especially in areas of the world where access to heavy construction equipment, trained labor and supplies are not readily available or reliable. Time spent on offshore hook up and commissioning is also minimized by utilizing a single-piece installation. J. Ray engineers developed a simulation model to predict the I-650 barge motions and the loads between the deck and the barge, as well as the tensions in the mooring lines. Model tests were completed and the simulation method was verified. The analysis tools developed yielded reliable and repeatable results in selecting and designing components critical to the success of the float-over. Such components include the mooring system, the shock absorbing cells, sliding surfaces and vessel ballasting systems, and with careful analysis, risks can be minimized and the installation method could be guaranteed as successful. In this paper, computer analysis methods are explained; comparisons to the model tests and the results achieved in the real world are compared. The main conclusion is that the float-over method is an important, cost-effective, state-of-the-art tool in installing large sized decks in single piece. Introduction Installing production decks (topsides) offshore has always posed technical challenges. The main offshore construction equipment is the floating crane (derrick barge). For relatively light topsides, less than 3,000 metric tons, a number of lift vessels are available in most offshore areas of the world. For lifts of structures heavier than 3,000 metric tons, the number of vessels drops dramatically. To make matters worse, the vessels which have the capability to handle heavier topsides weights are committed to work in certain parts of the world and are very costly to mobilize for a project in a distant location. Apart from the lift capacity, several other factors that put severely limit the operation of even the high capacity derrick lift- barges. Although the “name plate” capacity exceeding 14,000 metric tons is being advertised in the market; the geometry, hook reach and water depth restrictions limit the ultimate lifting capacity to a single piece of about 10,000 metric tons. In addition, floating cranes are sensitive to the prevailing weather conditions at the installation site. For a swell dominated offshore site, it is not unusual for a floating crane to be de-rated 40-50% from its rated lift capacity. If a topsides heavier than 10,000 metric tons is to be installed using floating cranes, it will have to be divided into smaller modules that can be lifted individually. In such a scenario, offshore hook-up and commissioning will need to be extended at a cost premium.
-
Upload
independent -
Category
Documents
-
view
0 -
download
0
Transcript of Float-Over of Arthit PP Deck

OTC 19230
Float-Over of Arthit PP Deck A. Kocaman and DJ Kim, J. Ray McDermott Engineering LLC, Houston, Texas; Seto Jian, J. Ray McDermott, Singapore
Copyright 2008, Offshore Technology Conference This paper was prepared for presentation at the 2008 Offshore Technology Conference held in Houston, Texas, U.S.A., 5–8 May 2008. This paper was selected for presentation by an OTC program committee following review of information contained in an abstract submitted by the author(s). Contents of the paper have not been reviewed by the Offshore Technology Conference and are subject to correction by the author(s). The material does not necessarily reflect any position of the Offshore Technology Conference, its officers, or members. Electronic reproduction, distribution, or storage of any part of this paper without the written consent of the Offshore Technology Conference is prohibited. Permission to reproduce in print is restricted to an abstract of not more than 300 words; illustrations may not be copied. The abstract must contain conspicuous acknowledgment of OTC copyright.
Abstract In December 2007, the 17,500-metric ton, Arthit PP deck was installed over the substructure in a single piece by a using J. Ray McDermott’s (J. Ray) transportation and installation barge Intermac-650 (I-650), specially designed for float-over installation. The Arthit Field is located in the Gulf of Thailand in 80 meters of water.
A number of technical challenges were overcome to accomplish the successful and safe float-over. A single-piece deck installation using the float-over technique provides significant advantages over other methods of deck installation for heavy topsides, especially in areas of the world where access to heavy construction equipment, trained labor and supplies are not readily available or reliable. Time spent on offshore hook up and commissioning is also minimized by utilizing a single-piece installation. J. Ray engineers developed a simulation model to predict the I-650 barge motions and the loads between the deck and the barge, as well as the tensions in the mooring lines. Model tests were completed and the simulation method was verified. The analysis tools developed yielded reliable and repeatable results in selecting and designing components critical to the success of the float-over. Such components include the mooring system, the shock absorbing cells, sliding surfaces and vessel ballasting systems, and with careful analysis, risks can be minimized and the installation method could be guaranteed as successful. In this paper, computer analysis methods are explained; comparisons to the model tests and the results achieved in the real world are compared. The main conclusion is that the float-over method is an important, cost-effective, state-of-the-art tool in installing large sized decks in single piece.
Introduction Installing production decks (topsides) offshore has always posed technical challenges. The main offshore construction equipment is the floating crane (derrick barge). For relatively light topsides, less than 3,000 metric tons, a number of lift vessels are available in most offshore areas of the world. For lifts of structures heavier than 3,000 metric tons, the number of vessels drops dramatically. To make matters worse, the vessels which have the capability to handle heavier topsides weights are committed to work in certain parts of the world and are very costly to mobilize for a project in a distant location. Apart from the lift capacity, several other factors that put severely limit the operation of even the high capacity derrick lift-barges. Although the “name plate” capacity exceeding 14,000 metric tons is being advertised in the market; the geometry, hook reach and water depth restrictions limit the ultimate lifting capacity to a single piece of about 10,000 metric tons. In addition, floating cranes are sensitive to the prevailing weather conditions at the installation site. For a swell dominated offshore site, it is not unusual for a floating crane to be de-rated 40-50% from its rated lift capacity. If a topsides heavier than 10,000 metric tons is to be installed using floating cranes, it will have to be divided into smaller modules that can be lifted individually. In such a scenario, offshore hook-up and commissioning will need to be extended at a cost premium.

2 OTC 19230
Various float-over methodologies have been developed where heavy topsides are mated with the pre-installed substructure at the offshore site, exposed to the weather elements.
A number of production decks (topsides) were installed in the Norwegian sector of the North Sea that were heavier than 10,000 tons using a float-over technique. However, in the case of these platforms, the topsides were mated with the substructure in a Norwegian fjord, protected from the environment. The substructures were gravity base structure (GBS) type, afloat at the time of float-over, which were then transported to the offshore site as an integral unit with the topsides.
In the past, a of 21,000-metric ton topsides was floated over a TLP hull which itself was afloat. In recent years, a topsides of 21,500-metric ton was floated over a fixed substructure using a “T” shaped barge. Numerous other float-over topsides installations were accomplished ranging from 3,200 metric tons up to 19,000 metric tons. In all of the float-over work, the engineers had to face and overcome numerous technical challenges:
• Availability of vessels with capability to loadout, transport and float-over heavy topsides • Design, fabrication and procurement of specialty float-over hardware, such as leg mating units (LMU’s) • Deck support frame to distribute the load and provide the correct height to support the topsides • Mooring layout • Rapid ballast system • Prevailing weather conditions • Design of the substructure • Timing of offshore operations • Safety
OTC19072 (Reference-1) by Seij and de Groot is a good source of available float-over methodologies and the hardware. Description of Arthit PP Deck Float-over The Arthit Field lies in the Gulf of Thailand in 80 meters of water, roughly 640 kilometers south of Bangkok. The field operator is PTTEP. The field consists of seven wellhead platforms with production tied to a central processing facility. The production, mainly natural gas, is collected, processed at the PP platform and pipelined to shore. The Arthit PP deck is, by far, the heaviest piece in the complex.
Figure-1 below shows the Arthit deck float-over completed in December 2007 by J. Ray .
Figure-1 Arthit Deck – as the barge enters the jacket slot

OTC 19230 3
The Arthit Field operator, PTTEP, recognizing the potential effects of the installation; chose the topsides to be float-over installation early in the design stage. The substructure (jacket) has also been designed for a float-over. A generic barge with a total width of 42 meters, narrow enough to fit into the jacket slot, and wide enough to have enough stability for transportation had been assumed for deck design purposes. The substructure was designed to handle typical barge impact and barge fender loads. The deck was fabricated by J. Ray at Batam Island, Indonesia (30 miles south of Singapore). At the time J. Ray proposed to fabricate and install the Arthit deck, a barge with capacity to loadout, transport and float-over Arthit deck did not exist in J. Ray’s fleet. The launch barge I-650 had the capacity to transport the deck but with 51.8 meters width, it will not fit into the jacket slot. The feasibility of modifying the jacket and the deck was investigated, however, thejacket and deck designs were at an advanced stage and could not be modified to suit the available barge. There were potentially suitable barges owned by others, however, most were not available. A decision was made to modify the I-650 to loadout, transport and float-over the deck. The bow half of the I-650 was reduced in width from 51.8 meters down to 42 meters in a dry dock in December of 2005. This modification allowed I-650 to have 1.5 meter clearance on either side of the barge as the barge entered the jacket slot. Reference-2 by Kocaman et al provides details of the barge modification to suit the float-over.
The method proposed for Arthit was to use a loose slot method (further defined below), using shock cells at the jacket legs, leg mating units (LMUs) and sliding surface deck support units (DSUs). A new built deck support frame (DSF) was used to loadout and transport the deck at correct height. The DSF also served as load spreading grillage, distributing the deck weight into the I-650 frames properly.
The mooring system consisted of eight mooring lines terminating at sea bed anchors and eight mating lines terminating at jacket legs.
Loadout The deck was fabricated low on the fabrication yard skidways to provide improved clearance for the cranes. The first step was to raise the deck and slide the DSF underneath the deck. The deck was then lowered onto the DSF and tiedowns between the two were installed.
Figure-2 Deck Loadout
4 OTC 19230
Four sets of strand jacks were placed on one side at the end of the DSF and at the opposite end at the deadman structure at the bow of the barge. Each jack had a capacity to generate 900 tons of pull, enough to overcome friction.
The deck loadout was designed for around-the-clock operation. A temporary barge ballast system was installed, while leaving the barge’s own ballast system on stand-by as a back up.
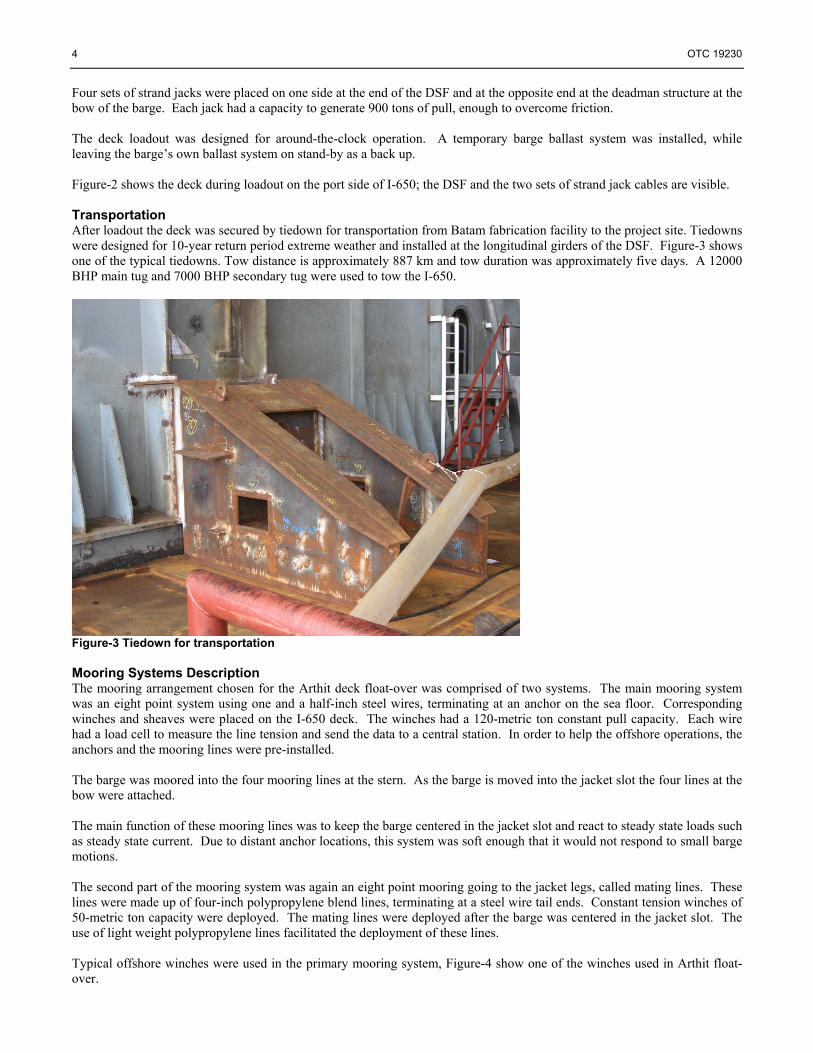
Figure-2 shows the deck during loadout on the port side of I-650; the DSF and the two sets of strand jack cables are visible. Transportation After loadout the deck was secured by tiedown for transportation from Batam fabrication facility to the project site. Tiedowns were designed for 10-year return period extreme weather and installed at the longitudinal girders of the DSF. Figure-3 shows one of the typical tiedowns. Tow distance is approximately 887 km and tow duration was approximately five days. A 12000 BHP main tug and 7000 BHP secondary tug were used to tow the I-650.
Figure-3 Tiedown for transportation Mooring Systems Description The mooring arrangement chosen for the Arthit deck float-over was comprised of two systems. The main mooring system was an eight point system using one and a half-inch steel wires, terminating at an anchor on the sea floor. Corresponding winches and sheaves were placed on the I-650 deck. The winches had a 120-metric ton constant pull capacity. Each wire had a load cell to measure the line tension and send the data to a central station. In order to help the offshore operations, the anchors and the mooring lines were pre-installed.
The barge was moored into the four mooring lines at the stern. As the barge is moved into the jacket slot the four lines at the bow were attached.
The main function of these mooring lines was to keep the barge centered in the jacket slot and react to steady state loads such as steady state current. Due to distant anchor locations, this system was soft enough that it would not respond to small barge motions.
The second part of the mooring system was again an eight point mooring going to the jacket legs, called mating lines. These lines were made up of four-inch polypropylene blend lines, terminating at a steel wire tail ends. Constant tension winches of 50-metric ton capacity were deployed. The mating lines were deployed after the barge was centered in the jacket slot. The use of light weight polypropylene lines facilitated the deployment of these lines.
Typical offshore winches were used in the primary mooring system, Figure-4 show one of the winches used in Arthit float-over.

OTC 19230 5
Figure-4 Typical mooring winch Loose Slot Method The preferred method at J. Ray is to use the loose slot, allowing the vessel to enter and exit with only minimal and incidental contact. The weather limits were established that would eliminate barge contacting the substructure during float-over. In a contingency case when such a contact is unavoidable, the contact would not cause further damage to the deck, barge or the substructure. As indicated above in the description section, the clearance achieved was 1.5 meters on either side. Computer simulations and model tests were made to ensure the vessel did not contact the substructure or if the contact occurred under a contingency case the vessel and the substructure would not sustain detrimental damage. Float-over Phases From an operational point of view, there are several distinct phases of the operation. Brief descriptions of these phases are:
• Standby: Where the vessel is a safe distance from the substructure but connected to the mooring system and last minute preparations are underway, such as preparing the vessel rapid ballast system or the hydraulic jacks.
• Docking: The vessel enters the substructure. • Pre-Mating: When ballasting the vessel to match the LMU’s with receptors and removing the remaining tie downs,
it is critical that the vessel motions be limited to suit the chosen LMU geometry. No weight transfer yet occurs. • Mating: The topsides is lowered onto the substructure by either rapid ballasting of the vessel or by contracting the
hydraulic jacks. The topsides weight is transferred to the jacket completely. • Post-mating: A gap is created between the DSU and the vessel. Enough gap needs to develop so that vessel motions
will not cause contact between the two. • Exit: The vessel is removed from the jacket slot.
Computer Modeling of Float-over In the analysis of the float-over operation, the vessel motions and the resulting loads in the LMU, DSU and mooring lines needed to be estimated accurately so that further fabrication and design efforts could continue for these components. The principal software used at J. Ray is MOSES, Marine Operational Structural Engineering Software (Ultramarine) for simulating marine operations. The software allows modeling and simulation of a number of bodies connected in a variety of ways, and the bodies can be subjected to wave, wind and current action. To predict the motions and related connector loads, 3-D time domain analysis was used. The float-over system was modeled as three independent rigid bodies with different types of connectors. For the hydrodynamic calculation, a 3-D diffraction method was used.
6 OTC 19230
For most motion analysis software the float-over barge hull needs to be defined as a collection of panel plates. The topsides can be modeled as a rigid body. The program needs to have means to connect the topsides and the vessel using rigid and flexible connector members as well as the mooring lines. The analysis program will then assemble all the components together:
• The barge is connected to the seafloor by mooring wires. • The barge is connected to the jacket using mating lines. • The topsides is connected to the barge using rigid connecter simulation the stiffness of the DSUs. • DSU will contain vertical gap spring and lateral spring element to simulate a frictional surface between the topsides
and the barge. • The topsides will be connected to the jacket using LMUs. • LMUs will have a nonlinear gap spring element considering mating cone and receptor geometry and ability to
generate side loads.
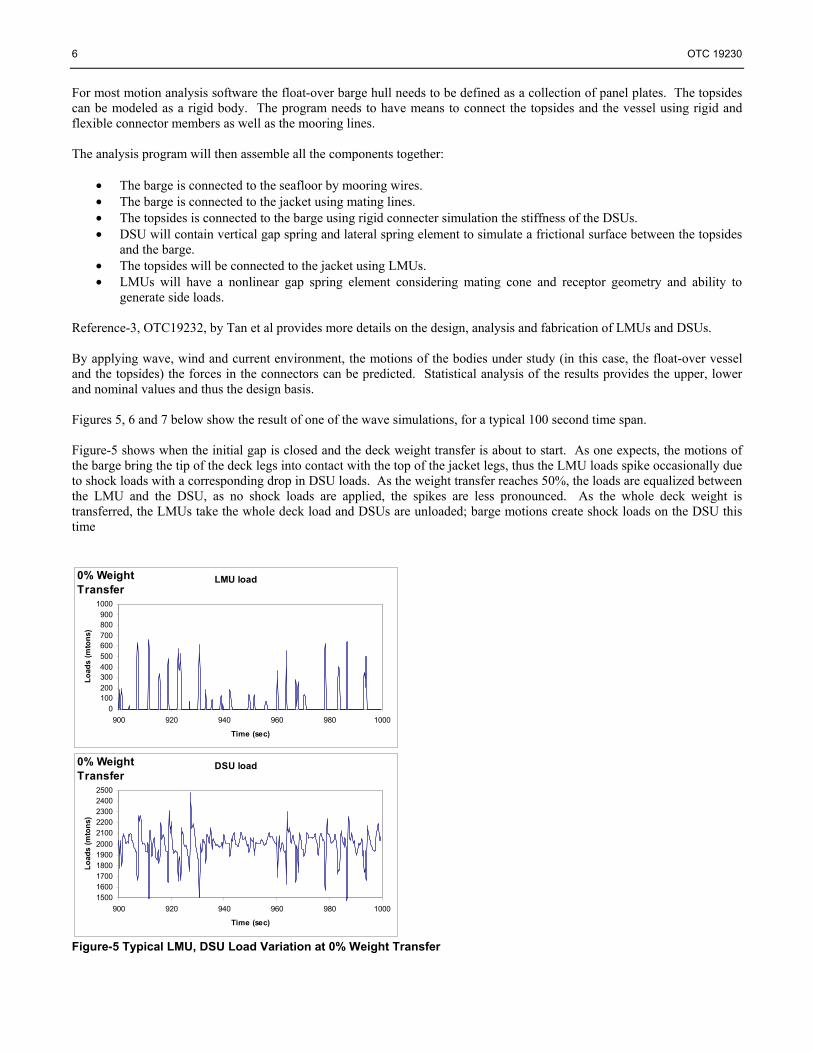
Reference-3, OTC19232, by Tan et al provides more details on the design, analysis and fabrication of LMUs and DSUs. By applying wave, wind and current environment, the motions of the bodies under study (in this case, the float-over vessel and the topsides) the forces in the connectors can be predicted. Statistical analysis of the results provides the upper, lower and nominal values and thus the design basis. Figures 5, 6 and 7 below show the result of one of the wave simulations, for a typical 100 second time span. Figure-5 shows when the initial gap is closed and the deck weight transfer is about to start. As one expects, the motions of the barge bring the tip of the deck legs into contact with the top of the jacket legs, thus the LMU loads spike occasionally due to shock loads with a corresponding drop in DSU loads. As the weight transfer reaches 50%, the loads are equalized between the LMU and the DSU, as no shock loads are applied, the spikes are less pronounced. As the whole deck weight is transferred, the LMUs take the whole deck load and DSUs are unloaded; barge motions create shock loads on the DSU this time
LMU load
0100200300400500600700800900
1000
900 920 940 960 980 1000
Time (sec)
Load
s (m
tons
)
0% Weight Transfer
DSU load
15001600170018001900200021002200230024002500
900 920 940 960 980 1000
Time (sec)
Load
s (m
tons
)
0% Weight Transfer
Figure-5 Typical LMU, DSU Load Variation at 0% Weight Transfer

OTC 19230 7
LMU load
0
200
400
600
800
1000
1200
1400
1600
900 920 940 960 980 1000
Time (sec)
Load
s (m
tons
)
50% Weight Transfer
DSU load
0
200
400
600
800
1000
1200
1400
1600
900 920 940 960 980 1000
Time (sec)
Load
s (m
tons
)
50% Weight Transfer
Figure-6 Typical LMU, DSU Load Variation at 50% Weight Transfer
LMU load
1000
1200
1400
1600
1800
2000
2200
2400
2600
900 920 940 960 980 1000
Time (sec)
Load
s (m
tons
)
100% Weight Transfer
DSU load
0
200
400
600
800
1000
1200
1400
1600
900 920 940 960 980 1000
Time (sec)
Load
s (m
tons
)
100% Weight Transfer
Figire-7 Typical LMU, DSU Load Variation at 100% Weight Transfer

8 OTC 19230
Model Testing In most instances, computer simulations will not be enough to assess the feasibility of the float-over and establish the design criteria for the individual components. Model testing is a good way to verify that the computer simulations do accurately define the reality and no surprises are incurred. A six-week model testing program was conducted at Offshore Model Basin (OMB) in Escondido, CA in December 2005 though January 2006. The model scale must be selected carefully. The wave heights and the swell heights to be used in prototype scale are small, less than two meters. Scaling the waves to model scale will produce very small waves at low periods which will be test facility limited and add further complications. For these tests a model scale of 1:50 was used. This scale is probably the upper limit for float-over tests. Even at that scale, the model scale waves were 3-4 cm in height and one second in period. Creating such a small wave in a wave tank is not an easy task! Figure-8 shows the model test configuration for a float-over using I-650. The jacket is visible with load cells. Mooring lines are also visible; however, to simplify the model testing, the jacket legs are reduced to four and the mooring lines were also reduced to four.
Figure-8 Float-over model test using I-650 Modern instrumentation techniques and digitized data collection offer great advantages. Significant amounts of operational data can be collected and processed easily. In these tests, the motions of the topsides and the barge were measured separately. The optical tracking system was used for the 3-D motion measurements and it allowed for determination of the velocities and accelerations. The LMUs and the DSUs were instrumented using 2-D and 3-D load cells measuring contact forces. Load cells were installed on the mooring and the mating lines recorded the line tensions. Typical wave staffs were used to measure wave heights in three locations in the basin so that the generated wave parameters could be derived for each test. The test plan included, generation of random amplitude operators (RAOs) for the barge, system natural period tests, irregular waves with and without swell component for float-over conditions, irregular waves for tow sea keeping condition and towing resistance tests.

Correlation Between Model Test and Simulations One of the technical challenges of model testing is interpretation of the results and correlation to the computer simulations. A comparison of LMU load as calculated and measured in the wave basin is shown in Figure-9 below. Close correlation is observed providing evidence for the accuracy of computer simulations.
LMU Connector Loads at Leg 1 In Z Direction
0.0
1000.0
2000.0
3000.0
4000.0
5000.0
0 45 90 135 180
Wave Heading (degree)
Forc
e In
Z D
irect
ion
(tons
)
OMB Force In Z Direction
JRME Force In Z Direction
Figure-9 Comparison of LMU loads
Weather Data Weather climate at the project site is relatively mild. Swell is defined as the part of spectral energy with spectral peak period greater than 6.9 seconds according to metocean data. Swell condition is the worst during August when the southwest monsoon is enhanced by the tropical revolving storm (TRS) passing through Western Pacific and northern South China Sea. High wind waves are generated by strong local monsoon wind, which sit on top of the long swells that are generated in the southern South China Sea and propagate to the site from the southeast through the opening of the gulf. In August, 24% of swell heights are greater than 0.5m and 5% are greater than 1.0m. The predominant swell direction is from the southeast with 40% of frequency of occurrence and the secondary swell direction is from the west with 32% of frequency. Local wave climate at the installation site is mild with significant wave heights being less than 1.0m in an average year 86% of the time. Worst wave conditions occur in December during the northeast monsoon (November to March) and in August during the southwest monsoon (June to September). In the case of December, the worst condition occurs when a TRS hits the site. Under non-TRS conditions, wave condition in January is worse than in December.
Month Dominant Direction
Hs < 0.5m
Hs < 1.0m
Hs < 1.5m
Jan E 14.90 61.3 96.2 Feb E 20.40 76.0 98.9 Mar E 38.90 81.4 98.2 Apr E 48.70 87.9 99.8 May E,SE 30.80 84.9 98.6 Jun E,SE,S,W 26.30 73.5 99.4 Jul SE,S,W 16.40 64.5 98.8
Aug SE,S,W 9.20 55.6 93.4 Sep E,SE 15.40 73.5 99.7 Oct E,SE,W 32.70 88.8 98.7 Nov N,NE,E 15.80 72.4 97.6 Dec N,NE,E 12.30 50.8 91.5
All year E,SE 23.90 74.0 97.7 Table-1 Percentage occurrence of total Hs
10 OTC 19230
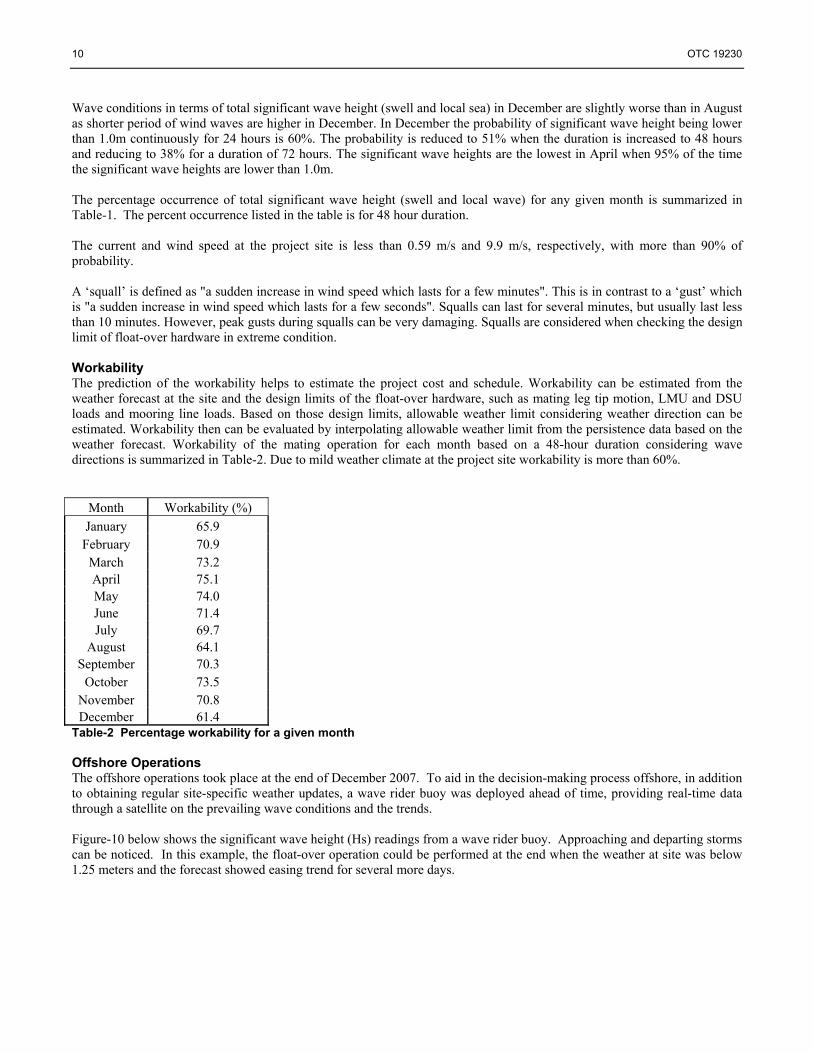
Wave conditions in terms of total significant wave height (swell and local sea) in December are slightly worse than in August as shorter period of wind waves are higher in December. In December the probability of significant wave height being lower than 1.0m continuously for 24 hours is 60%. The probability is reduced to 51% when the duration is increased to 48 hours and reducing to 38% for a duration of 72 hours. The significant wave heights are the lowest in April when 95% of the time the significant wave heights are lower than 1.0m. The percentage occurrence of total significant wave height (swell and local wave) for any given month is summarized in Table-1. The percent occurrence listed in the table is for 48 hour duration. The current and wind speed at the project site is less than 0.59 m/s and 9.9 m/s, respectively, with more than 90% of probability. A ‘squall’ is defined as "a sudden increase in wind speed which lasts for a few minutes". This is in contrast to a ‘gust’ which is "a sudden increase in wind speed which lasts for a few seconds". Squalls can last for several minutes, but usually last less than 10 minutes. However, peak gusts during squalls can be very damaging. Squalls are considered when checking the design limit of float-over hardware in extreme condition. Workability The prediction of the workability helps to estimate the project cost and schedule. Workability can be estimated from the weather forecast at the site and the design limits of the float-over hardware, such as mating leg tip motion, LMU and DSU loads and mooring line loads. Based on those design limits, allowable weather limit considering weather direction can be estimated. Workability then can be evaluated by interpolating allowable weather limit from the persistence data based on the weather forecast. Workability of the mating operation for each month based on a 48-hour duration considering wave directions is summarized in Table-2. Due to mild weather climate at the project site workability is more than 60%.
Month Workability (%) January 65.9 February 70.9 March 73.2 April 75.1 May 74.0 June 71.4 July 69.7
August 64.1 September 70.3
October 73.5 November 70.8 December 61.4
Table-2 Percentage workability for a given month
Offshore Operations The offshore operations took place at the end of December 2007. To aid in the decision-making process offshore, in addition to obtaining regular site-specific weather updates, a wave rider buoy was deployed ahead of time, providing real-time data through a satellite on the prevailing wave conditions and the trends. Figure-10 below shows the significant wave height (Hs) readings from a wave rider buoy. Approaching and departing storms can be noticed. In this example, the float-over operation could be performed at the end when the weather at site was below 1.25 meters and the forecast showed easing trend for several more days.

OTC 19230 11
0
0.5
1
1.5
2
2.5
3
0 10 20 30 40 50 60
Days
Hs
(m)
Figure-10 Wave rider buoy data
The real-time data collected by the wave rider buoy can be compared to the hindcast data to see if the prevailing weather is better or worse than the hindcast. Such a comparison is shown as percent exceedence data in Figure-11 below. The solid line is the hindcast; the dashed line shows the actual data. It is clear that the installation period in question was worse than the hindcast, thus appropriate reduction had to be made in the workability percentages shown in Table-2.
0
0.1
0.2
0.3
0.4
0.5
0.6
0.7
0.8
0.9
1
0 0.5 1 1.5 2 2.5 3
Hs (m)
% E
xcee
denc
e
Figure-11 Real vs. hindcast comparison
Conclusions The challenges facing the engineers in designing float-over operations are numerous, but quantifiable. We have tried to describe some of them in this paper. The successful completion of the Arthit PP deck float-over demonstrated that the Intermac-650 and the use of loose slot method is a viable way to install very large topsides safely and economically.
ACKNOWLEDGEMENT Authors wish to thank Richard Newhouse and Louise Denly of J. Ray McDermott Engineering for their contributions and helpful suggestions for this paper. REFERENCES 1- Seij, M and de Groot, H. “State of the Art in Float-Overs”, OTC 19072, May 2007 2- Kocaman, A. et al “I-650 Changing Form for Changing Times”, Offshore Magazine, Volume 66 Issue 8, August 2006 3- Tan B. et al “Arthit Filed Development: Float-over Hardware Design and Issues” OTC 19232, May 2008.