Predicting the location of entorhinal cortex from MRI
10
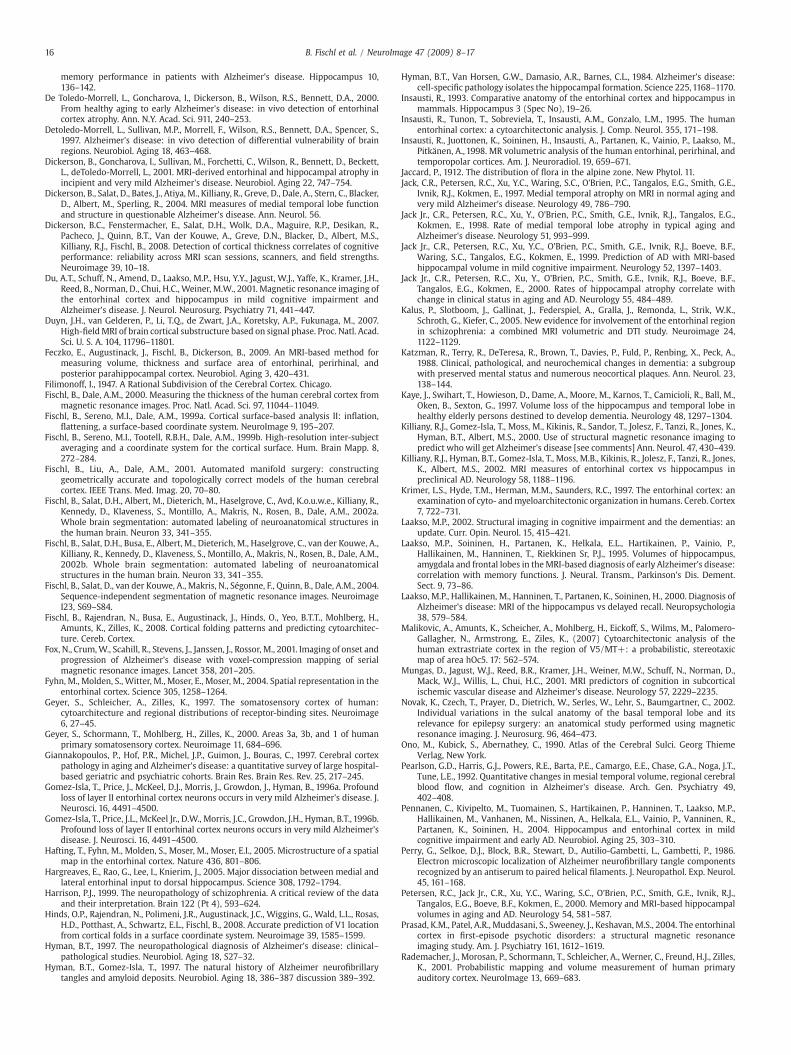
Predicting the location of entorhinal cortex from MRI Bruce Fischl a,b, ⁎, Allison A. Stevens a , Niranjini Rajendran e , B.T. Thomas Yeo b , Douglas N. Greve a , Koen Van Leemput a,b , Jonathan R. Polimeni a , Sita Kakunoori a , Randy L. Buckner a , Jennifer Pacheco f , David H. Salat a , Jennifer Melcher d , Matthew P. Frosch c , Bradley T. Hyman c , P. Ellen Grant a , Bruce R. Rosen a , André J.W. van der Kouwe a , Graham C. Wiggins g , Lawrence L. Wald a , Jean C. Augustinack a a Athinoula A Martinos Center, Department of Radiology, MGH, Harvard Medical School, USA b MIT Computer Science and AI Lab, USA c Department of Neurology, MGH, Harvard Medical School, USA d Department of Otology and Laryngology, MGH, Harvard Medical School, USA e RUSH Alzheimer's Disease Center, RUSH University Medical Center, 600 S. Paulina, Suite 1044, Chicago, IL 60612, USA f Department of Psychology, The University of Texas at Austin, USA g Center for Biomedical Imaging, NYU Medical Center, New York, NY, USA abstract article info Article history: Received 23 January 2009 Revised 23 March 2009 Accepted 7 April 2009 Available online 16 April 2009 Keywords: Morphometry MRI Alzheimer's disease Entorhinal cortex (EC) is a medial temporal lobe area critical to memory formation and spatial navigation that is among the earliest parts of the brain affected by Alzheimer's disease (AD). Accurate localization of EC would thus greatly facilitate early detection and diagnosis of AD. In this study, we used ultra-high resolution ex vivo MRI to directly visualize the architectonic features that define EC rostrocaudally and mediolaterally, then applied surface-based registration techniques to quantify the variability of EC with respect to cortical geometry, and made predictions of its location on in vivo scans. The results indicate that EC can be localized quite accurately based on cortical folding patterns, within 3 mm in vivo, a significant step forward in our ability to detect the earliest effects of AD when clinical intervention is most likely to be effective. © 2009 Elsevier Inc. All rights reserved. Introduction In the medial temporal lobe, the hippocampal formation and in particular the entorhinal cortex (EC) – the anterior parahippocampal gyrus – show the most significant neurofibrillary tangle pathology and neuronal death early in Alzheimer's disease (Gomez-Isla et al., 1996a, b) and it is the most profoundly affected in the later stages of disease (Arnold et al., 1991a,b; Braak and Braak, 1991). It is widely accepted that neurofibrillary tangle pathology originates in specific layers of the multimodal areas, entorhinal and perirhinal cortex (Braak and Braak, 1985; Van Hoesen and Solodkin, 1993). The EC receives direct projections from frontal, occipital, parietal and other regions of temporal cortex, and provides the major convergent input from these areas to the hippocampus, serving as a gateway for neocortical information, in part for memory processing. Profound degeneration of EC layer II, the entorhinal output layer to the hippocampus through the perforant pathway, is found early in the disease and results in an isolation of the hippocampus from the neocortex (Hyman et al., 1984). Alzheimer's disease is the most common form of dementia and affects over four million people in the United States alone (Albert, 1996), highlighting the importance of being able to localize this cortical area in vivo. Although definitive diagnosis of AD still rests on laborious pathological assessment, volumetric in vivo MRI has made notable contributions to reveal atrophy in mesocortical and allocortical areas early in the course of the disease, and has been shown to discriminate controls from AD (De Toledo-Morrell et al., 2000; Dickerson et al., 2001; Insausti et al., 1998; Killiany et al., 2000). Furthermore, in vivo volumetric studies have also shown that EC is atrophic in mild cognitive impairment patients, that decreased volume of the hippocampus can predict mild AD (Pennanen et al., 2004) and that clinical progression is correlated with gray matter volume reduction (Jack et al., 2000; Kaye et al., 1997). Nevertheless, it is not possible to observe and detect neuronal level resolutions in vivo. Standard in vivo anatomical brain imaging protocols produce images that cannot resolve structures smaller than 1–2 mm in size. Achieving significantly higher resolution would be of fundamental clinical and neuroscientific value, as it would allow the in vivo detection and analysis of cytoarchitectural features of the cortex, as well as substructures of brain regions such as the hippocampus, thalamus and amygdala. Unfortunately, such resolution is extremely difficult to obtain in vivo, as the signal-to-noise ratio (SNR) goes down with the third power of the linear dimension of each voxel. While NeuroImage 47 (2009) 8–17 ⁎ Corresponding author. Athinoula A Martinos Center, Massachusetts Gen. Hosp/ Harvard Medical School, Bldg. 149, 13th St., Charlestown, MA 02129, USA. Fax: +1 617 726 7422. E-mail address: fi[email protected] (B. Fischl). 1053-8119/$ – see front matter © 2009 Elsevier Inc. All rights reserved. doi:10.1016/j.neuroimage.2009.04.033 Contents lists available at ScienceDirect NeuroImage journal homepage: www.elsevier.com/locate/ynimg
-
Upload
independent -
Category
Documents
-
view
5 -
download
0
Transcript of Predicting the location of entorhinal cortex from MRI
NeuroImage 47 (2009) 8–17
Contents lists available at ScienceDirect
NeuroImage
j ourna l homepage: www.e lsev ie r.com/ locate /yn img
Predicting the location of entorhinal cortex from MRI
Bruce Fischl a,b,⁎, Allison A. Stevens a, Niranjini Rajendran e, B.T. Thomas Yeo b, Douglas N. Greve a,Koen Van Leemput a,b, Jonathan R. Polimeni a, Sita Kakunoori a, Randy L. Buckner a, Jennifer Pacheco f,David H. Salat a, Jennifer Melcher d, Matthew P. Frosch c, Bradley T. Hyman c, P. Ellen Grant a, Bruce R. Rosen a,André J.W. van der Kouwe a, Graham C. Wiggins g, Lawrence L. Wald a, Jean C. Augustinack a
a Athinoula A Martinos Center, Department of Radiology, MGH, Harvard Medical School, USAb MIT Computer Science and AI Lab, USAc Department of Neurology, MGH, Harvard Medical School, USAd Department of Otology and Laryngology, MGH, Harvard Medical School, USAe RUSH Alzheimer's Disease Center, RUSH University Medical Center, 600 S. Paulina, Suite 1044, Chicago, IL 60612, USAf Department of Psychology, The University of Texas at Austin, USAg Center for Biomedical Imaging, NYU Medical Center, New York, NY, USA
⁎ Corresponding author. Athinoula A Martinos CentHarvard Medical School, Bldg. 149, 13th St., Charlestown726 7422.
E-mail address: [email protected] (B. Fisc
1053-8119/$ – see front matter © 2009 Elsevier Inc. Aldoi:10.1016/j.neuroimage.2009.04.033
a b s t r a c t
a r t i c l e i n f oArticle history:Received 23 January 2009Revised 23 March 2009Accepted 7 April 2009Available online 16 April 2009
Keywords:MorphometryMRIAlzheimer's disease
Entorhinal cortex (EC) is a medial temporal lobe area critical to memory formation and spatial navigationthat is among the earliest parts of the brain affected by Alzheimer's disease (AD). Accurate localization of ECwould thus greatly facilitate early detection and diagnosis of AD. In this study, we used ultra-high resolutionex vivo MRI to directly visualize the architectonic features that define EC rostrocaudally and mediolaterally,then applied surface-based registration techniques to quantify the variability of EC with respect to corticalgeometry, and made predictions of its location on in vivo scans. The results indicate that EC can be localizedquite accurately based on cortical folding patterns, within 3 mm in vivo, a significant step forward in ourability to detect the earliest effects of AD when clinical intervention is most likely to be effective.
© 2009 Elsevier Inc. All rights reserved.
Introduction
In the medial temporal lobe, the hippocampal formation and inparticular the entorhinal cortex (EC) – the anterior parahippocampalgyrus – show themost significant neurofibrillary tangle pathology andneuronal death early in Alzheimer's disease (Gomez-Isla et al., 1996a,b) and it is the most profoundly affected in the later stages of disease(Arnold et al., 1991a,b; Braak and Braak, 1991). It is widely acceptedthat neurofibrillary tangle pathology originates in specific layers of themultimodal areas, entorhinal and perirhinal cortex (Braak and Braak,1985; Van Hoesen and Solodkin, 1993). The EC receives directprojections from frontal, occipital, parietal and other regions oftemporal cortex, and provides the major convergent input from theseareas to the hippocampus, serving as a gateway for neocorticalinformation, in part for memory processing. Profound degeneration ofEC layer II, the entorhinal output layer to the hippocampus throughthe perforant pathway, is found early in the disease and results in anisolation of the hippocampus from the neocortex (Hyman et al., 1984).Alzheimer's disease is the most common form of dementia and affects
er, Massachusetts Gen. Hosp/, MA 02129, USA. Fax: +1 617
hl).
l rights reserved.
over four million people in the United States alone (Albert, 1996),highlighting the importance of being able to localize this cortical areain vivo.
Although definitive diagnosis of AD still rests on laboriouspathological assessment, volumetric in vivo MRI has made notablecontributions to reveal atrophy in mesocortical and allocortical areasearly in the course of the disease, and has been shown to discriminatecontrols from AD (De Toledo-Morrell et al., 2000; Dickerson et al.,2001; Insausti et al., 1998; Killiany et al., 2000). Furthermore, in vivovolumetric studies have also shown that EC is atrophic in mildcognitive impairment patients, that decreased volume of thehippocampus can predict mild AD (Pennanen et al., 2004) and thatclinical progression is correlated with gray matter volume reduction(Jack et al., 2000; Kaye et al., 1997). Nevertheless, it is not possible toobserve and detect neuronal level resolutions in vivo.
Standard in vivo anatomical brain imaging protocols produceimages that cannot resolve structures smaller than 1–2 mm in size.Achieving significantly higher resolution would be of fundamentalclinical and neuroscientific value, as it would allow the in vivodetection and analysis of cytoarchitectural features of the cortex, aswell as substructures of brain regions such as the hippocampus,thalamus and amygdala. Unfortunately, such resolution is extremelydifficult to obtain in vivo, as the signal-to-noise ratio (SNR) goes downwith the third power of the linear dimension of each voxel. While

9B. Fischl et al. / NeuroImage 47 (2009) 8–17
some recent studies have pushed this limit to under 1–2 mm, this is atthe cost of extremely long scan sessions and specialized imaginghardware (Duyn et al., 2007), and even this is still a coarse resolutionrelative to what is required to visualize correlates of the cytoarchi-tecture with MRI. With the exception of the line of Gennari, which isone of the few histological features of the cortex that has beendetected in vivo, at least for part of its extent (Barbier et al., 2002;Clare and Bridge, 2005; Clark et al., 1992), current in vivo methodscannot consistently resolve cytoarchitectural features of the cerebralcortex.
In contrast, ultra-high resolution ex vivo MRI can distinguishcytoarchitectural features. In a previous study, using ex vivoMRI and a7 Tesla (7 T) scanner, we robustly distinguished the cell-dense layer IIislands throughout the extent of EC (Augustinack et al., 2005), and theline of Gennari, a highly myelinated stripe in layer IV in primary visualcortex (Hinds et al., 2008), allowing us to delineate areas based on itsmicrostructural properties. Moreover, EC recently has been mappedusing quantitative architectonic techniques (Amunts et al., 2005)showing it to be less variable in volumetric coordinate than manypreviously mapped neocortical regions. In related work, we haverecently shown that cortical folding patterns are excellent predictorsfor a wide array of histologically-defined architectonic regions (Fischlet al., 2008). In this studywe found that the boundaries of primary andsecondary sensory cortices could be localized to within 2–4 mm basedon cortical folding patterns, although higher cortical areas such as BA44/45 were more variable with respect to cortical geometry. Theability to detect cytoarchitecture with ex vivoMRI makes these imagesideal for the construction of models for the location of cytoarchitec-tonically defined boundaries that can ultimately to be applied to invivo data sets.
The current way that neuroimaging researchers localize aBrodmann area is problematic and the existing imaging localizationmethods have limited accuracy. Originally, Brodmann areas weredescribed histologically by Korbinian Brodmann almost a century agowho defined these areas using a Nissl stain and categorized thembased on the presence, absence or a combination of cortical layers in aparticular region (Brodmann, 1909). Currently there are two commonmethods that neuroimagers use to localize a Brodmann area. First,neuroimaging researchers identify Brodmann areas based on an adhoc assessment of the location of interest relative to surroundingfolding patterns. This approach is problematic as there is no means torigorously test the uncertainty of these localizations and the relation-ship between the Brodmann areas (BAs) and cortical folds issometimes unclear. An alternative is to use volumetric registrationto an atlas coordinate system (i.e. the Talairach coordinate system(Talairach et al., 1967; Talairach and Tournoux, 1988)), then map theBAs defined in the atlas onto individual subjects using the registration.Unfortunately, this technique has been shown to yield poor localiza-tion accuracy in a wide array of cortical areas (Amunts et al., 2000;Amunts et al., 1999; Geyer et al., 1997; Geyer et al., 2000; Malikovic etal., 2007; Rademacher et al., 2002; Rademacher et al., 2001). Thus,accurate in vivo identification and localization of cortical areas –
specifically the EC – would be a significant step towards detecting ADpathology in the earliest stages and provide a critical MRI diagnostictool.
Here we take a novel approach to identification and arealocalization, and image ex vivo tissue samples, in which exceedinglyhigh resolution is obtainable, on the order of 100 μm isotropic, thenapply the information derived from the ex vivo images to model theprobabilistic relationship between cortical geometry and the under-lying cytoarchitecture, allowing us to accurately predict the locationsof cortical areas from standard in vivo imaging data. In the currentstudy we extend beyond sulcal topography and use MR-cytoarchi-tecture to detect and focus on the localization of EC since it is knownto be one of the earliest loci of Alzheimer's disease (AD), and criticalfor normalmemory function.We show that surface-based registration
aligns the borders of EC extremely well across subjects, within 2–3 mm, or less than the size of an average functional MRI voxel. Theability to more accurately localize this cortical region is a critical stepin the early diagnosis of AD, and in the assessment of the efficacy ofpotential clinical interventions.
Methods
Participants and ex vivo samples
The in vivo AD participants (n=61) had a mean and standarddeviation of 77.7±6.8 years of age with a range of 63–92 years old.Thirty-one women and thirty men participated. The Clinical DementiaRating (CDR) was 0.5 for all and the Mini-Mental State Examination(MMSE) was 25.6 ±3.3. The normal control participants (n=73) hada mean age of 76.8±6.9 years with a range of 63–95 years. Forty-seven women and twenty-six men were imaged. The control subjectswere CDR=0 and the MMSE for the control subjects was 28.5±3.7.
The autopsy samples (n=17) used in the high resolution ex vivoscanning had a mean age of 66.6±12.68 years with a range of 42–81.The gender classification for the ex vivo brain samples was ten males(5/5 left/right hemisphere) and two females (1/1 left/right hemi-sphere), while the remainder of gender information was unavailable.The postmortem interval had a range of 6.5 h to 25 h. Postmorteminterval was always limited to less than 25 h in this study. To the bestof our knowledge, the ex vivo samples did not have any neurologicalconditions and were presumably cognitively normal.
Description of coils
The images used in this study were acquired using one of threecustom-built coils, varying in size to accommodate variations in tissuesample size. That is, we imaged each sample in the smallest coil thatwould (a) fit the entire sample, and (b) yield high sensitivity over thepredicted region containing EC. Specifically, we used either a 4-turnsolenoid coil (28.5 mm inner diameter, 44 mm length), a 4-channelphased-array (a linear array of loop coil elements each with 5 cm coildiameter, 1.5 cm overlap between adjacent elements, 16 cm in length)or a small birdcage (24 rungs, outer diameter=19.7 cm, innerdiameter=19.3 cm, length=12 cm) for imaging hemispheres with-out introducing cuts into the tissue samples.
Optimizing ex vivo MR acquisition
In order to compute acquisition parameters that are optimal forrevealing the EC architectonics, we utilized a set of techniques forusing multi-echo FLASH (MEF) scans acquired at varying flip anglesand/or repetition times (TR) to estimate the underlying tissueparameters that are the source of image contrast in standard gradientecho sequences (i.e. T1, proton density (PD) and T2⁎) (Fischl et al.,2004). Once these parameters were estimated, they were used asinput to simulations designed to maximize the contrast-to-noise ratio(CNR) per unit time. We applied these techniques to a set of fixed exvivo tissue samples, imaged with abovementioned radio frequencycoils on a 7 T human scanner (Siemens Medical Systems, Erlangen,Germany). The data was acquired using a MEF sequence, withTR=40 ms, α=15°,20°,25°, 4 echoes, TE=8 ms, 16 ms, 24 ms,32 ms) at 100 μm isotropic resolution. The multiple flip angles wereused to estimate the T1 and proton density of the underlying formalin-fixed tissue using the techniques described in (Fischl et al., 2004). Inaddition, the multiple echoes were used to estimate T2⁎ using a log-linear fit to the data. Region of interests (ROIs) were then manuallydrawn in the gray and white matter, and the mean tissue parameterswere computed to be: T1=(WM=770 ms, GM=1078 ms), PD=(WM=18,024 ms, GM=19,996 ms), and T2⁎=(WM=11 ms,GM=26 ms). An example of the data (first four images) and the

Fig. 1. Multi echo flash (images 1–4) with fitted T1 (image 5), PD (image 6) and T2⁎ (rightmost image).
10 B. Fischl et al. / NeuroImage 47 (2009) 8–17
parameter maps (last three images) is given in Fig. 1. Interestingly, thedominant source of image contrast in these fixed ex vivo samples isgiven by T2⁎ differences in the tissue.
Using these parameters, the steady state Bloch equations wereapplied (Bloch et al., 1946) and the CNR was computed over TR=[5 ms,80 ms], TE=[5 ms, TR-2 ms], and flip angle α=[3°,40°]. Foreach TR/TE/α pair, the CNR was computed by assuming a symmetricreadout, a minimum bandwidth and assuming that 2 ms are requiredfor spoiling at the end of each TR. The CNR was assumed to increasewith the 1/2 power of the number of echoes that can be acquired for agiven TR and echo spacing, and to decrease with the square root of TR,corresponding to the assumption that the noise is time-independent(that is, a longer TR implies that fewer scans can be collected andaveraged to increase SNR). The optimum acquisition parameters fromthis simulation were computed to be TR=40 ms, TE=20 ms, andα=23°. These parameters allowed us to acquire images thatpermitted the direct visualization of the layer II entorhinal islands asshown in Figs. 2 and 3. The presence of these islands allowed one of us(JCA) to manually delineate the borders of EC on the high resolutionsamples. These borders were then transferred back to a set of 1 mmisotropic acquisitions (1.5 T, MEF,TR=20 ms, α=5°, 10°, 15°, 20°, 25°,30°, 8 echoes, TE=1.85 ms to 15.85 ms, with a 2 ms echo spacing)which were used to generate surface models of the cortex (Dale et al.,1999; Fischl et al., 2001; Fischl et al., 1999a,b). More specifically, thehigh resolution 7 T data was manually registered to the 1.5 T data, andthis registration was used to map the EC label into the low resolutioncoordinate system. The labels were then sampled onto the gray/whitesurface boundary model, and small sampling artifacts were correctedusing a third-order binary close (3 binary dilations, followed by 3binary erosions, to remove small holes in the label, due to differentialdistortion in the 7 T and 1.5 T images). An example of these surfacestogether with the EC labels sampled onto inflated surface models isgiven in Fig. 4.
Basic anatomy and connectivity of the MTL
The medial surface of the temporal lobe contains a number ofstructures that are critical for memory, emotion, and olfactory neural
Fig. 2. The matching high resolution (100 μm) MRI in (A) and the Nissl stained section inhistology methods. Magnification bar=1 cm. am = amygdala; CA1–CA3 = ammon's horntransition-area; hf = hippocampal fissure; sub = subiculum; para = parasubiculum; pre =
processes. Most broadly, this region includes primary olfactory cortex,the amygdala, and the hippocampal formation and overlying para-hippocampal gyrus. The hippocampal formation can be subdividedinto the hippocampus proper (or cornu ammonis), the dentate gyrus,and the subiculum. The majority of extrinsic afferents to thehippocampus arise from entorhinal (area 28 and 34), perirhinal(area 35) and posterior parahippocampal cortices (areas TH and TF inthe monkey). Supragranular entorhinal fibers project to the molecularlayer in dentate gyrus through a white matter tract known as theperforant pathway, and the dentate gyrus in turn projects to the CA3subfield of the hippocampus via the mossy fiber pathway. The CA3subfield projects intrinsically via Schaffer collaterals to the fimbria-fornix and to pyramidal cells in CA1 subfield, which in turn projectsback to deep pyramidal neurons in EC. But the majority of efferentfibers from the hippocampus take a less direct route that firstterminates in the subiculum (ammonic-subicular pathway) and thentravels out of the formation through the fornix and EC (Rosene andVan Hoesen, 1987).
Anatomically, EC makes up the anterior portion of the parahippo-campal gyrus and we utilized three distinctive cytoarchitecturalcharacteristics to define it: (i) the cell-dense layer II islands, (ii) thecell poor lamina dissecans (ld) and (iii) deep pyramidal layer. Layer IIis arranged in clusters or islands that are neuron dense regionsalternating with neuron poor regions. The lamina dissecans is anacellular layer that is unique to the EC and the deep pyramidal layer inEC is homogenous and fairly wide to receive subicular input.
Description of validation and labeling in EC
To show validation of our methods, Fig. 2 illustrates thecorresponding high resolution (100 μm) MRI (Fig. 2A) and the Nisslstained section (Fig. 2B). The mediolateral boundaries of entorhinallayer II islands are outlinedwithwhite arrows inMRI and black arrowsin Nissl section (Figs. 2A and B, respectively). In both imagemodalities, MRI and Nissl, the medial border is inferior to theparasubiculum and the medial most entorhinal island in lamina II ishighlighted with awhite arrow. The alternations in signal in layer II ECmarking the islands as well as the low signal intensities in the lamina
(B). Image and photomicrograph are presented to illustrate and validate our ex vivo-fields; cs = collateral sulcus; ec = entorhinal cortex; hata = hippocampal-amygdala-presubiculum; pc = perirhinal cortex; v = ventricle.

11B. Fischl et al. / NeuroImage 47 (2009) 8–17
dissecans can be observed in high resolution MRI as shown in Fig. 2,which compares the high resolution MRI (A) with a Nissl stain (B),illustrating that both reveal the laminar architecture of the EC. Thelamina II, III, lamina dissecans (ld), V and VI are outlined (Fig. 2),following Cajal's nomenclature for the cell free lamina in layer IV (i.e.lamina dissecans). The lateral border of entorhinal lies at the lateralapex of the parahippocampal gyrus and typically coincides with the
Fig. 3. The rostrocaudal and mediolateral limits of EC in high resolution ex vivo MRI (100 μanterior EC is between the lateral asterisk and ‘olf’ label. A coordinate system is labeled, ‘arrowheads throughout this figure demarcate themedial entorhinal boundary while the care(area 34) with the tentorial notch distinguishing entorhinal area 34 from entorhinal area 28ending of the hippocampal head and the size of the parahippocampal gyrus is becoming sm(cs∼) in (K) at approximately the level of the lateral geniculate nucleus. At level (L), entosulcus; ec = entorhinal cortex; dg = dentate gyrus; ga = gyrus ambiens; hp = hippocampsubiculum; para = parasubiculum; pre = presubiculum; pc = perirhinal cortex; tn = ten
opening of the collateral sulcus, albeit the sulcal patterns in medialtemporal lobe can be quite variable. The borders of EC were manuallydelineated using these features by a trained neuroanatomist (JCA) ona set of 9 left hemisphere and 8 right hemisphere samples, taken fromneurologically normal subjects. An additional example of the robust-ness of these features, and in particular the layer II entorhinal islandsis given in Figs. 2 and 3.
m isotropic voxels). (A) Primary olfactory cortex is loosely marked with asterisks andd’ for dorsal, ‘v’ for ventral, ‘l’ for lateral and ‘m’ for medial in A for all panels. Whitet (^) demarcates the lateral entorhinal limit. (B–D) show EC at the level of gyrus ambiens. (E–H) demonstrate the ‘pes’ hippocampi at the uncal hippocampal level. (I) shows thealler. (J) and (K) display the posterior EC and concurrently the collateral sulcus ends
rhinal islands are no longer observed. Abbreviations: am = amygdala; cs = collateralus; hf = hippocampal fissure; olf = olfactory; lgn = lateral geniculate nucleus; sub =torial notch. Magnification bar=1 cm.

12 B. Fischl et al. / NeuroImage 47 (2009) 8–17
Results
Delineation of the borders of EC
We analyzed all rostrocaudal levels of the EC with special attentionto the rostral, caudal, medial and lateral borders of the EC. In Fig. 3, therostrocaudal extent of EC is illustrated showing the rostral most andcaudal most boundaries in A and K, respectively. At the rostral end,primary olfactory cortex occupies the anterior most portion of EC (Fig.3A) and some reports have described this cortex as subregion EO(Insausti et al., 1995) or prorhinal (Krimer et al., 1997). Althoughprimary olfactory cortex exhibits a slight clustering in its superficiallayers, it does not contain large stellate neurons that are prototypicalof the mid and posterior levels of EC. It is difficult to discern layer II inex vivoMRI in primary olfactory cortex because the lamina are thinnerand not organized into discrete clusters (Fig. 3A). The classic layer IIislands are beginning to organize at this anterior plane and a hint ofclustering can be observed immediately to the right of the lateralasterisk (Fig. 3A). The medial border changes the most throughoutthis cortex because of the presence of the gyrus ambiens (area 34)anteriorly. At anterior levels, the medial border abuts the amygdalanuclei (Figs. 3B–D). Moving caudally along the parahippocampalgyrus, the gyrus ambiens disappears and gives way to the hippocam-pal fissure (Fig. 3E). Once the hippocampal fissure opens, the ECborders the parasubiculummedially (Figs. 3E–K). We have delineatedthe medial border with a white arrowhead in relevant panels in Fig. 3.Laterally, the EC borders perirhinal cortex (Brodmann's area 35) andthis lateral border is routinely observed at the lateral crown or apex ofthe parahippocampal gyrus (Figs. 3A–K). Some reports have referredto this lateral apex as the shoulder of the parahippocampal gyrus (DeToledo-Morrell et al., 2000). EC's lateral border is demarcated with acaret (^) in Fig. 3 directly above the ‘cs’ which stands for collateral
Fig. 4. Medial view of the entorhinal labels used in this study.
sulcus. Perirhinal cortex lies on themedial bank of the collateral sulcusand is immediately lateral to EC. As the collateral sulcus endsposteriorly (cs∼ in Fig. 3K), the posterior EC is winding down aswell; it is observed in our ex vivo MR images for few additional slices(i.e. Fig. 3K) and is completely gone at the next illustrated level (Fig.3L). The caudal limit of the EC is at the level of the lateral geniculatenucleus of the thalamus, approximately half way through theparahippocampal gyrus. In Fig. 3L, the entorhinal islands in layer IIare no longer observed because the EC ends here. Taken together, thepanels in Fig. 3 illustrate EC in its entirety and shows thecomprehensive – anterior, posterior, medial and lateral – borders ofEC, Brodmann's area 28 and 34 in ex vivo MRI.
Validation of labeling using surface models
We imaged 17 human hemispheres at 1.5 T at 1 mm ex vivo inorder to construct surface models for the same subjects for which wedelineated the borders of EC using the ex vivo 100 μm isotropic databased on its architectonic properties (shown in Fig. 3). The highresolution ex vivo scans were manually registered to the 1 mm ex vivoscans using a rigid transformation in order to transfer the labels drawnon the 100 μm data to the surface models. The set of labels delineatedon the 100 μm data transformed to the 1.5 T data used for surfacereconstructions are shown in a medial view of each ex vivo subject'sinflated surface in Fig. 4 (left and right hemispheres).
In order to quantify the variability of the predicted location of ECacross subjects we used a modified symmetric Hausdorff distance.Specifically, for each point on the boundary of each subject's EC labelin the individual subject space, we computed the minimum distanceto the boundary of each other subject projected into the individualsubject's surface model, then computed the average of these. Theresults of this analysis are displayed in Fig. 5. The advantage of this
Ex vivo EC labeling shown on inflated surface of the brain.

Fig. 6. Spatial probability maps for EC in the left and right hemispheres.
13B. Fischl et al. / NeuroImage 47 (2009) 8–17
procedure is that it provides a measure in millimeters of theuncertainty of localization. In addition, it is not biased by the size ofan area, a well-known problem for other similarity measures such asthe Dice or Jaccard coefficients (Jaccard, 1912), which compute thedegree of overlap of binary labels, which is affected by the size of thelabel, with larger labels typically evidencing greater overlap thansmaller one.
In order to visualize the spatial variability, we mapped each labelinto a common spherical coordinate system and built cross-subjectspatial probability maps that each point on the surface is part of EC, asshown in Fig. 6. Each point in each hemisphere in this figure is color-coded to reflect the probability that that point in the average sphericalcoordinate system is part of EC. Thus a perfectly predicted ECwould bereflected by a step function transitioning from 100% overlap (allsubjects) in the interior of EC (yellow), to 0% overlap (no subjects)outside of EC (gray). These data illustrate the medial temporallocalization of EC in the anterior parahippocampal gyrus in both leftand right hemispheres.
To illustrate the clinical utility of the accurate localization of EC, weused spherical registration (Fischl et al., 1999a,b) to predict thelocation of EC in a set of subjects diagnosed with very mildAlzheimer's disease (AD, N=61, CDR=0.5, men/women=30/31,age=77.7±6.8 (63–92)) as well as healthy controls (N=73, men/women=26/47, age=76.8±6.9 (63–95)). We then used our sur-face-based tools to reconstruct models of the gray/white and pialsurfaces (Dale, 1994; Dale et al., 1999; Fischl et al., 2001; Fischl et al.,2004; Fischl et al., 2002a,b; Fischl et al., 1999a,b) and to measure themean thickness of the cortex in the predicted EC (Fischl and Dale,2000). The results of this analysis are shown in Fig. 7, showing thateven in this early stage of clinical AD we are able to detect robustthickness differences (pb10−5) in the predicted location of EC, inagreement with previous studies that either showed EC effects incortical maps or used manual techniques to localize EC (De Toledo-Morrell et al., 2000; Detoledo-Morrell et al., 1997; Dickerson et al.,2001; Dickerson et al., 2004; Dickerson et al., 2008; Du et al., 2001;Gomez-Isla et al., 1996a,b; Killiany et al., 2000; Killiany et al., 2002; Xuet al., 2000). As a control for this result we also drew two additionalROIS. The first ROI represented the entire temporal lobe, excluding theestimated location of EC. The second was drawn beginning onecentimeter posterior to the predicted location of EC, extendingposteriorly the same length as the predicted EC. We then performedthe same analysis of cortical thickness across the two populationswithin these ROIs. The results of this analysis are given in Fig. 7. Thegreatly reduced cortical thickness in EC (Fig. 7, left) relative to both theposterior medial temporal lobe (Fig. 7, center) and the entire non-ECtemporal lobe (Fig. 7, right), illustrate that our results are in factspecific to EC and not representative of widespread cortical thinning.
As shown above, the surface geometry predicted the location ofright EC more accurately than left EC. In order to assess whether
Fig. 5. Symmetric mean Hausdorff distances for the left hemisphere (left) and righthemisphere (right). The bars plot the median of the individual points.
geometric variations in the folding patterns contributed to thevariability in localization accuracy in the current dataset we examinedthe sulcal pattern in the medial temporal lobe and specifically thecollateral sulcus, one of the primary landmarks used for in vivoestimation of EC borders (Insausti et al., 1998). Visual inspectionrevealed that four of the nine left hemisphere samples had a singleuninterrupted collateral sulcus and the remaining five cases showedan interrupted and/or branching collateral sulcus. For the righthemispheres, three cases displayed a single uninterrupted collateralsulcus, while five cases showed an interrupted or branched pattern.Since these patterns were somewhat evenly split between unin-terrupted and interrupted configurations and because of the smallsample size, it is difficult to interpret whether the sulcal outline had aneffect. The casewith the largest error exhibited a single uncomplicatedcollateral sulcus, suggesting that the variability of the collateral sulcusby itself may not be the determining factor in localization accuracy.
Discussion
Sulcal patterns in the medial temporal lobe are notoriouslyvariable in the human brain (Insausti, 1993; Insausti et al., 1998;Novak et al., 2002; Ono et al., 1990; Van Hoesen et al., 2000), makingmanual parcellation of these critical areas based on visual inspectionof cortical geometry extremely difficult. The architectonic propertiesof EC however are much more well-characterized (e.g. (Amunts et al.,2005; Augustinack et al., 2004; Cajal, 1909; de No, 1933; Insausti et al.,1995; Krimer et al., 1997; Solodkin and Van Hoesen, 1996)). Usingultra-high-field (7 T) and ultra-high resolution (≈100 μm isotropic)ex vivo MRI we were able to directly visualize the architectonicfeatures that distinguish EC from adjacent regions and to use them tomanually delineate the borders of EC. These borders were mappedonto whole-hemisphere MRI acquired at lower field (1.5 T), andsubsequently onto surface models of the cerebral cortex constructedfrom the low-field volumes (Dale et al., 1999; Fischl et al., 2001; Fischlet al, 1999a,b). We then applied surface-based inter-subject registra-tion techniques (Fischl et al., 2008; Fischl et al., 1999a,b; Hinds et al.,2008) that align cortical folding patterns to determine how well thecortical folds predicted the location of the microscopically definedborders of EC. As shown in the Results section, the EC borders were infact localized extremely well by the surrounding geometry, withvariability in the location of the borders on the order of 3 mm.Interestingly, the lateralization of these effects qualitatively agreeswith Amunts et al. (2005), in that the location of left hemisphere ECwas more variable (≈3.5 mm) than the right hemisphere (≈2.5 mm)with respect to the folding patterns, although a larger sample size willbe required to confirm this finding. It is also worth pointing out thatthe accuracy of EC localization is comparable to that of primarysensory areas (Fischl et al., 2008), perhaps due to its connectivity withthe hippocampus, which has a relatively stable location with respectto other brain structures.
The EC islands (lamina II) were apparent on the ex vivo MRIthroughout the rostrocaudal EC in agreement with subdivisionsproposed in previous microscopy studies by Insausti et al. (1995)and Krimer et al. (1997). The anterior most regions (i.e. EO of Insausti;PR of Krimer) and medial most regions (i.e. EMI of Insausti; 28Is of

Fig. 7. Comparison of AD and control mean cortical thickness in EC (left), posterior medial temporal lobe (center) and the entire temporal lobe excluding the predicted location of EC(right). The black bars represent the standard error of the mean in a random effects analysis across subjects.
14 B. Fischl et al. / NeuroImage 47 (2009) 8–17
Krimer) have thinner layer II and are more difficult to detect. In ourstudies we have found that even modest reduction in resolution from100 μm to 120 μm isotropic voxels can make the EC borders in theseregions difficult or impossible to detect. Conversely, the more lateralsubregions of EC (i.e. 28Ir and 28Ic of Krimer; EI of Insausti) havethicker, rounded and sometimes even elongated layer II islandscompared to medial and anterior regions (Insausti et al., 1995; Krimeret al., 1997), and are more readily apparent at coarser resolutions.
The entorhinal lamina nomenclature also deserves some discus-sion. While Cajal identified the cell free layer as layer IV (i.e. laminadissecans), his student, Lorente de Nó, referred to the laminadissecans as layer IIIa and layer IV to the large pyramidal neuronsdeep to the lamina dissecans (Cajal, 1909; de No, 1933). In this report,we have followed the nomenclature of Cajal, which agrees with thedefinition of periallocortex that lacks a granular layer. However, it isimportant to note that the deep pyramidal neurons in EC are in aunique position because they receive such a strong projection fromthe subiculum. The deep pyramidal neurons could be thought of as acontinuation of the subiculum, even illustrated as such in Lorente deNó's 1934 paper, which is why Lorente de Nó's nomenclature isattractive; it makes sense given the hippocampal/EC connections.Although the neurogenesis of EC is poorly understood, Filimonoff(1947) had suggested that the superficial layers of EC were derivedfrom paleocortex (olfactory) cortex and the deeper layers originatedfrom allocortex (hippocampal) cortex. Filimonoff's notion was thattwo three-layered cortices came together to form a rudimentary sixlayered cortex, EC. Even though this topic is beyond the scope of thismanuscript, Filimonoff's reasoning may be an explanation for why ECis agranular, its agranularity being represented as lamina dissecansand yet entorhinal contains a deep layer with large pyramidalneurons, a presumptive layer IV. In fact, in the Nissl stained sectionin Fig. 2, to the right of the lamina labels (i.e. medial EC), one canobserve the acellular layer (lamina dissecans), the deep pyramidallayer (presumptive layer IV) and closely opposed layers V and VI.
Although we attempted to match the planes from the MRI and thesectioning tissue, it is nearly impossible to achieve. The hippocampalfissure andmedial hippocampal fields illustrate this point markedly inFigs. 2A and B. It is noteworthy that, in this example (Fig. 2), thehippocampal fissure is opened up more in the MRI whereas the Nisslphotomicrograph image contains a shorter hippocampal fissure.Furthermore, the medial hippocampus is more posterior in the MRIwhere it is still transitioning from subicular cortices to CA subfields inthe Nissl stained section (noted by ⁎ in Fig. 2). Onemight reason that itis a matter of scrolling anterior in the MR images to find the preciseplane, but the planes are oblique by one or two degrees. Until betterstereotaxic methods come about for ex vivo imaging, these slightdifferences in planes are unavoidable.
It is interesting to note that previous studies have reportedlateralization effects in the medial temporal lobe, in broad agree-
ment with our finding of greater localization accuracy in the righthemisphere EC than in the left. For example, in Ono's categorizationof the collateral sulcus in 25 brains (Ono et al., 1990), the leftposterior collateral sulcus had the most complicated sulcal topo-graphy, while the right was deemed to be less complex with fewerinterruptions and connections. In a separate study using in vivosubjects, we identified and categorized the collateral sulcus innormal controls and AD cases and found that approximately 20–30%(depending on age) of the normal controls displayed an interruptedcollateral sulcus, whereas the incidence was much higher for the ADcases (≈57%) (Feczko et al., 2009). In addition, histologically it hasbeen shown that neuron counts are higher in the left EC than in theright (Simic et al., 2005). Finally, an in vivo volumetric imaging studyhas shown that right EC is a better predictor of early AD than the leftEC or either hippocampal region (De Toledo-Morrell et al., 2000),possibly indicative of the greater difficulty of accurately localizingthe left EC than the right. Additional studies examining morpho-metric changes and their correlation with respect to sulcal patternsin large populations are required to further elucidate thisrelationship.
The ability to accurately predict the location of EC has significanceon a number of levels. From a neuroscientific perspective, EC hasintriguing structural and functional properties that make it the targetof a wide array of animal and human research. Structurally, EC has aunique cortical architecture with layer II neurons organized intoalternating clusters of neuron dense “entorhinal islands” and neuronpoor inter-island regions (de No, 1933; Ramon y Cajal, 1909).Functionally, entorhinal efferent axons project to the hippocampalformation via the perforant pathway through which most afferentneocortical information converges and is destined for hippocampalcircuitry. The EC (layer IV) also receives the hippocampal CA1-subicular projection and layer IV ultimately projects back to theneocortex (Van Hoesen and Pandya, 1975a,b) so EC sits at a criticaljuncture anatomically and connectionally in the human brain.
The EC has been shown to contain topographic maps of the visualenvironment with layer II “grid cells” that appear to encode spatialmaps of the environment (Hafting et al., 2005), with lateral entorhinalshowing less spatial selectivity than medial entorhinal (Hargreaves etal., 2005). The spatial maps are arrayed in an intriguing hexagonalarrangement of “grid cells”, with variable spacing as one moves fromdorso-lateral EC to ventro-medial EC (Fyhn et al., 2004). In addition,EC has been shown to myelinate in adolescence, and there is evidencethat it is affected in schizophrenia (Arnold et al., 1991a,b; Arnold et al.,1997; Benes, 1989, 1993; Benes et al., 1994; Harrison,1999; Kalus et al.,2005; Prasad et al., 2004; Talamini et al., 2005; Turetsky et al., 2003).Thus, accurate localization of EC may help future functional studies tofurther characterize spatial navigation systems, and to detect devel-opmental abnormalities in the brain in addition to changes observedin AD in this region.

15B. Fischl et al. / NeuroImage 47 (2009) 8–17
Clinical assessment can diagnose probable AD with a high degreeof accuracy, yet a confirmed diagnosis of AD can only be made viahistological analysis of the postmortem brain. The postmortemdiagnosis of AD is based on the regional distribution of characteristiclesions including neuritic amyloid plaques and neurofibrillary tanglesin limbic and association cortices (Arnold et al., 1991a,b; Arriagada etal., 1992; Gomez-Isla et al., 1996a,b; Hyman and Gomez-Isla, 1997;Perry et al., 1986; Rogers and Morrison, 1985; Terry and Katzman,1983). Histological changes in the EC occur early in the disease process(Braak and Braak, 1991; Giannakopoulos et al., 1997; Gomez-Isla et al.,1996a,b). In fact, even non-demented older adults occasionally showthe required pathology for an AD diagnosis at autopsy (Katzman et al.,1988). Although still open to debate, a consensus is growing that such‘incidental’ changes represent the earliest (preclinical) stages of ADpathology, even in cognitively healthy adults (Berg et al., 1998;Hyman, 1997). Regional plaque and tangle deposition follows acharacteristic spatiotemporal distribution in the brain (Arnold et al.,1991a,b; Braak and Braak, 1991, 1997), with early degenerationmanifest in the hippocampal formation and temporo-parietal cortex,and later effects found in prefrontal regions.
It is clear that regions showing greatest pathology in postmortemstudies are morphologically altered in MRI (Fischl et al., 2002a,b; Foxet al., 2001; Jack et al., 1999; Jack et al., 1997; Kaye et al., 1997; Pearlsonet al., 1992). The longitudinal rate of volume loss in these structures isuseful for the discrimination of probable AD from normal aging withaccuracy that approaches clinical diagnosis (Crum et al., 2001; Fox etal., 2001; Jack et al., 1998; Kaye et al., 1997; Laakso, 2002; Scahill et al.,2002). Neuroimaging techniques can be used to detect volumetricchanges in these regions prior to the onset of dementia and even priorto the onset of cognitive decline (Convit et al., 1997; Jack et al., 1999;Kaye et al., 1997; Killiany et al., 2000; Killiany et al., 2002; Xu et al.,2000). Recent studies demonstrate the ability to measure degenera-tive changes in cortical gray matter in vivo, and relate such measuresto cognitive ability (e.g., delayed recall) and disease severity (Convit etal., 1997; de Toledo-Morrell et al., 2000; Fischl et al., 2002a,b; Killianyet al., 2002; Laakso et al., 2000; Laakso et al., 1995; Mungas et al.,2001; Petersen et al., 2000; Soininen et al., 1994). MRI measurespredict which healthy older adults, or older adults with MCI willsubsequently become demented (Fischl et al., 2002a,b; Jack et al.,1999; Kaye et al., 1997).
Clinical intervention in AD would be greatly facilitated by anaccurate method of detecting the disease early in its course, beforewidespread neuronal death has occurred. This is technically difficult,as the early effects are subtle and localized to a small number of brainregions, such as EC. The ability to localize the region of expectedchange and the accurate quantification of the change are critical toolsin MRI. In this report, we have shown that surface-based geometry-driven inter-subject registration tools can resolve the first of theseproblems by accurately predicting the borders of the EC based on thesurrounding surface geometry, which we believe to be an importantstep towards the development of techniques for the early diagnosisand monitoring of diseases such as AD.
Acknowledgments
Support for this research was provided in part by the NationalCenter for Research Resources (P41-RR14075, and the NCRR BIRNMorphometric Project BIRN002, U24 RR021382), the National Insti-tute for Biomedical Imaging and Bioengineering (R01 EB001550,R01EB006758), the National Institute for Neurological Disorders andStroke (R01 NS052585-01) as well as the Mental Illness andNeuroscience Discovery (MIND) Institute, and is part of the NationalAlliance for Medical Image Computing (NAMIC), funded through theNIH Roadmap for Medical Research, Grant U54 EB005149. Additionalsupport was provided by The Autism & Dyslexia Project funded by theEllison Medical Foundation. Finally, we acknowledge a research
agreement and research support from Siemens Healthcare. One ofthe authors (LLW) has obtained consulting income from SiemensHealthcare.
References
Albert, M.S.,1996. Cognitive and neurobiologicmarkers of early Alzheimer disease. Proc.Natl. Acad. Sci. 93, 13547–13551.
Amunts, K., Schleicher, A., Bürgel, U., Mohlberg, H., Uylings, H.B.M., Zilles, K., 1999.Broca's region revisited: cytoarchitecture and intersubject variability. J. Comp.Neurol. 412, 319–341.
Amunts, K., Malikovic, A., Mohlberg, H., Schormann, T., Zilles, K., 2000. Brodmann'sareas 17 and 18 brought into stereotaxic space — where and how variable?NeuroImage 11, 66–84.
Amunts, K., Kedo, O., Kindler, M., Pieperhoff, P., Schneider, F., Mohlberg, H., Habel, U.,Shah, J.N., Zilles, K., 2005. Cytoarchitectonic mapping of the human amygdala,hippocampal region and entorhinal cortex. Anat. Embryol. 210, 343–352.
Arnold, S.E., Hyman, B.T., Flory, J., Damasio, A.R., Van Hoesen, G.W., 1991a. Thetopographical and neuroanatomical distribution of neurofibrillary tangles andneuritic plaques in the cerebral cortex of patients with Alzheimer's disease. Cereb.Cortex 1, 103–116.
Arnold, S.E., Hyman, B.T., Van Hoesen, G.W., Damasio, A.R., 1991b. Some cytoarchi-tectural abnormalities of the entorhinal cortex in schizophrenia. Arch. Gen.Psychiatry 48, 625–632.
Arnold, S.E., Ruscheinsky, D.D., Han, L.Y., 1997. Further evidence of abnormalcytoarchitecture of the entorhinal cortex in schizophrenia using spatial pointpattern analyses. Biol. Psychiatry 42, 639–647.
Arriagada, P.V., Marzloff, K., Hyman, B.T., 1992. Distribution of Alzheimer-typepathologic changes in nondemented elderly individuals matches the pattern inAlzheimer's disease [see comments] Neurology 42, 1681–1688.
Augustinack, J., Kouwe, A.v.d., Salat, D., Wald, L., Blackwell, M., Wiggins, C., Fischl, B.,2004. Detection of entorhinal islands using 7 T MRI. Human Brain Mapping.Budapest, Hungary.
Augustinack, J.C., van der Kouwe, A.J., Blackwell, M.L., Salat, D.H., Wiggins, C.J., Frosch,M.P., Wiggins, G.C., Potthast, A., Wald, L.L., Fischl, B.R., 2005. Detection ofentorhinal layer II using 7Tesla [correction] magnetic resonance imaging. Ann.Neurol. 57, 489–494.
Barbier, E.L., Marrett, S., Danek, A., Vortmeyer, A., Gelderen, P.V., Duyn, J., Bandettini, P.,Grafman, J., Koretsky, A.P., 2002. Imaging cortical anatomy by high-resolutionMR at3.0T: detection of the stripe of Gennari in visual area 17. Magn. Reson. Med. 48,735–738.
Benes, F.M., 1989. Myelination of cortical-hippocampal relays during late adolescence.Schizophr. Bull. 15, 585–593.
Benes, F.M., 1993. The relationship between structural brain imaging and histopatho-logic findings in schizophrenia research. Harv. Rev. Psychiatry 1, 100–109.
Benes, F.M., Turtle, M., Khan, Y., Farol, P., 1994. Myelination of a key relay zone in thehippocampal formation occurs in the human brain during childhood, adolescence,and adulthood. Arch. Gen. Psychiatry 51, 477–484.
Berg, L., McKeel Jr., D.W., Miller, J.P., Storandt, M., Rubin, E.H., Morris, J.C., Baty, J., Coats,M., Norton, J., Goate, A.M., Price, J.L., Gearing, M., Mirra, S.S., Saunders, A.M., 1998.Clinicopathologic studies in cognitively healthy aging and Alzheimer's disease:relation of histologic markers to dementia severity, age, sex, and apolipoprotein Egenotype. Arch. Neurol. 55, 326–335.
Bloch, F., Hansen, W.W., Packard, M., 1946. The nuclear induction experiment. Phys. Rev.70, 474–485.
Braak, H., Braak, E., 1985. On areas of transition between entorhinal allocortex andtemporal isocortex in the human brain. Normal morphology and lamina-specificpathology in Alzheimer's disease. Acta Neuropathol. 68, 325–332.
Braak, H., Braak, E., 1991. Neuropathological staging of Alzheimer-related changes. ActaNeuropathol. (Berl) 82, 239–259.
Braak, H., Braak, E., 1997. Staging of Alzheimer-related cortical destruction. Int.Psychogeriatr. 9, 257–261 discussion 269–272.
Brodmann, K., 1909. Vergleichende Lokalisationslehre der Groβhirnrinde in ihrenPrinzipien dargestellt auf Grund des Zellenbaues. Leipzig.
Cajal, S.R., 1909. Histologie du système nerveux de l'homme et des vertébrés. Maloine,Paris.
Clare, S., Bridge, H., 2005. Methodological issues relating to in vivo cortical myelographyusing MRI. Hum. Brain Mapp. 26, 240–250.
Clark, V.P., Courchesne, E., Grafe, M., 1992. In vivo myeloarchitectonic analysis of humanstriate and extrastriate cortex using magnetic resonance imaging. Cereb. Cortex 2,417–424.
Convit, A., De Leon, M.J., Tarshish, C., De Santi, S., Tsui, W., Rusinek, H., George, A., 1997.Specific hippocampal volume reductions in individuals at risk for Alzheimer'sdisease. Neurobiol. Aging 18, 131–138.
Crum, W., Scahill, R., Fox, N., 2001. Automated hippocampal segmentation by regionalfluid registration of serial MRI: validation and application in Alzheimer's disease.Neuroimage 13, 847–855.
Dale, A.M., 1994. Source Localization and Spatial Discriminant Analysis of Event-RelatedPotentials: Linear Approaches. University of California, San Diego.
Dale, A.M., Fischl, B., Sereno, M.I., 1999. Cortical surface-based analysis I: segmentationand surface reconstruction. NeuroImage 9, 179–194.
de No, L., 1933. Studies on the structure of the cerebral cortex. J. Psychol. Neurol. 45,381–438.
de Toledo-Morrell, L., Dickerson, B., Sullivan, M.P., Spanovic, C., Wilson, R., Bennett, D.A.,2000. Hemispheric differences in hippocampal volume predict verbal and spatial
16 B. Fischl et al. / NeuroImage 47 (2009) 8–17
memory performance in patients with Alzheimer's disease. Hippocampus 10,136–142.
De Toledo-Morrell, L., Goncharova, I., Dickerson, B., Wilson, R.S., Bennett, D.A., 2000.From healthy aging to early Alzheimer's disease: in vivo detection of entorhinalcortex atrophy. Ann. N.Y. Acad. Sci. 911, 240–253.
Detoledo-Morrell, L., Sullivan, M.P., Morrell, F., Wilson, R.S., Bennett, D.A., Spencer, S.,1997. Alzheimer's disease: in vivo detection of differential vulnerability of brainregions. Neurobiol. Aging 18, 463–468.
Dickerson, B., Goncharova, I., Sullivan, M., Forchetti, C., Wilson, R., Bennett, D., Beckett,L., deToledo-Morrell, L., 2001. MRI-derived entorhinal and hippocampal atrophy inincipient and very mild Alzheimer's disease. Neurobiol. Aging 22, 747–754.
Dickerson, B., Salat, D., Bates, J., Atiya, M., Killiany, R., Greve, D., Dale, A., Stern, C., Blacker,D., Albert, M., Sperling, R., 2004. MRI measures of medial temporal lobe functionand structure in questionable Alzheimer's disease. Ann. Neurol. 56.
Dickerson, B.C., Fenstermacher, E., Salat, D.H., Wolk, D.A., Maguire, R.P., Desikan, R.,Pacheco, J., Quinn, B.T., Van der Kouwe, A., Greve, D.N., Blacker, D., Albert, M.S.,Killiany, R.J., Fischl, B., 2008. Detection of cortical thickness correlates of cognitiveperformance: reliability across MRI scan sessions, scanners, and field strengths.Neuroimage 39, 10–18.
Du, A.T., Schuff, N., Amend, D., Laakso, M.P., Hsu, Y.Y., Jagust, W.J., Yaffe, K., Kramer, J.H.,Reed, B., Norman, D., Chui, H.C., Weiner, M.W., 2001. Magnetic resonance imaging ofthe entorhinal cortex and hippocampus in mild cognitive impairment andAlzheimer's disease. J. Neurol. Neurosurg. Psychiatry 71, 441–447.
Duyn, J.H., van Gelderen, P., Li, T.Q., de Zwart, J.A., Koretsky, A.P., Fukunaga, M., 2007.High-fieldMRI of brain cortical substructure based on signal phase. Proc. Natl. Acad.Sci. U. S. A. 104, 11796–11801.
Feczko, E., Augustinack, J., Fischl, B., Dickerson, B., 2009. An MRI-based method formeasuring volume, thickness and surface area of entorhinal, perirhinal, andposterior parahippocampal cortex. Neurobiol. Aging 3, 420–431.
Filimonoff, I., 1947. A Rational Subdivision of the Cerebral Cortex. Chicago.Fischl, B., Dale, A.M., 2000. Measuring the thickness of the human cerebral cortex from
magnetic resonance images. Proc. Natl. Acad. Sci. 97, 11044–11049.Fischl, B., Sereno, M.I., Dale, A.M., 1999a. Cortical surface-based analysis II: inflation,
flattening, a surface-based coordinate system. NeuroImage 9, 195–207.Fischl, B., Sereno, M.I., Tootell, R.B.H., Dale, A.M., 1999b. High-resolution inter-subject
averaging and a coordinate system for the cortical surface. Hum. Brain Mapp. 8,272–284.
Fischl, B., Liu, A., Dale, A.M., 2001. Automated manifold surgery: constructinggeometrically accurate and topologically correct models of the human cerebralcortex. IEEE Trans. Med. Imag. 20, 70–80.
Fischl, B., Salat, D.H., Albert, M., Dieterich, M., Haselgrove, C., Avd, K.o.u.w.e., Killiany, R.,Kennedy, D., Klaveness, S., Montillo, A., Makris, N., Rosen, B., Dale, A.M., 2002a.Whole brain segmentation: automated labeling of neuroanatomical structures inthe human brain. Neuron 33, 341–355.
Fischl, B., Salat, D.H., Busa, E., Albert, M., Dieterich, M., Haselgrove, C., van der Kouwe, A.,Killiany, R., Kennedy, D., Klaveness, S., Montillo, A., Makris, N., Rosen, B., Dale, A.M.,2002b. Whole brain segmentation: automated labeling of neuroanatomicalstructures in the human brain. Neuron 33, 341–355.
Fischl, B., Salat, D., van der Kouwe, A., Makris, N., Ségonne, F., Quinn, B., Dale, A.M., 2004.Sequence-independent segmentation of magnetic resonance images. NeuroimageI23, S69–S84.
Fischl, B., Rajendran, N., Busa, E., Augustinack, J., Hinds, O., Yeo, B.T.T., Mohlberg, H.,Amunts, K., Zilles, K., 2008. Cortical folding patterns and predicting cytoarchitec-ture. Cereb. Cortex.
Fox, N., Crum,W., Scahill, R., Stevens, J., Janssen, J., Rossor, M., 2001. Imaging of onset andprogression of Alzheimer's disease with voxel-compression mapping of serialmagnetic resonance images. Lancet 358, 201–205.
Fyhn, M., Molden, S., Witter, M., Moser, E., Moser, M., 2004. Spatial representation in theentorhinal cortex. Science 305, 1258–1264.
Geyer, S., Schleicher, A., Zilles, K., 1997. The somatosensory cortex of human:cytoarchitecture and regional distributions of receptor-binding sites. Neuroimage6, 27–45.
Geyer, S., Schormann, T., Mohlberg, H., Zilles, K., 2000. Areas 3a, 3b, and 1 of humanprimary somatosensory cortex. Neuroimage 11, 684–696.
Giannakopoulos, P., Hof, P.R., Michel, J.P., Guimon, J., Bouras, C., 1997. Cerebral cortexpathology in aging and Alzheimer's disease: a quantitative survey of large hospital-based geriatric and psychiatric cohorts. Brain Res. Brain Res. Rev. 25, 217–245.
Gomez-Isla, T., Price, J., McKeel, D.J., Morris, J., Growdon, J., Hyman, B., 1996a. Profoundloss of layer II entorhinal cortex neurons occurs in very mild Alzheimer's disease. J.Neurosci. 16, 4491–4500.
Gomez-Isla, T., Price, J.L., McKeel Jr., D.W., Morris, J.C., Growdon, J.H., Hyman, B.T., 1996b.Profound loss of layer II entorhinal cortex neurons occurs in very mild Alzheimer'sdisease. J. Neurosci. 16, 4491–4500.
Hafting, T., Fyhn, M., Molden, S., Moser, M., Moser, E.I., 2005. Microstructure of a spatialmap in the entorhinal cortex. Nature 436, 801–806.
Hargreaves, E., Rao, G., Lee, I., Knierim, J., 2005. Major dissociation between medial andlateral entorhinal input to dorsal hippocampus. Science 308, 1792–1794.
Harrison, P.J., 1999. The neuropathology of schizophrenia. A critical review of the dataand their interpretation. Brain 122 (Pt 4), 593–624.
Hinds, O.P., Rajendran, N., Polimeni, J.R., Augustinack, J.C., Wiggins, G., Wald, L.L., Rosas,H.D., Potthast, A., Schwartz, E.L., Fischl, B., 2008. Accurate prediction of V1 locationfrom cortical folds in a surface coordinate system. Neuroimage 39, 1585–1599.
Hyman, B.T., 1997. The neuropathological diagnosis of Alzheimer's disease: clinical–pathological studies. Neurobiol. Aging 18, S27–32.
Hyman, B.T., Gomez-Isla, T., 1997. The natural history of Alzheimer neurofibrillarytangles and amyloid deposits. Neurobiol. Aging 18, 386–387 discussion 389–392.
Hyman, B.T., Van Horsen, G.W., Damasio, A.R., Barnes, C.L., 1984. Alzheimer's disease:cell-specific pathology isolates the hippocampal formation. Science 225,1168–1170.
Insausti, R., 1993. Comparative anatomy of the entorhinal cortex and hippocampus inmammals. Hippocampus 3 (Spec No), 19–26.
Insausti, R., Tunon, T., Sobreviela, T., Insausti, A.M., Gonzalo, L.M., 1995. The humanentorhinal cortex: a cytoarchitectonic analysis. J. Comp. Neurol. 355, 171–198.
Insausti, R., Juottonen, K., Soininen, H., Insausti, A., Partanen, K., Vainio, P., Laakso, M.,Pitkänen, A., 1998. MR volumetric analysis of the human entorhinal, perirhinal, andtemporopolar cortices. Am. J. Neuroradiol. 19, 659–671.
Jaccard, P., 1912. The distribution of flora in the alpine zone. New Phytol. 11.Jack, C.R., Petersen, R.C., Xu, Y.C., Waring, S.C., O'Brien, P.C., Tangalos, E.G., Smith, G.E.,
Ivnik, R.J., Kokmen, E., 1997. Medial temporal atrophy on MRI in normal aging andvery mild Alzheimer's disease. Neurology 49, 786–790.
Jack Jr., C.R., Petersen, R.C., Xu, Y., O'Brien, P.C., Smith, G.E., Ivnik, R.J., Tangalos, E.G.,Kokmen, E., 1998. Rate of medial temporal lobe atrophy in typical aging andAlzheimer's disease. Neurology 51, 993–999.
Jack Jr., C.R., Petersen, R.C., Xu, Y.C., O'Brien, P.C., Smith, G.E., Ivnik, R.J., Boeve, B.F.,Waring, S.C., Tangalos, E.G., Kokmen, E., 1999. Prediction of AD with MRI-basedhippocampal volume in mild cognitive impairment. Neurology 52, 1397–1403.
Jack Jr., C.R., Petersen, R.C., Xu, Y., O'Brien, P.C., Smith, G.E., Ivnik, R.J., Boeve, B.F.,Tangalos, E.G., Kokmen, E., 2000. Rates of hippocampal atrophy correlate withchange in clinical status in aging and AD. Neurology 55, 484–489.
Kalus, P., Slotboom, J., Gallinat, J., Federspiel, A., Gralla, J., Remonda, L., Strik, W.K.,Schroth, G., Kiefer, C., 2005. New evidence for involvement of the entorhinal regionin schizophrenia: a combined MRI volumetric and DTI study. Neuroimage 24,1122–1129.
Katzman, R., Terry, R., DeTeresa, R., Brown, T., Davies, P., Fuld, P., Renbing, X., Peck, A.,1988. Clinical, pathological, and neurochemical changes in dementia: a subgroupwith preserved mental status and numerous neocortical plaques. Ann. Neurol. 23,138–144.
Kaye, J., Swihart, T., Howieson, D., Dame, A., Moore, M., Karnos, T., Camicioli, R., Ball, M.,Oken, B., Sexton, G., 1997. Volume loss of the hippocampus and temporal lobe inhealthy elderly persons destined to develop dementia. Neurology 48, 1297–1304.
Killiany, R.J., Gomez-Isla, T., Moss, M., Kikinis, R., Sandor, T., Jolesz, F., Tanzi, R., Jones, K.,Hyman, B.T., Albert, M.S., 2000. Use of structural magnetic resonance imaging topredict who will get Alzheimer's disease [see comments] Ann. Neurol. 47, 430–439.
Killiany, R.J., Hyman, B.T., Gomez-Isla, T., Moss, M.B., Kikinis, R., Jolesz, F., Tanzi, R., Jones,K., Albert, M.S., 2002. MRI measures of entorhinal cortex vs hippocampus inpreclinical AD. Neurology 58, 1188–1196.
Krimer, L.S., Hyde, T.M., Herman, M.M., Saunders, R.C., 1997. The entorhinal cortex: anexamination of cyto- andmyeloarchitectonic organization in humans. Cereb. Cortex7, 722–731.
Laakso, M.P., 2002. Structural imaging in cognitive impairment and the dementias: anupdate. Curr. Opin. Neurol. 15, 415–421.
Laakso, M.P., Soininen, H., Partanen, K., Helkala, E.L., Hartikainen, P., Vainio, P.,Hallikainen, M., Hanninen, T., Riekkinen Sr, P.J., 1995. Volumes of hippocampus,amygdala and frontal lobes in theMRI-based diagnosis of early Alzheimer's disease:correlation with memory functions. J. Neural. Transm., Parkinson's Dis. Dement.Sect. 9, 73–86.
Laakso, M.P., Hallikainen, M., Hanninen, T., Partanen, K., Soininen, H., 2000. Diagnosis ofAlzheimer's disease: MRI of the hippocampus vs delayed recall. Neuropsychologia38, 579–584.
Malikovic, A., Amunts, K., Scheicher, A., Mohlberg, H., Eickoff, S., Wilms, M., Palomero-Gallagher, N., Armstrong, E., Ziles, K., (2007) Cytoarchitectonic analysis of thehuman extrastriate cortex in the region of V5/MT+: a probabilistic, stereotaxicmap of area hOc5. 17: 562–574.
Mungas, D., Jagust, W.J., Reed, B.R., Kramer, J.H., Weiner, M.W., Schuff, N., Norman, D.,Mack, W.J., Willis, L., Chui, H.C., 2001. MRI predictors of cognition in subcorticalischemic vascular disease and Alzheimer's disease. Neurology 57, 2229–2235.
Novak, K., Czech, T., Prayer, D., Dietrich, W., Serles, W., Lehr, S., Baumgartner, C., 2002.Individual variations in the sulcal anatomy of the basal temporal lobe and itsrelevance for epilepsy surgery: an anatomical study performed using magneticresonance imaging. J. Neurosurg. 96, 464–473.
Ono, M., Kubick, S., Abernathey, C., 1990. Atlas of the Cerebral Sulci. Georg ThiemeVerlag, New York.
Pearlson, G.D., Harris, G.J., Powers, R.E., Barta, P.E., Camargo, E.E., Chase, G.A., Noga, J.T.,Tune, L.E., 1992. Quantitative changes in mesial temporal volume, regional cerebralblood flow, and cognition in Alzheimer's disease. Arch. Gen. Psychiatry 49,402–408.
Pennanen, C., Kivipelto, M., Tuomainen, S., Hartikainen, P., Hanninen, T., Laakso, M.P.,Hallikainen, M., Vanhanen, M., Nissinen, A., Helkala, E.L., Vainio, P., Vanninen, R.,Partanen, K., Soininen, H., 2004. Hippocampus and entorhinal cortex in mildcognitive impairment and early AD. Neurobiol. Aging 25, 303–310.
Perry, G., Selkoe, D.J., Block, B.R., Stewart, D., Autilio-Gambetti, L., Gambetti, P., 1986.Electron microscopic localization of Alzheimer neurofibrillary tangle componentsrecognized by an antiserum to paired helical filaments. J. Neuropathol. Exp. Neurol.45, 161–168.
Petersen, R.C., Jack Jr., C.R., Xu, Y.C., Waring, S.C., O'Brien, P.C., Smith, G.E., Ivnik, R.J.,Tangalos, E.G., Boeve, B.F., Kokmen, E., 2000. Memory and MRI-based hippocampalvolumes in aging and AD. Neurology 54, 581–587.
Prasad, K.M., Patel, A.R., Muddasani, S., Sweeney, J., Keshavan, M.S., 2004. The entorhinalcortex in first-episode psychotic disorders: a structural magnetic resonanceimaging study. Am. J. Psychiatry 161, 1612–1619.
Rademacher, J., Morosan, P., Schormann, T., Schleicher, A., Werner, C., Freund, H.J., Zilles,K., 2001. Probabilistic mapping and volume measurement of human primaryauditory cortex. NeuroImage 13, 669–683.

17B. Fischl et al. / NeuroImage 47 (2009) 8–17
Rademacher, J., Burgel, U., Zilles, K., 2002. Stereotaxic localization, intersubjectvariability, and interhemispheric differences of the human auditory thalamocor-tical system. Neuroimage 17, 142–160.
Ramon y Cajal, S., 1909. Histologie du Système Nerveux de l'Homme et des Vertébrés.Maloine, Paris.
Rogers, J., Morrison, J.H., 1985. Quantitative morphology and regional and laminardistributions of senile plaques in Alzheimer's disease. J. Neurosci. 5, 2801–2808.
Rosene, D.L., Van Hoesen, G.W., 1987. The hippocampal formation of the primate brain:a review of some comparative aspects of cytoarchitecture and connections. In:Jones, EG, Peters, A (Eds.), Cerebral Cortex. Further Aspects of Cortical Function,Including Hippocampus. Plenum Press, New York, pp. 345–456.
Scahill, R., Schott, J., Stevens, J., Rossor, M., Fox, N., 2002. Mapping the evolution ofregional atrophy in Alzheimer's disease: unbiased analysis of fluid-registered serialMRI. Proc. Natl. Acad. Sci. U. S. A. 99, 4703–4707.
Simic, G., Bexheti, S., Kelovic, Z., Kos, M., Grbic, K., Hof, P.R., Kofsovic, I., 2005.Hemispheric asymmetry, modular variability and age-related changes in thehuman entorhinal cortex. Neuroscience 130.
Soininen, H.S., Partanen, K., Pitkanen, A., Vainio, P., Hanninen, T., Hallikainen, M.,Koivisto, K., Riekkinen Sr, P.J., 1994. Volumetric MRI analysis of the amygdala andthe hippocampus in subjects with age-associated memory impairment: correlationto visual and verbal memory. Neurology 44, 1660–1668.
Solodkin, A., Van Hoesen, G.W., 1996. Entorhinal cortex modules of the human brain. J.Comp. Neurol. 365, 610–617.
Talairach, J., Szikla, G., Tournoux, P., Prosalentis, A., Bordas-Ferrier, M., Covello, L., Iacob,M., Mempel, E., 1967. Atlas d'Anatomie Stereotaxique du Telencephale. Masson,Paris.
Talairach, J., Tournoux, P., 1988. Co-Planar Stereotaxic Atlas of the Human Brain. ThiemeMedical Publishers, New York.
Talamini, L.M., Meeter, M., Elvevag, B., Murre, J.M., Goldberg, T.E., 2005. Reducedparahippocampal connectivity produces schizophrenia-like memory deficits insimulated neural circuits with reduced parahippocampal connectivity. Arch. Gen.Psychiatry 62, 485–493.
Terry, R.D., Katzman, R., 1983. Senile dementia of the Alzheimer type. Ann. Neurol. 14,497–506.
Turetsky, B.I., Moberg, P.J., Roalf, D.R., Arnold, S.E., Gur, R.E., 2003. Decrements in volumeof anterior ventromedial temporal lobe and olfactory dysfunction in schizophrenia.Arch. Gen. Psychiatry 60, 1193–1200.
Van Hoesen, G.W., Pandya, D.N., 1975a. Some connections of the entorhinal (area 28)and perirhinal (area 35) cortices in the rhesus monkey. I. Temporal lobe afferents.Brain Res. 95, 1–24.
Van Hoesen, G.W., Pandya, D.N., 1975b. Some connections of the entorhinal (area 28)and perirhinal (area 35) cortices in the rhesus monkey. III. Efferent connections.Brain Res. 95, 39–59.
Van Hoesen, G.W., Solodkin, A., 1993. Some modular features of temporal cortex inhumans as revealed by pathological changes in Alzheimer's disease. Cereb. Cortex3, 465–475.
Van Hoesen, G.W., Augustinack, J.C., Dierking, J., Redman, S.J., Thangavel, R., 2000. Theparahippocampal gyrus in Alzheimer's disease. Clinical and preclinical neuroana-tomical correlates. Ann. N.Y Acad. Sci. 911, 254–274.
Xu, Y., Jack Jr., C.R., O'Brien, P.C., Kokmen, E., Smith, G.E., Ivnik, R.J., Boeve, B.F., Tangalos,R.G., Petersen, R.C., 2000. Usefulness of MRI measures of entorhinal cortex versushippocampus in AD. Neurology 54, 1760–1767.