
Event-related functional MRI of cortical activity evoked by microsaccades, small visually-guided...
27
Event-related functional MRI of cortical activity evoked by microsaccades, small visually-guided saccades, and eyeblinks in human visual cortex Peter U. Tse 1,* , Florian J. Baumgartner 2 , and Mark W. Greenlee 2 1 Dartmouth College, USA 2 Universität Regensburg, Germany Abstract We used event-related functional magnetic resonance imaging (fMRI) to determine blood-oxygen- level-dependent (BOLD) signal changes following microsaccades, visually-guided saccades, and eyeblinks in retinotopically mapped visual cortical areas V1–V3 and hMT+. A deconvolution analysis revealed a similar pattern of BOLD activation following a microsaccade, 0.16° voluntary saccade, and 0.16° displacement of the image under conditions of fixation. In all areas, an initial increase in BOLD signal peaking at approximately 4.5 seconds after the event was followed by a decline and decrease below baseline. This modulation appears most pronounced for microsaccades and small voluntary saccades in V1, diminishing in strength from V1 to V3. In contrast, 0.16 degree real motion under conditions of fixation yields the same level of BOLD signal increase in V1 through V3. BOLD signal modulates parametrically with the size of voluntary saccades (0.16°, 0.38°, 0.82°, 1.64°, and 3.28°) in V1–V3, but not in hMT+. Eyeblinks generate larger modulation that peaks by 6.5 seconds, and dips below baseline by 10 seconds post-event, and also exhibits diminishing modulation from V1 to V3. Our results are consistent with the occurrence of transient neural excitation driven by changes in input to retinal ganglion cell receptive fields that are induced by microsaccades, visually-guided saccades, or small image shifts. The pattern of results in area hMT + exhibits no significant modulation by microsaccades, relatively small modulation by eyeblinks, and substantial responses to saccades and background jumps, suggesting that spurious image motion signal arising from microsaccades and eyeblinks is relatively diminished by hMT+. Introduction The goal of the present research is to determine the neural/fMRI effects of microsaccades in early cortical visual areas. We compare these responses to those evoked by comparably sized saccades and whole image motions under conditions of fixation. All three event types should generate similar changes at the level of the retinal image. By comparing cortical responses to these three event types, our aim is to determine the degree to which cortical responses to microsaccades are driven by image changes versus other factors, such as, for example, microsaccadic suppression of spurious motion signals. *To whom correspondence should be sent: Peter U. Tse, PhD., H.B. 6207, Moore Hall, Department of Psychological and Brain Sciences, Dartmouth College, Hanover, N.H., USA. [email protected], [email protected], [email protected] Publisher's Disclaimer: This is a PDF file of an unedited manuscript that has been accepted for publication. As a service to our customers we are providing this early version of the manuscript. The manuscript will undergo copyediting, typesetting, and review of the resulting proof before it is published in its final citable form. Please note that during the production process errors may be discovered which could affect the content, and all legal disclaimers that apply to the journal pertain. NIH Public Access Author Manuscript Neuroimage. Author manuscript; available in PMC 2011 January 1. Published in final edited form as: Neuroimage. 2010 January 1; 49(1): 805–816. doi:10.1016/j.neuroimage.2009.07.052. NIH-PA Author Manuscript NIH-PA Author Manuscript NIH-PA Author Manuscript
-
Upload
uni-regensburg -
Category
Documents
-
view
0 -
download
0
Transcript of Event-related functional MRI of cortical activity evoked by microsaccades, small visually-guided...

Event-related functional MRI of cortical activity evoked bymicrosaccades, small visually-guided saccades, and eyeblinks inhuman visual cortex
Peter U. Tse1,*, Florian J. Baumgartner2, and Mark W. Greenlee21 Dartmouth College, USA2 Universität Regensburg, Germany
AbstractWe used event-related functional magnetic resonance imaging (fMRI) to determine blood-oxygen-level-dependent (BOLD) signal changes following microsaccades, visually-guided saccades, andeyeblinks in retinotopically mapped visual cortical areas V1–V3 and hMT+. A deconvolutionanalysis revealed a similar pattern of BOLD activation following a microsaccade, 0.16° voluntarysaccade, and 0.16° displacement of the image under conditions of fixation. In all areas, an initialincrease in BOLD signal peaking at approximately 4.5 seconds after the event was followed by adecline and decrease below baseline. This modulation appears most pronounced for microsaccadesand small voluntary saccades in V1, diminishing in strength from V1 to V3. In contrast, 0.16 degreereal motion under conditions of fixation yields the same level of BOLD signal increase in V1 throughV3. BOLD signal modulates parametrically with the size of voluntary saccades (0.16°, 0.38°, 0.82°,1.64°, and 3.28°) in V1–V3, but not in hMT+. Eyeblinks generate larger modulation that peaks by6.5 seconds, and dips below baseline by 10 seconds post-event, and also exhibits diminishingmodulation from V1 to V3. Our results are consistent with the occurrence of transient neuralexcitation driven by changes in input to retinal ganglion cell receptive fields that are induced bymicrosaccades, visually-guided saccades, or small image shifts. The pattern of results in area hMT+ exhibits no significant modulation by microsaccades, relatively small modulation by eyeblinks,and substantial responses to saccades and background jumps, suggesting that spurious image motionsignal arising from microsaccades and eyeblinks is relatively diminished by hMT+.
IntroductionThe goal of the present research is to determine the neural/fMRI effects of microsaccades inearly cortical visual areas. We compare these responses to those evoked by comparably sizedsaccades and whole image motions under conditions of fixation. All three event types shouldgenerate similar changes at the level of the retinal image. By comparing cortical responses tothese three event types, our aim is to determine the degree to which cortical responses tomicrosaccades are driven by image changes versus other factors, such as, for example,microsaccadic suppression of spurious motion signals.
*To whom correspondence should be sent: Peter U. Tse, PhD., H.B. 6207, Moore Hall, Department of Psychological and Brain Sciences,Dartmouth College, Hanover, N.H., [email protected], [email protected], [email protected]'s Disclaimer: This is a PDF file of an unedited manuscript that has been accepted for publication. As a service to our customerswe are providing this early version of the manuscript. The manuscript will undergo copyediting, typesetting, and review of the resultingproof before it is published in its final citable form. Please note that during the production process errors may be discovered which couldaffect the content, and all legal disclaimers that apply to the journal pertain.
NIH Public AccessAuthor ManuscriptNeuroimage. Author manuscript; available in PMC 2011 January 1.
Published in final edited form as:Neuroimage. 2010 January 1; 49(1): 805–816. doi:10.1016/j.neuroimage.2009.07.052.
NIH
-PA Author Manuscript
NIH
-PA Author Manuscript
NIH
-PA Author Manuscript

Microsaccades are involuntary, conjugate, brief (~25ms), very small eye movements that occurduring visual fixation, whereas saccades, even if as small as microsaccades, are voluntary.Microsaccades shift the retinal image over several dozen (Moller et al., 2002; Yarbus, 1967;Ditchburn and Ginsbourg, 1953; Lord, 1951; Ratliff and Riggs, 1950) to several hundred(Martinez-Conde et al., 2006) photoreceptors. They exhibit the same linear relationshipbetween peak velocity and amplitude as voluntary and corrective saccades (Martinez-Condeet al., 2006; Zuber and Stark, 1965; Wurtz, 1996). Because voluntary saccades can be as smallin magnitude as microsaccades, it is not primarily size that is the defining characteristic ofmicrosaccades, but rather their largely involuntary nature1, which itself may indicate asubcortical origin for microsaccades.
These observations suggest that microsaccades, voluntary, and corrective saccades may begenerated by at least partially overlapping circuitry that drives saccade-triggering burst neuronsin the superior colliculus (Zuber and Stark, 1965; Wurtz, 1996; Sparks, 2002). Recently, it wasshown (Hafed, Goffart, and Krauzlis, 2009) that microsaccades and saccades are bothgenerated by the same mechanism in the superior colliculus, and that microsaccades andsaccades lie on the same continuum. This might seem to imply that microsaccades and saccadesof equivalent magnitudes should generate the same responses in visual cortical areas. But onecannot infer from the finding that microsaccades and saccades share a partly commongeneration mechanism in the colliculus, that same-sized saccades and microsaccades must leadto the same type and level of activation in visual areas. For example, different cortical processesmight both send commands to the same collicular neurons that then move the eyes.
We used high temporal resolution event-related fMRI to determine the blood oxygen leveldependent (BOLD) signal changes in V1–V3, and hMT+ associated with microsaccades,eyeblinks, voluntary saccades to peripheral targets of varying amplitude (0.16, 0.38, 0.82, 1.64,and 3.28 degree), and 0.16 degree background image shifts, in an effort to determine whetherthese events trigger net neural excitation or inhibition in the regions of interest (ROIs) specified.Because microsaccades, small saccades, and small background image shifts generatecomparable changes at the level of the retinal image, any differences in cortical neural activitywould presumably result from differences in how these types of stimulus events are processedrather than from differences in the image change per se. This would require that the visualsystem rely on information other than the information available solely from the sequence ofimages, such as knowledge that a command to make a saccade or microsaccade has been given.
Materials and MethodsThree fMRI experiments were carried out. Experiment 1 was designed to measure BOLD signalactivity as a function of voluntary saccade size. In this experiment the background remainedstationary, while voluntary saccades were made by tracking the fixation spot as it changedposition instantaneously, leading to jumps of 0.16, 0.38, 0.82, 1.64, and 3.28 visual degrees.Experiment 2 was designed to measure BOLD signal activity as a function of microsaccadeoccurrence. In this experiment the background remained stationary, and a run began and endedwith a 30 second epoch where 0.16 visual degree voluntary saccades were made; However,during seven minutes in the middle of each run, the fixation point remained stationary, andsubjects had to maintain fixation in order to facilitate the detection of microsaccades. Inexperiment 3, designed to measure BOLD signal activity as a function of actual image shiftscomparable in size to those caused by microsaccades, the fixation point remained stable, and
1Even though some individuals can apparently lower their microsaccade rate voluntarily (Steinman et al., 1973; Fiorentini and Ercoles,1966; Steinman et al., 1973), or when carrying out a difficult task (Winterson and Collewijn, 1976; Kowler and Steinman, 1977; Kowlerand Steinman, 1979; Bridgeman and Palca, 1980), without suffering from perceptual fading, microsaccades cannot be generatedvoluntarily (Martinez-Conde et al., 2004). For a model that can account for the discrepant findings concerning voluntary and involuntarymicrosaccade generation, see Rolfs et al. (2008).
Tse et al. Page 2
Neuroimage. Author manuscript; available in PMC 2011 January 1.
NIH
-PA Author Manuscript
NIH
-PA Author Manuscript
NIH
-PA Author Manuscript

the background shifted position 0.16 visual degrees. This was done to mimic the image changethat would occur upon a microsaccade or a small visually-guided saccade.
ParticipantsA total of 8 different participants (male n = 5) carried out one or more of the three experimentsconducted in the MR-scanner (mean age = 32.3 yrs; SD = 6.8 yrs). All subjects had normal orcorrected-to-normal vision. None showed evidence of visual and/or neurologicalabnormalities.
Functional MRI AcquisitionExperiment 1: Small voluntary saccades—fMRI data were collected in a high temporalresolution mixed event-related block design (3T Siemens Allegra scanner at the University ofRegensburg Imaging Center, TR=402 ms, 7 slices along calcarine, TE=30ms, FA=35°, 800volumes, n=6, 6–8 runs per subject, discarding approximately 10 seconds of scans to guaranteethat proton spins were at steady-state). Each run lasted 5 minutes and 45 seconds. In blocks ofsmall voluntary saccades (0.16, 0.38, 0.82, 1.64, and 3.28 visual degrees; 12 pseudorandomevents per block; one saccade size was presented per block; 5 saccade blocks per run; 6 fixationblocks per run), while subjects were requested to steadily track a small point that jumped eitherleftwards or rightwards to locations symmetrical around the center of the screen. Adisplacement of the fixation point never took place more often than once every 3 TRs. Thetemporal order of the experimental design is shown in Figure 1a. The background polar gratingwas present throughout a run.
Experiment 2: Microsaccades—fMRI data were collected in a high temporal resolutionmixed event-related block design (T2*-weighted gradient echo planar imaging, TR=631ms,11 slices along calcarine, TE=30ms, FA=35°, slice thickness 3mm, 0.3mm interslice gap, 800volumes as in Exp. 1, n=5, 5–8 runs per subject, discarding approximately 10 seconds of scansto guarantee that proton spins were at steady-state). Each run lasted 8 minutes and 24 seconds.For 30 seconds at the beginning and end of each run, small voluntary saccades were initiatedby discrete jumps in the fixation point (0.16°, 12 pseudorandom events per epoch). Duringvoluntary saccade epochs, subjects maintained fixation on a small point that jumped 0.08° tothe left and right of the central fixation point that was presented only during the fixation-onlyperiod. A displacement of the fixation point never took place more often than once every 3TRs. The size 0.16° was chosen for voluntary saccades because this falls within the size rangeof involuntary microsaccades, and was detectable using our eye tracker and detectionalgorithm. A long fixation-only period of 7 minutes, 25 seconds separated these two saccadeepochs, during which the fixation point stayed in the central position. Details of the temporalorder of the experimental design are shown in Figure 1b.
Experiment 3: Image jumps under fixation—In this high temporal resolution event-related control experiment, the fixation point remained in the central location throughout theentire run (800 volumes, n=6, 6–8 runs per subject; TR=631ms, 11 slices along calcarine, TE= 30ms, FA=35°), and the polar checkerboard background jumped leftward and rightward 0.16visual degrees. A background jump never took place more often than once every 3 TRs. Thetemporal sequence used in this experimental design is shown in Figure 1c.
Stimulus presentationThe stimulus for all three experiments was a 22×16 visual degree polar grating containing aone degree-wide strip, which divided the upper from the lower halves of the radial checkerboardimage, as shown in Fig. 2. Subjects were required to fixate a black dot (0.05 visual degrees)centered along the white horizontal strip. In experiments 1 and 2 the background remained
Tse et al. Page 3
Neuroimage. Author manuscript; available in PMC 2011 January 1.
NIH
-PA Author Manuscript
NIH
-PA Author Manuscript
NIH
-PA Author Manuscript
stationary and the fixation point changed position instantaneously (leading to 0.16, 0.38, 0.82,1.64, and 3.28 visual degree horizontal image shifts) or remained stationary (during the middleseven minutes of each run of experiment 2), while in experiment 3 the fixation point remainedstationary and the background instantaneously changed position by 0.16 visual degrees atpseudorandom times. Stimuli were presented using a VSG card from Cambridge ResearchSystems. The high contrast polar grating was chosen as the background in order to maximizethe type of input known to drive activity in early visual areas. The white band was used so thatthe fixation point was always visible against a common background with a constant localcontrast.
fMRI Data AnalysisData were analyzed in BrainVoyager 2000 and Matlab. The effect of head motion on the MR-images was corrected for during preprocessing. The general linear model was carried out withinregions of interest V1, V2, V3 and hMT+ localized separately for each subject’s brain. Slicescan time correction was carried out to correct for the fact that slices were not collected at thesame time but were rather collected in interleaved, ascending order. Functional data were notsmoothed in the space domain, but low-frequency temporal fluctuations were removed. Thisprocedure did not introduce any new correlations between a voxel and its neighbors. For eachsubject, the functional data were co-registered to the high-resolution anatomical image andnormalized into the Talairach stereotactic coordinate space, which enabled region-of-interestanalysis of the BOLD signal within V1, V2, V3 and hMT+ for each subject.
Region of Interest SpecificationRetinotopic mapping of the visual areas was carried out on each participant using the standardphase-encoding cross-correlation technique (T2*-weighted gradient echo planar imaging usingthe same 3T Siemens Allegra scanner, TR=2000 ms, 30 slices oriented along the AC-PC plane,TE=30ms, FA=90°, slice thickness=3 mm thickness, inter-slice distance 0.3mm, 152 brainvolumes per run, 304 seconds/run, interleaved slice acquisition, matrix size=64×64mm) withthe modification that two wedges of an 8Hz flicker black and white polar checkerboard gratingwere bilaterally positioned opposite each other, forming a bowtie. This stimulus arrangementled to an enhanced signal-to-noise ratio, since the total number of stimulations for each locationwas twice that of the single wedge stimulus (Sereno et al., 1995; Slotnick and Yantis, 2003).Each wedge subtended 20° of 360°. Counterphase flickering checkerboard wedges rotatedcontinuously at an angular velocity of 11.25°/sec, undergoing nineteen 180 degree rotationsduring each run (304 seconds), beginning and ending at the vertical meridian. A minimum oftwo runs were collected for both the leftward and rightward directions for each subject andthen averaged by common direction to minimize noise. Retinotopic areas (V1, V2d, V2v, V3d,V3v) were defined as masks on the basis of standard criteria (Sereno et al., 1995), assuming acontralateral hemifield representation for V1, and a contralateral quadrant representation forV2d, V2v, V3d, and V3v. The union of leftward and rightward V1 masks was created for eachhemisphere of each subject. The corresponding unions were also created for V2d, V2v, V3d,and V3v. Any intersections of these masks (i.e. shared voxels) were removed from each unionmask, creating a conservative mask that contained, respectively, only ‘pure’ V1, V2d, V2v,V3d, or V3v voxels. V2d and V2v voxels were then combined into a single V2 mask, and V3dand V3v masks we combined into a single V3 mask for each subject. Corresponding maskswere then combined across hemispheres for each subject. Within these masks, separate generallinear model (GLM) analyses were carried out using the Brain Voyager 2000 event-relateddeconvolution procedure with autocorrelation correction implemented to counteractcorrelation among error of successive measurements. It was not possible to reliably examineBOLD signal in other potential retinotopic ROIs, such as V4v or V3A/B, because the thinnessof the volumes (7 or 11 slices along the calcarine sulcus, which permitted short TRs) collected
Tse et al. Page 4
Neuroimage. Author manuscript; available in PMC 2011 January 1.
NIH
-PA Author Manuscript
NIH
-PA Author Manuscript
NIH
-PA Author Manuscript

in the three experiments did not provide sufficient overlap with regions too distal from thecalcarine sulcus.
Area hMT+ was localized in each subject using the methods of Huk, Dougherty, and Heeger(2002). The parameters of the EPI sequence were identical to those used for retinotopicmapping. Subjects fixated a red fixation spot while their eye movements were monitored toassure fixation. White dots were presented on a black background. In stimulation epochs thedots moved in unison along radial trajectories, alternating between inward and outward motioneach second. During rest epochs, the dots remained stationary. Stimulation and rest epochsalternated. Each epoch lasted 18s (9 TRs), and there were a total of eleven epochs per run (200TRs). Dots were always present on the screen. Areas of activation were specified in each subjectusing a general linear model contrast between stimulation and rest conditions. Head motioncorrections were included as regressors in the GLM to minimize variation linked with headmotion. The threshold was set to a point (minimum value t=7) where hMT+ activation wasdistinguishable from coactivating areas. Anatomical criteria were applied that limited thespecification of hMT+ to an upper posterior limb of the inferior temporal sulcus. Voxels thatmet these criteria were defined as hMT+ ROIs in the left and right hemispheres.
Anatomical data were collected in each subject as a T1-weighted MPRAGE scan (TR=2300ms,160 sagital slices, TE=2.6ms, FA=9°, 256×256 voxels/slice, 1×1×1mm voxels).
Eye Movement RecordingsEye position data were collected using a custom-built MR-compatible Limbus tracker (MR-Eyetracker; Cambridge Research Systems; See Supplementary Figure 4 to view an image ofthe eyetracker) over the right eye, which measured both horizontal and vertical components ofthe eye movements in the scanner during scan acquisition. Eye traces were acquired using thedata acquisition toolbox for Matlab software via an Advantech IO-card Analog signal wasconverted into a 1000Hz digital signal. The eyetracker contained infrared LEDs (< 0.2 mW at880 nm) with a potential spatial resolution < 0.1°. This eyetracker proved challenging to usebecause small head movements could make the difference between being able to detect 0.16visual degree visually-guided saccades and losing the ability to detect them. Subjects’ headswere therefore restrained with cushions and headphones to a much greater degree than istraditionally required. In addition, subjects were asked to keep their depth of breathing andhead motion to a minimum. Thus only subjects who could stay still for several minutes at atime were able to carry out these experiments. Online analysis of collected eye movementsrevealed whether the 0.16 visual degree visually-guided saccades at the beginning and end ofeach run had been detected at a level above chance. Recalibration of the eyetracker after eachrun was possible, and carried out as needed, in order to bring the eyetrace signals back into thezone of peak sensitivity.
We are confident of our ability to detect microsaccades because each run of experiment 2 hada built-in internal check in the 30 second epochs of 0.16 degree visually-guided saccades atthe beginning and end of each run. For runs where we could reliably detect these known eyemovements at the beginning and end of a run, we could use the threshold for detectingmicrosaccade-sized visually-guided saccades to define a threshold for detecting microsaccadesin the middle of the run when subjects maintained fixation on a stationary fixation spot.
Eyeblinks were defined and removed from eye movement traces and the TR of eyeblink onsetwas recorded in order to define individual eyeblink events for later event-related deconvolutionanalysis of the BOLD signal within specified ROIs. Only the horizontal eye movement signalwas analyzed because microsaccades are approximately an order of magnitude more likely tooccur horizontally than vertically (for a probability density function of microsaccade directionssee Tse, Sheinberg, and Logothetis, 2004). Eye traces were converted into a velocity signal by
Tse et al. Page 5
Neuroimage. Author manuscript; available in PMC 2011 January 1.
NIH
-PA Author Manuscript
NIH
-PA Author Manuscript
NIH
-PA Author Manuscript

taking the first derivative of the raw data that had been purged of eyeblinks. The velocity signalwas then filtered with a 20-point (ms) symmetric Hanning window for zero-phase forward andreverse digital filtering (low pass filter cutoff frequency 55Hz). Zero-crossings were specifiedin the velocity signal. Time bins were then defined between successive zero-crossings. Timebins shorter than 10 and longer than 100 ms were discarded as outside the domain ofmicrosaccades. Outliers in velocity space were then specified in two ways within each of thetwo thirty-second saccade epochs at the beginning and end of each run of experiment 2: (1)The maximum absolute magnitude was defined within each time bin. Bins containing thehighest 5% magnitudes were defined as outliers in velocity space. (2) The area under the curvewas determined for each time bin. The top 5% of areas were defined as outliers in amplitudespace. Events were conservatively specified by the intersection of these two sets of velocity-space outliers, comprising typically about the top 3% of velocity or area outliers.
An internal check on the quality of the detected microsaccade data was the ability to detect the24 known occurrences of 0.16 visual degree visually-guided saccades that occurred during thetwo saccade epochs, one at the beginning and end of each run. Thus, from within this set, foreach saccade epoch, velocity and area outliers were discarded which did not fall within 100msand 400ms after the known onset of a 0.16 visual degree jump in the fixation point. The numberof detected velocity-space outliers that lay within 100ms and 400ms after the known onset ofa 0.16 visual degree jump of the fixation point was counted for each run. Simply on the basisof chance we would expect some outliers to fall within this window. This number can bedescribed as falling within a binomial distribution. This number exceeded a threshold specifiedby meeting or surpassing that number for which 90% of the area under the binomial distributionwas passed in seven runs in three of the five subjects shown. On good runs, this typicallyamounted to eight or more of the twelve known 0.16 visual degree saccades in each of the twosaccade epochs. The median velocity and area of these outliers was then defined. Because thefirst and second saccade epochs occurred for thirty seconds at the beginning and end of a run,a linear interpolation between the median velocities of these epochs was used to define athreshold for the detection of microsaccades over the entire run, in order to account for possiblechanges in the signal to noise ratio that may have occurred over a run. A corresponding linearinterpolation was also defined for the two median areas. For each run, microsaccades weredefined as those non-saccade events which surpassed both thresholds. The rate ofmicrosaccades defined in this manner was typically between 0.3 and 0.4/sec, which is less thanhalf the approximately one microsaccade per second reported by other authors (Martinez-Conde et al., 2004). Because of its conservative nature, erring on the side of making incorrectrejections of microsaccades rather than false alarms, events specified as microsaccades usingthis algorithm contained microsaccades with a conservative level of detection confidence.Although we could not detect all microsaccades because of our conservative criteria, we areconfident that the events specified as microsaccades for our event-related deconvolutionanalysis were indeed microsaccades.
ResultsEye Movement Data
Fig. 3 shows the main sequence for visually-guided saccades detected in experiment 1, plottingsaccade amplitude against maximum saccade velocity in llog-log coordinates in order to makeapparent the smallest magnitude eye movements. Note that even the smallest visually-guided(0.16 visual degrees) saccades fall on the same regression line, supporting the claim that thesesmall amplitude saccades are truly saccades. In addition, the black squares indicate the meanmagnitude of measured microsaccades for five subjects (data shown in Figure 5), indicatingthat they too fall on the saccade main sequence, consistent with past findings that microsaccade
Tse et al. Page 6
Neuroimage. Author manuscript; available in PMC 2011 January 1.
NIH
-PA Author Manuscript
NIH
-PA Author Manuscript
NIH
-PA Author Manuscript
main sequence falls within the saccade main sequence (e.g. Hafed et al., 2009: Engbert,2006;Zuber, 1965).
Figure 4 shows ten seconds of eye movement data from the right eye of one subject in blackas well as the corresponding velocity data superimposed over this. Circles indicate detectedmicrosaccades.
Figure 5 plots the main sequence of microsaccades that were detected in experiment 2. Aregression line for each subject’s data makes apparent that the population of microsaccadesfalls on the main sequence of saccades shown in the log-log plot in Figure 3 (for a linear-linearversion, see Supplementary Figure 3). The r statistic for each subject is shown in the legend.Note that only the three subjects whose r-values exceed 0.3 passed the binomial test describedabove, meaning that we can only be confident that microsaccades were accurately andsignificantly detected for these three subjects. The other two subjects are shown forcomparison.
Functional MRI DataExperiment 1—The magnitude of the BOLD signal response was found to varyparametrically with the magnitude of voluntary saccades in areas V1, V2, and V3, but not inarea hMT+ (see Figure 6). The steepest slope of the function describing the relationshipbetween the BOLD response and the saccade amplitude was found for the ROI located in V1.Higher visual areas also showed a dependence of the BOLD response amplitude on saccadesize. Interestingly BOLD signal in hMT+, although showing a response for all saccade sizestested, did not exhibit a strong dependence on saccade amplitude. A whole volume GLM forone representative subject can be seen in Supplementary Figure 2a–e.
Experiments 2 and 3—A deconvolution analysis of event-related BOLD data in fivesubjects2 revealed a similar pattern of activation across subjects following a microsaccade,small saccade, or image background jump in V1, V2, and V3, where an upward modulation insignal, peaking at approximately four seconds post-event, was followed by a longer period ofdecline and negative activation, as shown in Figure 7. (For a full volume GLM from experiment2 for a representative subject, see supplementary Figure 2f–i online). The signal modulationto a 0.16 visual degree visually-guided saccade, which was as small as a microsaccade, revealeda similar signature to that of microsaccades across subjects. As shown in Figure 7, BOLDsignal increases in V1 for voluntary saccades that have amplitudes comparable to those ofmicrosaccades. The pattern of response to a microsaccade, saccade, and eyeblink all tended todiminish in strength as one progresses from V1 to V2 to V3.
The pattern of BOLD responses in hMT+ was qualitatively different from the responses inareas V1, V2, and V3, as can be seen in Figure 7. In hMT+ there was no evidence of modulationof BOLD signal by microsaccades, but responses to background jumps and saccades were morerobust than in areas V1, V2, and V3, while following a similar time course. Similarly, responsesto eyeblinks were diminished in hMT+ relative to the strong response to eyeblinks observedespecially in V1. This pattern of results suggests that spurious image changes generated bymicrosaccades or eyeblinks are diminished by the time the signal is processed in hMT+. Ourfinding that microsaccade response in hMT+ was not significant as measured using the BOLDsignal fails to corroborate neurophysiological data (Bair and O’Keefe, 1998) showing thatmicrosaccades lead to neural excitation in macaque MT. Note, however, that Bair & O’Keefe(1998) did not report that there is any kind of systematic modulation of neural activity with
2Note that the average timecourses shown for the microsaccade case are for the three subjects who passed the conservative criteria forinclusion described in the text. Timecourses for all other conditions (saccade, image motion, eyeblinks) are the average of five subjects’timecourses.
Tse et al. Page 7
Neuroimage. Author manuscript; available in PMC 2011 January 1.
NIH
-PA Author Manuscript
NIH
-PA Author Manuscript
NIH
-PA Author Manuscript

fixational saccade amplitude; They only pointed out a modulation of neuronal activity as afunction of the preferred direction tuning of MT neurons. As far as we know, to date, there hasnot been a neurophysiological report of neuronal activity in MT varying with microsaccadeamplitude. It is possible that microsaccades do trigger responses in hMT+ neurons, but thatour event-related fMRI method lacked the power to detect these changes. Indeed, in one of oursubjects (see Figure 8, green), there was significant microsaccadic activation in hMT+, but thiswas not apparent or significant in the group data, possibly because of an insufficient numberof subjects. Thus, we are not prepared to state with confidence that microsaccades do not triggermeasurable BOLD signal in hMT+ under any circumstances. Indeed, given the results of Bair& O’Keefe (1998), showing a modulation of firing rate in MT as a function of microsaccadedirection (although they did not show modulation with microsaccade amplitude), we believethat it is more likely that our power, while adequate to detect significant signal in V1–V3, wasnot adequate to detect signal in hMT+. We can, however, state with confidence that the strengthof BOLD signal modulation, and correlated neural activity presumably associated withmicrosaccades, diminishes from V1 to hMT+.
The BOLD signal timecourse following a microsaccade for each of the five subjects tested isshown in Figure 8. Color coding of timecourses mirrors the color-coding of subject data inFigure 5a. Note that only the data from the the green, maroon, and blue subjects were averagedin making the microsaccade subplot in Figure 7, because only these three subjects passed theconservative criteria described above based on successful detection of the 0.16 degree saccadesat the beginning and end of a run.
General DiscussionThe present findings support the claim that microsaccades are associated with a significantincrease in BOLD signal response, and concomitant neural activity, in striate and extrastriatevisual cortex. The responses in V1 associated with spontaneously occurring microsaccades arequalitatively similar to those evoked during visually-guided saccades and image motions ofcomparable amplitude (Fig. 7), although not quite as high in amplitude. These fMRI findingsare broadly consistent with recent single unit data in the macaque showing that V1 saccadeneurons burst equivalently upon microsaccades, small voluntary saccades, and abrupt imagechanges (Kagan, Gur, and Snodderly, 2008). Unlike Kagan et al (2008), we also examinedextrastriate cortex, and find a diminishing of BOLD signal following a microsaccade from V1through V3, with no significant modulation in hMT+. While there is a similar diminishmentof BOLD signal following a comparably sized visually-guided saccade from V1 through V3,there is no comparable diminishment of BOLD signal response in hMT+ following a saccade.Indeed, we find that the size of hMT+ response does not appear to modulate as a function ofthe size of the voluntary saccade. Thus hMT+ responses are very different for microsaccadesversus saccades that create the same change in the image as a microsaccade. In this regard, theBOLD signal response to a microsaccade resembles the pattern of BOLD signal response toan eyeblink, albeit it much reduced in magnitude, in that the magnitude of BOLD signalresponse to an eyeblink decreases from V1 to V3, and is most substantially reduced in hMT+.
The results summarized in Fig. 7 indicate that the BOLD response amplitude exhibits a similartrend for the microsaccade, visually guided saccade and eyeblink conditions with the greatestresponse in V1, an intermediate response in V2 and the lowest response in V3. These threeconditions all involve a retinal image shift evoked by rotation of the eye. An image shift causedby stimulus motion on the display during steady fixation evokes a BOLD response that isindistinguishable in V1, V2 and V3. This pattern of results could represent a signature ofextraretinal signals in the visual cortex during eye movements. However, we need to be carefulwhen making comparisons between these conditions and the condition of stimulus motion. Aspointed out by Bristow et al 2005 for eyeblinks and Sylvester et al (2005 and Sylvester et al
Tse et al. Page 8
Neuroimage. Author manuscript; available in PMC 2011 January 1.
NIH
-PA Author Manuscript
NIH
-PA Author Manuscript
NIH
-PA Author Manuscript

(2006) for saccades, differences in retinal image movements for these different conditions, andnot extraretinal signal processing per se, could be at least partially responsible for this patternof results. We took care to assure that the voxels used in the data analysis represented theretinotopic coordinates of the stimulus display and not the peripheral visual field. Furthermore,at least for the comparison between the microsaccade, visually guided saccade (amplitude 0.16deg) and stimulus display shift, the image displacement was small in amplitude. Large saccadessurpassing 1 deg or greater would have led to considerable displacements on the retina of off-display image components (like the edge of the screen or inside housing of the magnet). Suchlarge saccades were avoided in the present comparison.
Constant input to retinal ganglion cells can lead to neural adaptation and, as a consequence,perceptual fading (Clarke and Belcher, 1962; Kotulak and Schor, 1986; Livingstone and Hubel,1987; Martinez-Conde, Macknik, and Hubel, 2004; Millodot, 1967, Ramachandran, 1992).Steady illumination leads to diminished neural responses, whereas abrupt spatial or temporalchanges in stimulus input evoke stronger neural responses (Hartline, 1940; Kuffler, 1952;Hubel and Wiesel, 1965). Fixational microsaccades are thought to play a central role incounteracting neural adaptation and perceptual fading by providing the necessary change inthe image needed to bring novel stimuli into adapted ganglion cell receptive fields, therebytriggering new transient responses (Riggs and Ratliff, 1953; Skavenski et al., 1979; Martinez-Conde et al., 2004, 2006; Engbert and Kliegl, 2004; Livingstone et al., 1996; Macknik andLivingstone, 1998). If effects of microsaccades are counteracted by image stabilization, thevisual scene quickly fades, presumably because of the effects of neural adaptation at the levelof retinal ganglion cells. The image ‘refresh’ signal following a microsaccade is thought totrigger an increase in neural activity in ganglion cells and subsequent neurons in the visualsystem. In support of this view, microsaccades have been found to increase the probability ofsubsequent bursting in the lateral geniculate nucleus of the thalamus (LGN) and V1 neuronsin macaques (Martinez-Conde et al., 2000, 2002, 2004). However, there is as yet no evidencethat the onset of fading triggers microsaccades. Indeed, there may be no such fading-inducedtrigger, if the system makes a microsaccade at some baseline rate as an ‘automaticrefresh’ (Kagan et al., 2008).
The neural basis of microsaccades is still a matter of debate. Barlow (1952) proposed thatmicrosaccades occur upon a shift of visual attention, and it has since been shown thatmicrosaccade rate is indeed modulated by shifts of attention (Engbert and Kliegl, 2003; Hafedand Clark, 2002; Horwitz and Albright, 2003; Rolfs et al., 2004; Tse et al, 2002, 2004; Turattoet al., 2007; Valsecchi and Turatto, 2009) and perceptual state (Hsieh and Tse, 2009; Martinez-Conde et al., 2006), although microsaccade occurrence is not limited to the time of attentionalshifts or perceptual shifts (Tse, Caplovitz and Hsieh, 2009). However, there has been a debateabout whether microsaccade directionality is also influenced by the directionality of attentionalshifts, with some arguing for an influence of attention (Engbert, 2006; Engbert and Kliegl,2003; Hafed and Clark, 2002; Laubrock et al., 2007; Rolfs et al., 2004; Turatto et al., 2007;Valsecchi and Turatto, 2009), and others finding that attention plays no significant role in thedistribution of microsaccade directions (Horwitz and Albright, 2003; Horowitz et al., 2007a,b, Tse et al., 2002, 2004). Whether microsaccade directionality is correlated with attentionaldirectionality or not, the fact that microsaccade rate is modulated by attentional shifts suggeststhat eye-shifting circuitry is not independent of attention-shifting circuitry. This does not provethat microsaccades are generated cortically; they might be generated subcortically, yet beinhibited or released by cortical commands.
The attentional system is thought to have at least two subsystems, one involved in automaticand rapid shifts of “exogenous” attention to abrupt onsets (Irwin et al., 2000; Jonides & Yantis,1988; Remington, Johnston, & Yantis, 1992; Theeuwes, 1994; Yantis & Hillstrom, 1994;Yantis & Jonides, 1984; Yantis & Jonides, 1990), and the other subsystem involved in
Tse et al. Page 9
Neuroimage. Author manuscript; available in PMC 2011 January 1.
NIH
-PA Author Manuscript
NIH
-PA Author Manuscript
NIH
-PA Author Manuscript
volitional shifts of “endogenous” attention. The bottom-up subsystem is thought to involvecircuitry in the superior colliculus (Valsecchi and Turatto, 2007), and the top-down subsystemis thought to involve circuitry in the frontal lobe (Mesulam, 1981; Posner & Petersen, 1990).
Similarly, saccade generation involves at least two parallel subsystems. A sub-cortical pathwayinvolving the superior colliculus generates reflexive, orienting saccades, and a cortical pathwayinvolving the frontal eye fields generates voluntary saccades via top-down input into thesuperior colliculus (e.g. Everling & Munoz, 2000; Hanes, Patterson, & Schall, 1998; Schall,1995). Both the abrupt attentional shift system and abrupt eye movement system appear torecruit some of the same circuitry in the superior colliculus, one to move the direction of gazeand the other to move the focus of processing without necessarily moving the eyes (Corbettaet al., 1998; Kustov & Robinson, 1996; Rizzolatti, 1994; Robinson & Kertzman, 1995).Moreover, the superior colliculus cells thought to trigger saccades may inhibit the superiorcolliculus cells that maintain eye fixation, and vice versa (e.g. Munoz & Wurtz, 1993). If anexogenous or endogenous attentional shift activates saccade cells in the superior colliculus,their activation might influence the behavior of fixation cells through their mutual inhibition,perhaps accounting for the influence of attention on microsaccade rate. Thus, while attentionalshifts modulate the rate of microsaccade occurrence, microsaccades are not fundamentallyattentional in nature. They appear to comprise a built-in reset mechanism to counteract visualfading. As such, it appears that microsaccades are involuntary and automatic under normalcircumstances (Martinez-Conde et al., 2004).
Microsaccades are associated with neuronal responses in all visual areas that have beenconsidered to date (Martinez-Conde et al., 2004, Greschner et al., 2002; Martinez-Conde et al.,2002; Gur and Snodderly, 1997; Bair and O’Keefe, 1998; Leopold and Logothetis, 1998;Snodderly and Kagan, 2001; Reppas et al., 2002), and may account for neuronal responsevariability in awake monkey V1 (Gur et al., 1997). Microsaccades have an excitatory effect inthe retina (Greschner et al., 2002), LGN (Martinez-Conde et al., 2002, Reppas et al., 2002),V1 (Martinez-Conde et al., 2000, 2002, Leopold and Logothetis, 1998; Snodderly and Kagan,2001) extrastriate cortex (Leopold and Logothetis, 1998), and MT (Bair and O’Keefe, 1998)in monkeys. This is due to changes in the visual input induced by microsaccades rather thanmotor signals or top-down feedback, at least in the LGN and area V1, because microsaccadesonly lead to an increase in neural activity when a microsaccade actually brings a new stimulusinto a neuron’s receptive field; In the absence of a stimulus other than the fixation point,microsaccades would not be expected to increase neural activity, because no new stimulusinput would be brought into the adapted cells’ receptive fields (Martinez-Conde et al., 2000,2002).
Leopold and Logothetis (1998), however, found that microsaccades are associated withtransient inhibition of neural activity in V1. Note that they nonetheless found that cells in V2and V4 showed strong excitation that coincided in time with the striate depression of activityfollowing a microsaccade. Because we do not notice changes in the relative position of theretinal image induced by microsaccades, it has been suggested that there is inhibition of neuralfiring associated with the occurrence of microsaccades which might carry information thatwould be perceived as spurious image motion if not suppressed. Although we now have ampleevidence for the existence of saccadic suppression from electrophysiology (Wurtz, 1968;1969; Macknik et al., 1991), psychophysics (Bridgeman and Macknik, 1995; Burr et al.,1994; Ross et al., 2001) and functional MRI (Kleiser et al., 2004; Sylvester et al 2005, 2006;Vallines & Greenlee, 2007) the existence of microsaccade suppression remains controversal(compare Ditchburn, 1955; Beeler; 1967 and Krauskopf, 1966; Sperling, 1990). Collorarydischarges from the brainstem oculomotor nuclei (Zuber et al, 1964; Zuber and Stark, 1966)and/or superior colliculus (Lee et al., 2007) could inhibit the processing of retinal input at thelevel of the LGN (Sylvester et al 2005) or V1 (Vallines & Greenlee, 2007). The present findings
Tse et al. Page 10
Neuroimage. Author manuscript; available in PMC 2011 January 1.
NIH
-PA Author Manuscript
NIH
-PA Author Manuscript
NIH
-PA Author Manuscript

suggest that V1, V2 and V3 are significantly activated after microsaccades, but the limitednumber of subjects used in this analysis requires further confirmation.
Alternatively, microsaccadic suppression need not involve a collateral discharge mechanismlike that presumed to underlie saccadic suppression. Murakami and Cavanagh (1998), forexample, suggested that suppression of the effects of retinal image shifts elicited by fixationaleye movements occurs by continually subtracting the smallest instantaneous velocity motionvector in a scene from all other motion vectors, because this smallest vector could arise as aspurious motion signal during fixational eye movements. Such a computation might take placecortically rather than subcortically, such as in area hMT+ (Murakami and Cavanagh, 2001;Sasaki et al., 2002).
Although microsaccades have been reported to induce excitatory responses in macaque hMT+ (Bair and O’Keefe, 1998), it could be that this activity induces suppression of neural activityelsewhere. The existence of microsaccadic suppression would be indicated by inhibition ofneural activity or by cancellation of neural activity related to retinal image shifts during orfollowing a microsaccade at some level in the visual system.
Thus, neural activity would be expected to increase following release from the neuronaladaptation in retinal ganglion cells that is believed to lead to perceptual fading (i.e. BOLDsignal should increase from the baseline that exists just prior to the occurrence of amicrosaccade), but would be expected to decrease as a function of microsaccadic suppression(i.e. decrease from the baseline that exists just prior to the occurrence of a microsaccade) atsome location in the visual pathway, if such a mechanism indeed exists.3
The exact nature of the activation in visual cortex as a consequence of microsaccades remainsto be determined. One important aspect is related to the retinal image shift elicited bymicrosaccades. Although the size of image shifts caused by microsaccades are clearly abovethe threshold for motion detection, we do not consciously perceive these retinal image shifts.Because the magnocellular/parvocellular geniculostriate pathway inputs that first trigger hMT+ responses emerge from V1, and because V1 exhibits microsaccade modulation but hMT+does not, at least as measured by us using BOLD signal, one might want to conclude that thecomputation that minimizes the spurious motion signals arising from microsaccades occurs inhMT+ itself. However, our data cannot rule out the possibility that there are other pathways tohMT+ that do this. For example, it is possible that direct koniocellular LGN to hMT+ inputs(Sincich et al, 2004) modulate spurious motion signals that arise from microsaccades or othersources. Although there is direct tectopulvinar input to hMT+ that bypasses V1, it is not likelythat microsaccadic suppression is driven by this bottom-up pathway, because the motion andother visual tuning properties of pulvinar nucleus cells appear to be driven cortically ratherthan via bottom-up input from superior colliculus cells (Bender, 1983); Indeed, tectal cells arenot orientation or direction selective (Cynader and Berman, 1972), making it unlikely that abottom-up motion signal reaches hMT+ via the tectopulvinar pathway at all. A collateraldischarge signal that could accomplish microsaccadic suppression of spurious image changeshas been hypothesized to arise in the brainstem ocular-motor nuclei (Zuber et al., 1964; Zuberand Stark, 1966). If this hypothesis is correct, then our data suggest that the discounting ofspurious image motion signals that arise from microsaccades is not accomplished via collateraldischarge, or that such collateral discharge, if it exists, does not operate on V1, but may operateon hMT+. While it is important to place our data in the context of what is known, the present
3Of course, it is possible that an inhibitory mechanism, such as the firing of inhibitory interneurons, could lead to an increase in BOLDsignal in an area where those interneurons existed, but areas downstream from this area would presumably receive less input followingsuch inhibition, and these areas would presumably show decreased BOLD signal relative to preceding baseline upon the occurrence ofa microsaccade.
Tse et al. Page 11
Neuroimage. Author manuscript; available in PMC 2011 January 1.
NIH
-PA Author Manuscript
NIH
-PA Author Manuscript
NIH
-PA Author Manuscript

data alone cannot establish whether microsaccadic suppression occurs, and if so, by whatmechanism it occurs.
Interestingly, the level of response to a voluntary, visually-guided saccade is at least as strongin hMT+ as it is in area V1. This would appear to suggest that the presumed discounting ofspurious image motions generated by saccades is not operative in either V1 or hMT+ duringvisually-guided saccades. On the other hand, our experimental design was conceived todetermine the effects of microsaccades and small voluntary visually-guided saccades withcontinual high-contrast checkerboard presentation. Vallines and Greenlee (2006) found thatthe BOLD signal decreased only for Gabor stimuli flashed immediately around the time of thesaccade onset. The present stimulus was always present, so that saccadic suppression may notbe easily detected here, because we are not just probing the brief duration when saccadicsuppression occurs. Thus, the presence or absence of saccadic suppression cannot be readilydetermined under our current paradigm. Nonetheless, even though the stimulus was alwayspresent, we do find relative dimunition of BOLD signal response to microsaccades in hMT+compared to responses in V1–V3.
While our data do not support or rule out any particular collateral discharge model ofmicrosaccadic suppression, they also do not support the hypothesis (Murakami and Cavanagh,1998) that hMT+ discounts spurious image motion generated as a result of microsaccades bysubtracting the smallest image motion vector from all motion vectors. In our studymicrosaccades are not associated with significant BOLD signal modulation in area hMT+,whereas small visually-guided saccades are. Thus the signals associated with the retinal imageshifts evoked by microsaccades appear to be suppressed prior to the hMT+ processing stage.Interestingly, retinal image shifts associated with stimulus motion and/or visually-guidedsaccades are associated with a significant increase in BOLD signal in all visual areasinvestigated, including hMT+. It follows that the lack of BOLD signal increase in area hMT+that we report here is not a consequence of poor signal-to-noise in our T2*-weighted MR imageseries. Rather the observed pattern of results appears to reflect a genuine difference betweenencoding processes related to stimulus motion, retinal slip due to visually-guided saccades andthat evoked by microsaccades. Whether a collateral discharge, vector subtraction, or othermodel is correct, our data constrain future models of the mechanism whereby spurious imagemotions are discounted by the visual system.
Microsaccades, comparably sized visually-guided saccades, and comparably sized image shiftsunder conditions of fixation, all lead to qualitatively similar time courses of BOLD signalchange in striate and extrastriate cortex, suggesting comparable changes in neural activitycorrelated with their occurrence. While microsaccades would be expected to lead to increasedactivity because of changed input to retinal ganglion cell receptive fields, they might beexpected to lead to decreased output because of potential mechanisms associated withsuppression of spurious motion signals that arise from microsaccades. Our data establish theexistence of net neuronal excitation in V1, V2, and V3 in association with the occurrence ofmicrosaccades, to our knowledge, for the first time in the humans, presumably associated withthe ‘refresh’ in the image following small image shifts. Because the pattern of activation thatis due to a microsaccade-sized (0.16 visual degrees) visually-guided saccade and to amicrosaccade-sized (0.16 visual degrees) jump in the background under steady fixation issimilar to that produced by a microsaccade, it is reasonable to assume that the change in theBOLD signal that arises with microsaccades is due to the shift in the image across the retinathat microsaccades, small saccades, or small image changes induce. As far as V1 cells areconcerned, it does not appear to matter whether the change in ganglion and successive cellinput is due to a microsaccade, a voluntary saccade, or a comparable change of the image,supporting recent single unit work in macaque V1 that reports the same basic pattern of results(Kagan et al., 2008). Note, however, that the magnitude of the BOLD signal to microsaccades
Tse et al. Page 12
Neuroimage. Author manuscript; available in PMC 2011 January 1.
NIH
-PA Author Manuscript
NIH
-PA Author Manuscript
NIH
-PA Author Manuscript

is less than half of that observed in V1 to a visually-guided saccade. This difference may occurbecause an image motion (i.e. the motion of the fixation point to a new location) is the cue tomake a voluntary saccade to that new location. As such, the BOLD signal measured to avisually-guided saccade under our paradigm might involve the superposition of responses toboth this small image change, and the response to the saccade itself. Going beyond the findingsof Kagan et al. (2008), we find that responses in V2 and V3 do differ depending on whetherthe image change was self-generated or not, diminishing for self-generated image changes, butnot diminishing for non-self-generated image changes. Reponses in area hMT+ do, however,differ depending on whether retinal image shifts are induced by stimulus motion, visually-guided saccades (i.e., conscious self motion) or by involuntary micromovements of the eyes(Fig. 3).
An initial negative dip in BOLD signal is evident in most timecourse plots in Figures 7 and 8.This negative dip is thought to arise from a short-term increase in deoxyhemoglobin as oxygenmetabolism increases with neuronal activity before increased blood flow and/or volume bringsin fresh, oxygenated blood to flush out deoxygenated blood (Fox and Raichle, 1986; Frahm etal., 1996; Magistretti & Pellerin, 1999; Frostig et al., 1990; Röther, et al., 2001). Recentmodeling of the BOLD signal (Sotero & Trujillo-Barreto, 2007) finds that the magnitudes ofthe peak in BOLD signal, initial negative dip, and post-stimulus undershoot all increaseproportionally with an increase in the magnitude of neuronal excitation. However, whereasincreased magnitude of inhibition also increases magnitude of the initial dip and post-stimulusundershoot, it decreases the magnitude of the peak. Moreover, increased inhibition of neuronalactivity in the absence of excitation would lead only to a decrease of BOLD signal belowbaseline. To the extent that this model of BOLD signal dynamics is correct, our data imply thatmicrosaccades, saccades, image motion, and eyeblinks all generate net excitatory neuronalactivity in the regions of interest examined. Our data, however, do not rule out the existenceof simultaneous effects of both neuronal excitation and inhibition on the BOLD signaltimecourses observed.
A further finding in our study is the robust increase in BOLD signals associated with eyeblinks(Fig. 3). In a block design Bristow et al (2005a,b) compared periods where subjects voluntarilyblinked to those in which the subjects maintained fixation. This was conducted with and withoutthe presence of diffuse flickering visual stimulation delivered by an optic fiber guide insidethe subjects’ mouths (see Supplementary Material in Bristow et al. 2005a). In the absence ofvisual stimulation, LGN, V1, V2 and V3 are not active during fixation, whereas significantincreases in BOLD response were evident during blinking. In the presence of diffuse flickeringlight, voluntary blinking has an inhibitory effect on visual cortex responses and this effect ismost pronounced in V3 (see Fig. 1 in Bristow et al 2005). Based on the event-related approachwith combined eye tracking that we took here, we could determine the effect of spontaneouslyoccurring blinks on the time course of activation in V1, V2, V3 and hMT+. Our results indicatethat spontaneous blinks in the presence of visual stimulation are associated with a significantincrease in the BOLD response in these areas. The amplitude of this response is greatest forV1 and declines as the signal progresses to higher stages of visual processing in V2, V3 andhMT+ (Fig. 3). Although we did not explicitly investigate the effect of blinking in the absenceof visual stimulation, our results suggest that spontaneous involuntary blinks have a robustexcitatory effect on visual cortex4.
4Note that the majority of researchers do not monitor eye movements while carrying out fMRI experiments. Our results demonstrate thatthis could be problematic for fMRI research where stimuli are presented visually. To the extent that microsaccades, saccades, or eyeblinksmay be correlated with experimental conditions, our data demonstrate that the results of fMRI studies to date could in principle arisebecause of these potential confounds, and not the experimental variables under consideration.
Tse et al. Page 13
Neuroimage. Author manuscript; available in PMC 2011 January 1.
NIH
-PA Author Manuscript
NIH
-PA Author Manuscript
NIH
-PA Author Manuscript
In conclusion, we have described the BOLD signal correlates of microsaccades andmicrosaccade-sized visually-guided saccades and image motions, as well as eyeblinks inhuman visual cortical areas V1, V2, V3, and hMT+. A deconvolution analysis of BOLD signalrevealed a similar pattern of activation following a microsaccade, a 0.16 visual degreevoluntary saccade, and a background jump of 0.16 visual degrees under conditions of fixation.In all cases, an initial increase in BOLD signal peaking at approximately four seconds after theevent was followed by a decline and decrease below baseline in V1, V2, and V3. Thismodulation appears most pronounced for microsaccades and small voluntary saccades in V1,diminishing in strength in V2 and V3. In contrast, 0.16 degree image motions under conditionsof fixation yield the same level of modulation in V1, V2, and V3. BOLD signal, moreover,modulates parametrically with the size of small voluntary saccades (0.16, 0.38, 0.82, 1.64, and3.28 visual degrees) in V1, V2, and V3, but not in hMT+. Eyeblinks generate a much largermodulation that peaks approximately seven seconds after an event, and dips below baseline byapproximately ten seconds post-event, and also exhibits diminishing modulation across V1,V2, and V3. Our results are consistent with the occurrence of transient net neural excitationdriven by changes in input to retinal ganglion cell receptive fields that are induced bymicrosaccades, visually-guided saccades, or small image shifts. The pattern of results in areahMT+ exhibits no significant modulation by microsaccades, relatively small modulation byeyeblinks, and substantial responses to saccades and background jumps, suggesting thatspurious image motion arising from microsaccades and eyeblinks is diminished by this stageof processing.
Supplementary MaterialRefer to Web version on PubMed Central for supplementary material.
AcknowledgmentsThis research was supported by an Alexander von Humboldt Foundation Wilhelm Bessel Award to PUT in 2006 andEuropean Commission grant IST 027198 ‘Decisions in Motion’ and the Harris Distinguished Visiting Professorprogram of Dartmouth College to MWG in 2008. We thank Markus Raabe and Roland Rutschmann for help incollecting data.
ReferencesBair W, O’Keefe LP. The influence of fixational eye movements on the response of neurons in area hMT
+ of the macaque. Vis Neurosci 1998;15:779–86. [PubMed: 9682878]Barlow HB. Eye movements during fixation. JPhysiol Lond 1952;116:290–306. [PubMed: 14939180]Beeler GW. Visual threshold changes resulting from spontaneous saccadic eye movements. Vision Res
1967;7:769–775. [PubMed: 5608665]Bender DB. Visual activation of neurons in the primate pulvinar depends on cortex but not colliculus.
Brain Research 1983;279:258–261. [PubMed: 6640346]Bridgeman B, Palca J. The role of microsaccades in high acuity observational tasks. Vision Res h
1980;20:813–7.Bridgeman BB, Macknik SL. Saccadic suppression relies on luminance information. Psychological
Research 1995;58:163–168. [PubMed: 8570784]Burr DC, Morrone MC, Ross J. Selective suppression of the magnocellular visual pathway during
saccadic eye movements. Nature 1994;371(6497):511–3. [PubMed: 7935763]Clarke FJ, Belcher SJ. On the localization of Troxler’s effect in the visual pathway. Vision Research
1962;2:53–68.Corbetta M, Akbudak E, Conturo TE, Snyder AZ, Ollinger JM, Drury HA, Linenweber MR, Petersen
SE, Raichle ME, Van Essen DC, Shulman GL. A common network of functional areas for attentionand eye movements. Neuron 1998;21(4):761–773. [PubMed: 9808463]
Tse et al. Page 14
Neuroimage. Author manuscript; available in PMC 2011 January 1.
NIH
-PA Author Manuscript
NIH
-PA Author Manuscript
NIH
-PA Author Manuscript

Cynader M, Berman N. Receptive-field organization of monkey superior colliculus. Journal ofNeurophysiology 1972;35:187–201. [PubMed: 4623918]
Ditchburn RW. Eye-movements in relation to retinal action. Opt Acta Lond 1955;1:171–176.Ditchburn RW, Ginsborg BL. Involuntary eye movements during fixation. J Physiol 1953;119:1–17.
[PubMed: 13035713]Engbert R. Microsaccades: A microcosm for research on oculomotor control attention and visual
perception. Prog Brain Res 2006;154:177–92. [PubMed: 17010710]Engbert R, Kliegl R. Microsaccades uncover the orientation of covert attention. Vision Res
2003;43:1035–1045. [PubMed: 12676246]Engbert R, Kliegl R. Microsaccades keep the eyes’ balance during fixation. Psychological Science
2004;6:431–6. [PubMed: 15147499]Everling S, Munoz DP. Neuronal correlates for preparatory set associated with pro-saccades and anti-
saccades in the primate frontal eye field. Journal of Neuroscience 2000;20(1):387–400. [PubMed:10627615]
Hafed ZM, Goffart L, Krauzlis RJ. A neural mechanism for microsaccade generation in the primatesuperior colliculus. Science 2009;13(323):940–3. [PubMed: 19213919]5916
Hanes DP, Patterson WF, Schall JD. Role of frontal eye fields in countermanding saccades: visualmovement, and fixation activity. Journal of Neurophysiology 1998;79(2):817–834. [PubMed:9463444]
Fiorentini A, Ercoles AM. Involuntary eye movements during attempted monocular fixation. AttiFondGiorgio Ronchi 1966;21:199–217.
Fox PT, Raichle ME. Focal physiological uncoupling of cerebral blood flow and oxidative metabolismduring somatosensory stimulation in human subjects. Proc Natl Acad Sci 1986;83:1140–1144.[PubMed: 3485282]
Frahm J, Krüger G, Merboldt KD, Kleinschmidt A. Dynamic uncoupling and recoupling of perfusionand oxidative metabolism during focal brain activation in man. Magn Reson Med 1996;35:143–148.[PubMed: 8622575]
Frostig RD, Lieke EE, Tso DY, Grinvald A. Cortical functional architecture ad local coupling betweenneuronal activity and the microcirculation revealed by in vivo high-resolution optical imaging ofintrinsic signals. Proc Natl Acad Sci 1990;87:6082–6086. [PubMed: 2117272]
Greschner M, Bongard M, Rujan P, Ammermuller J. Retinal ganglion cell synchronization by fixationaleye movements improves feature stimation. Nature 2002;5:341–347.
Gur M, Snodderly DM. Visual receptive fields of neurons in primary visual cortex. V1. move in spacewith the eye movements of fixation . Vision Res 1997;37:257–65. [PubMed: 9135859]
Gur M, Beylin A, Snodderly DM. Response Variability of Neurons in Primary Visual Cortex. V1. ofAlert Monkeys. Journal of Neuroscience 1997;17:2914–2920. [PubMed: 9092612]
Hafed ZM, Clark JJ. Microsaccades as an overt measure of covert attention shifts. Vision Res2002;42:2533–2545. [PubMed: 12445847]
Hartline HK. The nerve messages in the fibers of the visual pathway. JOSA 1940;30:239–247.Horowitz TS, Fine EM, Fencsik DE, Yurgenson S, Wolfe JM. Fixational eye movements are not an index
of covert attention. Psychological Science 2007a;18:356–363. [PubMed: 17470262]Horowitz TS, Fine EM, Fencsik DE, Yurgenson S, Wolfe JM. Microsaccades and Attention: Does a
Weak Correlation Make an Index? Reply to Laubrock Engbert Rolfs and Kliegl. PsychologicalScience 2007b;18(4):367–368.2.
Horwitz GD, Albright TD. Short-latency fixational saccades induced by luminance increments. Journalof Neurophysiology 2003;90:1333–1339. [PubMed: 12904512]
Hsieh P-J, Tse PU. Microsaccade rate varies with subjective visibility during motion-induced blindness.PLOS One 2009;4(4):e5163. [PubMed: 19357789]
Hubel DH, Wiesel TN. Receptive fields and functional architecture in two non-striate visual areas. 18and 19. of the cat. JNeurophysiol 1965;28:229–289. [PubMed: 14283058]
Huk AC, Dougherty RF, Heeger DJ. Retinotopy and functional subdivision of human areas hMT+ andMST. J Neurosci 2002;22(16):7195–205. [PubMed: 12177214]
Tse et al. Page 15
Neuroimage. Author manuscript; available in PMC 2011 January 1.
NIH
-PA Author Manuscript
NIH
-PA Author Manuscript
NIH
-PA Author Manuscript

Irwin DE, Colcombe AM, Kramer AF, Hahn S. Attentional and oculomotor capture by onset luminanceand color singletons. Vision Research 2000;40:1443–1458. [PubMed: 10788651]
Jonides J, Yantis S. Uniqueness of abrupt visual onset in capturing attention. Perception Psychophysics1988;43:346–354. [PubMed: 3362663]
Kagan I, Gur M, Snodderly DM. Saccades and drifts differentially modulate neuronal activity in V1:Effects of retinal image motion position and extraretinal influences. Journal of Vision 2008;8(14):1–25. [PubMed: 19146320]19
Kleiser R, Seitz RJ, Krekelberg B. Neural correlates of saccadic suppression in humans. Curr Biol 2004;14(5):386–90. [PubMed: 15028213]
Kotulak JC, Schor CN. The accommodative response to subthreshold blur and to perceptual fading duringthe Troxler phenomenon. Perception 1986;15:7–15. [PubMed: 3774480]
Kowler E, Steinman RM. The role of small saccades in counting. Vision Res 1977;17:141–6. [PubMed:855198]
Kowler E, Steinman RM. Miniature saccades: eye movements that do not count. Vision Res 1979;19:105–8. [PubMed: 419697]
Krauskopf J. Lack of inhibition during involuntary saccades. Am J Psychol 1966;79:73–81.Kuffler SW. Neurons in the retina: organization inhibition and excitation problems. Cold Spring Harbor
Symposia on Quantitative Biology 1952;17:281–292.Kustov AA, Robinson DL. Shared neural control of attentional shifts and eye movements. Nature
1996;384(7):74–77. [PubMed: 8900281]Laubrock J, Engbert R, Rolfs M, Kliegl R. Microsaccades are an index of covert attention: Commentary
on Horowitz Fine Fencsik Yurgenson and Wolfe. 2007. Psychological Science 2007;18:364–366.[PubMed: 17470263]
Lee PH, Sooksawate T, Yanagawa Y, Isa K, Isa T, Hall WC. Identity of a pathway for saccadicsuppression. Proc Natl Acad Sci USA 2007;104(16):6824–7. [PubMed: 17420449]
Leopold DA, Logothetis NK. Microsaccades differentially modulate neural activity in the striate andextrastriate visual cortex. Experimental Brain Research 1998;123:341–345.
Livingstone MS, Hubel DH. Psychophysical evidence for separate channels for the perception of formcolor movement and depth. Journal of Neuroscience 1987;7:3416–3418. [PubMed: 3316524]
Livingstone MS, Freeman DC, Hubel DH. Visual Responses in V1 of Freely Viewing Monkeys. ColdSpring Harbor Symposia on Quantitative Biology 1996;LXI:27–37.
Lord MP. Measurement of binocular eye movements of subjects in the sitting position. Brit J Ophthal1951;35:21–30. [PubMed: 14821276]
Macknik SL, Fisher BD, Bridgeman B. Flicker distorts visual space constancy. Vision Res 1991;31:2057–64. [PubMed: 1771791]
Macknik SL, Livingstone MS. Neuronal correlates of visibility and invisibility in the primate visualsystem. Nat Neurosci 1998;1:144–9. [PubMed: 10195130]
Magistretti PJ, Pellerin L. Cellular mechanisms of brain energy metabolism and their relevance tofunctional brain imaging. Philos Trans R Soc Lond B Biol Sci 1999;354:1155–1163. [PubMed:10466143]
Martinez-Conde S, Macknik SL, Hubel DH. The role of fixational eye movements in visual perception.Nature Reviews Neuroscience 2004;5(3):229–40.
Martinez-Conde S, Macknik SL, Hubel DH. The function of bursts of spikes during visual fixation in theawake primate lateral geniculate nucleus and primary visual cortex . Proc Natl Acad Sci USA2002;99:13920–5. [PubMed: 12361982]
Martinez-Conde S, Macknik SL, Hubel DH. Microsaccadic eye movements and firing of single cells inthe striate cortex of macaque monkeys. Nature Neuroscience 2000;3:251–8.
Martinez-Conde S, Macknik SL, Hubel DH. The role of fixational eye movements in visual perception.Nat Rev Neurosci 2004;5(3):229–40. [PubMed: 14976522]
Martinez-Conde S, Macknik SL, Troncoso XG, Dyar TA. Microsaccades counteract visual fading duringfixation. Neuron 2006;49(2):297–305. [PubMed: 16423702]
Mesulam MM. A cortical network for directed attention and unilateral neglect. Annals of Neurology1981;10:309–325. [PubMed: 7032417]
Tse et al. Page 16
Neuroimage. Author manuscript; available in PMC 2011 January 1.
NIH
-PA Author Manuscript
NIH
-PA Author Manuscript
NIH
-PA Author Manuscript

Millodot M. Extra foveal variations of the phenomenon of Troxler. Psychologie Francaise 1967;12:190–196.
Moller F, Laursen ML, Tygesen J, Sjolie AK. Binocular quantification and characterization ofmicrosaccades. Graefes Arch Clin Exp Ophthalmol 2002;240:765–70. [PubMed: 12271375]
Munoz DP, Wurtz RH. Fixation cells in monkey superior colliculusIIReversible activation anddeactivation. Journal of Neurophysiology 1993;70(2):576–589. [PubMed: 8410158]
Murakami I, Cavanagh PA. A jitter after-effect reveals motion-based stabilization of vision. Nature1998;395:798–801. [PubMed: 9796813]
Murakami I, Cavanagh P. Visual jitter: evidence for visual-motion-based compensation of retinal slipdue to small eye movements. Vision Research 2001;41:173–86. [PubMed: 11163852]
Posner MI, Petersen SE. The attention system of the human brain. Annual Review of Neuroscience1990;13:25–42.
Ramachandran V. Blindspot. Scientific American 1992;266:4–49.Ratliff F, Riggs LA. Involuntary motions of the eye during monocular fixation. Journal of Experimental
Psychology 1950;40:687–701. [PubMed: 14803643]Remington RW, Johnston JC, Yantis S. Involuntary attentional capture by abrupt onsets. Perception
Psychophysics 1992;51:279–290. [PubMed: 1561053]Reppas JB, Usrey WM, Reid RC. Saccadic eye movements modulate visual responses in the lateral
geniculate nucleus. Neuron 2002;35:961–74. [PubMed: 12372289]Riggs LA, Ratliff F, Cornsweet JC, Cornsweet TN. The disappearance of steadily fixated visual test
objects. JOptSocAm 1953;43:495–501.Rizzolatti, G. Attention and performance XV. Umilta, C.; Moscovitch, EM., editors. Cambridge: MIT;
1994. p. 231-265.Robinson DL, Kertzman C. Covert orienting of attention in macaquesIIIContributions of the superior
colliculus. Journal of Neurophysiology 1995;74(2):713–721. [PubMed: 7472376]Rolfs M, Engbert R, Kliegl R. Microsaccade orientation supports attentional enhancement opposite to a
peripheral cue: commentary on Tse Sheinberg Logothetis. PsycholSci 2004;10:705–707.Rolfs M, Kliegl R, Engbert R. Toward a model of microsaccade generation: The case of microsaccadic
inhibition. Journal of Vision 2008;8(11):5, 1–23. [PubMed: 18831599]Ross J, Morrone MC, Goldberg ME, Burr DC. Changes in visual perception at the time of saccades.
Trends in Neurosciences 2001;24:113–21. [PubMed: 11164942]Röther J, Knab R, Hamzei F, Fiehler J, Reichenbach JR, Büchel C, Weiller C. Negative dip in BOLD
fMRI is caused by blood flow--oxygen consumption uncoupling in humans. Neuroimage 2002;15(1):98–102. [PubMed: 11771977]
Sasaki Y, Murakami I, Cavanagh P, Tootell RH. Human brain activity during illusory visual jitter asrevealed by functional magnetic resonance imaging. Neuron 2002;35:1147–56. [PubMed: 12354403]
Schall JD. Neural basis of saccade target selection. Reviews in the Neurosciences 1995;6(1):63–85.[PubMed: 7633641]
Sereno MI, Dale AM, Reppas JB, Kwong KK, Belliveau JW, Brady TJ, Rosen BR, Tootell RB. Bordersof multiple visual areas in humans revealed by functional magnetic resonance imaging. Science1995;268:889–893. [PubMed: 7754376]
Sincich LC, Park KF, Wohlgemuth MJ, Horton JC. Bypassing V1: a direct geniculate input to area MT.Nat Neurosci 2004;7(10):1123–8. [PubMed: 15378066]
Skavenski AA, Hansen RM, Steinman RM, Winterson BJ. Quality of retinal image stabilization duringsmall natural and artificial body rotations in man. Vision Res 1979;19:675–83. [PubMed: 547477]
Slotnick SD, Yantis S. Efficient acquisition of human retinotopic maps. Human Brain Mapping 2003;18(1):22–9. [PubMed: 12454909]
Snodderly DM, Kagan I, Gur M. Selective activation of visual cortex neurons by fixational eyemovements: implications for neural coding. Visual Neuroscience 2001;18:259–77. [PubMed:11417801]
Sotero RC, Trujillo-Barreto NJ. Modelling the role of excitatory and inhibitory neuronal activity in thegeneration of the BOLD signal. Neuroimage 2007;35(1):149–65. [PubMed: 17234435]
Tse et al. Page 17
Neuroimage. Author manuscript; available in PMC 2011 January 1.
NIH
-PA Author Manuscript
NIH
-PA Author Manuscript
NIH
-PA Author Manuscript

Sparks DL. The brainstem control of saccadic eye movements. Nat Rev Neurosci 2002;3:952–64.[PubMed: 12461552]
Sperling, G. Eye movements and their role in visual and cognitive processes. Kowler, E., editor. Elsevier;1990. p. 307-351.
Steinman RM, Cunitz RJ, Timberlake GT, Herman M. Voluntary control of microsaccades duringmaintained monocular fixation. Science 1967;155:1577–9. [PubMed: 6020487]
Steinman RM, Haddad GM, Skavenski AA, Wyman D. Miniature eye movement. Science 1973;181:810–9. [PubMed: 4198903]
Theeuwes J. Stimulus-driven capture and attentional set: selective search for color and visual abruptonsets . Journal of Experimental Psychology: Human Perception Performance 1994;20(4):799–806.
Tse PU, Caplovitz GP, Hsieh P-J. Corrigendum to ‘Microsaccade directions do not predict directionalityof illusory brightness changes of overlapping transparent surfaces’ [Vision Research 46 (2006) 3823–3830]. Vision Research 2009;49(790):e1–e7. [PubMed: 19569272]
Tse PU, Sheinberg DL, Logothetis NK. Fixational eye movements are not affected by abrupt onsets thatcapture attention. Vision Res 2002;42:1663–1669. [PubMed: 12079794]
Tse PU, Sheinberg DS, Logothetis NK. The distribution of microsaccade directions need not reveal thelocation of attention. Psychol Science 2004;15(10):708–10.
Turatto M, Valsecchi M, Tamè L, Betta E. Microsaccades distinguish between global and local visualprocessing. Neuroreport 2007;18(10):1015–1018. [PubMed: 17558287]
Vallines I, Greenlee MW. Saccadic suppression of retinotopically localized blood oxygen level-dependent responses in human primary visual area V1. Journal of Neuroscience 2006;26(22):5965–9. [PubMed: 16738238]
Valsecchi M, Turatto M. Microsaccadic response to visual events that are invisible to the superiorcolliculus. Behav Neurosci 2007;121(4):786–93. [PubMed: 17663603]
Valsecchi M, Turatto M. Microsaccadic responses in a bimodal oddball task. Psychol Res 2009;73(1):23–33. [PubMed: 18320216]
Winterson BJ, Collewijn H. Microsaccades during finely guided visuomotor tasks. Vision Research1976;16:1387–90. [PubMed: 1007017]
Wurtz RH. Visual cortex neurons: response to stimuli during rapid eye movements. Science1968;162:1148–1150. [PubMed: 4301650]
Wurtz RH. Vision for the control of movement The Friedenwald Lecture. Investigative OphthalmologyVisual Science 1996;37:2130–45. [PubMed: 8843900]
Wurtz RH. Comparison of effects of eye movements and stimulus movements on striate cortex neuronsof the monkey. J Neurophysiol 1969;32:987–994. [PubMed: 4981519]
Yantis S, Hillstrom AP. Stimulus-driven attentional capture: evidence from equiluminant visual objects.Journal of Experimental Psychology: Human Perception Performance 1994;20(1):95–107.
Yantis S, Jonides J. Abrupt visual onsets and selective attention: evidence from visual search. Journal ofExperimental Psychology: Human Perception Performance 1984;10(5):601–621.
Yantis S, Jonides J. Abrupt visual onsets and selective attention: voluntary versus automatic allocation.Journal of Experimental Psychology: Human Perception Performance 1990;16(1):121–134.
Yarbus, AL. Eye Movements and Vision. Plenum Press; New York: 1967.Zuber BL, Crider A, Stark L. Saccadic suppression associated with microsaccades. QPR 1964;74:244–
249.Zuber BL, Stark L. Saccadic suppression: elevation of visual threshold associated with saccadic eye
movements. Exp Neurol 1966;16:65–79. [PubMed: 5923485]Zuber BL, Stark L. Microsaccades and the velocity-amplitude relationship for saccadic eye movements.
Science 1965;150:1459–60. [PubMed: 5855207]
Tse et al. Page 18
Neuroimage. Author manuscript; available in PMC 2011 January 1.
NIH
-PA Author Manuscript
NIH
-PA Author Manuscript
NIH
-PA Author Manuscript
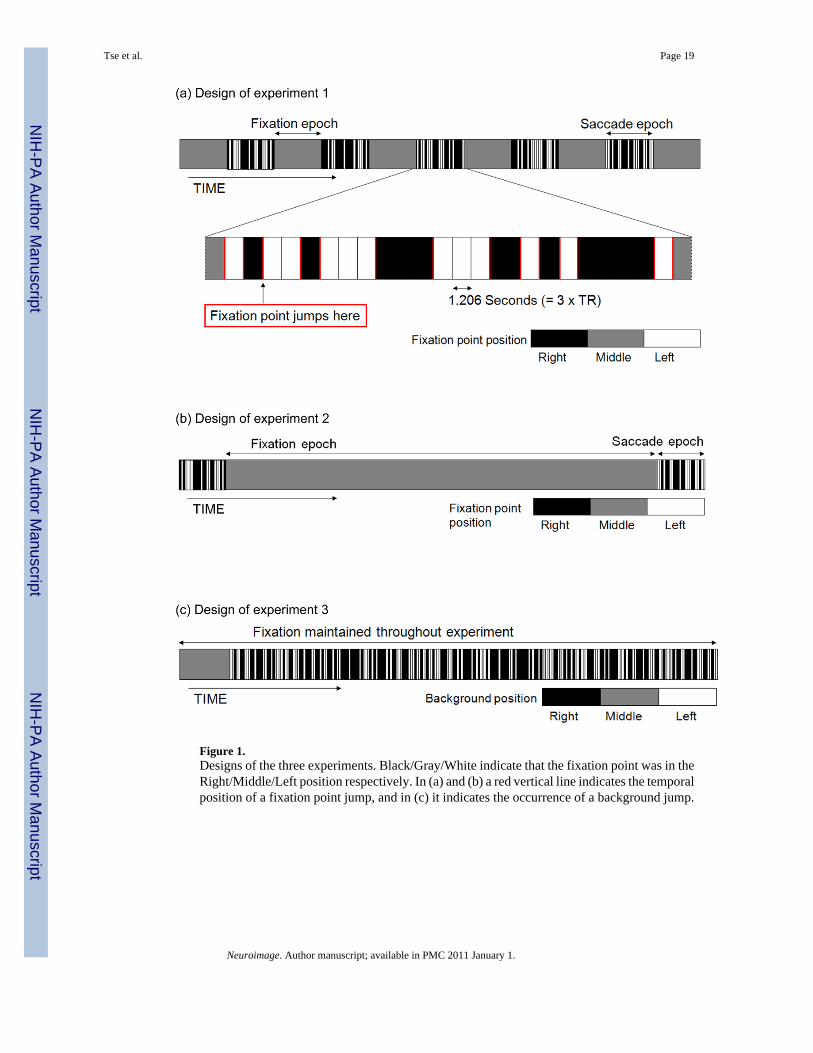
Figure 1.Designs of the three experiments. Black/Gray/White indicate that the fixation point was in theRight/Middle/Left position respectively. In (a) and (b) a red vertical line indicates the temporalposition of a fixation point jump, and in (c) it indicates the occurrence of a background jump.
Tse et al. Page 19
Neuroimage. Author manuscript; available in PMC 2011 January 1.
NIH
-PA Author Manuscript
NIH
-PA Author Manuscript
NIH
-PA Author Manuscript

Figure 2.The stimulus was the same polar checkerboard in all three experiments. In experiment 1 thecheckerboard was stationary and the fixation point jumped back and forth within the centralhorizontal white band 0.16, 0.38, 0.82, 1.64, and 3.28 visual degrees in a block design. Inexperiment 2 the checkerboard was stationary while the fixation point was placed on the centralhorizontal white band and remained stationary, except during the two 30s epochs at thebeginning and end of each run, during which the fixation point, but not the checkerboard,alternated position pseudorandomly between 0.08 visual degrees to the left and 0.08 visualdegrees to the right of the center for a 0.16 visual degree jump, in order to induce voluntaryvisually-guided saccades that were as small as microsaccades. Experiment 3: The fixation pointremained stationary at the central location while the checkerboard jumped 0.08 visual degreesto the left and right of the fixation point, for a 0.16 visual degree jump of the backgroundoverall. The task was to maintain fixation on the fixation point throughout all three experiments,whether moving or not.
Tse et al. Page 20
Neuroimage. Author manuscript; available in PMC 2011 January 1.
NIH
-PA Author Manuscript
NIH
-PA Author Manuscript
NIH
-PA Author Manuscript
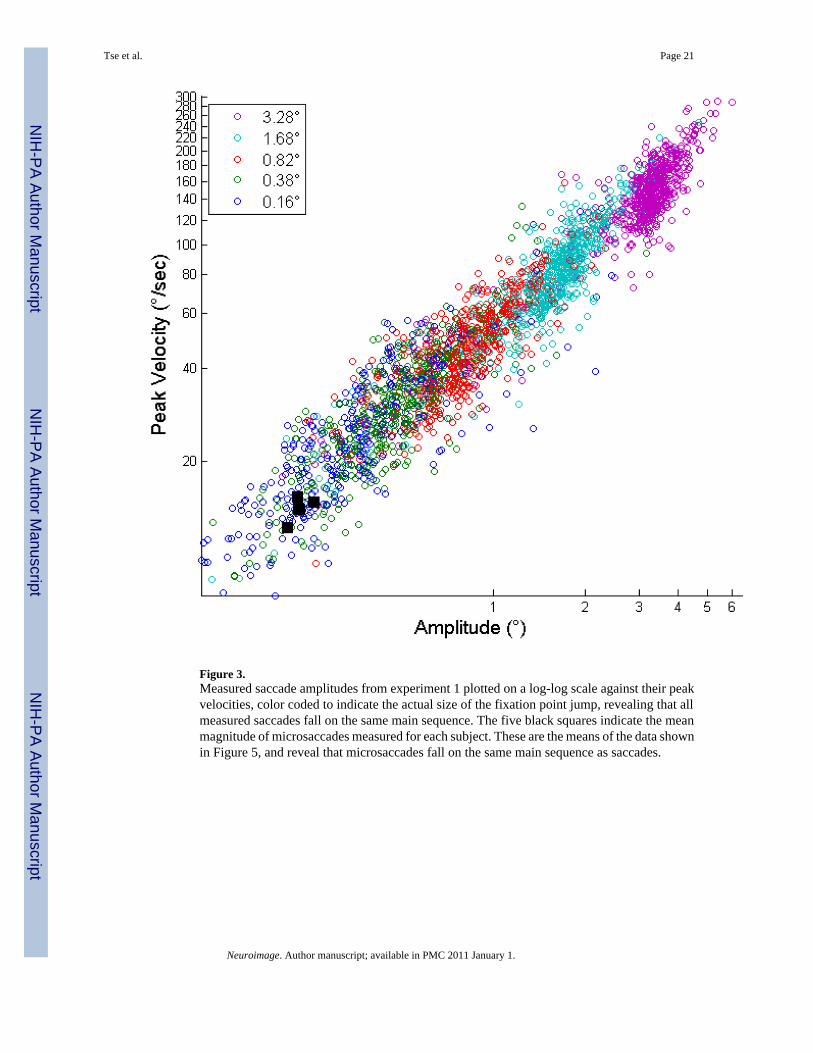
Figure 3.Measured saccade amplitudes from experiment 1 plotted on a log-log scale against their peakvelocities, color coded to indicate the actual size of the fixation point jump, revealing that allmeasured saccades fall on the same main sequence. The five black squares indicate the meanmagnitude of microsaccades measured for each subject. These are the means of the data shownin Figure 5, and reveal that microsaccades fall on the same main sequence as saccades.
Tse et al. Page 21
Neuroimage. Author manuscript; available in PMC 2011 January 1.
NIH
-PA Author Manuscript
NIH
-PA Author Manuscript
NIH
-PA Author Manuscript

Figure 4.An example of 10 seconds of horizontal channel eyetraces (black) from a single subject,superimposed upon the corresponding velocity of the eye movements (red, centered at 0velocity). Microsaccades were detected as outliers in velocity space subject to other criteria(see text). Detected microsaccades are indicated with black circles. Eyetrace units are z-scoresof amplitude in degrees of visual angle, and eye movement velocity units are visual degreesper second.
Tse et al. Page 22
Neuroimage. Author manuscript; available in PMC 2011 January 1.
NIH
-PA Author Manuscript
NIH
-PA Author Manuscript
NIH
-PA Author Manuscript

Tse et al. Page 23
Neuroimage. Author manuscript; available in PMC 2011 January 1.
NIH
-PA Author Manuscript
NIH
-PA Author Manuscript
NIH
-PA Author Manuscript

Figure 5.(a) Main sequence of detected microsaccades from experiment 2, plotting microsaccadeamplitude against peak velocity. Superimposed in the corresponding color is the regressionline that best fits a given subject’s data. Values of the correlation coefficient r are given in thelegend. Note that only the three highest correlation coefficient subjects’ data was used inaveraging BOLD signal deconvolution timecourses (see Fig. 7). (b) Histogram of the velocitiesof detected microsaccades. (c) Histogram of the amplitudes of detected microsaccades. Databelow x=0.16 are not shown because we did not count as microsaccades visual events whoseamplitude was less than 0.16 visual degress.
Tse et al. Page 24
Neuroimage. Author manuscript; available in PMC 2011 January 1.
NIH
-PA Author Manuscript
NIH
-PA Author Manuscript
NIH
-PA Author Manuscript

Figure 6.The level of BOLD signal activation increases in V1, V2, and V3 as a function of the size ofa voluntary saccadic eye movement, but remains flat for hMT+.
Tse et al. Page 25
Neuroimage. Author manuscript; available in PMC 2011 January 1.
NIH
-PA Author Manuscript
NIH
-PA Author Manuscript
NIH
-PA Author Manuscript

Figure 7.The curves indicate the average deconvolution functions corrected for autocorrelationfollowing an event (x=0) in V1 (black), V2 (red), V3 (blue), and hMT+ (black dotted) formicrosaccades (top left) from experiment 2 (n=5, but only showing the average of the threesubjects that passed the conservative criteria for inclusion described in text), background shifts(i.e. image motions) from experiment 3 (n=5, top right), 0.16 visual degree visually-guidedsaccades from experiment 2 (n=5, bottom left), and (4) eyeblinks from experiment 2 (n=5,bottom right). The data are plotted in all subplots at increments of volume acquisitions(TR=631ms, eleven slices oriented along the calcarine sulcus), but the x-axis has been relabeledas seconds for clarity. 32 volumes equals approximately 20 seconds. Zero on the x-axisindicates the beginning of a volume in which an event was detected. The first datapoint in eachdeconvolution function is drawn at the end of the first TR. The units of the y axis are % BOLDsignal change. Note that the scale of the y-axis is the same for microsaccades, 0.16 visual degreebackground jumps and 0.16 visual degree visually guided saccades, but different for eyeblinksbecause of the large difference in response to eyeblinks.
Tse et al. Page 26
Neuroimage. Author manuscript; available in PMC 2011 January 1.
NIH
-PA Author Manuscript
NIH
-PA Author Manuscript
NIH
-PA Author Manuscript
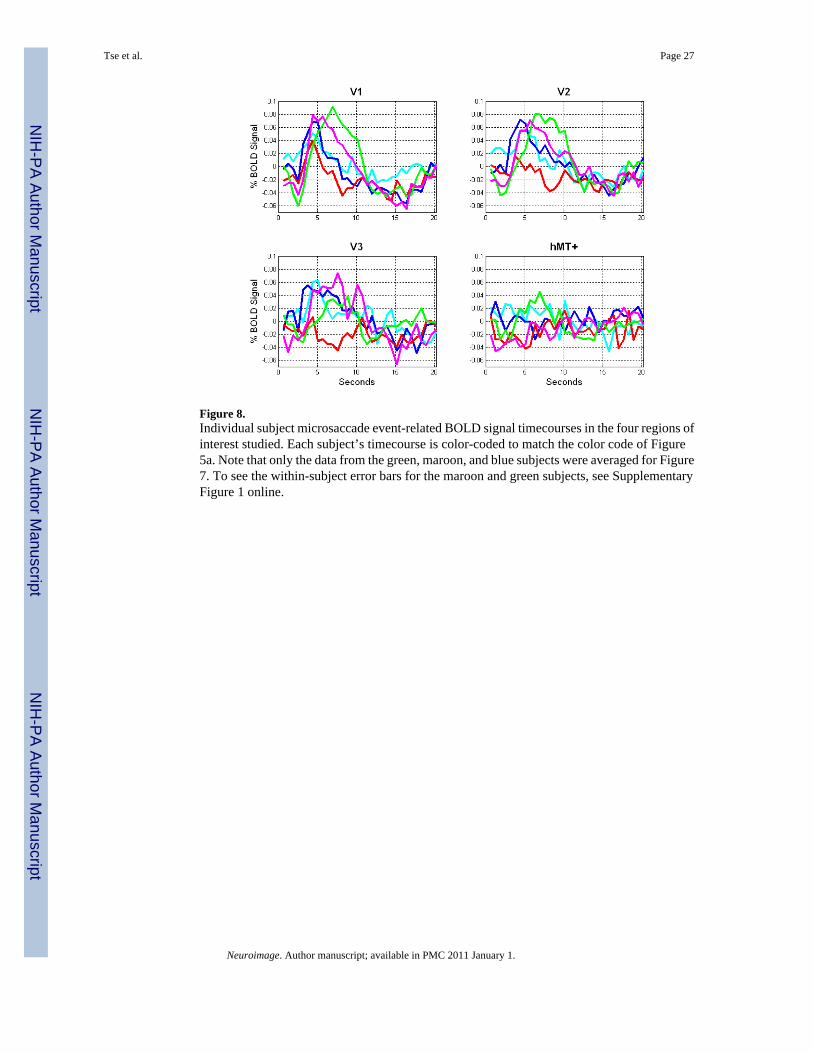
Figure 8.Individual subject microsaccade event-related BOLD signal timecourses in the four regions ofinterest studied. Each subject’s timecourse is color-coded to match the color code of Figure5a. Note that only the data from the green, maroon, and blue subjects were averaged for Figure7. To see the within-subject error bars for the maroon and green subjects, see SupplementaryFigure 1 online.
Tse et al. Page 27
Neuroimage. Author manuscript; available in PMC 2011 January 1.
NIH
-PA Author Manuscript
NIH
-PA Author Manuscript
NIH
-PA Author Manuscript