ACOUSTICALLY EVOKED POTENTIALS IN THE DURING ...
98
)OCUMENT OFFICE 2---T RM00 36-412 RESEARCH LABORATORY OF ELECTRONICS VASSACHUSETTS INSTITUTE OF TECHNOLOGY 'AMBRIDGE, MASSACHUSETTS 02139, U.S.A. ACOUSTICALLY EVOKED POTENTIALS IN THE DURING CONDITIONING ROBERT D. HALL ROGER GREENWOOD MARK ad RAT 64 TECHNICAL REPORT 455 NOVEMBER 30, 1966 MASSACHUSETTS INSTITUTE OF TECHNOLOGY RESEARCH LABORATORY OF ELECTRONICS CAMBRIDGE, MASSACHUSETTS c0p0
-
Upload
khangminh22 -
Category
Documents
-
view
0 -
download
0
Transcript of ACOUSTICALLY EVOKED POTENTIALS IN THE DURING ...

)OCUMENT OFFICE 2---T RM00 36-412RESEARCH LABORATORY OF ELECTRONICSVASSACHUSETTS INSTITUTE OF TECHNOLOGY'AMBRIDGE, MASSACHUSETTS 02139, U.S.A.
ACOUSTICALLY EVOKED POTENTIALS IN THE
DURING CONDITIONING
ROBERT D. HALL
ROGER GREENWOOD MARK
ad
RAT
64
TECHNICAL REPORT 455
NOVEMBER 30, 1966
MASSACHUSETTS INSTITUTE OF TECHNOLOGY
RESEARCH LABORATORY OF ELECTRONICSCAMBRIDGE, MASSACHUSETTS
c0p0

The Research Laboratory of Electronics is an interdepartmentallaboratory in which faculty members and graduate students fromnumerous academic departments conduct research.
The research reported in this document was made possible inpart by support extended the Massachusetts Institute of Tech-nology, Research Laboratory of Electronics, by the JOINT SERV-ICES ELECTRONICS PROGRAMS (U.S. Army, U.S. Navy, andU.S. Air Force) under Contract No. DA36-039-AMC-03200 (E);additional support was received from the National Science Founda-tion (Grant GK-835), the National Institutes of Health (Grant2 PO1 MH-04737-06), and the National Aeronautics and Space Ad-ministration (Grant NsG-496).
Reproduction in whole or in part is permitted for any purpose ofthe United States Government.
Qualified requesters may obtain copies of this report from DDC.

MASSACHUSETTS INSTITUTE OF TECHNOLOGY
RESEARCH LABORATORY OF ELECTRONICS
Technical Report 455 November 30, 1966
ACOUSTICALLY EVOKED POTENTIALS IN THE RAT
DURING CONDITIONING
Robert D. Hall and Roger Greenwood Mark
(Manuscript received August 26, 1966)
Abstract
Acoustically evoked potentials were recorded from unanesthetized rats in a seriesof experiments designed to study changes in sensory evoked potentials during condi-tioning. It is shown that when clicks are established as conditional stimuli (CS) in con-ditioned emotional response (CER) situations, click-evoked potentials recorded fromcentral auditory structures and from mesencephalic reticular formation exhibit appre-ciable amplitude increases. Similar increases were found with Sidman avoidance con-ditioning. These changes in evoked potentials during aversive conditioning were notrelated to acquired discriminative or conditional properties of the acoustic stimulus,since similar changes in click-evoked potentials were found when a CER was broughtunder control of a photic CS. These alterations in click-evoked potentials were shownto be independent of movement or movement-related variables. Potentials evoked incentral auditory structures by electrical stimuli applied to the cochlear nucleus orwithin the cochlea also revealed increases in amplitude during acquisition of a CER. Inone experiment nearly all movement was eliminated in both CS and control conditionsthrough methods of behavioral control. Data-sampling techniques provided a furthercontrol for residual differences in amount of movement in the two periods. These pro-cedures did not eliminate increases in amplitudes of click-evoked potentials duringaversive conditioning.
In general, whenever behavioral measures indicated that rats were frightened,acoustically evoked potentials evidenced increased amplitudes, whether or not a CS waspresent. In all experiments only changes in late components of acoustically evokedpotentials were consistently related to observed behavioral changes. It is concluded thatchanges in sensory evoked potentials observed during conditioning are not related towhat may be considered the neural substrate of conditioning, but, in aversive condi-tioning situations at least, they are associated with fear elicited initially as an uncondi-tioned response to noxious stimulation and later as a conditioned response.

a
-

TABLE OF CONTENTS
I. INTRODUCTION 1
1.1 Changes in Sensory Evoked Potentials Observed in ClassicalAversive Conditioning Studies 1
1. 2 Changes in Sensory Evoked Potentials Observed duringAvoidance Conditioning 6
1. 3 Changes in Evoked Potentials Observed with AppetitiveConditioning Procedures 9
1.4 Experimental Background of the Present Investigation 10
II. GENERAL EXPERIMENTAL METHODS AND PROCEDURES 13
2.1 Subjects 13
2.2 Electrodes 13
2. 3 Procedures for Implanting Electrodes 13
2. 4 Histological Verification of Electrode Placements 14
2. 5 Recording and Processing Neural Potentials 14
2.6 Conditioned Emotional Response Situation 15
2. 7 Behavioral Apparatus 16
2. 8 Acoustic Stimuli 17
2. 9 Presentation of Data 17
III. CLICK-EVOKED POTENTIALS RECORDED FROM CENTRALAUDITORY STRUCTURES 19
IV. EXPERIMENTAL ANALYSIS OF CHANGES IN ACOUSTICALLYEVOKED POTENTIALS DURING CONDITIONING 23
4.1 Experiment I 23
4. 2 Experiment II 28
4.3 Experiment III 33
4. 4 Experiment IV 40
4. 5 Experiment V 52
4. 6 Experiment VI 57
V. SUMMARY OF EXPERIMENTAL WORK AND DISCUSSION 70
5.1 Early components of Auditory Evoked Potentials 70
5. 2 Late components of Auditory Evoked Potentials 71
5. 3 Comments on Reported Changes in Evoked Potentials Relatedto "Attention" 75
5.4 Closing Remarks 77
VI. SUMMARY 78
Acknowledgment 79
References 80
iii


I. INTRODUCTION
The search for neuroelectric correlates of conditioning may be traced to the first
report of a conditioned alpha block by Durup and Fessard, Z0 in 1935, but with a few
notable exceptions this endeavour belongs to the last decade. Experimental work with
animals had to wait upon adequate techniques for the permanent implantation of elec-
trodes. General improvements in electrophysiological methods and instrumentation
have also helped to make this work feasible. At last, though hardly least, the computer,
within very recent years, has added new dimensions to brain research with the behaving
organism.
A review of the entire literature concerned with neuroelectric correlates of condi-
tioning is clearly beyond the scope of this experimental report. For a most comprehen-
sive and relatively recent review the reader may wish to consult Morrell.6 2 The
published proceedings of several international symposia also provide interesting and
representative cross sections of research on the electrical activity of the brain during
conditioning. 1 8 24,37 50 Our attention here will be confined to changes in sensory
evoked potentials observed during conditioning.
1.1 CHANGES IN SENSORY EVOKED POTENTIALS OBSERVED IN CLASSICAL
AVERSIVE CONDITIONING STUDIES
Galambos and Morgan32 describe an experiment by two Russian workers, Artemyev
and Bezladnova,3 which to the best of our knowledge is the first report of alterations in
evoked potentials related to conditioning. (We make a distinction between sensory activ-
ity evoked by "flickering" stimuli that may "drive" neural potentials, and evoked
responses to stimuli presented at sufficiently low repetition rates to preclude appreci-
able interactions between successive evoked responses.) Artemyev and Bezladnova
employed tone bursts of 1. 3-sec duration as conditional stimuli (CS) for a leg flexion
response in cats. The unconditional stimulus (UCS) was an electric shock to the paw.
The potentials evoked by the tone bursts were monitored on an oscilloscope, and electro-
myograms from the leg muscles provided a measure of the conditioned response (CR).
As the CR developed, it was accompanied by an increase in the percentage of evoked
responses that were detectable in single oscilloscope traces, and thus signified an
increase in amplitude of these potentials. With extinction the potentials reverted to
preconditioning levels.
The first report of similar findings from American laboratories was that of
Galambos, Sheatz, and Vernier. 3 0 In this study, electrodes were permanently implanted
in cochlear nucleus, auditory and visual cortex, septal area, hippocampus, amygdala,
and caudate nucleus of cats. During a preconditioning period the subjects were habit-
uated to click stimuli presented day and night at a rate of 1/3 sec for "many days or
weeks." In the conditioning phase of the experiments that followed, approximately
10-20 electric shocks were presented to the chest contiguously with random clicks.
1
�C __ _

Evoked potentials recorded during this procedure were compared with potentials
recorded before conditioning and with those recorded during an extinction period that
followed. No systematic behavioral measures were reported, but crouching, snarling,
twitching or similar responses to the click CS were regarded as evidence of conditioning.
It was found that amplitudes of click-evoked potentials decreased during the long habit-
uation period, increased when the clicks were "paired" with shock, and fell to precondi-
tioning levels during extinction. Additional experiments were performed with cats
paralyzed with Flaxedil in order to determine if the changes in evoked potentials were
related to movement. Similar changes were found in the paralyzed cats.
Following this initial report, Galambos and various co-workers have published a
series of papers confirming the original findings. 7 ' 28, 34, 41, 59,63 Both cats and mon-
keys were employed as subjects in this series of experiments. In all of these studies
trains of clicks or tone bursts were used as conditional stimuli. The CS was followed
by shock or, in the more recent experiments, by puffs of air to the subject's face. The
subjects were always exposed to the auditory stimuli for long periods preceding the
conditioning phase of an experiment; and in general, evoked potentials were found to
undergo appreciable reductions in amplitude during these habituation periods. Pairing
of the acoustic stimulus with a noxious one consistently led to increases in the ampli-
tudes of acoustically evoked potentials. This was true for potentials recorded from sev-
eral locations in the classical auditory projection and for potentials recorded from other
CNS locations. The latter included hippocampus, caudate nucleus, reticular formation,
dorsal midbrain tegmentum, habenula, cingulate cortex, and field of Forel. Auditory
structures that yielded larger evoked responses with conditioning included cochlear
nucleus, trapezoid body, superior olivary complex, inferior colliculus, medial genicu-
late body, and auditory cortex.
In the study by Moushegian, Rupert, Marsh, and Galambos,63 changes in amplitudes
of click-evoked cortical potentials during habituation and conditioning were found in four
cats with severed middle-ear muscles. A report by Hugelin, Dumont and Paillas4 7 had
suggested that middle-ear muscles might play a role in the modification of acoustically
evoked potentials during attentive behavior. In encephale isol6 cats it had been found
that electrical stimulation of the reticular formation led to reductions in amplitudes of
auditory cortical potentials. This effect could not be reproduced in animals with sev-
ered middle-ear muscles. The report by Moushegian et al. and the earlier one by
Galambos, Sheatz, and Vernier seem to rule out middle-ear muscle activity as the
explanation for changes in acoustically evoked potentials during conditioning, since the
alterations were found in animals with severed middle-ear muscles and in animals para-
lyzed with Flaxedil.
Galambos and Sheatz 3 4 have noted that acoustically evoked potentials recorded from
many sites in the central nervous system, auditory and "nonauditory" alike, assume
essentially the same waveform when the acoustic stimulus has been established as a
conditioned one. They have described it as a triphasic response: a positive potential
2
-

followed by a negative wave and a second positive wave. Increased similarity in wave-
forms effected through conditioning has also been reported by John, Ruchkin, and
Villegas.51
Among the earliest reports of alterations in sensory evoked potentials related to
conditioning was a paper by Jouvet and Hernindez-Peon, 5 3 first presented in 1955 at the
Fifth Marseille Colloquium of the International Federation of Electroencephalography
and Clinical Neurophysiology. The conditioning phase of this study was a logical exten-
sion of the authors' work on changes in sensory evoked potentials during habituation and
attention, also treated in the same paper, and described in other publications of the
same period.4 4 ' 45 We shall defer discussion of the work on habituation and attention
and consider only that part of the study concerned with conditioning.
Jouvet and Hernindez-Peon employed a tone burst of 2500 cps and 2. 0-sec duration
as a CS. This was followed by the UCS, a shock to the paw. The subjects were cats
with permanently implanted electrodes in cortical and subcortical structures. These
included primary auditory cortex, reticular formation, and that part of somatic, sen-
sorimotor cortex serving the limb involved in the conditioned response. Electromyo-
grams from the subject's leg provided a measure of the CR. With acquisition of the CR,
amplitudes of evoked potentials recorded from auditory cortex increased. Moreover,
potentials evoked by the auditory CS were also recorded from somatic cortex. With
extinction, evoked potentials from auditory cortex diminished, while those recorded
from somatic cortex could no longer be discerned in the EEG. Reconditioning returned
the potentials to amplitudes seen during the initial conditioning.
The report by Hernindez-Peon, Jouvet and Scherrer, 4 5 concerned mainly with habit-
uation of evoked potentials, also described a conditioning experiment with cats in which
amplitudes of acoustically evoked potentials increased when a tone-burst CS was paired
with shock to the paw, Other reports by Hernindez-Peon and his co-workers have
described imilar changes in evoked potentials recorded from the visual pathway and
reticular formation when photic stimuli were employed as conditional stimuli in classi-
cal aversive conditioning situations.4 3 ' 66.-11
An early report by Buser, Jouvet, and Hernindez-Peon 1 described a variation on
the modification of sensory evoked potentials during conditioning. In this experiment
with three unanesthetized cats, the "excitability cycle" of mesencephalic reticular
formation was altered by conditioning procedures. Potentials evoked by pairs of clicks
were recorded before, during, and after a conditioning procedure in which click pairs
were regularly followed by shock to the paw. The second click of each pair typically
followed the first by 300-400 msec. Before the introduction of shock, the response
evoked by the second click was appreciably smaller than the response evoked by the
first. The difference in amplitudes was reduced when shocks to the paw were presented
after each pair of clicks. Responses to both clicks were enhanced, but the enhancement
was greater for potentials evoked by the second click. The change was interpreted as
a decrease in the subnormal excitability of the reticular formation that ordinarily
3
--~~~_
followed a response to the first click of each pair. Omission of the shock provided little
evidence of an expected extinction effect. Interestingly, a pseudoconditioning control
procedure had ambiguous effects. This control consisted of shock presentations that
were "random" with respect to the acoustic stimuli. One subject evidenced changes in
evoked potentials similar to those observed during conditioning; another subject did not.
This is one of very few experiments that have employed any controls of this kind.
In one of the few experiments to employ rats as subjects, Macadar, Gin6s, Bove,
and Garcia-Austt5 7 have described changes in photically evoked potentials recorded
from visual cortex during conditioning. The conditioning procedure was one in which
shocks were presented at either the beginning or the end of 40-sec periods in which light
flashes were presented at 1/sec. Photic stimulation periods alternated with 40-sec
periods of no stimulation. Flash-evoked cortical potentials evidenced increased ampli-
tudes when shocks were presented during a train of flashes. It apparently made no dif-
ference whether the shocks were delivered at the beginning or the end of the flash series.
From the same Montevideo laboratory, Buno, Velluti, Handler, and Garcia-Austt
have described changes in round-window potentials recorded from guinea pigs during
conditioning. Acoustic stimuli, clicks or tone pips were in some cases presented
directly to the middle ear through a tube fixed in place at the time round-window elec-
trodes were implanted. Parts of the ossicular chain in the middle ear were also
removed at the same time. Electric shocks delivered to the contralateral pinna were
paired with acoustic stimuli in the following way: Clicks or tone pips presented at 1/sec
were each followed by a shock for a period of three minutes. No evoked potentials were
recorded during these shock periods. The shock periods alternated with three-minute
periods in which no shocks were presented. During the latter, round-window potentials
were recorded. Cochlear microphonics evoked by tone pips were found to increase in
amplitude with the commencement of shocking, but with continued shocking underwent
reductions which the authors regarded as evidence of "rehabituation." When shocks
were discontinued this reduction was accelerated. Similar changes were found in the
N1 response to click stimulation. Buno et al. believe that the way in which stimuli were
presented, i. e., directly into the middle ear through a tube, rules out an explanation of
the changes in terms of uncontrolled stimulus parameters. Removal of the ossicles
eliminated the possibility that changes in round-window potentials were due to contrac-
tions of middle-ear muscles. In view of the potential significance of the findings, the
appreciable variability in the data presented is disturbing. We can only wish that addi-
tional systematic data from a number of subjects had been presented.
To the best of our knowledge, Beck, Doty, and Kooi6 have been the only workers to
report that sensory evoked potentials did not change when acoustic stimuli were made
conditional stimuli in a classical aversive conditioning situation. Their experiments
were concerned primarily with conditioned cortical arousal responses. Cats immobi-
lized with bulbocapnine were employed as subjects. Cortical arousal was elicited by
2-sec tone bursts after the acoustic stimulus had been paired with shock to the paw, but
4

evoked cortical responses to tone onset showed no systematic changes during condi-
tioning. For one subject, a series of four clicks was employed as the CS, and the click-
evoked potentials did not appear to change either. Whether or not these findings can be
attributed to the use of bulbocapnine is difficult to say.
Behavioral measures of a conditioned response have been conspicuously absent in
most of the published reports reviewed above. In many instances there has been neither
definition nor measurement of the response that presumably has been conditioned. Justi-
fication for use of the term "conditioning" has been that the relevant sensory stimulus
was "paired" in some more or less systematic way with another stimulus, usually elec-
tric shock. The so-called "pairing of stimuli" is not, however, a sufficient operation
to define a conditioning situation, including that of "sensory-sensory conditioning." The
conditioning process is influenced by a number of important variables, and there are
conditions under which the pairing of stimuli does not lead to the occurrence of condi-
tioned responses. To assume that the temporal contiguity of two stimuli has led to some
sort of conditioning would seem to be poor practice in a scientific endeavour struggling
with such complex problems. We believe, and will attempt to show, that repeated
failures to obtain careful systematic measures of behavior have from the outset led to
a misunderstanding about the nature of changes in evoked potentials during conditioning.
To assume that alterations in sensory evoked potentials are a sign that conditioning has
occurred would seem to beg the question, at least if we are talking about conditioned
changes in behavior. The phrase 'neural correlates of conditioning' will be meaningful
only when systematic alterations in neuroelectric activity are related to orderly changes
in measures of a conditioned response.
It may not be unreasonable to regard a change in evoked potentials as a conditioned
response, quite independently of any measurable changes in behavior, be it muscular
or glandular. If, however, such changes are to be viewed within a Pavlovian conditioning
paradigm (and this seems to have been the model that has dictated the "pairing" of
stimuli in studies employing such procedures), then the UCS, shock in most cases, must
be regarded as a stimulus that itself is capable of eliciting the changes in evoked poten-
tials. The essential role of the unconditional stimulus in classical conditioning para-
digms revolves around its capacity to elicit the response that is to be conditioned.
Briefly, this implies that in classical aversive conditioning situations, a shock UCS
should elicit changes in evoked potentials similar to those that have been reported as a
function of conditioning, independently of any associative processes. No one seems to
have considered this possibility, but in fact it turns out to be so. The changes are not,
however, independent of measurable and correlated changes in behavior.
In summary, it would seem unwise to consider changes in sensory evoked potentials
as neuroelectric correlates of conditioned changes in behavior when it is not shown that
orderly changes in behavior accompany the recorded alterations in evoked potentials.
On the other hand, if changes in evoked potentials are themselves to be regarded as
conditioned responses, then some substitute must be found for the Pavlovian conditioning
5
- -~ ~ ~ ~ ~ ~ ~ I

paradigm (certainly the operant one is not appropriate) or we must recognize the capac-
ity of the UCS to elicit similar changes in evoked potentials.
Although many of the experiments reviewed above have serious methodological short-
comings, the cumulated data strongly suggest that when impulsive physiological stimuli
are employed as conditional stimuli in classical aversive conditioning paradigms, there
are appreciable changes in the potentials evoked by these stimuli during the course of
conditioning. Although this finding, on the face of it at least, seems clear enough, the
interpretations afforded it have been rather less than clear. There is in all of these
studies, however, the implication that the alterations in sensory evoked potentials are
somehow intimately related to the neural substrate of conditioning. This notion we shall
have ample reason to question.
1.2 CHANGES IN SENSORY EVOKED POTENTIALS OBSERVED DURING AVOIDANCE
CONDITIONING
Changes in sensory evoked potentials during avoidance conditioning have proved to
be more complex than those seen in situations employing unavoidable noxious stimuli.
Pickenhain and Klingberg, 6 7 for example, have described a complex series of changes
in visual cortical potentials during several phases of avoidance conditioning. Electrodes
were implanted in rats over olfactory bulbs, visual cortex, and other cortical areas.
Following a short habituation period, subjects were trained to avoid shocks to the feet
by climbing upon a vertical rod. The discriminative stimulus signaling shock consisted
of a train of 5 or 10 brief light flashes presented at a rate of 1. 5/sec. In the analysis
of the neuroelectric and behavioral data, conditioning and extinction periods were sub-
divided according to several criteria. The conditioning period was first divided into
two major subperiods. The first, called the period of reinforcement, included all trials
before the occurrence of the first CR. The second, the conditioning period, included
all trials from the first trial on which a CR occurred to the trial preceding the first
unreinforced failure to respond during extinction. The extinction period consisted of
the trial marked by the first unreinforced failure to respond and the trials that followed.
The two conditioning periods and extinction period were further subdivided when the data
appeared to delineate three phases common to each of them. In this regard there has
been a modification of the analysis offered in the 1965 publication, and we shall consider
only the later findings. These were described by Dr. Pickenhain in a talk before the
Communications Biophysics Group, Research Laboratory of Electronics, M. I. T., on
March 10, 1966. The first phase in each of the three major periods was called the
"phase of disturbance." It was characterized by general excitability, increases in
respiratory rate (measured from recordings of olfactory bulb activity), strong
desynchronization of the electrocorticogram, and decreases in the amplitudes of
flash-evoked potentials. The second phase, called the "phase of adaptation," was marked
by arrest reactions, less general excitability, and goal-directed behavior. During
this period, photically evoked potentials evidenced increases in amplitude and
6
_�� __ ___��_
prominent afterdischarges. The last phase, the phase of well-adapted behavior, was
characterized by quiet, orderly behavior, and the "automatic" occurrence of conditioned
responses during the conditioning period. Flash-evoked potentials were relatively small
in this period, and afterdischarges were not conspicuous.
Pickenhain and Klingberg have interpreted their findings in terms of changes in the
level of vigilance, or level of arousal. They do not view the alterations in evoked poten-
tials as evidence of neural mechanisms underlying the conditioned avoidance behavior.
Jasper 4 9 has reached a similar conclusion in a brief report presented during a discus-
sion at the Pavlovian Conference on Higher Nervous Activity held at the New York Acad-
emy of Sciences. Jasper described an experiment in which a conditioned leg withdrawal
was established in cats. The CS consisted of a train of clicks presented at a rate of
5/sec. Measures of evoked potentials were reported only for electrodes on primary
auditory cortex. During the first 10 days of the experiment, the clicks were not followed
by shock, and the cortical potentials decreased in this period to approximately 50% of
their original amplitudes. During the first few days of conditioning, the potentials con-
tinued to show reductions in amplitude. But around the third day, still before the occur-
rence of many avoidance responses, amplitudes increased and continued to do so until
the percentage of avoidance responses became appreciable. At this point, evoked poten-
tials again diminished. Jasper noted the poor correlation between measures of avoid-
ance behavior and amplitudes of evoked potentials. He suggested that the changes in
auditory potentials seemed more related to alerting reactions.
A similar suggestion has been made by Gerken and Neff, 3 8 following the analysis of
data from a study in which several conditioning procedures were employed. Evoked
potentials were recorded from auditory cortex of cats under four conditions: (i) pre-
conditioning, essentially a habituation procedure, (ii) pseudoconditioning, in which
acoustic stimuli and shocks were presented in a "random" manner, (iii) classical condi-
tioning, and (iv) avoidance conditioning. Two kinds of acoustic stimuli were employed:
the CS consisted of a 4-sec burst of clicks presented at 4000/sec, and a test stimulus
consisted of a single click. The potentials evoked by these two stimuli were found to be
similar. Four separate amplitude measurements were made on evoked responses
recorded under each experimental condition. All subjects were not exposed to all of
these procedures. Some, for example, did not receive the pseudoconditioning treatment
before one kind of conditioning or the other. During preconditioning, evoked potentials,
especially the later components, tended to increase, while the early components showed
some evidence of reduced amplitudes. The patterns of change shown in the published
records are marred, however, by considerable variability from subject to subject.
Evidence of increases in the amplitudes of cortical potentials was also found during
pseudoconditioning, again primarily in the later components. Curiously, the changes
were sometimes seen in potentials recorded from one electrode in a given subject, but
not from other cortical electrodes in the same subject. The potentials also showed
increased amplitudes during both classical and avoidance conditioning - but not when
7
___ I -
conditioning had been preceded by the pseudoconditioning procedure. On the basis of
these and other findings, Gerken and Neff concluded that the alterations in evoked poten-
tials did not appear to be related to the learning process, but rather to the emotional
state or alertness of the subjects.
Hearst, Beer, Sheatz, and Galambos 4 1 have also studied acoustically evoked poten-
tials during avoidance conditioning. Only one subject was employed, a monkey with elec-
trodes implanted in cochlear nucleus, medial geniculate body, caudate nucleus, and
hippocampus. Bar-pressing behavior was maintained on a multiple schedule of rein-
forcement in which clicks, presented at approximately 1/sec, were correlated with a
Sidman avoidance component. The results are rather perplexing. During periods when
the monkey was clearly responding discriminatively to the clicks, no appreciable click-
evoked activity could be seen in any of the brain sites monitored. With removal of the
lever, the animal continued to slap his hand at the place where the lever had been. When
this behavior finally weakened (after 18 consecutive hours during which no shocks were
presented) potentials recorded from medial geniculate, caudate nucleus, and hippo-
campus were larger than they had been during any previous phase of the experiment.
When the avoidance procedure was resumed, click-evoked potentials were once more
difficult to detect in the EEG.
John, Ruchkin, and Villegas 5 1 ' 5 have described an avoidance conditioning study
with cats in which 4/sec flashes were established as discriminative stimuli. Many elec-
trodes, 14-30, were implanted in each subject, in both specific sensory pathways and
nonspecific structures. Average evoked responses were computed for potentials
recorded from all electrodes in each subject. Correlation coefficients, Pearson's r,
were also computed for all possible pairs of average responses. This was the first step
in the factor analysis of the evoked potentials. The correlation coefficients (not reported)
and the subsequent factor analysis suggested that waveforms of the average responses
tended to become more similar with the establishment of the conditioned avoidance
response. Functional groupings of some neural loci were also indicated by similar
changes in factor loadings for potentials recorded from these structures at different
stages of the experiment. We must confess we find the data that have been presented
unconvincing on both counts. The finding of increased similarity in waveforms of
evoked potentials during conditioning has also been described by Galambos and Sheatz, 3 4
as noted above.
In summary, the data from avoidance conditioning experiments reveal some incon-
sistencies, and, at the very least, some rather complex changes in sensory evoked
potentials. Some of these inconsistencies and complexities are more apparent than real.
This should become apparent in the work to be reported here. One idea of consequence
does emerge from the three studies of Jasper, Pickenhain, and Klingberg, and Gerken
and Neff: Changes in evoked potentials seen during avoidance conditioning are not
related to the conditioning process. They appear, rather, to be associated with some
more general change, specifically with a change in arousal level or emotional "state. "
8

1.3 CHANGES IN EVOKED POTENTIALS OBSERVED UNDER APPETITIVE
CONDITIONING PROCEDURES
Most of the reported studies of sensory evoked potentials during conditioning have
employed aversive conditioning techniques. Of the few that have employed positive rein-
forcement, only one, to the best of our knowledge, has made use of a Pavlovian para-
digm, though even in this one no measures of a behavioral respondent were obtained.
This was described by Hearst, Beer, Sheatz, and Galambos 4 1 in their study of evoked
potentials in four different conditioning situations. The one subject, a monkey, had
permanently implanted electrodes in hippocampus, caudate nucleus, cerebellar white
matter, and medial geniculate body. The CS consisted of 400-cps tone pips, 0. 5 sec in
duration, presented every 1.5 sec for 15 seconds. This was followed by the delivery of
a sugar pellet that the subject, reportedly, ate each time. A conditioned respondent was
was not defined. A habituation period was followed by conditioning, extinction, and
reconditioning periods. Evoked potentials recorded from hippocampus increased during
conditioning, diminished during extinction, and grew again with reconditioning. Evoked
potentials from other electrodes evidenced no changes during the experiment.
Hearst et al. also measured click-evoked potentials during an operant discrimina-
tion procedure employing the same sugar reinforcement. Potentials were recorded from
the hippocampus, caudate nucleus, medial geniculate body, and cochlear nucleus. The
monkey, again the only subject, was trained to press a lever only during presentations
of a click stimulus. Reinforcement in the SD periods was presented on a 1-minute Fixed
Interval schedule. With the establishment of the discriminative behavior, amplitudes
of evoked potentials from all electrodes were smaller than those recorded in precondi-
tioning sessions. Removal of both the lever and food cup from the situation led to an
increase in the amplitudes of evoked responses, while a return to the normal discrimina-
tion procedure again resulted in diminished evoked potentials. It will be recalled that
the avoidance conditioning experiment described in the same report also indicated that
evoked potentials decreased in amplitude with the acquisition of a discriminative
operant.
Somewhat different findings have been reported by Worden 7 5 in a study of acoustically
evoked potentials during operant discrimination training with a single cat. The animal
had electrodes implanted in nearly all projection sites of the classical auditory system,
but emphasis has been placed on potentials recorded from the trapezoid body or infe-
rior olivary complex. (Histological verification of electrode placements had not been
accomplished at the time of the report.) Short tone bursts, presented at a rate of 2/sec,
were established as discriminative stimuli for lever-pressing. Before the acquisition
of the discrimination, only small evoked responses, if any, were recorded. By the
third day of training, when the cat appeared to be "waiting" for the acoustic signal, large
potentials appeared in the trapezoid body. On the sixth day, potentials from all
recording sites were large. More complex changes were seen in later stages of the
9
-- I-- --
experiment; this suggested that evoked potentials do not remain large as long as discrim-
inative behavior is maintained, but revert to smaller amplitudes when discriminations
are well established.
Brazier, Killam, and Hance 8 have found changes of still another kind in flash-evoked
potentials recorded from lateral geniculate body during acquisition of an operant discrim-
ination. Again only one subject was used, a cat. The animal was trained to press a
lever in the presence of light flashes presented at 10/sec. No changes in the lateral
geniculate potentials were seen until the animal was required to respond within 15 sec
following the onset of the flashes. Under these conditions, an increase in the amplitudes
of both primary and secondary responses was seen. The discriminative behavior was
further differentiated by establishing 6/sec flashes as an SA signalling no food reinforce-
ment for lever-pressing. The acquisition of this discrimination led to further increases
in amplitude of the lateral geniculate responses, as well as to changes in waveform of
the later components.
In several reports, Freeman 2 5 ' 26 has also described increases in amplitudes of
evoked potentials recorded from prepyriform cortex when cats were trained to discrim-
inate electrical stimuli applied to lateral olfactory tracts or prepyriform cortex. In one
experiment, animals were trained to traverse a runway on the presentation of electrical
stimuli to prepyriform cortex. In the other, stimulation of the lateral olfactory tracts
was employed as a discriminative stimulus for bar-pressing. Food and milk reinforcers
were employed in these experiments. Amplitude-frequency functions for evoked poten-
tials were obtained by systematic manipulation of stimulus repetition rates at various
stages of the experiments. In general, it was found that these functions had sharper
peaks when the stimuli had become discriminative. The functions were flatter during
extinction of the discriminative response and in preconditioning, habituation sessions.
Increases in amplitudes of some components of evoked prepyriform potentials during
acquisition of the discrimination were also reported.
Data from the few conditioning studies that have employed positive reinforcing stim-
uli are, at best, fragmentary. With the exception of the studies of Freeman, none
employed more than a single subject, and it is not surprising that the results have been
rather inconsistent. Changes in amplitudes of evoked potentials as a function of condi-
tioning procedures have been described in each report, but increases were found in
some experiments, decreases in others, and nonmonotonic alterations in the rest. This
was how things stood when our own investigations began. It seemed clear at that time
that much work had yet to be done in-the study of sensory evoked potentials during condi-
tioning, especially in operant situations in which discriminations were established with
positive reinforcement.
1.4 EXPERIMENTAL BACKGROUND OF THE PRESENT INVESTIGATION
Findings from the classical aversive conditioning studies reviewed above certainly
suggest that changes in evoked potentials occur when a stimulus is established as a
10

conditioned one in a Pavlovian paradigm. At the outset of the present investigation, in
1961, we had hoped to extend this finding to the case of operant discriminations estab-
lished with positive reinforcers. At that time, none of the studies employing operant
conditioning techniques, aversive or appetitive, had provided convincing evidence of
changes in sensory evoked potentials correlated with the acquisition of a discriminative
operant. In our opinion, this statement is still correct. But we had hoped to find such
changes and set about in earnest to do so. For it seemed to us, as certainly it has to
others, that an unequivocal demonstration of changes in sensory activity during the
establishment of some discriminative behavior would provide a convenient starting point
for the analysis of neural mechanisms underlying conditioning.
Our first attempts were rather clumsy, both in design and execution. It was not
especially alarming, therefore, to find no changes in potentials evoked by either visual
or auditory stimuli as the stimuli were made discriminative. But repeated attempts did
not alter the picture. None revealed any systematic and reproducible changes in evoked
responses. The last two experiments of that series deserve some brief mention, for
they appeared optimal in their design and were reasonably executed.
Rats were employed as subjects, and for the most part our concern was with corti-
cal evoked potentials. In two essentially parallel experiments, click stimuli were
employed with one group of animals and photic stimuli with another group. Evoked
potentials were recorded from the primary cortical projection areas. The experimental
situations were quite analogous to a simple reaction time situation employed with human
subjects. Animals were trained to respond rapidly, by releasing a lever, to a single
click or photic stimulus presented on each trial. Rats were first trained to hold the
lever depressed until a reinforcement was presented. Activation of the feeder and other
stimulus changes served as stimuli for release of the lever in this initial stage of the
experiment. The discrimination was then transferred to either the click or photic stim-
ulus, the latter consisting of a two-second illumination of a circular target immediately
in front of the subject's face. Food reinforcement was contingent upon release of the
lever within 2 seconds of stimulus onset, and in final stages of training within 1 second.
The discriminative stimulus was presented at some variable interval, 3-8 sec, following
initiation of the bar-holding response. Evoked potentials were averaged across trials
to obtain an average response for each daily session. It was also possible to obtain
separate averages for trials on which animals responded correctly and for trials on
which responses were incorrect. When the discrimination had become well established,
the situation was reversed to the original conditions in which activation of the feeder
served as signal for the bar-release, and then reversed again.
Throughout the course of these experiments, there was no evidence of any change in
cortical evoked potentials that could be related to the conditioned changes in behavior.
With sufficient training the rats responded correctly on 90-95% of the approximately
250 daily trials. Response latencies had modal values of approximately 0. 5 sec. There
was no doubt that the bar-release was under control of the auditory or visual stimulus,
11
__ ___

but there was no indication of any change in evoked potentials as this behavior was estab-
lished. Nor did the average evoked potentials associated with correct or incorrect behav-
ioral responses show any differences. We could only conclude that the establishment of
a stimulus as a discriminative one with positive reinforcement procedures does not alter
evoked potentials recorded from primary sensory cortex. It also seemed unlikely that
changes would occur at lower stations in the classical sensory pathways and not be
reflected in the cortical responses.
It was at this point that we began to question seriously the fact that consistent and
convincing changes in evoked potentials had been reported only for the classical aversive
conditioning paradigm. Our question had a two-fold nature: (i) Could we reproduce
those changes in rats in our laboratory? (ii) What could be unique about classical aver-
sive conditioning with respect to alterations in sensory evoked potentials? Was it the
use of noxious stimulation? No one had demonstrated that changes in evoked potentials
were dependent upon the acquisition of a conditioned response. Few had even measured
a conditioned response. Nor had anyone determined whether the changes might be a
sensitization or pseudoconditioning effect. To answer these and other questions, the
experiments described below were undertaken. It was a relatively simple matter to
show that alterations in evoked potentials found during classical aversive conditioning
were not directly related to the conditioning process. It was somewhat more difficult
to show that they were related to an emotional response dependent upon the use of
noxious stimulation.
12
II. GENERAL EXPERIMENTAL METHODS AND PROCEDURES
Many of the experimental methods and procedures employed in the experiments
described below were common to most, if not all, of the individual experiments. It will
be economical, therefore, to describe them once here, and consider only critical dif-
ferences in later descriptions of particular experiments.
2.1 SUBJECTS
Thirty-four albino rats, descendants of the Sprague-Dawley strain, were employed
in this series of experiments. Rats were purchased from the Charles River Breeding
Laboratories. In most cases only three or four subjects were used in each experiment.
Although this number may seem small, it will become apparent that many of the experi-
ments served to a considerable degree as replications of earlier experiments. Weights
of the animals ranged from approximately 300 gm to 450 gm.
2.2 ELECTRODES
All electrodes were made of stainless steel. Cortical electrodes, unless noted other-
wise, had ball tips approximately 0. 5 mm in diameter and were placed on the dural sur-
face. Deep electrodes were in most cases made from Teflon-insulated wire, 125 L in
diameter. In a few instances we used 250-pL wire insulated with a 4-ply enamel coating.
In the earlier experiments the recording tip of a deep electrode was simply the trans-
verse section of the wire. In later experiments exposed tips were electrolytically etched
to points, 0. 5 mm long. In all but a few cases monopolar derivations were employed.
Reference electrodes consisted of stainless-steel screws. These were placed in one of
several locations: over olfactory bulbs, frontal cortex or cerebellum. We have not
been able to detect any differences in click-evoked potentials associated with these dif-
ferent placements of reference electrodes. Each subject was adequately grounded by
means of a large neck electrode which consisted of a loop of 250-p. wire, approximately
1 cm long, laid next to the occipital bone. Neck muscles on the posterior aspect of the
skull were retracted, the neck electrode was fixed in place, and the muscles were then
laid over it. Smaller electrodes for recording neck-muscle activity were employed in
some instances.
2.3 PROCEDURES FOR IMPLANTING ELECTRODES
The rats were anesthetized with Nembutal during the implanting operations. Initial
doses of 50 mg/kg of body weight were used, and supplementary doses were administered
as needed. Three or four screws were threaded into the skull to serve as anchoring
screws for the electrode assembly or as reference electrodes. Recording electrodes
were inserted through trephine holes, 1. 5 mm in diameter.
Deep electrodes were placed stereotaxically with the aid of coordinates calculated
from DeGroot's atlas of the rat brain.1 7 Click-evoked potentials were monitored during
13
__I __ ~ I_
the placement of each electrode as an additional aid in placing the electrode correctly.
When the position was considered satisfactory, the hole in the skull was filled with bone
wax and the electrode was cemented in place. Electrode wires were then soldered to
either 9- or 15-pole connectors of the Cannon Electric Company's Micro-D series.
2.4 HISTOLOGICAL VERIFICATION OF ELECTRODE PLACEMENTS
At the end of each experiment the animals were anesthetized and perfused first with
normal saline and then with 1Q% formalin. The head was cut off, all extracranial tissue
was removed, and the head was placed in 10% formalin over night. In order to remove
the electrodes carefully, without having to grind away the dental cement, the head was
mounted in a jig that held the skull and electrode connector rigidly with respect to each
other. The jig and head were then placed in Carnoy' s fixative which is 30% chloroform.
After two or three days in this solution, the dental cement was completely dissolved by
the chloroform. The electrodes could then be easily removed while the entire assembly
and skull were still held rigidly.
Brains were imbedded by using the hot celloidon technique of E. C. Clayden. 5 When
electrodes had been implanted in the cochlear nuclei, the tympanic bullae were left in
place when the brain was removed from the skull. The bone was then decalcified before
the celloidon imbedding. The brains were cut, typically in 50-p sections, and stained
with either Weil or cresyl violet stains. The identification of neural structures in which
electrode tips were located was accomplished with the aid of K6nig and Klippel's atlas of
the rat brain. 5 6 The revised edition of Craigie's atlas by Zeman and Innes 7 7 was also
employed in the identification of brain-stem auditory structures.
2.5 RECORDING AND PROCESSING NEURAL POTENTIALS
Electric potentials were amplified by Grass P-5 or P-5 11 AC amplifiers. The
amplified signals were then recorded on FM, 7-channel magnetic tape. Ampex FR 1100
or Sanborn Ampex 2000 tape recorders were employed for this purpose. The variation
of the frequency response of the entire recording system depended upon the source of
the potentials. Channels used in recording potentials from eighth nerve and cochlear
nucleus had a frequency response that was flat between 1.5 cps and 2500 cps.
High-frequency limits (half-amplitude) were 2000 cps for medial geniculate and inferior
colliculus channels, and 500 cps for cortical recordings.
Evoked potentials were averaged with the aid of the Average Response Computer,
ARC, 14, 16 or a PDP-4 computer (Digital Equipment Corporation). An X-Y plotter was
used to obtain permanent records of the average responses, and amplitude measurements
were made from these plots.
Records of brain potentials, muscle activity and other signals were sometimes
obtained on a Grass Model 3 EEG. All electric signals were routinely monitored on
oscilloscopes. Special details of recording procedures will be considered in descrip-
tions of the appropriate experiments.
14
__�__ �_ _�_

2.6 CONDITIONED EMOTIONAL RESPONSE SITUATION
We have employed the conditioned emotional response (CER) situation of Estes and
Skinner 2 2 and Brady and Hunt 7 in many of the experiments that will be described. In
this situation a bar-pressing response is first established and maintained at relatively
constant rates on an intermittent schedule of reinforcement. A reinforcement in the
present experiments consisted of a single 0. 045-gm food pellet. In place of the Vari-
able Interval (VI) schedule of reinforcement usually employed in CER experiments, we
have used a tandem Variable Interval Fixed Ratio schedule, typically a tand. VI 30 sec
FR 4. This kind of schedule tends to generate higher rates of responding than the simple
VI schedule, but has some of the conveniences associated with the latter, e. g., long
programmed intervals of no reinforcement. Conditioning of an emotional response is
initiated when bar-pressing has become stable. This is accomplished by presenting a
conditional stimulus (CS), for 1-minute periods in our experiments, which is followed
on each occasion by an unavoidable noxious electric shock. Acquisition of the conditioned
anxiety or fear can readily be traced in the increasing suppression of bar-pressing
during CS presentations. The ease with which this conditioning can be followed in
measures of bar-pressing, and the ease with which the behavior is established make the
CER situation a particularly convenient aversive conditioning paradigm. An example of
the behavior generated in such situations can be seen in Fig. 1. The cumulative response
record shows a relatively high rate of bar-pressing in the absence of the CS, but vir-
tually no responding at all during CS presentations.
Fig. 1. Cumulative response record of bar-pressing in conditioned emotionalresponse (CER) situation. First pip of each pair on the responsecurves indicates onset of CS. Second pip indicates termination ofCS and presentation of shock UCS. Food reinforcements are in-dicated by pips on the bottom line.
15
^1�_1 __I �I � I _ �

2.7 BEHAVIORAL APPARATUS
In all but two experiments, the subjects were not restrained. They worked in long
narrow boxes made of black Bakelite, 12 in. long, 3 in. wide, and 15 in. high. The food
cup was located 3 in. above the lever at one end of the box. Dimensions of the box and
location of the food cup minimized the amount of circling behavior and, therefore, the
troublesome twisting of electrode leads. The food cup was also made of Bakelite, and
the lever which the animals pressed was covered with a gravel and epoxy mixture. The
use of nonconducting materials for food cup and lever eliminated noise arising from con-
tact potentials. The gravel-epoxy compound on the lever was the only nonmetallic mate-
rial we could find that was hard enough to discourage or withstand chewing. Photoelectric
switches were used on levers to avoid the noise associated with mechanical switches, and
the limiting stops were cotton-cushioned for the same reason.
The box contained a grid floor consisting of only 4 bars. Shock stimuli were deliv-
ered to the subjects' feet through this grid. Two methods were employed (in different
experiments) to eliminate the possibility that subjects might escape shock by standing
on isopotential bars. In one, adjacent bars were connected through 10-kQ resistors so
that the grid was a simple voltage divider. The second method employed a special
scrambling circuit designed by Richard J. Clayton. A variac provided a variable shock
source of 60 cps AC. This current was usually chopped by means of an oscillating relay
and then led through an isolation transformer to the grid or scrambling circuit. Shock
duration in each instance was 0. 5 sec.
The rat boxes were housed in sound-attenuating, electrically shielded chambers,
22 in. wide, 21 in. deep, and 45 in. high. The chambers were located in a separate
room to insure acoustic isolation from the control and recording equipment. The experi-
ments, except for the changing of subjects, were completely automated. This was
accomplished with the aid of conventional relay circuitry plus some solid-state devices.
The latter were also designed by Richard J. Clayton.
In several cases, subjects were placed on food-deprivation schedules and were
handled.daily for a week or more before electrodes were implanted, but in most experi-
ments these procedures were not initiated until 5-7 days following surgery. Body weights
were maintained at 75-80% of the animals' ad libitum feeding weights. It has been our
experience that bar-pressing behavior in CER situations is best when animals are
required to work for their entire daily food ration in the experimental situation, and
when this allotment is ample. Experimental sessions, therefore, usually lasted 2. 5-3. 0
hours, and the animals received approximately 300-350 reinforcements, i. e., 13. 5-
15. 75 gm of food. Water, with an added vitamin supplement, was always available to
subjects in their home cages.
Bar-pressing was established under continuous reinforcement. Intermittent rein-
forcement was introduced with schedules of low values. These were gradually increased
until the final values were reached in order to maintain relatively high rates of
16
� __ I �·_ �
responding. No acoustic stimuli were ever introduced until rats had achieved high stable
response rates. For at least 2-3 days before the first recording session, animals were
run with electrode leads attached so that adaptation to the leads would not confound any
effects related to the introduction of auditory stimuli.
2.8 ACOUSTIC STIMULI
Evoked potentials of concern in these experiments were all evoked by clicks. The
clicks were generated by applying 0. 15-msec square pulses across a loudspeaker. The
loudspeaker was located 37 in. above the floor of the experimental chamber. Walls of
the chamber were lined with acoustic tile to reduce the amount of reflected sound. Click
intensities were generally moderate, approximately 30-35 db above the rat's threshold.
One of us determined the approximate threshold for click stimuli under the conditions of
our experiments from both behavioral and evoked-potential measurements. 5 8 Click
stimuli were always presented against a low-level background masking noise that was
present throughout experimental sessions. In all experiments clicks were presented at
a rate of 1/sec.
It was often the case that a food reinforcement was presented during a train of clicks,
simply because such presentations were determined by the behavior and reinforcement
schedule. On these occasions, there was no interruption of the click train. The stimuli
presented during the 5-6 sec immediately following a reinforcement were not marked,
however, on the magnetic tape. Consequently, click-evoked potentials recorded in post-
reinforcement periods were not included in the average responses. This was done to
eliminate the masking effects of chewing. It was clear from the muscle activity seen on
cortical electrodes that ingestion of a food pellet was nearly always accomplished within
6 seconds.
2.9 PRESENTATION OF DATA
Our primary concern in this investigation has been with correlated changes in sen-
sory evoked potentials and behavior in the individual organism. At this time there would
appear to be no good justification for combining data from individual subjects, for at this
stage of our inquiry into neuroelectric correlates of conditioning a model that might jus-
tify the use of group measures is clearly lacking. Moreover, group means or other
measures of central tendency often obscure important features of the data, and only
rarely do they present a more convincing summary of experimental findings than do data
from individual subjects. The presentation of data from individual subjects is not with-
out its own problems. If all data are to be presented there are clearly problems of econ-
omy. If the "typical case" is the adopted solution to these problems, one runs the risk
of serious sampling errors. Throughout this report we have tried to find some com-
promise, but in all cases each subject is represented in data presented for the several
experiments.
Habituation of evoked potentials in unanesthetized subjects has been described in
17
__ _ - _

43 - 36many reports (see, for example, Hernindez-Peon ; Garcia-Austt ). This habitua-
tion refers to a more or less systematic reduction in the amplitudes of sensory evoked
potentials associated with repeated presentations of the stimulus. The nature of these
changes is still a matter of dispute. The conditions under which it occurs, and where
in the nervous system evoked potentials show such changes are problems that have not
been resolved.
In order to obtain stable baseline measures of evoked potentials, we have routinely
employed habituation procedures before any conditioning operations. These procedures
were often in effect for 10 days or more. Although we have found evidence of habitua-
tion in click-evoked potentials, these data will not be considered here. A discussion of
this problem would only lengthen this very long report and detract from its principal
thesis. Habituation data from these and other experiments will be described elsewhere.
18
_ _ �__ _ __ I ___ __

III. CLICK-EVOKED POTENTIALS RECORDED FROM CENTRAL
AUDITORY STRUCTURES
Electric potentials evoked by impulsive sensory stimuli and recorded with macro-
electrodes are summations of the electric responses in relatively large populations of
cells. Different cell populations and several kinds of neural potentials, e. g., unit
"spikes" and postsynaptic potentials, may contribute to these summated responses. In
this report we shall employ the term 'sensory evoked potential' in its narrower sense
to mean the summated responses recorded by means of macroelectrodes. Such poten-
tials often assume complex waveforms that are difficult to describe and difficult to quan-
tify in some physiologically meaningful way. These difficulties are due in large measure
to our inadequate understanding of the nature of these potentials. Three decades or
more of experimental work have yet to provide a generally accepted and reasonably pre-
cise account of evoked responses from primary projection areas of the cortex, perhaps
the most extensively studied evoked potentials in the central nervous system. The anal-
ysis of evoked potentials from most subcortical stations of specific sensory systems has
been only rudimentary. Moreover, the analysis has barely dealt with the potentials
recorded from unanesthetized organisms, potentials that are admittedly more complex
than those recorded from anesthetized preparations. But in spite of these difficulties,
we pursue the study of evoked potentials, for it is clear that much has been learned
about functions of the C. N. S. through these efforts.
In the work reported here it was often necessary to proceed in considerable igno-
rance regarding evoked potentials to be found in subcortical structures of unanesthetized
rats. Moreover, the present report will not permit a detailed analysis of such activity.
In some instances we cannot be sure that all components of evoked responses recorded
from electrodes within a given structure have their origins in the activity of that struc-
ture. Current spread from nearby structures is an ever present hazard when recording
evoked potentials in the C. N. S. by means of so-called monopolar derivations. The prob-
lem of interpretation is somewhat ameliorated by the use of "bipolar" electrodes, but
this technique introduces its own problems. We have found monopolar recording desir-
able for two reasons: (i) Electrodes are smaller than bipolar types and inflict less dam-
age on neural tissue. (ii) In our experience, the reproducibility of evoked potentials
from one subject to the next, and the correlation of these potentials with electrode loca-
tions have proved much easier with monopolar derivations. In the rest of this section,
evoked potentials recorded in these experiments from cortical and subcortical auditory
structures are described. It can be understood that these potentials were recorded
from electrodes within or on the surface of the several structures. It cannot be assumed
that these potentials necessarily have their origins in the same structures. An experi-
mental analysis of some of these potentials is in progress, but until it is complete no
definite statements can be made regarding the sources of at least some components of
the evoked responses. We emphasize this problem for it will become clear that changes
19
---~_~ L~l _ _
in acoustically evoked potentials during conditioning are complex changes that may or
may not involve particular response components. A component analysis of the wave-
forms is therefore critical for any fundamental understanding of the changes.
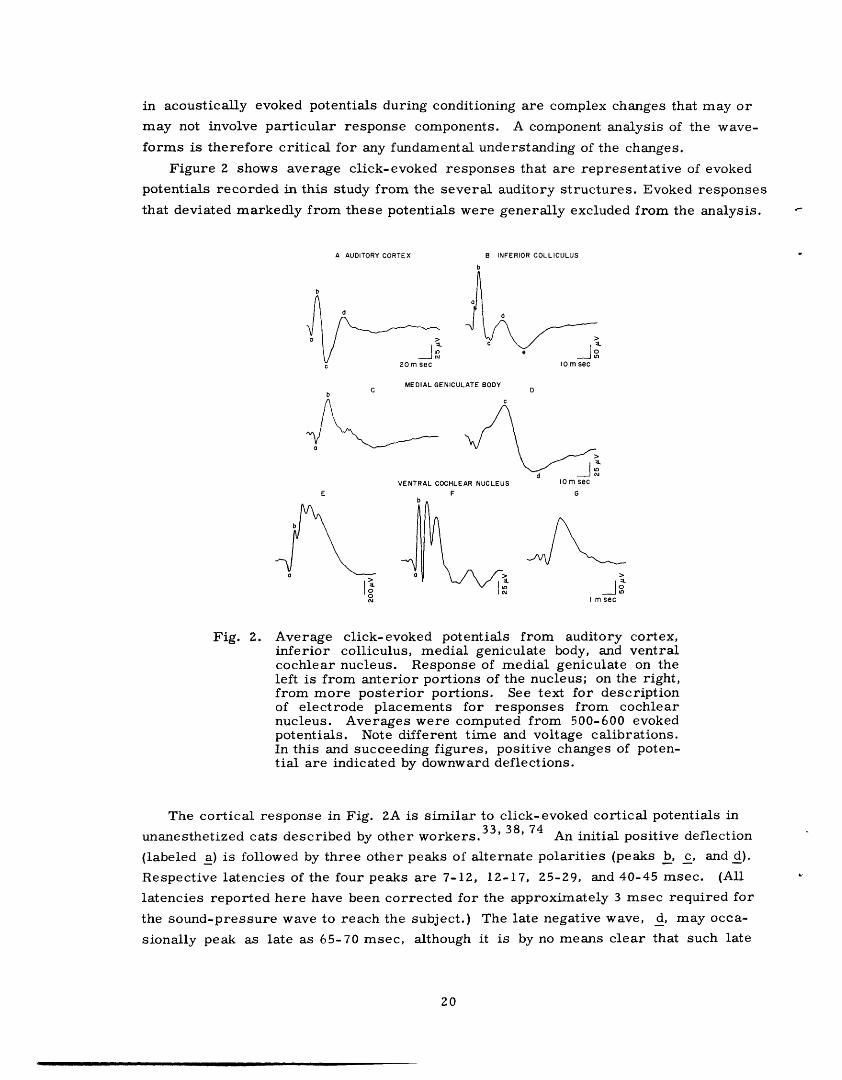
Figure 2 shows average click-evoked responses that are representative of evoked
potentials recorded in this study from the several auditory structures. Evoked responses
that deviated markedly from these potentials were generally excluded from the analysis.
A AUDITORY CORTEX B INFERIOR COLLICULUS
b
O nsec10 m sec
MEDIAL GENICULATE BODYb C Db
1.
VENTRAL COCHLEAR NUCLEUS 10 m sec
E F Gb
a a
I m sec
Fig. 2. Average click-evoked potentials from auditory cortex,inferior colliculus, medial geniculate body, and ventralcochlear nucleus. Response of medial geniculate on theleft is from anterior portions of the nucleus; on the right,from more posterior portions. See text for descriptionof electrode placements for responses from cochlearnucleus. Averages were computed from 500-600 evokedpotentials. Note different time and voltage calibrations.In this and succeeding figures, positive changes of poten-tial are indicated by downward deflections.
The cortical response in Fig. 2A is similar to click-evoked cortical potentials in
unanesthetized cats described by other workers. 3 3 ' 38, 74 An initial positive deflection
(labeled a) is followed by three other peaks of alternate polarities (peaks b, c, and d).
Respective latencies of the four peaks are 7-12, 12-17, 25-29, and 40-45 msec. (All
latencies reported here have been corrected for the approximately 3 msec required for
the sound-pressure wave to reach the subject.) The late negative wave, d, may occa-
sionally peak as late as 65-70 msec, although it is by no means clear that such late
20
��� ..�.� I �._ ��_ �
b
I
0

potentials are completely comparable to those with shorter latencies. Cortical poten-
tials presented in this report are like the average response of Fig. ZA or differ mainly
in the relative amplitudes of the various components. Other waveforms, have been
encountered, however, which suggest that a complete description of the cortical surface
potentials must be more complex than the one presented here.
It will be convenient to make a distinction between early and late components of click-
evoked potentials recorded from auditory cortex, medial geniculate body and inferior
colliculus. This distinction will provide a convenient brief means of describing the
potentials, but it appears also to have physiological significance in the present analysis.
The primary components a and b of the cortical response will be called the early
components, and their amplitudes will be taken as the voltage difference between them.
Similarly, peaks c and d will be called the late components, and their amplitudes will
be expressed as the voltage difference between the two peaks.
All evoked potentials recorded from inferior colliculus were from electrodes in ante-
rior portions of the nucleus. Several lines of evidence suggest that the first sharp nega-
tive deflection (a) with a peak at 3 msec represents activity of the lateral lemniscus.
Peaks b and c will be considered the early components of the collicular response, and
their amplitudes will be measured peak to peak. Peak latencies of these components
are 5-8 and 12-17 msec, respectively. The late components are peaks d (24-31 msec)
and e (42-49 msec). Except for the late components, the response depicted here is
similar to click-evoked potentials recorded from curarized cats by Jungert. 5 4
Click-evoked potentials recorded from the medial geniculate body were of two more
or less distinct types. From anterior portions of the geniculate the responses looked
like those on the left in Fig. 2C. An initial positive wave with its peak at 5-6 msec was
followed by a much larger negative deflection that peaked at 14-17 msec. For somewhat
similar potentials recorded from parts of the medial geniculate in anesthetized cats,
Rose and Galambos 6 8 have presented evidence that the first positive deflection may be
due to presynaptic activity. To facilitate measurements, however, we have taken the
voltage difference between the first positive (a) and the first negative (b) peaks as the
amplitude of the early components of the geniculate response. From electrodes in more
posterior parts of the medial geniculate, evoked potentials acquired a second large nega-
tive peak (22-29 msec) that was followed by a slow positive wave with a peak at
42-57 msec, peaks c and d in the average response of Fig. 2D. The origin of these
late components is a matter of concern, for their time course and polarities are much
like those of late components of the collicular response. We cannot ignore the possi-
bility that potentials from one site represent current spread from the other, or that
these components in responses from both locations are due to activity in a third neigh-
boring structure. We have not yet resolved this problem. Gershuni et al. 3 9 have
recorded click-evoked potentials from the medial geniculate body of unanesthetized cats,
and some of the potentials they present appear to be like those we have recorded from
posterior portions of the nucleus. We have not determined whether these workers are
21
_ __

satisfied that the late components of the response are due to activity in the medial genic-
ulate body.
Click-evoked potentials recorded from the ventral cochlear nucleus also exhibit sev-
eral more or less distinct forms that have proved to be reasonably correlated with dif-
ferences in electrode placements. In general, they are similar to evoked potentials
from this nucleus described by other workers for both anesthetized and unanesthetized
cats.2, 54, 64 The largest responses were usually found in the more ventral portions of
the nucleus. An example of these potentials is seen in Fig. 2E. The first positive
deflection with a peak latency of 0. 7-0. 9 msec is almost certainly the response of eighth
nerve. The latency of this potential seems too short for it to be anything else. We have
also recorded this positive wave together with the cochlear microphonic from electrodes
against the bony wall of the tympanic bulla. In such cases the short-latency positive
wave was contiguous with the microphonic potentials. Moreover, there seems to be
general agreement among all workers that eighth-nerve responses can be recorded from
within the ventral cochlear nucleus. We have measured the amplitude of peak a from
the baseline, and in some cases we have also measured the voltage difference between
a and b. The two measures are highly correlated, and either measure will be referred
to as the amplitude of the auditory nerve response.
The later and generally slower components of responses recorded from ventral coch-
lear nucleus can reasonably be attributed to activity in the nucleus. The amplitude of
the VCN response was determined by taking a peak-to-peak measure on the "backside"
of the response. This was necessary because, at present, we are not able to distin-
guish with certainty the later components of the eighth-nerve response from the initial
activity attributable to cochlear nucleus. Since the waveforms of evoked responses
recorded from the cochlear nucleus fall into several groups, the amplitude measure has
not been precisely the same for all responses. In all cases, however, it represents the
voltage difference between the last large negative peak and the peak of a positive poten-
tial following it.
The cochlear nucleus potential in Fig. 2F was obtained from an electrode situated
more dorsally in the nucleus than the electrode from which the response in Fig. 2E was
obtained. All the sharp peaks of the two responses are coincident. The major differ-
ence in waveform seems to be that peaks of the response in Fig. 2F do not appear to be
riding on a slow potential as do peaks in the response in Fig. 2E. There is also an
appreciable difference in amplitude between the two responses.
The evoked response from ventral cochlear nucleus in Fig. 2G is typical of those
recorded from electrodes within lateral or dorsolateral portions of the nucleus. It con-
sists primarily of a relatively slow negative wave. A similar response is recorded
from the surface of the nucleus in the same regions, but in such instances the promi-
nent wave is often of the opposite polarity.
22
__ _I__ �� �_ __

IV. EXPERIMENTAL ANALYSIS OF CHANGES IN ACOUSTICALLY
EVOKED POTENTIALS DURING CONDITIONING
4.1 EXPERIMENT I
The present series of experiments was undertaken to determine, first of all, if
changes in click-evoked potentials could be found in this laboratory when clicks were
made conditional stimuli in aversive conditioning situations. We had previously been
unsuccessful in our attempts to demonstrate alterations in evoked potentials recorded
from primary sensory cortex during the acquisition of appetitive operant discriminations.
This first experiment simply demonstrates that with aversive conditioning procedures
conditioned changes in behavior are accompanied by changes in acoustically evoked
potentials. Click-evoked responses evidenced appreciable increases in amplitude when
clicks were established as conditional stimuli for a Conditioned Emotional Response
(CER). The analysis of these changes is the subject of the following experiments.
4.1.1 Methods
Three rats, S14, S15, and S16, were employed. Ball-tip electrodes were implanted
bilaterally on the dura overlying the auditory cortex. An attempt was also made to
implant electrodes in the medial geniculate body, but the electrodes were actually placed
in the reticular formation, slightly medial and slightly posterior to the medial genicu-
late. Potentials recorded from these electrodes showed significant changes during condi-
tioning and the data will be presented. In two subjects, S14 and S16, electrodes were
successfully implanted in the ventral cochlear nucleus.
Unfortunately, the electrode assembly on S15 was detached from the skull on the
third day of conditioning. Changes in evoked potentials were quite apparent, however,
in all three subjects by the first or second day of conditioning, and the lack of complete
data for S15 does not seem critical.
When bar-pressing behavior had become stable under the tand VI 30 sec FR 4 sched-
ule of food reinforcement, -minute trains of 1/sec clicks were introduced. Thirteen
to fifteen such click trains were presented in each daily session. Experimental sessions
were approximately 2 hours long. A background masking noise was continuously present.
During the first four sessions of auditory stimulation, click trains were not followed
by electric shocks. Conditioning of the emotional response began on the fifth day when
each train of clicks was followed by an unavoidable shock to the subjects' feet. Thir-
teen to fifteen conditioning trials were presented in each session, and conditioning
continued for 7 days. The conditioned suppression of bar-pressing was then extinguished
for 6 days by withholding shock in these sessions.
4. 1.2 Results
Average cortical evoked responses showed appreciable increases during condi-
tioning. This can be seen in Fig. 3 in which average evoked potentials from the
23
--- l-_l ·Il l

PRECONDITIONING CONDITIONING
S514
S15
A·~~id---- _--5 \S---16
20 msec
Fig. 3. Average click-evoked cortical responses from three subjects takenfrom last preconditioning session and second conditioning sessionof a CER situation. Averages computed from first 550 evokedpotentials recorded in each session.
last preconditioning session and the second conditioning session are shown for each sub-
ject. Data from the second day of conditioning were chosen because this was S15's last
session. It appears that all components of the cortical potentials were larger during
conditioning than they were in the last preconditioning session; however, the most con-
sistent and orderly changes were seen in the late components. A more quantitative view
of the changes in late components can be seen in Figs. 4 and 5. Here amplitudes are
plotted as a function of daily sessions for S14 and S16, respectively. Amplitudes are
expressed as percentage differences relative to amplitudes of potentials recorded in the
last preconditioning session. A behavioral index, which will be employed throughout
this report, is shown in the lower graphs. This is a ratio of the number of bar-presses
that occurred during CS presentations to the number of bar-presses emitted during
1-minute control periods immediately preceding each CS. This ratio goes to zero with
complete suppression of bar-pressing during CS presentations. It is clear from Figs. 4
and 5 that the CER was quickly established and the changes in behavior were more or
less paralleled by increases in the amplitudes of late components of cortical responses.
Measurements of the early components of cortical potentials have not revealed such
an orderly picture. In general, a trend toward increased response amplitudes appeared
during conditioning. These changes were quite variable, however, and relatively small
when amplitudes of the early components were measured from the first positive to the
first negative peaks. This can be seen in Fig. 6B, in which these amplitudes have been
plotted, again as relative changes, for all three subjects. In Fig. 6A another measure
of the primary cortical response has been plotted in a similar way. This is a measure
of the amplitude of the first positive component, taken from the baseline to the peak of
24
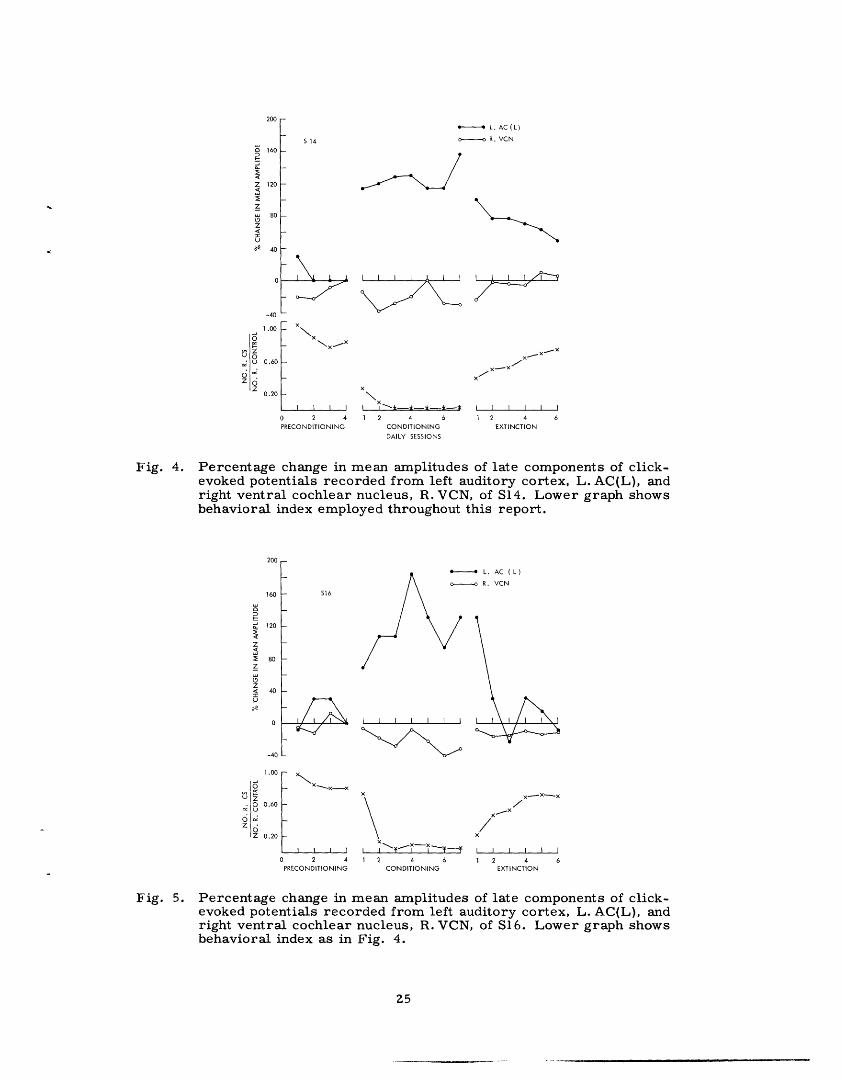
:-4-· :L. AC(L)
o R. VCN
-~~~~~'x
S 14
x
IX0 2 4PRECONDITIONING
4CONDITIONINGDAILY SESSION
I I I I I I
6 1 2 4 6EXTINCTION
S
Fig. 4. Percentage change in mean amplitudes of late components of click-evoked potentials recorded from left auditory cortex, L. AC(L), andright ventral cochlear nucleus, R. VCN, of S14. Lower graph showsbehavioral index employed throughout this report.
. VCN - R. VCN
16
L /_ i~
I I I I I I I
l l l
X'X
x
I I I I I I
0 2 4PRECONDITIONING
2 4 6 1 2 4 6CONDITIONING EXTINCTION
Fig. 5. Percentage change in mean amplitudes of late components of click-evoked potentials recorded from left auditory cortex, L. AC(L), andright ventral cochlear nucleus, R. VCN, of S16. Lower graph showsbehavioral index as in Fig. 4.
25
g 160
Z 120
zw 80
ZIU
40
0
-40
1.00
U0
zOz
0.20
160
<
I
120
80
40
-40
1.00
0
zU2a.C 0.60
Z 2
Z 0.20
l -t - t - By -
X
I ~" - -- -I--�
---200
I � I I
-
I I I II I I I I I I
.x
-X-X "
X
1t
2
,tLVU r "P
_.
1

200
160
Z 120
80Z
40
U0-
,120
o
$80z
404z
US
-40 I I I I I I0 2 4 1 2 4 6 1 2 4 6
PRECONDITIONING CONDITIONING EXTINCTION
DAILY SESSIONS
Fig. 6. A: Percentage change in mean amplitudes of first surface positivecomponent of click-evoked cortical responses from 3 subjectsplotted as a function of daily sessions. Amplitudes measuredfrom baseline to first positive peak.
B: Plots similar to those in A for early components of corticalevoked responses. Amplitudes measured from first positivepeak to first negative peak.
this potential. In this measure the amplitude changes were much more conspicuous, but
no less variable. The curves for S16 show a rather interesting pattern with an initial
increase during the first few conditioning sessions, but little evidence of increased
response amplitudes in later sessions. These irregular patterns of change in the ampli-
tudes of early cortical potentials have appeared throughout the course of this investiga-
tion.
Click-evoked potentials recorded from ventral cochlear nucleus showed no evidence
of increased amplitudes during conditioning. Quite the contrary, there was some indica-
tion of a small decrease in the amplitudes of these potentials. This can be seen in
Figs. 4 and 5, in which the relative changes in amplitude have been plotted as a function
of daily experimental sessions.
Examples of the changes noted in click-evoked potentials recorded from mesence-
phalic reticular formation can be seen in Fig. 7. These average responses were taken
from the last preconditioning session and second conditioning session, as were the
26

PRECONDITIONING CONDITIONING
S 14
S 15
S 16
10 rec
Fig. 7. Average click-evoked responses recorded from mesencephalicreticular formation in 3 subjects. Potentials on left were takenfrom the last preconditioning session; those on right from thesecond day of conditioning in CER situation. Averages werecomputed from first 550 evoked potentials recorded in eachsession.
cortical potentials shown in Fig. 3. The first sharp negative peak of the potentials
recorded from the reticular formation is probably due to activity in the lateral lemnis-
cus. Detailed arguments to support this notion will be presented elsewhere. The slower
positive-negative complex with peak latencies of approximately 15 and 40 msec can be
attributed with reasonable certainty to the reticular formation. This diphasic wave is
often followed by a series of rhythmic waves that become more prominent during aver-
sive conditioning. We have not been able to record this activity from more lateral elec-
trode placements. In any case, it is clear that these click-evoked potentials recorded
from mesencephalic reticular formation undergo significant changes during the estab-
lishment of a conditioned emotional response. The course of these changes was quite
parallel to the alterations in late cortical responses.
4.1.3 Discussion
Data from this experiment leave no doubt that sensory evoked potentials are appre-
ciably altered during aversive conditioning. But the patterns of change are by no means
simple. Changes in late components of cortical responses and in evoked potentials
recorded from the reticular formation seemed to follow rather closely the establishment
of a CER. Early components of cortical responses were also affected by the condi-
tioning procedures, but these changes seemed to bear no simple relationship to the
conditioned changes in behavior. The suggestion of diminished amplitudes in responses of
ventral cochlear nucleus seems paradoxical. Early cortical potentials, attributable, in
part at least, to activity in the classical auditory projection, evidenced changes, however
irregular, in the opposite direction. These patterns of change will be considered again
27
·· LI-. I --

when data sufficient to justify their consideration have been presented. For the moment,
the most important question is whether or not the systematic changes found in the poten-
tials from auditory cortex and reticular formation were uniquely related to the acquired
conditional or discriminative properties of the click stimulus. In the second experiment
it will become apparent that they were not.
4.2 EXPERIMENT II
If the changes in acoustically evoked potentials described in the first experiment
were due to acquired conditional properties of the click stimulus, they should not occur
when the same conditioned response is established to a CS of another sensory modality.
If, for example, a visual CS is used in conditioning an emotional response, we should
not expect to find increases in the amplitudes of acoustically evoked potentials recorded
during the acquisition of this behavior.
In the first phase of this experiment clicks were established as conditional stimuli
in the same CER situation that was employed in the first experiment. In the second part
of the experiment, following extinction of the emotional response to the click stimulus,
the same behavior was reestablished with a visual CS; namely, a change in the ambient
illumination of the test chamber. During this phase of the conditioning clicks were pre-
sented throughout experimental sessions. It was possible, therefore, to record click-
evoked potentials during presentations of the visual stimulus to determine if there were
any alterations in auditory potentials as the behavior was brought under control of the
photic stimulus. It became quite apparent that click-evoked potentials were altered by
these procedures in much the same way they were when clicks were employed as the CS
in the first part of the experiment.
4. 2.1 Methods
Three rats, S1, S2, and S3, were used in this experiment. Monopolar ball-tip elec-
trodes were implanted bilaterally on the dura over auditory cortex.
Bar-pressing was established and maintained as in the first experiment. When this
behavior had become reasonably stable, clicks were introduced for the first time.
Unlike the other experiments described in this report, this one did not employ an
extensive habituation period prior to the commencement of conditioning. Two subjects,
S2 and S3, were exposed to continuous clicks, presented at /sec, for approximately an
hour during the last preconditioning session. No clicks were presented to S1 before the
first conditioning trial.
A CER was then established under conditions quite like those described in the first
experiment. One-minute trains of /sec clicks constituted the CS. The UCS was an
unavoidable shock delivered to the feet through the grid floor. Approximately 10 trials
were presented in each experimental session, although in several instances as few as
five trials were given in sessions cut short of excessive "freezing" by the subjects.
Four conditioning sessions were followed by three days of extinction. The CER with
28

the click CS was then reconditioned and extinguished two more times. Following the
last extinction of the emotional response to the click CS, 1/sec clicks were presented
in one session, throughout the experimental period. Food reinforcements were the only
other stimuli presented during this session. On the day that followed, the clicks were
presented in the same way during the entire session, but a CER was once again estab-
lished, this time with a visual CS. Lights in the test chamber were turned off for one
minute, and this stimulus was followed by shock. In succeeding sessions the conditioned
response to the visual stimulus was extinguished, then reconditioned and extinguished
two more times. The number of sessions devoted to each change in procedure varied
slightly for the individual subjects, but successive reconditionings required only a day
or two. Extinction periods ranged from 3 to 5 days.
Throughout the procedures just described, click-evoked potentials were recorded
only during click or photic CS periods. Following these procedures, the CER was once
more established with the visual CS, and provisions were made to record click-evoked
potentials during one-minute control periods that immediately preceded each CS, as
well as during CS presentations.
4. 2.2 Results
Cortical click-evoked potentials underwent systematic changes in waveform during
the first conditioning and extinction periods that were due, apparently, to the omission
of an extended habituation period. One feature of these changes in waveform is illus-
trated in Fig. 8. Average evoked responses from one subject are shown for alternate
CONDITIONING I
CONDITIONING 3
Fig. 8. Average click-evoked cortical responsesfrom SZ for selected sessions of first
EXTINCTION I conditioning and extinction periods. Ses-sions are noted above the traces. Agradual diminution of a late slow nega-tive wave results in a "sharpening"of the
EXTINCTION 3 negative peak at approximately 45 msec.Averages were computed from approxi-mately 500 evoked potentials.
RECONDITIONING 1
20 rec
days of conditioning and extinction periods and for the first reconditioning session. In
the first few sessions the late negative wave with a peak at approximately 45 msec was
followed by a slow negative potential so that the peak at 45 msec appeared to have a
29
I- I I I_ _ _ _

CONDITIONING slow falling phase. This slow negative
potential showed an orderly diminution
in successive sessions of both condi-
tioning and extinction periods. By theCONDITIONING 4
first day of reconditioning it was essen-
tially gone, and the negative peak at
45 msec appeared much sharper. Sub-EXTINCTION 3
ject S3 showed precisely the same pat-
tern of change.
'rlhe second feature of the change in
waveform can be seen in Fig. 9, in which
average cortical responses from Si arecx_ +1 _ o +h r.l+ l
[JIbCIlLCU. tli-'' tll CUU LICWJ . [ULellLl.l dl
had a somewhat different form initially20 mec
than those of the other subjects. TheFig. 9. Average click-evoked cortical
responses from S1 presented as positive peak at approximately 30 msecin Fig. 8. Gradual increase in was not apparent through most of thispositive component with peak at30 msec, not seen as such until period and did not become so until the30 msec, not seen as such untilthe last trace, yields "sharp- first day of reconditioning. The "sharp-ening" of the first negative wave.ening of the first negative wave. ening" of the first negative wave that is
apparent in the potentials of Fig. 9 was
due presumably to the gradual increase in this positive component. In later condi-
tioning sessions it became even more prominent. In other experiments we have seen
both kinds of changes during extended habituation periods: the diminution of the late
slow negativity and the growth of the second positive wave. Both changes produce a
"sharpening" of all components of cortical evoked responses.
Changes in waveform that occurred in the first 8-10 experimental sessions did not
obscure the general changes in amplitude of cortical responses. During conditioning
click-evoked responses were large. Amplitudes decreased during extinction and grew
again with reconditioning. This pattern was maintained throughout the experiment. An
over-all view of the changes in amplitude of the late components of cortical responses
can be seen in Fig. 10. Mean amplitudes have been plotted as a function of daily sessions
in which the CER was reconditioned and extinguished several times, first with a click
CS and later with a photic CS. The plots begin with the final extinction session following
the initial conditioning, i. e., after the changes in waveform were, for the most part,
accomplished. Amplitudes have not been plotted as relative changes, as they are in the
rest of this report, because a rational, stable reference was not available. The behav-
ioral index introduced in the first experiment is shown in the lower graphs.
In spite of some irregularities, especially in behavioral measures for S1, it is
apparent that the conditioned suppression of bar-pressing was accompanied by increases
in amplitudes of late cortical potentials. With extinction of the emotional response,
30
-1-- � - - --- _ � _ ___ __ _
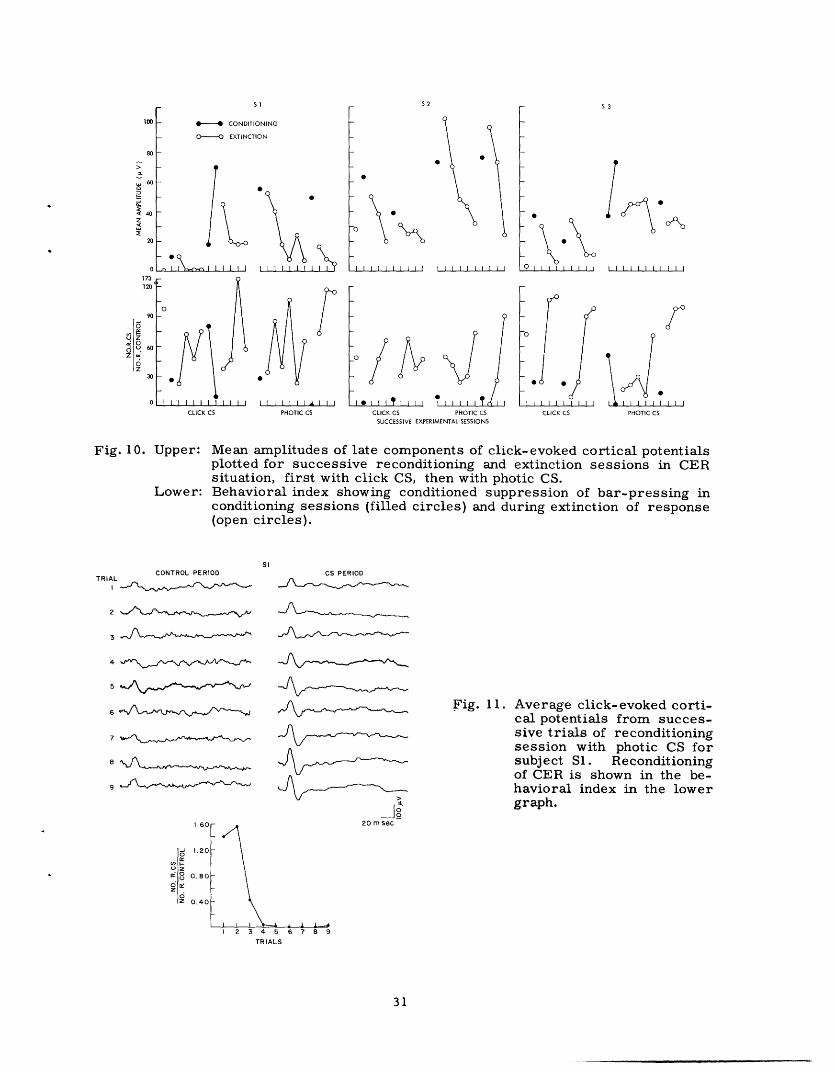
51
---- CONDITIONING
O----O EXTINCTION
I , I I I, L I I ICLICK CS PHOTIC CS
52
S 0
S
- S0
-I l ll
I I I I I I I I I I I I I I I I I I
0
16 1 1 1 1 1 J I I I JCLICK CS PHOTIC CS
SUCCESSIVE EXPERIMENTAL SESSIONS
Fig. 10. Upper: Mean amplitudes of late components of click-evoked cortical potentialsplotted for successive reconditioning and extinction sessions in CERsituation, first with click CS, then with photic CS.
Lower: Behavioral index showing conditioned suppression of bar-pressing inconditioning sessions (filled circles) and during extinction of response(open circles).
CONTROL PERIODTRIAL
sI
8
A-
I
z
0Z o
.60
.20
80
40
CS PERIOD
Fig. 11. Average click-evoked corti-cal potentials from succes-sive trials of reconditioningsession with photic CS forsubject S. Reconditioningof CER is shown in the be-havioral index in the lowergraph.
20 m sec
31
100
80
60
z
20
0
173120
90
60Z
6 ° 60
300
S3
I ._0
.1CLICK CS
TI I I I I I I I I I
PHOTIC CS
1 2 3 4 5 6 7 8 9
TRIALS
I I i I
-- -
_
* _
-"'N1 1 II I )

amplitudes returned to relatively low levels. The course of the changes in neuroelectric
and behavioral measures was remarkably similar in some instances, e. g., in the plots
for S3.
It is apparent in Fig. 10 that the changes in auditory potentials were not dependent
upon establishment of the click as a CS. Amplitudes of click-evoked potentials showed
similar increases when the CER was elicited by a change in ambient illumination.
This can be seen in another way in Fig. 11. Data presented here were obtained from
the final reconditioning session in which the photic stimulus was employed as CS. Click-
evoked potentials were recorded during CS presentations and during control periods
immediately preceding them. Average evoked responses from both control and CS peri-
ods are shown for each conditioning trial, and the changes in behavior are shown in the
lower graph. Conditioned suppression of bar-pressing was established quite rapidly,
and this was undoubtedly due to the subject's extensive experience in this situation. It
was rather complete by the fourth trial, and it can be seen that cortical potentials
recorded in CS periods were noticeably larger at this point. They continued to grow in
the trials that followed. In contrast, evoked potentials recorded during control periods
showed no such systematic change and remained relatively small throughout the session.
S I
I I I I I I I I I I I
CONDITIONING -
EXTINCTION o-
I I I I I I I I I I I
I I I C I I I I I I I I
CL SESSIOCK CS PHOTIC CS
SESSIONS
Fig. 12. Upper: Mean amplitudes of early com-ponents of click-evoked corticalpotentials plotted as a functionof successive reconditioning(filled circles) and extinction(open circles) sessions for S1.
Lower: Percentage of trials in eachsession in which bar-pressingwas completely suppressed(O bar presses) during CS pres-entations.
Changes in click-evoked cortical potentials found in this experiment were generally
reflected in all components of the evoked response. For the most part, amplitude
changes in the early components were quite parallel to those in the late components,
32
140
120
100
z
E 80
60
100
, 80
f 60
0
I
1i
20
0
--- ---- - -- -I- _. _ _
-ti.:
*

much more so than they were in the first experiment. An example of the changes in
peak-to-peak amplitudes of the initial surface positive and first surface negative poten-
tials can be seen in Fig. 12. A different behavioral index has been employed in the lower
part of this figure; namely, the percentage of trials in each session during which bar-
pressing was completely suppressed. This behavioral measure provided "smoother"
curves for S1 whose bar-pressing behavior was quite erratic during CS periods. With
the exception of one data point, the changes in this behavioral index and the amplitude
changes in early components of cortical responses appear quite parallel.
4. 2.3 Discussion
Increases in the amplitudes of cortical click-evoked potentials were clearly corre-
lated with the conditioned changes in behavior, but it became apparent in this experiment
that the changes were not related to acquired conditional properties of the click stimulus.
Similar changes in auditory potentials were just as obvious when the CER was elicited
by a visual CS. The data strongly suggest that alterations in acoustically evoked poten-
tials during aversive conditioning are related to some more general factor or factors
that were correlated in this experiment with the occurrence of the conditioned emotional
response.
The changes in waveforms of cortical responses seen in the initial stages of this
experiment have not been encountered during conditioning in other experiments when
extended habituation periods preceded conditioning. We have, however, observed such
changes in evoked potentials recorded during habituation procedures. These facts seem
to indicate that changes in sensory evoked potentials related to habituation procedures
on the one hand, and to conditioning operations on the other are not simply the reverse
of one another. They are apparently due to processes which are at least partially inde-
pendent and may in some circumstances operate concurrently.
4.3 EXPERIMENT III
The purpose of this experiment was threefold: (i) The second experiment showed
that increases in amplitudes of auditory cortical potentials were correlated with condi-
tioned changes in behavior when a visual stimulus served as the conditional one. It was
conceivable, however, that these alterations were related to the conditioning history of
the subjects. In the first phase of that experiment, clicks had served as the CS. To eval-
uate this possibility, a photic CS was employed in the first conditioning of subjects in the
present experiment, and click-evoked potentials were recorded throughout this period.
(ii) Early components of cortical evoked responses were found to increase during condi-
tioning in both experiments described above. This suggested that stimulus variables
might be operative under the conditions of our experiments and that changes in evoked
activity might have been due to changes in the acoustic input. Teas and Kiang74 have
shown that the primary components of auditory cortical evoked potentials in the unanes-
thetized cat are sensitive to stimulus parameters, while the later components appear to
33
_I _ _

be influenced by more complex variables, including level of arousal. Stimulus variables
were also suspect, because of repeated demonstrations that with free-field sound stimu-
lation orientation of the head is important in determining effective sound-pressure
levels.60, 71,76 Movement-related variables (to be discussed in greater detail in later
experiments) may also serve to modify the input to the central auditory system. In view
of these considerations, it seemed advisable to measure the input to the central auditory
system. To this end, click-evoked potentials from the auditory nerve were recorded
during conditioning. (iii) An effort was also made in this experiment to record evoked
responses from the medial geniculate body. Throughout these experiments we have
encountered difficulties in recording satisfactory evoked potentials from the medial
geniculate. In part these have been due to difficulties in achieving good electrode place-
ments, but for reasons that we do not understand, electrodes accurately placed have
often yielded poor evoked potentials. Others have noted difficulties in recording evoked
potentials from the medial geniculate1 ' 55 and the fragility of medial geniculate poten-68tials.
4.3.1 Methods
Four rats were employed. Ball-tip electrodes were implanted extradurally over the
auditory cortex of both hemispheres. Electrodes were also implanted bilaterally in ven-
tral cochlear nuclei and in the region of the medial geniculate body. In all 4 subjects at
least one electrode was placed within the medial geniculate, but satisfactory evoked
potentials were recorded from only two subjects. One electrode in RM-27 was placed
in the reticular formation just medial to the geniculate body. This electrode yielded
potentials like those recorded from reticular formation in the first experiment.
Animals were trained to press the bar in the usual way, and the behavior was main-
tained on the same reinforcement schedule employed previously. In 11 preconditioning
sessions clicks were presented at a rate of 1/sec throughout each experimental period.
Several alterations in the stimulus situation were made during the first 7 days. Evoked
responses recorded during the last 4 days of the preconditioning period appeared stable,
and conditioning was begun on the twelfth day of click stimulation.
The visual CS consisted of an increase in the ambient illumination of the test cham-
ber for a period of 1 minute. An increase in illumination served as a control for
possible sensory interaction effects in the second experiment in which a decrease in
illumination was employed as the CS. During conditioning the photic CS was, of course,
followed by an unavoidable shock to the feet. Subject RM-26 was given 9 days of condi-
tioning; subjects RM-27 and RM-28 were given 12. The electrode assembly on RM-29
became detached after only 8 days of conditioning, and the animal was sacrificed at that
time. Although incomplete, data from this subject have been included with the others.
For subjects that completed the experiment, conditioning was followed by 5 days of
extinction and 3 reconditioning sessions.
Throughout conditioning, extinction, and reconditioning, click-evoked potentials were
34
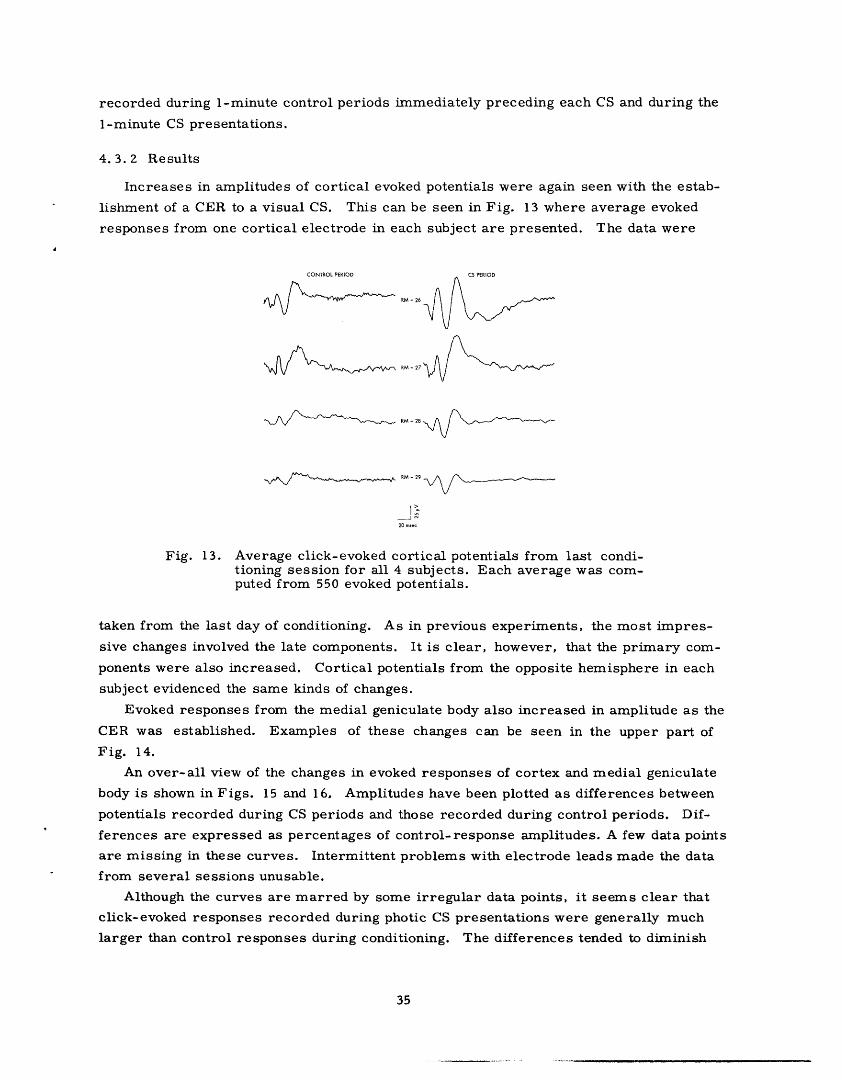
recorded during 1-minute control periods immediately preceding each CS and during the
1-minute CS presentations.
4.3.2 Results
Increases in amplitudes of cortical evoked potentials were again seen with the estab-
lishment of a CER to a visual CS. This can be seen in Fig. 13 where average evoked
responses from one cortical electrode in each subject are presented. The data were
CONTROL PERIOD CS PERIOD
RM -26
RM -28
RM -29
20 msec
Fig. 13. Average click-evoked cortical potentials from last condi-tioning session for all 4 subjects. Each average was com-puted from 550 evoked potentials.
taken from the last day of conditioning. As in previous experiments, the most impres-
sive changes involved the late components. It is clear, however, that the primary com-
ponents were also increased. Cortical potentials from the opposite hemisphere in each
subject evidenced the same kinds of changes.
Evoked responses from the medial geniculate body also increased in amplitude as the
CER was established. Examples of these changes can be seen in the upper part of
Fig. 14.
An over-all view of the changes in evoked responses of cortex and medial geniculate
body is shown in Figs. 15 and 16. Amplitudes have been plotted as differences between
potentials recorded during CS periods and those recorded during control periods. Dif-
ferences are expressed as percentages of control-response amplitudes. A few data points
are missing in these curves. Intermittent problems with electrode leads made the data
from several sessions unusable.
Although the curves are marred by some irregular data points, it seems clear that
click-evoked responses recorded during photic CS presentations were generally much
larger than control responses during conditioning. The differences tended to diminish
35
I___· __ _

RM -26a
RM -28L. MGB
10 _..I
|| \ ~i~~~~ RM -28R. VCN
Fig. 14. Average click-evoked potentials recorded from medialgeniculate body and ventral cochlear nucleus in 2 subjectson the last day of conditioning. Averages were computedfrom 550 evoked potentials. Note difference in timescales for MGB and VCN potentials.
during extinction and reappeared with reconditioning. Large increases in amplitude
were not seen until the sixth day of conditioning, nor was the suppression of bar-
pressing very dramatic until that time. Intensity of the shock UCS was increased during
the first 6 days of conditioning when it became apparent that the initial shock intensity
was not adequate to achieve a strong CER.
Evoked potentials recorded from the reticular formation in subject RM-27 evidenced
similar changes. This can be seen in Fig. 15, in which amplitudes of evoked responses
from reticular formation have been plotted in lieu of comparable measures of geniculate
potentials.
Potentials recorded from ventral cochlear nucleus presented a most irregular pic-
ture. This is apparent in Fig. 14, in which average evoked responses are shown with
geniculate potentials from the same subjects. Cochlear nucleus potentials from RM-26
did not appear to be larger during CS periods than they were in control periods. On the
other hand, the potentials shown for RM-28 were clearly larger during CS presentations;
however, differences of this kind in the data from RM-28 were most variable and seemed
to show little correlation with the more systematic changes in late components of corti-
cal and geniculate responses.
Rather surprisingly, amplitudes of potentials recorded from the cochlear nucleus
evidenced no consistent relationships with amplitudes of early components of cortical
36
� �_ _�
CONTROI PFRIOD 1C PERIOD
-
6

Oa)
u O aXC a0 >0 E
W AU h U
, Z b C
o~oo~ 0%- 1X oZ- 0)
In U Vw x
j x
x
xx
I
/
I I I I I I I I I I I I
4-14
X_ o o U .-4
O a ua4( $ S 0
z Lu
z ~0 ·
-. '-4 Q)
u 2
I I
(1OlNOD -SD ) 3QflildWV NV3W NI 3DN3~3
x
x
Xx
\x
x
1x
I I I I I I I I I I I I I I I I
o _ _ o o o
alOlNOD NnO' -'ON
SD Nlina ' 'ON
_H V U o
a C -
0
- o0 o9P,,4t to>.
L)
t,"4r.z4
37
x
U4
I-
__ __ · - _
,_ kW
W" \ H U
C~W S_ W
5, in W 4-
_______O
0
!
c

III
Xx\ xx
x
/
I I I I I * I I I
0 2 4 6 8 10 12
CONDITIONING
oxX
x
X
X\x
I I I I I I I I1 2 4 1 2 3
EXTINCTION RECOND
DAILY SESSIONS
-L.AC(L)
I I x1 I
RM -29
I I I I
x
x
I I I I I I; *
0 2 4 6 8
CONDITIONING
DAILY SESSIONS
Fig. 16. Relative differences in mean amplitudes of click-evokedpotentials presented as in Fig. 15. Amplitudes of latecomponents of cortical responses are shown for bothsubjects, changes in medial geniculate potentials forRM-26.
and geniculate responses. This is shown in Fig. 17. Here we have plotted the ampli-
tudes of the earliest component of the cochlear nucleus potentials, which were almost
certainly due to auditory nerve activity. Plotted also are peak-to-peak amplitudes of
the early components of cortical potentials from the same subject. In other respects
the graphs are like those presented above. It is clear from Fig. 17 that large changes
in the early cortical responses were not accompanied by similar changes in contralat-
eral eighth-nerve responses, not at least during the initial conditioning. It should also
be noted that changes in the early cortical responses were, at best, roughly correlated
with changes in the late components. A comparison of the curves in Fig. 17 with those
in Fig. 15 for the same subject will reveal this.
Additional examples of the changes in eighth-nerve responses are shown in Fig. 18.
38
0zz
zz
za:
120
100
UO81
_Ou 0dzv0
0 :z
so80
60
40
20
0

RM-26J
oi0
Ito
zwH
W_4z
4
z
0
a
0
I I I I I I 1 2 4 1 2 3
CONDITIONING EXTINCTION REC
DAILY SESSIONS
Fig. 17. Relative differences in mean amplitudes of click-evokedpotentials recorded during CS and control periods of dailyexperimental sessions for subject RM-26. Changes inearly components of cortical responses are contrastedwith relatively stable amplitudes of eighth-nerve poten-tials during conditioning period.
170
O
iIZ 600
v40
20z
UJz -2
I I I I I I Io 0 2 4 6 8 10 12 1 2 4 1 2 3
CONDITIONING EXTINCTION RECONDITIONING
DAILY SESSIONS
Fig. 18. Relative differences in mean amplitudes of click-evoked eighth-nerve responses recorded in CS and control periods from RM-27.
Relative changes in amplitude have been plotted for eighth-nerve responses recorded
from left and right cochlear nuclei in RM-27. The curves reveal trends similar to
those seen in potentials recorded from more central sites, but the variability in eighth-
nerve potentials weakened the correlations between peripheral and central responses.
4.3.3 Discussion
Click-evoked potentials are clearly altered when a conditioned emotional response
is established with a visual CS. These alterations are not dependent upon any prior
39
_I __ _· -
·--
I
-F)

conditioning in which clicks have served as conditional stimuli, nor are they a function
of the direction of change in the photic stimulus. An increase or decrease in ambient
illumination served equally well as conditional stimuli in this and the previous experi-
ment, and changes in click-evoked potentials were correlated with the acquisition of a
CER under both conditions. The conclusion seems inescapable, therefore, that changes
in click-evoked potentials which are found when clicks are employed as conditional stim-
uli are not related to acquired conditional properties of the auditory stimulus. To put
it another way, the changes are not related to any neural mechanisms underlying condi-
tioning; they appear to be a function of some more general change in the nervous system.
We were rather surprised to find that changes in early components of cortical
responses, which were not consistently related to the conditioned changes in behavior,
were not closely related either to the changes in eighth-nerve and cochlear-nucleus
responses. All of these potentials were appreciably altered during conditioning, but the
changes appeared to be largely independent. Because, in some cases at least, the eighth-
nerve responses did undergo significant increases during conditioning, we cannot rule
out stimulus variables as confounding factors in this experimental situation. But it is
clear that the systematic changes in amplitudes of late cortical potentials were not
dependent upon changes in the input to the central nervous system. Nor were they
dependent upon parallel changes in the early components of the same responses.
4.4 EXPERIMENT IV
The changes in acoustically evoked potentials described above have been attributed to
some general change in the organism during conditioning. There are two obvious possibil-
ities. The first is the emotional response itself. Anxiety or fear is an extremely general-
ized reaction with many response components. These include alterations in cardiac and
respiratory rates, piloerection, several important glandular responses and, very often,
quite dramatic changes in skeletal-muscular behavior. It would not seem strange, there-
fore, to find that sensory activity in the C.N.S. is also altered in the frightened animal.
A demonstration that fear was the critical factor requires, at the very least, elimin-
ation of the second possibility, namely, a radical reduction in the amount of movement
that typically is an important component of the conditioned emotional response. The
frightened rat in CER situations often "freezes" in the presence of the CS. There are
several reasons why this elimination of nearly all movement might in itself account for
the increases in sensory evoked potentials.
Carmel and Starr 1 2 have shown that in unanesthetized cats many kinds of
body movements are accompanied by contractions of the middle-ear muscles. It
has also been demonstrated that contractions of the middle-ear muscles often
accompany eye movements and other body movements during paradoxical sleep,
as well as in waking states.4 ' 5,19 Contractions of the middle-ear muscles are
known to attenuate the acoustic input to the cochlea. 2 1 ' 28, 31 If the reduction in
general body movement associated with the conditioned suppression of bar-pressing
40
_ �__�

is accompanied by a reduction in the activity of middle-ear muscles, one would expect
an increase in amplitudes of auditory potentials when a CER occurs.
Movement has been implicated in another way as a variable affecting acoustically
evoked potentials. Starr 7 3 has presented evidence suggesting that reductions in audi-
tory cortical potentials related to movement are not due solely to middle-ear
mechanisms. Starr found that by cutting middle-ear muscles reductions in evoked
responses from subcortical auditory sites during movement were eliminated, but
cortical potentials continued to show reductions when the cat subjects moved. This
suggested the operation of some central mechanism.
Still another way that movement can affect acoustically evoked potentials is through
the noise it creates, noise that can serve as a masking stimulus. In experiments
reported here, an effort was made to eliminate apparatus noise, but the elimination of
all noise associated with body movements is impossible.
In view of these considerations it seemed possible that the reduction in movement
that often accompanies a CER might itself be sufficient to account for the increased
amplitudes of click-evoked potentials. We have already noted that Galambos, Sheatz,
and Vernier 3 0 have reported augmented amplitudes of click-evoked potentials in Flax-
edilized cats during conditioning, and that Moushegian et al. 6 3 have found similar
increases following section of the middle-ear muscles. There was reason to believe,
therefore, that the changes in auditory potentials described above could not be accounted
for solely in terms of movement or movement-related variables. Nevertheless, it seemed
advisable to determine what role, if any, movement might play in the CER situation.
Electrical stimulation of peripheral sites in the auditory projection seemed to offer
a suitable way to bypass peripheral auditory mechanisms that might be operative during
movement. Cutting middle-ear muscles in the rat seemed too difficult to do well, and
such an operation would eliminate only one of the mechanisms involved in the modifica-
tion of auditory activity during movement. Electrical stimulation offered an added
advantage by making it possible to provide a constant input to the auditory system in the
form of constant current pulses. As we could not be certain that stimulus variables had
played no role in altering evoked potentials in previous experiments, this advantage
seemed important. In the experiment described below, electrically evoked potentials
were recorded from several auditory structures during the acquisition of a conditioned
emotional response.
4.4.1 Methods
Six rats were employed in this experiment. In three, bipolar stimulating electrodes
were implanted in the cochlear nucleus. Electrodes were made of twisted pairs of
teflon-insulated stainless-steel wire, 0. 005 in. in diameter. The distance between
exposed tips was 1 mm. Examination of the brain at the end of the experiment showed
that electrodes had been placed in the ventral cochlear nucleus in subjects RM-33 and
RM-36, and slightly dorsal to the dorsal cochlear nucleus in RM-35.
41
_�__I_ _ __ I· _

In three animals, RM-38, RM-39, RM-40, stimulating electrodes were implanted in
the cochlea. This was done in an effort to obtain an input to the central auditory system
that better approximated the input evoked by click stimulation. In these animals the
tympanic bulla of one ear was opened, and the tympanic membrane, the ossicles, and
muscles of the middle ear were removed to expose the cochlea. The l-mm etched tips
of two electrodes were inserted through small holes in adjacent turns of the cochlea and
cemented there. The entire middle ear was filled with dental cement, and electrode
leads were led subcutaneously to the connector on top of the skull.
Two structures were damaged during implantation of the cochlear stimulating elec-
trodes: the facial nerve and the pterygopalatine portion of the internal carotid artery.
Injury to the seventh nerve resulted in left facial palsies in all three subjects. Damage
of the artery in two subjects led to ischemia of the ipsilateral retina and blindness in
that eye. Wound infections also occurred in the same two subjects, RM-38 and RM-40,
but responded well to antibiotic therapy and drainage. During the conditioning phase of
the experiment behavior of the animals was normal, except for an unusual orientation
of the head caused, presumably, by the unilateral blindness.
Electrodes were also implanted bilaterally in the usual way over auditory cortex. In
4 subjects deep monopolar electrodes were placed in anterior parts of the inferior col-
liculus contralateral to the stimulated side. Two subjects carried similar electrodes in
the region of the contralateral lateral lemniscus.
One subject with cochlear stimulating electrodes, RM-39, completed the experiment,
but an infiltration of tissue between skull and electrode assembly had slowly lifted the
assembly from the skull. There was a progressive, diminution of cortical responses
recorded from this animal, as well as some minor changes in potentials recorded from
inferior colliculus.
The apparatus and behavioral procedures were quite similar to those employed in
the previous experiment. A 1-minute increase in ambient illumination of the test cham-
ber served as the CS for a CER. Electrical stimulation of the cochlea or the cochlear
nucleus was employed in place of click stimuli. The electrical stimulus was presented
at a rate of 1/sec throughout experimental sessions, as the clicks had been in the pre-
vious experiment. The electrical stimulus consisted of a 0. 1-msec square pulse
applied to the electrodes through an isolation transformer and a l-kai series resistor.
Current levels were adjusted for individual subjects to evoke small but measurable
potentials. Currents varied from 34 pA to 200 LA. Electrode impedances ranged from
23 k to 73 kQ. Stimulus currents were monitored throughout daily sessions and were
found to be quite stable over the course of the experiment.
Following the stabilization of bar-pressing, electrical stimulation of the auditory
system was introduced during 5-7 preconditioning sessions. Although stimuli were
presented throughout each of these sessions, evoked potentials were sampled only
during fourteen 1-minute periods. These procedures were followed by conditioning
which lasted 6-8 days. This in turn was followed by 4-5 days of extinction. Finally,
42
__� _____I_� __ __

the animals were reconditioned in 2-3 sessions. In all but the preconditioning sessions,
electrically evoked responses were recorded during CS presentations and 1-minute con-
trol periods preceding them.
The three subjects with intact middle ears were then given 7 additional days of condi-
tioning. In the first 6 of these the level of the background masking noise was varied
in order to determine whether changes in acoustic input had any effect upon electrically
evoked potentials. Noise levels employed were 10 db and 20 db above and 10 db below
the level employed during most of the experiment. In the final session, click stimula-
tion was employed to determine the nature of click-evoked potentials from the several
electrode sites. Click-evoked potentials were recorded from all electrodes, including
those in the cochlear nucleus, and were found to be quite like those recorded from sim-
ilar placements in other animals in this series of experiments.
Body movements were monitored during some sessions. A simple accelerometer
was mounted on the electrode connector for this purpose. It consisted of a bar of piezo-
electric crystal taken from an ordinary phonograph cartridge. One end was attached to
the connector, and the free end supported a small lead weight. Any movement that we
could detect by watching the animals led to the mechanical distortion of the crystal.
Potentials generated by these distortions were amplified and recorded. The device
provided a crude but sensitive indicator of movement.
4.4.2 Results
The movement indicator provided a graphic demonstration of the radical reduction
in movement that is typically part of the conditioned emotional response. This can be
seen in Fig. 19. The cumulative response record and movement records from selected
trials of the first conditioning session are presented for subject RM-38. The movement
records are simply pen records of voltages recorded from the accelerometer. It is
apparent in both measures that the CER developed rapidly. It is also clear from the
movement records that the rat barely moved during the twelfth trial, nor did he in later
trials. This pattern of behavior has been seen in most, but not all, subjects in these
experiments.
Cortical potentials evoked by electrical stimulation of the cochlear nucleus differed
appreciably in the 3 subjects stimulated this way. This is apparent in Fig. 20, in which
average evoked responses from the last reconditioning session are presented. It is also
apparent that the responses of RM-35 and RM-36 were appreciably different from click-
evoked cortical potentials recorded in our other experiments. This is not surprising,
in view of the great difference in the modes of stimulation.
Cortical responses were clearly altered by the conditioning operations. In general,
the potentials were larger in CS periods when the conditioned response was well estab-
lished. But in this instance, some changes in waveform were too complex to justify such
a simple description of the changes brought about through conditioning. Note, for example,
in the responses from RM-35 the diminution of the first negative peak in CS periods
43
�I � _I
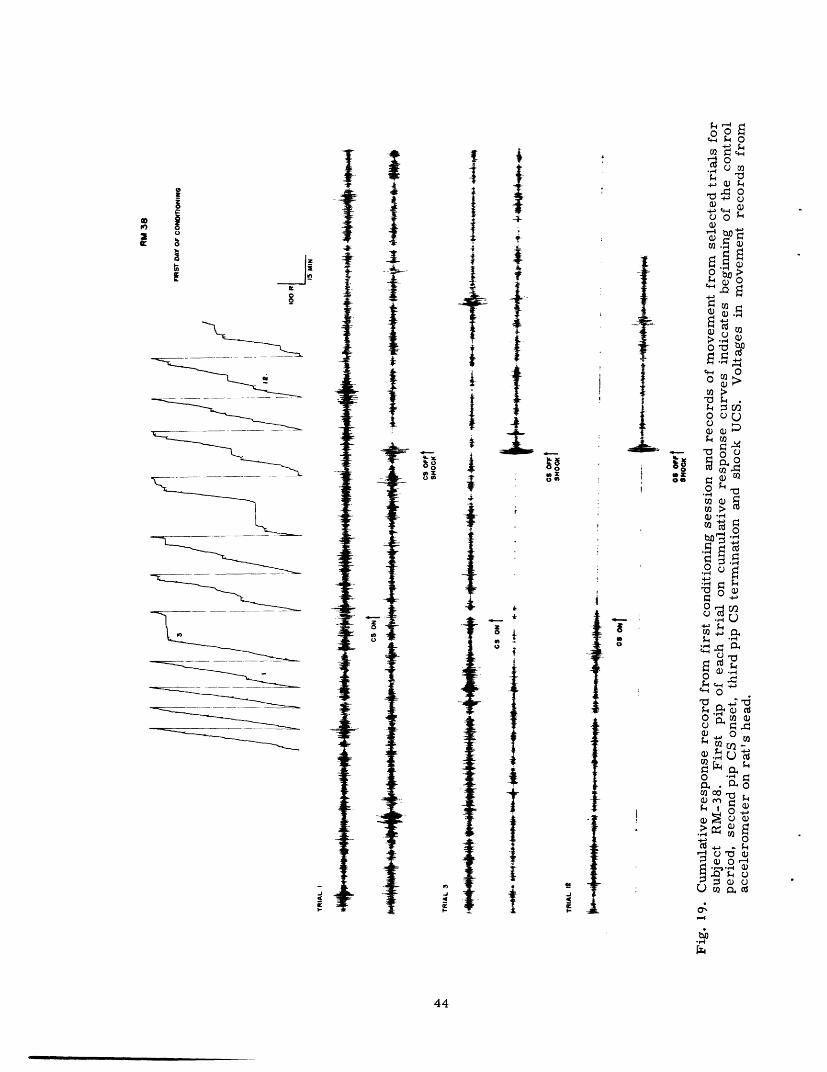
02co
cc tIt;
F2I
Jr
n
0i
oo
o s4 0
Q)
Oq0 bfl
0 o
0o0.) 0
oS
00V2
C'
0 O
U
O *H
~ o
IF I
'I
-+
t
ii o*n :
f4II1:
IIii
i
I
!
-42
--A
4
!ii
Ir
i
-j j
a0l4
_ I
_ 4
0
o i
i
t
-Iit..4
4PrcJ
44
.....
.
F
I
-z
P-el
iF
L
r,
ii,
t-
rI~
O
O o
0
I
Z-
F -
II
:Ar
CI-9
-

Fig. 20.
Average cortical potentials evoked byelectrical stimulation of cochlearnucleus in last reconditioning sessionfor three subjects. Responses arefrom cortex contralateral to the sideof stimulation and were computedfrom approximately 500 evoked poten-tials. Traces begin 2 msec afterstimulus onset.
CS PERIOD
r '^"
Fig. 21. Average responses recorded from ipsilateral cortex of twosubjects in last reconditioning session. Potentials evokedby electrical stimulation of cochlear nucleus. Averagescomputed from approximately 500 evoked potentials.Traces begin 2 msec after stimulus onset.
CONTROL~~~~ PEID--PRO
RM 33C. IC '
C. LL
// - -- E-- M3
10 nrec
Fig. 22. Average responses to electrical stimulation of cochlear nucleusrecorded from contralateral inferior colliculus of subject RM-33and contralateral lateral lemniscus of RM-35 during last recon-ditioning session. Traces begin 2 msec after stimulus onset.
45
CONTROL PERIOD
RM -3 A
RM -36
20 se
CONTROL PERIOD
i;f'" ~ ~ /RM -33
RM -36
CS PERIOD
�si----
20 mec

that accompanied increases in the later negative and positive waves. With so few sub-
jects it is impossible to analyze these patterns of change. Different as the potentials
may have been, it is important that they did show changes with the acquisition of the
CER. This can also be seen in Fig. 21 where potentials recorded from ipsilateral cor-
tex are presented for two subjects that had sizable ipsilateral responses.
Oddly enough, potentials recorded from contralateral inferior colliculus in two
subjects and lateral lemniscus in the third did not differ significantly from click-evoked
potentials recorded from these or other subjects in this study. Examples of these poten-
tials are presented in Fig. 22. The collicular potentials from RM-33 underwent large
increases in all components during conditioning. Increases in potentials recorded
r . r Al ( C
22C
Z _< 0 18(lec
ZZto- 0 14C
LD'U)o
at a IO(- 6. a 6(.
2C
- C.C (L)
I I I _
AC (L)
LL
0.7
0.5
x
0.3
0. X
CONDITIONING E 2 4
CONDITIONING EXTINCTION
DAILY SESSIONS
1 2
REC
x
/l; --- _ I I I
U : Z 4 b I I4
CONDITIONING EXTINCTION
DAILY SESSIONS
Fig. 23. Differences in mean amplitudes of electrically evoked potentialsrecorded during CS and control periods of successive experimentalsessions. Changes in late components of cortical responses areshown for both subjects, changes in late components of inferior col-liculus responses for RM-33, and changes in responses from laterallemniscus for RM-35. Potentials evoked by electrical stimulation ofcontralateral cochlear nucleus. Behavioral changes plotted as usualin the lower graphs. Behavioral response counts are not availablefor RM-35 in first conditioning session.
from lateral lemniscus were much less dramatic, though quite consistent.
The relative magnitudes of changes in auditory potentials is more easily seen in
Fig. 23, in which day-by-day changes have been plotted as in previous experiments.
46
-J0
,--zZ0
lCzr
0
ir
0z
U,0
z(D
0ci
oz
x- x
1 2
REC
___ ___
I

The striking feature of these curves is that several large changes in amplitude were not
associated with fluctuations in the behavioral index. On the second day of conditioning,
for example, cortical and collicular potentials from RM-33 were of approximately the
same amplitude during control and CS periods. Evoked responses in both conditions
were very large, and on this day the animal "froze" throughout most of the session. We
shall return to this observation presently.
Auditory potentials in three subjects receiving stimulation of the cochlea were also
larger in CS periods when the conditioned response was established. Potentials recorded
from contralateral cortex and inferior colliculus are shown for subjects RM-38 and
RM-40 in Fig. 24. Increases in the amplitudes of late components of all responses are
CONTROL PERIOD CSPERIOD
RM -38
RM -40c. AC
20 m
CM -33C. IC
RM -40C. IC
10 msec
Fig. 24. Average evoked responses recorded from contralateral audi-tory cortex and inferior colliculus in two subjects during lastreconditioning session. Potentials evoked by electrical stimuliapplied within the cochlea. Averages computed from approxi-mately 500 evoked potentials. Traces begin 2 msec afterstimulus onset.
quite apparent. Similar changes were seen in evoked potentials from RM-39, but pro-
gressive alterations resulting from movement of the electrode assembly rendered the
data unsuitable for presentation. It should also be noted that cortical and collicular
potentials, evoked by electrical stimuli applied within the cochlea were generally quite
similar to click-evoked potentials recorded from these structures throughout this inves-
tigation.
47
-_ ~ _ _

Changes in the amplitudes of cortical and collicular potentials have been plotted in
Fig. 25 in the usual manner. Several features of the data are illustrated here. Late
components of potentials recorded from inferior colliculus underwent significant changes
during conditioning, extinction and reconditioning, as can be seen in the curves for
RM-38; however, early components of these responses showed little evidence of change.
This is apparent in the plots for RM-40. The patterns of change in late components of
both cortical and collicular responses are of particular interest. During extinction and
---- C. AC (L)
.--d C. IC (L)
100
80
60
40
20
I I I I I I LI
0 2 4 6
CONDITIONING EXTINCTION
DAILY SESSIONS
0
X
I 2
REC
RM-40*- * C. AC (L)
0-.0 C. IC (E)
L _
0--
- C
U
x/x
xS
2 4 6 8 1 2 4
CONDITIONING EXTINCTION
DAILY SESSIONS
x
x
1 2
REC
Fig. 25. Relative differences in amplitudes of both cortical and inferior colliculuspotentials recorded during CS and control periods. Potentials evoked byelectrical stimuli applied within the cochlea. Measure of late componentsof cortical potentials for RM-38 taken from second negative peak to thirdpositive peak. Changes in late components of IC potentials are shown forRM-38, changes in early components for RM-40. Behavioral index shownin lower graphs.
reconditioning, relative differences in amplitude of potentials recorded during CS and
control periods seemed directly related to strength of the CER. But during the initial
conditioning period large changes in the measure of relative amplitudes were not asso-
ciated with comparable changes in the behavioral index. In particular, the large increase
on the sixth day of conditioning in the amplitude measure for both cortical and collicular
potentials in RM-38, and the progressive increase in the measure of cortical potentials
48
300
zw
z
wL-)z
Li,
LWcLa
240
180
120
60
0I-0a:
C-,zo
,W-,
w0
I--Ja.M
0.9
o
iz, D
U)
CDz
a
:
c
0.7
0.5
0.3
0.1 x xI '1
~
'r '1' '1 ...... Ji ~' I I I
- ---- --
7-
L_
I-
L-
L-
-LB6b~ 6_Z\L
J

in RM-40, were certainly not predictable from the behavioral measure that we have
employed. This points to a weakness in this measure, i. e., it is insensitive to changes
in behavior during control periods when bar-pressing in CS periods has been suppressed.
More important are the discrepancies between behavioral index and measure of evoked
potentials which point to significant aspects of the changes in behavior and evoked poten-
tials during aversive conditioning.
In the upper portion of Fig. Z6 mean amplitudes of late cortical potentials from
RM-38 have been plotted separately for daily control and CS periods. Also plotted are
amplitudes of potentials recorded in 5 preconditioning sessions. In the lower portion of
=l 60
a
- 40a.
z< 20
L2
80
< 60
-
40z6zz
202
0
RM-38 ---- CONTROL
C. AC (L) CS
I I I I I I ,I I I I I I I I i I I
I I I I I0 2 4 I 2 4 6 I 2 4 I 2
PRECONDITIONING CONDITIONING EXTINCTION REC
DAILY SESSIONS
Fig. 26. Upper: Mean absolute amplitudes of late components of electri-cally evoked cortical responses plotted separately for CSand control periods as a function of experimental sessions.Control data from 5 preconditioning sessions are alsoincluded.
Lower: Mean number of bar-presses per trial plotted separatelyfor CS and control periods in successive daily sessions.No CS presentations in preconditioning period.
the figure, the mean number of bar-presses that occurred in the same periods are
plotted separately. Note, first of all, that with the commencement of conditioning there
was an appreciable increase in the potentials recorded during control periods. This
increase was maintained until the last day of conditioning and was associated with a sig-
nificant reduction in bar-pressing during control periods. If the suppression of bar-
pressing can be taken as an indicant of fear under these kinds of experimental conditions
(and there is every reason to believe that it can), then the animal was frightened not only
49
I _
I_
_I
I

during CS presentations, but also in the absence of the CS. Not until the last day of con-
ditioning was the animal sufficiently at ease in the absence of the CS that bar-pressing
assumed rates comparable to those in preconditioning sessions, i. e., before the intro-
duction of shock. With this increase in bar-pressing evoked potentials decreased in
amplitude during control periods, though not very much during CS periods, thereby
yielding the large amplitude difference that was seen in Fig. 25 for the last day of condi-
tioning. With extinction and reconditioning there was very little change in behavior or
cortical potentials during control periods, except perhaps in the final return of bar-
pressing rates to those of preconditioning sessions. Differences in evoked responses
and behavior during these phases of the experiment reflected, therefore, the changes
found in CS periods.
We have already hinted at a similar explanation for the apparently wayward data
points in the curves for RM-33 shown in Fig. 23. On the second day of conditioning,
RM-33 bar-pressed in only 2 of 10 control periods, and was obviously frightened through-
out most of the session. Evoked potentials were appropriately large with the occurrence
CONTROL RM -33
NOISE LEVEL
-10 lb i
A f\-
20 dbA_
20 mec
Fig. 27. Averages of cortical potentials evoked by electrical stimulation ofventral cochlear nucleus in RM-33 during 3 conditioning sessionswith different levels of background noise. Noise levels referredto level employed in principal part of the experiment. Each aver-age computed from approximately 500 evoked potentials. Tracesbegin 2 msec after stimulus onset.
50
, ./ I I _>
1- -�v
ii"

of conditioned or unconditioned fear.
Variations in the level of background masking noise over a 30-db range affected the
electrically evoked potentials in only minor ways and did not systematically influence the
amplitude increases during CS presentations. This is readily seen in Fig. 27, where
average evoked cortical responses from three sessions are presented for RM-33. Condi-
tioning was continued in these sessions, and for each day the noise level indicated in
Fig. 27 was employed throughout the experimental session. The data indicate that pos-
sible alterations in the acoustic environment that might have been correlated with condi-
tioned changes in behavior had little, if any, significance in this situation. It should
perhaps be noted that the 20-db noise level was sufficiently loud to depress markedly
bar-pressing rates in all three subjects.
4.4.3 Discussion
Data presented above would seem to eliminate two factors that might possibly have
accounted for changes in acoustically evoked potentials in CER situations: (i) differences
in activity of middle-ear muscles associated with differences in amount of movement
during control and CS periods, (ii) alterations in the acoustic input related to movement
or other factors. The use of electrical stimuli removed any possibility that uncontrolled,
but systematic, fluctuations in stimulus intensity were responsible for the changes in
evoked potentials. Moreover, the demonstration that orderly changes in evoked poten-
tials were independent of large variations in background noise would seem to rule out an
explanation in terms of this variable. Although this finding cannot be generalized to
conditions of physiological acoustic stimulation, other data indicate that amplitude
increases in acoustically evoked potentials when a rat freezes are not due to reductions
in background noise. Teas and Kiang74 have shown that reductions affect early, as well
as late, components of click-evoked cortical potentials. But we have seen that increases
in the amplitudes of late components during conditioning are not necessarily accompanied
by increases in the early cortical responses. Data from a later experiment will also be
relevant to this point.
It was also shown that the amplitude increases in auditory responses were not
dependent upon the occurrence of a conditioned emotional response. With the introduc-
tion of shock there was a general depression of bar-pressing behavior and a concurrent
increase in evoked potentials in both control and CS periods. This certainly points to a
relationship between fear and an increase in sensory evoked potentials. Insofar as the
mode of stimulation ruled out stimulus and movement-related variables, the relation-
ship between fear and augmented evoked potentials is not mitigated by the correlation
of fear and "freezing."
Inconsistencies in the patterns of change in early components of cortical potentials
were seen in this experiment, as they were in previous ones. Data from several sub-
jects showed increases in amplitudes of early components that were highly correlated
with changes in late cortical components. Records from other subjects, however,
51
·�1�11__ ^�__�_ I _I __

showed an inverse relationship between early and late components with reductions in
early components during conditioning. We are unable to account for the extreme vari-
ability encountered in the early cortical responses. It was characteristic of cortical
potentials recorded in this entire series of experiments. Use of electrical stimulation
has ruled out the explanation we had previously entertained, namely, that the inconsist-
encies were related to uncontrolled stimulus variables. In any case, it is again apparent
that the changes in late components of the cortical responses were not dependent upon
similar changes in early components.
4.5 EXPERIMENT V
Peripheral auditory mechanisms operative during movement were neutralized in the
previous experiment through the use of electrical stimulation. But electrical stimula-
tion of more peripheral parts of the auditory system could not rule out centrally medi-
ated changes in evoked potentials related to movement. We have already noted that
Starr 73 has reported evidence suggesting that some reductions in auditory cortical poten-
tials during movement may be related to central mechanisms. This required that we
seek a way to determine whether central factors involved in movement were at all
responsible for the modification of acoustically evoked potentials during aversive condi-
tioning.
The most straightforward solution to this problem would seem to require the elimina-
tion of differences in amounts of movement that occur during appetitive control and aver-
sive conditioning procedures. In this experiment we attempted to do this by training
rats to bar-press at equal rates under two components of a multiple schedule of rein-
forcement.2 3 One component was a Variable Interval (VI) food-reinforcement schedule.
The other was a Sidman avoidance schedule. 7 0 Under the schedule of food reinforcement,
animals worked as they did in control periods of the CER situation. Under the avoidance
schedule, rats were presumably frightened as they were in CS periods of the CER situa-
tion, but they also moved to avoid shock. This approach was based on the assumption
that equal rates of bar-pressing under the two conditions would roughly equate amounts
of movement during periods when the animals were or were not frightened. This assump-
tion was incorrect, and the experiment did not accomplish what we had intended. Never-
theless, it is of interest for the very reason that it failed. Moreover, it extends the
findings from CER experiments to another aversive conditioning paradigm.
4.5.1 Methods
The desired behavior under the multiple schedule of reinforcement was obtained in
only 2 subjects. The experiment was terminated before 2 additional subjects reached
the desired level of performance. One subject (S16) whose performance was satisfactory
had been a subject in Experiment I. The other was prepared for this experiment with
electrodes over auditory cortex of both hemispheres and with deep electrodes in retic-
ular formation, medial geniculate body, and ventral cochlear nucleus.
52

Training procedures and training periods were different for the 2 subjects, and there
is no need to describe these in detail. Under the final conditions of the experiment, bar-
pressing was maintained on a multiple schedule of reinforcement. One component of
this schedule was a VI 30-sec food-reinforcement schedule; the other was a Sidman
avoidance schedule with a 2-sec shock-shock interval and an 8-sec or 10-sec response-
shock interval. For S18, a drl condition (differential reinforcement of low rates) of
3 seconds was added to the VI schedule of food reinforcement in some sessions to reduce
response rates. For S16, 10-minute periods of each schedule alternated in experimental
sessions that were approximately 3 hours long. For S18, 20-minute periods were used
in sessions that were approximately 6 hours long. Ambient illumination of the test
chamber was appreciably increased when the Sidman avoidance schedule was in effect.
Clicks were presented at a rate of 1/sec throughout each experimental session.
Again, the clicks were simply a part of the background "noise" and were not relevant
to the behavior. Potentials evoked by clicks were recorded in groups of 100, beginning
at the half-way mark (5 or 10 min) of each reinforcement period. Five to seven such
samples were obtained for each component of the multiple schedule in an experimental
sess' n. Shock presentations during avoidance periods led to blocking of the amplifiers.
Clicks presented in an 8-sec period following shock were not marked on tape. Similarly,
stimulus pulses were not recorded for 8 seconds following each food reinforcement.
4.5.2 Results
Click-evoked potentials recorded from auditory cortex, medial geniculate body, and
reticular formation were larger when the animals bar-pressed to avoid shock than they
were when the subjects worked on the schedule of food reinforcement at comparable
response rates. An example of this is shown in Fig. 28. Average evoked responses
from three electrodes in S16 are presented for both components of the multiple schedule.
The potentials were recorded in the session for which the cumulative response record
is presented at the upper part of the figure. It can be seen that bar-pressing rates were
roughly equal for most of the session. The potentials were actually sampled in 7 periods
of each schedule, beginning with the second period of food reinforcement. Consequently,
the sampling was complete before the large differences in response rates developed at
the end of the session. The total number of bar-presses emitted during the sampling
periods was 223 for the VI component, and 240 for the Sidman avoidance schedule.
Increases in amplitudes of evoked potentials recorded from cortex and reticular forma-
tion were comparable to those found for the same subject in the CER situation. In this
case, too, potentials recorded from ventral cochlear nucleus did not evidence an
increase in amplitude.
In Fig. 29 are plotted the relative differences in amplitude of potentials recorded
from 5 electrodes in S18. Data are presented from 4 successive daily sessions and for
2 additional sessions run several weeks later. In the lower part of the figure, the mean
number of bar-presses per recording period under each schedule is shown for the same
53
____1�� _

experimental sessions. It is apparent that differences in evoked-response amplitudes
were related to the animal's activity in periods of food reinforcement. In the second
session bar-pressing rates were very low during the VI drl component, and differences
FOOD SVC L. RF L. AC
R. VCN L. RF L. AC
VIFOOD S
R
S.A.SHOCK
SR
I.0 ec 10 mec 20 msec
Fig. 28. Cumulative response record at top shows bar-pressing of S16 undermultiple schedule of reinforcement (mult VI 30 sec Avoidance RS 10SS 2). Average evoked responses at bottom recorded from rightventral cochlear nucleus (R. VCN), left reticular formation (L. RF),and left auditory cortex (L. AC) computed from 550 evoked poten-tials recorded during 7 periods of each schedule beginning with thesecond period of food reinforcement.
in amplitude were much reduced. This was also true for the first of the two later
recording sessions. Over-all response rates and observation of the animal were suffi-
cient to indicate that the rat was generally frightened throughout both sessions. Poten-
tials recorded during periods of food reinforcement were much increased in the same
sessions, thereby accounting for the reductions in amplitude differences shown in
Fig. 29.
The last two sessions for which data are presented in Fig. 30 were run for the pur-
pose of obtaining records of the subject's movement. The accelerometer described
earlier was employed for this purpose. In Fig. 30 movement records are presented in
the lower portion of the figure for one recording period of each schedule condition. The
cumulative response record for the entire session is shown in the upper portion.
Response rates during the VI drl component actually exceeded those found under the
avoidance component in this session. But it is clear from the movement records that
54
I
"II---

L. =TT N
R. MGB (L)
L. RF
L. AC (L)0---<0
R. AC (L)
/
I-A
VI drl
S. A.
I I I I I I
SESSIONS
Fig. 29. Upper: Relative differences in mean amplitudes of click-evoked potentials recorded during two componentsof multiple schedule of reinforcement plotted for6 experimental sessions.
Lower: Mean number of bar-presses emitted during peri-ods of each component of multiple schedule whenevoked potentials were recorded. Last 2 sessions2 w e e k s after first 4 sessions. (S. A., Sidmanavoidance component; VI drl, Variable Int e rvaldifferential reinforcement of low rate schedule offood reinforcement.)
55
H> 120
aI00
t
-J 8024z4u 602z
z 40z
Ir
> 2a
40
0
.
o ZZ 0
z zo, 2E w
I
_ _ _ __
AF.1.
n

O W o
O O( u 6
a) -0 $-4 ka -, '-+., 0 (1
53 '5!a) 4
(,
0
La.
0
0 - -w0
z0Er0w
5
-i(h
5
0orrLJo(9z
zcJ
z
C
zLL
0
Aio1
*I't -
I17-4Ai-
.
.r
i
_ ,4j -
. -
-e
-IIi-:a
I-Iif
f
- w=~
1I1
i-
i
I
I-i-
o
(9z
o
w
z
ar
LJow0
I
4t
ItI
T'
tfTl4
1
I
U)
0 -LL-
cr
c't0
L T 0-
I C
1i
--
:-I
~I O ;>
U29
cOU ) °00
^ ia ; o
.o
CrI0LL cd.C 0
W>°O
y) C..) -
L - 1-hd 0
0Yb0
C0)0O mu S I0 oI Oa)
W4=
o 2
0
W -40 0) 0k-Q0)C
k40) 0
0))0
rm0)
C)
V o Y
0
T4
56
I
-1i
i
-4I
FI
-L·
IiIIi
.r
i
IA
rF
I i
-i I
A

comparable bar-pressing rates are not necessarily indicative of comparable amounts of
general bodily movement. There was much less movement during the aversive
VI drl FOOD SR
,| lt <t\9 ,2 Go~~ L. AC
L. RF
Fig. 3 1.
Average evoked responses fromleft auditory cortex (L.AC) and
20 . left reticular tormation (L. t')ULJ Ld.LI CU II JU11 L L : '- C C I 1 -,
for which behavioral data arepresented in Fig. 30. Each aver-age computed from 600 evokedpotentials.
10 mrec
component of the multiple schedule than there was during the appetitive component.
Potentials recorded from two electrodes in the session for which behavioral data are
shown in Fig. 30 are presented in Fig. 31. There would seem to be little doubt that sen-
sory evoked potentials in the frightened rat, moving only to avoid shock, are appreciably
larger than those recorded when the animal is very active and working for food.
4.5.3 Discussion
The behavioral techniques employed in this experiment did not eliminate the high
correlation between the occurrence of an emotional response and a reduction in general
bodily movement. Consequently, the larger evoked responses recorded during the aver-
sive component of the multiple schedule cannot be unequivocally related to fear or anx-
iety. Nevertheless, in this experiment we have another instance of alterations in
sensory evoked potentials related to some behavioral change effected through aversive
conditioning techniques. At the very least, the data indicate that changes in sensory
activity described in previous experiments were not peculiar to the conditioned emo-
tional response situation. The changes may occur under conditions permitting the ani-
mal to avoid the noxious stimulation. Moreover, the occurrence of some behavioral
activity is not sufficient to eliminate these changes.
Behavioral data presented above indicate that the topography of a behavioral response
is affected by the kinds of conditioning procedures employed to obtain the response. In
so doing, they emphasize the need for more complete descriptions of behavior in electro-
physiological studies of conditioning.
4.6 EXPERIMENT VI
In the preceding experiment an attempt was made to eliminate differences in the
amounts of movement that were typical of control and CS conditions in CER situations by
increasing the amount of movement during the aversive CS condition. In the present
57
__- I

experiment the opposite approach was taken; rats were trained to sit motionless during
control periods.
A restraining device was employed that from the outset severely limited movement.
The device has been described in detail elsewhere. 4 0 Briefly, it consisted of a small
cagelike structure just large enough to accomodate a rat. Animals were secured in the
restrainer by means of a plastic collar that was worn for the duration of the experiment.
In other experiments rats have been trained to bar-press under these conditions of par-
tial restraint, but in this experiment the bar was removed and rats were trained to sit
motionless. This situation differed from the usual CER situation, in that "holding still"
for a period of 4 seconds constituted a response rather than a bar-press. When the
holding-still behavior had been stabilized, an emotional response was conditioned in the
usual way. Briefly, the procedures provided a situation in which alert animals were
motionless a large part of the time while "working" for food. The freezing that occurred
during an emotional response did not represent a radical change in skeletal-muscular
behavior.
Another technique was available as a control for residual differences in amounts of
movement during control and CS conditions, namely, the sampling of evoked potentials
only in periods of no movement under both conditions.
We would like to note here that in an earlier experiment concerned with changes in
evoked potentials during conditioning, partially restrained rats were employed in a CER
situation. When bar-pressing in the restrainer had become stable, trains of clicks were
introduced, first in habituation sessions and later as conditional stimuli. Following
conditioning, the CER was extinguished and reconditioned. Finally, a visual stimulus
was employed as the CS, and click-evoked potentials were monitored as the same
PRECONDITIONING CONDITIONING EXTINCTION RECONDITIONING
RM-20
RM- _.
Fig. 32. Average click-evoked cortical responses record20edse
Fig. 32. Average click-evoked cortical responses recordedfrom 4 subjects in CER situation in which animalswere restrained in special apparatus that permittedbar-pressing. Trains of 60 clicks, presented at1/sec, served as CS. Averages from each stage ofthe experiment computed from 600 evoked potentials.RM-14 did not complete the experiment.
58

behavioral changes were brought under control of another sensory modality. The exper-
iment has been described in detail by Mark. 5 8 The results were quite consistent with
the data presented above. A brief summary of the findings is presented in Fig. 32. Aver-
age cortical evoked responses are shown for the 4 subjects at each stage of the experi-
ment in which clicks served as CS. Cortical responses underwent considerable increases
with acquisition of the CER, diminished to preconditioning levels during extinction, and
grew again with reconditioning. It is apparent in Fig. 32 that late components of the
cortical potentials were again the most labile. Evoked responses recorded from ante-
rior portions of the medial geniculate body in several subjects underwent similar
changes, but the changes were relatively small. Although this experiment could not rule
out movement as the explanation of changes in auditory potentials, it suggested that the
explanation could not be found in gross bodily movements or general orientation of the
animals with respect to the stimulus. In the experiment described below, evoked poten-
tials from restrained rats were altered during aversive conditioning when nearly all
movement was eliminated.
4.6.1 Methods
Electrodes were implanted in 6 rats at the following locations: auditory cortex,
medial geniculate body, inferior colliculus, and ventral cochlear nucleus. One subject,
S32, lost its electrode assembly on the fourth day of conditioning. Data from S32 were
consistent with those from the other animals, but will not be considered here. Of 5
animals that completed the experiment, 3 had medial geniculate electrodes that yielded
satisfactory potentials. Four had electrodes from which typically large collicular poten-
tials were recorded. All subjects had at least one electrode in the ventral cochlear
nucleus. For some unknown reason, cortical potentials from both hemispheres of S33
showed a progressive deterioration during the conditioning phase of the experiment. Con-
sequently, complete cortical data are available for only 4 subjects. It should perhaps
be mentioned that 2 additional subjects were employed in a pilot study, and data from
those animals support the findings of the principal experiment.
Two to three weeks after the implanting operation, the animals were adapted to the
restrainer in 4-6 daily sessions. During this period, they were given food only while
they were restrained for approximately 3 hours each day.
In the next stage of the experiment, the animals were trained to sit motionless. This
required from 9 to 16 days. In the terminal stage of this training, a response was
defined as holding still for 4 sec, and was maintained on a VI 25-sec schedule of food
reinforcement. To accomplish this, the output from the accelerometer was integrated,
and the integrated voltage was led to a level detector and switching circuit. The system
was adjusted empirically so that the switch was triggered whenever the animal showed
the slightest movement. The device was very sensitive to chewing movements and other
small head movements that were difficult to see.
After being trained to sit still, the rats were exposed to clicks in 14 preconditioning
59
�__�·11�1___�·___·__ _ �_

sessions. In the last 4 sessions, clicks were presented at 1/sec throughout each one.
In the last two of these, the visual CS, an increase in ambient illumination lasting 1 min-
ute, was presented 13-14 times in each session. Click-evoked potentials were recorded
during the 1-minute CS presentations and during 1-min control periods that fell midway
between CS periods. No food reinforcements were presented in either control or CS
periods that were separated in this experiment so that subjects might not discriminate
the relatively long periods of no-reinforcement resulting from having them contiguous.
Eight days of conditioning followed in which the visual CS was followed by shock to
the tail. All recording conditions were like those in the immediately preceding control
sessions. Conditioning was followed by 5 days of extinction and 2 days of reconditioning.
In all sessions a stimulus marker for every stimulus was recorded on one tape chan-
nel in the usual way. In some sessions only those stimuli presented when the subjects
were motionless, and had been so for at least 1 second, were marked on another tape
channel. It was possible thereby to compare average evoked responses derived from
periods of no movement with the complete samples from some sessions. The sampling
procedure was not employed throughout the experiment because it required an additional
tape channel and therefore eliminated data from one electrode.
4.6.2 Results
The kind of behavior generated by the conditioning procedures described above can
be seen in the cumulative response records of Fig. 33. In the absence of the CS,
S31
CS
CONTROLa Fig. 33. Cumulative response records of2 subjects showing "holding-still"
................................. behavior in special "CER" situa-z A --- ---- _: 1_s _ - DA
lion Wlfn resLraxneu r aLs. ne-sponse defined as holding still for4 sec. Visual CS followed byshock to tail. Alternate controland CS periods marked by pairsof pips on response curves.
I:
15 MIN
response rates for S31 were among the lowest in the group. In the presence of the CS
the frightened animal "froze," as did all subjects, and there was a very noticeable
increase in the rate of the "holding-still" response. A marked change in rate of
responding is not so apparent in the record for S33. Except for chewing, this subject
moved little at any time, and response rates were altered only slightly during CS
60
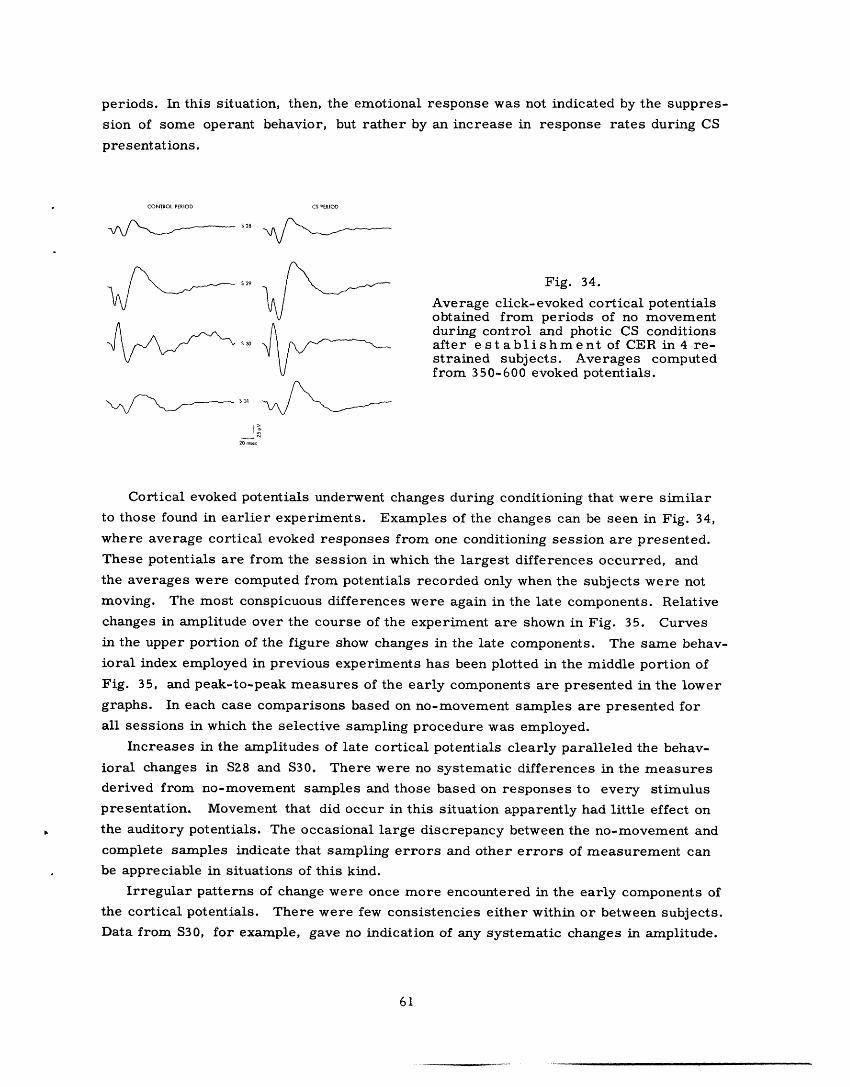
periods. In this situation, then, the emotional response was not indicated by the suppres-
sion of some operant behavior, but rather by an increase in response rates during CS
presentations.
CONTROL PERIOD CS PERIOD
29 Fig. 34.
Average click-evoked cortical potentialsobtained from periods of no movementduring control and photic CS conditions
V\ 5 30 @\ - after establishment of CER in 4 re-strained subjects. Averages computedfrom 350-600 evoked potentials.
31
20 mrec
Cortical evoked potentials underwent changes during conditioning that were similar
to those found in earlier experiments. Examples of the changes can be seen in Fig. 34,
where average cortical evoked responses from one conditioning session are presented.
These potentials are from the session in which the largest differences occurred, and
the averages were computed from potentials recorded only when the subjects were not
moving. The most conspicuous differences were again in the late components. Relative
changes in amplitude over the course of the experiment are shown in Fig. 35. Curves
in the upper portion of the figure show changes in the late components. The same behav-
ioral index employed in previous experiments has been plotted in the middle portion of
Fig. 35, and peak-to-peak measures of the early components are presented in the lower
graphs. In each case comparisons based on no-movement samples are presented for
all sessions in which the selective sampling procedure was employed.
Increases in the amplitudes of late cortical potentials clearly paralleled the behav-
ioral changes in S28 and S30. There were no systematic differences in the measures
derived from no-movement samples and those based on responses to every stimulus
presentation, Movement that did occur in this situation apparently had little effect on
the auditory potentials. The occasional large discrepancy between the no-movement and
complete samples indicate that sampling errors and other errors of measurement can
be appreciable in situations of this kind.
Irregular patterns of change were once more encountered in the early components of
the cortical potentials. There were few consistencies either within or between subjects.
Data from S30, for example, gave no indication of any systematic changes in amplitude.
61
�___I� _ _�__ C_ __�_ __

8C
- 40
I 20
No 0
-20
.
EK-K
4.40
0° 2.20
z
0) 1.80
ZZ
1.00Z 1.40
0.60
80
60
zZ
40 I(..
oLo o-__0
2z 0
-20D 2
PREC
L. AC (L)
0----0
L. AC (E)
S28
I I Iq
x
Ax ~x/
Q
6,I
I I I I I I
i I I l I I I l 4 l2 4 6 8 1 2 4
CONDITIONING EXTINCTION
DAILY SESSIONS
9
U
I
/A
1 2REC
S3C
I
-- A
0 2PREC
9
AIAor vI I ' I I I I I I I
x
X/
I I I I I I I I I I I I
.- 4
- --
I I I I I I A 't2 4 6 8 1CONDITIONING E
DAILY SESSIONS
2 4EXTINCTION
I 1 2REC
Fig. 35. Upper: Relative differences in mean amplitudes of late components ofclick-evoked cortical potentials recorded from 2 subjects dur-ing control and photic CS periods. Mean amplitudes of poten-tials recorded while subjects were motionless (unfilled symbols)are compared with mean amplitudes of all evoked responsesrecorded during each condition (filled symbols).
Middle: Changes in holding-still response shown in same behavioralindex employed for bar-pressing behavior throughout thereport.
Lower: Relative differences in mean amplitudes of early components ofcortical evoked potentials shown as in the upper graphs for latecomponents.
On the other hand, the early cortical potentials from S28 showed changes quite parallel
to those of the late components during extinction, although no such simple relationship
was apparent during the initial conditioning.
Late components of evoked responses from electrodes in anterior portions of the
inferior colliculus increased in amplitude during conditioning, as they had in the experi-
ment with electrical stimulation. With one exception, the early components did not
undergo similar changes. Average evoked responses comparable to the cortical poten-
tials in Fig. 34 are presented in Fig. 36. Early collicular potentials from S33 were
62
¢
-
6
V__I

CONTROL PERIOD CS PERIOD
S 28
29
S 30
533
_J R10 msec
267
180
140 L
100 -
60
20
-20
IC (L)
IC (E)
S29 0
A
Fig. 36. Average click-evoked potentialsrecorded from inferior collicu-lus in 4 subjects during controland photic CS periods in oneconditioning session. Averagesbased on 350-600 evoked poten-tials recorded when rats weremotionless.
S3 0
x-x
I I I I I I I1 2 4 6 8
CONDITIONING
DAILY SESSION
x
I I I I Li
x
I I1 2 4 1 2 0 2EXTINCTION REC PREC
S
I I I I I I I I I I I I I1 2 4 6 8 1 2 4
CONDITIONING EXTINCTION
DAILY SESSIONS
Fig. 37. Relative differences in mean amplitudes of both early and late components ofclick-evoked potentials recorded from inferior colliculus during control andphotic CS periods of daily experimental sessions. Amplitude measures basedon no-movement samples (unfilled symbols) are compared with those based onpotentials evoked by all stimuli (filled symbols). Behavioral changes areplotted in the lower graphs.
63
z
w
zw0zLucrwILLLLa3
-J0W
z00
(n0
wIt
-J0-2
-Jo
z0
Fo
Zzz
6od
U)0
zi0
6ZI
2.20
1.80
1.40
1.00-
0.60
0 2PREC
LJ1 2REC
LL-IL;I·-�
.---- -.- . -
D
x

consistently larger during conditioning, and the waveform of these potentials differed
slightly from that of the potentials in other subjects. There was no obvious difference
in electrode location to account for this discrepancy.
Relative differences in amplitude of potentials recorded in control and CS periods
have been plotted for both early and late components of the collicular potentials in
Fig. 37. For S30, increases in late components during CS periods were highly corre-
lated with the conditioned behavioral changes. Although the correlation seemed some-
what lower for S29, there was little doubt that the late potentials were generally larger
CONTROL PERIOD
528
S 33
10
Fig. 38. Average click-evoked potentials recorded from medial genicu-late body in 3 subjects during control and photic CS periods ofone conditioning session. Averages based on 350-600 evokedpotentials recorded when rats were motionless.
during CS presentations. In both subjects amplitudes of the early components showed
only minor fluctuations during the experiment.
Evoked potentials recorded from medial geniculate revealed patterns of change very
similar to those seen in cortical responses. Late components increased appreciably
during conditioning. This is readily apparent in Fig. 38. At times, the early compo-
nents seemed to show similar trends, but the amplitude increases were considerably
smaller. This can be seen in the curves for S33 in Fig. 39. At best, these changes
were of the order of 30 per cent and showed few consistencies either within or between
subjects. Note in the curves for S33 the very small behavioral changes that, neverthe-
less, were accompanied by relatively large increases in the late potentials recorded
from the medial geniculate.
As in previous experiments, evoked potentials recorded from ventral coch-
lear nucleus exhibited no consistent patterns of change during conditioning. This
was true for both the earliest response components that can be attributed to
auditory nerve and for the later nuclear potentials. Examples of the potentials
64
__� _ I __�__I __ __ ��

- MGB(L) 9 31 r S33120 - _
z 9<r MGB(E)- 90-z
z 0
, - 60 -
LU
- ZLLrW= 30 ko0L~.K2
5.93
U)o(Dz
0Qr
z
_J0° 2.20
o _
O 1.80
c 1.400
9_
% - A- -b _g
k P
9
6
i:_
x
XX X
Xi; · I, ,Y-~~x _x- . x
. . .' \ / . . . A ,-X- -X X
0-60 i I I I I I I I I I I 1 1 L I I _ I I I I I I I I I I L_0 2 1 2 4 6 8 1 2 4 12 2 0 2 2 4 6 8 1 2 4 1 2PREC CONDITIONING EXTINCTION REC PREC CONDITIONING EXTINCTION REC
DAILY SESSIONS DAILY SESSIONS
Fig. 39. Relative differences in mean amplitudes of both early and late com-ponents of click-evoked potentials recorded from medial geniculatebody during control and photic CS periods of daily experimentalsessions. Plots are comparable to those for inferior colliculuspotentials in Fig. 37. Filled symbols indicate means based on allevoked potentials recorded in each session; unfilled symbols indi-cate means of no-movement samples.
are shown in Fig. 40, where day-to-day changes in amplitude have also been plotted in
the usual way. Cochlear-nucleus potentials in S33 showed increases during conditioning
which more or less paralleled the changes in potentials recorded from more central
locations. Such changes are not apparent in the plots for S30 and S31. If there was any
change in the potentials from S31, it was in the opposite direction. These potentials,
incidentally, were much like those described for S14 and S16 in the first experiment
reported here. The latter were also recorded from the lateral surface of the ventral
cochlear nucleus and showed similar decreases during conditioning. The eighth-nerve
component of evoked potentials from S30 and S33 showed rather orderly increases
during conditioning, but changes like this were not apparent in the records from other
subjects.
The irregularities in evoked potentials recorded from cochlear nucleus are
undoubtedly due, in part at least, to differences in electrode placements. But
it seems unlikely that this is the sole explanation. In S29, evoked potentials
recorded from cochlear nucleus were quite like those recorded from S30. Elec-
trode placements were nearly identical. There was no evidence, however, of
65
-- I- -- -
_3U_ -

50 - S 30
30 _A VCN
10
-10
-30
S 31
10 -o I I I - - I I I I
-30
50 - s 33_ w
30
10
-10
I I I I I I I1 2
PRECOND
1 2 4 6 8
CONDITIONING
DAILY SESSIONS
I I I I I
1 2 4
EXTINCTION
i i
I>
I I1 2
RECOND
Fig. 40. Relative differences in mean amplitudes of both eighth-nerve and cochlear-nucleus components of click-evoked potentials recorded from ventralcochlear nucleus during control and photic CS periods of daily experimen-tal sessions. Examples of potentials from which amplitude measureswere derived are shown on the right. Dots at beginning of these tracesindicate time of click onset.
any systematic change in the data from S29.
In all of the graphs above we have again plotted changes in amplitude as relative dif-
ferences between potentials recorded in CS and control periods for each experimental
session. Plots of this kind tend to emphasize the correlations between conditioned
changes in behavior and increases in evoked-response amplitudes. But we have already
noted (see Fig. 26 for Experiment IV) that this way of looking at the data obscures an
important aspect of the changes in evoked potentials. When electric shocks are first
introduced at the outset of conditioning, evoked responses from both control and CS
periods typically show large increases. Before there is evidence that the emotional
response has been conditioned and is discriminative (i. e., occurs only with CS presenta-
tions), there is abundant evidence that the subjects are generally frightened. Examples
of this can be seen in Fig. 41. Here, mean absolute amplitudes of late cortical and
geniculate potentials have been plotted separately for control and CS periods as a func-
tion of daily sessions. Also shown are the total behavioral response counts from
recording periods for each condition. Data from S28 were selected because the relative
66
zz-5
u
IL
/
0
I I �'� �''
I__J1 msec
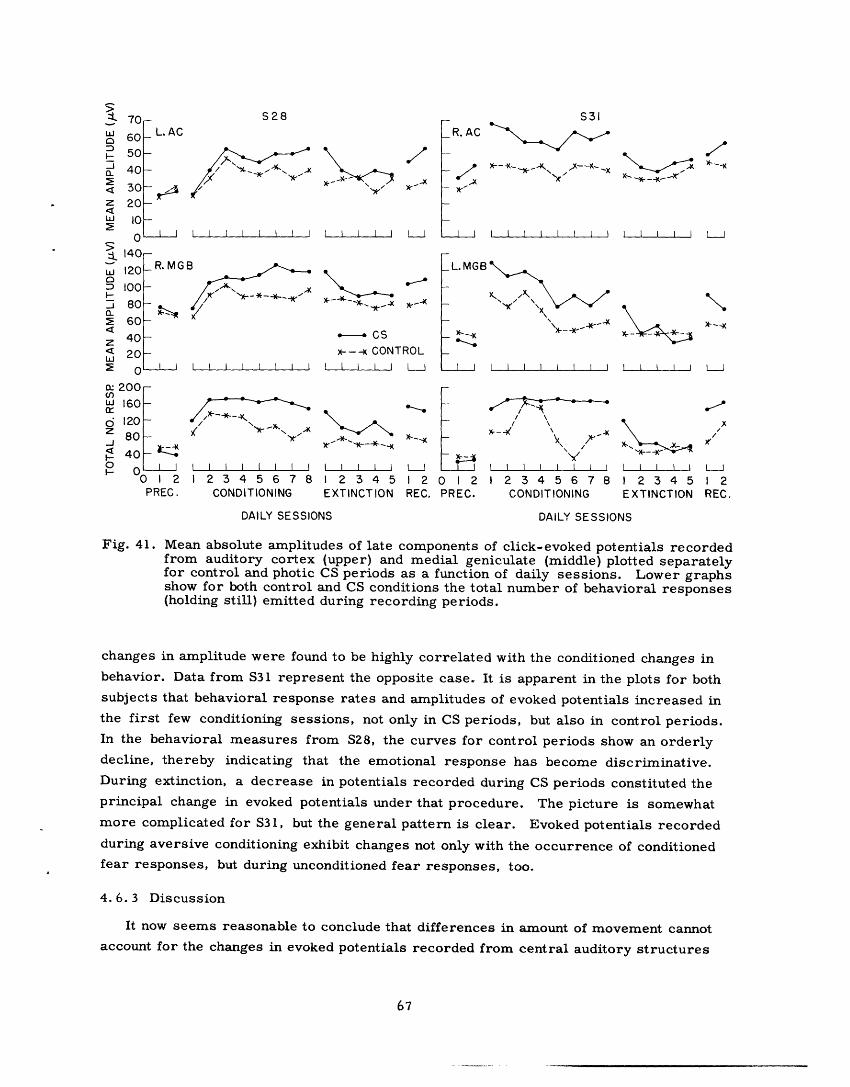
S28
,/ '*_-~ -. -K' -*~~~~~X .~-xKI-
'-
I I I I I I I
3
/K"---C~~/
/
0- CS
x---x CONTROLI I I I I I I I I I I I I L
-/ A- \ A
I I I I I I I I
1 2345678CONDITIONING
-K-
lI I I I1 2345EXTINCTION
--x _ -
I I e120 1 2REC. PREC.
DAILY SESSIONS
S31R. AC "
- AeK I-I
'A X- -X
I I I I I I I I I I I I I
_L. MGB
K-- - -K--
I I I I I I I I I
/ \/ \
I I I I I I I I I I I II 2 34 5678 I 2345
CONDITIONING EXTINCTION
DAILY SESSIONS
Fig. 41. Mean absolute amplitudes of late components of click-evoked potentials recordedfrom auditory cortex (upper) and medial geniculate (middle) plotted separatelyfor control and photic CS periods as a function of daily sessions. Lower graphsshow for both control and CS conditions the total number of behavioral responses(holding still) emitted during recording periods.
changes in amplitude were found to be highly correlated with the conditioned changes inbehavior. Data from S31 represent the opposite case. It is apparent in the plots for bothsubjects that behavioral response rates and amplitudes of evoked potentials increased inthe first few conditioning sessions, not only in CS periods, but also in control periods.In the behavioral measures from S28, the curves for control periods show an orderly
decline, thereby indicating that the emotional response has become discriminative.
During extinction, a decrease in potentials recorded during CS periods constituted theprincipal change in evoked potentials under that procedure. The picture is somewhat
more complicated for S31, but the general pattern is clear. Evoked potentials recorded
during aversive conditioning exhibit changes not only with the occurrence of conditionedfear responses, but during unconditioned fear responses, too.
4.6.3 Discussion
It now seems reasonable to conclude that differences in amount of movement cannotaccount for the changes in evoked potentials recorded from central auditory structures
67
I-0
zz
5
0
z I
CLzW2
a:
U-0I-0
X--,B
7060 L, AC60
50 4030 20 10-
O0 140 120 _R. M(
100 80 - %.6040
O20
200 -160 120 80
40
O0 2PREC.
E--X
l l
X
I I1 2REC.
"-c .~
-
x, I $('I
IE
`-X.,yt.'K

during aversive conditioning. In the present experiment gross differences in movement
were eliminated through behavioral techniques, and selective sampling of potentials from
periods of no movement served as a control for residual differences. It seems most
probable, therefore, that the observed alterations in acoustically evoked potentials were
related to fear, elicited first as an unconditioned response and later as a conditioned one.
This hypothesis is quite compatible with results from all of our own experiments, and
all of the published work that we know of. It will be amplified in our final discussion.
The behavioral situation employed in the present experiment seems to have much in
common with behavioral conditions that have characterized most studies of evoked poten-
tials and conditioning. Animals sitting rather quietly were simply presented with trains
of sensory stimuli that were followed by a noxious unconditional stimulus. But in the
EXTINCTION VI FOOD SR
TRIAL i
2 h Ua k lV 'I,
I
20 mec
Fig. 42. Averages of 50 click-evoked cortical poten-tials recorded from subject S25 during con-trol periods of successive conditioning trials.Potentials at left recorded from session withno behavioral control during control periods(holding-still r e s p o n s e in extinction); thoseat right from earlier session in which holding-still response was maintained on VI scheduleof food reinforcement.
68
_ ��__�� _ _ _��_��__ _
3
4
5
6
7
8

present experiment, subjects were sitting quietly under conditions of behavioral control.
Hungry alert animals were "working" under a schedule of food reinforcement. Their
relatively constant performance throughout experimental sessions (after the initial dis-
turbances related to the introduction of shock) was indicative of stable behavioral condi-
tions suitable for recording baseline evoked potentials. The importance of achieving
behavioral control during preconditioning or other control periods is illustrated in
Fig. 42. These data were obtained from subject SZ5, one of the animals in the pilot
study for the present experiment. Average evoked cortical potentials shown in the left
column were obtained from a conditioning session like those described above for the
restrained animals, except that reinforcement of the holding-still response was with-
held for the entire session, i. e., the response was under extinction. This procedure
was employed to ascertain if the holding still was largely under control of the food rein-
forcer. It became immediately obvious in behavioral data that it was.
The average responses in Fig. 42 are averages of 50 evoked potentials taken only
from control periods of successive trials. The great variability in responses taken
from the session in which the holding-still behavior was extinguished is immediately
obvious. The very noisy potentials of the second and fourth trials were due to the sub-
ject's chewing on metal supports of the restrainer. The large change in late components
in trials 7 and 8 reflect the fact that the animal was dozing. Contrast these irregular-
ities with the relatively stable averages recorded in control periods of an earlier condi-
tioning session in which the usual reinforcement procedures were in effect. Whenever
we have attempted to record evoked potentials under conditions of no behavioral control,
we have encountered variability like that of the potentials from the extinction session of
Fig. 42. It has caused us great concern about the so-called habituated evoked responses
that have commonly constituted the baseline data in most studies of evoked potentials
and conditioning. Common sampling practices are also brought into question by the
inherent variability of evoked potentials recorded under conditions of no behavioral
control.
69
-�111�1111�11--- -~ ~ I~-- -

V. SUMMARY OF EXPERIMENTAL WORK AND DISCUSSION
A summary of the experimental work presented here is complicated by the fact that
what seemed true for late components of auditory evoked potentials was not necessarily
so for the early components. Irregular patterns of change and many inconsistencies
were encountered in early components of evoked potentials recorded from central audi-
tory structures. Similar irregularities were found in the more peripheral activity
recorded from ventral cochlear nucleus. It will be convenient to consider this problem
first, so that the following summary need be concerned only with the systematic changes
in late components of acoustically evoked potentials.
5.1 EARLY COMPONENTS OF AUDITORY EVOKED POTENTIALS
In our earlier experiments, in which movement-related variables were undoubtedly
operative, relatively large increases in early components of cortical and medial genicu-
late potentials were frequently seen during conditioning. Similar increases were some-
times found in eighth-nerve and cochlear-nucleus responses. Such changes were not
entirely consistent between subjects or within the same subject. Moreover, the changes
in early components did not necessarily parallel the changes in late components that
were systematically related to the changes in behavior. In later experiments, when
efforts were made to eliminate the movement factor, there was still evidence of change
in the early components. Changes that did occur, however, generally seemed smaller
and less frequent.
The data suggest that movement-related variables may have been partly responsible
for the large-amplitude increases in early components found in CER situations with
unrestrained rats and physiological acoustic stimulation. A word of caution is in order
here, for it is not clear that the later experiments differed from the earlier ones only
with respect to the control of movement. But the fact remains that when some control of
movement variables was achieved, changes in the early components.of auditory evoked
potentials seemed more the exception than the rule.
As we have already noted, it seems unlikely that changes in the early components
can be explained as a result of poor stimulus control. Similar irregular patterns of
change were found in potentials evoked by electrical stimulation. Moreover, variations
in effective sound-pressure levels could have been no more than trivial in the last exper-
iment with restrained subjects. Another finding that argues against a simple stimulus
interpretation of changes in early cortical potentials is that such changes did not depend
upon similar changes in potentials from more peripheral structures, including auditory
nerve. Eighth-nerve responses were sometimes quite stable, while early components
of cortical potentials underwent appreciable alterations. The same arguments make it
exceedingly unlikely that the irregular patterns of change in early components are to be
explained in terms of middle ear muscle activity.
Regrettably, few conclusions can be drawn about the changes in early components of
70
I _ __ ___ __ _ _

evoked potentials recorded from the classical auditory system. This includes, of course,
the potentials recorded from VCN, both eighth-nerve and cochlear-nucleus components.
They sometimes exhibit increased amplitudes when rats are frightened, but the corre-
lation seemed much too low to indicate any simple relationships between the behavioral
and electrophysiological events. But one point is clear: The changes in early compo-
nents of auditory evoked responses that occur during aversive conditioning are not
related to acquired conditional or discriminative properties of the auditory stimulus.
Moreover, the systematic changes in late components of the potentials are not dependent
upon changes in the components that precede them.
5. 2 LATE COMPONENTS OF AUDITORY EVOKED POTENTIALS
The analysis of alterations in late components of evoked potentials recorded from
central auditory structures now seems reasonably straightforward, for in this case the
changes were systematically and consistently related to measurable alterations in
behavior. Experiments described above reveal the following facts about the late compo-
nents of click-evoked potentials recorded from central auditory structures:
1. Increases in amplitude of evoked potentials recorded from auditory cortex,
medial geniculate body, and inferior colliculus occur with the establishment of a condi-
tioned emotional response. Similar increases occur in potentials recorded from mesence-
phalic reticular formation.
2. Quite comparable increases in acoustically evoked potentials are found when the
same conditioned behavior is brought under control of a photic CS. The photic stimulus
may be an increase or decrease of illumination. Moreover, these changes in click-
evoked potentials do not require a previous conditioning history in which clicks have
been employed as CS.
3. The amplitude increases are not specific to the CER situation, since comparable
changes were found during Sidman avoidance conditioning.
4. Increased amplitudes were found in CER situations with both restrained and
unrestrained subjects.
5. Potentials evoked in central auditory structures by electrical stimuli applied to
cochlear nucleus or within the cochlea revealed the same amplitude increases during
acquisition of a CER.
6. Elimination of differences in amounts of movement that were typical of control
and CS periods in most experiments did not eliminate the increases in evoked potentials
during aversive conditioning.
7. Unconditioned fear, evidenced by behavioral measures obtained during control
periods (i. e., in the absence of the CS), was accompanied by comparable increases in
amplitude of click-evoked potentials.
In our opinion, the most parsimonious and reasonable explanation of these facts is
that amplitude increases in acoustically evoked potentials recorded from central audi-
tory structures and reticular formation during aversive conditioning are due to fear,
71
_�4�1_1_�__ v - _^

fear which is first elicited by noxious unconditional stimuli, and later as a conditioned
response. Certainly there is no reason to believe that the changes in evoked potentials
were related to acquired discriminative or conditional properties of the acoustic stim-
ulus. In fact, the demonstration that this is so proved to be relatively trivial. Acous-
tically evoked potentials were readily changed by conditioning procedures that made no
use of the auditory stimulus, and the changes were quite comparable to those seen when
the auditory stimulus was employed as the CS. Our principal task in this analysis was
to determine what role, if any, movement or movement-related variables played in the
observed amplitude increases. The use of electrical stimuli in one experiment served
as a control for the more conspicuous variables related to movement, namely, the
peripheral factors such as activity of the middle ear muscles, noise generated by move-
ment, and fluctuations in stimulus intensity. With the elimination of nearly all movement
by means of behavioral methods, and with the complete elimination of movement through
the selective sampling of evoked potentials, data from our final experiment indicate that
increased amplitudes of click-evoked potentials during aversive conditioning were not
due to "central" factors, or indeed, to any other factors related to movement.
As we have noted in the introduction to this report, other workers have concluded
that changes in sensory evoked potentials during conditioning are not related to the
neural substrate of conditioning. Jasper, 4 9 Pickenhain and Klingberg, 6 7 and Gerken
and Neff 3 8 have all proposed that the changes found in their experiments were related
to some more general factor. Interestingly, these three experiments had two important
features in common: (i) Objective measures of the animals' behavior were obtained.
(ii) Avoidance conditioning paradigms were employed. (Gerken and Neff also employed
Pavlovian conditioning procedures in some subjects.) Careful measurement of both
behavior and evoked potentials revealed in all three cases that changes in evoked poten-
tials were not a simple function of the strength of conditioned avoidance responses. The
use of simple avoidance paradigms was, it seems, particularly suitable for revealing
this discrepancy.
Since the classical work of Mowrer 6 5 and Miller,6 1 it has been widely accepted that
conditioned fear frequently provides the motivational basis of avoidance behavior.
Conditioning of the fear response precedes the establishment of the instrumental avoid-
ance behavior, but when the latter has been acquired (and the subject, therefore, is no
longer being shocked) signs of fear become much less apparent. Conditioning of the
fear and avoidance responses do not follow the same temporal course. If increased
evoked-response amplitudes in avoidance conditioning are related to fear, then one
would expect an initial rise in amplitudes with the occurrence of unconditioned fear and
with the conditioning of this response, before the occurrence of many avoidance
responses. But with the subsequent acquisition of the avoidance behavior, amplitudes
of evoked potentials should diminish with the mitigation of the fear response. In our
opinion, the data presented by Jasper, and Pickenhain and Klingberg are, for the most
past, consonant with this interpretation, although some explanation must be found for
72
·
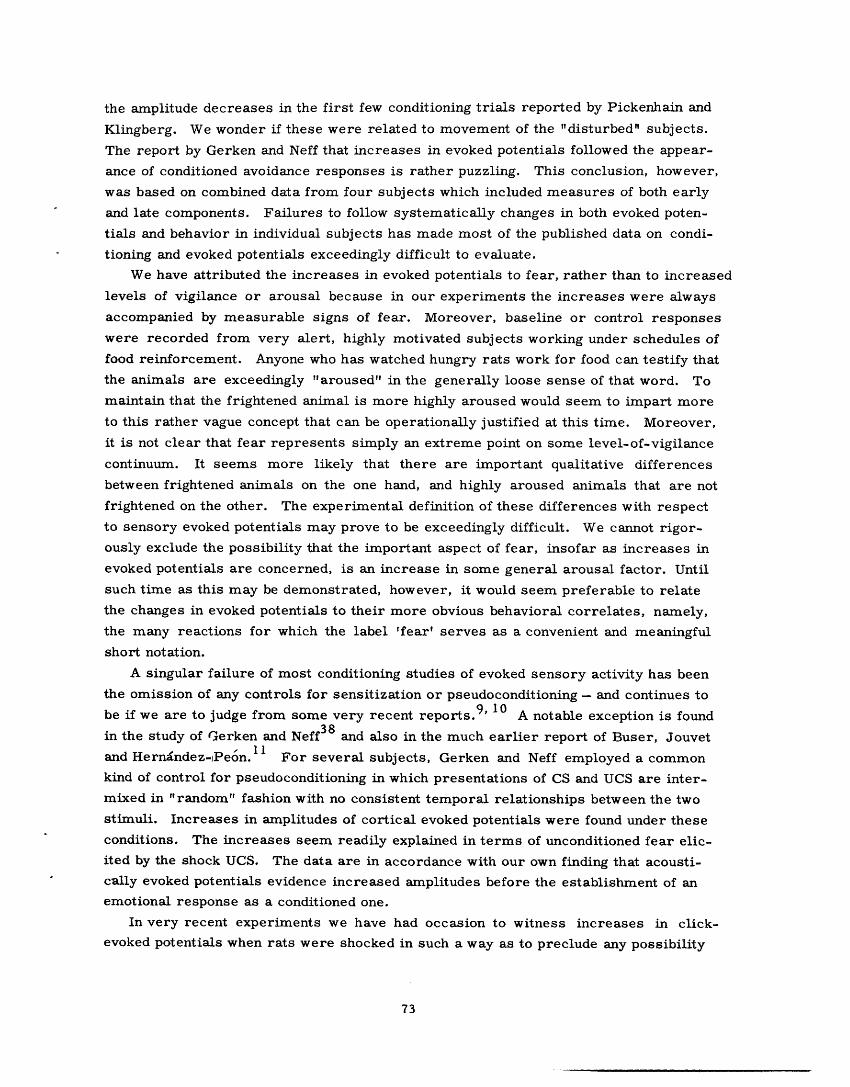
the amplitude decreases in the first few conditioning trials reported by Pickenhain and
Klingberg. We wonder if these were related to movement of the "disturbed" subjects.
The report by Gerken and Neff that increases in evoked potentials followed the appear-
ance of conditioned avoidance responses is rather puzzling. This conclusion, however,
was based on combined data from four subjects which included measures of both early
and late components. Failures to follow systematically changes in both evoked poten-
tials and behavior in individual subjects has made most of the published data on condi-
tioning and evoked potentials exceedingly difficult to evaluate.
We have attributed the increases in evoked potentials to fear, rather than to increased
levels of vigilance or arousal because in our experiments the increases were always
accompanied by measurable signs of fear. Moreover, baseline or control responses
were recorded from very alert, highly motivated subjects working under schedules of
food reinforcement. Anyone who has watched hungry rats work for food can testify that
the animals are exceedingly "aroused" in the generally loose sense of that word. To
maintain that the frightened animal is more highly aroused would seem to impart more
to this rather vague concept that can be operationally justified at this time. Moreover,
it is not clear that fear represents simply an extreme point on some level-of-vigilance
continuum. It seems more likely that there are important qualitative differences
between frightened animals on the one hand, and highly aroused animals that are not
frightened on the other. The experimental definition of these differences with respect
to sensory evoked potentials may prove to be exceedingly difficult. We cannot rigor-
ously exclude the possibility that the important aspect of fear, insofar as increases in
evoked potentials are concerned, is an increase in some general arousal factor. Until
such time as this may be demonstrated, however, it would seem preferable to relate
the changes in evoked potentials to their more obvious behavioral correlates, namely,
the many reactions for which the label 'fear' serves as a convenient and meaningful
short notation.
A singular failure of most conditioning studies of evoked sensory activity has been
the omission of any controls for sensitization or pseudoconditioning - and continues to
be if we are to judge from some very recent reports. 9 ' 10 A notable exception is found
in the study of Gerken and Neff 3 8 and also in the much earlier report of Buser, Jouvet
and Hernlndez-iPeon. 1 For several subjects, Gerken and Neff employed a common
kind of control for pseudoconditioning in which presentations of CS and UCS are inter-
mixed in "random" fashion with no consistent temporal relationships between the two
stimuli. Increases in amplitudes of cortical evoked potentials were found under these
conditions. The increases seem readily explained in terms of unconditioned fear elic-
ited by the shock UCS. The data are in accordance with our own finding that acousti-
cally evoked potentials evidence increased amplitudes before the establishment of an
emotional response as a conditioned one.
In very recent experiments we have had occasion to witness increases in click-
evoked potentials when rats were shocked in such a way as to preclude any possibility
73
_�__1_1______1_____1_ 1

TH5 PRESHOCK SESSION ,RD CLUrr'V CCrCc,__
35
S36
l \ t _h S 37
20 msec
Fig. 43. Average click-evoked hippocampal potentials recorded fromthree subjects before presentation of any electric shocks,and during the third session in which shocks were delivered"randomly" with respect to click trains.
of conditioning. An example of such changes can be seen in Fig. 43. These data were
obtained from a pilot study in which an attempt was made to determine the nature of
click-evoked potentials in the hippocampus and dentate gyrus. The average evoked
potentials in Fig. 43 were recorded from bipolar electrodes in hippocampus. The rats
were placed in the experimental chamber and exposed to clicks in 7 three-hour daily
sessions. Clicks were presented at 1/sec in 10-12 groups of 100 in each session. During
three additional sessions, the animals were shocked through the grid floor of the box.
Ten to twelve shocks were administered in each session at irregular times in the
1 0-minute intervals between trains of clicks, usually around midway through the inter-
vals. No attempt was made to achieve behavioral control in this brief experiment, for
our primary concern was with the waveform of the hippocampal response. The shocking
procedure was introduced when the potentials appeared sufficiently stable to permit at
least the disclosure of possible large changes.
The average responses in Fig. 43 were obtained from the fifth preshock session and
on the last day of shocking. They include all evoked potentials recorded from these elec-
trodes in each session. Data from the fifth preshock session are presented because the
last two preshock sessions were used to obtain monopolar recordings. The effects of
shocking were sufficiently great as to leave little doubt that noxious stimulation can
bring about significant increases in acoustically evoked potentials quite independently of
74

any conditioning operations.
Changes in the electrical activity of auditory structures described in two recent
experiments 9 , 35 appear to lend support to the idea that changes in acoustically evoked
potentials in aversive conditioning situations are not related to associative factors, but
to some more generalized reaction. In the most recent study, Buchwald, Halas, and
Schramm9 employed electrodes 50 ,u in diameter to record activity evoked by 1.5-sec
tone bursts. These served as CS for a leg flexion response in cats. Signals from a
number of electrodes in each subject were highpass-filtered so that spike potentials gen-
erated by relatively small cell populations were separated from the slow-wave responses
"seen" by the same electrodes. The filtered signals were then integrated to obtain "aver-
age" responses of the multiple-unit activity. Enhancement of these responses from a
number of recording sites was found during conditioning, especially in responses
recorded from the classical auditory system and reticular formation. It was noted,
however, that these augmented responses were not specifically correlated with the occur-
rence of conditioned responses, but that evoked activity generally seemed to increase
during conditioning as did strength of the conditioned leg flexion. This suggests to us
that the critical conditioning in this situation was the conditioning of fear. We would
guess that behavioral measures of some part of the fear response, e. g., change in
heart rate, would have been highly correlated with changes in the integrated multiple-
unit responses.
Galin3 5 employed similar recording techniques with a procedure in which -minute
bursts of noise were paired with subcutaneous electric shocks to the backs of cat sub-
jects. Potentials were recorded from a number of sites along the auditory pathways.
Without considering the details of this experiment, we would simply point to the princi-
pal finding. This was a reduction in amplitude of the integrated voltages recorded
during noise bursts and, interestingly, during 1-minute control periods that preceded
noise presentations. The largest decrease was in the level of spontaneous activity, i.e.,
the activity recorded in prestimulus periods. The "evoked response," the difference
between the average integrated voltages recorded in prestimulus and stimulus periods,
underwent relatively minor changes. The changes which, curiously, were all reductions
in amplitude were most apparent in the activity recorded from inferior colliculus. No
changes were found in potentials recorded from auditory cortex or medial geniculate
body. These findings are not readily incorporated with those from our own experiments
or with the data from other conditioning studies of evoked sensory activity. The finding
that noxious stimulation appreciably alters the spontaneous activity of sensory structures
certainly suggests a significant change in "state" of the organism.
5.3 COMMENTS ON REPORTED CHANGES IN EVOKED POTENTIALS RELATED
TO "ATTENTION"
In 1956, Hernindez-Peon, Scherrer and Jouvet 4 4 reported that acoustically evoked
potentials recorded from cochlear nucleus of unanesthetized cats showed reductions in
75
· _I I_ I_~

amplitude when "distracting stimuli of other sensory modalities were presented. This
finding was interpreted as an indication that attending to a stimulus of one sensory
modality leads to an inhibition of sensory activity in other modalities. Following this
original report, a long series of papers by Hernindez-Peon and various co-workers
seemed to confirm this finding. Much of the work has been described in several review
articles.42, 43 Many confirmations, too numerous to list here, were forthcoming from
other laboratories throughout the world. Another finding that has often come hand-in-
hand with reports that "attention" influences evoked responses is that evoked potentials
"habituate," i. e., decrease in amplitude as a function of repeated stimulus presenta-
tions. Habituation effects, the changes attributed to attentional processes, and the
reported increases in evoked potentials related to conditioning together have led to a
rather general notion that biologically "significant" stimuli are accorded some priority
by the nervous system. They evoke larger responses than do stimuli which at some
given time are irrelevant or insignificant.
A detailed review of the experimental work concerned with effects of attention on
sensory evoked potentials is much too large a task to initiate at this point. It should be
noted, however, that not all reports have been positive. In a recent review, Horn4 6 has
been critical of much of the experimental work in this active research area. We intro-
duce the problem because the principal findings from our own conditioning studies seem
relevant.
The reader may recall that experiments described in this report stemmed from ear-
lier failures to demonstrate changes in evoked potentials as stimuli were made discrim-
inative stimuli in appetitive operant conditioning situations. By any reasonable
operational criteria, it would seem that a discriminative stimulus is clearly "significant,"
and is a stimulus to which the animal "attends." Yet we were unable to detect any
changes in click- or flash-evoked potentials as either stimulus acquired these properties.
Moreover, the work described here clearly indicates that changes in evoked potentials
observed in aversive conditioning situations are not related to discriminative properties
of the stimuli. When rats, for example, responded to, and presumably attended to, a
photic CS, click-evoked potentials did not diminish, they became larger. These findings
imply that attending to a stimulus in one modality is not sufficient in itself to enhance
potentials evoked by that stimulus or suppress potentials evoked by stimuli of other
modalities.
How then are we to account for the repeated observations that evoked potentials
recorded from sites along classical sensory pathways are reduced when "distracting"
stimuli of other sensory modalities are presented? (It is probably significant that, in
animal experiments at least, there has been no successful attempt to demonstrate an
increase in amplitudes of evoked potentials in a given sensory system as a stimulus of
the same modality becomes one to which the subject attends. See, for example, the
reports by Jane, Smirnov, and Jasper, 4 8 and Horn. 4 6 ) We suspect that in many
instances the alterations in evoked potentials observed in "attention" experiments with
76
animals can be attributed to uncontrolled stimulus variables and changes in "state" of
the organism, but it would be presumptuous to propose that all such reports are expli-
cable in these terms. The problem is further complicated by the fact that sensory
evoked potentials recorded from the human scalp do appear to depend upon the relevance
of the stimuli to tasks assigned to subjects. Among many experiments with human sub-13,69,72
jects concerned with this problem, several recent and well-designed experiments
indicate that late potentials, with peak latencies typically greater than 100 msec, are
larger when the stimulus becomes a critical aspect of the subject's task. There are
many difficulties in drawing comparisons between the data from human and animal sub-
jects. Perhaps the most important are the considerable differences between potentials
recorded from the human scalp and those recorded from the cortical surface or from
within the cortex of animal subjects. Almost certainly, evoked potentials recorded
from temporal and occipital regions of the human scalp do not have their origins in pri-
mary sensory cortex. It would seem, then, that the burden of proof is with those who
maintain that evoked potentials recorded from classical sensory systems are influenced
by attentional processes. This will require an appropriate demonstration under experi-
mental conditions marked by rigorous control of all variables known to influence sensory
evoked potentials.
5.4 CLOSING REMARKS
This investigation was begun with the hope that significant changes in sensory evoked
potentials might be found that were unequivocally related to conditioning. But the
observed changes in acoustically evoked potentials could not be attributed to conditioning,
and consequently shed no light on neural mechanisms underlying conditioned changes in
behavior. In some sense, the changes were simply an artifact of the kinds of condi-
tioning procedures employed.
The finding that sensory evoked potentials are appreciably modified when animals
are frightened has, however, its own intrinsic interest. Why these changes occur is a
question that should prove amenable to experimental analysis, for fear is reasonably
susceptible to experimental control. This finding also has some practical implications
for future work concerned with the neural basis of conditioning. It suggests that condi-
tioning procedures that provoke radical changes in "state" are to be avoided, for such
changes may unduly complicate the search for neuroelectric events that are uniquely
related to conditioning operations.
77
_11__·1__ __ _

VI. SUMMARY
Acoustically evoked potentials were recorded from unanesthetized rats in a series
of experiments concerned with changes in sensory evoked potentials during conditioning.
Experiments described here employed aversive conditioning procedures, principally the
conditioned emotional response (CER) paradigm. Aversive conditioning techniques were
adopted after repeated failures in our earlier work to find changes in cortical evoked
potentials as appetitive operants were brought under stimulus control.
The principal findings from aversive conditioning experiments may be summarized
as follows.
1. When clicks are established as conditional stimuli in CER situations, click-
evoked potentials recorded from auditory cortex, medial geniculate body, inferior col-
liculus, and mesencephalic reticular formation show evidence of increases in amplitude
that are strongly correlated with the conditioned suppression of bar-pressing. Only
changes in the late components of potentials recorded from central auditory structures
are consistently and systematically related to the conditioned behavioral changes. Early
components of cortical, geniculate, and collicular evoked potentials, as well as evoked
responses from auditory nerve and cochlear nucleus, often show amplitude increases,
but the changes observed are not consistent from subject to subject or within the same
subject. Changes in early components, therefore, do not necessarily parallel those in
later components.
2. None of the changes in evoked potentials during the establishment of the CER are
related to the acquired conditional or discriminative properties of the CS. Similar
changes in acoustically evoked potentials occur when the CER is elicited by a photic CS.
3. Changes in click-evoked potentials during aversive conditioning are not specific
to the CER situation; similar changes were found with Sidman avoidance procedures.
4. The changes could not be attributed to movement or movement-related variables.
Potentials evoked in central auditory structures by electrical stimuli applied to cochlear
nucleus or within the cochlea revealed similar amplitude increases during acquisition of
a CER. In another experiment, behavioral methods and data sampling techniques were
employed to eliminate differences in amount of movement that were typical of control
and CS periods in most of our experiments. These procedures did not eliminate the
increases in acoustically evoked potentials during aversive conditioning.
5. In general, whenever behavioral measures indicated that rats were frightened,
late components of click-evoked potentials recorded from central auditory structures
exhibited increased amplitudes, whether or not a CS was present.
We conclude that reliable alterations in sensory evoked potentials observed during
aversive conditioning are related to fear, which is elicited by noxious unconditional
stimuli and becomes itself a conditioned response.
78

Acknowledgment
We are indebted to many people in the Research Laboratory of Electronics of the
Massachusetts Institute of Technology, who in countless ways have helped to make this
work possible. We can only begin to acknowledge them here.
Special thanks are due to Patty Kirkpatrick, JoAnn Arnn, Susan Kent, and
Judith Swenson, who at one time or another were directly involved in keeping us and our
rats running.
Time and again, we have considered ourselves fortunate in having Richard Clayton
and Robert M. Brown to consult on instrumentation problems. They were always ready
with practicable solutions. Thanks are due also to Arthur Berg and Jack Sears for their
assistance on equipment matters.
F. Hugh Byers did much of the laborious data processing and provided computer pro-
grams that made the task more reasonable for all of us. Joseph Randall also did yeoman
service as data processor.
Ann O' Rourke did most of the histological work, and Dorothy Ippolito saw the work
completed.
These are the people who were most directly involved in the execution of the
research, but we are indebted to all of our colleagues in the Communications Biophysics
Group. They have provided a scholarly, critical and friendly atmosphere pervaded by
a collective esteem of excellence in research. We can only say "We'll try harder."
It is with the warmest pleasure that we acknowledge our special debt to Walter A.
Rosenblith. He was patient while we stumbled, knew we needed time to learn, and was
always ready with a word of encouragement, or with a word of advice if we asked for it.
His thoughtful criticism of the manuscript is also appreciated.
We are also indebted to Nelson Y. S. Kiang for his constructive criticisms of an
earlier version of this report, although neither he nor Walter Rosenblith can be held
responsible for any mistakes it may contain.
79
__II_ _
References
1. Ades, H. W., and Brookhart, J. M. The central auditory pathway, J. Neuro-physiol. 13, 189-205 (1950).
2. Altman, Y. A., Radionova, E. A., and Ratnikova, G. I. Electrophysiologicalinvestigation of the cochlear nucleus in the cat, Sechenov Physiol. J. U. S. S. R. 49,1163-1172 (1963).
3. Artemyev, V. V., and Bezladnova, N. I. Electrical reaction of the auditory areaof the cortex of the cerebral hemispheres during the formation of a conditionaldefense reflex, Trudy Inst. Fiziol. (Mosk.) 1, 228-236 (1952).
4. Baust, W., and Berlucchi, G. Reflex responses to clicks of cat's tensor tympaniduring sleep and wakefulness and the influence thereon of the auditory cortex, Arch.ital. Biol. 102, 686-712 (1964).
5. Baust, W., Berlucchi, G., and Moruzzi, G. Changes in the auditory input in wake-fulness and during the synchronized and desynchronized stages of sleep, Arch. ital.Biol. 102, 657-674 (1964).
6. Beck, E. C., Doty, R. W., and Kooi, K. A. Electrocortical reactions associatedwith conditioned flexion reflexes, Electroenceph. clin. Neurophysiol. 10, 279-289(1958).
7. Brady, J. V., and Hunt, H. F. An experimental approach to the analysis of emo-tional behavior, J. Psychol. 40, 313-324 (1955).
8. Brazier, M. A. B., Killam, K. F., and Hance, A. J. The reactivity of the nerv-ous system n the light of the past history of the organism, in Sensory Communica-tion, edited by W. A. Rosenblith (The M.I.T. Press, Cambridge, Mass., andJohn Wiley and Sons, Inc., New York, 1961), pp. 699-716.
9. Buchwald, J. S., Halas, E. S., and Schramm, S. Changes in cortical and sub-cortical unit activity during behavioral conditioning, Physiol. Behav. 1, 11-22(1966).
10. Buno, W., Jr., Velluti, R., Handler, P., and Garcia-Austt, E. Neural control ofthe cochlear input in the wakeful free guinea-pig, Physiol. Behav. 1, 23-35 (1966).
11. Buser, P., Jouvet, M., and Hernindez-Peon, R. Modifications, au cours duconditionnement chez le chat, du cycle d'excitabilit6 au niveau de la reticulem6sencephalique, Acta Neurol. Latinoamer. 4, 268-278 (1958).
12. Carmel, P., and Starr, A. Acoustic and non-acoustic factors modifying middle-ear muscle activity in waking cats, J. Neurophysiol. 26, 598-616 (1963).
13. Chapman, R. M., and Bragdon, R. Evoked responses to numerical and non-numerical visual stimuli while problem solving, Nature 203, 1155-1157 (1964).
14. Clark, W. A., Brown, R. M., Goldstein, M. H., Molnar, C. E., O'Brien, D. F.,and Zieman, H. E. The average response computer (ARC): A digital device forcomputing averages and amplitude and time histograms of electrophysiologicalresponses, IRE Trans., Vol. BME-8, No. 1, pp. 46-51, January 1961.
15. Clayden, E. C. Practical Section Cutting and Staining (T. H. Churchill Ltd.,London, 1962).
16. Communications Biophysics Group of Research Laboratory of Electronics andW. M. Siebert, Processing Neuroelectric Data (The Technology Press ResearchMonograph, M. I. T., 1959); Technical Report 351, Research Laboratory of Elec-tronics, M.I.T., Cambridge, Mass., July 7, 1959.
17. De Groot, J. The rat forebrain in stereotaxic coordinates, Verhandl. Koninkl.Nederl. Akad. Wetensch. afd Natuurkunde, Tweede Reeks, Deel LII, No. 4 (1959).
18. Delafresnaye, J. F. (ed.). Brain Mechanisms and Learning (Charles C. Thomas,Springfield, Ill., 1961).
80
19. Dewson, J. H., Dement, W. C., and Simmons, F. B. Middle ear muscle activityin cats during sleep, Exptl. Neurol. 12, 1-8 (1965).
20. Durup, G., and Fessard, A. L'6lectroenc6phalogramme de l'homme, L'ann6ePsychol. 36, 1-32 (1935).
21. Eliasson, S., and Gisselsson, L. Electromyographic studies of the middle earmuscles of the cat, Electroenceph. clin. Neurophysiol. 7, 399-406 (1955).
22. Estes, W. K., and Skinner, B. F. Some quantitative properties of anxiety,J. Exptl. Psychol. 29, 390-400 (1941).
23. Ferster, C. B., and Skinner, B. F. Schedules of Reinforcement (Appleton-Century-Crofts, Inc., New York, 1957).
24. Fischgold, H., and Gastaut, H. (eds.). Conditionnement et Reactivit6 en Electro-enc6phalographie, Electroenceph. clin. Neurophysiol. Suppl. 6 (1957).
25. Freeman, W. J. Harmonic oscillation as model for cortical excitability changeswith attention in cats, Science 133, 2058-2059 (1961).
26. Freeman, W. J. Phasic and long-term excitability changes in prepyriform cortexof cats, Exptl. Neurol. 5, 500-518 (1962).
27. Galambos, R. Some recent experiments on the neurophysiology of hearing, Ann.Otol. Rhinol. Laryngol. 65, 1053-1059 (1956).
28. Galambos, R. Some neural correlates of conditioning and learning, in ElectricalStudies on the Unanesthetized Brain, edited by E. R. Ramey and D. S. O'Doherty(Paul B. Hoeber Inc., New York, 1960), pp. 120-131.
29. Galambos, R. Studies of the auditory system with implanted electrodes, in NeuralMechanisms of the Auditory and Vestibular Systems, edited by G. L. Rasmussenand W. Windle (Charles C. Thomas, Springfield, Ill., 1960), pp. 137-151.
30. Galambos, R., Sheatz, G., and Vernier, V. G. Electrophysiological correlatesof a conditioned response in cats, Science, 123, 376-377 (1956).
31. Galambos, R., and Rupert, A. Action of the middle ear muscles in normal cats,J. Acoust. Soc. Am. 31, 349-355 (1959).
32. Galambos, R., and Morgan, C. T. The neural basis of learning, in Handbook ofPhysiology, Sect. 1, Vol. 3, edited by J. Field, H. W. Magoun, and V. E. Hall(American Physiological Society, Washington, D. C., 1960).
33. Galambos, R., Myers, R., and Sheatz, G. Extralemniscal activation of auditorycortex in cats, Am. J. Physiol. 200, 23-28 (1961).
34. Galambos, R., and Sheatz, G. An electroencephalograph study of classical condi-tioning, Am. J. Physiol. 203, 173-184 (1962).
35. Galin, D. Background and evoked activity in the auditory pathway: Effects of noiseshock pairing, Science 149, 761-763 (1965).
36. Garcia-Austt, E. Influence of the states of awareness upon sensory evoked poten-tials, in The Physiological Basis of Mental Activity, edited by R. HernKndez-Pe6n,Electroenceph. clin. Neurophysiol., Suppl. 24, 76-89 (1963).
37. Gastaut, H. (ed.). Symposium L'electroenc6phalographie du conditionnement, Proc.1st Intern. Congr. Neurol. Sci. Brussels, Acta Med. Belg. (1957).
38. Gerken, G. M., and Neff, W. D. Experimental procedures affecting evokedresponses recorded from auditory cortex, Electroenceph. clin. Neurophysiol. 15,947-957 (1963).
39. Gershuni, G. V., Kozhevnikov, A. M., Maruseva, A. M., Avakyan, R. V.,Radionova, E. A., Altman, J. A., and Soroko, V. I. Modifications in electricalresponses of the auditory system in different states of the higher nervous activity,in The Moscow Colloquium on Electroencephalography of Higher Nervous Activity,edited by H. H. Jasper and G. D. Smirnov, Electroenceph. clin. Neurophysio.,Suppl. 13 (1960).
81
__1�1____ ·I __ I

40. Hall, R. D., Clayton, R. J., and Mark, R. G. A device for the partial restraintof rats in operant conditioning studies, J. Exptl. Anal. Behav. 9, 143-145 (1966).
41. Hearst, E., Beer, B., Sheatz, G., and Galambos, R. Some electrophysiologicalcorrelates of conditioning in the monkey, Electroenceph. clin. Neurophysiol. 12,137-152 (1960).
42. Hernindez-Peon, R. Centrifugal control of sensory inflow to the brain and sensoryperception, Acta Neurol. Latinoamer. 5, 279-298 (1959).
43. Hernindez-Peon, R. Neurophysiological correlates of habituation and other mani-festations of plastic inhibition (internal inhibition), in The Moscow Colloquium onElectroencephalography of Higher Nervous Activity, edited by H. H. Jasper andG. D. Smirnov, Electroenceph. clin. Neurophysiol., Suppl. 13, pp. 101-114 (1960).
44. Hernandez-Peon, R., Scherrer, H., and Jouvet, M. Modification of electricactivity in cochlear nucleus during "attention" in unanesthetized cats, Science 123,331-332 (1956).
45. Hernindez-Pe 6n, R., Jouvet, M., and Scherrer, H. Auditory potentials at coch-lear nucleus during acoustic habituation, Acta Neurol. Latinoamer. 3, 144-157(1957).
46. Horn, G. Physiological and psychological aspects of selective perception, inAdvances in the Study of Behavior, edited by D. S. Lehrman, R. A. Hinde andE. Shaw (Academic Press, New York, 1965), pp. 155-215.
47. Hugelin, A., Dumont, S., and Paillas, N. Tympanic muscles and control of audi-tory input during arousal, Science 131, 1371-1372 (1960).
48. Jane, J. A., Smirnov, G. D., and Jasper, H. H. Effects of distraction upon sim-ultaneous auditory and visual evoked potentials, Electroenceph. clin. Neuro-physiol. 14, 344-358 (1962).
49. Jasper, H. H. Discussion, Part II. Pavlovian Conference on Higher NervousActivity, Ann. New York Acad. Sci. 92, 970-973 (1961).
50. Jasper, H. H., and Smirnov, G. D. (eds.). Moscow Colloquium on Electroenceph-alography of Higher Nervous Activity, Electroenceph. clin. Neurophysiol.,Suppl. 13 (1960).
51. John, E. R., Ruchkin, D. S., and Villegas, J. Signal analysis of evoked poten-tials recorded from cats during conditioning, Science 141, 429-431 (1963).
52. John, E. R., Ruchkin, D. S., and Villegas, J. Experimental background: Signalanalysis and behavioral correlates of evoked potential configurations in cats, inSensory Evoked Response in Man, edited by H. E. Whipple, Ann. New York Acad.Sci. 112, 362-420 (1964).
53. Jouvet, M., and Herndndez-Peon, R. Mechanismes neurophysiologique concernantl'habituation, l'attention et le conditionnement, in Conditionnement et Reactivit enElectroencephalographie, edited by H. Fischgold and H. Gastaut, Electroenceph.clin. Neurophysiol., Suppl. 6, pp. 39-49 (1957).
54. Jungert, S. Auditory pathways in the brain stem, Acta Oto-laryngol., Suppl. 138(1958).
55. Kemp, E. H., Coppe, G. E., and Robinson, E. H. Electric responses of thebrainstem to unilateral auditory stimulation, Amer. J. Physiol. 120, 304-315(1937).
56. K6nig, J. F. R., and Klippel, R. A. The Rat Brain (Williams and Wilkins Co.,Baltimore, 1963).
57. Macadar, O., Gin6s, A., Bove, I. C., and Garcia-Austt, E. Effect of habituation,interference and association upon the visual evoked response in the rat, ActaNeurol. Latinoamer. , 315-327 (1963).
58. Mark, R. G. Auditory evoked potentials during conditioning in the rat, Ph.D. Thesis,Massachusetts Institute of Technology, 1966 (unpublished).
82

59. Marsh, J. T., McCarthy, D. A., Sheatz, G., and Galambos, R. Amplitudechanges in evoked auditory potentials during habituation and conditioning, Electro-enceph. clin. Neurophysiol. 13, 224-234 (1961).
60. Marsh, J. T., Worden, F. G., and Hicks, L. Some effects of room acoustics onevoked auditory potentials, Science 137, 280-282 (1962).
61. Miller, N. E. Studies of fear as an acquirable drive. I. Fear as motivation andfear-reduction as reinforcement in the learning of new responses, J. Exptl.Psychol. 38, 89-101 (1948).
62. Morrell, F. Electrophysiological contributions to the neural basis of learning,Physiol. Revs. 41, 443-494 (1961).
63. Moushegian, G., Rupert, A., Marsh, J. T., and Galambos, R. Evoked corticalpotentials in absence of middle ear muscles, Science 133, 582-583 (1961).
64. Moushegian, G., Rupert, A., and Galambos, R. Microelectrode study of the ven-tral cochlear nucleus of the cat, J. Neurophysiol. 25, 515-529 (1962).
65. Mowrer, O. H. Anxiety-reduction and learning, J. Exptl. Psychol. 27, 497-516(1940).
66. Palestini, M., Davidovich, A., and HernKndez-Peon, R. Functional significanceof centrifugal influences upon the retina, Acta Neurol. Latinoamer. 5, 113-131(1959).
67. Pickenhain, L., and Klingberg, F. Behavioural and electrophysiological changesduring avoidance conditioning to light flashes in the rat, Electroenceph. clin.Neurophysiol. 18, 464-476 (1965).
68. Rose, J. E., and Galambos, R. Microelectrode studies on medial geniculate bodyof cat. I. Thalamic region activated by click stimuli, J. Neurophysiol. 15, 343-357(1952).
69. Sheatz, G., and Chapman, R. M. Influencing human evoked responses to auditorypatterns by problem solving, a paper presented at the meeting of the Eastern Psy-chological Association, New York, 1966.
70. Sidman, M. Avoidance conditioning with brief shock and no exteroceptive warningsignal, Science 118, 157-158 (1953).
71. Simmons, F. B., and Beatty, D. L. Sound field variability: Some measurementsfrom the cat, Electroenceph. clin. Neurophysiol. 17, 332-334 (1964).
72. Spong, P., Haider, M., and Lindsley, D. B. Selective attentiveness and corticalevoked responses to visual and auditory stimuli, Science 148, 395-397 (1965).
73. Starr, A. Influence of motor activity on click-evoked responses in the auditorypathway of waking cats, Exptl. Neurol. 10, 191-204 (1964).
74. Teas, D. C., and Kiang, N. Y-s. Evoked responses from the auditory cortex, Exptl.Neurol. 10, 91-119 (1964).
75. Worden, F. G. Discussion, in The Central Nervous System and Behavior, editedby M. A. B. Brazier (Josiah Macy, Jr. Foundation, New York, 1959), p. 270.
76. Worden, F. G., and Marsh, J. T. Some acoustic effects on evoked auditory poten-tials, in Feedback Systems Controlling Nervous Activity, edited by A. Escobar(Sociedad Mexicana de Ciencias Fisiologicas, A. C., 1964), pp. 178-196.
77. Zeman, W., and Innes, J. R. M. Craigie's Neuroanatomy of the Rat (AcademicPress, New York, 1963).
83
_LI1� __C _I_


JOINT SERVICES ELECTRONICS PROGRAMREPORTS DISTRIBUTION LIST
Department of Defense
Dr. Edward M. ReilleyAsst Director (Research)Ofc of Defense Res & EngDepartment of DefenseWashington, D. C. 20301
Office of Deputy Director(Research and Information Room 3D1037)Department of DefenseThe PentagonWashington, D.C. 20301
DirectorAdvanced Research Projects AgencyDepartment of DefenseWashington, D.C. 20301
Director for Materials SciencesAdvanced Research Projects AgencyDepartment of DefenseWashington, D. C. 20301
HeadquartersDefense Communications Agency (333)The PentagonWashington, D. C. 20305
Defense Documentation CenterAttn: TISIACameron Station, Bldg. 5Alexandria, Virginia 22314
DirectorNational Security AgencyAttn: C3/TDLFort George G. Meade, Maryland 20755
Weapons Systems Evaluation GroupAttn: Col. Finis G. JohnsonDepartment of DefenseWashington, D. C. 20305
National Security AgencyAttn: R4-James Tippet
Office of ResearchFort George G. Meade, Maryland 20755
Central Intelligence AgencyAttn: OCR/DD PublicationsWashington, D. C. 20505
Department of the Air Force
AUL3T-9663Maxwell AFB, Alabama 36112
AFRSTEHqs. USAFRoom ID-429, The PentagonWashington, D.C. 20330
AFFTC (FTBPP-2)Technical LibraryEdwards AFB, Calif. 93523
Space Systems DivisionAir Force Systems CommandLos Angeles Air Force StationLos Angeles, California 90045Attn: SSSD
SSD(SSTRT/Lt. Starbuck)AFUPOLos Angeles, California 90045
Det #6, OAR (LOOAR)Air Force Unit Post OfficeLos Angeles, California 90045
Systems Engineering Group (RTD)Technical Information Reference BranchAttn: SEPIRDirectorate of Engineering Standards
and Technical InformationWright-Patterson AFB, Ohio 45433
ARL (ARIY)Wright-Patterson AFB, Ohio 45433
AFAL (AVT)Wright-Patterson AFB, Ohio 45433
AFAL (AVTE/R. D. Larson)Wright-Patterson AFB, Ohio 45433
Hq. OAR (RRY) ptAttn: Col. James A. Fava,Washington, D. C. 22209
USAFF323
Commanding GeneralAttn: STEWS-WS-VTWhite Sands Missile RangeNew Mexico 88002
RADC (EMLAL-1)Griffiss AFB, New York 13442Attn: Documents Library
AFCRL (CRMXLR)AFCRL Research Library, Stop 29L. G. Hanscom FieldBedford, Massachusetts 01731
-I - -

JOINT SERVICES REPORTS DISTRIBUTION LIST (continued)
Academy Library DFSLB)U. S. Air Force AcademyColorado 80840
FJSRLUSAF Academy, Colorado 80840
APGC (PGBPS-12)Eglin AFB, Florida 32542
AFETR Technical Library(ETV, MU- 135)Patrick AFB, Florida 32-925
AFETR (ETLLG-1)STINFO Officer (for Library)Patrick AFB, Florida 32925
ESD (ESTI)L. G. Hanscom FieldBedford, Massachusetts 01731
AEDC (ARO, INC)Attn: Library/DocumentsArnold AFS, Tennessee 37389
European Office of Aerospace ResearchShell Building, 47 Rue CantersteenBrussels, Belgium
Lt. Colonel Robert B. Kalisch, ChiefElectronics Division F322 5Directorate of Engineering SciencesAir Force Office of Scientific Research1400 Wilson Blvd.Arlington, Virginia 22209
Department of the Army
U.S. Army Research OfficeAttn: Physical Sciences Division3045 Columbia PikeArlington, Virginia 22204
Research Plans OfficeU.S. Army Research Office3045 Columbia PikeArlington, Virginia 22204
Commanding GeneralU. S. Army Materiel CommandAttn: AMCRD-DE-EWashington, D.C. 20315
Commanding GeneralU. S. Army S'trategic Communications
CommandWashington, D. C. 20315
Commanding OfficerU. S. Army Materials Research AgencyWatertown ArsenalWatertown, Massachusetts 02172
Commanding OfficerU. S. Army Ballistics Research LaboratoryAttn: V. W. RichardsAberdeen Proving GroundAberdeen, Maryland 21005
CommandantU. S. Army Air Defense SchoolAttn: Missile Sciences Division C&S Dept.P.O. Box 9390Fort Bliss, Texas 79916
Commanding GeneralFrankford ArsenalAttn: SMFA-L6000-64-4 (Dr. Sidney Ross)Philadelphia, Pennsylvania 19137
Commanding GeneralU. S. Army Missile CommandAttn: Technical LibraryRedstone Arsenal, Alabama 35809
U. S. Army Munitions CommandAttn: Technical Information BranchPicatinney ArsenalDover, New Jersey 07801
Commanding OfficerHarry Diamond LaboratoriesAttn: Mr. Berthold AltmanConnecticut Avenue and Van Ness St. N. W.Washington, D. C. 20438
Commanding OfficerU. S. Army Security AgencyArlington HallArlington, Virginia 22212
Commanding OfficerU. S. Army Limited War LaboratoryAttn: Technical DirectorAberdeen Proving GroundAberdeen, Maryland 21005
Commanding OfficerHuman Engineering LaboratoriesAberdeen Proving Ground, Maryland 21005
DirectorU. S. Army EngineerGeodesy, Intelligence and MappingResearch and Development AgencyFort Belvoir, Virginia 22060
_ I _ _ __ �

JOINT SERVICES REPORTS DISTRIBUTION LIST (continued)
CommandantU. S. Army Command and General
Staff CollegeAttn: SecretaryFort Leavenworth, Kansas 66270
Dr. H. Robl, Deputy Chief ScientistU. S. Army Research Office (Durham)Box CM, Duke StationDurham, North Carolina 27706
Commanding OfficerU. S. Army Research Office (Durham)Attn: CRD-AA-IP (Richard 0. Ulsh)Box CM, Duke StationDurham, North Carolina 27706
SuperintendentU. S. Army Military AcademyWest Point, New York 10996
The Walter Reed Institute of ResearchWalter Reed Medical CenterWashington, D.C. 20012
Commanding OfficerU. S. Army Engineer R&D LaboratoryAttn: STINFO BranchFort Belvoir, Virginia 22060
Commanding OfficerU.S. Army Electronics R&D ActivityWhite Sands Missile Range,
New Mexico 88002
Dr. S. Benedict Levin, DirectorInstitute for Exploratory ResearchU. S. Army Electronics CommandAttn: Mr. Robert O. Parker, Executive
Secretary, JSTAC (AMSEL-XL-D)Fort Monmouth, New Jersey 07703
Commanding GeneralU.S. Army Electronics CommandFort Monmouth, New Jersey 07703Attn: AMSEL-SC
AMSEL-RD-DRD-GRD-MAF- 1RD-MATRD-GFXL-DXL-EXL-CXL-SHL-DHL-LHL-JHL-P
HL-OHL-RNL-DNL-ANL-PNL-RNL-SKL-DKL-EKL-SKL-TVL-DWL-D
Department of the Navy
Chief of Naval ResearchDepartment of the NavyWashington, D. C. 20360Attn: Code 427
Chief, Bureau of ShipsDepartment of the NavyWashington, D. C. 20360
Chief, Bureau of WeaponsDepartment of the NavyWashington, D. C. 20360
Commanding OfficerOffice of Naval Research Branch OfficeBox 39, Navy No 100 F. P. O.New York, New York 09510
Commanding OfficerOffice of Naval Research Branch Office1030 East Green StreetPasadena, California
Commanding OfficerOffice of Naval Research Branch Office219 South Dearborn StreetChicago, Illinois 60604
Commanding OfficerOffice of Naval Research Branch Office207 West 42nd StreetNew York, New York 10011
Commanding OfficerOffice of Naval Research Branch Office495 Summer StreetBoston, Massachusetts 02210
Director, Naval Research LaboratoryTechnical Information OfficerWashington, D. C.Attn: Code 2000
CommanderNaval Air Development and Material CenterJohnsville, Pennsylvania 18974
Librarian, U. S. Electronics LaboratorySan Diego, California 95152
Commanding Officer and DirectorU. S. Naval Underwater Sound LaboratoryFort TrumbullNew London, Connecticut 06840
Librarian, U. S. Naval Post Graduate SchoolMonterey, California
-"Ix^Y---- I

JOINT SERVICES REPORTS DISTRIBUTION LIST (continued)
CommanderU. S. Naval Air Missile Test CenterPoint Magu, California
DirectorU. S. Naval ObservatoryWashington, D.C.
Chief of Naval OperationsOP-07Washington, D. C.
Director, U.S. Naval Security GroupAttn: G433801 Nebraska AvenueWashington, D. C.
Commanding OfficerNaval Ordnance LaboratoryWhite Oak, Maryland
Commanding OfficerNaval Ordnance LaboratoryCorona, California
Commanding OfficerNaval Ordnance Test StationChina Lake, California
Commanding OfficerNaval Avionics FacilityIndianapolis, Indiana
Commanding OfficerNaval Training Device CenterOrlando, Florida
U. S. Naval Weapons LaboratoryDahlgren, Virginia
Weapons Systems Test DivisionNaval Air Test CenterPatuxtent River, MarylandAttn: Library
Other Government Agencies
Mr. Charles F. YostSpecial Assistant to the Director
of ResearchNASAWashington, D. C. 20546
NASA Lewis Research CenterAttn: Library21000 Brookpark RoadCleveland, Ohio 44135
Dr. H. Harrison, Code RREChief, Electrophysics BranchNASA, Washington, D. C. 20546
Goddard Space Flight Center NASAAttn: Library, Documents Section Code 252Green Belt, Maryland 20771
National Science FoundationAttn: Dr. John R. LehmannDivision of Engineering, 1800 G Street N. W.Washington, D.C. 20550
U. S. Atomic Energy CommissionDivision of Technical Information ExtensionP. O. Box 62, Oak Ridge, Tennessee 37831
Los Alamos Scientific LibraryAttn: Reports LibraryP.O. Box 1663Los Alamos, New Mexico 87544
NASA Scientific & Technical InformationFacility
Attn: Acquisitions Branch (S/AK/DL)P.O. Box 33, College Park, Maryland 20740
NASA Langley Research Center G-108Langley Station, Hampton, Virginia 23365Attn: Mr. R.V. Hess, Mail Stop 160
Non-Government Agencies
DirectorResearch Laboratory of ElectronicsMassachusetts Institute of TechnologyCambridge, Massachusetts 02139
Polytechnic Institute of Brooklyn55 Johnson StreetBrooklyn, New York 11201Attn: Mr. Jerome Fox
Research Coordinator
DirectorColumbia Radiation LaboratoryColumbia University538 West 120th StreetNew York, New York 10027
DirectorStanford Electronics LaboratoriesStanford UniversityStanford, California
DirectorCoordinated Science LaboratoryUniversity of IllinoisUrbana, Illinois 61803

JOINT SERVICES REPORTS DISTRIBUTION LIST (continued)
DirectorElectronics Research LaboratoryUniversity of CaliforniaBerkeley 4, California
DirectorElectronics Sciences LaboratoryUniversity of Southern CaliforniaLos Angeles, California 90007
Professor A. A. Dougal, DirectorLaboratories for Electronics and
Related Sciences ResearchUniversity of TexasAustin, Texas 78712
Division of Engineering and AppliedPhysics
210 Pierce HallHarvard UniversityCambridge, Massachusetts 02138
Aerospace CorporationP.O. Box 95085Los Angeles, California 90045Attn: Library Acquisitions Group
Professor Nicholas GeorgeCalifornia Institute of TechnologyPasadena, California
Aeronautics LibraryGraduate Aeronautical LaboratoriesCalifornia Institute of Technology1201 E. California Blvd.Pasadena, California 91109
Director, USAF Project RANDVia: Air Force Liaison OfficeThe RAND Corporation1700 Main StreetSanta Monica, California 90406Attn: Library
The Johns Hopkins UniversityApplied Physics Laboratory8621 Georgia AvenueSilver Spring, MarylandAttn: Boris W. Kuvshinoff
Document Librarian
School of Engineering SciencesArizona State UniversityTempe, Arizona
Dr. Leo YoungStanford Research InstituteMenlo Park, California
Hunt LibraryCarnegie Institute of TechnologySchenley ParkPittsburgh, Pennsylvania 15213
Mr. Henry L. BachmannAssistant Chief EngineerWheeler Laboratories122 Cuttermill RoadGreat Neck, New York
University of LiegeElectronic Institute15, Avenue Des TilleulsVal-Benoit, LiegeBelgium
University of California at Los AngelesDepartment of EngineeringLos Angeles, California
California Institute of TechnologyPasadena, CaliforniaAttn: Documents Library
University of CaliforniaSanta Barbara, CaliforniaAttn: Library
Carnegie Institute of TechnologyElectrical Engineering DepartmentPittsburgh, Pennsylvania
University of MichiganElectrical Engineering DepartmentAnn Arbor, Michigan
New York UniversityCollege of EngineeringNew York, New York
Syracuse UniversityDept. of Electrical EngineeringSyracuse, New York
Yale UniversityEngineering DepartmentNew Haven, Connecticut
Bendix Pacific Division11600 Sherman WayNorth Hollywood, California
General Electric CompanyResearch LaboratoriesSchenectady, New York
�_IOIII__ICII___��I_-..-.-sl--·C.-- - P�

JOINT SERVICES REPORTS DISTRIBUTION LIST (continued)
Airborne Instruments LaboratoryDeerpark, New York
Lockheed Aircraft CorporationP.O. Box 504Sunnyvale, California
Raytheon CompanyBedford, MassachusettsAttn: Librarian

UNCLASSIFIEDSecurity Classification
DOCUMENT CONTROL DATA - R & D(Security classification of title, body of abstract and indexing annotation must be entered when the overall report is classified)
. ORIGINATING ACTIVITY (Corporate author) 2a. REPORT SECURITY CLASSIFICATION
Research Laboratory of Electronics UnclassieMassachusetts Institute of Technology 2b. GROUP
Cambridge, Massachusetts3. REPORT TITLE
Acoustically Evoked Potentials in the Rat during Conditioning
4. DESCRIPTIVE NOTES (Type of report and.inclusive dates)
Technical ReportS. AUTHOR(S) (First name, middle initial, last nam?)
Robert D. HallRoger G. Mark
6. REPORT DATE 7. TOTAL NO. OF PAGES 7b. NO. OF REFS
November 30, 1966 96 778.. CONTRACT OR GRANT NO. 9a. ORIGINATOR'S REPORT NUMBER(S)
DA36-039-AMC-03200(E) Technical Report 455b. PROJECT NO. 200-14501-B31F
NSF Grant GK- 835ab. OTHER REPORT NO(S) (Any other numbers that may be assignedNIH Grant P01 MH-04737-06 this report)
NASA Grant N sG- 496 None
10. DISTRIBUTION STATEMENT
Distribution of this report is unlimited
11. SUPPLEMENTARY NOTES 12. SPONSORING MILITARY ACTIVITY
Joint Services Electronics Programthru USAECOM, Fort Monmouth N.J.
13. ABSTRACT
Acoustically evoked potentials were recorded from unanesthetized rats in a seriesof experiments designed to study changes in evoked potentials during conditioning. Itis shown that when clicks are established as conditional stimuli (CS) in conditionedemotional response (CER) situations, click-evoked potentials recorded from centralauditory structures and from mesencephalic reticular formation exhibit amplitudeincreases. Similar increases were found with Sidman avoidance conditioning. Thesechanges during aversive conditioning were not related to acquired discriminative prop.erties of the acoustic stimulus, since similar changes in click-evoked potentials werefound when a CER was elicited by a photic CS. The changes were shown to be indepenent of movement-related variables. Potentials evoked in central auditory structuresby electrical stimulation of the cochlear nucleus or cochlea increased in amplitudeduring acquisition of a CER. In one CER situation nearly all movement was eliminatethrough methods of behavioral control, and data-sampling techniques provided a con-trol for residual differences in amount of movement during CS and control periods.These procedures did not eliminate increases in click-evoked potentials during condi-tioning. In general, whenever behavioral measures indicated that rats were frightene¢acoustically evoked potentials exhibited increased amplitudes, whether or not a CS walpresent, but only changes in late components of click-evoked potentials were consist-ently related to observed behavioral changes. We conclude that changes in evokedpotentials observed during aversive conditioning are not related to the neural substratof conditioning, but are associated with fear elicited initially as an unconditionedresponse to noxious stimulation and later as a conditioned response.
DD , , 51473 (PAGE 1)S/N 0101-807-6811
UN CT A.RT 'TV . nSecurity ClassificatioA-r3
--
-- ---- �------�I----
A-31408

UNC LASSIFIEDSecurity Classification
14.KEY WORDS
Neuroelectric correlates of fear
Evoked potentials during conditioningAcoustically evoked potentials
Conditioned emotional response
DD FORM ,,1473 (BACK)S/N 0101-807-6821
LINK A
ROLE WT
LINK B
ROLE WT
LINK C
ROLE WT
UNCLASSIFIEDSecurity Classification A-3 1409
---
I _ I l i