Electrical stimulation of tooth pulp in humans. I. Relationships among physical stimulus...
26
Pain, 14 (1982) 207-232 Elsevier Biomedical Press 207 Electrical Stimulation of Tooth Pulp in Humans. I. Relationships among Physical Stimulus Intensities, Psychological magnitude Estimates and Cerebral Evoked Potentials ’ Vera M. Fernandes de Lirna, Gian Ernilio Chatrian 2, Ettore Lettich, Robert C. Canfield, R. Colin Miller and Michael J. Soso 3 Division of Electroencephalographyand Clinical Neurophysiolagy Departments of Laboratory Medicine and Neurological Surgery, University of Washington School of Medicine and Department of Restorative Dentistry, University of Washington School of Dentistry, Seattle, Wash. 98195 (U.S.A.) (Received 7 January 1982. accepted 16 April I982) Brief electrical pulses were applied to the pulp of individual pre-molar teeth of 14 healthy, adult vofunteers via wire electrodes implanted and sealed in dentine. The sensation threshold was estimated in each individual by the Two-Alternative Forced-Choice Staircase (2AFCS) method. Seven, 5 or 4 stimulus intensities were employed which were equally spaced in a logarithmic scale between 10 PA above threshold and 500 PA. Magnitude estimates of the subjective intensity of the sensation produced by individual dental excitations were obtained. Cerebral tooth pulp-evoked potentials were simultaneously recorded in 11 subjects. The growth of psychological sensory magnitude with increasing strength of electrical stimulus conformed to the general psychophysical power law. Individual power function exponents varied from 0.204 to 0.907 with a mean of 0.475 and a standard deviation of 0.190. The amplitude of TPEPs, measured between compo- nents IV135 and P293, also was a power function of stimulus intensity. The exponents of individual TFEP amp~tude-intensity functions ranged from 0.055 to ’ Submitted in part by Y.M. Femandes de Lima in her Doctoral Dissertation, University of Washington 1331. * Requests for reprints should be sent to Dr. G.E. Chatrian, Division of EEG and Clinical Neurophysiol- ogy, NN-283 University Hospital SB-IO, Seattle, Wash. 98195, U.S.A. 3 Present address: Department of Neurology. University of Pittsburgh School of Medicine, Piltsburgh, Pa. 15251, U.S.A. 03#“3959/82/~o$~Z.75 Q 1982 Ekevier Biomedical Press
-
Upload
independent -
Category
Documents
-
view
0 -
download
0
Transcript of Electrical stimulation of tooth pulp in humans. I. Relationships among physical stimulus...
Pain, 14 (1982) 207-232 Elsevier Biomedical Press
207
Electrical Stimulation of Tooth Pulp in Humans. I. Relationships among Physical Stimulus Intensities,
Psychological magnitude Estimates and Cerebral Evoked Potentials ’
Vera M. Fernandes de Lirna, Gian Ernilio Chatrian 2, Ettore Lettich, Robert C. Canfield, R. Colin Miller and
Michael J. Soso 3 Division of Electroencephalography and Clinical Neurophysiolagy Departments of Laboratory Medicine and
Neurological Surgery, University of Washington School of Medicine and Department of Restorative Dentistry, University of Washington School of Dentistry, Seattle, Wash. 98195 (U.S.A.)
(Received 7 January 1982. accepted 16 April I982)
Brief electrical pulses were applied to the pulp of individual pre-molar teeth of 14 healthy, adult vofunteers via wire electrodes implanted and sealed in dentine. The sensation threshold was estimated in each individual by the Two-Alternative Forced-Choice Staircase (2AFCS) method. Seven, 5 or 4 stimulus intensities were employed which were equally spaced in a logarithmic scale between 10 PA above threshold and 500 PA. Magnitude estimates of the subjective intensity of the sensation produced by individual dental excitations were obtained. Cerebral tooth pulp-evoked potentials were simultaneously recorded in 11 subjects.
The growth of psychological sensory magnitude with increasing strength of electrical stimulus conformed to the general psychophysical power law. Individual power function exponents varied from 0.204 to 0.907 with a mean of 0.475 and a standard deviation of 0.190. The amplitude of TPEPs, measured between compo- nents IV135 and P293, also was a power function of stimulus intensity. The exponents of individual TFEP amp~tude-intensity functions ranged from 0.055 to
’ Submitted in part by Y.M. Femandes de Lima in her Doctoral Dissertation, University of Washington
1331. * Requests for reprints should be sent to Dr. G.E. Chatrian, Division of EEG and Clinical Neurophysiol-
ogy, NN-283 University Hospital SB-IO, Seattle, Wash. 98195, U.S.A. 3 Present address: Department of Neurology. University of Pittsburgh School of Medicine, Piltsburgh,
Pa. 15251, U.S.A.
03#“3959/82/~o$~Z.75 Q 1982 Ekevier Biomedical Press

0.362 with a mean of 0.144 and a standard deviation of 0.100. These last exponents
were substantially smaller than those describing the growth of psychological magni-
tude estimates. Neither magnitude estimation nor TPEP amplitude-intensity func- tions displayed abrupt changes in slope which might accompany transition from one
operating sensory mechanism to another and/or changes in qualities of subjective sensations from ‘innocuous’ to ’ uncomfortable’ to ‘painful.’
The result of our psychophysical and electrophysiologic experiments indicate that: (I) albeit highly specialized both mo~hologically and functionally, human tooth pulp has certain fundamental properties in common with other sensory
systems and (2) late midline TPEP components may provide measures of central
events that, within a range of stimulus intensities, are associated with the perception of pain, but should not be looked upon as specific indicators of pain processes.
Introduction
This paper describes the relations among the intensity of electrical stimulation of tooth pulp, the magnitude of the resulting sensations and certain parameters of
cerebral evoked potentials. The relations between physical stimulus intensity and subjectively estimated
strength of sensation were determined using the method of ‘magnitude estimation’
[70,71]. Psychophysical experiments employing this technique have demonstrated that for a large number of sensory continua the growth of subjectively estimated sensory magnitude with increasing intensity of physical stimulus follows the ‘power law’ formulated by Stevens and Galanter [73]. This law is described by equations
such as that of Ekman [30]:
where + represents estimated sensory magnitudes, K is a constant of proportionality. Q, is the intensity of the physical stimulus, &, is the sensation threshold and B the
power exponent for the particular continuum. In its logarith~c form this relation is
linear as indicated by the equation:
iog~=logK+plog(~-~,,) (equation 2)
Magnitude estimation techniques were utilized in investigations of sensations gener-
ated by electrical excitation of skin [6,23,31,32,57,69,71]. A somewhat different approach was followed by Buchsbaum et al. [lo] in a study utilizing electrical shocks
delivered to the skin of the forearm. Non-parametric analysis of their subjects’ categorical ratings yielded two indices of pain responses. These measures, termed ‘response criterion’ and ‘error rate’ or ‘insensitivity,’ represented the non-parametric analogues of ‘response criterion’ and ‘observer sensitivity,’ respectiveiy, of signal detection theory experiments.
To our knowledge, a direct scaling method (bisections was first employed by Swartz 1’781 in studying electrically induced dental sensation. He delivered the
209
stimulating pulses to the surface of metal restorations of molar teeth and found an approximately linear relationship between stimulus intensity and subjective magni- tude of pain. More recently, Gracely [38] and Gracely et al. [39-411 delivered painful electrical stimuli to the surface of individual teeth of normal volunteers. Their subjects assessed either the sensory intensity or the unpleasantness of the dental stimulus by choosing the appropriate word from a list of verbal descriptors. Individual verbal responses were quantified by substituting group mean word values determined by a cross-modality matching procedure. Quantified verbal descriptor values of either sensory intensity or unpleasantness of the electrical stimulus were found to be power functions of stimulus intensity.
The effects of stimulus intensity on human somatosensory evoked potentials have been investigated since the early sixties. These studies utilized: (1) electrical excita- tion of skin [6-9,11,27,5 1,57,6 1,62,74,80,82], (2) cutaneous mechanical stimulation [7,34,47,48], (3) noxious thermal stimulation of skin [12-141 and (4) electrical stimulation of teeth [21,42,59,66].
Some investigators attempted to correlate the electrophysiolo~cal responses with subjective assessments of intensity of the sensations experienced by their subjects as well as other psychophysical measures. However, with the exception of Carmon et al. [ 12,131, these researchers obtained psychological and electrophysiological data in separate experiments [6,11,14,21,34,42,47,57,74] or did not themselves obtain psy- chophysical data [66]. The need for simultaneously collecting physiolo~cal and psychological measures was emphasized by Sutton [75] and Vaughan [SZ] who felt that it should not be assumed that a given stimulus intensity would always generate the same sensory experience. Our investigations applied traditional magnitude estimation techniques to the study of electrically elicited tooth pulp sensation. In this research, psychophysical and electrophysiological data were concurrently obtained, Moreover, the stimulus was delivered via intradentinal implants electrodes to minimize the chances of spread of current to periodontal and gingival structures.
Methods
Subjects The subjects employed in this institutionally approved investigation were in-
formed, consenting, paid, healthy, adult volunteers. Fourteen individuals, 12 males and 2 females, participated in the magnitude estimation experiment. Their ages ranged from 25 to 34 years with a mean of 27 years. Cerebral evoked potentials were obtained simult~eously with the magnitude estimates in eleven of these persons, 10 males and 1 female, ranging in age from 24 to 37 years with a mean of 28 years.
General procedure Each subject’s data were collected in a single day, and the duration of the typical
experiment was 8 h, beginning with electrode implantation. Individual data collec- tion runs lasted not more than 12 min. During them the subjects laid comfortably in bed in a sound-attenuated room. Individual runs were separated by periods of rest of

Rubber Insulating sleeves dam --5. \\
Fig. I. Diagrammatic representation of dental preparation used in our studies
20 min during which the subjects were encouraged to walk around or engage in diversions of their choice. At the end of the experiment, the volunteers were instructed to fill out a 3-part questionnaire that inquired into the subjective qualities
of the sensations experienced at each of the stimulus intensities (201. After the study, the tooth was restored with standard. clinically accepted methods.
Tooth selection and ~~e~aratio~~
The dental preparation employed in this study (Fig. 1) was developed by one of us (R.C. Canfield) as a modification of that first described in an earlier work [16j.
Pre-molar teeth with defective mesial and distal developmental pits or small silver amalgam restorations at these sites were used for electrode implantation. Teeth demonstrating advanced decay possibly detracting from the viability of the pulp were excluded from our investigation. The tooth selected for study was isolated by a rubber dam which was sealed by ligation and application of rubber cement. Two openings approximately 1 mm in diameter were placed through the enamel about 0.5
211
mm deep into dentine by means of a high speed dental drill with copious water spray. The coiled bare tips of stainless steel wire electrodes 0.07 mm in diameter and 2-3 mm long were sealed into the prepared cavities with silver amalgam restorative material. Pol~inylchloride tubing sleeves (24-gauge) were then slipped around the wire electrodes. A quick-setting resinous material (Concise) was used to fill the remainder of the cavity and provided continuity between the sleeves and the exposed tooth surface. Rubber cement was applied to the entire preparation to bond elastic rubber-based material (Permlastic) which was added to relieve some of the mechani- cal stress on the electrode wires and sleeves. To provide additional comfort and reduce muscle tension, the rubber dam was then trimmed and folded into a small cylinder which was brought out of the mouth between the lips.
Electrical stimulus The dental stimuli consisted of individual monophasic rectangular pulses of 2
msec duration generated by an isolated, battery-powered, constant-current electrical stimulator (Electronic for Life Sciences SC-IA, modified). These pulses were de- livered bipolarly across the pulp cavity between the implanted intradentinal elec- trodes.
Monitoring of current, voltage and electrode impedance To measure the impedance of the dental electrodes, a single standard pulse of 10
I_LA intensity was applied between them. Current (voltage drop across a 100 Q resistor in series with the preparation) and voltage wave forms were displayed on an oscilloscope (Tektronix 502 with differential amplifiers), photographed (Polaroid Camera C-13) and measured. The impedance was calculated from these measure- ments and the preparation was regarded as adequate when its value was below 120 kQ Several impedance measurements were obtained throughout each experiment to assess the stability of the preparation. Stable impedances were felt to be of paramount importance because of evidence reported by Tursky [79] that in experi- ments of eiectrical excitation of skin neither constant current nor constant voltage stimulation resulted in invariable subjective sensory intensity unless electrode imped- ances also remained unchanged.
Estimation of sensation threshold Sensation thresholds for the particular dental stimulus employed were determined
by the ‘Two-Alternative Forced-Choice Staircase’ (2AFCS) method [l&23,56] using a staircase rule that estimated the 70.7% point in the psychometric function (831. Two staircase runs each consisting of 50 trials were obtained for each subject and the mean of these two estimates was taken as the subject’s sensation threshold for the particular stimulus.
Magnitude estimation procedure The stimulus range varied among subjects. The lowest intensity (I,) was 10 pA
above the sensation threshold and the highest intensity was 500 PA. In 11 individu- als, the interval between I, and 500 PA was divided into 6 steps equahy spaced in a
logarithmic scale, thus producing 7 levels of stimulation (Ii-I.,). To maintain an
approximately uniform spacing of stimuli in subjects with high thresholds, the range
was divided into 4 or 3 intervals, thus producing 5 and 4 levels of stimulation. in 2 and 1 persons, respectively.
The subjects were instructed to assign to each stimulus any number in proportion to the intensity of the sensation experienced. Neither a standard nor a modulus was
employed. In the individuals in whom 7 current levels were used, each experimental run consisted of a block of 56 trials. Individual blocks contained 8 stimuli at each
intensity presented in a pre-arranged random sequence. In the subjects in whom 5 stimulus intensities were employed, 8 runs were performed each of which consisted
of a block of 60 trials containing 12 presentations of stimuli at each intensity. The
person in whom 4 intensities were empioyed underwent 6 runs of 56 trials with 14
presentations at each intensity. Individual trials (pulses) were separated by intervals
of 4- 11 set during which the magnitude estimates were given and cerebral evoked
potentials were recorded. Power functions were fitted to each subject’s estimates as expressed by the
equation:
log\c,=logK+~log(~-‘$0) (equation 3)
where J/ was the geometrical mean of the magnitude estimates, Q, the stimulus intensity in ALA, +e the estimated threshold current in pA and K a constant of proportionality. A computer program was utilized to fit the least squares linear
regression line to the log transforms of the estimates.
Recording of evoked potentials Of the 11 subjects in whom cerebral responses were recorded in the course of the
magnitude estimation experiment, 8, 2 and 1 received stimuli at 7, 5 and 4 intensity
levels, respectively, as detailed under ‘Magnitude estimation procedure.’ The evoked potentials were detected by 6 tin EEG electrodes applied with
collodion and filled with conductive jelly. These leads were placed over midline
regions as well as the post-central areas of both sides in locations described by
Chatrian et al. [ 161. The ground electrode was attached over the cheek ipsilateral to
the stimulus. All measurements utilized in this study were taken in a vertex-inion
(&-I) derivation [ 161. The EEG potentials were amplified (Beckman Accutrace-16 electroencephalo-
graph) and recorded on magnetic tape (Ampex 7-track FR-1300 FM recorder). The
output of this recorder was fed back into the electroencephalograph and written on paper. These recording conditions provided control of the quality of the signal stored on magnetic tape as well as assessment of the subject’s level of alertness. Moreover, they facilitated the delivery of the stimulus at times when the EEG was free of artifact. The EEG was also fed into a digital computer (DEC Lab X/E with 32K core memory) for ‘on-line’ averaging using a sampling rate of 500 Hz and a sweep time of 500 msec. The averaged potentials were graphed by an incremental
plotter (Calcomp 565). The bandwidth of the amplifier-tape recorder system was 0.16-2500 Hz ( - 3 dB).

213
For final analysis, the EEG was filtered by an additional low-pass filter (24 dB/octave roll-off’) which reduced the high frequency response of the system to 100 Hz.
Analysis of evoked potentials Processing of EEG data involved digitization of epochs of analog record begin-
ning 50 msec before and ending 450 msec after stimulus onset using a sampling rate of 1 kHz. Individual digitized trials identified by their sequential numbers were stored in a disk (DEC RK05). Computer programs were developed to retrieve all trials obtained at the same stimulus level, calculate the geometric mean for each of the 500 data points, and graph and store the resulting average potential. Latencies of individual response components were measured from onset of stimulus artifact to peak. Peak amplitudes of individual waves were computed from a baseline which consisted of the arithmetic mean of the 50 values preceding the dental stimulus.
Power functions were fitted to the log transforms of the peak and peak-to-peak amplitudes of individual evoked potential components in a manner analogous to those utilized for the magnitude estimation data. They were expressed by the equation:
logE=logk, +Prlog(cp-%a) (equation 4)
where E was the evoked potential amplitude in uV, & the power function exponent, + the stimulus intensity in PA, Cpo the estimated sensation threshold in PA and k, a constant of proportionality. A special program made it possible to calculate the integral of the area under the wave form expressed as ‘root mean square’ (RMS) voltage from 60 to 450 msec after stimulus onset. In our records, negativity of the active electrode was displayed as an upward deflection. Evoked potential nomencla- ture was that suggested by Donchin et al. /29j.
Results
(A) Relations of magnitude estimates to stirnu~~ intensity Sensation thresholds estimated by the 2AFCS method varied in our subjects from
3.08 to 70.16 uA and the range of stimulus intensities was 15.92-35.92 dB SL (Table I).
The growth of subjectively estimated sensory magnitude with increasing intensity of electrical dental stimulus conformed to a power function. The exponents (g) of individual magnitude estimation functions varied from 0.204 to 0.907 with a mean of 0.475 and a standard deviation of 0.190. Individual power exponents and residual error of fit [49] are detaiied in Table I and magnitude estimation functions, best fitting lines, and power function exponents for each subject are displayed in Fig. 2, It should be noted that the magnitude estimation functions were calculated using 60-64 estimates at each stimulus intensity for all individuals except subjects 43 and 55. The former individual only p~tici~ated in 3 magnitude estimation runs because difficulties were experienced with the concurrent recording of cerebral evoked

j -@=0.204 0.251 0.327 0.332 0360 0.4tt 0.441 0.487 0.304 O.St6 0.571 0.671
z- s-
log Stimulus intensity, (li-+o
Fig. 2. Individual magnitude estimation functions, best fitting iines, and power function exponents of 14
subjects. To represent with a common scale estimates utilizing different numerical values. the ordinate
was divided into arbitrary units. Medians of individual magnitude estimation functions were aligned to
facilitate visual comparison. The divisions in the abscissa represent 10 dB intervals.
potentials. The latter subject did not feel, i.e., estimated as ‘zero,’ 27 of the last 30 stimuli presented at the lowest intensity (65 PA or 3.10 dB SL). Thus, in these two
persons, the exponents of magnitude estimation functions were calculated from 24 and 30 estimates, respectively.
TABLE I
SENSATION THRESHOLD, STIMULUS RANGE, EXPONENTS OF MAGNITUDE ESTIMATION
FUNCTION, AND RESIDUAL ERROR OF FIT 1N 14 SUBJECTS
Subject Sensation
number threshold (PA)
Stimulus range (dB SL) Exponents Error of fit
36 4.70 31.06 0.204 0.023
32 3.70 31.06 0.250 0.055
57 25.27 22.39 0.327 0.063
43 22.50 24.44 0.332 0.054
30 5.30 30.46 0.360 0.08 I 55 48.20 11.72 0.41 I 0.087
56 21.26 23.58 0.441 0.112
28 3.08 35.92 0.487 0.08 1
47 70.16 15.92 0.504 0.083
34 5.20 30.63 0.516 0.053
49 13.40 26.37 0.577 0.172
46 16.02 25.79 0.67 1 0.125
48 37.38 21.11 0.704 0.257
59 17.24 25.03 0.907 0.169
215
oO-+LA 8
Magnitude estimation runs
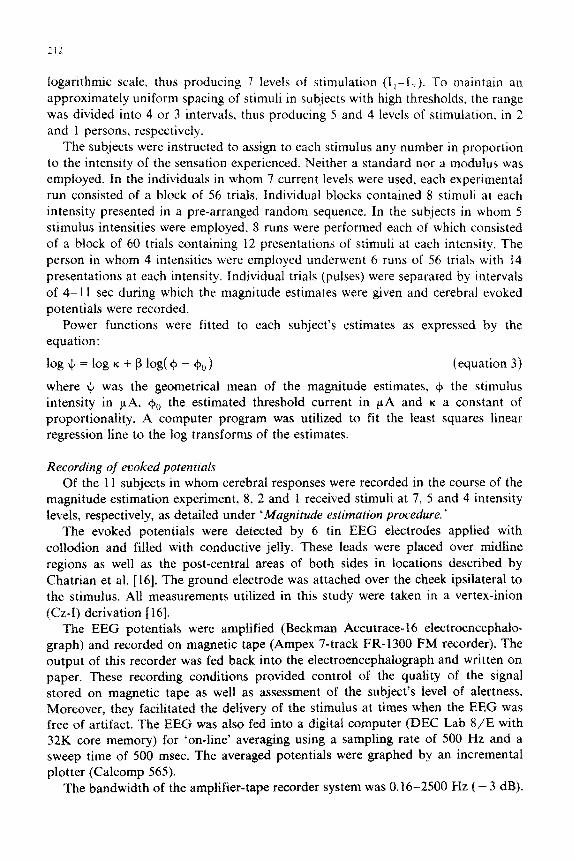
Fig. 3. Variations of magnitude estimates in successive experimental runs in one individual (S36).
25 I
Ic “0 .;E 20
$ ! C 15- 8 E
.u L
i IO-
& CT)
5-
16
14
13.
OO I I I I
2 4 6 8 Magnitude estimation runs
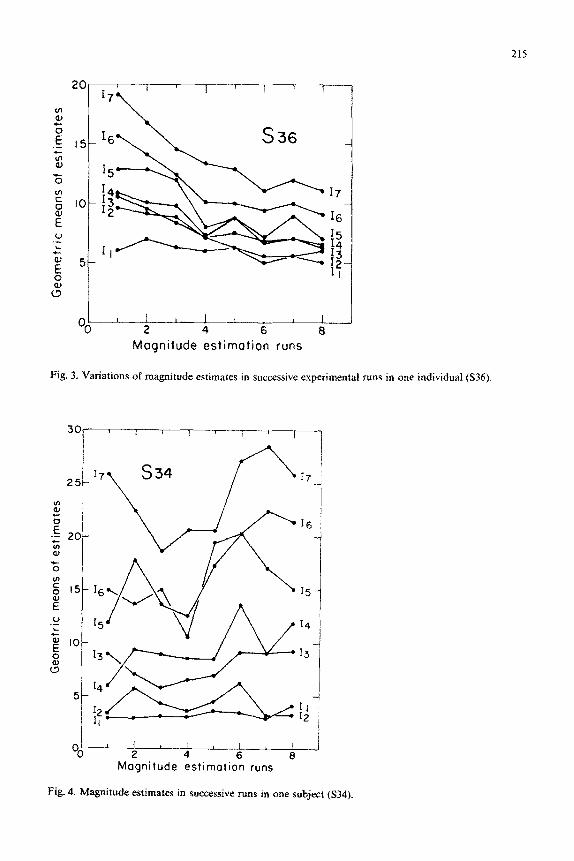
Fig. 4. Magnitude estimates in successive runs in one subject (S34).

Within the intensity range employed in our study, the magnitude estimation
functions were ‘smooth.’ i.e., did not display consistent, abrupt changes in their
slopes.
In 6 of 12 subjects in whom a sufficiently large number of estimates was collected,
these tended to decrease for all stimulus intensities during the second as compared to
the first part of the experimental day (Fig. 3). By contrast, in 4 individuals the
estimates tended to diminish during the first half and to increase during the second
half of the study (Fig. 4). The remaining 2 subjects gave fairly stable estimates. To
investigate the possibility that alterations of the preparation might have caused the observed changes in magnitude estimates, electrode impedances were measured
periodically throu~out the experiment. Their values were found to be stable as
indicated by coefficients of variation ranging from 0.6 to 4.4%. We also inquired into the reliability of our subjects’ scaling behavior by obtaining separate magnitude estimation functions for the first and second halves of the presentations at each
stimulus intensity and comparing the corresponding exponents and error of fit by means of the Wilcoxon’s signal rank test. NO systematic change in slope or goodness
of fit was found between the two parts of the experiment (Figs. 5 and 6).
(B) Relations of evoked potentids to stimulus intensity Cerebral tooth pulp-evoked potentials (TPEPs) recorded in a vertex-inion (&-I)
derivation consisted of a characteristic sequence of events. Following an earlier, inconstant negativity, a triphasic vertex-positive-negative-positive potential change
was detected (Fig. 7). Because in the group of subjects participating in this study the
log Stimulus intensity. $1-4~
Fig. 5. Magnitude estimation functions during the first (dots), and second (crbsses) halves of the
experiment in S36 (same as Fig. 3).
217
EF o1 - I .o 1.5 2.0 2.5 3.0
log Stimulus intensity, $I-#~
Fig. 6. Magnitude estimation functions during the first (dots), and second (crosses) halves of the
experiment in S34 (same as Fig. 4).
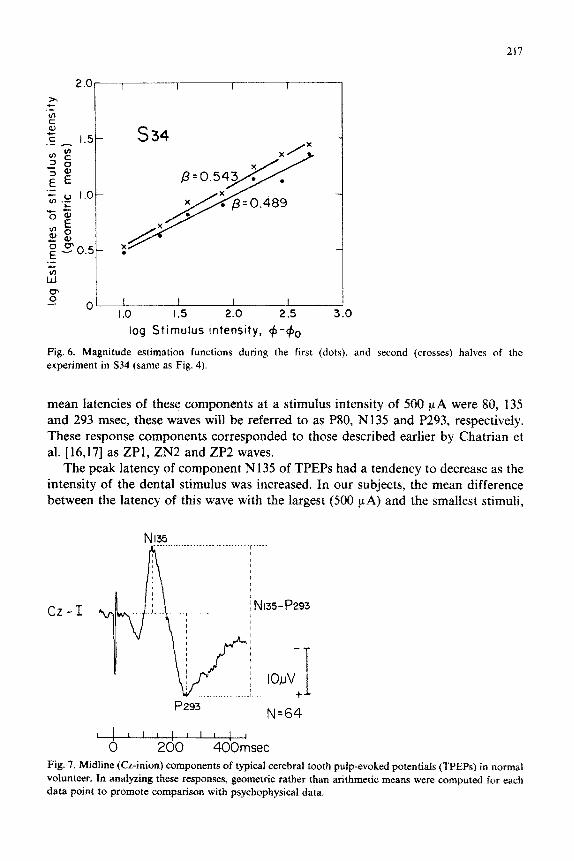
mean latencies of these components at a stimulus intensity of 500 ILA were 80, 135
and 293 msec, these waves will be referred to as P80, N135 and P293, respectively. These response components corresponded to those described earlier by Chatrian et al. [16,17] as ZPl, ZN2 and ZP2 waves.
The peak latency of component N 135 of TPEPs had a tendency to decrease as the intensity of the dental stimulus was increased. In our subjects, the mean difference between the latency of this wave with the largest (500 PA) and the smallest stimuli,
N135
n’.‘...--.----------..-...‘.: / I I
cz -1 . .1... _.... :~... ~ N’35-P2g3
p 4-1:-.._.. - i IO,uV + I
P293 N=64
Fig. 7. Midline (Cz-inion) components of typical cerebral tooth pulp-evoked potentials (TPEPs) in normal
volunteer. In analyzing these responses, geometric rather than arithmetic means were computed for each
data point to promote comparison with psychophysical data.

TABLE II
EXPONENTS OF TPEP AMPLITUDE-INTENSITY FUN(“I’IONS IN I1 SUBJECTS -._-..__-- ------ - .._ .__ ---... _-_____ .._._ ._.-.~_~-.-._~_
Subject Nl35 P293 N 135-P293 RMS number amplitude amplitude amplitude value
---~-
30 0.170 0.024 O.OYX
32 0.180 0.078 0.076 34 0.169 0.190 0.113
36 0.07 I Il. 105 0.105
56 0.004 0.101 0.065
57 0.008 0.104 0.064 5’) 0.117 0.362 0.344
55 0.270 0.314 0.302
48 0.180 0.250 0.229 41 0.057 0.053 0.055
28 0.260 0.002 0.1 18
O.OXY
0.078
0. I30
0. I45
O.lZl
0.034
0.332
0.320
0.22 I 0.113
Mean 0.135 0.143 0.144 0.158
SD. 0.09 I 0.119 0.100 0.100
respectively, was - 7.3 + 5.94 msec. This difference was statistically significant (Wilcoxon’s signal rank test Ws = 1, P < 0.02). The latency of wave P293 also
decreased with increasing stimulus intensity in the majority of subjects, but this change was not statistically significant (Ws = - 9, P > 0.05).
The peak voltage of wave P80 did not vary systematically with the intensity of stimulation. By contrast, the peak amplitudes of waves N135 and P293 and the
N 135-P293 peak-to-peak amplitude displayed highly significant relationships to
TABLE III
RESIDUAL ERROR OF FIT OF TPEP AMPLITUDE-INTENSITY FUNCTIONS IN I I SUBJECTS
Subject
number
Nl35
amplitude
P293
amplitude
N I35-P293
amplitude
RMS
value
30 0.093 0.025 0.038
32 0.080 0.015 0.023
34 0.027 0.043 0.030
36 0.096 0.048 0.036
56 0.084 0.024 0.041
57 0.032 0.044 0.03 1
59 0.132 0.018 0.04 I 55 0.090 0.029 0.036
48 0.075 0.018 0.036
47 0.040 0.022 0.018
28 0.035 0.040 0.024
0.032
0.020
0.032
0.043
0.025
0.023
II.05 I
0.033
0.044
0.019
Mean 0.07 I 0.029 0.03 I 0.032
S.D. 0.033 0.011 0.008 0.0 10

219
A Physml Intensity (dBSL)
346
2+6
18.3
92
534
3
Ptlyslcol lrlensity (dBSL)
292
24.0
Fig. 8. Variations of midline components of TPEPs with increasing stimuius intensity in 2 subjects
undergoing simultaneous evoked potential and magnitude estimation experiments.
stimulus strength (Tables II and III and Figs. 8 and 9). The growth of these voltages with increasing intensity of dental excitation conformed to a power function. The mean exponents computed across subjects for the peak amplitudes of N135 and P293 were comparable (0.135 and 0.144, respectively). However, the residual error of fit (351 was somewhat larger for N135 than for P293 (ts = 5.1, P c 0.002, two-tailed).

i@=O.OSS 0.064 0.065 0.076 0.098 0.105 0.113 t
0.118 0.229 0.302 6.362 -I
II-l_1_LlL.I LLLLL-8 I I * 3 / 18 8 I J L * I I * ‘ I I* 18 I t / 3 I L J
log Stimulus intensity, +-+e
Fig. 9. Individual TPEP amplitude-intensity functions (N 135-P293). best fittmg lines. and power function
exponents of 11 subjects Divisions in the ordinate and abscissa are relative log units. In this figure as well
as Fig. 5, the medians of TPEP amplitude-intensity functions were aligned to facilitate visual comparison.
In 3 individuals, the exponents describing the growth of the N13.S amplitude were substantially larger than those of the P293 component, whereas in 5 subjects the opposite was true. In the remaining 3 volunteers, differences between the two
exponents were small. Hence, the N135-P293 peak-to-peak amplitude provided the most satisfactory measure of growth of TPEP amplitude with increasing stimulus intensity for the whole group. Individual N135P293 amplitude-intensity functions,
best fitting lines and power function exponents are depicted in Fig. 9. The exponents ranged from 0.055 to 0.362 with a mean of 0.144 and a standard deviation of 0.100 (Table II). The exponents and goodness of fit of the power functions computed for
TABLE IV
EXPONENTS OF TPEP AMPLITUDE-INTENSITY AND MAGNITUDE ESTIMATION POWER
FUNCTIONS IN II SUBJECTS -.
Subject T PEP amplitude- Magnitude estimation
number intensity functions functions --
28 0.11x 0.44 I
30 0.098 0.360
32 0.076 0.25 I
34 0.113 0.516
36 0.105 0.204
47 0.055 0.504
4x 0.250 0.704
5s 0.302 0.41 I
56 0.065 0.44 I
57 0.064 0.327
49 0.362 0.907
Mean 0.144 0.475
S.D. 0.100 0.190

221
(d8SL)
25,s
t 4.6
7.2
0 200 400 s57
- 4OOmsec
Fig. 10. fndividuai TPEPs obtained in one in~~dna~ (S57) by averaging potentials elicited by identical intensities of physical stimulus (A) and responses associated with identical subjective estimate irrespective of stimulus intensity (B).
the area under the wave form, expressed as RMS voltage, were similar to those obtained using the N135-P293 amplitudes (Table III). Thus, RMS voltages did not provide a better description of growth of evoked potential magnitude with increasing stimulus intensity.

EXPONENTS FOUND AND EXPI:(‘ft:D AND RESID~JAL ERROR OF FIT OF POWER FUNC’-
TIONS KELAI‘INCi I’PEI’ AMPLlTlJDE AND SUBJEC‘TIVE SENSORY MA~;NlTlJl~E IN 1 I
SC!HJE<‘TS -. - -- ..---._ --.- ^._. --.._.__. -.._ ~~~~~__~_~_,~__~~ -.._ -_..._
Subject Exponent found Enponent expzcted Error <>f fll number
36 0.489 0.517 0.064 34 0.174 0.2 18 0.027 3’ 0.226 0.330 KU45 30 0.205 0.272 0.037 57 0.233 0.196 0.0 17 59 0.506 0.339 0.036 4x 0.237 0.355 0.039 47 0.114 u. 109 0.025
55 0.593 0.734 0.02 I
56 0.282 0.147 0.024
Mean 0.300 0.32 t 0.033
S.D. 0.155 0.186 0.014
(C) Relations of magnitude estimates to evoked potential amplitudes
The exponents of individual N 135-P293 amplitude-intensity functions were con- sistently smaller than those of concurrently obtained magnitude estimation functions (Table IV).
Because both the psychophysical estimates and the specified evoked potential amplitudes conformed to a power function, a power function relationship was predicted to exist between these measures as indicated by the following equation:
(equation 5)
where E was the evoked potentiaf amplitude, 4 was the psychological estimate of sensory magnitude, K, and Kz were constants, and B, and Bz were the exponents of
the power functions of the magnitude estimates and of the TPEP amplitudes,
respectively. To test the correctness of this prediction, we averaged for each subject all trials in which identical magnitude estimates were given, irrespective of the
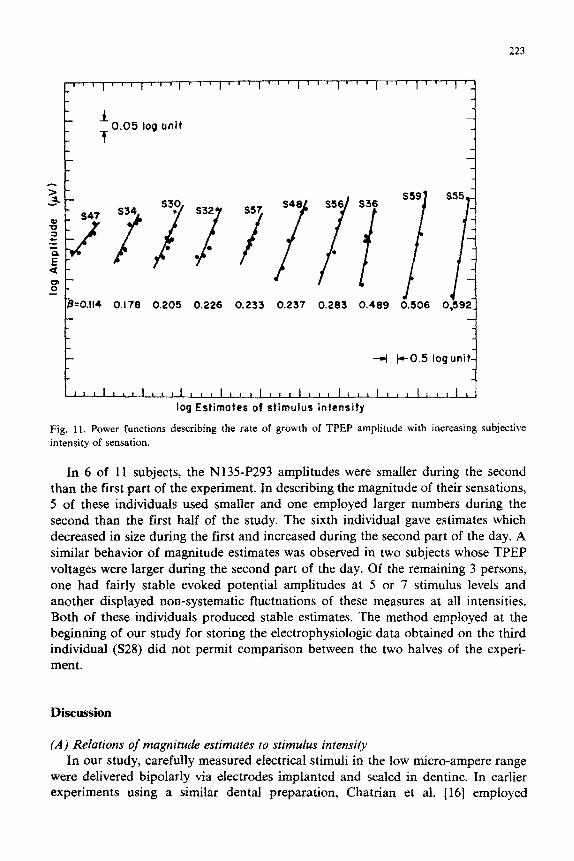
physical intensity of the stimulus employed. Depending on how often each number was used by a given subject, each average was the result of lo-100 trials. Fig. 10 displays TPEPs obtained in one individual (S57) by averaging the responses elicited by identical intensities of physical stimulus (A) and compares them to those produced by averaging trials associated with identical magnitude estimates (B). The rate of growth of the N135-P293 amplitudes with increasing subjective intensity of sensation conformed to a power function (Fig. 1 I). The exponents of this function were of the same order of magnitude as those predicted on the basis of equation 4 (Table V). Moreover, the residual error of fit was comparable for both functions (Tables III and IV).
223
f 0.05 log unit
~~~~~,~,~ ~~
s34 s3,o
S32 SS7 S46 S56 S36
ss9 S55
. . . l
'B=0.114 O.lt8 0.205 0.226 0.233 0.237 0.283 0.469 0.506 0,592_
--I p-O.5 logunit-
11*I11,I,,1I,,, ,,, *,, ‘,, ,r,l,l,/,,t ,
log Estimates of stimulus intensity
Fig. 11. Power functions describing the rate of growth of TPEP amplitude with increasing subjective
intensity of sensation.
In 6 of 11 subjects, the N135-P293 amplitudes were smaller during the second than the first part of the experiment. In describing the magnitude of their sensations, 5 of these indi~duals used smaller and one employed larger numbers during the second than the first half of the study. The sixth individual gave estimates which decreased in size during the first and increased during the second part of the day. A similar behavior of magnitude estimates was observed in two subjects whose TPEP voltages were larger during the second part of the day. Of the remaining 3 persons, one had fairly stable evoked potential amplitudes at 5 or 7 stimulus levels and another displayed non-systematic fluctuations of these measures at all intensities. Both of these individuals produced stable estimates. The method employed at the beginning of our study for storing the electrophysiologic data obtained on the third individual (S28) did not permit comparison between the two halves of the experi- ment.
(A) Relations of magnitude estimates to stimulus intensity In our study, carefully measured electrical stimuli in the low micro-ampere range
were delivered bipolarly via electrodes implanted and sealed in dentine. In earlier experiments using a similar dental preparation, Chatrian et al. [16] employed
electrical pulses which exceeded in intensity our stimuli. These excitations were
applied to a guttapercha-filled tooth of a normal individual and a tooth of a subject
who was congenitally insensitive to noxious stimuli but had preservation of other
sensations, including touch. pressure and movement of teeth. In these circumstances, neither reports of any sensations nor cerebral potentials were elicited by pulpal
stimulation. These results indicated that no significant spread of current to peri-
odontal or gingival tissues occurred in these authors’ ~xperin~~nta~ conditions. in our study, the chances of spread of the stimulus outside the pulp chamber were further
reduced by the use of smaller currents as well as improvements of the dental preparation. Thus, we feit confident that the sensory experiences we investigated
were generated by excitation of tooth pulp afferents without significant contamina- tion by sensations arising in periodontal and gingival tissues,
Our work demonstrated that in the circumstances of our experiment, the growth of sensations arising from electrical stimulation of tooth pulp conformed to the
general psychophysical power law [73]. This finding was in keeping with results obtained by Gracely [38] and Gracely et al. [39--.41] with electrical stimulation of the
external surface of teeth. These authors reported that quantified verbal descriptor values of either sensory intensity or unpleasantness of the dental stimulus were
power functions of physical stimulus intensity. A similar relationship was demon-
strated by Gracely 1381 and Heft et al. [43] between quantified verbal descriptor
values of sensory intensity or unpleasantness of an acute ‘natural’ thermal stimulus {application of chloride spray to exposed dentine) or of sensory intensity of chronic clinical pain (due to oro-facial pain syndro~~es~ and the intensity of an electrical dental stimulus directly matched to either type of pain.
In our study, individual power function exponents varied from 0.203 to 0.907 with a mean of 0.475. We believe that the size of these exponents reflects procedural variables more than inherent properties of the tooth pulp sensory system. Hence, we
do not regard them as invariant, universal values for sensations elicited by electrical tooth pulp excitation. It has been shown that the outcome of tnagnitude estimation experiments is influenced by a variety of factors including: the range of stimuli; the spacing of stimuli within the range; the location of the threshold relative to the
range; the position of the first stimulus within the range: the use of a modulus and
its size: the subject”s use of numbers; the temporal spacing of stimuli; the situational context; and, the subject’s learning and actual experience with magnitude estimation [SS]. Moreover, the utilization of magnitude estimation or magnitude pr(~du~tion
procedures [69] and the use of single, brief electrical pulses or repetitive stimulations of long duration have been found to influence the results of experiments estimating the magnitude of sensations elicited by electrical stimulation of skin. Long-lasting (O.l&-1.72 set) reiterative (50-60 Hz) stimulation yielded exponents OF 1.32 [23]; 1.54 [31,32]; 1.25-2.6X [69]: and, 3.5 [72]. By contrast. short single pulses (0.5 msec) produced exponents of 0.70 [6.57]. Rosner and Gaff 1571 replicated the experimental conditions of Stevens et al. [72] who had used repetitive as well as single pulses to
stimulate two fingers immersed in saline and found that long-lasting. reiterative excitation produced faster rates of growth of sensation than did single pulses. They speculated that repetitive pulses recruited smaller diameter fibers more rapidly than

225
did single pulses and expressed the belief that this effect accounted for a larger
exponent of the power function. Recognizing that the psychophysical functions obtained from any one magnitude
estimation experiment are influenced by the experimental circumstances in which
they are obtained, care was taken in designing our experiment to establish conditions
under which reasonable control was exerted over certain variables. Our protocol
included estimation of the sensation threshold by the 2AFCS method. Thus, the
relation of threshold to range was well known in each subject. The largest permissi-
ble intensity range was used in each individual. Neither standard nor modulus were
employed. Moreover, only naive subjects were studied and all data were obtained in
the course of a single session. We hope that the use in a defined experimental context of a magnitude estimation procedure conforming to accepted standards [52] will facilitate comparison with past and future works. No such comparison was possible with the work of Gracely [38] and Gracely et al. [39-413 and Heft et al. [43] in which no information was given on the slopes of the magnitude-intensity
functions. In a significant proportion of individuals, the size of magnitude estimates
systematically changed during the experimental day in the absence of measurable alterations of the preparation as well as of any evidence of unreliability of our
subjects’ scaling behavior. About half of these subjects displayed variations of N 135P293 evoked potential amplitudes that were comparable to those of subjective
estimates. The causes of these systematic changes during the experimental day are
unclear. However, it is imperative that this phenomenon be taken into consideration
when designing investigations in which subjective estimates of sensory magnitude, evoked potential amplitudes, or both, are utilized as measures of the efficacy of pharmacological agents or of other therapeutic actions.
(23) Late midline components of cerebral evoked potentials: postulated neural generators In our experiments, all stimuli were suprathreshold, task-relevant and occurred at
unpredictable intervals and intensities. Under these conditions, two types of late midline evoked potentials are commonly observed in humans irrespective of sensory
modality: (1) a diphasic negative-positive ‘vertex potential’ [4,25] and (2) a ‘late positive P3 or P300 wave’ [76].
The latency and topography of the N135 wave demonstrated in our experiments were analogous to those of the N 140 components of the vertex potential reported by
others with peripheral nerve stimulation [35]. Evidence was adduced that this component depended on a wide variety of stimulus parameters as well as on
psychological variables related to cognitive processes ]28,36,45,60]. An interesting study of Schwent et al. 1601 suggested that stimulus intensity was a crucial factor in
determining the degree of change of the vertex potential with shifts of attention. The features of the P293 wave detected in our experimental conditions suggest
that this potential may be generated by two partly overlapping events: the positive component of the vertex wave and a P300 task-related potential. The latter is believed to be relatively independent of stimulus parameters such as intensity [2&45] and has been shown to be generated even by omitted, expected, task-relevant stimuli
j50.54.65.77]. H~wevtx, observations by Desmedt et al. j26j suggest that in certain
experimental conditions. stimulus intensity may influence this late potential. The neural generators of the vertex components of human evoked potentials are
still unknown. Because the t~~p~)graphy of thcae wave5 is similar for all sensory
modalities, some investigators have suggested that they are generated in non-specific
cortical areas receiving input from diffusely projecting thalamic nuclei [37,5X]. By
contrast, Williamson et al. [84] postulated that the entire somatosenxory response of humans depended on the integrity of the lemniscal system and of the primary
sensory cortex. Epidural and intracorticai recordings ted Arezzo et al. (31 to believe
that the late waves of the somatosensory evoked potential of monkeys were gener- ated widely within the somesthetic areas of the post-central cortex. However,
recordings of Papakostopoul~~~ and Crow 1531 utilizing subdural electrodes in
humans demonstrated late somatosensory evoked potential simultaneously occurring in both the prefrontal cortex and the cortex surrounding the central sulcus. These
two components could be separated from each other by varying the conditions of stimulation. These last findings add strength to the belief that the concepts of ‘specific’ and ‘non-specific’ origins of late midline components of human evoked potentials need not be mutually exclusive [24]. In keeping with this notion. experi-
mental evidence has been obtained in animals which suggests multiple. parallel input from tooth pulp afferents to thalamus and cortex [1.2.63,64.81,X5].
The origin of the P300 component of human cerebral evoked potentials is uncertain. Evidence has been presented in recent years that this response is com- pounded of multiple temporally and spatially overlapping potentials that can be partly separated only by special experimental strategies [44.45,&S]. The exact topog- raphy and intracranial sources of these individual components have not been
determined and animal models of this response are lacking. Earlier results by Chatrian et al. (161 suggested that widespread neural activity from frontal and
parietal cortices contributed to the generation of the ZN2 and ZP2 (our N13S and
P293) midline components of TPEPs.
Our work demonstrated that the latency of the N135 midline component of human TPEPs was s~gnifi~antiy and inversely related to physical stimulus intensity. This finding was in keeping with observations of Carmon et al. [ 141 on the potentials elicited by noxious thermal stimuli to skin but was in conflict with results subse- quently obtained in the same laboratory [ 121. Of special relevance to our work was
the observation by Chen et al. [al] and.Chapman et al. f 15] that the latencies of midline response to electrical stimulation of the dental surface were independent of the strength of excitation. These authors confined their observations to stimulus levels producing painful sensations and utilized stimulus ranges substantially nar- rower than ours. These differences as well as dissimilarjties in stimulation and recording techniques may have been responsible for their failure to detect -the latency-intensity effects demonstrated by our studies.
227
Our finding that the N13SP293 amplitudes of midline TPEPs were power
functions of physical stimulus intensity was in keeping with results obtained by
others [6,34,48,57,82], using electrical or mechanical stimulation of skin. Studies
utilizing indirect scaling procedures also demonstrated a monotonic relationship between stimulus strength and late components of cerebral response to cutaneous
indentation ]47] or electrical stimulation [ IO,1 1,511. The slopes of the Nl30 ampli- tude-intensity functions computed by Buchsbaum et al. [IO] ranged from 0.06 to 0.74. In a subsequent work of Buchsbaum et al. [ 1 I], these values varied between
0.65 and 3.13 in young and between 0.49 and 3.21 in middle-aged, individuals. In our studies, the exponents of the power functions describing the growth of
evoked potential amplitudes with increasing strength of pulpal stimulus (0.055-0.362) were smaller than those computed for the subjective magnitude estimates (0.203-0.907). This result was in keeping with the slower rates of growth of
el~trophysiolo~cal than of psychophysical measures reported by others with electri-
cal cutaneous excitation [6,57,82]. Because both the psychological estimates of sensory magnitude and the N 13SP293
amplitudes of midline TPEPs were power functions of physical stimulus intensity, a
third power function relating TPEP amplitudes and subjective estimates was ex-
pected to exist 1571. This expected relationship was verified in our subjects. Relations
among late midline components of human cerebral evoked potentials, stimulus intensities and sensory magnitudes also were reported by several investigators including Hillyard et a.1. [46] and Squires et al. 1671. Of special relevance to our work
were the results of Barrett et al. [S] who found that both stimulus intensity and decision criterion influenced the amplitudes of somatosensory evoked potentials measured between their N150 and P300 vertex components.
Some authors gave special consideration to the painfulness of the sensations experienced by their subjects. Carmon et al. [14] found a significant relationship between the amplitude of a negative-positive component culminating 130- 160 msec after a noxious thermal stimulus to skin and subjective pain sensations. The latency of the negative potential was correlated to stimulus strength. When the excitation
produced only a sensation of warmth, no evoked potentials could be detected. These responses were interpreted as indicators of cerebral ‘arousal’ due to pain. Subse-
quently, Carmon et al. [12] reported that the amplitude of a positive potential peaking at 370-390 msec was relatively independent of stimulus intensity whereas it
correlated with qualitative and quantitative aspects of the verbal report of pain. In a
more recent single-trial analysis of these cerebral responses, Carmon et al. [13] described linear correlations among magnitude (RMS value) of the P200-N300-P400 complex, stimulus strength and subjective pain response. Partial correlations re- vealed a much stronger relationship between cerebral and subjective responses than between evoked potentials and electrical stimulus intensity. These authors suggested that the stated cerebral response components measured ‘neural events in the pain perception process rather than transduction and transmission of the stimulus event.’ Similarly, Stowell[74] found that a positive complex peaking at 170-290 msec was a monotonic function of psychophysical estimates of painfulness rather than of physical parameters of percutaneous electrical stimulation.

Other investigators utilized m their studies electrical stimuli delivered to the dental surface. Harkins and Chapman 1421 reported that the amplitude of several
components of the midline response to the same stimulus (PlOO-N 175. N 175P260
and P260-N350) were &nearly related to physical stimulus intensity as weI] as
subjective pain ratings. No responses could be resolved when the sensations elicited
consisted only of ‘very faint’ or ‘pre-pain’ sensations. In a later study, Chrn et al.
[21] applied partial correlations and determined that the amplitude of the earlier
potentials (N65-Pl20 and P~Z{)-Nl75) was closely related to stimulus intensity whereas the voltage of later waves (N175-P260 and P260-N340) correlated with
subjective painfulness. Their data suggested that the former components coded ‘information about intensity of external stimulation whereas the latter waves reflected ‘association processes involved in evaluation of the noxious stimulus.’
Recently, Bromm and Scharein f7] reported that averaged cerebral responses to electrical and mechanical stimuli to the skin of the middle finger did not display any
wave forms specifically related to the experience of pain. However, principal component analysis of single trial evoked potentials demonstrated two independent components with latencies of 140-160 and 280-360 msec. respectively, which discriminated between painful and painless sensations and were therefore
characterized as ‘pain-related components.’ Moreover. the work of Buchsbaum et al. [I l] suggested that the slopes of amplitude-intensity functions of the Ni20 compo-
nent of the averaged response to electrical excitation of the skin of the forearm appeared to be more closely related to the ‘insensitivity’ than to the ‘response
criterion’ measured in a psychophysical experiment performed prior to the electro-
physiological study [IO]. The sensations experienced by our subjects evolved from ‘innocuous’ to ’ uncom-
fortable’ to ‘painful’ at progressively higher levels of pulpal excitation [20]. These modifications of the quality of sensation were unacconlpanied by abrupt changes in slope of individual magnitude estimation and TPEP amplitude-intensity functions such as might accompany transition from one underlying sensory mechanism to
another. This finding strengthened our belief that in our experiments the stimulus remained confined to tooth pulp afferents and did not spread to larger diameter periodontal and gingival fibers. Moreover, no visually discernible changes in TPEP wave form were observed as stimulus strength was increased. Hence. late midline
components of tooth pulp evoked potentials may provide measures of central events which, within a range of stimulus intensity. are associated with the perception of pain [16], but should not be looked upon as specific indicators of pain processes.
We believe that our work adequately demonstrates that the sensations arising
from tooth pulp obey the power law described by Stevens and Calanter [73]. The lawful behavior of these sensory responses indicates that, although highly specialized
both morphologically and functionally, tooth pulp has certain fundamental proper- ties in common with other sensory systems. The demonstration that the amplitudes of some cerebral potentials evoked by dental excitation display a similar behavior adds support to this concept. These observations provide additional means of
investigating tooth pulp sensation.

229
Acknowledgements
This work was supported in part by Grants DEO-3485 to Dr. G.E. Chatrian, DEO-2600 to the Center for Research in Oral Biology, and Biomedical Research
Support Grant No. 207 RR 05346 to the School of Dentistry, University of Washington, from the United States Public Health Service, National Institutes of
Health, Department of Health and Human Services. During her graduate studies the first author received a scholarship from the Conselho National de Desenvolvimento
Scientific0 e Technologico (CNPq) of Brazil. We wish to thank Professor Richard M. Rose for his suggestions and criticisms.
References
1 Albe-Fessard, D., Nashold, B., Pollin, B. and Woda, A., Thalamic and mid-brain responses to dental
pulp afferent messages in awake cats. In: Proc. Symposium on Neural Mechanisms of Pain,
Smolenice, Czechoslovakia, 10-I 1 September 1976, J. Physiol. (Paris), 73 (1977) 379-386.
2 Andersson, S.A., Keller, 0. and Vyklicky, L., Cortical activity evoked from tooth pulp afferents, Brain
Res., 50 (1973) 473-475.
3 Arezzo, J.C., Vaughan, H.G. and Legat, A.D., Topography and intracranial sources of somatosensory
evoked potentials in the monkey. II. Cortical components, Electroenceph. clin. Neurophysiol., 51
(1981) l-18.
4 Bancaud, J., Bloch, V. et ,Paillard, J., Contribution EEG a I’etude des potentiels Cvoques chez l’homme
au niveau du vertex, Rev. neurol., 89 (1953) 399-418.
5 Barrett, G., Halliday, A.M., Halliday, E. and Rudolf, N. deM., The later components of the
somatosensory evoked potentials and the P300 in a threshold detection task, Prog. clin. Neurophysiol.,
6 (1979) 140-150.
6 Beck, C. and Rosner, B.S., Magnitude scales and somatic evoked potentials to percutaneous electrical
stimulation, Physiol. Behav., 3 (1968) 947-953.
7 Bromm, B. and Scharein, E., Principal component analysis of pain-related cerebral potentials to
mechanical and electrical stimulation in man, Electroenceph. clin. Neurophysiol., 53 (1982) 94- 103.
8 Broughton, J.R., Somatosensory Evoked Potentials in Man, Doctoral dissertation, McGill University,
Montreal, 1967, 144 pp.
9 Buchsbaum, M.S. and Davis, G.C., Application of somatosensory event related potentials to experi- mental pain and the pharmacology of analgesia. In: D. Lehmann and E. Callaway (Eds.), Human
Evoked Potentials: Applications and Problems, Plenum Press, New York, 1979, pp. 43-54.
IO Buchsbaum, MS., Davis, G.C., Coppola, R. and Naber, R., Opiate pharmacology and individual
differences. I. Psychophysical pain measurements, Pain, 10 (1981) 357-366.
11 Buchsbaum, MS., Davis, G.C., Coppola, R. and Naber, R., Opiate pharmacology and individual
differences. II. Somatosensory evoked potentials, Pain, 10 (1981) 367-377.
12 Carmon, A., Dotan, Y. and Sarne, Y., Correlation of subjective pain experience with cerebral evoked
responses to noxious thermal stimulations, Exp. Brain Res., 33 (1978) 445-453.
I3 Carmon, A., Friedman, Y., Coger, R. and Kenton, B., Single trial analysis of evoked potentials to
noxious thermal stimulation in man, Pain, 8 (1980) 21-32.
14 Carmon, A., Mor, J. and Goldberg, J., Evoked cerebral responses to noxious thermal stimuli in
humans, Exp. Brain Res., 25 (1976) 103-107.
I5 Chapman, R.C., Chen, A.C.N. and Harkins, S.W., Brain evoked potentials as correlates of laboratory pain: a review and perspective, Adv. Pain Res. Ther., 3 (1979) 791-803.
16 Chatrian, G.E., Canfield, R.C., Knauss, T.A. and Lettich, E., Responses of the human brain to
electrical stimulation of tooth pulp, Neurology (Minneap.), 25 (1975) 745-757.
I7 Chatrian, G.E., Canfield, R.C., Lettich, E. and Black, R.G., Responses of the human brain to electrical stimulation of tooth pulp, J. dent. Res., 58 (1974) 1299.

230
1X Chatrian. G.E.. Canfield. R.C’.. Lettich. I:.. Miller. R.C’. and Soso, M.. Sensation thresholds for electrical stimulati~~n of tooth pulp via ~ntradentil~ai electrodes in humans, A study utilixing the
two-alternative forced-choice staircase method, in preparation,
19 Chatrian, G.E., Farrell, D.F.. Canfield, R.C. and Lettich. I?.. Congenital insensitivity t(\ noxious
stimuli, Arch. Neurol. (Chic.), 32 (1975) 141-145.
20 Charrian, GE., Fernandes de Lima, V.M., Lettich, E., Canfield, R.C., Miller, R.C. and Soso, M.J.,
Electrical stimulal~on of tooth pulp in humans. 11. Qualities of sensations, Pain. 14 (1982) 233-246.
21 Chen. A.C.N., Chapman, R.C. and Harkins, S.W.. Brain evoked potentials are Functional correlates of
induced pain in man, Pain, 6 (1979) 365--374,
22 Cornsweet. T.M., The staircase method in psychophysics. Amer. J. Psychol., 75 (1962) 4851-491.
23 Craig, K.D., Best, II. and Ward. L.M., Social modeiling influences on psychophysical Judgments of
electrical stimulation, J. abnorm. Psychol., X4 (1975) 3% 373.
24 Davis. H.. Osterhammel. P.A.. Wier. C.C. and Gjerdingen. D.B.. Slow vertex potentials: interactions
among auditory. tactile. electric and visual stimuli, Electroenceph. clin. Neurophysi~l,. 33 (1972)
537-545.
25 Davis, P.A.. Effects of acoustic stimuli on the waking human brain, J. Neurophysiol.. 2 (1939)
494-499,
26 Desmedt, J.E.. Robertson. D., Brunko, E. and Debecker, J., Somatosensory decision tasks in man:
early and late components of the cerebral potentials evoked by stimulation of different fingers in
random sequences, Electroenceph. clin. Neurophysiol., 43 (1977) 403-414.
27 Domino, E.F., Matsuoka. S.. Waltz. J. and Cooper, I., Simultaneous recordings of scalp and epidural
somato~nsory evoked responses in man, Science, 145 (1964) 1199- 1200.
28 Donald, M.W.. Limits on current theories of transient evoked potentials. Prog. clin. Neur~~physioi.. 6
(1979) 1x7--199.
29 Donchin, E., Callaway, I?.. Cooper. R., Desmedt, J.E., Gaff. W.R., Hillyard, S.A. and Sutton, S..
Publication criteria for studies of evoked potentials (EP) in man. Report of a committee. Prog. clin.
Neurophysiol.. 1 (1977) I - 12.
30 Ekman. G., Subjective Power Functions and the Method of Fractionation. Report from the Psycho-
logical Laboratory, University of Stockholm. 1956, No. 34 (cited by Marks 1974).
31 Ekman, G., Frankenhaeuser, M.. Levander, S. and I&his, I., Scales of UIlpleasantness of electrical
stimulation, Stand. J. Psychol., 5 (1964) 257-261.
32 Ekman. G., Frankenhaeuser, M.. Levander, S. and Mellis, 1.. The influence of intensity and duration
of electrical stimulation on subjective variables, Stand. J. Psychol., 7 (1966) 5X-64.
33 Fernandes de Lima. V.M.. Relationships among Intensities of Electrical Stimulation of Tooth Pulp,
Subjective Estimates of Sensory Magnitude and Objective Measures of Cerebral Evoked Potentials.
Doctoral dissertation. University of Washington, Seattle. Wash., 1981, I12 pp.
34 Franz&n, 0. and Offenloch, K.. Evoked response correlates of psychophysical magnitude estimates for
tactile stimulation in man, Exp. Brain Res., 8 (1969) l--. 18.
35 Goff, G.D., Matsumiya. Y., Allison. T. and Goff, W.R., The scalp topography of human somato-
sensory and auditory evoked potentials, Electroenceph. chn. Neurophysiot., 43 (1977) 57-76.
36 Gaff, W.R., Allison, T. and Vaughan, H.G., The functional neuroanatomy of event related potentials.
In: E. Callaway, P. Tueting and S. Koslow (Eds.). Event-Related Brain Potentials in Man. Academic
Press, New York, 1978, pp. I-80.
37 Goff. W.R., Rosner. B.S. and Allison. T., Distribution of cerebral somatosensory evoked responses in
normal man, Electroenceph. clin. Neurophysiol., 14 (1962) 697-713.
38 Gracely, R.H., Psychophysical assessment of human pain. In: J.J. Bonica, J.E. Liebeskind and D.
Albe-Fessard (Eds.). Advances in Pain Research and Therapy. Vol. 3. Raven Press. New York. 1979,
pp. 805-824. 39 Gracely, R.H.. Dubner, R.. McGrath, P. and Heft, M., New methods of pain measurement and their
application to pain controi, Int. dent. J., 28 (1978) 52-65. 40 Gracely, R.H.. McGrath, P. and Dubner, R.. Ratio scales of sensory and affective verbal pain
descriptors. Pain. 5 (1978) 5-18. 41 Gracely, R.H., McGrath, P. and Dubner, R., Validity and sensitivity of ratio scales of sensory and
affective verbal pain descriptors: manipuIation of affect by diazepam. Pain, 5 (‘1978) 19-29.

231
42 Harkins, S.W. and Chapman, C.R., Cerebral evoked potentials to noxious dental stimulation:
relationship to subjective pain report, Psychophysiology, 15 (1978) 248-252.
43 Heft, M.W., Gracely, R.H., Dubner, R. and McGrath, P.A., A validation model for verbal descriptor
scaling of human clinical pain, Pain, 9 (1980) 367-373.
44 Hillyard, S.A., Courchese, E., Kraig, H.I. and Picton, T.W., Scalp topography of the P3 wave in
different auditory decision tasks. In: W.C. McCallum and J.R. Knott (Eds.), The Responsive Brain,
Wright, Bristol, 1976, pp. 81-87. 45 Hillyard, S.A. and Picton, T.W., Event-related brain potentials and selective information processing in
man, Prog. clin. Neurophysiol., 6 (1979) l-52.
46 Hillyard, S., Squires, K., Bauer, J. and Lindsay, P., Evoked potential correlates of auditory signal
detec,ion, Science, 172 (197 1) 1357- 1360.
47 Johnson, D., Jtirgens, R., Kongehl, G. and Kornhuber, H.H., Somatosensory evoked potentials and
magnitude of perception, Exp. Brain Res., 22 (1975) 331-334.
48 Keidel, W.D., Electrophysiology of vibratory perception, Contrib. sens. Physiol., 3 (1968) l-74.
49 Kenton, B., A critique of neurophysiological-psychophysical correlations. In: B.L. Crue (Ed.), Pain.
Research and Treatment, Academic Press, New York, 1975, pp. 127-149.
50 Klinke, R., Fruhstorfer, H. and Finkenzeller, P., Evoked responses as a function of external and stored
information, Electroenceph. clin. Neurophysiol., 25 (1968) 119-122.
5 1 Lavine, R., Buchsbaum, M.S. and Poncy, M., Auditory analgesia: somatosensory evoked response and
subjective pain rating, Psychophysiology, 13 (1976) l40- 148.
52 Marks, L.E., Sensory Processes. The New Psychophysics. Academic Press, New York, 1974, 344 pp.
53 Papakostopoulos, D. and Crow, H.J., Direct recordings of the somatosensory evoked potentials from
the cerebral cortex of man and the difference between precentral and postcentral potentials, Prog. clin.
Neurophysiol., 7 (1980) 15-26.
54 Picton, T.W., Hillyard, S.A. and Galambos, R., Evoked responses to omitted stimuli. In: M.N.
Livanov (Ed.), Major Problems of Brain Electrophysiology, Academy of Sciences, U.S.S.R., 1974, pp.
302-31 I (in Russian, cited by Hillyard and Picton 1979).
55 Poulton, E.C., The new psychophysics: six models for magnitude estimation, Psychol. Bull., 69 (1968)
l-19.
56 Rose, R.M., Teller, D.Y. and Rendleman, P., Statistical properties of staircase estimates, Percept.
Psychophys., 8 (1970) 199-204.
57 Rosner, B.S. and Goff, W.R., Electrical responses of the nervous system and subjective scales of
intensity, Contrib. sens. Physiol., 2 (1967) 169-221.
58 Roth, M., Shaw, J. and Green, J., The form, voltage distribution and physiological significance of the
K-complex, Electroenceph. clin. Neurophysiol., 8 (1956) 385-402.
59 Sano, H., Influence of intensity-varied electrical stimulation of a tooth and 30% N,O premixed gas
inhalation on somatosensory evoked potentials (SEPs), Jap. J. dent. Anesthesiol., 5 (1977) 9-2 I. 60 Schwent, V., Hillyard, S.A. and Galambos, R., Selective attention and the auditory vertex potential. II.
Effects of signal intensity and masking noise, Electroenceph. clin. Neurophysiol., 40 (1976) 604-614.
61 Shagass, C. and Schwartz, M., Evoked cortical potentials and sensation in man, J. Neuropsychiat., 2
(1961) 262-270.
62 Shagass, C. and Schwartz, M., Cerebral responsiveness in psychiatric patients. Intensity response
gradients and recovery cycles of somatosensory potentials, Arch. gen. Psychiat., 8 (1963) 177- 189.
63 Shigenaga, Y., Matano, S., Kusuyama, M. and Sakai, A., Cortical neurons responding to electrical
stimulation of the rat’s incisor pulp, Brain Res., 67 (1974) 153- 156.
64 Shigenaga, Y., Matano, S., Okada, K. and Sakai, A., The effects of tooth pulp stimulation in the
thalamus and hypothalamus of the rat, Brain Res., 63 (1973) 402-407.
65 Simson, R., Vaughan, H.G. and Ritter, V., The scalp topography of potentials associated with missing
visual or auditory stimuli, Electroenceph. clin. Neurophysiol., 40 (1976) 33-42.
66 Spreng, M. und Ichioka, M., Langsame Ridenpotentiale bei Schmerzreizung am Menschen, Pfliigers
Arch. ges. Physiol., 279 (1964) 121-132.
67 Squires, K.C., Hillyard, S.A. and Lindsay, P.H., Vertex potentials evoked during auditory signal
detection: relation to decision criteria, Percept. Psychophys., I4 (1973) 265-272.
68 Squires, N.K., Squires, K.C. and Hillyard, S.A., Two varieties of long-latency positive waves evoked
by unpredictable auditory stimuli in man, Electroenceph. clin. Neurophysiol., 38 (1975) 387-401,

232
69
70
71
72
73
74
75
76
77
78
79
80
81
82
83
84
85
Sternbach, J.C. and Tursky. B., On the psychophysical power functton in electrtc shock. Psychon. %I..
I (1964) 217-218.
Stevens, S.S., The direct estimation of sensory magnitudes -- loudness. Amer. J. Psychoi.. 69 (1956)
I-25.
Stevens, S.S., Problems and methods of psychophysics, Psychol. Bull., 55 (1958) 177.. 196.
Stevens, S.S., Carton, A.S. and Shickman, G.M., A scale of apparent intensity of electric shock. J. exp.
Psychol.. 56 (1958) 328-334.
Stevens, S.S. and Galanter, E.H.. Ratio scales and category scales for a dozen perceptual contmua. J.
exp. Psychol.. 54 (1957) 377.-411.
Stowell, H.. Cerebral slow waves related to the perception of pain in man, Brain Res. Bull., 2 (1977)
23-30.
Sutton, S., The specification of psychological variables tn an average evoked potentials experiment. In:
E. Donchin and D.B. Lindsley (Eds.), NASA Conference on Average Evoked Potentials, San
Francisco, NASA-SP-191, U.S. Govt. Printing Office, Washington, D.C., 1969, pp. 239-297.
Sutton, S., Braren, M.. &bin, J. and John, E., Evoked potential correlates of stimulus uncertainty.
Science, I50 (1965) 1187-1188.
Sutton, S., Tueting, P., Zubin. J. and John, E.R., Information delivery and the sensory evoked
potential, Science, I55 (1967) l436- 1439.
Swartz, P., A new method for scaling pain, J. exp. Psychol., 45 (1953) 288-293.
Tursky, B.. Physical, physiological, and psychological factors that affect pain reaction to electric
shock, Psychophysiology. I I (1974) 95-l 12.
Uttal. W.R. and Cook, L., Systematics of the evoked somatosensory cortical potentials, IBM J. Res.
Develop., 6 (1962) l79- 193.
Van Hassel, H.J., Biedenbach. M.A. and Brown, A.C., Cortical potentials evoked by tooth pulp
stimulation in rhesus monkey, Arch. oral Biol., I7 (1972) 1059-1066.
Vaughan, H.G., Psychophysical relations of evoked responses. In: A. Remand (Ed.), Handbook of
Electroencephalography and Clinical Neurophysiology. Vol. 8A. Elsevier. Amsterdam. 1975, pp.
977 102.
Wetherill, G.B. and Levitt, H., Sequential estimation points on a psychometric function. Brit. J. math.
stat. Psychol.. 18 (1965) I-IO.
Williamson, P.D., Goff, W.R. and Allison, T., Somatosensory evoked responses in patients with
unilateral cerebral lesions, Electroenceph. clin. Neurophysiol., 28 (1970) 566-575.
Woda. A., Azerad, J. and Albe-Fessard, D., Mapping of the trigeminal sensory complex of the cat.
Characterization of its neurons by stimulations of the peripheral field, dental pulp afferents and
thalamic projections. In: Proc. Symp. on Neural Mechanisms of Pain, Smolenice. Czechoslovakia, J.
Physiol. (Paris), 73 (1977) 3677378.