Non-linear analysis of visual evoked potentials
225
NON-LINEAR ANALYSIS OF VISUAL EVOKED POTENTIALS: APPLICATIONS FOR UNDERSTANDING THE ROLE OF THE AFFERENT STREAMS IN VISUAL PROCESSING Laila Elaine Hugrass 2018 A thesis submitted in total fulfilment of the requirements for the degree of Doctor of Philosophy
-
Upload
khangminh22 -
Category
Documents
-
view
2 -
download
0
Transcript of Non-linear analysis of visual evoked potentials
NON-LINEAR ANALYSIS OF VISUAL EVOKED
POTENTIALS:
APPLICATIONS FOR UNDERSTANDING THE ROLE OF THE
AFFERENT STREAMS IN VISUAL PROCESSING
Laila Elaine Hugrass
2018
A thesis submitted in total fulfilment of the
requirements for the degree of Doctor of Philosophy

i
Abstract The receptive field properties of neurons in the magnocellular (M), parvocellular
(P) and koniocellular (K) afferent pathways have been well studied in primates. Due to
interactions between these pathways at the cortical level, it is difficult to study them
with non-invasive methods in humans. M and P signatures have been identified in the
non-linear temporal structure of visual evoked potentials (VEPs). This has opened the
door to investigating contributions from these afferent pathways to various aspects of
visual processing.
This thesis uses non-linear VEPs, in combination with conventional VEPs and
psychophysics to identify putative M and P responses. The principle aim is to extend
the use of non-linear VEP analysis by applying these techniques to investigate how the
afferent streams contribute to different aspects of visual processing. Specifically, this
thesis reviews the use of non-linear VEPs, conventional VEP techniques and
psychophysics to study M and P processing (Chapters 2 and 3). It applies EEG and
MEG measures of non-linear VEPs to investigate variations in M and P responses to red
and green background (Chapter 4) and to blue chromatic saturation (Chapters 5).
Conventional VEP (Chapter 6) and non-linear VEP (Chapter 7) were applied to
investigate the ways in which the neuropeptide, oxytocin, influences early visual
processing of affective and non-affective input.
By combining non-linear VEP and psychophysical evidence, I challenged the
long held belief that red surrounds specifically suppress M contributions to cortical
processing and perception (Chapter 4). Furthermore, by studying non-linear MEG
responses, I identified an early cortical signature of chromatic saturation that appears to
originate from a population of neurons that recover rapidly from stimulation (Chapter
5). Finally, I found that oxytocin administration influences very fast latency,
presumably M-driven, responses to emotional faces (Chapter 6), yet it does not
influence M or P driven VEP responses to non-affective multifocal flash stimulation
(Chapter 7).
These findings highlight the importance of using a variety of complementary
techniques to investigate the earliest stages of visual processing. By studying the non-
linear temporal structure of VEPs, I was able to resolve some ambiguities in the

ii
literature. This work is discussed in terms of its implications, and future directions for
studying M and P afferent contributions to vision.

iii
Acknowledgements I would like to express my sincere gratitude to my supervisor, Professor David
Crewther. I appreciate the support and encouragement you have provided along the
way. Your enthusiasm and knowledge have been so important in my development as a
researcher. I would also like to thank Professor Sheila Crewther for her guidance and
support. I am very grateful to Doctor Izelle Labuschagne for her input regarding the
design of the oxytocin studies and for her advice in preparing the related manuscripts.
It would not have been possible to complete this thesis without the people who
participated in my research. Thank you all for being so generous with your time. I am
very fortunate to have been a member of David Crewther’s Visneuro laboratory group.
Over the years, it has been an absolute pleasure to welcome undergraduate student
members to the Visneuro team. I am very grateful for the assistance that each of you
have provided. Our weekly Visneuro meetings have been very valuable in providing a
platform for us to discuss our work. In particular, I would like to thank my colleagues,
Dr Talitha Ford, Dr. Nicola Jastrebski, Dr. James Collett, Alyse Brown, Brook
Shiferaw, Eveline Mu, Adelaide Burt and Katie Wykes for all of their wisdom and
encouragement.
I would like to thank my incredible friends and family for being my support
network throughout this journey. I am so grateful for my Armidale friends, my
Tasmanian ladies, and my Melbourne champions. Lastly, I would like to give a special
thanks to my partner Chris Ormston for believing in me and for helping me to see the
funny side of absolutely everything.

iv
General Declaration
I, the candidate, declare that the contents of this thesis:
1. Contains no material which has been accepted by me for the award of any
other degree at any other university or equivalent institution.
2. To the best of my knowledge, contains no material previously published or
written by another person except where appropriate reference is made in the
thesis.
3. Discloses the relative contributions of the authors on work that is based on
joint research or publications (see Appendix I).
4. I warrant that I have obtained, where necessary, permission from the
copyright owners to use any third party copyright material reproduced in the
thesis (such as artwork, images, unpublished documents), or to use any of
my own published work (such as journal articles) in which the copyright is
held by another party (such as publisher, co-author).

v
Table of Contents
Abstract ............................................................................................................................. i
Acknowledgements ........................................................................................................ iii
General Declaration ....................................................................................................... iv
Table of Contents ............................................................................................................ v
List of Figures ................................................................................................................. xi
List of Tables ............................................................................................................... xvii
List of Papers as Part of this Thesis ........................................................................ xviii
List of Additional Papers that do not Form a Part of this Thesis ............................ xix
List of Presentations ...................................................................................................... xx
List of Abbreviations .................................................................................................... xxi
Chapter 1: Introduction and Thesis Overview .......................................................... 1
1.1 Overviewafferentpathways.............................................................................11.2 Thenon-linearVEPapproachtostudyingtheafferentstreams...........41.3 Outlineofthesischaptersandaims................................................................61.4 References...............................................................................................................9
Chapter 2: The Afferent Pathway Origins of Scalp Recorded Visual Evoked
Potentials - A Review .................................................................................................... 14
2.1 Chapterguide......................................................................................................142.2 Abstract.................................................................................................................152.3 Introduction.........................................................................................................162.4 Primatestudiesoftheafferentvisualpathways.....................................162.5 HumanVEPanalysesoftheafferentvisualpathways...........................172.6 ThetransientVEPapproach...........................................................................192.6.1 IntroductiontotransientVEPs............................................................................192.6.2 EffectsofluminancecontrastandspatialfrequencyonVEPs...............192.6.3 EffectsofcolourontransientVEPs....................................................................212.6.4 EffectsofmotionontransientVEPs..................................................................222.6.5 SummaryofafferentcontributionstotransientVEPs..............................23
2.7 ThessVEPapproach..........................................................................................232.7.1 IntroductiontossVEP..............................................................................................23
vi
2.7.2 EffectsofluminancecontrastandspatialfrequencyonssVEP.............242.7.3 EffectsofcolouronssVEP......................................................................................252.7.4 EffectsofmotiononssVEP....................................................................................262.7.5 SummaryofafferentcontributionstossVEP................................................26
2.8 Them-sequenceapproach..............................................................................272.8.1 Introductiontom-sequencesandWienerkernelanalysis......................272.8.2 Effectsofluminancecontrastonnon-linearVEPs......................................282.8.3 Effectsofspatialfrequencyonnon-linearVEPs...........................................292.8.4 Effectsofcolouronnon-linearVEPs.................................................................302.8.5 Corticalsourcesofnon-linearVEPsignal.......................................................312.8.6 Summaryofafferentcontributionstonon-linearVEPsignals..............31
2.9 TheVESPAapproach.........................................................................................322.9.1 IntroductiontoVESPA.............................................................................................322.9.2 TheeffectsofluminanceandspatialfrequencyonVESPAsignals......322.9.3 SummaryofafferentcontributionstoVESPAsignal..................................33
2.10 DiscussionandConclusions.........................................................................332.11 References..........................................................................................................35
Chapter 3: A review of Non-Linear Visual Evoked Potential Research into
Contributions from the Human M and P pathways to Cortical Vision ................... 443.1 Chapterguide.......................................................................................................443.2 Abstract..................................................................................................................453.3 Introduction.........................................................................................................463.4 Primatephysiology:CharacteristicsoftheMandPpathways...........463.5 Thenon-linearVEPapproach........................................................................483.5.1 Introductiontonon-lineartemporalanalysisofVEPs..............................483.5.2 ThemultifocalVEPapproachtoidentifyingMandPinputstocortical
vision 493.6 Applications.........................................................................................................533.6.1 DevelopmentalchangesinMandPfunction.................................................533.6.2 MandPfunctionindevelopmentaldisorders..............................................543.6.2.1 TheAutismSpectrum.....................................................................................................543.6.2.2 Dyslexiaandmathematicalimpairment................................................................56
3.6.3 PsychopharmacologyandnonlinearVEP:EffectsofOmega-3PUFA
diets 573.6.4 Colourprocessing......................................................................................................58
vii
3.7 Summaryandfuturedirections....................................................................593.8 Conclusions..........................................................................................................613.9 References............................................................................................................61
Chapter 4: The Effects of Red Surrounds on Visual Magnocellular and
Parvocellular Cortical Processing and Perception ..................................................... 71
4.1 Chapterguide......................................................................................................714.1.1 Highlights......................................................................................................................71
4.2 Abstract.................................................................................................................724.3 Introduction.........................................................................................................734.4 Experiment1:Method......................................................................................764.4.1 Participants..................................................................................................................764.4.2 Stimuli.............................................................................................................................764.4.3 EEGrecordingandanalysis...................................................................................77
4.5 Experiment1:ResultsandDiscussion........................................................784.5.1 K1Amplitude...............................................................................................................784.5.2 K2.1Amplitude...........................................................................................................804.5.3 K2.2Amplitude...........................................................................................................804.5.4 Summary.......................................................................................................................81
4.6 Experiment2:Method......................................................................................814.6.1 Participants..................................................................................................................814.6.2 Stimuli.............................................................................................................................82
4.7 Experiment2:ResultsandDiscussion........................................................834.7.1 Greysteadypedestaltasks....................................................................................864.7.2 Greypulsedpedestaltasks....................................................................................864.7.3 Colouredsteadypedestaltasks...........................................................................874.7.4 Colouredpulsedpedestaltasks...........................................................................874.7.5 Summary.......................................................................................................................88
4.8 Generaldiscussion.............................................................................................894.9 Acknowledgements...........................................................................................924.10 References..........................................................................................................92
Chapter 5: The Temporal Structure of Evoked MEG Responses: Effects of
Chromatic Saturation ................................................................................................... 985.1 Chapterguide......................................................................................................985.1.1 Highlights......................................................................................................................98
5.2 Abstract...............................................................................................................100
viii
5.3 Introduction.......................................................................................................1015.4 Methods...............................................................................................................1035.4.1 Participants...............................................................................................................1035.4.2 Stimuli..........................................................................................................................1035.4.3 MEGrecording..........................................................................................................1045.4.4 StructuralT1.............................................................................................................1055.4.5 MEGanalyses............................................................................................................1055.4.6 MEGstatisticalanalyses.......................................................................................106
5.5 Results..................................................................................................................1075.5.1 Sensorspaceanalyses...........................................................................................1075.5.2 Sourcelocalisation.................................................................................................1095.5.3 PLSanalyses..............................................................................................................111
5.6 Discussion...........................................................................................................1135.7 Conclusions.........................................................................................................1155.8 Acknowledgements.........................................................................................1155.9 References..........................................................................................................115
Chapter 6: Intranasal Oxytocin Modulates Very Early Visual Processing of
Emotional Faces .......................................................................................................... 1206.1 Chapterguide.....................................................................................................1206.1.1 Highlights...................................................................................................................120
6.2 Abstract................................................................................................................1216.3 Introduction.......................................................................................................1226.4 Methods...............................................................................................................1246.4.1 Participants...............................................................................................................1246.4.2 Questionnaires.........................................................................................................1256.4.3 FacialemotionVEPtask.......................................................................................1256.4.4 Procedure...................................................................................................................1266.4.5 EEGrecordingandpre-processing.................................................................1266.4.6 StatisticalAnalyses.................................................................................................127
6.5 Results..................................................................................................................1296.5.1 Preliminaryanalysesofbehaviouraldata....................................................1296.5.2 Mainanalysesofbehaviouraldata..................................................................1296.5.3 PreliminaryanalysesofVEPs............................................................................1306.5.4 Earlyeffects(40-60ms)........................................................................................1326.5.5 P100..............................................................................................................................133
ix
6.5.6 N170andVPP...........................................................................................................1356.5.7 LPPresults.................................................................................................................137
6.6 Discussion...........................................................................................................1386.7 Conclusions........................................................................................................1416.8 Acknowledgements.........................................................................................1416.9 References..........................................................................................................141
Chapter 7: Acute Intranasal Oxytocin does not Influence the Non-Linear
Temporal Structure of Cortical Visual Evoked Potentials ..................................... 1487.1 Chapterguide....................................................................................................1487.1.1 Highlights...................................................................................................................148
7.2 Abstract...............................................................................................................1497.3 Introduction.......................................................................................................1507.4 Method.................................................................................................................1527.4.1 Participants...............................................................................................................1527.4.2 Procedure...................................................................................................................1527.4.3 Questionnaires.........................................................................................................1537.4.4 mfVEPStimuli...........................................................................................................1537.4.5 EEGrecordingandpre-processing.................................................................1547.4.6 StatisticalAnalyses.................................................................................................155
7.5 Results..................................................................................................................1567.5.1 StateanxietypreliminaryLMM........................................................................1567.5.2 StateanxietyLMM..................................................................................................1567.5.3 mfVEPpreliminaryLMMs...................................................................................1577.5.4 K1N65P105LMM...........................................................................................................1577.5.5 K2.1N70P105...................................................................................................................1597.5.6 EarlyandlateK2.2waveforms.........................................................................161
7.6 Discussion...........................................................................................................1627.7 Acknowledgements.........................................................................................1647.8 References..........................................................................................................165
Chapter 8: General Discussion ............................................................................... 1708.1 Understandingtheeffectsofredsurroundsonvisualprocessing..1708.1.1Overviewoforiginalcontributions.....................................................................1718.1.2Implications...................................................................................................................172
8.2 Understandingtheeffectsofdiffusechromaticsaturation...............1738.2.1Overviewoforiginalcontributions.....................................................................174
x
8.2.2Implications...................................................................................................................1758.3 Understandingoftheeffectsofoxytocinonearlyvisualprocessing
1768.3.1Overviewoforiginalcontributions.....................................................................1768.3.2Implications...................................................................................................................177
8.4 Limitationsandfuturedirections...............................................................1788.4.1Relatingprimatephysiologytohumanbehaviour.......................................1798.4.2SeparationofKsignalsfromMandPsignals.................................................1808.4.3Updatingthethree-pathwayhypothesis..........................................................1808.4.4OtherM-drivensubcorticalvisualpathways..................................................1808.4.5Individualdifferences...............................................................................................181
8.5 Conclusions.........................................................................................................1818.6 References..........................................................................................................182
Appendix A: Certificates of ethics approval ............................................................. 189A.1SUHRECProject2015/064:TransformationsinVisualCortex:From
neuralinputtorecognition....................................................................................................189A.2SUHRECProject2017/027:TransformationsinVisualCortex:From
neuralinputtorecognition....................................................................................................191
Appendix B: Authorship Indication Forms .............................................................. 193B.1AuthorshipindicationforthepaperpresentedinChapter2...............193B.2AuthorshipindicationforthepaperpresentedinChapter3...............194B.3AuthorshipindicationforthepaperpresentedinChapter4...............195B.4AuthorshipindicationforthepaperpresentedinChapter5...............197B.5AuthorshipindicationforthepaperpresentedinChapter6...............198B.6AuthorshipindicationforthepaperpresentedinChapter7...............199
Appendix C: Summary of Journals in which paper are/are to be published ........ 200PapersInPress.............................................................................................................200PapersInSubmission................................................................................................201PapersInPreparation...............................................................................................201
xi
List of Figures Figure 2.1 Illustration of different VEP stimulation techniques. The top panels illustrate
transient VEP at 1Hz, for diffuse (a) and pattern onset (b) and (c) pattern reversal
stimulation modes. The bottom panels provide examples of contrast modulation
sequences during d) steady state VEP at 4 Hz, (e) fast m-sequence VEP, where the
contrast alternates pseudorandomly between binary levels, at a base interval of
16.7ms, and (f) VESPA, where the contrast is modulated randomly over a wide
range of narrowly spaced levels, at a base interval of 16.7ms. ............................... 19
Figure 3.1 Illustration of typical (a) K1, (b) K2.1 and (c) K2.2 waveforms from a single
observer, as measured from the central patch of a multifocal VEP stimulus, at 70%
luminance contrast, and a display update rate of 60Hz. .......................................... 49
Figure 4.1 Dartboard stimulus configuration for the green low contrast (a), green high
contrast (b), red low contrast (c) and red high contrast (d) conditions. We
compared VEP kernel responses to the central patch for the conditions with red and
green surrounds. ...................................................................................................... 77
Figure 4.2 K1, K2.1 and K2.2 responses to the central patch at 10% (a, b, c) and at 70%
(d, e, f) temporal contrast. The bold red and green lines correspond to the averaged
waveforms for the conditions with red and green backgrounds respectively.
Responses from each participant are illustrated in the faint red and green traces.
VEP amplitudes for the red and green surrounds were compared using running
paired samples t-tests (df = 14). The absolute t-values are shown in the black
traces at the bottom of each panel, with the dashed and dotted horizontal lines
signifying the p < .05 and p < .01 two-tailed significance thresholds respectively.
Times when the VEP traces differed significantly are flagged with * (p < .05) and
** (p< .01). .............................................................................................................. 79
Figure 4.3 Illustration of the steady (a and c) and pulsed (b and d) pedestal paradigms
on green and red backgrounds. An additional experiment was performed with
pedestals and targets that were all red (e) or all green (f). In the steady paradigms,
observers adapted to the pedestals for 3 seconds prior to a 30ms test stimulus. They
were required to identify the location of the luminance increment (the top square in
this case). The pulsed paradigms were the same except observers adapted to the
background, rather than to the pedestals. ................................................................ 83

xii
Figure 4.4 Plots of mean log luminance increment thresholds versus log pedestal
luminance for the centrally (a) and peripherally (b) presented grey pedestal tasks
(N = 9) and for the centrally (c) and peripherally (d) presented coloured pedestal
tasks (N=8). Results for the red and green background conditions are shown in the
red and green traces respectively. Results for the steady pedestal task are shown in
the filled markers (solid lines), whereas results for the pulsed pedestal task are
shown in the unfilled markers (dashed lines). For the coloured pedestal tasks, the
yellow markers are the average of thresholds obtained in the red and green steady
pedestal conditions, and the yellow solid line illustrates the linear fit. The
backgrounds have been shaded in dark and light greys to show when the pedestals
were decrements and increments relative to the background luminance. The error
bars denote ± 1 SEM. .............................................................................................. 85
Figure 5.1 Illustration of the chromatic saturation levels for the blue multifocal stimuli.
The central quadrants of the multifocal stimuli are illustrated in the panels on the
right, at levels of 0, 25, 50, 75 and 95% blue saturation. For each chromatic
saturation condition, temporal luminance contrast = 30% .................................... 104
Figure 5.2 Sensor space analyses. Mean magnetic evoked K1 (a), K2.1 (b) and K2.2 (c)
waveforms are shown for an occipital sensor cluster (principle component
derived). The shading represents the blue chromatic desaturation series from 95%
to 0%. Mean amplitudes and latencies for the first major troughs and peaks are
presented for the K1 (d-e), K2.1 (f-g) and K2.2 (h-i) waveforms, with chromatic
saturation plotted on the x-axes. Responses to the central multifocal quadrants are
presented in different coloured traces (red: top right, orange: top left, green: bottom
left, purple: bottom right). The error bars denote ± SEM. .................................... 108
Figure 5.3 Group averaged (n = 8) maps of z-score normalised MNI sources for the
95% blue saturation conditions. The separate rows illustrate the K2.1 response at
70ms (a) and 95ms (b), and the K2.2 response at 70ms (c) and 95ms (d). For each
column of cortical maps, the corresponding stimulus quadrants are illustrated in the
blue segments at the top of the panel (top right, top left, bottom right and bottom
left). The same colour bar range was applied for all maps, displaying z-scores
ranging from 0 (dark red) to >10 (white). Due to much stronger K2.1 activations,
the thresholds were set to z > 6 and z > 3 for the K2.1 and K2.2 maps respectively.
............................................................................................................................... 110
xiii
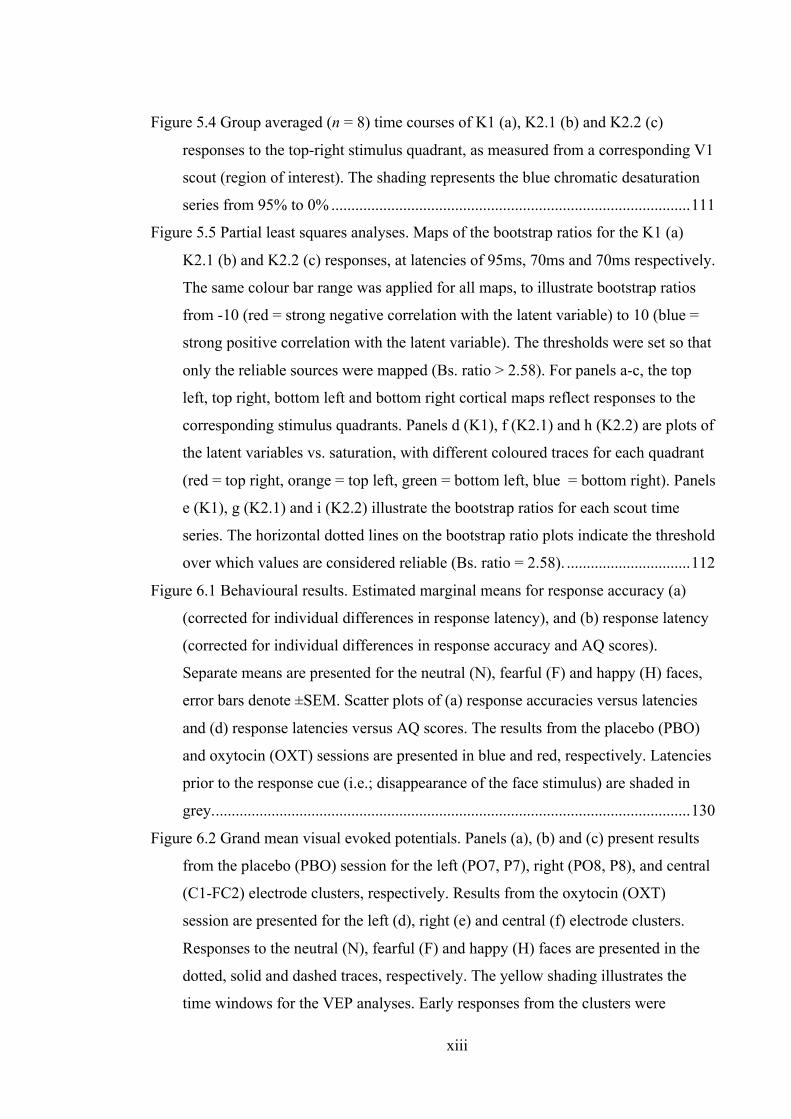
Figure 5.4 Group averaged (n = 8) time courses of K1 (a), K2.1 (b) and K2.2 (c)
responses to the top-right stimulus quadrant, as measured from a corresponding V1
scout (region of interest). The shading represents the blue chromatic desaturation
series from 95% to 0% .......................................................................................... 111
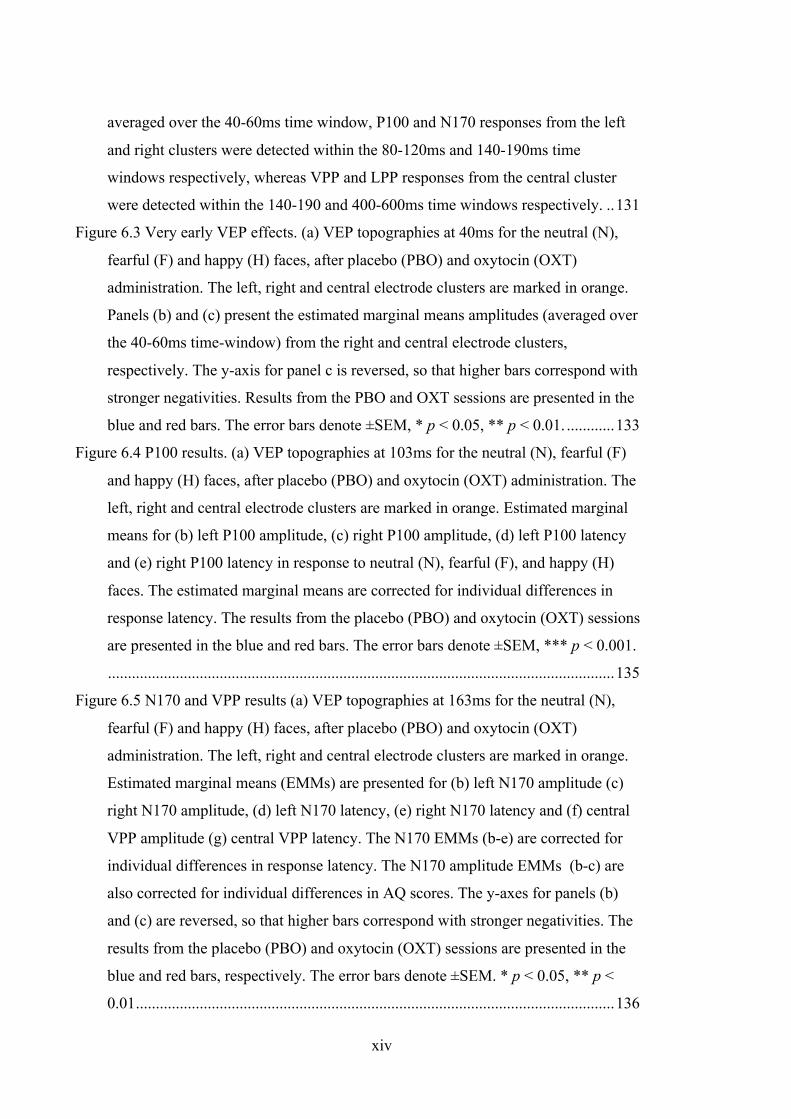
Figure 5.5 Partial least squares analyses. Maps of the bootstrap ratios for the K1 (a)
K2.1 (b) and K2.2 (c) responses, at latencies of 95ms, 70ms and 70ms respectively.
The same colour bar range was applied for all maps, to illustrate bootstrap ratios
from -10 (red = strong negative correlation with the latent variable) to 10 (blue =
strong positive correlation with the latent variable). The thresholds were set so that
only the reliable sources were mapped (Bs. ratio > 2.58). For panels a-c, the top
left, top right, bottom left and bottom right cortical maps reflect responses to the
corresponding stimulus quadrants. Panels d (K1), f (K2.1) and h (K2.2) are plots of
the latent variables vs. saturation, with different coloured traces for each quadrant
(red = top right, orange = top left, green = bottom left, blue = bottom right). Panels
e (K1), g (K2.1) and i (K2.2) illustrate the bootstrap ratios for each scout time
series. The horizontal dotted lines on the bootstrap ratio plots indicate the threshold
over which values are considered reliable (Bs. ratio = 2.58). ............................... 112
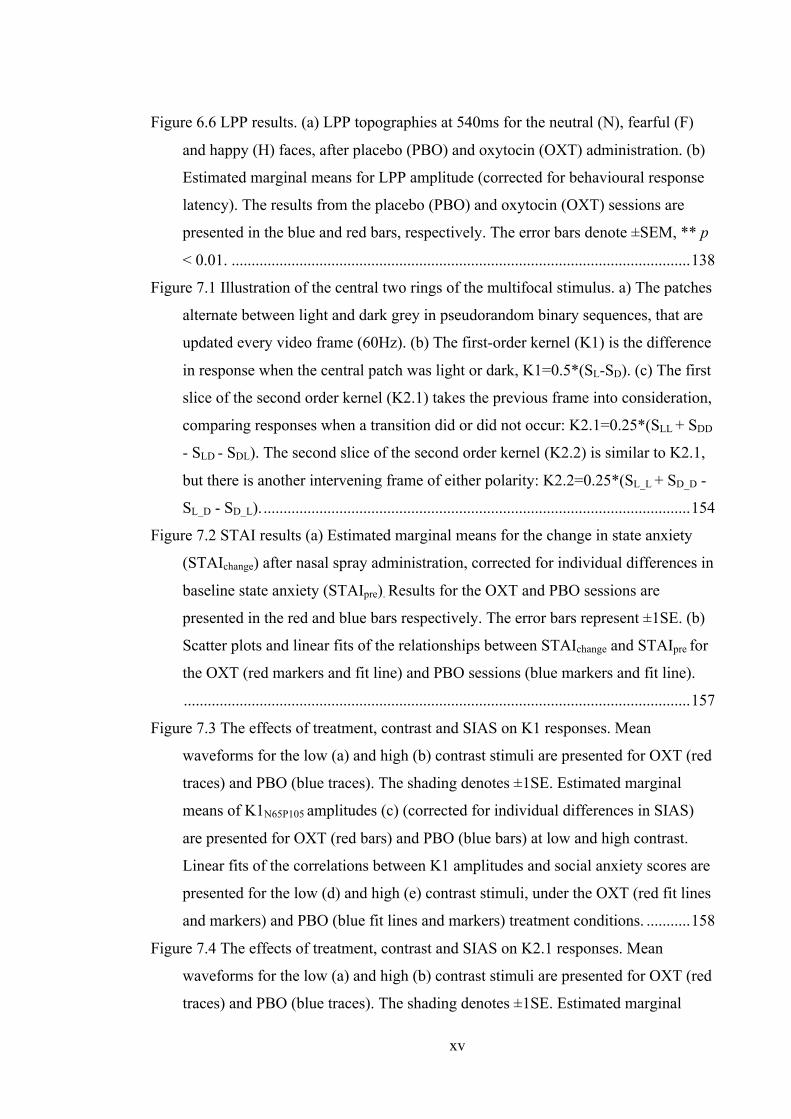
Figure 6.1 Behavioural results. Estimated marginal means for response accuracy (a)
(corrected for individual differences in response latency), and (b) response latency
(corrected for individual differences in response accuracy and AQ scores).
Separate means are presented for the neutral (N), fearful (F) and happy (H) faces,
error bars denote ±SEM. Scatter plots of (a) response accuracies versus latencies
and (d) response latencies versus AQ scores. The results from the placebo (PBO)
and oxytocin (OXT) sessions are presented in blue and red, respectively. Latencies
prior to the response cue (i.e.; disappearance of the face stimulus) are shaded in
grey. ....................................................................................................................... 130
Figure 6.2 Grand mean visual evoked potentials. Panels (a), (b) and (c) present results
from the placebo (PBO) session for the left (PO7, P7), right (PO8, P8), and central
(C1-FC2) electrode clusters, respectively. Results from the oxytocin (OXT)
session are presented for the left (d), right (e) and central (f) electrode clusters.
Responses to the neutral (N), fearful (F) and happy (H) faces are presented in the
dotted, solid and dashed traces, respectively. The yellow shading illustrates the
time windows for the VEP analyses. Early responses from the clusters were
xiv
averaged over the 40-60ms time window, P100 and N170 responses from the left
and right clusters were detected within the 80-120ms and 140-190ms time
windows respectively, whereas VPP and LPP responses from the central cluster
were detected within the 140-190 and 400-600ms time windows respectively. .. 131
Figure 6.3 Very early VEP effects. (a) VEP topographies at 40ms for the neutral (N),
fearful (F) and happy (H) faces, after placebo (PBO) and oxytocin (OXT)
administration. The left, right and central electrode clusters are marked in orange.
Panels (b) and (c) present the estimated marginal means amplitudes (averaged over
the 40-60ms time-window) from the right and central electrode clusters,
respectively. The y-axis for panel c is reversed, so that higher bars correspond with
stronger negativities. Results from the PBO and OXT sessions are presented in the
blue and red bars. The error bars denote ±SEM, * p < 0.05, ** p < 0.01. ............ 133
Figure 6.4 P100 results. (a) VEP topographies at 103ms for the neutral (N), fearful (F)
and happy (H) faces, after placebo (PBO) and oxytocin (OXT) administration. The
left, right and central electrode clusters are marked in orange. Estimated marginal
means for (b) left P100 amplitude, (c) right P100 amplitude, (d) left P100 latency
and (e) right P100 latency in response to neutral (N), fearful (F), and happy (H)
faces. The estimated marginal means are corrected for individual differences in
response latency. The results from the placebo (PBO) and oxytocin (OXT) sessions
are presented in the blue and red bars. The error bars denote ±SEM, *** p < 0.001.
............................................................................................................................... 135
Figure 6.5 N170 and VPP results (a) VEP topographies at 163ms for the neutral (N),
fearful (F) and happy (H) faces, after placebo (PBO) and oxytocin (OXT)
administration. The left, right and central electrode clusters are marked in orange.
Estimated marginal means (EMMs) are presented for (b) left N170 amplitude (c)
right N170 amplitude, (d) left N170 latency, (e) right N170 latency and (f) central
VPP amplitude (g) central VPP latency. The N170 EMMs (b-e) are corrected for
individual differences in response latency. The N170 amplitude EMMs (b-c) are
also corrected for individual differences in AQ scores. The y-axes for panels (b)
and (c) are reversed, so that higher bars correspond with stronger negativities. The
results from the placebo (PBO) and oxytocin (OXT) sessions are presented in the
blue and red bars, respectively. The error bars denote ±SEM. * p < 0.05, ** p <
0.01 ........................................................................................................................ 136
xv
Figure 6.6 LPP results. (a) LPP topographies at 540ms for the neutral (N), fearful (F)
and happy (H) faces, after placebo (PBO) and oxytocin (OXT) administration. (b)
Estimated marginal means for LPP amplitude (corrected for behavioural response
latency). The results from the placebo (PBO) and oxytocin (OXT) sessions are
presented in the blue and red bars, respectively. The error bars denote ±SEM, ** p
< 0.01. ................................................................................................................... 138
Figure 7.1 Illustration of the central two rings of the multifocal stimulus. a) The patches
alternate between light and dark grey in pseudorandom binary sequences, that are
updated every video frame (60Hz). (b) The first-order kernel (K1) is the difference
in response when the central patch was light or dark, K1=0.5*(SL-SD). (c) The first
slice of the second order kernel (K2.1) takes the previous frame into consideration,
comparing responses when a transition did or did not occur: K2.1=0.25*(SLL + SDD
- SLD - SDL). The second slice of the second order kernel (K2.2) is similar to K2.1,
but there is another intervening frame of either polarity: K2.2=0.25*(SL_L + SD_D -
SL_D - SD_L). ........................................................................................................... 154
Figure 7.2 STAI results (a) Estimated marginal means for the change in state anxiety
(STAIchange) after nasal spray administration, corrected for individual differences in
baseline state anxiety (STAIpre). Results for the OXT and PBO sessions are
presented in the red and blue bars respectively. The error bars represent ±1SE. (b)
Scatter plots and linear fits of the relationships between STAIchange and STAIpre for
the OXT (red markers and fit line) and PBO sessions (blue markers and fit line).
............................................................................................................................... 157
Figure 7.3 The effects of treatment, contrast and SIAS on K1 responses. Mean
waveforms for the low (a) and high (b) contrast stimuli are presented for OXT (red
traces) and PBO (blue traces). The shading denotes ±1SE. Estimated marginal
means of K1N65P105 amplitudes (c) (corrected for individual differences in SIAS)
are presented for OXT (red bars) and PBO (blue bars) at low and high contrast.
Linear fits of the correlations between K1 amplitudes and social anxiety scores are
presented for the low (d) and high (e) contrast stimuli, under the OXT (red fit lines
and markers) and PBO (blue fit lines and markers) treatment conditions. ........... 158
Figure 7.4 The effects of treatment, contrast and SIAS on K2.1 responses. Mean
waveforms for the low (a) and high (b) contrast stimuli are presented for OXT (red
traces) and PBO (blue traces). The shading denotes ±1SE. Estimated marginal
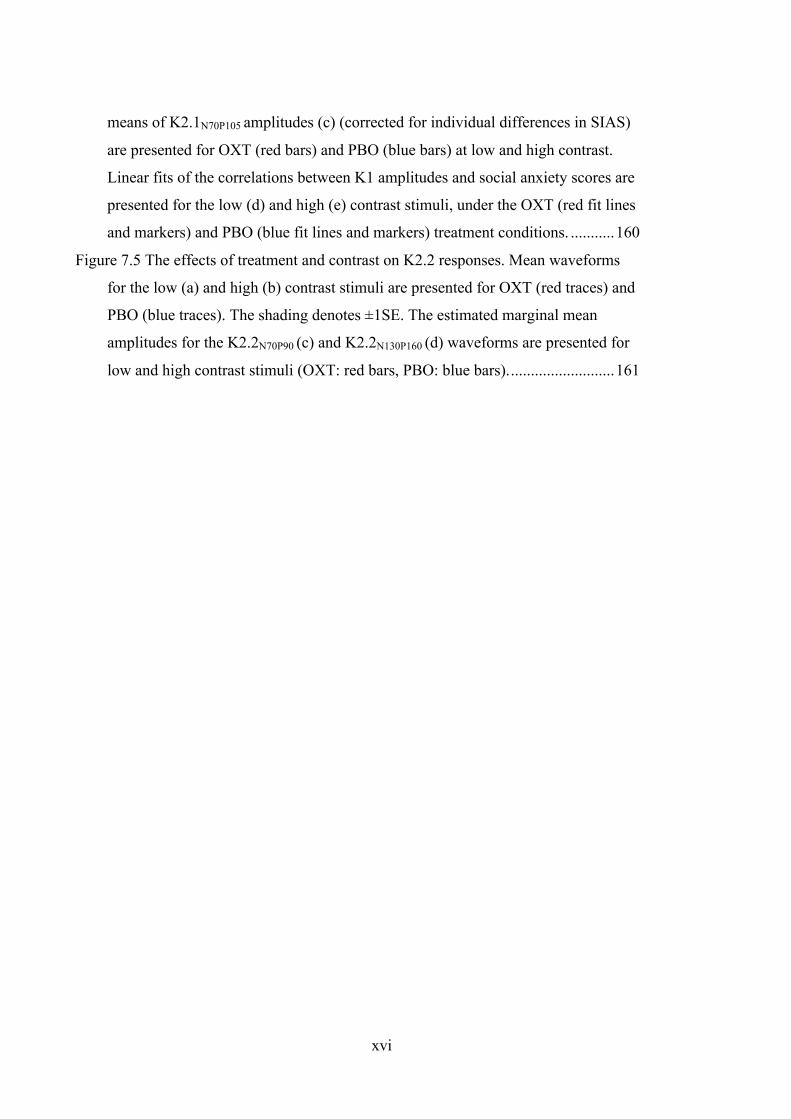
xvi
means of K2.1N70P105 amplitudes (c) (corrected for individual differences in SIAS)
are presented for OXT (red bars) and PBO (blue bars) at low and high contrast.
Linear fits of the correlations between K1 amplitudes and social anxiety scores are
presented for the low (d) and high (e) contrast stimuli, under the OXT (red fit lines
and markers) and PBO (blue fit lines and markers) treatment conditions. ........... 160
Figure 7.5 The effects of treatment and contrast on K2.2 responses. Mean waveforms
for the low (a) and high (b) contrast stimuli are presented for OXT (red traces) and
PBO (blue traces). The shading denotes ±1SE. The estimated marginal mean
amplitudes for the K2.2N70P90 (c) and K2.2N130P160 (d) waveforms are presented for
low and high contrast stimuli (OXT: red bars, PBO: blue bars). .......................... 161

xvii
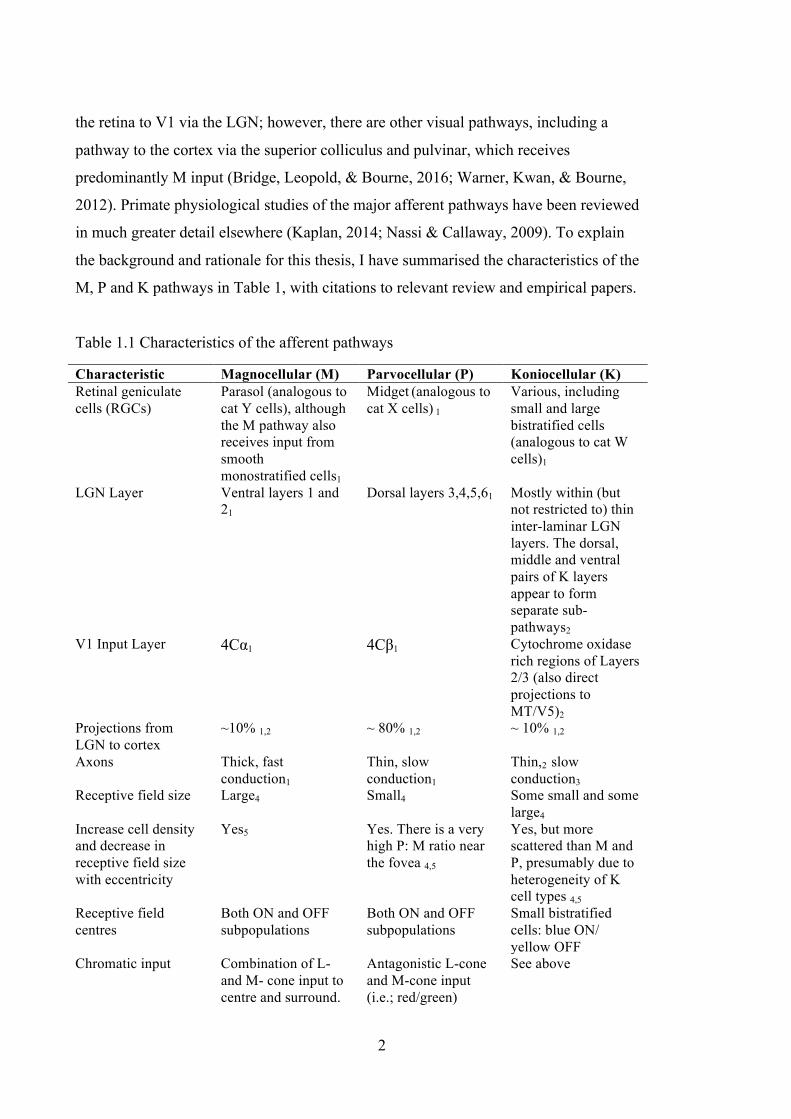
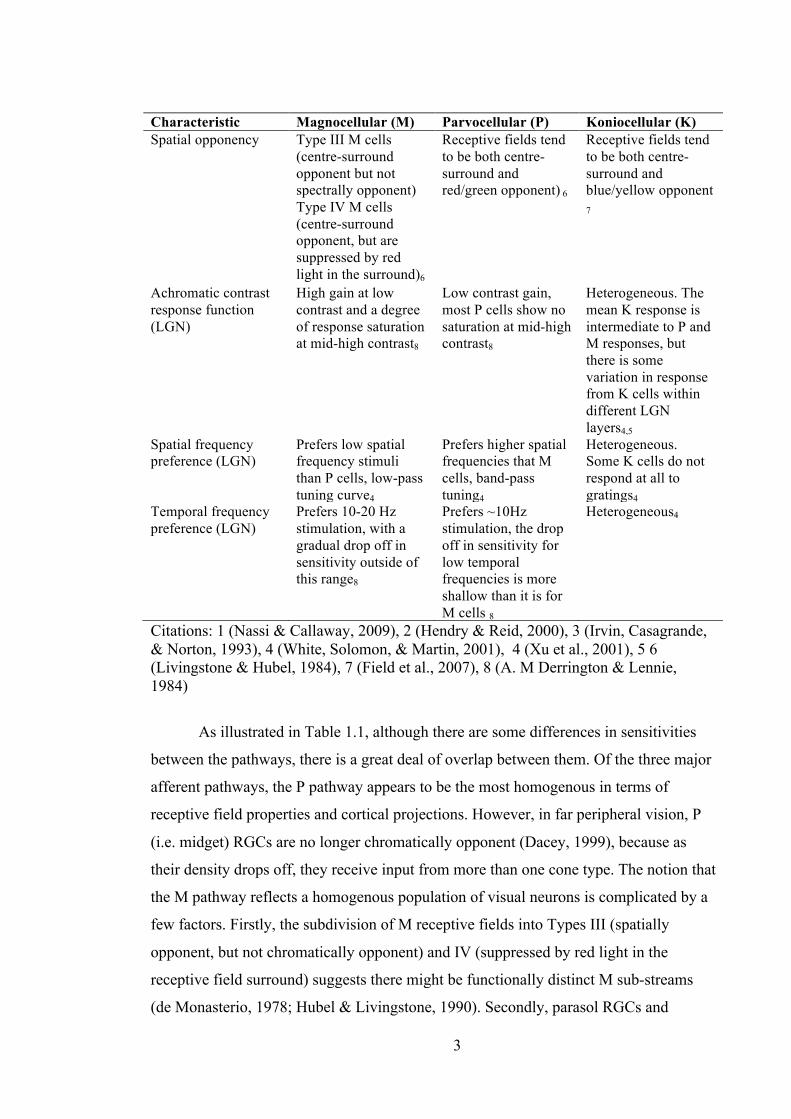
List of Tables Table 1.1 Characteristics of the afferent pathways ........................................................... 2
Table 7.1 Descriptive statistics for AQ, SIAS and state anxiety .................................. 156
xviii
List of Papers as Part of this Thesis Papers In Press
Hugrass, L., Verhellen, T., Morrall-Earney, E, Mallon, C & Crewther, D.P. (In Press).
The effects of red surrounds on visual magnocellular and parvocellular cortical
processing and perception. Journal of Vision
Papers In Submission
Hugrass, L., & Crewther, D. (In Submission). The afferent pathway origins of scalp
recorded visual evoked potentials - A review
Hugrass, L., & Crewther, D. (In Submission). A review of non-linear visual evoked
potential research into contributions from the human M and P pathways to
cortical vision.
Hugrass, L., Labuschagne, I., Price, A., & Crewther, D. (In Submission). Part 1:
Intranasal oxytocin modulates very early visual processing of emotional faces.
Hugrass, L., & Crewther, D. (In Submission). Part 2: Acute intranasal oxytocin does not
influence the non-linear temporal structure of cortical visual evoked potentials.
Papers In Preparation
Hugrass, L., & Crewther, D. (In Preparation). The temporal structure of evoked MEG
responses: Effects of chromatic saturation
xix
List of Additional Papers that do not Form a Part of this Thesis
Published Papers
Burt, A., Hugrass, L., Frith-Belvedere, T., & Crewther, D. (2017). Insensitivity to
Fearful Emotion for Early ERP Components in High Autistic Tendency Is
Associated with Lower Magnocellular Efficiency. Frontiers in human
neuroscience, 11, 495.
Jastrzebski, N. R., Hugrass, L. E., Crewther, S. G., & Crewther, D. P. (2017). Surround-
Masking Affects Visual Estimation Ability. Frontiers in integrative
neuroscience, 11, 7.
Hugrass, L., Slavikova, J., Horvat, M., Al Musawi, A., & Crewther, D. (2017).
Temporal brightness illusion changes color perception of “the dress”. Journal of
vision, 17(5), 6-6.
Riddell, N., Hugrass, L., Jayasuriya, J., Crewther, S. G., & Crewther, D. P. (2016). An
asymmetric outer retinal response to drifting sawtooth gratings. Journal of
neurophysiology, 115(5), 2349-2358.
Crewther, D. P., Brown, A., & Hugrass, L. (2016). Temporal structure of human
magnetic evoked fields. Experimental brain research, 234(7), 1987-1995.
Hugrass, L., & Crewther, D. (2012). Willpower and conscious percept: volitional
switching in binocular rivalry. PloS one, 7(4), e35963.
Papers In Submission
Eveline Mu, Laila Hugrass, David Crewther (2018) Red background facilitates high
spatial frequency fearful face processing in groups with high autistic tendency.
Frontiers in Neuroscience/Perception Science
Katie Wykes, Laila Hugrass, David Crewther (2018) Autistic personality is not a strong
predictor of binocular rivalry dynamics. Frontiers in Neuroscience/Perception
Science

xx
List of Presentations 2017 Australasian Cognitive Neurosciences Conference “The Effects of Chromatic
Saturation on Non-linear Evoked MEG Responses”
2017 Vision Science Society “The effects of visual surround on multifocal visual
evoked potentials”
2016 Australasian Cognitive Neurosciences Conference “Non-linear VEP analysis of
orientation selective surround suppression”
2016 Vision Science Society “Does early processing of low spatial frequency facial
emotion vary as a function of autistic tendency?”
2016 Experimental Psychology Conference “Pupil responses reflect perceived
brightness shifts in moving ramped gratings”
xxi
List of Abbreviations
ANOVA – Analysis of variance
AQ – Autism Spectrum Quotient
CRF – Contrast response function
EEG – Electroencephalography
K – Koniocellular
K1 – First-order Wiener kernel
K2.1 – First slice of the second-order
Wiener kernel
K2.2 – Second slice of the second-order
Wiener kernel
LGN – Lateral genicular nucleus
LMM – Linear mixed effects model
M – Magnocellular
MT/V5 – Middle temporal area V5,
M – Mean
m-sequence – Maximum length
sequence
MEG -Magnetoencephalography
mfVEP – Multifocal Visual Evoked
Potential
OXT – Oxytocin
P – Parvocellular
PBO – Placebo
RMS – Root mean square
SD – Standard deviation
SIAS – Social Interaction Anxiety Scale
STAI – State-trait anxiety inventory
ssVEP – steady state Visual Evoked
Potential
V1 – Primary visual cortex
V2 – Visual area 2
VEP – Visual Evoked Potential
VESPA - Visual Evoked Spread
Spectrum Analysis


1
Chapter 1: Introduction and Thesis Overview The magnocellular (M), parvocellular (P) and koniocellular (K) visual pathways
have been studied extensively in primates (e.g.; Casagrande, 1994; Hendry & Reid,
2000; Kaplan & Shapley, 1986; Livingstone & Hubel, 1988; Wiesel & Hubel, 1966).
The afferent pathways remain fairly well segregated from the retina, to the lateral
geniculate nucleus (LGN) and the respective input layers in the visual cortex (Nassi &
Callaway, 2009). However, due to interactions at the level of the cortex (Nealey &
Maunsell, 1994; Vidyasagar & Pammer, 2010), as well as overlapping sensitivities
(Derrington & Lennie, 1984; Xu et al., 2001), there is a healthy degree of scepticism as
to whether behavioural data or scalp-recorded signals can be meaningfully traced back
to specific subcortical visual pathways (Kaplan, 2014; Skottun, 2014; Skottun &
Skoyles, 2007, 2010).
Despite these difficulties, interest in the major afferent pathways has remained
strong owing to their different contributions to form, colour and motion processing
(Livingstone & Hubel, 1988), and a proposed role for the M system in the rapid
processing of behaviourally relevant input (Kveraga, Boshyan, & Bar, 2007; Vlamings,
Goffaux, & Kemner, 2009; Vuilleumier, Armony, Driver, & Dolan, 2003).
Furthermore, M pathway abnormalities are associated with a range of developmental of
disorders, including autism (McCleery, Akshoomoff, Dobkins, & Carver, 2009),
schizophrenia (Butler et al., 2006) and dyslexia (Lovegrove, 1996; Stein & Walsh,
1997). In order to infer contributions from the subcortical visual pathways to these brain
mechanisms and disorders, neuroscientists are faced with the challenge of developing
valid techniques for studying each pathway in isolation.
The remaining sections of this chapter present an introduction to the M, P and K
afferent pathways (§1.1), a description of the non-linear VEP technique for inferring M
and P contributions to cortical evoked responses (§ 1.2), and a chapter-by-chapter
overview of the thesis questions and aims (§ 1.4).
1.1 Overview afferent pathways At any point of the visual field, there are multiple types of retinal ganglion cells
(RGCs) that transmit different signals in parallel to the brain (Nassi & Callaway, 2009).
The most widely studied visual pathways have been the M, P and K projections from
2
the retina to V1 via the LGN; however, there are other visual pathways, including a
pathway to the cortex via the superior colliculus and pulvinar, which receives
predominantly M input (Bridge, Leopold, & Bourne, 2016; Warner, Kwan, & Bourne,
2012). Primate physiological studies of the major afferent pathways have been reviewed
in much greater detail elsewhere (Kaplan, 2014; Nassi & Callaway, 2009). To explain
the background and rationale for this thesis, I have summarised the characteristics of the
M, P and K pathways in Table 1, with citations to relevant review and empirical papers.
Table 1.1 Characteristics of the afferent pathways
Characteristic Magnocellular (M) Parvocellular (P) Koniocellular (K) Retinal geniculate cells (RGCs)
Parasol (analogous to cat Y cells), although the M pathway also receives input from smooth monostratified cells1
Midget (analogous to cat X cells) 1
Various, including small and large bistratified cells (analogous to cat W cells)1
LGN Layer Ventral layers 1 and
21 Dorsal layers 3,4,5,61 Mostly within (but
not restricted to) thin inter-laminar LGN layers. The dorsal, middle and ventral pairs of K layers appear to form separate sub-pathways2
V1 Input Layer 4Cα1 4Cβ1 Cytochrome oxidase rich regions of Layers 2/3 (also direct projections to MT/V5)2
Projections from LGN to cortex
~10% 1,2 ~ 80% 1,2 ~ 10% 1,2
Axons Thick, fast conduction1
Thin, slow conduction1
Thin,2 slow conduction3
Receptive field size Large4 Small4 Some small and some large4
Increase cell density and decrease in receptive field size with eccentricity
Yes5 Yes. There is a very high P: M ratio near the fovea 4,5
Yes, but more scattered than M and P, presumably due to heterogeneity of K cell types 4,5
Receptive field centres
Both ON and OFF subpopulations
Both ON and OFF subpopulations
Small bistratified cells: blue ON/ yellow OFF
Chromatic input Combination of L- and M- cone input to centre and surround.
Antagonistic L-cone and M-cone input (i.e.; red/green)
See above
3
Characteristic Magnocellular (M) Parvocellular (P) Koniocellular (K) Spatial opponency
Type III M cells (centre-surround opponent but not spectrally opponent) Type IV M cells (centre-surround opponent, but are suppressed by red light in the surround)6
Receptive fields tend to be both centre-surround and red/green opponent) 6
Receptive fields tend to be both centre-surround and blue/yellow opponent 7
Achromatic contrast response function (LGN)
High gain at low contrast and a degree of response saturation at mid-high contrast8
Low contrast gain, most P cells show no saturation at mid-high contrast8
Heterogeneous. The mean K response is intermediate to P and M responses, but there is some variation in response from K cells within different LGN layers4,5
Spatial frequency preference (LGN)
Prefers low spatial frequency stimuli than P cells, low-pass tuning curve4
Prefers higher spatial frequencies that M cells, band-pass tuning4
Heterogeneous. Some K cells do not respond at all to gratings4
Temporal frequency preference (LGN)
Prefers 10-20 Hz stimulation, with a gradual drop off in sensitivity outside of this range8
Prefers ~10Hz stimulation, the drop off in sensitivity for low temporal frequencies is more shallow than it is for M cells 8
Heterogeneous4
Citations: 1 (Nassi & Callaway, 2009), 2 (Hendry & Reid, 2000), 3 (Irvin, Casagrande, & Norton, 1993), 4 (White, Solomon, & Martin, 2001), 4 (Xu et al., 2001), 5 6 (Livingstone & Hubel, 1984), 7 (Field et al., 2007), 8 (A. M Derrington & Lennie, 1984)
As illustrated in Table 1.1, although there are some differences in sensitivities
between the pathways, there is a great deal of overlap between them. Of the three major
afferent pathways, the P pathway appears to be the most homogenous in terms of
receptive field properties and cortical projections. However, in far peripheral vision, P
(i.e. midget) RGCs are no longer chromatically opponent (Dacey, 1999), because as
their density drops off, they receive input from more than one cone type. The notion that
the M pathway reflects a homogenous population of visual neurons is complicated by a
few factors. Firstly, the subdivision of M receptive fields into Types III (spatially
opponent, but not chromatically opponent) and IV (suppressed by red light in the
receptive field surround) suggests there might be functionally distinct M sub-streams
(de Monasterio, 1978; Hubel & Livingstone, 1990). Secondly, parasol RGCs and
4
smooth monostriate RGCs, have similar receptive field properties and both appear to
project to the superior colliculus and ventral layers of the LGN, which suggests the
presences of parallel ‘M’ like channels (Crook et al., 2008).
It was once assumed that visual processing could be cleanly separated into the M
and P streams, however this assumption was complicated by the discovery of K cells
(Casagrande, 1994). The K layers of the LGN are populated by a heterogeneous group
of cells with different receptive field properties (Hendry & Reid, 2000), so it would not
make sense to design VEP stimuli aimed at targeting all K cells. On the other hand, the
subpopulation of K cells that transmit blue chromatic input to the cortex can be studied
based on responses to s-cone isolating stimuli (Chatterjee & Callaway, 2003). K
thalamocortical neurons are only slightly more numerous than those of the M pathway,
but they lack the power that M cells have to dominate cortical circuits, owing to their
high divergence factor and large axons (Hendry & Reid, 2000). This limits the degree to
which K signals are likely to contribute to scalp-recorded VEPs, so for the purpose of
this thesis, I focus mostly on putative M and P VEP signatures, while acknowledging
the possibility of some contribution from K cells.
After arriving at the input layers of V1, M P and K signals project to different
cortical regions, with the dorsal ‘vision for action’ stream receiving predominantly M
input and the ventral, ‘vision for perception’ stream receiving predominantly P input
(Goodale & Milner, 1992; Ungerleider & Mishkin, 1982). K cells mostly project to the
cytochrome oxidase blobs in V1 layers 2/3, as well as to the V1/V2 border, which
suggests they play an important role in colour processing; however there is also direct K
input from the LGN to MT/V5 (Hendry & Reid, 2000). Due to complex
interconnections between regions within the dorsal and ventral visual streams, the sub-
cortical afferent pathways are no longer segregated once their signals reach the cortex
(Kaplan, 2014). This means that it is difficult to design experiments to selectively target
contributions from the M, P or K pathways.
1.2 The non-linear VEP approach to studying the afferent streams There are several approaches to identifying M and P contributions to scalp-
recorded VEPs, including transient VEPs, steady state VEP, Visual Evoked Spread
Spectrum Analysis (VESPA) and non-linear temporal analysis of multifocal VEPs (e.g.;
Ellemberg, Hammarrenger, Lepore, Roy, & Guillemot, 2001; Klistorner, Crewther, &
Crewther, 1997; Lalor, Kelly, & Foxe, 2012; Zemon & Gordon, 2006). Of the

5
aforementioned techniques, non-linear analysis of diffuse mfVEPs provides the cleanest
separation of putative M and P VEP signals (reviewed, Chapter 2), so this technique
forms the basis for much of the work presented in the following chapters. Applications
of this technique are reviewed in Chapter 3, and non-linear VEP methodology was
applied for the experimental papers presented in Chapters 4, 5, and 7. This section
provides a brief introduction to the multifocal VEP technique.
For a linear system, it is possible to fully characterise the response to a train of
stimuli based on the sum of responses to each individual stimulus. Yet, due to temporal
non-linearities in the visual system, it is necessary to account for responses to the
preceding stimuli (Victor, 1992). There are many different methods for characterising
temporal non-linearities in the visual system (reviewed, Klein, 1992; Marmarelis &
Marmarelis, 1978; Sutter, 1992; Victor, 1992). For the purpose of this thesis, we focus
specifically on the use of multifocal binary m-sequence stimulation, and Weiner kernel
decomposition of the non-linear temporal VEP kernels (Sutter, 1992).
An m-sequence (maximum length sequence) is a type of pseudorandom binary
sequence of length 2m -1 that contains all of the possible configurations of m
consecutive elements exactly once, except for the all zero configuration (Golomb,
1967). In a multifocal VEP experiment, an m-sequence modulates the diffuse luminance
(e.g., Klistorner et al., 1997) or pattern contrast (e.g., Baseler & Sutter, 1997) between
binary levels. The m-sequences for separate patches are temporally de-correlated from
each other, so it is possible to record independent responses from across the visual field.
The m-sequence for each patch is usually updated at the frame rate of the display screen
(i.e., 60 – 100 Hz).
Sutter developed a method to cross-correlate visual responses with the m-
sequence, based on Fast Walsh transform (Sutter, 1992). This allows for rapid Wiener
kernel decomposition with a single cross-correlation, so that one can easily investigate
the response recovery of the visual system to a full range of binary stimulation. In a
linear system, the first-order kernel (K1) is the impulse response function. The first
(K2.1) and second (K2.2) slices of the second order kernel measure non-linear temporal
interactions over one and two video frames respectively. The nature of the kernel
responses depends on the timing and form of the stimuli. For diffuse luminance
stimulation, there are a robust K1, K2.1 and K2.2 responses, yet for pattern reversal
stimulation, there is not much power in the K1 response (Baseler & Sutter, 1997). As
6
the frame rate slows, the resulting VEP kernels tend to approximate waveforms
recorded using conventional (i.e.; transient) VEP paradigms (Fortune & Hood, 2003).
Klistorner et al. (1997) presented diffuse (i.e. unpatterned) multifocal, m-
sequence stimuli, and varied the degree of temporal contrast between the binary
luminance levels. Peak-to-peak amplitudes of the major waveforms were plotted against
temporal luminance contrast. Modelling of the K1 waveform suggests that it reflects the
sum of two components, one with high contrast gain and rapid saturation (putative M)
and the other with lower contrast gain but no saturation (putative P). Consistent with an
M generator, the K2.1 response had high contrast gain and saturated at mid contrast
levels. Consistent with a P generator, the main K2.2 waveform gradually increased in
amplitude with contrast, and the contrast response function showed no sign of
saturation. More recently, it has been shown that the contrast response function of the
early K2.2 waveform (which is lower in amplitude than the main K2.2 waveform) is
consistent with an M pathway generator (Jackson et al., 2013).
There are several advantages to using non-linear VEP analyses to identify
putative M and P signals. Firstly, it is advantageous to stimulate with small multifocal
patches, because it minimises temporal blurring. When VEP stimuli activate large
regions of V1, temporal blurring can occur due to changes in the ratio of M and P cells
with eccentricity, and individual differences in the gross anatomy of visual field maps
can alter the orientation of cortical sources of VEP signals (Baseler & Sutter, 1997;
Baseler, Sutter, Klein, & Carney, 1994). Secondly, fast m-sequence stimulation evokes
responses that are well localised to the primary visual cortex, compared with the
conventional, transient VEP signal, where there is considerable input from extrastriate
regions to the waveforms (Fortune & Hood, 2003). Thirdly, due to relatively clean
separation of M and P signals into the main K2.1 and K2.2 waveforms, it is possible to
compare putative M and P responses to the same stimuli; whereas other VEP techniques
often rely on different stimuli to target the M and P systems (i.e.; achromatic low
contrast versus isoluminant red/green stimulation).
1.3 Outline of thesis chapters and aims The overall aim of this body of work is to use non-invasive neurophysiological
and psychophysical techniques to infer cortical processing of input from the M and P
visual pathways. This thesis presents two review chapters and four experimental
chapters that address this general aim. As a consequence of the format there is some
7
unavoidable overlap in the background information and methodological explanations. In
order to communicate how each chapter contributes to the overall body of work, I have
included a guide at the start of each chapter, as well as short dot-pointed highlights of
the key and novel findings. All of the research conducted for this thesis was carried out
in accordance with the Declaration of Helsinki and the Swinburne Human Research
Ethics committee.
Chapters 2 and 3 are review papers that have been submitted for publication.
These chapters review evidence for different electrophysiological techniques that have
been used to investigate M, P and K processing, and identify future directions for non-
linear VEP research into the human M and P streams. Chapter 2 evaluates different
scalp-recorded VEP techniques for investigating the afferent visual pathways. The
techniques reviewed include transient VEP, steady state VEP, non-linear analysis of
multifocal VEP, and Visual Evoked Spread Spectrum Analysis (VESPA).
The review paper presented in Chapter 3 focuses specifically on the fast m-
sequence, non-linear VEP approach for measuring putative M and P signals. This
chapter begins by describing the afferent pathways, and evaluating evidence that the
main K2.1 and K2.2 waveforms reflect M and P input to the cortex respectively. The
paper goes on to review experiments from over the past 20 years that have applied this
technique to investigate the M and P pathways in humans. Specifically, it reviews
studies that used non-linear VEP signatures of M and P processing to draw conclusions
about: typical development of the visual system, individual differences in visual
processing associated with autism, dyslexia and dyscalculia, and the nature of chromatic
surface and form representations in V1.
Chapter 4 presents an original research paper that evaluates the claim that
presenting stimuli on a red background selectively suppresses M contributions to visual
processing. This work was based on primate single cell studies that identified a sub-
population of M cells (Type IV) that exhibit tonic suppression when red light is
presented in their receptive field surround (de Monasterio, 1978; Derrington,
Krauskopf, & Lennie, 1984; Hubel & Livingstone, 1990; Livingstone & Hubel, 1988).
Many human behavioural studies have been conducted based on the assumption that
presenting visual stimuli on a red backgrounds blocks M contributions to visual
processing (West, Anderson, Bedwell, & Pratt, 2010). There has been a surprising lack
of investigation into the validity of this assumption. The experiments presented in this

8
chapter used both non-linear VEP and steady and pulsed pedestal psychophysics to
investigate these claims.
Chapter 5 presents an original research paper (in preparation) that investigated
the effects of chromatic saturation on the non-linear temporal structure of cortical
signals, as measured with MEG. In an EEG study, Crewther and Crewther (2010)
analysed non-linear temporal responses to a diffuse patch that pseudo-randomly
reversed between binary grey levels. K2.1 amplitudes greatly increased when blue or
red colour was added to the darker grey, even though the luminance contrast was held
constant (Crewther & Crewther, 2010). As described in Section 1.2, under conditions of
achromatic stimulation the K2.1 waveform appears to reflect input from the M pathway
(Klistorner et al., 1997). Given that the M pathway does not contribute to colour
perception (Livingstone & Hubel, 1988), it was surprising that K2.1 amplitudes
increased with the level of chromatic saturation. Chapter 5 investigates the cortical
sources of non-linear VEP signal that are sensitive to chromatic saturation.
Chapters 6 and 7 present the results of a two-part original research paper that
was designed to investigate the effects of oxytocin on visual processing of affective and
non-affective stimuli. Oxytocin is a neuropeptide that is well known for its effects on
social cognition (Bartz & Hollander, 2008). Evidence that oxytocin influences
functional coupling between the amygdala and superior colliculi (Gamer, Zurowski, &
Büchel, 2010) suggests that it might have profound effects on the earliest stages of
visual processing (Ebitz, Watson, & Platt, 2013). Rapid affective processing involves
the projection of coarse input from the M pathway to the superior colliculus, LGN,
amygdala and frontal cortices (Bar et al., 2006; Kveraga, Boshyan, & Bar, 2007; Pessoa
& Adolphs, 2010).
The data presented in Chapters 6 and 7 were collected from the same sample of
participants, in a double-blind, placebo controlled crossover study. Participants
completed two EEG sessions, one after receiving intranasal oxytocin and the other after
receiving a placebo. The aim of the experiment presented in Chapter 6 was to
investigate the timing of the effects of oxytocin on visual evoked responses to fearful,
happy and neutral faces. The aim of the experiment presented in Chapter 7 was to
investigate whether oxytocin specifially modulates visual processing of non-affective
input from the M or P pathways.

9
Chapter 8 provides a general discussion of the body of work presented within
this thesis. It summarises the novel findings, outlines key contributions to knowledge in
the area, and discusses implications for understanding how input from the afferent
visual pathways contributes to cortical signals and perception. This leads to a discussion
of the limitations associated with studying the human M and P pathways, and some
suggestions for future research.
1.4 References Bartz, J. A., & Hollander, E. (2008). Oxytocin and experimental therapeutics in autism
spectrum disorders. Progress in brain research, 170, 451-462.
Baseler, H., & Sutter, E. (1997). M and P components of the VEP and their visual field
distribution. Vision Research, 37(6), 675-690.
Baseler, H., Sutter, E., Klein, S., & Carney, T. (1994). The topography of visual evoked
response properties across the visual field. Electroencephalography and clinical
Neurophysiology, 90(1), 65-81.
Bridge, H., Leopold, D. A., & Bourne, J. A. (2016). Adaptive pulvinar circuitry
supports visual cognition. Trends in cognitive sciences, 20(2), 146-157.
Butler, P. D., Martinez, A., Foxe, J. J., Kim, D., Zemon, V., Silipo, G., . . . Javitt, D. C.
(2006). Subcortical visual dysfunction in schizophrenia drives secondary cortical
impairments. Brain, 130(2), 417-430.
Casagrande, V. (1994). A third parallel visual pathway to primate area V1. Trends in
neurosciences, 17(7), 305-310.
Chatterjee, S., & Callaway, E. M. (2003). Parallel colour-opponent pathways to primary
visual cortex. Nature, 426(6967), 668.
Crewther, D. P., & Crewther, S. G. (2010). Different temporal structure for form versus
surface cortical color systems–evidence from chromatic non-linear VEP. PLoS
One, 5(12), e15266.
Crook, J. D., Peterson, B. B., Packer, O. S., Robinson, F. R., Gamlin, P. D., Troy, J. B.,
& Dacey, D. M. (2008). The smooth monostratified ganglion cell: evidence for
spatial diversity in the Y-cell pathway to the lateral geniculate nucleus and
superior colliculus in the macaque monkey. Journal of Neuroscience, 28(48),
12654-12671.
10
Dacey, D. M. (1999). Primate retina: cell types, circuits and color opponency. Progress
in retinal and eye research, 18(6), 737-763.
de Monasterio, F. M. (1978). Properties of concentrically organized X and Y ganglion
cells of macaque retina. Journal of Neurophysiology, 41(6), 1394-1417.
Derrington, A. M., Krauskopf, J., & Lennie, P. (1984). Chromatic mechanisms in lateral
geniculate nucleus of macaque. The Journal of Physiology, 357, 241-265.
Derrington, A. M., & Lennie, P. (1984). Spatial and temporal contrast sensitivities of
neurones in lateral geniculate nucleus of macaque. The Journal of Physiology,
357(1), 219-240.
Ebitz, R. B., Watson, K. K., & Platt, M. L. (2013). Oxytocin blunts social vigilance in
the rhesus macaque. Proceedings of the National Academy of Sciences, 110(28),
11630-11635.
Ellemberg, D., Hammarrenger, B., Lepore, F., Roy, M.-S., & Guillemot, J.-P. (2001).
Contrast dependency of VEPs as a function of spatial frequency: the
parvocellular and magnocellular contributions to human VEPs. Spatial vision,
15(1), 99-111.
Field, G. D., Sher, A., Gauthier, J. L., Greschner, M., Shlens, J., Litke, A. M., &
Chichilnisky, E. (2007). Spatial properties and functional organization of small
bistratified ganglion cells in primate retina. Journal of Neuroscience, 27(48),
13261-13272.
Fortune, B., & Hood, D. C. (2003). Conventional pattern-reversal VEPs are not
equivalent to summed multifocal VEPs. Investigative Ophthalmology & Visual
Science, 44(3), 1364-1375.
Gamer, M., Zurowski, B., & Büchel, C. (2010). Different amygdala subregions mediate
valence-related and attentional effects of oxytocin in humans. Proceedings of the
National Academy of Sciences, 107(20), 9400-9405.
doi:10.1073/pnas.1000985107
Golomb, S. W. (1967). Shift register sequences: Holden-Day.
Goodale, M. A., & Milner, A. D. (1992). Separate visual pathways for perception and
action. Trends in neurosciences, 15(1), 20-25.
Hendry, S. H., & Reid, R. C. (2000). The koniocellular pathway in primate vision.
Annual review of neuroscience, 23(1), 127-153.
11
Hubel, D. H., & Livingstone, M. S. (1990). Color and contrast sensitivity in the lateral
geniculate body and primary visual cortex of the macaque monkey. Journal of
Neuroscience, 10(7), 2223-2237.
Irvin, G. E., Casagrande, V. A., & Norton, T. T. (1993). Center/surround relationships
of magnocellular, parvocellular, and koniocellular relay cells in primate lateral
geniculate nucleus. Visual Neuroscience, 10(2), 363-373.
Jackson, B. L., Blackwood, E. M., Blum, J., Carruthers, S. P., Nemorin, S., Pryor, B.
A., . . . Crewther, D. P. (2013). Magno-and parvocellular contrast responses in
varying degrees of autistic trait. PLoS ONE, 8(6), e66797.
Kaplan, E. (2014). The M, P and K pathways of the primate visual system revisited. The
new visual neurosciences (Werner JS, Chalupa LM, eds.). Cambridge, MA:
Massachusetts Institute of Technology.
Kaplan, E., & Shapley, R. M. (1986). The primate retina contains two types of ganglion
cells, with high and low contrast sensitivity. Proceedings of the National
Academy of Sciences, 83(8), 2755-2757.
Klein, S. (1992). Optimizing the Estimation of Nonlinear Kernels. In R. B. Pinter & B.
Nabet (Eds.), Nonlinear Vision: Determination of Neural Receptive Fields,
Function, and Networks (pp. 109-170). Cleveland, Ohio: CRC Press.
Klistorner, A., Crewther, D. P., & Crewther, S. G. (1997). Separate magnocellular and
parvocellular contributions from temporal analysis of the multifocal VEP. Vision
Research, 37(15), 2161-2169.
Kveraga, K., Boshyan, J., & Bar, M. (2007). Magnocellular Projections as the Trigger
of Top-Down Facilitation in Recognition. The Journal of Neuroscience, 27(48),
13232-13240. doi:10.1523/jneurosci.3481-07.2007
Lalor, E. C., Kelly, S. P., & Foxe, J. J. (2012). Generation of the VESPA response to
rapid contrast fluctuations is dominated by striate cortex: evidence from
retinotopic mapping. Neuroscience, 218, 226-234.
Livingstone, M. S., & Hubel, D. (1984). Anatomy and physiology of a color system in
the primate visual cortex. The Journal of Neuroscience, 4(1), 309-356.
Livingstone, M. S., & Hubel, D. (1988). Segregation of form, color, movement, and
depth: anatomy, physiology, and perception. Science, 240(4853), 740-749.

12
Lovegrove, B. (1996). Dyslexia and a transient/magnocellular pathway deficit: The
current situation and future directions. Australian Journal of Psychology, 48(3),
167-171.
Marmarelis, P. Z., & Marmarelis, V. Z. (1978). Analysis of Physiological Systems The
White-Noise Approach: Boston, MA : Springer US.
McCleery, J. P., Akshoomoff, N., Dobkins, K. R., & Carver, L. J. (2009). Atypical Face
Versus Object Processing and Hemispheric Asymmetries in 10-Month-Old
Infants at Risk for Autism. Biological Psychiatry, 66(10), 950-957.
doi:10.1016/j.biopsych.2009.07.031
Nassi, J. J., & Callaway, E. M. (2009). Parallel processing strategies of the primate
visual system. Nature Reviews Neuroscience, 10(5), 360-372.
Nealey, T., & Maunsell, J. (1994). Magnocellular and parvocellular contributions to the
responses of neurons in macaque striate cortex. Journal of Neuroscience, 14(4),
2069-2079.
Skottun, B. C. (2014). A few observations on linking VEP responses to the magno-and
parvocellular systems by way of contrast–response functions. International
Journal of Psychophysiology, 91(3), 147-154.
Skottun, B. C., & Skoyles, J. R. (2007). Some remarks on the use of visually evoked
potentials to measure magnocellular activity. Clinical Neurophysiology, 118(9),
1903-1905.
Skottun, B. C., & Skoyles, J. R. (2010). On identifying magnocellular and parvocellular
responses on the basis of contrast-response functions. Schizophrenia bulletin,
37(1), 23-26.
Stein, J., & Walsh, V. (1997). To see but not to read; the magnocellular theory of
dyslexia. Trends in Neurosciences, 20(4), 147-152.
Sutter, E. (1992). A deterministic approach to nonlinear systems analysis. In R. B.
Pinter & B. Nabet (Eds.), Nonlinear Vision: Determination of Neural Receptive
Fields, Function, and Networks (pp. 171-220). Cleveland, Ohio: CRC Press.
Ungerleider, L. G., & Mishkin, M. (1982). Two cortical visual systems. . In D. J. Ingle,
M. A. Goodale, & R. J. W. Mansfield (Eds.), Analysis of visual behavior (pp.
549-586). Cambridge: MIT Press.
Victor, J. D. (1992). Nonlinear Systems Analysis in Vision: Overview of Kernel
Methods. In R. B. Pinter & B. Nabet (Eds.), Nonlinear Vision: Determination of
13
Neural Receptive Fields, Function, and Networks (pp. 1-38). Cleveland, Ohio:
CRC Press.
Vidyasagar, T. R., & Pammer, K. (2010). Dyslexia: a deficit in visuo-spatial attention,
not in phonological processing. Trends in cognitive sciences, 14(2), 57-63.
Vlamings, P. H. J. M., Goffaux, V., & Kemner, C. (2009). Is the early modulation of
brain activity by fearful facial expressions primarily mediated by coarse low
spatial frequency information? Journal of Vision, 9(5). doi:Artn12
10.1167/9.5.12
Vuilleumier, P., Armony, J. L., Driver, J., & Dolan, R. J. (2003). Distinct spatial
frequency sensitivities for processing faces and emotional expressions. Nature
neuroscience, 6(6), 624-631. doi:10.1038/nn1057
Warner, C. E., Kwan, W. C., & Bourne, J. A. (2012). The early maturation of visual
cortical area MT is dependent on input from the retinorecipient medial portion
of the inferior pulvinar. Journal of Neuroscience, 32(48), 17073-17085.
West, G. L., Anderson, A. K., Bedwell, J. S., & Pratt, J. (2010). Red diffuse light
suppresses the accelerated perception of fear. Psychological Science, 21(7), 992-
999.
White, A. J., Solomon, S. G., & Martin, P. R. (2001). Spatial properties of koniocellular
cells in the lateral geniculate nucleus of the marmoset Callithrix jacchus. The
Journal of Physiology, 533(2), 519-535.
Wiesel, T. N., & Hubel, D. H. (1966). Spatial and chromatic interactions in the lateral
geniculate body of the rhesus monkey. Journal of Neurophysiology, 29(6),
1115-1156.
Xu, X., Ichida, J. M., Allison, J. D., Boyd, J. D., Bonds, A., & Casagrande, V. A.
(2001). A comparison of koniocellular, magnocellular and parvocellular
receptive field properties in the lateral geniculate nucleus of the owl monkey
(Aotus trivirgatus). The Journal of Physiology, 531(1), 203-218.
Zemon, V., & Gordon, J. (2006). Luminance-contrast mechanisms in humans: visual
evoked potentials and a nonlinear model. Vision Research, 46(24), 4163-4180.
14
Chapter 2: The Afferent Pathway Origins of Scalp Recorded Visual
Evoked Potentials - A Review
2.1 Chapter guide
Hugrass, L., & Crewther, D. (In Submission). The afferent pathway origins of scalp
recorded visual evoked potentials - A review
This review chapter presents a re-formatted version of the article cited above,
which has been submitted to the European Journal of Neuroscience as a review paper.
In this chapter, I reviewed a range of non-invasive VEP techniques that are used to
investigate the human M and P pathways, including transient VEP, ssVEP, nonlinear
VEP and Visual Evoked Spread Spectrum Analysis (VESPA). The aim of this chapter
was to review evidence as to whether it is possible to meaningfully separate
contributions from the human M, P and K pathways to scalp-recorded VEPs, and to
identify the advantages and disadvantages of the different VEP techniques.
15
2.2 Abstract It is not an easy task to attribute scalp-recorded visual evoked potential (VEP)
signals to their origins in the LGN afferent pathways. This is largely due to the non-
invasive restriction on recording techniques in humans. Primate studies have shown that
the magnocellular (M), parvocellular (P) and koniocellular (K) pathways have different
sensitivities to luminance contrast, spatial frequency, colour, and motion. On the basis
of these results, researchers have designed stimuli to preference different afferent
pathways, and then inferred their contributions to components of scalp-recorded VEPs
in humans. Here we review studies that have used transient, steady state, multifocal
(i.e., fast m-sequence) and VESPA approaches to study afferent inputs to VEP signals.
We evaluate evidence as to whether input from the human M, P and K pathways can be
separated using VEPs, and discuss advantages and disadvantages of the different VEP
techniques.
16
2.3 Introduction Visual pathways from the retina to the striate cortex form partly anatomically
and physiologically distinct magnocellular (M), parvocellular (P) and koniocellular (K)
pathways. The major afferent visual pathways have been well studied in primate single
cell, viral transfection and optical imaging studies (reviewed, Kaplan, 2014; Nassi &
Callaway, 2009). Beyond the input layers of V1, there are complex interactions between
inputs from each afferent pathway (Nealey & Maunsell, 1994; Vidyasagar, Kulikowski,
Lipnicki, & Dreher, 2002). This makes it difficult to study the human M, P and K
systems non-invasively. Due to differences in the temporal and spatial receptive field
properties of M, P and K cells, as well as differences in their cortical projections, it has
been proposed that the afferent pathways contribute differently to higher-level
perceptual and cognitive tasks (Bullier, 2001; Kveraga, Boshyan, & Bar, 2007;
Laycock, Crewther, & Crewther, 2007). Of particular interest, M pathway abnormalities
have been implicated in a range of neurodevelopmental disorders (Laycock et al., 2007;
Lovegrove, 1996; Stein, 2014). Consequently, many researchers have worked on
developing scalp recorded visual evoked potential (VEP) paradigms to isolate the
afferent pathways.
2.4 Primate studies of the afferent visual pathways Primate physiological studies of the afferent visual pathways have been
reviewed in detail elsewhere (Kaplan, 2014; Nassi & Callaway, 2009). For the reader’s
convenience, this section provides a brief summary of the M, P and K pathways. M
retinal ganglion cells (i.e.; parasol cells, which are analogous to Y cells in cats) have
large cell bodies and thick axons that project to the ventral two LGN layers, and then to
input layer 4Cα of V1. M receptive fields are large, with spatially opponent ON- or
OFF-centres. M cells do not exhibit chromatically opponent responses; however there is
a subpopulation of ‘Type IV’ M cells, that are suppressed when red light is presented in
their receptive field surrounds (de Monasterio, 1978; Derrington, Krauskopf, & Lennie,
1984; Livingstone & Hubel, 1984; Wiesel & Hubel, 1966). M cells have a preference
for low spatial frequency, high temporal frequency stimulation. M contrast response
functions (CRFs) exhibit high gain at low contrast levels, and saturate at medium to
high contrasts (Kaplan & Shapley, 1986).
P retinal ganglion cells (i.e. midget cells, which are analogous to X cells in cats)
have much smaller somata and dendritic field spread than M cells, and have relatively
17
thin axons that project to the dorsal four LGN layers and the trans-synaptically project
to input layer 4Cβ in V1. The density of P cells is very high around the fovea, but there
is a steep drop off in the ratio of P to M cells at greater eccentricities (Dacey, 1993). P
receptive fields have ON- or OFF-centres, with red-green chromatically opponent and
spatially opponent responses. In comparison to M cells, P cells have lower luminance
contrast sensitivity, with non-saturating CRFs. Some evidence suggests that P cells do
not respond to stimuli with Michelson contrasts lower than approximately 8% (Tootell,
Hamilton, & Switkes, 1988).
K cells (konio: Greek, dust, which are analogous to W cells in cats) are a group
of small cells, which were initially ignored by physiologists who focused on the larger
M and P cells (Casagrande, 1994). K cells have thin axons that project to regions in
between layers of the LGN, and then to the upper layers of V1, mostly close to, or
within the cytochrome oxidase blobs (Hendry & Reid, 2000). The receptive field
properties of K cells are heterogeneous. Some K cells have CRFs similar to those of M
cells or P cells, while cells in the middle K layers of the LGN receive short-wave length
cone input from small bistratified and large sparse retinal ganglion cells, and transmit
input to the cytochrome oxidase blob centres in V1 (Chatterjee & Callaway, 2003; ,
Martin & Lee, 2014; Szmajda et al., 2008; White, Solomon, & Martin, 2001). While it
was once thought that the afferent pathways could be cleanly separated into the M and P
streams, the study of K cells has shown there are at least five parallel afferent streams
(Hendry & Reid, 2000).
2.5 Human VEP analyses of the afferent visual pathways
Several researchers have attempted to identify VEP components originating
from the M, P and K pathways, based on what is known from primate studies of
achromatic contrast response functions, spatial frequency preferences, chromatic
sensitivity, temporal response characteristics and changes in response to stimulation
across the visual field. For instance, it has been proposed that VEPs to low luminance
contrast stimulation rely on the M pathway, that red-green colour vision is highly
dependent on the P pathway, and that the K subpopulation that transmits s-cone input
can be inferred based on responses to tritan (blue-yellow) stimuli (e.g.; Barboni et al.,
2013; Foxe et al., 2008).
When attempting to separate afferent contributions to VEP signals, it is
worthwhile considering their cortical sources. Although the afferent streams target
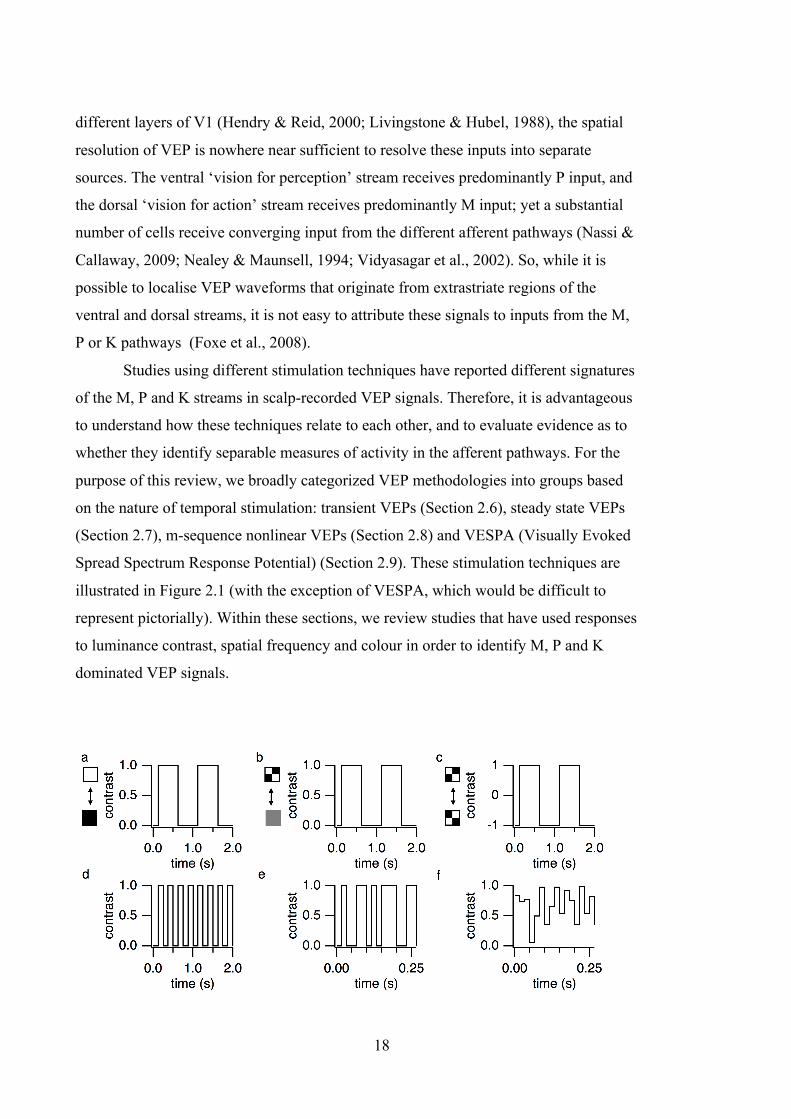
18
different layers of V1 (Hendry & Reid, 2000; Livingstone & Hubel, 1988), the spatial
resolution of VEP is nowhere near sufficient to resolve these inputs into separate
sources. The ventral ‘vision for perception’ stream receives predominantly P input, and
the dorsal ‘vision for action’ stream receives predominantly M input; yet a substantial
number of cells receive converging input from the different afferent pathways (Nassi &
Callaway, 2009; Nealey & Maunsell, 1994; Vidyasagar et al., 2002). So, while it is
possible to localise VEP waveforms that originate from extrastriate regions of the
ventral and dorsal streams, it is not easy to attribute these signals to inputs from the M,
P or K pathways (Foxe et al., 2008).
Studies using different stimulation techniques have reported different signatures
of the M, P and K streams in scalp-recorded VEP signals. Therefore, it is advantageous
to understand how these techniques relate to each other, and to evaluate evidence as to
whether they identify separable measures of activity in the afferent pathways. For the
purpose of this review, we broadly categorized VEP methodologies into groups based
on the nature of temporal stimulation: transient VEPs (Section 2.6), steady state VEPs
(Section 2.7), m-sequence nonlinear VEPs (Section 2.8) and VESPA (Visually Evoked
Spread Spectrum Response Potential) (Section 2.9). These stimulation techniques are
illustrated in Figure 2.1 (with the exception of VESPA, which would be difficult to
represent pictorially). Within these sections, we review studies that have used responses
to luminance contrast, spatial frequency and colour in order to identify M, P and K
dominated VEP signals.
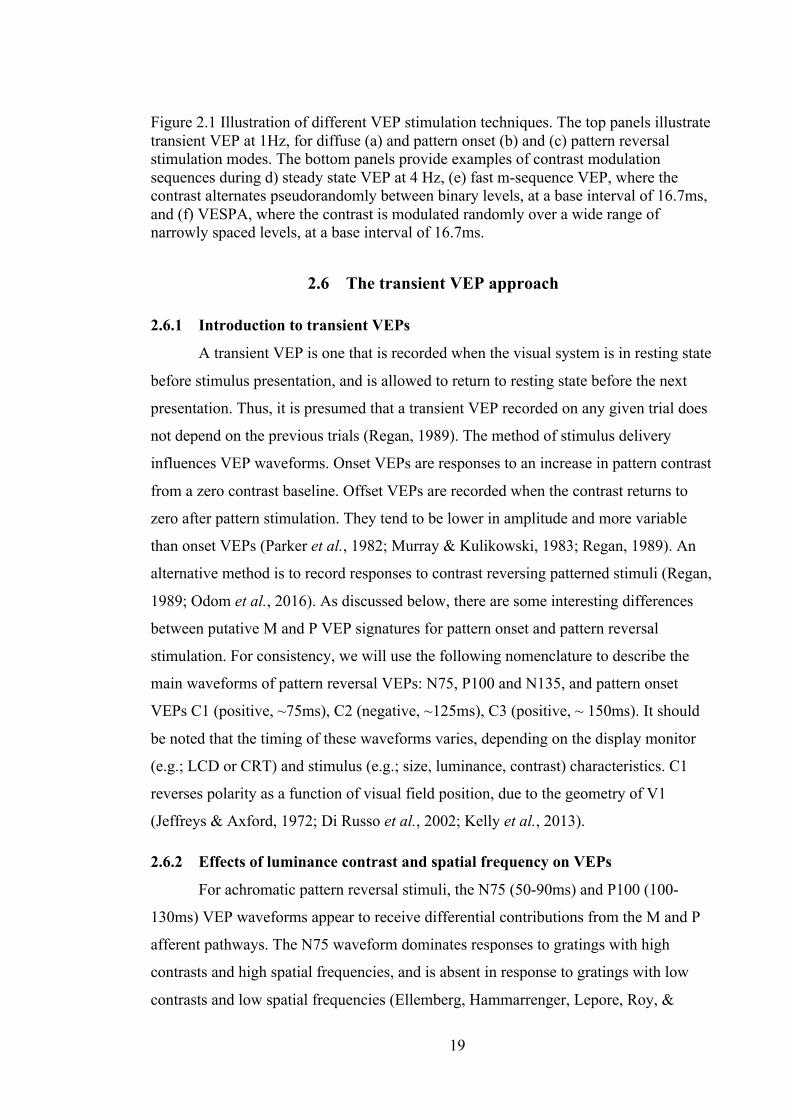
19
Figure 2.1 Illustration of different VEP stimulation techniques. The top panels illustrate transient VEP at 1Hz, for diffuse (a) and pattern onset (b) and (c) pattern reversal stimulation modes. The bottom panels provide examples of contrast modulation sequences during d) steady state VEP at 4 Hz, (e) fast m-sequence VEP, where the contrast alternates pseudorandomly between binary levels, at a base interval of 16.7ms, and (f) VESPA, where the contrast is modulated randomly over a wide range of narrowly spaced levels, at a base interval of 16.7ms.
2.6 The transient VEP approach
2.6.1 Introduction to transient VEPs
A transient VEP is one that is recorded when the visual system is in resting state
before stimulus presentation, and is allowed to return to resting state before the next
presentation. Thus, it is presumed that a transient VEP recorded on any given trial does
not depend on the previous trials (Regan, 1989). The method of stimulus delivery
influences VEP waveforms. Onset VEPs are responses to an increase in pattern contrast
from a zero contrast baseline. Offset VEPs are recorded when the contrast returns to
zero after pattern stimulation. They tend to be lower in amplitude and more variable
than onset VEPs (Parker et al., 1982; Murray & Kulikowski, 1983; Regan, 1989). An
alternative method is to record responses to contrast reversing patterned stimuli (Regan,
1989; Odom et al., 2016). As discussed below, there are some interesting differences
between putative M and P VEP signatures for pattern onset and pattern reversal
stimulation. For consistency, we will use the following nomenclature to describe the
main waveforms of pattern reversal VEPs: N75, P100 and N135, and pattern onset
VEPs C1 (positive, ~75ms), C2 (negative, ~125ms), C3 (positive, ~ 150ms). It should
be noted that the timing of these waveforms varies, depending on the display monitor
(e.g.; LCD or CRT) and stimulus (e.g.; size, luminance, contrast) characteristics. C1
reverses polarity as a function of visual field position, due to the geometry of V1
(Jeffreys & Axford, 1972; Di Russo et al., 2002; Kelly et al., 2013).
2.6.2 Effects of luminance contrast and spatial frequency on VEPs
For achromatic pattern reversal stimuli, the N75 (50-90ms) and P100 (100-
130ms) VEP waveforms appear to receive differential contributions from the M and P
afferent pathways. The N75 waveform dominates responses to gratings with high
contrasts and high spatial frequencies, and is absent in response to gratings with low
contrasts and low spatial frequencies (Ellemberg, Hammarrenger, Lepore, Roy, &
20
Guillemot, 2001). P100 latencies tend to be shorter for checkerboards with larger check
sizes (Shawkat & Kriss, 1998). For low spatial frequency patterns, P100 amplitudes are
measurable even at low contrast and saturate at mid to high contrast (Souza, Gomes,
Saito, da Silva Filho, & Silveira, 2007). For high spatial frequency patterns, P100
amplitudes increase more steeply with contrast and do not appear to saturate from
medium to high contrast (Rudvin, Valberg, & Kilavik, 2000). Taken together, these
results suggest that the N75 waveform is dominated by input from the P pathway, that
the P100 response to high contrast, high spatial frequency patterns is dominated by
input from the P pathway, and that the P100 response to low contrast, low spatial
frequency patterns is dominated by input from the M pathway.
The major C1 and P1 peaks of onset-offset VEP responses also appear to reflect
differential contributions from the M and P pathways (Hall et al., 2005; Jones & Keck,
1978; Murphy, Kelly, Foxe, & Lalor, 2012; Parker, Salzen, & Lishman, 1982). Some
early studies reported that for low spatial frequency pattern onset VEPs, a fast-latency
N0-P0 (60-80ms) waveform emerges prior to the C1-P1 waveform (90-130ms) (Jones
& Keck, 1978). Consistent with an M generator; N0-P0 amplitudes saturate at low
contrast, and as the spatial frequency of the pattern decreases, N0 amplitudes increase
(Jones & Keck, 1978) and latencies decrease (Parker et al., 1982). However, for most
other studies, C1 is the earliest reported waveform in the pattern-onset VEP (Foxe et al.,
2008; Hall et al., 2005; Marcar & Jäncke, 2016).
Foxe et al. (2008) used high-density EEG to record pattern onset VEPs and to
investigate the spatiotemporal dynamics of C1 generation. Consistent with a P
generator, C1 amplitudes were maximal in response to an achromatic, high contrast
check pattern (which should stimulate M, P and K cells), and for an isoluminant red-
green pattern (which should stimulate P, and possibly K cells). The C1 waveform
disappeared in response to a low contrast achromatic pattern (which should only
stimulate M cells), despite the fact that a strong P1 waveform was observed. These
results indicate that the initial volley of M input to the striate cortex does not contribute
to scalp recorded C1 waveforms.
Hall et al. (2005) used MEG to investigate the cortical sources of pattern onset
VEP waveforms. The analyses revealed striate and extrastriate sources, with CRFs that
were consistent with those of P and M cells respectively (Kaplan & Shapley, 1986).
This may account for some disparities in previous EEG studies that recorded from
21
occipital or lateral sites. Hall et al. averaged these source responses over a broad time
window, so it is unclear whether these sources specifically reflect the C1 or P1
responses. However, the lack of correlation between C1 and P1 amplitudes (Murphy et
al., 2012) supports the argument that they originate from separate sources. Thus, it is
likely that the C1 waveform is generated in V1, and that the P1 waveform reflects
extrastriate contributions.
Marcar and Jäncke (2016) attempted to reconcile differences in the
manifestation of M and P characteristics to reversal and onset VEPs. Source localization
of pattern-reversal VEPs showed that N75 responses are maximal at the occipital pole,
and P100 amplitudes are higher in the surrounding areas. Pattern-reversal VEP
amplitudes increased with the area of the dartboard stimulus that underwent contrast
modulation, which suggests these signals are sensitive to temporal luminance contrast.
For onset VEPs, C1 responses were maximal over the occipital pole and P1 responses
were maximal in parietal regions. C1 responses were present regardless of the contrast
modulation area, whereas P1 amplitudes were much higher when at least 50% of the
dartboard was modulated. This suggests that C1 and P1 are modulated by spatial and
temporal contrast mechanisms respectively. Hence it could be the choice of stimulation
technique that determines the degree to which M and P signatures are visible in pattern
onset and pattern reversal VEPs.
2.6.3 Effects of colour on transient VEPs
This section reviews studies that have isolated P and K contributions to transient
VEPs, by stimulating with isoluminant chromatic gratings. Consistent with evidence
from chromatically sensitive V1 cells (Jankov, 1978), isoluminant pattern offset stimuli
do not elicit VEPs (Suttle & Harding, 1999). The onset of isoluminant red/green or
blue/yellow gratings evokes a prominent N1 (~120ms) response (Murray, Parry,
Carden, & Kulikowski, 1987; Suttle & Harding, 1999; Tobimatsu, Tomoda, & Kato,
1995). Both N1 (pattern onset) and N145 (pattern reversal) amplitudes increase with the
level of chromatic contrast (Gomes et al., 2006; Souza et al., 2008). When luminance
contrast is added to red/green gratings, N1 amplitudes decrease and VEP responses are
dominated by the P1 waveform, which presumably reflects luminance sensitive M and
P mechanisms (Mottron & Burack, 2001). A similar pattern of results is found when
luminance is added to blue/yellow gratings (Suttle & Harding, 1999).

22
N1 responses to achromatic stimuli increase monotonically with spatial
frequency, whereas N1 responses to chromatic stimuli are maximal at roughly two
cycles per degree (Murray et al., 1987; Tobimatsu et al., 1995). This suggests that P
dominated chromatic and luminance mechanisms have different spatial frequency
sensitivities. It is curious that N1 chromatic VEP amplitudes decrease for low spatial
frequency gratings (Murray et al., 1987), while psychophysical measurements do not
(Mullen, 1985). A possible explanation could be that V1 cells within and between
cytochrome oxidase blobs have different spatial frequency sensitivities (Edwards,
Purpura, & Kaplan, 1995), and appear to contribute differently to chromatic VEPs
(Crewther & Crewther, 2010). Overall, the evidence reviewed in this section suggests
that N1 responses to isoluminant chromatic gratings are likely to reflect P and K input
to colour sensitive regions in the striate and extrastriate cortex (Murray et al., 1987;
Suttle & Harding, 1999; Tobimatsu et al., 1995).
2.6.4 Effects of motion on transient VEPs
The M pathway targets motion sensitive cortical regions, such as MT/V5
(Maunsell, Nealey, & DePriest, 1990). Furthermore, psychophysically measured
contrast response functions for motion perception are similar to those of M cells
(Tootell et al., 1995). Motion VEPs were first studied by Clarke (1973), who identified
VEP components associated with motion onset, offset and reversal stimuli. Interest in
motion VEPs was later renewed, with the goal of identifying M and P driven VEP
components. This literature has been reviewed in detail elsewhere (Kuba, Kubová,
Kremláček, & Langrová, 2007); for the purpose of the current discussion, we provide an
overview of evidence as to whether motion VEPs can isolate the M pathway.
Motion onset VEPs produce larger and more reliable responses than motion
offset or motion reversal VEPs, hence they have been the most widely studied form of
motion VEP (Kuba et al., 2007). The main components of the motion onset VEP are the
P1 (~130ms) and N2 (~180ms) waveforms, which are maximal for occipital and
parietal/occipitotemporal recording sites respectively (Bach & Ullrich, 1997; Nakamura
& Ohtsuka, 1999). Early papers suggested that the P1 waveform was the main motion
related potential (Clarke, 1973), however more recent evidence suggests that this
component may reflect responses to patterned stimulation, as opposed to motion per se
(Bach & Ullrich, 1997; Kuba et al., 2007).
23
Bach and Ullrich (1997) found that N2 responses can be recorded even for very
low contrast motion stimulation, and that N2 amplitudes saturate at mid to low contrast.
These results suggest the N2 is dominated by M input. The largest N2 responses are
recorded for radially expanding grating stimuli, particularly when the stimuli are
sinusoidally modulated (Kremláček, Kuba, Kubova, & Chlubnova, 2004). This is
presumably because the high spatial frequency component of square-wave modulation
is not ideal for stimulating the M pathway. In summary, evidence reviewed in this
section suggests that N2, but not P1, motion onset VEP responses reflect M dominated
input to motion processing regions in the dorsal stream.
2.6.5 Summary of afferent contributions to transient VEPs
The studies reviewed in this section have identified transient VEP components
that appear to be dominated by input from the M, P and K pathways. For achromatic
pattern reversal and pattern onset stimulation, N75/C1 responses appear to be
dominated by P input (Ellemberg et al., 2001; Foxe et al., 2008), and P100/P1 responses
appear to be dominated by either M or P input, depending on the contrast and spatial
frequency of the stimulus (Parker et al., 1982; Souza et al., 2007). For isoluminant
chromatic stimulation, the N1 waveform appears to reflect P and K contributions to
chromatic processing mechanisms in the early visual cortex (Gomes et al., 2006; Suttle
& Harding, 1999); whereas for motion stimulation, the N2 waveform appears to reflect
M inputs to motion processing regions in the dorsal stream (Bach & Ullrich, 1997;
Kremláček et al., 2004). However, the reliance on different stimulation parameters to
target M, P and K dominated signals mean that transient VEP techniques are not well
suited for making direct comparisons regarding the initial volleys of afferent input to
the cortex.
2.7 The ssVEP approach
2.7.1 Introduction to ssVEP
When visual stimuli are presented at frequencies higher than 3Hz, a continuous
oscillatory potential can be recorded from the visual cortex, which has been termed the
steady state VEP, or ssVEP (Regan, 1973; Vialatte, Maurice, Dauwels, & Cichocki,
2010). Nonlinearities in the visual system change the shape of responses to a relatively
pure sine wave stimulus, which results in additional frequencies not originally present
in the input signal. The human SSVEP is typically characterized in terms of the phase

24
and amplitude of responses at the fundamental frequency (F) and at two times the
fundamental frequency (2F). For pattern reversal stimuli, most of the response power is
at 2F, whereas for onset-offset stimulation, there are robust F and 2F responses (Regan,
1973).
2.7.2 Effects of luminance contrast and spatial frequency on ssVEP
When ssVEP amplitudes are plotted against log luminance contrast, the function
consists of distinct limbs at low and high contrasts. This has been observed for F and 2F
responses to onset-offset stimulation (Bobak, Bodis-Wollner, Harnois, & Thornton,
1984; Nelson & Seiple, 1992), and for 2F responses to contrast reversing gratings
(Murray et al., 1987; Nakayama & Mackeben, 1982), and is indicative of contributions
from two neural mechanisms with different contrast sensitivities. This double slope
function is evident even at very early stages of development (Norcia, Tyler, & Hamer,
1990). Nakayama and Mackeben (1982) proposed that the low and high contrast limbs
could be reflections of M and P processing in the striate cortex.
For diffuse (i.e. unpatterned) stimulation, both slopes are present for frequencies
from 1 to 8Hz, yet the high contrast slope is compromised at frequencies above 16.67Hz
(Rudvin et al., 2000). This low-pass temporal filtering is consistent with a P generator.
Nelson and Seiple (1992) showed that the effects of spatial and temporal frequency on
ssVEP amplitudes are consistent with generators in separate pathways. For low
temporal frequency, high spatial frequency gratings, amplitudes increased
monotonically with log stimulus contrast. With low spatial frequency, high temporal
frequency gratings, the contrast response function had high gain up to 20% contrast, and
then showed logarithmic compression. This is consistent with the saturating CRFs
recorded from primate M cells (Kaplan & Shapley, 1986).
Some researchers have claimed that responses at 2F isolate the M system. This
was based on the idea that M cells have phasic response properties, and 2F responses
are similar in amplitude for the onset and offset of achromatic gratings (McKeefry,
Russell, Murray, & Kulikowski, 1996). This claim has been criticized based on the
presence of phasic responses in P cells (Skottun & Skoyles, 2007). Although it is
probably an overstatement to claim that 2F responses isolate the M pathway, evidence
from a recent chromatic ssVEP study (Barboni et al., 2013) is consistent with the
argument that responses at 2F are dominated by the M pathway (see Section 2.7.3).
25
Previous ssVEP (Zemon, Gordon, & Welch, 1988) and physiological (Schiller,
Sandell, & Maunsell, 1986) results suggest that bright or dark grey patches elicit
responses from the subcortical ON or OFF systems respectively. Zemon and Gordon
(2006) targeted the M ON and OFF systems by measuring ssVEPs to the appearance of
low contrast bright or dim patches on a mid-grey background. To target P ON and OFF
responses (and presumably K responses), a high-contrast pedestal was added to saturate
the M system, such that it would not respond strongly to temporal modulation in patch
luminance. Spatial tuning curves and CRFs for the pedestal and onset-offset conditions
were similar to those of P and M cells respectively (Derrington & Lennie, 1984; Kaplan
& Shapley, 1986). Across conditions, CRFs were steeper for the bright than dark
patches, which indicates that contrast gains are steeper for OFF than ON cells in both
the M and P pathways (Zemon & Gordon, 2006).
Current evidence suggests that ssVEP signal is not adequately explained by a
single dipole source; rather it appears to originate in the primary visual cortex, and
propagate to extrastriate regions (Vialatte et al., 2010). Di Russo et al. (2001) used
dipole modelling and fMRI to analyse the neural sources of 2F ssVEP responses to a
contrast reversing grating stimulus (6Hz alternation rate; 12 Hz contrast reversal rate).
The results revealed V1 and MT/V5 dipole sources account for approximately 97% of
variance in the signal. These results suggest it is possible that M and P dominated
ssVEP signals originate from different cortical sources.
2.7.3 Effects of colour on ssVEP
Under conditions of isoluminant chromatic stimulation, McKeefry et al. (1996)
found that the 2F component of the onset-offset ssVEP signal is degraded. In order to
further investigate potential M, P and K contributions to ssVEP components, Barboni et
al. (2013) varied the degree of chromatic contrast in isoluminant red/green (i.e. L/M
cone) and blue/yellow (S/L+M cone) gratings, under onset-offset and pattern reversal
stimulation conditions. Colour discrimination ellipses were plotted based on ssVEP
amplitudes at F (10 Hz for onset offset, and 10 rev/s for pattern reversal). These results
were well matched with the psychophysically measured ellipses. Therefore, it is likely
that input from the P and K streams dominates the F component of ssVEP responses to
isoluminant chromatic stimuli.
For both the onset/offset and reversal modes of stimulation, 2F ellipses were
larger and more elongated along the tritan confusion line than the F or psychophysically
26
measured ellipses (Barboni et al., 2013). The M pathway receives only minimal input
from short wavelength cones (Chatterjee & Callaway, 2002), and responds to red/green
chromatic flicker at 2F, presumably due to nonlinear summation of medium and long
wavelength cone mechanisms (Lee, Martin, & Valberg, 1989). Hence, under conditions
of isoluminant chromatic stimulation, it appears that input from the M pathway
dominates the 2F ssVEP component.
2.7.4 Effects of motion on ssVEP
Only a small number of ssVEP investigations have used visual motion to probe
M processing, presumably due to difficulties in isolating signals associated with motion
and pattern sensitive mechanisms. Snowden, Ullrich, and Bach (1995) compared
responses to random dot stimuli that either alternated between incoherent and coherent
motion, or reversed in motion direction. There were different effects of motion speed
and luminance contrast for the two stimulation conditions. For coherent motion onset,
there was a low-pass relationship between motion speed and ssVEP amplitude at F, with
no clear response at 2F. Consistent with a P generator, the CRF increased
monotonically with no sign of saturation. For motion reversal, there was a band-pass
relationship between motion speed and ssVEP amplitudes at F and 2F. Consistent with
an M generator, the CRF saturated at approximately 20% contrast.
Heinrich and Bach (2003) showed that motion reversal ssVEPs (at the reversal
rate, i.e.; twice the stimulus frequency) are susceptible to directionally specific pre-
adaptation, which further supports the argument that they are a true reflection of motion
processing, as opposed to pattern processing. In summary, current evidence suggests
that motion reversal ssVEPs are much better suited to targeting M-driven motion
processing mechanisms than motion-onset ssVEPs.
2.7.5 Summary of afferent contributions to ssVEP
The studies reviewed in this section suggest that for achromatic stimulation, the
M pathway dominates ssVEPs to diffuse, rapidly flickering stimuli, whereas the P
pathway dominates ssVEPs to high spatial frequency, low temporal frequency stimuli
(Nelson & Seiple, 1992; Rudvin & Valberg, 2006). For isoluminant chromatic
stimulation, responses at the fundamental frequency appear to be dominated by P and K
input, and responses at 2F appear to reflect non-linear summation of L- and M-cone
inputs to the M pathway (Barboni et al., 2013). For motion reversal stimulation, 2F
27
ssVEP signals appear to reflect M input to motion sensitive cortical regions (Heinrich &
Bach, 2003; Snowden et al., 1995).
A major advantage of ssVEP over transient VEP is that high signal to noise
amplitude responses can be achieved in much shorter recording sessions (Regan, 1973).
However, a disadvantage is that rapid, periodic visual stimulation does not allow brain
activity to recover from the previous stimulus before the next one appears, so the
contributions of multiple visual areas overlap in the averaged waveform (Vialatte et al.,
2010). This suggests that ssVEP is not well suited for comparing the initial volleys of
M, P and K afferent input to V1.
2.8 The m-sequence approach
2.8.1 Introduction to m-sequences and Wiener kernel analysis
Nonlinear temporal analyses offer an alternative approach to separating afferent
inputs to VEPs. The impulse response function characterises temporal responses of a
linear system, by decomposing the stimulus into discrete time bins, such that each
impulse response can be considered independently. In a nonlinear system, successive
impulse responses cannot be considered independently, so one needs to take nonlinear
temporal interactions into account. There are several different mathematical approaches
to studying nonlinear systems (reviewed, Klein, 1992; Marmarelis & Marmarelis, 1978;
Sutter, 1992; Victor, 1992). In this section, we review studies that used an m-
sequence/Wiener kernel approach to non-linear VEP analysis. The VESPA approach is
reviewed in Section 2.9.
An m-sequence (maximum length sequence) is a type of pseudorandom binary
sequence of length 2m -1 that contains all of the possible configurations of m
consecutive elements exactly once, except for the all zero configuration (Golomb,
1967). Sutter developed a method to cross-correlate visual responses with the m-
sequence based on Fast Walsh transform (Sutter, 1992). This allows for rapid extraction
of first and higher order Wiener kernel responses from a single cross-correlation, so that
one can investigate the memory (i.e. response recovery) of the visual system to a full
range of binary stimulation.
The first-order kernel (K1) is analogous, but not identical to the conventional
onset-offset VEP response, or the impulse response function in a linear system. The first
slice of the second order kernel (K2.1) measures non-linear temporal responses over one

28
video frame, and is analogous, but not identical to the conventional contrast reversal
VEP. The second slice of the second order response (K2.2) measures non-linearity over
two video frames (Sutter, 1992). For pattern reversal non-linear VEPs, there is not much
power in the K1 VEP response, but there are robust second order responses (Baseler &
Sutter, 1997).
Transient VEP and ssVEP experiments have often used stimuli that activate
large areas of the visual field. Yet the M and P pathways are likely to respond
differently to stimuli presented at fixation or in the periphery (Dacey, 1993). An
advantage of pseudo-random stimulation is that independent multifocal responses can
be measured by stimulating each patch with temporally decorrelated versions of the m-
sequence (Sutter, 1992). By scaling the patch size with linear approximations of the
cortical magnification factor (Horton & Hoyt, 1991), it is possible to match the signal to
noise ratio across the visual field (Baseler, Sutter, Klein, & Carney, 1994).
2.8.2 Effects of luminance contrast on non-linear VEPs
In 1997, two separate research groups published papers that inferred M and P
contributions to VEP signals based on the CRFs of second-order non-linear kernel
responses (Baseler & Sutter, 1997; Klistorner, Crewther, & Crewther, 1997). Baseler
and Sutter (1997) presented a contrast-reversing multifocal checkerboard stimulus,
where each checkerboard reversed in de-correlated pseudorandom m-sequences
(reversal rate 66.7 reversals/s, i.e., 33.3Hz). The K2.1 response could be decomposed
into C1 and C2 components, based on the effects of eccentricity on the K2.1P60 (60-
80ms) and K2.1P90 (75-115ms) peak latencies. The effects of spatial frequency (i.e.
check size), luminance and colour on C1 and C2 were consistent with M and P
generators respectively. The authors suggested that C1 may reflect M input to V1 input
layer 4Cα and that C2 may reflect a combination of P input arriving at layer 4Cβ, as
well as processing in V1 layers 2 and 3.
When the visual system is stimulated at higher temporal frequencies, M and P
signatures are more cleanly separated into different slices of the second order non-linear
VEP. Klistorner, Crewther and Crewther (1997) presented a diffuse onset-offset
multifocal stimulus, where the binary luminance of each patch alternated along de-
correlated m-sequences (updated at 66.67 Hz). CRFs were plotted for the peak-to-peak
amplitudes of the first and second order kernels. Modelling of the K1 waveform
suggested it reflects the sum of M and P inputs. Consistent with a M generator, the
29
K2.1N70P100 waveform had high contrast gain and saturated at around 43% contrast
(semi saturation coefficient ~ 20%). Consistent with a P generator, the main K2.2N90P130
waveform gradually increased in amplitude with contrast, and the CRF showed no sign
of saturation. The K2.3 waveform had a similar CRF to the K2.2 response, but the
signal to noise ratio was lower. Differences in the latencies of the major K2.1 and K2.2
waveforms are consistent with the latency advantage of M input to V1 (Nowak, Munk,
Girard, & Bullier, 1995).
In order to establish the saturation properties of the K2.1 and K2.2 waveforms,
Jackson et al. (2013) carried out Naka-Rushton fits of the CRFs. Consistent with
Klistorner et al. (1997), the K2.1 N60P90 waveform had high contrast gain and rapid
saturation. The K2.2N95P130 waveform had lower contrast gain and a much higher semi-
saturation coefficient. There were some small departures from Klistorner et al. (1997),
which could possibly be attributed to stimulating at a higher frame rate (75 Hz as
opposed to 67 Hz). An early waveform (K2.2N65P75) became apparent in the K2.2
response, with a similar CRF to the K2.1 response. This suggests that the K2.2N65P75 and
K2.2N95P130 waveforms can be traced back to M and P origins respectively. Evidence
from a study that used sparse ternary stimuli suggest that the CRFs for the K2.0
Volterra kernel response are also consistent with an M pathway generator (Maddess,
James, & Bowman, 2005).
Brown, Corner, Crewther, and Crewther (Submitted for Publication) found that
K2.1 amplitudes correlate negatively with psychophysically measured flicker fusion
thresholds. That is, individuals with higher flicker fusion frequencies in general possess
smaller amplitude second order first slice (K2.1) peak amplitudes. However, amplitudes
of the main K2.2 waveform do not correlate with flicker fusion thresholds. Previous
studies have shown that the human mechanisms for detecting high temporal frequency
stimulation are consistent with those observed in cat Y cells (Burbeck & Kelly, 1981).
Brown et al. interpreted these results in terms of more rapid neural recovery, and related
higher flicker fusion to increased neural efficiency of the M but not the P system.
2.8.3 Effects of spatial frequency on non-linear VEPs
The effects of spatial frequency on non-linear VEPs have been studied using
contrast reversing checkerboards (Momose & Kasahara, 2003), and sinusoidal gratings
(Araújo, Souza, Gomes, & Silveira, 2013; Momose, 2010). As spatial frequency
increases from 0.5 to 4.5 cycles per degree (Momose & Kasahara, 2003), or 0.5 to 9
30
cycles per degree (Momose, 2010), K2.1 amplitudes decrease and K2.2 amplitudes
increase. Although the authors only reported on the main K2.2 waveform (Momose &
Kasahara, 2003), an early K2.2 N65P75 waveform was observed in response to low, but
not high spatial frequency stimulation, which is consistent with evidence that the early
and late K2.2 waveforms have different generators (Jackson et al., 2013). Araújo et al.
(2013) performed more detailed comparisons of CRFs for the K2.1 and K2.2 responses
at different spatial frequencies, and found that under most conditions these waveforms
reflect M and P inputs respectively, but that at high spatial frequencies, there are some P
contributions to the K2.1 response. Based on what is known from primate physiology
(Derrington & Lennie, 1984), the effects of spatial frequency on non-linear VEPs
provides further evidence that under conditions with low spatial frequency or diffuse
stimulation, the K2.1 and early K2.2 waveforms originate from M input, and the late
K2.2 waveform originates from P input.
2.8.4 Effects of colour on non-linear VEPs
Klistorner, Crewther, and Crewther (1998) demonstrated dissociation between
the effects of diffuse red stimulation and achromatic stimulation on non-linear VEP
responses, with chromatic responses in both the K2.1 and K2.2 kernels to red, but not
green stimulation. Crewther and Crewther (2010) used non-linear VEP to investigate
responses to diffuse colour saturation (i.e.; surface colour) and to coloured line patterns
(i.e.; form colour), at 30% luminance contrast. For the diffuse colour conditions,
chromatic saturation had the greatest effects on K2.1 amplitudes. For the
appearance/disappearance of patterned stimuli, there was a clear dominance in the first
order kernel, with relatively small responses in the K2.1 and K2.2 kernels. Interestingly,
the K2.1 responses to diffuse stimulation were spectrally dependent, with stronger
responses for blue and red stimulation than for yellow green and cyan stimulation. By
contrast, K1 responses to pattern colour were robust for all colours.
These findings indicate that surface and edge colour representations have
different non-linear temporal structures. Although the strong K2.1 response to diffuse
colour is indicative of a system that recovers rapidly from stimulation, primate
physiological evidence suggests that the effects of diffuse red and blue colour on VEP
amplitudes are generated in V1 layers 2/3, as opposed to the M of P layers of the LGN
(Givre, Arezzo, & Schroeder, 1995). Cells within V1 cytochrome oxidase blobs respond
most strongly to diffuse red and blue inputs (Dow & Vautin, 1987), prefer high

31
temporal frequency stimulation (Shoham, Hübener, Schulze, Grinvald, & Bonhoeffer,
1997) and receive M, P and K input (Edwards et al., 1995). In summary, the studies
reviewed in this section indicate that VEP responses to diffuse surface colour are better
explained in terms of converging inputs from M, P and K cells to the cytochrome
oxidase blob centres in V1, than separate inputs from the subcortical afferent pathways.
2.8.5 Cortical sources of non-linear VEP signal
Slotnick, Klein, Carney, Sutter, and Dastmalchi (1999) performed dipole source
localisation of K2.1 responses to contrast reversing multifocal checkers. They showed
that the dipole polarity, retinotopic organisation and continuity across the horizontal
meridian are consistent with a V1 generator. K2.2 responses also appear to originate
from V1 (Crewther, Brown, & Hugrass, 2016; Fortune & Hood, 2003). Differences in
multifocal K2.1 and K2.2, and transient VEP responses to contrast reversing
checkerboards appear to depend heavily on the temporal frequency of stimulation
(Fortune & Hood, 2003). As m-sequence stimulation is slowed, the waveforms become
more similar to those obtained with transient VEP. These results suggest that while fast
m-sequence stimulation primarily activates V1, transient VEPs are more heavily
influenced by extrastriate sources. However, for unpatterned multifocal stimuli, K1 and
K2.1 MEG signals recorded from MT/V5 exhibit only a 1-2ms latency delay, relative to
responses from V1 (Crewther et al., 2016). This may reflect input from an M-driven
colliculo-pulvinar route to MT/V5, which plays a critical role in the development of the
primate dorsal stream (Bridge, Leopold & Bourne, 2016).
2.8.6 Summary of afferent contributions to non-linear VEP signals
The studies reviewed in this section showed that fast m-sequence stimulation
allows for relatively clean separation of M and P afferent inputs into the first and second
slices of the second order non-linear VEP responses. The K2.1 and early K2.2
waveforms appear to originate from M input to V1, and the main K2.2 waveform
appears to originate from P input to V1 (Jackson et al., 2013; Klistorner et al., 1997).
The effects of chromatic stimulation on the non-linear VEP kernels are somewhat more
difficult to interpret (Crewther & Crewther, 2010). Future studies that stimulate with S-
cone isolating multifocal stimuli may help to clarify M, P and K contributions to
different chromatic processing mechanisms in V1.
32
2.9 The VESPA approach
2.9.1 Introduction to VESPA
VESPA (visual evoked spread spectrum analysis) is a different approach to
measuring responses to stochastic stimulation. The contrast of a checkerboard stimulus
is rapidly modulated by a stochastic signal. This is used to estimate the linear impulse
response function (i.e. the first order Volterra kernel) of the visual system using least of
squares estimation (Marmarelis and Marmarelis, 1978). Similar to the non-linear VEP
techniques described above, the contrast of the stimulus is updated rapidly at the frame
rate of the display, yet the stimulus is not limited by the same temporal constraints,
which gives VESPA more flexibility in terms of stimulus design. Unlike binary m-
sequence stimulation, VESPA modulates the stimulus contrast over a wide range of
narrowly spaced levels. The resulting signals are similar, but not identical to transient
pattern reversal VEP waveforms, with similar C1 and P1 responses recorded from
occipital sensors (Murphy et al., 2012).
2.9.2 The effects of luminance and spatial frequency on VESPA signals
Lalor and Foxe (2009) designed different checkerboard VESPA stimuli to target
the M and P pathways (check size =.65 degree, temporal frequencies ranged from 1 to
30Hz). Based on the CFRs of primate M and P cells (Kaplan & Shapley, 1986), it was
proposed that the VESPA signal would be dominated by M and P input when the range
of modulation was restricted to low or high contrast. VESPA signals for the full-range
(0-100% contrast) and high-contrast (32-100%) conditions were highly similar, which
indicates that both are dominated by P (and possibly K) inputs. VESPA responses to
low contrast stimuli (0-10%) were lower in amplitude, and there was a slight C1 latency
delay of approximately 4-5ms.
Murphy et al. (2012) compared C1 and P1 responses, as recorded both with
transient pattern reversal VEPs (100% contrast) and VESPA (0- 100% contrast). For
VESPA, C1 and P1 amplitudes were maximal for electrode site OZ, whereas for
transient VEPs, larger P1 amplitudes were also present for occipto-temporal and parietal
electrode sites. Likewise, transient VEP C1, VESPA C1, and VESPA P1 amplitudes
were highly inter-correlated, suggesting a common generator, whereas the transient
VEP P1 responses did not correlate with the other measures. There was no low contrast
33
condition in this experiment, but it would be interesting for future studies to compare
the sources of transient VEP and VESPA responses to low contrast stimulation.
2.9.3 Summary of afferent contributions to VESPA signal
In summary, both C1 and P1 full-range and high-contrast VESPA responses
appear to be dominated by P (and possibly K) input to the striate cortex, whereas C1
and P1 low-contrast VESPA responses appear to reflect M input to the striate cortex. If
this signal reflects M input to V1, the latency delay for low-contrast VEP would appear
inconsistent with evidence that M input reaches V1 faster than P input (Nowak et al.,
1995); however single cell onset latencies are slower for stimuli with low contrast
(Maunsell et al., 1999). Hence, due to differences in stimulus contrast for the putative M
and P waveforms, it is difficult to ascribe differences in C1 latencies to differences in
the latencies of M and P inputs to V1. To date, studies of M and P dominated VESPA
responses have only reported the first-order Volterra kernel (i.e. the impulse response);
however future studies that analyse higher order kernels may prove useful in further
separating M and P contributions to the VESPA signal.
2.10 Discussion and Conclusions Many studies have been conducted to investigate M, P and K inputs to scalp
recorded VEPs. This is not an easy task, due to interactions between the afferent input
channels at the cortical level (Vidyasagar et al., 2002), and the presence of K
subpopulations with similar achromatic CRFs to those of the M and P streams (White et
al., 2001). Hence, the practice of tracing VEPs recorded from human scalps to their
subcortical origins, based on CRFs alone has been strongly criticized (Skottun, 2014).
However, converging evidence from experiments that have modulated the colour,
spatial frequency, eccentricity and temporal frequency of stimulation suggest it is
possible to identify components of VEP signals that are dominated by input from the M,
P and K pathways.
Signals that reflect P input to the cortex have been identified with each of the
VEP approaches discussed in this review. For instance, for high contrast achromatic
stimulation with transient VEP or VESPA, the C1 waveform appears to reflect P input
to V1 (Lalor & Foxe, 2009; Murphy et al., 2012). Likewise, P input appears to dominate
ssVEP responses to flickering stimuli with low temporal frequency, high luminance
contrast or isoluminant red-green levels (Gomes et al., 2006; Nelson & Seiple, 1992).
34
Analysis of the non-linear temporal structure of VEPs has shown that the effects of
contrast and spatial frequency on the main K2.2 waveform suggest that it originates
from P sources (Klistorner et al., 1997; Maddess et al., 2005; Momose, 2010).
As stated in Section 2.4, K cells form at least three physiologically distinct
pathways, which have overlapping sensitivities to the M and P pathways (Hendry &
Reid, 2000). Therefore, it is unlikely that K contributions to scalp-recorded VEPs would
manifest as a unitary component, or that they can be clearly disambiguated from M and
P dominated VEP signatures. By using s-cone isolating stimuli, some transient VEP and
ssVEP studies have inferred contributions from the sub-population of K cells that
transmits s-cone input to the cortex (Barboni et al., 2013; Gomes et al., 2006). K
thalamocortical neurons are only slightly more numerous than those of the M pathway,
but lack the power of M cells to dominate cortical circuits owing to their high
divergence factor and large axons (Hendry & Reid, 2000). The sluggish temporal
responses of K cells (Irvin, Casagrande, & Norton, 1993) would suggest that it is
unlikely that they contribute to the same components of the K2.1 and early K2.2
waveforms as M cells. The presence of K cells makes it difficult to cleanly separate M
and P subcortical inputs to VEPs. Future macaque studies that characterise VEPs arising
from the K LGN layers, or K inputs to V1 may provide evidence that would help
researchers to separate inputs from the M, P and K pathways to VEPs.
Based on the evidence reviewed here, the degree to which M input is manifest in
scalp-recorded VEP signals depends strongly on the stimulation approach. For transient
pattern-onset VEPs, the apparent absence of M contributions to the C1 waveform
indicates it is difficult to measure the initial volley of M input to the cortex (Foxe et al.,
2008). The low-contrast VESPA approach produces a waveform that is likely to
originate from M input to the striate cortex (Lalor & Foxe, 2009), however its latency is
delayed relative to the full-range VESPA signal. For ssVEP, responses to stimuli with
low contrast, low spatial frequency, and high temporal frequency appear to be
dominated by the M pathway (Nelson & Seiple, 1992). Fast m-sequence stimulation
allows for relatively clean isolation of M signals into the K2.1 and early K2.2
waveforms, particularly under conditions of low contrast or diffuse stimulation. A
major advantage of the m-sequence technique over the others reviewed here is that it is
possible to directly compare the timing of putative M and P responses under the same
stimulation conditions.
35
2.11 References Araújo, C. S., Souza, G. S., Gomes, B. D., & Silveira, L. C. L. (2013). Visual evoked
cortical potential (VECP) elicited by sinusoidal gratings controlled by pseudo-
random stimulation. PLoS ONE, 8(8), e70207.
Bach, M., & Ullrich, D. (1997). Contrast dependency of motion-onset and pattern-
reversal VEPs: interaction of stimulus type, recording site and response
component. Vision Research, 37(13), 1845-1849.
Barboni, M., Gomes, B., Souza, G., Rodrigues, A., Ventura, D., & Silveira, L. (2013).
Chromatic spatial contrast sensitivity estimated by visual evoked cortical
potential and psychophysics. Brazilian journal of medical and biological
research, 46(2), 154-163.
Baseler, H., & Sutter, E. (1997). M and P components of the VEP and their visual field
distribution. Vision Research, 37(6), 675-690.
Baseler, H., Sutter, E., Klein, S., & Carney, T. (1994). The topography of visual evoked
response properties across the visual field. Electroencephalography and clinical
Neurophysiology, 90(1), 65-81.
Bobak, P., Bodis-Wollner, I., Harnois, C., & Thornton, J. (1984). VEPs in humans
reveal high and low spatial contrast mechanisms. Investigative Ophthalmology
& Visual Science, 25(8), 980-983.
Bridge, H., Leopold, D. A., & Bourne, J. A. (2016). Adaptive pulvinar circuitry
supports visual cognition. Trends in cognitive sciences, 20(2), 146-157.
Brown, A., Corner, M., Crewther, D. P., & Crewther, S. G. (Submitted for Publication).
Human Flicker Fusion Correlates with Physiological Measures of
Magnocellular Neural Efficiency.
Bullier, J. (2001). Integrated model of visual processing. Brain Research Reviews,
36(2–3), 96-107. doi:http://dx.doi.org/10.1016/S0165-0173(01)00085-6
Burbeck, C. A., & Kelly, D. (1981). Contrast gain measurements and the
transient/sustained dichotomy. JOSA, 71(11), 1335-1342.
Casagrande, V. (1994). A third parallel visual pathway to primate area V1. Trends in
neurosciences, 17(7), 305-310.
Chatterjee, S., & Callaway, E. M. (2002). S cone contributions to the magnocellular
visual pathway in macaque monkey. Neuron, 35(6), 1135-1146.
36
Chatterjee, S., & Callaway, E. M. (2003). Parallel colour-opponent pathways to primary
visual cortex. Nature, 426(6967), 668-671.
Clarke, P. (1973). Comparison of visual evoked potentials to stationary and to moving
patterns. Experimental brain research, 18(2), 156-164.
Crewther, D. P., Brown, A., & Hugrass, L. (2016). Temporal structure of human
magnetic evoked fields. Exp Brain Res, 234(7), 1987-1995. doi:10.1007/s00221-
016-4601-0
Crewther, D. P., & Crewther, S. G. (2010). Different Temporal Structure for Form
versus Surface Cortical Color Systems – Evidence from Chromatic Non-Linear
VEP. PLoS ONE, 5(12), e15266. doi:10.1371/journal.pone.0015266
Dacey, D. M. (1993). The mosaic of midget ganglion cells in the human retina. Journal
of Neuroscience, 13(12), 5334-5355.
de Monasterio, F. M. (1978). Properties of concentrically organized X and Y ganglion
cells of macaque retina. Journal of Neurophysiology, 41(6), 1394-1417.
Derrington, A. M., Krauskopf, J., & Lennie, P. (1984). Chromatic mechanisms in lateral
geniculate nucleus of macaque. The Journal of Physiology, 357, 241-265.
Derrington, A. M., & Lennie, P. (1984). Spatial and temporal contrast sensitivities of
neurones in lateral geniculate nucleus of macaque. The Journal of Physiology,
357(1), 219-240.
Di Russo, F., Martínez, A., Sereno, M. I., Pitzalis, S., & Hillyard, S. A. (2001). Cortical
sources of the early components of the visual evoked potential. Human Brain
Mapping, 15(2), 95-111.
Dow, B., & Vautin, R. (1987). Horizontal segregation of color information in the
middle layers of foveal striate cortex. Journal of Neurophysiology, 57(3), 712-
739.
Edwards, D. P., Purpura, K. P., & Kaplan, E. (1995). Contrast sensitivity and spatial
frequency response of primate cortical neurons in and around the cytochrome
oxidase blobs. Vision Research, 35(11), 1501-1523.
Ellemberg, D., Hammarrenger, B., Lepore, F., Roy, M.-S., & Guillemot, J.-P. (2001).
Contrast dependency of VEPs as a function of spatial frequency: the
parvocellular and magnocellular contributions to human VEPs. Spatial vision,
15(1), 99-111.
37
Fortune, B., & Hood, D. C. (2003). Conventional pattern-reversal VEPs are not
equivalent to summed multifocal VEPs. Investigative Ophthalmology & Visual
Science, 44(3), 1364-1375.
Foxe, J. J., Strugstad, E. C., Sehatpour, P., Molholm, S., Pasieka, W., Schroeder, C. E.,
& McCourt, M. E. (2008). Parvocellular and magnocellular contributions to the
initial generators of the visual evoked potential: high-density electrical mapping
of the “C1” component. Brain topography, 21(1), 11-21.
Givre, S., Arezzo, J., & Schroeder, C. (1995). Effects of wavelength on the timing and
laminar distribution of illuminance-evoked activity in macaque V1. Visual
Neuroscience, 12(2), 229-239.
Golomb, S. W. (1967). Shift register sequences: Holden-Day.
Gomes, B. D., Souza, G. S., Rodrigues, A. R., Saito, C. A., Silveira, L. C. L., & Da
Silva Filho, M. (2006). Normal and dichromatic color discrimination measured
with transient visual evoked potential. Visual Neuroscience, 23(3-4), 617-627.
Hall, S. D., Holliday, I. E., Hillebrand, A., Furlong, P. L., Singh, K. D., & Barnes, G. R.
(2005). Distinct contrast response functions in striate and extra-striate regions of
visual cortex revealed with magnetoencephalography (MEG). Clinical
Neurophysiology, 116(7), 1716-1722.
Heinrich, S. P., & Bach, M. (2003). Adaptation characteristics of steady-state motion
visual evoked potentials. Clinical Neurophysiology, 114(7), 1359-1366.
Hendry, S. H., & Reid, R. C. (2000). The koniocellular pathway in primate vision.
Annual review of neuroscience, 23(1), 127-153.
Horton, J. C., & Hoyt, W. F. (1991). The representation of the visual field in human
striate cortex: a revision of the classic Holmes map. Archives of ophthalmology,
109(6), 816-824.
Irvin, G. E., Casagrande, V. A., & Norton, T. T. (1993). Center/surround relationships
of magnocellular, parvocellular, and koniocellular relay cells in primate lateral
geniculate nucleus. Visual Neuroscience, 10(2), 363-373.
Jackson, B. L., Blackwood, E. M., Blum, J., Carruthers, S. P., Nemorin, S., Pryor, B.
A., . . . Crewther, D. P. (2013). Magno-and parvocellular contrast responses in
varying degrees of autistic trait. PLoS ONE, 8(6), e66797.
Jankov, E. (1978). Spectral sensitivity of off-response in human VECP during selective
chromatic adaptation (author's transl). Albrecht von Graefes Archiv fur klinische
38
und experimentelle Ophthalmologie. Albrecht von Graefe's archive for clinical
and experimental ophthalmology, 206(2), 121-133.
Jeffreys, D. & Axford, J. (1972) Source locations of pattern-specific components of
human visual evoked potentials. I. Component of striate cortical origin.
Experimental Brain Research, 16, 1-21.
Jones, R., & Keck, M. J. (1978). Visual evoked response as a function of grating spatial
frequency. Investigative Ophthalmology & Visual Science, 17(7), 652-659.
Kaplan, E. (2014). The M, P and K pathways of the primate visual system revisited. The
new visual neurosciences (Werner JS, Chalupa LM, eds.). Cambridge, MA:
Massachusetts Institute of Technology.
Kaplan, E., & Shapley, R. M. (1986). The primate retina contains two types of ganglion
cells, with high and low contrast sensitivity. Proceedings of the National
Academy of Sciences, 83(8), 2755-2757.
Kelly, S.P., Vanegas, M.I., Schroeder, C.E. & Lalor, E.C. (2013) The cruciform model
of striate generation of the early VEP, re-illustrated, not revoked: a reply to Ales
et al.(2013). Neuroimage, 82, 154-159.
Klein, S. (1992). Optimizing the Estimation of Nonlinear Kernels. In R. B. Pinter & B.
Nabet (Eds.), Nonlinear Vision: Determination of Neural Receptive Fields,
Function, and Networks (pp. 109-170). Cleveland, Ohio: CRC Press.
Klistorner, A., Crewther, D. P., & Crewther, S. G. (1997). Separate magnocellular and
parvocellular contributions from temporal analysis of the multifocal VEP. Vision
Research, 37(15), 2161-2169.
Klistorner, A., Crewther, D. P., & Crewther, S. G. (1998). Temporal analysis of the
chromatic flash VEP—separate colour and luminance contrast components.
Vision Research, 38(24), 3979-4000. doi:http://dx.doi.org/10.1016/S0042-
6989(97)00394-5
Kremláček, J., Kuba, M., Kubova, Z., & Chlubnova, J. (2004). Motion-onset VEPs to
translating, radial, rotating and spiral stimuli. Documenta Ophthalmologica,
109(2), 169-175.
Kuba, M., Kubová, Z., Kremláček, J., & Langrová, J. (2007). Motion-onset VEPs:
characteristics, methods, and diagnostic use. Vision Research, 47(2), 189-202.
39
Kveraga, K., Boshyan, J., & Bar, M. (2007). Magnocellular Projections as the Trigger
of Top-Down Facilitation in Recognition. The Journal of Neuroscience, 27(48),
13232-13240. doi:10.1523/jneurosci.3481-07.2007
Lalor, E. C., & Foxe, J. J. (2009). Visual evoked spread spectrum analysis (VESPA)
responses to stimuli biased towards magnocellular and parvocellular pathways.
Vision Research, 49(1), 127-133.
Laycock, R., Crewther, S. G., & Crewther, D. P. (2007). A role for the ‘magnocellular
advantage’ in visual impairments in neurodevelopmental and psychiatric
disorders. Neuroscience & Biobehavioral Reviews, 31(3), 363-376.
doi:http://dx.doi.org/10.1016/j.neubiorev.2006.10.003
Lee, B., Martin, P., & Valberg, A. (1989). Sensitivity of macaque retinal ganglion cells
to chromatic and luminance flicker. The Journal of Physiology, 414(1), 223-243.
Livingstone, M. S., & Hubel, D. (1984). Anatomy and physiology of a color system in
the primate visual cortex. The Journal of Neuroscience, 4(1), 309-356.
Livingstone, M. S., & Hubel, D. (1988). Segregation of form, color, movement, and
depth: anatomy, physiology, and perception. Science, 240(4853), 740-749.
Lovegrove, B. (1996). Dyslexia and a transient/magnocellular pathway deficit: The
current situation and future directions. Australian Journal of Psychology, 48(3),
167-171.
Maddess, T., James, A. C., & Bowman, E. A. (2005). Contrast response of temporally
sparse dichoptic multifocal visual evoked potentials. Visual Neuroscience,
22(2), 153-162.
Marcar, V. L., & Jäncke, L. (2016). To see or not to see; the ability of the magno‐and
parvocellular response to manifest itself in the VEP determines its appearance to
a pattern reversing and pattern onset stimulus. Brain and behavior, 6(11).
Marmarelis, P. Z., & Marmarelis, V. Z. (1978). Analysis of Physiological Systems The
White-Noise Approach: Boston, MA : Springer US.
Martin, P. R., & Lee, B. B. (2014). Distribution and specificity of S-cone (“blue cone”)
signals in subcortical visual pathways. Visual Neuroscience, 31(2), 177-187.
Maunsell, J., Ghose, G. M., Assad, J. A., McADAMS, C. J., Boudreau, C. E., &
Noerager, B. D. (1999). Visual response latencies of magnocellular and
parvocellular LGN neurons in macaque monkeys. Visual Neuroscience, 16(1),
1-14.
40
Maunsell, J., Nealey, T. A., & DePriest, D. D. (1990). Magnocellular and parvocellular
contributions to responses in the middle temporal visual area (MT) of the
macaque monkey. Journal of Neuroscience, 10(10), 3323-3334.
McKeefry, D., Russell, M., Murray, I., & Kulikowski, J. (1996). Amplitude and phase
variations of harmonic components in human achromatic and chromatic visual
evoked potentials. Visual Neuroscience, 13(4), 639-653.
Momose, K. (2010). Extraction of M and P components from the visual evoked
potential using pseudorandom stimulation with swept parameter technique.
Paper presented at the Engineering in Medicine and Biology Society (EMBC),
2010 Annual International Conference of the IEEE.
Momose, K., & Kasahara, S. (2003). Nonlinear characteristics of visual evoked
potential and their correlation with the visual responses on magnocellular and
parvocellular pathways. Paper presented at the Engineering in Medicine and
Biology Society, 2003. Proceedings of the 25th Annual International Conference
of the IEEE.
Mottron, L., & Burack, J. A. (2001). Enhanced perceptual functioning in the
development of autism.
Mullen, K. T. (1985). The contrast sensitivity of human colour vision to red‐green and
blue‐yellow chromatic gratings. The Journal of Physiology, 359(1), 381-400.
Murphy, J. W., Kelly, S. P., Foxe, J. J., & Lalor, E. C. (2012). Isolating early cortical
generators of visual-evoked activity: a systems identification approach.
Experimental brain research, 220(2), 191-199.
Murray, I. J., Parry, N. R., Carden, D., & Kulikowski, J. J. (1987). Human visual
evoked potentials to chromatic and achromatic gratings. Clinical Vision
Sciences, 1, 231-244.
Nakamura, Y., & Ohtsuka, K. (1999). Topographical analysis of motion-triggered
visual-evoked potentials in man. Japanese Journal of Ophthalmology, 43(1), 36-
43.
Nakayama, K., & Mackeben, M. (1982). Steady state visual evoked potentials in the
alert primate. Vision Research, 22(10), 1261-1271.
Nassi, J. J., & Callaway, E. M. (2009). Parallel processing strategies of the primate
visual system. Nature Reviews Neuroscience, 10(5), 360-372.

41
Nealey, T., & Maunsell, J. (1994). Magnocellular and parvocellular contributions to the
responses of neurons in macaque striate cortex. Journal of Neuroscience, 14(4),
2069-2079.
Nelson, J. I., & Seiple, W. H. (1992). Human VEP contrast modulation sensitivity:
separation of magno-and parvocellular components. Electroencephalography
and Clinical Neurophysiology/Evoked Potentials Section, 84(1), 1-12.
Norcia, A. M., Tyler, C. W., & Hamer, R. D. (1990). Development of contrast
sensitivity in the human infant. Vision Research, 30(10), 1475-1486.
Nowak, L., Munk, M., Girard, P., & Bullier, J. (1995). Visual latencies in areas V1 and
V2 of the macaque monkey. Visual Neuroscience, 12(2), 371-384.
Odom, J.V., Bach, M., Brigell, M., Holder, G.E., Mcculloch, D.L., Mizota, A.,
Tormene, A.P. & Vision, I.S.F.C.E.O. (2016) ISCEV standard for clinical visual
evoked potentials:(2016 update). Documenta Ophthalmologica, 133, 1-9.
Parker, D., Salzen, E., & Lishman, J. (1982). Visual-evoked responses elicited by the
onset and offset of sinusoidal gratings: latency, waveform, and topographic
characteristics. Investigative Ophthalmology & Visual Science, 22(5), 675-680.
Regan, D. (1973). Evoked potentials specific to spatial patterns of luminance and
colour. Vision Research, 13(12), 2381-2402.
Regan, D. (1989). Human brain electrophysiology: evoked potentials and evoked
magnetic fields in science and medicine: Elsevier.
Rudvin, I., & Valberg, A. (2006). Flicker VEPs reflecting multiple rod and cone
pathways. Vision Research, 46(5), 699-717.
Rudvin, I., Valberg, A., & Kilavik, B. E. (2000). Visual evoked potentials and
magnocellular and parvocellular segregation. Visual Neuroscience, 17(4), 579-
590.
Schiller, P. H., Sandell, J. H., & Maunsell, J. H. (1986). Functions of the ON and OFF
channels of the visual system. Nature, 322(6082), 824.
Shawkat, F. S., & Kriss, A. (1998). Sequential pattern-onset,-reversal and-offset VEPs:
Comparison of effects of checksize. Ophthalmic and Physiological Optics,
18(6), 495-503.
Shoham, D., Hübener, M., Schulze, S., Grinvald, A., & Bonhoeffer, T. (1997). Spatio–
temporal frequency domains and their relation to cytochrome oxidase staining in
cat visual cortex. Nature, 385(6616), 529.
42
Skottun, B. C. (2014). A few observations on linking VEP responses to the magno-and
parvocellular systems by way of contrast–response functions. International
Journal of Psychophysiology, 91(3), 147-154.
Skottun, B. C., & Skoyles, J. R. (2007). Some remarks on the use of visually evoked
potentials to measure magnocellular activity. Clinical Neurophysiology, 118(9),
1903-1905.
Slotnick, S. D., Klein, S. A., Carney, T., Sutter, E., & Dastmalchi, S. (1999). Using
multi-stimulus VEP source localization to obtain a retinotopic map of human
primary visual cortex. Clinical Neurophysiology, 110(10), 1793-1800.
Snowden, R. J., Ullrich, D., & Bach, M. (1995). Isolation and characteristics of a
steady-state visually-evoked potential in humans related to the motion of a
stimulus. Vision Research, 35(10), 1365-1373.
Souza, G. S., Gomes, B. D., Lacerda, E. M. C., Saito, C. A., Da Silva Filho, M., &
Silveira, L. C. L. (2008). Amplitude of the transient visual evoked potential
(tVEP) as a function of achromatic and chromatic contrast: contribution of
different visual pathways. Visual Neuroscience, 25(3), 317-325.
Souza, G. S., Gomes, B. D., Saito, C. A., da Silva Filho, M., & Silveira, L. C. L. (2007).
Spatial luminance contrast sensitivity measured with transient VEP: comparison
with psychophysics and evidence of multiple mechanisms. Investigative
Ophthalmology & Visual Science, 48(7), 3396-3404.
Stein, J. (2014). Dyslexia: the role of vision and visual attention. Current developmental
disorders reports, 1(4), 267-280.
Sutter, E. (1992). A deterministic approach to nonlinear systems analysis. In R. B.
Pinter & B. Nabet (Eds.), Nonlinear Vision: Determination of Neural Receptive
Fields, Function, and Networks (pp. 171-220). Cleveland, Ohio: CRC Press.
Suttle, C. M., & Harding, G. F. (1999). Morphology of transient VEPs to luminance and
chromatic pattern onset and offset. Vision Research, 39(8), 1577-1584.
Szmajda, B. A., Grünert, U., & Martin, P. R. (2008). Retinal ganglion cell inputs to the
koniocellular pathway. Journal of Comparative Neurology, 510(3), 251-268.
Tobimatsu, S., Tomoda, H., & Kato, M. (1995). Parvocellular and magnocellular
contributions to visual evoked potentials in humans: stimulation with chromatic
and achromatic gratings and apparent motion. Journal of the neurological
sciences, 134(1), 73-82.
43
Tootell, R. B., Hamilton, S. L., & Switkes, E. (1988). Functional anatomy of macaque
striate cortex. IV. Contrast and magno-parvo streams. Journal of Neuroscience,
8(5), 1594-1609.
Tootell, R. B., Reppas, J. B., Kwong, K. K., Malach, R., Born, R. T., Brady, T. J., . . .
Belliveau, J. W. (1995). Functional analysis of human MT and related visual
cortical areas using magnetic resonance imaging. Journal of Neuroscience,
15(4), 3215-3230.
Vialatte, F.-B., Maurice, M., Dauwels, J., & Cichocki, A. (2010). Steady-state visually
evoked potentials: focus on essential paradigms and future perspectives.
Progress in neurobiology, 90(4), 418-438.
Victor, J. D. (1992). Nonlinear Systems Analysis in Vision: Overview of Kernel
Methods. In R. B. Pinter & B. Nabet (Eds.), Nonlinear Vision: Determination of
Neural Receptive Fields, Function, and Networks (pp. 1-38). Cleveland, Ohio:
CRC Press.
Vidyasagar, T., Kulikowski, J., Lipnicki, D., & Dreher, B. (2002). Convergence of
parvocellular and magnocellular information channels in the primary visual
cortex of the macaque. European Journal of Neuroscience, 16(5), 945-956.
White, A. J., Solomon, S. G., & Martin, P. R. (2001). Spatial properties of koniocellular
cells in the lateral geniculate nucleus of the marmoset Callithrix jacchus. The
Journal of Physiology, 533(2), 519-535.
Wiesel, T. N., & Hubel, D. H. (1966). Spatial and chromatic interactions in the lateral
geniculate body of the rhesus monkey. Journal of Neurophysiology, 29(6),
1115-1156.
Zemon, V., & Gordon, J. (2006). Luminance-contrast mechanisms in humans: visual
evoked potentials and a nonlinear model. Vision Research, 46(24), 4163-4180.
Zemon, V., Gordon, J., & Welch, J. (1988). Asymmetries in ON and OFF visual
pathways of humans revealed using contrast-evoked cortical potentials. Visual
Neuroscience, 1(1), 145-150.
44
Chapter 3: A review of Non-Linear Visual Evoked Potential Research
into Contributions from the Human M and P pathways to Cortical
Vision
3.1 Chapter guide Hugrass, L., & Crewther, D. (In Submission). A review of non-linear visual
evoked potential research into contributions from the human M and P pathways to
cortical vision.
This chapter comprises a re-formatted version of the article cited above, which
has been submitted to Experimental Brain Research as a review paper. In the previous
chapter, I reviewed a range of non-invasive VEP techniques for that are used to
investigate the human M and P pathways, including transient VEP, ssVEP, nonlinear
VEP and VESPA. Of the available techniques, non-linear analysis of multifocal flash
evoked VEP provides the cleanest separation of putative M and P signals. The literature
review presented in the current chapter provides an overview of how this technique has
been applied to study the roles of the human M and P pathways in visual processing at
the cortical level.
45
3.2 Abstract Due to mixing of inputs from the afferent visual pathways, and a restriction
largely to non-invasive recording techniques, it has proved difficult to identify
magnocellular (M) and parvocellular (P) contributions to signals arising from the human
visual cortex, let alone contributions from the koniocellular (K) system. About 20 years
ago, non-linear analyses of visual evoked potentials (VEPs) revealed separable
signatures of putative M and P origins based on their contrast response functions and
latencies. Although several other VEP methods for studying M and P input to the cortex
have been proposed, the nonlinear analysis technique provides the cleanest separation of
the two pathways. Here we review studies that have applied this technique to investigate
M and P contributions to human vision. Such research is important for understanding
how temporal interactions within the two visual pathways contribute to individual
differences and abnormalities in visual processing.
46
3.3 Introduction More than 20 years ago, Klistorner, Crewther, and Crewther (1997) reported that
the magnocellular (M) and parvocellular (P) afferent pathways to the primary visual
cortex can be studied separately through non-linear analysis of multifocal visual flash
evoked potentials (VEPs). There are several reasons why it is important to develop non-
invasive techniques to investigate the functions of the M and P pathways in isolation.
Firstly, primate studies show that the afferent pathways contribute in different ways to
foreground-background segmentation of the visual scene, so studying their
contributions to VEPs may shed light on object processing mechanisms in humans
(Bullier, 2001; Hupé et al., 1998). Furthermore, M input activates the cortex
approximately 10-30ms earlier than the initial wave of P input (Nowak, Munk, Girard,
& Bullier, 1995), a phenomenon termed the magnocellular advantage (Laycock,
Crewther, & Crewther, 2007). In addition, M pathway dysfunction may contribute to
various clinical conditions including dyslexia (Lovegrove, 1996; Stein & Walsh, 1997),
schizophrenia (Butler et al., 2006) and autism (McCleery, Akshoomoff, Dobkins, &
Carver, 2009).
We begin this review with a description of the major afferent pathways to the
visual cortex (§ 3.4), and an introduction to non-linear temporal analysis of VEPs (§
3.5). Next, we present an overview of evidence that temporal non-linearities in the M
and P pathways contribute to separate slices of the second order VEP kernel (§ 3.5.2),
and review studies that have applied this technique to research the human M and P
pathways (§ 3.6). We finish the review with some suggestions for future directions in
understanding contributions from the major afferent pathways to visual processing and
visual dysfunction (§ 3.7 and 3.8).
3.4 Primate physiology: Characteristics of the M and P pathways Primate research into the major visual pathways has been reviewed in detail
elsewhere (Hendry & Reid, 2000; Kaplan, 2014; Nassi & Callaway, 2009). M cells,
served by large diameter axons, have fast conduction speeds, a preference for high
temporal frequency stimulation, low chromatic contrast sensitivity, and luminance
contrast response functions (CFRs) with high contrast gain and rapid saturation. P cells
have slower conduction speeds, a preference for low temporal frequency input, high
red/green chromatic sensitivity, and non-saturating achromatic CRFs with low gain
(Derrington & Lennie, 1984; Kaplan & Shapley, 1986; Livingstone & Hubel, 1988).
47
Koniocellular (K) cells (konio: Greek, dust) were initially ignored by neuroanatomists
and neurophysiologists alike, who focused on the larger M and P cells when
characterising the visual system. However, it is now known that a subset of K
projections plays an important role in transmitting short-wavelength (blue) cone input to
the cortex. K cells have slow conduction speeds and heterogeneous CRFs, intermediate
to those of M or P cells (Casagrande, 1994; Ghodrati, Khaligh-Razavi, & Lehky, 2017;
Martin, White, Goodchild, Wilder, & Sefton, 1997; White, Solomon, & Martin, 2001),
presumably because the class represents multiple cell types that exhibit calbindin
immunoreactivity.
The role of the cortical dorsal and ventral streams has captured the attention of
scientists for some time. Initially related to “where” and “what” functions respectively,
the publications of Livingstone and Hubel (1988; 1987) caused an explosion of interest
as to whether the M pathway drove the dorsal stream and the P pathway drove the
ventral stream, or whether the situation was rather more complicated. The latter view
turned out to be correct. The current understanding is that after the afferent pathways
reach the cortex, the ventral ‘vision for perception’ stream receives predominantly P
input, and the dorsal ‘vision for action’ stream receives predominantly M input; yet a
substantial number of cells receive converging input from the different afferent
pathways (Nassi & Callaway, 2009; Nealey & Maunsell, 1994; Vidyasagar,
Kulikowski, Lipnicki, & Dreher, 2002). This means that it is not easy to separate M, P
and K contributions to cortical visual processing mechanisms.
Due to fast conduction speeds, the initial feed-forward volley of M input is
sufficiently rapid to allow feedback from extra-striate regions to modulate V1 responses
to P input (Bullier, 2001; Kveraga, Boshyan, & Bar, 2007; Laycock et al., 2007).
Furthermore, different rates of recovery from stimulation mean it is likely that M and P
cells contribute to different temporal slices of non-linear VEP responses (Klistorner et
al., 1997). Due to the heterogeneity of K receptive field properties, physiological
characterisation of the K pathways has remained elusive. Therefore, this review focuses
mostly on the study of non-linear VEP signatures of M and P processing, and then later
revisits possible K contributions.
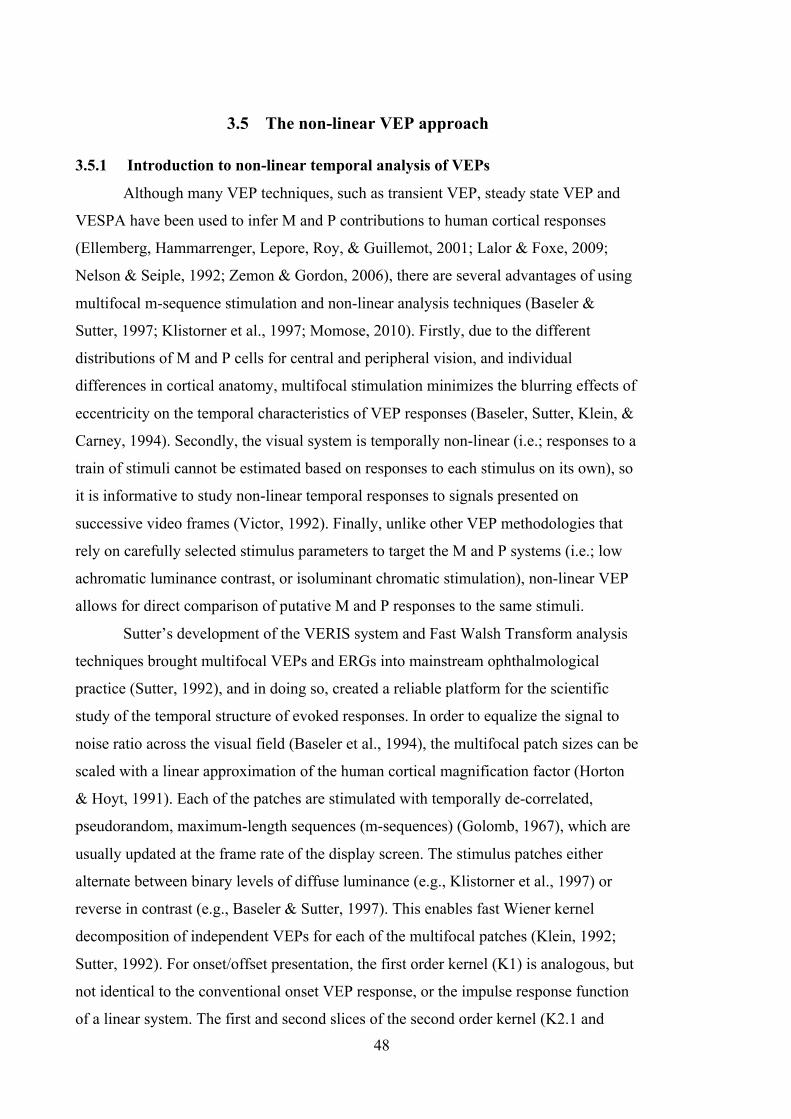
48
3.5 The non-linear VEP approach
3.5.1 Introduction to non-linear temporal analysis of VEPs
Although many VEP techniques, such as transient VEP, steady state VEP and
VESPA have been used to infer M and P contributions to human cortical responses
(Ellemberg, Hammarrenger, Lepore, Roy, & Guillemot, 2001; Lalor & Foxe, 2009;
Nelson & Seiple, 1992; Zemon & Gordon, 2006), there are several advantages of using
multifocal m-sequence stimulation and non-linear analysis techniques (Baseler &
Sutter, 1997; Klistorner et al., 1997; Momose, 2010). Firstly, due to the different
distributions of M and P cells for central and peripheral vision, and individual
differences in cortical anatomy, multifocal stimulation minimizes the blurring effects of
eccentricity on the temporal characteristics of VEP responses (Baseler, Sutter, Klein, &
Carney, 1994). Secondly, the visual system is temporally non-linear (i.e.; responses to a
train of stimuli cannot be estimated based on responses to each stimulus on its own), so
it is informative to study non-linear temporal responses to signals presented on
successive video frames (Victor, 1992). Finally, unlike other VEP methodologies that
rely on carefully selected stimulus parameters to target the M and P systems (i.e.; low
achromatic luminance contrast, or isoluminant chromatic stimulation), non-linear VEP
allows for direct comparison of putative M and P responses to the same stimuli.
Sutter’s development of the VERIS system and Fast Walsh Transform analysis
techniques brought multifocal VEPs and ERGs into mainstream ophthalmological
practice (Sutter, 1992), and in doing so, created a reliable platform for the scientific
study of the temporal structure of evoked responses. In order to equalize the signal to
noise ratio across the visual field (Baseler et al., 1994), the multifocal patch sizes can be
scaled with a linear approximation of the human cortical magnification factor (Horton
& Hoyt, 1991). Each of the patches are stimulated with temporally de-correlated,
pseudorandom, maximum-length sequences (m-sequences) (Golomb, 1967), which are
usually updated at the frame rate of the display screen. The stimulus patches either
alternate between binary levels of diffuse luminance (e.g., Klistorner et al., 1997) or
reverse in contrast (e.g., Baseler & Sutter, 1997). This enables fast Wiener kernel
decomposition of independent VEPs for each of the multifocal patches (Klein, 1992;
Sutter, 1992). For onset/offset presentation, the first order kernel (K1) is analogous, but
not identical to the conventional onset VEP response, or the impulse response function
of a linear system. The first and second slices of the second order kernel (K2.1 and

49
K2.2) measure non-linear temporal responses over one and two video frames
respectively (Sutter, 1992). An example to illustrate typical K1, K2.1 and K2.2
waveforms is provided in Figure 3.1.
Figure 3.1 Illustration of typical (a) K1, (b) K2.1 and (c) K2.2 waveforms from a single observer, as measured from the central patch of a multifocal VEP stimulus, at 70% luminance contrast, and a display update rate of 60Hz.
3.5.2 The multifocal VEP approach to identifying M and P inputs to cortical
vision
Baseler and Sutter (1997) stimulated with a multifocal dartboard. Individual
patches were filled with contrast reversing checkerboards, at an m-sequence base rate of
66.7 reversals/s, i.e., 33.3Hz. For pattern reversal stimulation, there is no substantial
first order response, yet there are robust second order responses. The K2.1 waveform
could be decomposed into C1 and C2 components, based on differences in the latency
of K2.1P60 (60-80ms) and K2.1P90 (75-115ms) peaks at different eccentricities. The first
peak was small for the central patch, increased in amplitude outside of the fovea, and its
latency did not change greatly with eccentricity. The amplitude and latency of the
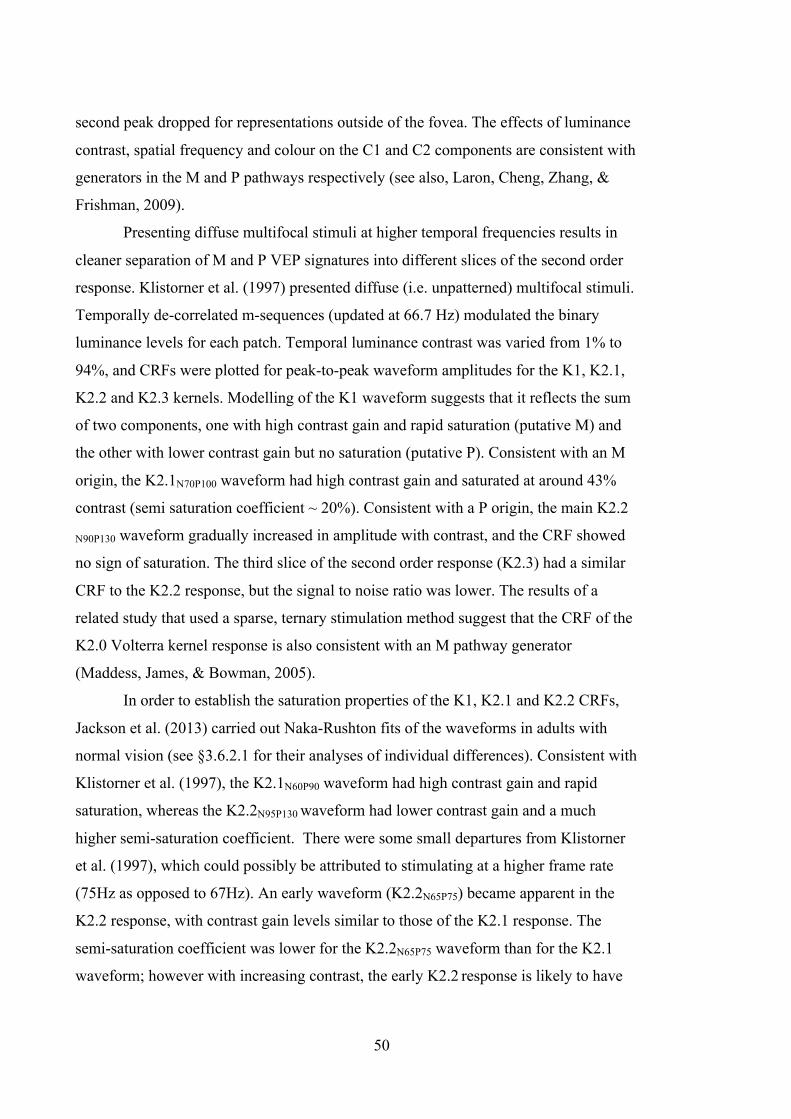
50
second peak dropped for representations outside of the fovea. The effects of luminance
contrast, spatial frequency and colour on the C1 and C2 components are consistent with
generators in the M and P pathways respectively (see also, Laron, Cheng, Zhang, &
Frishman, 2009).
Presenting diffuse multifocal stimuli at higher temporal frequencies results in
cleaner separation of M and P VEP signatures into different slices of the second order
response. Klistorner et al. (1997) presented diffuse (i.e. unpatterned) multifocal stimuli.
Temporally de-correlated m-sequences (updated at 66.7 Hz) modulated the binary
luminance levels for each patch. Temporal luminance contrast was varied from 1% to
94%, and CRFs were plotted for peak-to-peak waveform amplitudes for the K1, K2.1,
K2.2 and K2.3 kernels. Modelling of the K1 waveform suggests that it reflects the sum
of two components, one with high contrast gain and rapid saturation (putative M) and
the other with lower contrast gain but no saturation (putative P). Consistent with an M
origin, the K2.1N70P100 waveform had high contrast gain and saturated at around 43%
contrast (semi saturation coefficient ~ 20%). Consistent with a P origin, the main K2.2
N90P130 waveform gradually increased in amplitude with contrast, and the CRF showed
no sign of saturation. The third slice of the second order response (K2.3) had a similar
CRF to the K2.2 response, but the signal to noise ratio was lower. The results of a
related study that used a sparse, ternary stimulation method suggest that the CRF of the
K2.0 Volterra kernel response is also consistent with an M pathway generator
(Maddess, James, & Bowman, 2005).
In order to establish the saturation properties of the K1, K2.1 and K2.2 CRFs,
Jackson et al. (2013) carried out Naka-Rushton fits of the waveforms in adults with
normal vision (see §3.6.2.1 for their analyses of individual differences). Consistent with
Klistorner et al. (1997), the K2.1N60P90 waveform had high contrast gain and rapid
saturation, whereas the K2.2N95P130 waveform had lower contrast gain and a much
higher semi-saturation coefficient. There were some small departures from Klistorner
et al. (1997), which could possibly be attributed to stimulating at a higher frame rate
(75Hz as opposed to 67Hz). An early waveform (K2.2N65P75) became apparent in the
K2.2 response, with contrast gain levels similar to those of the K2.1 response. The
semi-saturation coefficient was lower for the K2.2N65P75 waveform than for the K2.1
waveform; however with increasing contrast, the early K2.2 response is likely to have
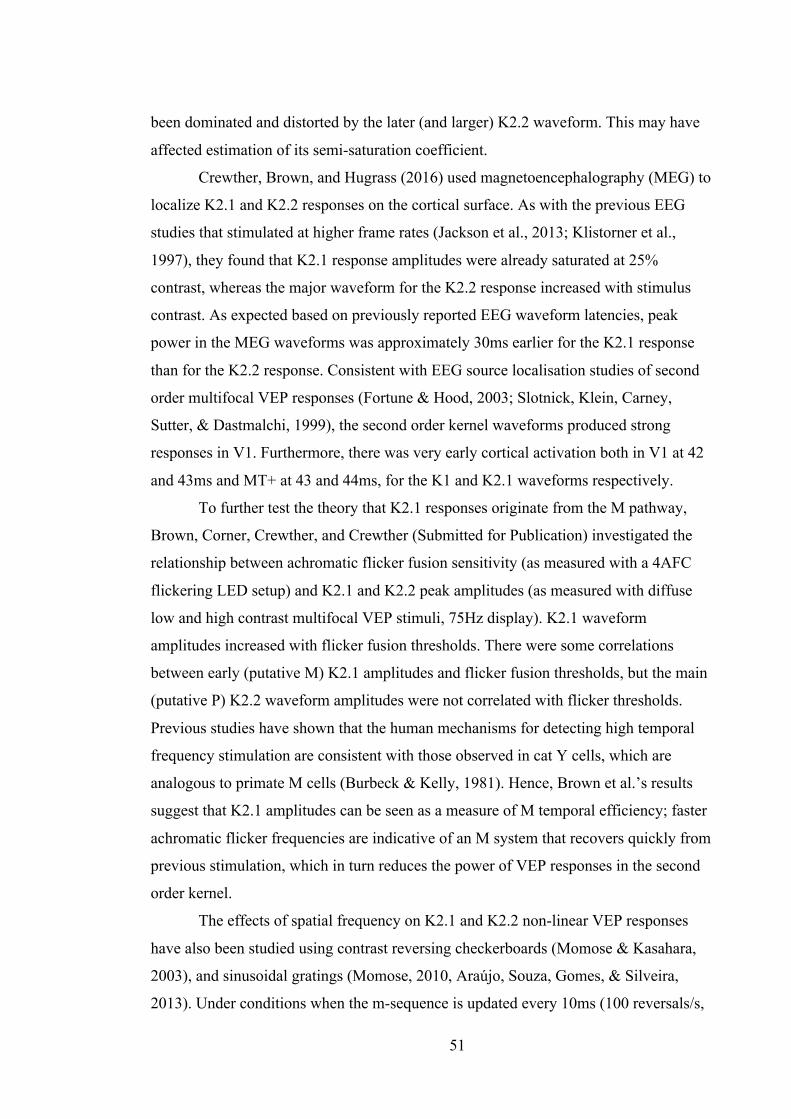
51
been dominated and distorted by the later (and larger) K2.2 waveform. This may have
affected estimation of its semi-saturation coefficient.
Crewther, Brown, and Hugrass (2016) used magnetoencephalography (MEG) to
localize K2.1 and K2.2 responses on the cortical surface. As with the previous EEG
studies that stimulated at higher frame rates (Jackson et al., 2013; Klistorner et al.,
1997), they found that K2.1 response amplitudes were already saturated at 25%
contrast, whereas the major waveform for the K2.2 response increased with stimulus
contrast. As expected based on previously reported EEG waveform latencies, peak
power in the MEG waveforms was approximately 30ms earlier for the K2.1 response
than for the K2.2 response. Consistent with EEG source localisation studies of second
order multifocal VEP responses (Fortune & Hood, 2003; Slotnick, Klein, Carney,
Sutter, & Dastmalchi, 1999), the second order kernel waveforms produced strong
responses in V1. Furthermore, there was very early cortical activation both in V1 at 42
and 43ms and MT+ at 43 and 44ms, for the K1 and K2.1 waveforms respectively.
To further test the theory that K2.1 responses originate from the M pathway,
Brown, Corner, Crewther, and Crewther (Submitted for Publication) investigated the
relationship between achromatic flicker fusion sensitivity (as measured with a 4AFC
flickering LED setup) and K2.1 and K2.2 peak amplitudes (as measured with diffuse
low and high contrast multifocal VEP stimuli, 75Hz display). K2.1 waveform
amplitudes increased with flicker fusion thresholds. There were some correlations
between early (putative M) K2.1 amplitudes and flicker fusion thresholds, but the main
(putative P) K2.2 waveform amplitudes were not correlated with flicker thresholds.
Previous studies have shown that the human mechanisms for detecting high temporal
frequency stimulation are consistent with those observed in cat Y cells, which are
analogous to primate M cells (Burbeck & Kelly, 1981). Hence, Brown et al.’s results
suggest that K2.1 amplitudes can be seen as a measure of M temporal efficiency; faster
achromatic flicker frequencies are indicative of an M system that recovers quickly from
previous stimulation, which in turn reduces the power of VEP responses in the second
order kernel.
The effects of spatial frequency on K2.1 and K2.2 non-linear VEP responses
have also been studied using contrast reversing checkerboards (Momose & Kasahara,
2003), and sinusoidal gratings (Momose, 2010, Araújo, Souza, Gomes, & Silveira,
2013). Under conditions when the m-sequence is updated every 10ms (100 reversals/s,
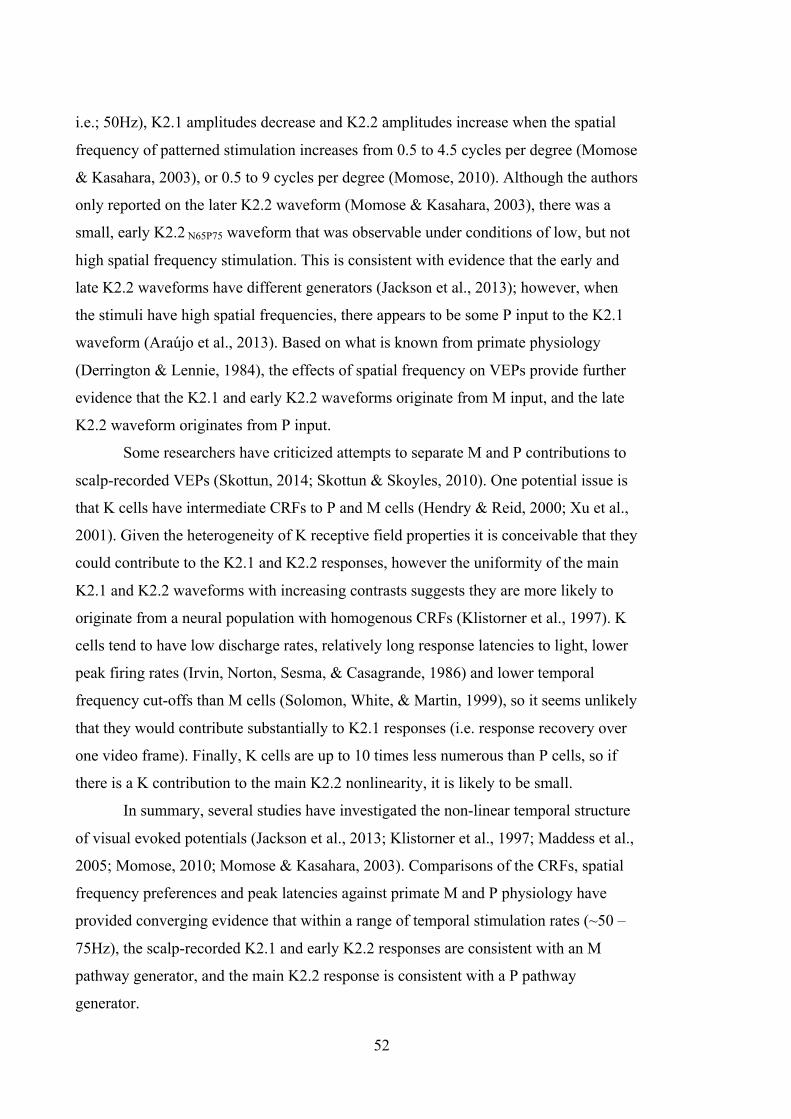
52
i.e.; 50Hz), K2.1 amplitudes decrease and K2.2 amplitudes increase when the spatial
frequency of patterned stimulation increases from 0.5 to 4.5 cycles per degree (Momose
& Kasahara, 2003), or 0.5 to 9 cycles per degree (Momose, 2010). Although the authors
only reported on the later K2.2 waveform (Momose & Kasahara, 2003), there was a
small, early K2.2 N65P75 waveform that was observable under conditions of low, but not
high spatial frequency stimulation. This is consistent with evidence that the early and
late K2.2 waveforms have different generators (Jackson et al., 2013); however, when
the stimuli have high spatial frequencies, there appears to be some P input to the K2.1
waveform (Araújo et al., 2013). Based on what is known from primate physiology
(Derrington & Lennie, 1984), the effects of spatial frequency on VEPs provide further
evidence that the K2.1 and early K2.2 waveforms originate from M input, and the late
K2.2 waveform originates from P input.
Some researchers have criticized attempts to separate M and P contributions to
scalp-recorded VEPs (Skottun, 2014; Skottun & Skoyles, 2010). One potential issue is
that K cells have intermediate CRFs to P and M cells (Hendry & Reid, 2000; Xu et al.,
2001). Given the heterogeneity of K receptive field properties it is conceivable that they
could contribute to the K2.1 and K2.2 responses, however the uniformity of the main
K2.1 and K2.2 waveforms with increasing contrasts suggests they are more likely to
originate from a neural population with homogenous CRFs (Klistorner et al., 1997). K
cells tend to have low discharge rates, relatively long response latencies to light, lower
peak firing rates (Irvin, Norton, Sesma, & Casagrande, 1986) and lower temporal
frequency cut-offs than M cells (Solomon, White, & Martin, 1999), so it seems unlikely
that they would contribute substantially to K2.1 responses (i.e. response recovery over
one video frame). Finally, K cells are up to 10 times less numerous than P cells, so if
there is a K contribution to the main K2.2 nonlinearity, it is likely to be small.
In summary, several studies have investigated the non-linear temporal structure
of visual evoked potentials (Jackson et al., 2013; Klistorner et al., 1997; Maddess et al.,
2005; Momose, 2010; Momose & Kasahara, 2003). Comparisons of the CRFs, spatial
frequency preferences and peak latencies against primate M and P physiology have
provided converging evidence that within a range of temporal stimulation rates (~50 –
75Hz), the scalp-recorded K2.1 and early K2.2 responses are consistent with an M
pathway generator, and the main K2.2 response is consistent with a P pathway
generator.
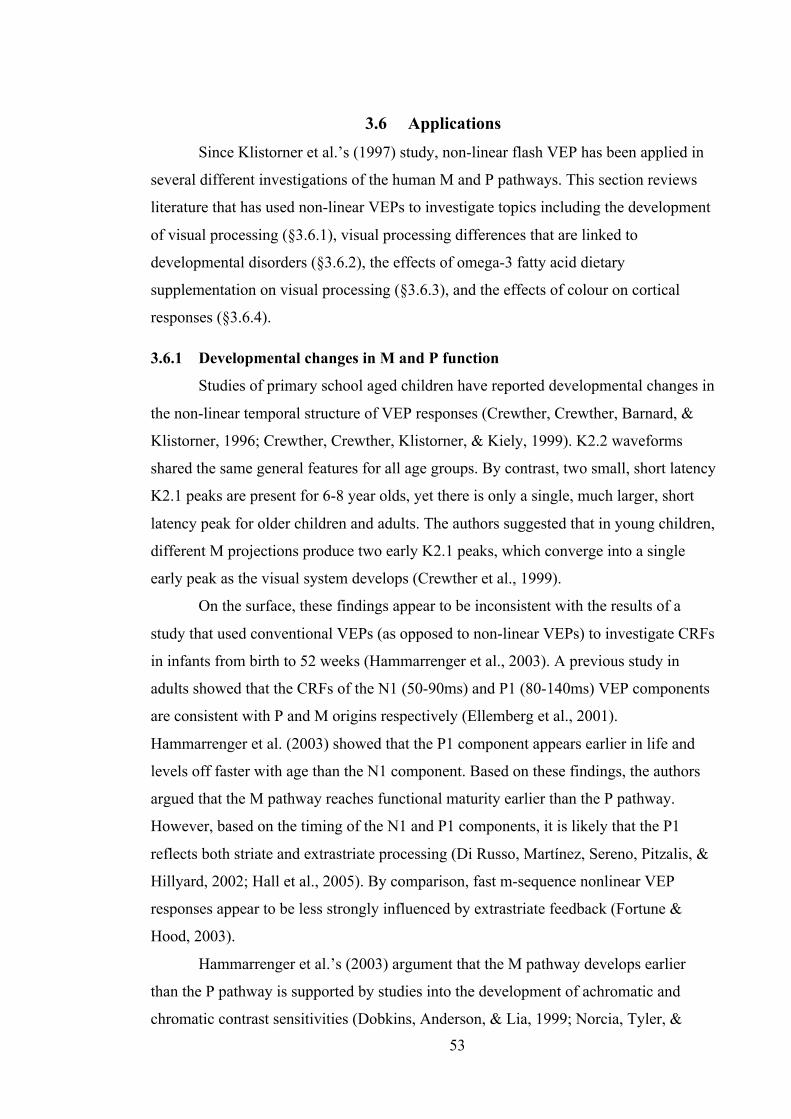
53
3.6 Applications Since Klistorner et al.’s (1997) study, non-linear flash VEP has been applied in
several different investigations of the human M and P pathways. This section reviews
literature that has used non-linear VEPs to investigate topics including the development
of visual processing (§3.6.1), visual processing differences that are linked to
developmental disorders (§3.6.2), the effects of omega-3 fatty acid dietary
supplementation on visual processing (§3.6.3), and the effects of colour on cortical
responses (§3.6.4).
3.6.1 Developmental changes in M and P function
Studies of primary school aged children have reported developmental changes in
the non-linear temporal structure of VEP responses (Crewther, Crewther, Barnard, &
Klistorner, 1996; Crewther, Crewther, Klistorner, & Kiely, 1999). K2.2 waveforms
shared the same general features for all age groups. By contrast, two small, short latency
K2.1 peaks are present for 6-8 year olds, yet there is only a single, much larger, short
latency peak for older children and adults. The authors suggested that in young children,
different M projections produce two early K2.1 peaks, which converge into a single
early peak as the visual system develops (Crewther et al., 1999).
On the surface, these findings appear to be inconsistent with the results of a
study that used conventional VEPs (as opposed to non-linear VEPs) to investigate CRFs
in infants from birth to 52 weeks (Hammarrenger et al., 2003). A previous study in
adults showed that the CRFs of the N1 (50-90ms) and P1 (80-140ms) VEP components
are consistent with P and M origins respectively (Ellemberg et al., 2001).
Hammarrenger et al. (2003) showed that the P1 component appears earlier in life and
levels off faster with age than the N1 component. Based on these findings, the authors
argued that the M pathway reaches functional maturity earlier than the P pathway.
However, based on the timing of the N1 and P1 components, it is likely that the P1
reflects both striate and extrastriate processing (Di Russo, Martínez, Sereno, Pitzalis, &
Hillyard, 2002; Hall et al., 2005). By comparison, fast m-sequence nonlinear VEP
responses appear to be less strongly influenced by extrastriate feedback (Fortune &
Hood, 2003).
Hammarrenger et al.’s (2003) argument that the M pathway develops earlier
than the P pathway is supported by studies into the development of achromatic and
chromatic contrast sensitivities (Dobkins, Anderson, & Lia, 1999; Norcia, Tyler, &
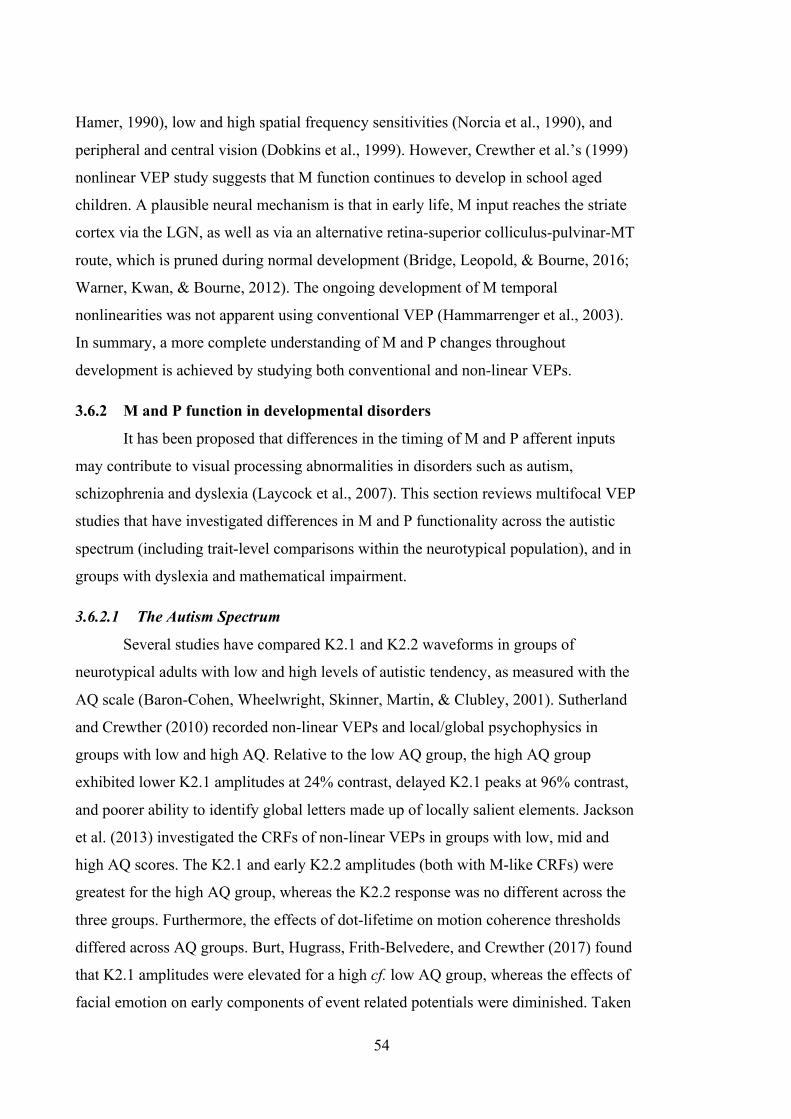
54
Hamer, 1990), low and high spatial frequency sensitivities (Norcia et al., 1990), and
peripheral and central vision (Dobkins et al., 1999). However, Crewther et al.’s (1999)
nonlinear VEP study suggests that M function continues to develop in school aged
children. A plausible neural mechanism is that in early life, M input reaches the striate
cortex via the LGN, as well as via an alternative retina-superior colliculus-pulvinar-MT
route, which is pruned during normal development (Bridge, Leopold, & Bourne, 2016;
Warner, Kwan, & Bourne, 2012). The ongoing development of M temporal
nonlinearities was not apparent using conventional VEP (Hammarrenger et al., 2003).
In summary, a more complete understanding of M and P changes throughout
development is achieved by studying both conventional and non-linear VEPs.
3.6.2 M and P function in developmental disorders
It has been proposed that differences in the timing of M and P afferent inputs
may contribute to visual processing abnormalities in disorders such as autism,
schizophrenia and dyslexia (Laycock et al., 2007). This section reviews multifocal VEP
studies that have investigated differences in M and P functionality across the autistic
spectrum (including trait-level comparisons within the neurotypical population), and in
groups with dyslexia and mathematical impairment.
3.6.2.1 The Autism Spectrum
Several studies have compared K2.1 and K2.2 waveforms in groups of
neurotypical adults with low and high levels of autistic tendency, as measured with the
AQ scale (Baron-Cohen, Wheelwright, Skinner, Martin, & Clubley, 2001). Sutherland
and Crewther (2010) recorded non-linear VEPs and local/global psychophysics in
groups with low and high AQ. Relative to the low AQ group, the high AQ group
exhibited lower K2.1 amplitudes at 24% contrast, delayed K2.1 peaks at 96% contrast,
and poorer ability to identify global letters made up of locally salient elements. Jackson
et al. (2013) investigated the CRFs of non-linear VEPs in groups with low, mid and
high AQ scores. The K2.1 and early K2.2 amplitudes (both with M-like CRFs) were
greatest for the high AQ group, whereas the K2.2 response was no different across the
three groups. Furthermore, the effects of dot-lifetime on motion coherence thresholds
differed across AQ groups. Burt, Hugrass, Frith-Belvedere, and Crewther (2017) found
that K2.1 amplitudes were elevated for a high cf. low AQ group, whereas the effects of
facial emotion on early components of event related potentials were diminished. Taken
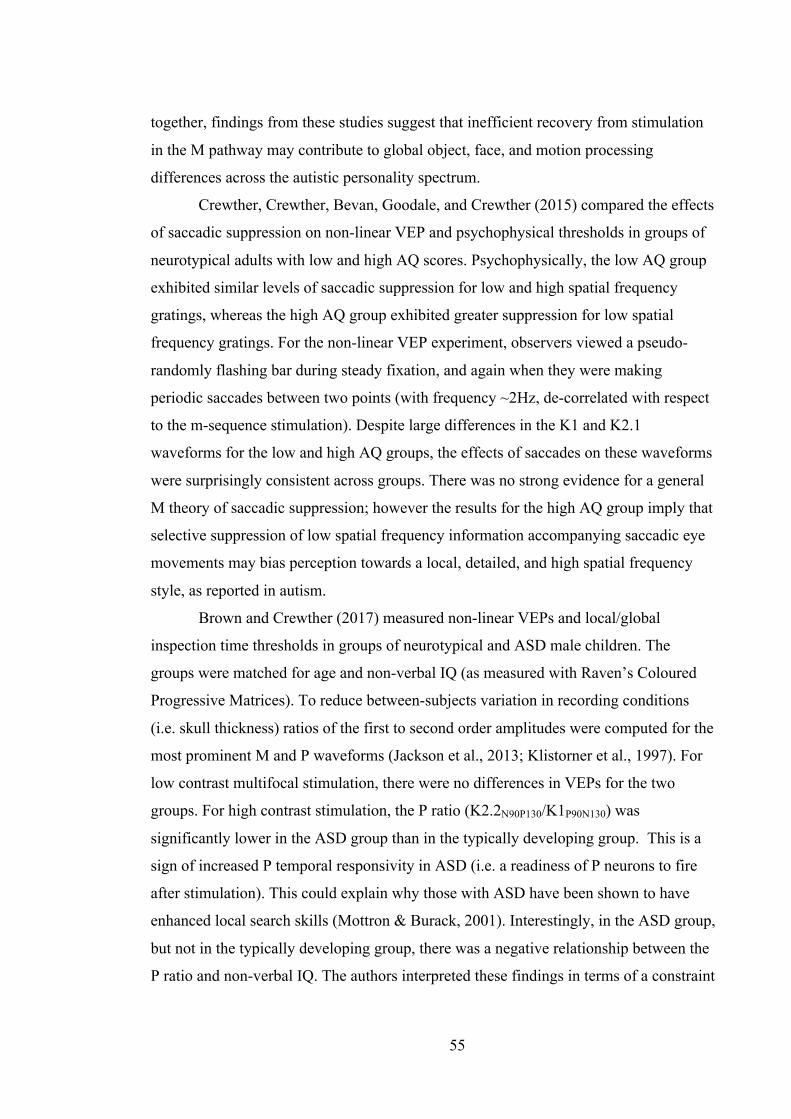
55
together, findings from these studies suggest that inefficient recovery from stimulation
in the M pathway may contribute to global object, face, and motion processing
differences across the autistic personality spectrum.
Crewther, Crewther, Bevan, Goodale, and Crewther (2015) compared the effects
of saccadic suppression on non-linear VEP and psychophysical thresholds in groups of
neurotypical adults with low and high AQ scores. Psychophysically, the low AQ group
exhibited similar levels of saccadic suppression for low and high spatial frequency
gratings, whereas the high AQ group exhibited greater suppression for low spatial
frequency gratings. For the non-linear VEP experiment, observers viewed a pseudo-
randomly flashing bar during steady fixation, and again when they were making
periodic saccades between two points (with frequency ~2Hz, de-correlated with respect
to the m-sequence stimulation). Despite large differences in the K1 and K2.1
waveforms for the low and high AQ groups, the effects of saccades on these waveforms
were surprisingly consistent across groups. There was no strong evidence for a general
M theory of saccadic suppression; however the results for the high AQ group imply that
selective suppression of low spatial frequency information accompanying saccadic eye
movements may bias perception towards a local, detailed, and high spatial frequency
style, as reported in autism.
Brown and Crewther (2017) measured non-linear VEPs and local/global
inspection time thresholds in groups of neurotypical and ASD male children. The
groups were matched for age and non-verbal IQ (as measured with Raven’s Coloured
Progressive Matrices). To reduce between-subjects variation in recording conditions
(i.e. skull thickness) ratios of the first to second order amplitudes were computed for the
most prominent M and P waveforms (Jackson et al., 2013; Klistorner et al., 1997). For
low contrast multifocal stimulation, there were no differences in VEPs for the two
groups. For high contrast stimulation, the P ratio (K2.2N90P130/K1P90N130) was
significantly lower in the ASD group than in the typically developing group. This is a
sign of increased P temporal responsivity in ASD (i.e. a readiness of P neurons to fire
after stimulation). This could explain why those with ASD have been shown to have
enhanced local search skills (Mottron & Burack, 2001). Interestingly, in the ASD group,
but not in the typically developing group, there was a negative relationship between the
P ratio and non-verbal IQ. The authors interpreted these findings in terms of a constraint
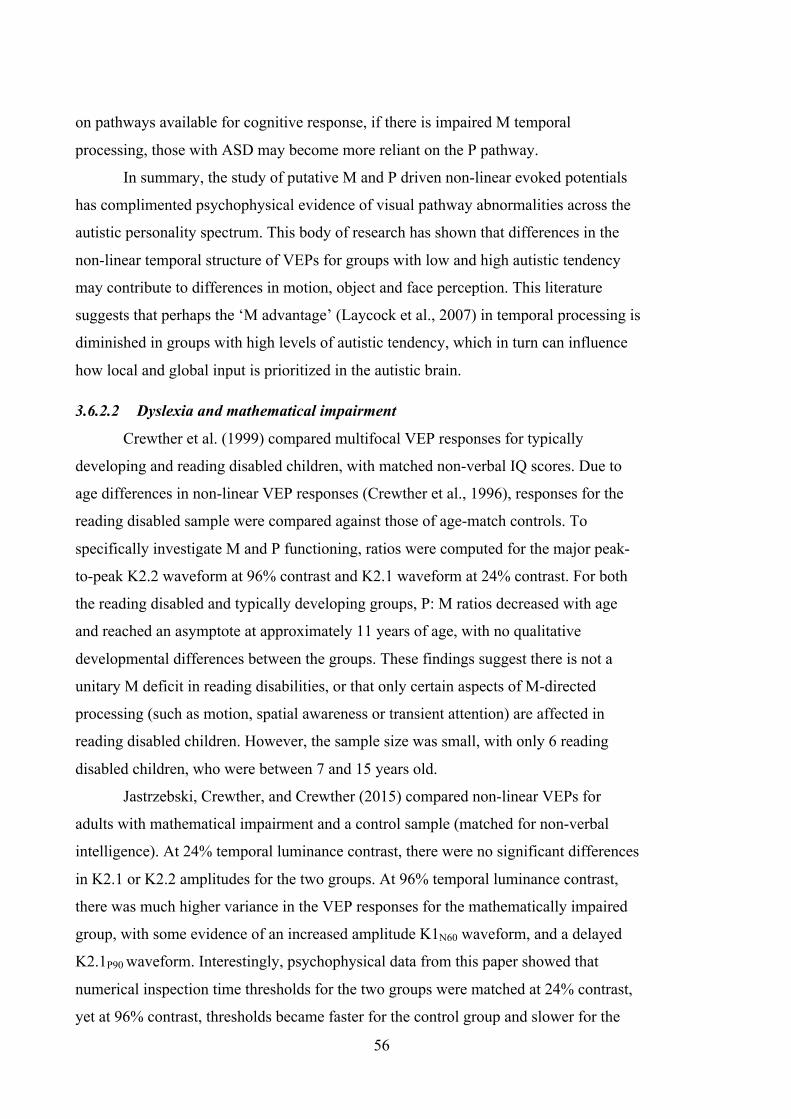
56
on pathways available for cognitive response, if there is impaired M temporal
processing, those with ASD may become more reliant on the P pathway.
In summary, the study of putative M and P driven non-linear evoked potentials
has complimented psychophysical evidence of visual pathway abnormalities across the
autistic personality spectrum. This body of research has shown that differences in the
non-linear temporal structure of VEPs for groups with low and high autistic tendency
may contribute to differences in motion, object and face perception. This literature
suggests that perhaps the ‘M advantage’ (Laycock et al., 2007) in temporal processing is
diminished in groups with high levels of autistic tendency, which in turn can influence
how local and global input is prioritized in the autistic brain.
3.6.2.2 Dyslexia and mathematical impairment
Crewther et al. (1999) compared multifocal VEP responses for typically
developing and reading disabled children, with matched non-verbal IQ scores. Due to
age differences in non-linear VEP responses (Crewther et al., 1996), responses for the
reading disabled sample were compared against those of age-match controls. To
specifically investigate M and P functioning, ratios were computed for the major peak-
to-peak K2.2 waveform at 96% contrast and K2.1 waveform at 24% contrast. For both
the reading disabled and typically developing groups, P: M ratios decreased with age
and reached an asymptote at approximately 11 years of age, with no qualitative
developmental differences between the groups. These findings suggest there is not a
unitary M deficit in reading disabilities, or that only certain aspects of M-directed
processing (such as motion, spatial awareness or transient attention) are affected in
reading disabled children. However, the sample size was small, with only 6 reading
disabled children, who were between 7 and 15 years old.
Jastrzebski, Crewther, and Crewther (2015) compared non-linear VEPs for
adults with mathematical impairment and a control sample (matched for non-verbal
intelligence). At 24% temporal luminance contrast, there were no significant differences
in K2.1 or K2.2 amplitudes for the two groups. At 96% temporal luminance contrast,
there was much higher variance in the VEP responses for the mathematically impaired
group, with some evidence of an increased amplitude K1N60 waveform, and a delayed
K2.1P90 waveform. Interestingly, psychophysical data from this paper showed that
numerical inspection time thresholds for the two groups were matched at 24% contrast,
yet at 96% contrast, thresholds became faster for the control group and slower for the
57
mathematically impaired group. The authors suggest that the delay in the M processing
(as evidenced by a later K2.1 peak) may lead to impaired centre-surround and transient
attentional mechanisms at high contrast.
In summary, the study of M and P signatures in non-linear evoked potentials
does not support a unitary M deficit for children with dyslexia and adults with
mathematical impairment. Although psychophysical studies have provided substantial
evidence of dyslexic abnormalities on putative M visual processing tasks (Lovegrove,
1996; Stein, 2014), there has been some controversy regarding the M theory for
dyslexia (Skottun, 2000). A potential explanation is that in normal readers, M input
rapidly activates attentional mechanisms and gates spotlighting of sequential letters or
numbers (Vidyasagar & Pammer, 2010). Abnormal temporal interactions between
inputs from the M and P pathways might impair this mechanism in people with reading
difficulties (and perhaps also in people with numeric difficulties). Non-linear VEP
studies with larger samples of children with reading and numerical difficulties may shed
light on whether these impairments are associated with temporal processing
abnormalities in the M and P pathways.
3.6.3 Psychopharmacology and nonlinear VEP: Effects of Omega-3 PUFA diets
Omega-3 PUFAs such as eicosapentaenoic acid (EPA) and docosahexaenoic
acid (DHA) are major components of the lipid bilayer of cell membranes in the brain
(Horrocks & Farooqui, 2004). Retinal development in infants varies with the dietary
supply of Omega-3 PUFAs (Birch, Birch, Hoffman, & Uauy, 1992), and there is reason
to believe that DHA is important for M function (Stein, 2014; Taylor & Richardson,
2000).
In a double-blind cross-over design, healthy adults were administered DHA and
EPA rich fish-oil supplements for 30 days prior to non-linear VEP recordings (Bauer et
al., 2011). Following EPA supplementation, there was a significant reduction in the M-
driven K2.1 and early K2.2 non-linear VEP components, and a significant improvement
in choice reaction times, relative to baseline measurements. DHA supplementation
decreased the early K2.2 amplitude, but it did not influence later K2.2 amplitudes
(putative P) or simple motor reaction times. The reduction in M-driven non-linearity
after EPA administration suggests that it plays a role in improving the efficiency of M
recovery from temporal stimulation.
58
While several authors have argued that Omega-3 PUFA supplementation may be
beneficial for children with autism, ADHD or learning disabilities (Sinn & Bryan, 2007;
Taylor & Richardson, 2000; Vancassel et al., 2001), the results have been inconclusive.
There has been a lack of well-controlled studies into whether PUFA supplementation
helps children with learning disorders (Tan, Ho, & Teh, 2012). Further research would
be required to establish whether an improvement in M efficiency might mediate the
effects of PUFA supplementation on perceptual and behavioural outcomes for children
with developmental disorders.
3.6.4 Colour processing
There has been a lot of debate as to whether luminance and colour are
represented separately in the brain (Shapley & Hawken, 2011). At the level of the LGN
the afferent streams have different sensitivities to colour, P cells respond well to
equiluminant red/green gratings, M cells are insensitive to chromatic contrast (Wiesel &
Hubel, 1966), and a subpopulation of K cells transmits s-cone signal to the cortex
(Chatterjee & Callaway, 2003). Colour and form processing becomes mixed at the
cortical level (Edwards, Purpura, & Kaplan, 1995). For instance, V1 layers 2/3 receive
uniformly distributed PC input (via V1 layer 4cβ), sparse MC input to centres of
cytochrome oxidase blobs (via V1 layer 4Cα) and KC input via the LGN (Ding &
Casagrande, 1998; Livingstone & Hubel, 1982).
Klistorner, Crewther, and Crewther (1998) demonstrated dissociation between
the effects of diffuse red stimulation and achromatic stimulation on non-linear VEP
responses, with chromatic responses in both the K2.1 and K2.2 kernels to red, but not
green stimulation. Crewther and Crewther (2010) used non-linear VEP to investigate
responses to diffuse colour saturation (i.e.; surface colour) and to coloured line patterns
(i.e.; form colour), at 30% luminance contrast. For diffuse colour, chromatic saturation
had the greatest effects on K2.1 amplitudes. For patterned stimuli
(appearance/disappearance presentation mode), there was a clear dominance in the first
order kernel, with relatively small responses in the K2.1 and K2.2 kernels. Interestingly,
K2.1 responses to diffuse stimulation were spectrally dependent, with stronger
responses for blue and red stimulation than for yellow green and cyan stimulation. By
contrast, K1 responses to pattern colour were robust for all colours.
These findings indicate that surface and edge colour representations have
different non-linear temporal structures. M cells are often described as ‘colour blind’, so
59
it is surprising that the K2.1 kernel response increased with chromatic saturation.
Although the M system is not colour selective, it is sensitive to chromatic signal
(Conway, 2014). A potential explanation for the spectral dependency of K2.1 responses
to diffuse colour (Crewther & Crewther, 2010) is that cells within the cytochrome
oxidase blobs of V1 layers 2/3 respond most strongly to diffuse red and blue light (Dow
& Vautin, 1987; Givre, Arezzo, & Schroeder, 1995). Furthermore, cells within blobs
receive M, P and K input, and tend to exhibit higher temporal resolution and lower
spatial resolution than cells between blob centres, which receive predominantly P input
(Edwards et al., 1995). This implies that chromatic sensitivity in the K2.1 waveform
may represent a rapid feed-forward, global figure segmentation signal that precedes
more detailed analyses of edges and surfaces (Bullier, 2001).
Steady state VEP (ssVEP) methods have also been applied to study non-linear
temporal responses to chromatic stimulation. Evidence from ssVEP research suggests
that responses to isoluminant chromatic flicker at the fundamental frequency are
dominated by P and K chromatic processing mechanisms, and that responses at the
second harmonic are dominated by M signals (Barboni et al., 2013; McKeefry, Russell,
Murray, & Kulikowski, 1996), which presumably arise from non-linear summation of
long- and medium-wavelength cone input (Lee, Martin, & Valberg, 1989). It would be
of interest for future studies to relate the chromatic processing signals in the K2.1 and
K2.2 nonlinear VEP waveforms to those observed in the fundamental and second
harmonic ssVEP responses.
3.7 Summary and future directions
As reviewed in Section 3.5, converging evidence indicates that the K2.1 and
early K2.2 waveforms originate from M input, whereas the main K2.2 waveform
originates from P input to the primary visual cortex (Brown et al., Submitted for
Publication; Crewther et al., 2016; Crewther & Crewther, 2010; Jackson et al., 2013;
Klistorner et al., 1997; Momose, 2010). However, it is important to keep in mind that
VEP responses are summed from multiple sources, so there is the possibility that the
recorded CRFs of these waveforms reflect combined input from different afferent
pathways (Skottun, 2000).
As reviewed in Section 3.6, studies that have applied this technique to
investigate the M and P pathways have mostly used unpatterned (i.e. diffuse) multifocal
stimuli. However, form can influence the non-linear temporal structure of VEPs (D. P.
60
Crewther & Crewther, 2010). Primate M and P spatial frequency sensitivities have been
well documented (Derrington, Krauskopf, & Lennie, 1984; Irvin, Casagrande, &
Norton, 1993). Although some previous studies have compared the effects of spatial
frequency on K2.1 and K2.2 responses to high contrast, pattern reversal stimuli
(Momose, 2010; Momose & Kasahara, 2003), to our knowledge there have been no
investigations into the combined effects of spatial frequency and luminance contrast on
non-linear VEPs. Future studies that analyse responses to patterned stimuli at various
spatial frequencies and achromatic contrast levels may further support the theory that
the main K2.1 and K2.2 waveforms originate in the M and P pathways respectively.
The contributions of K cells to non-linear VEP waveforms have not been well
studied, presumably owing to difficulties in designing stimuli to target this homogenous
population. The use of tritan stimuli may help to characterise the non-linear temporal
structure of responses produced by the K subpopulation that transmits s-cone opponent
signal to the cortex (Chatterjee & Callaway, 2003). Klistorner et al. (1998) used the
silent substitution method (Estévez & Spekreijse, 1974) to investigate interactions
between red-green chromatic and luminance contrast stimulation, and showed that in
dichromats, the minimum amplitudes of non-linear VEP responses were shifted from
the point of photopic equiluminance, to the red-green silent substitution point. This
suggests it could be informative to compare non-linear VEP response amplitudes
recorded with achromatic stimuli against those recorded with tritan stimuli around the
blue-yellow silent substitution point.
Most of the studies in this review focused on foveal and perifoveal vision. It is
known that the distribution of M and P cells varies with eccentricity (Dacey, 1993), and
that putative M and P non-linear VEP signatures vary with retinal eccentricity (Baseler
& Sutter, 1997; Laron et al., 2009). To date, none of the investigations into non-linear
VEPs in participant groups with potential M abnormalities have investigated the effects
of eccentricity on K2.1 and K2.2 amplitudes. In addition to temporal non-linearities,
non-linear spatial interactions are ubiquitous throughout the visual processing pathway.
Extending non-linear VEP analyses beyond the central patch would also allow for the
investigation of interactions between adjacent patches, which could be achieved through
the extraction of spatially mutual kernels (Zhang, 2003). This may help to further
characterise individual differences in M and P contributions to cortical visual processing
mechanisms.

61
The studies discussed in Sections 3.6.1 and 3.6.2 applied non-linear VEP to
investigate individual differences in M and P contributions to cortical vision. There is a
large degree of inter-subject variability in retinotopic maps of V1, as determined with
fMRI (DeYoe et al., 1996; Engel, 2012) and contrast-reversing multifocal VEPs (Zhang
& Hood, 2004). This is presumably owing to individual variability in cortical folding
patterns. Such differences can complicate comparisons of scalp-recorded VEP signals
across individuals. When principle components analysis (PCA) is applied to multifocal
VEP data via singular value decomposition (SVD), two principle components account
for a high percentage of intra- and inter-subject variance in the data (Dandekar, Ales,
Carney, & Klein, 2007; Zhang & Hood, 2004). When SVD is applied in combination
with MRI, it is possible to resolve VEPs arising from very close cortical sources, such
as V1 and V2 (Ales, Carney, & Klein, 2010; Carney, Ales, & Klein, 2008). These
techniques may improve the reliability of future non-linear VEP studies into changes in
putative M and P responses throughout development and across the autistic personality
spectrum.
3.8 Conclusions In summary, the characteristics of the K2.1 and K2.2 non-linear VEP kernels
indicate they reflect cortical processing of inputs from the M and P afferent pathways
respectively. Over the past 20 years, several studies have applied non-linear VEP
techniques to investigate human M and P functioning. In particular, when this technique
has been paired with psychophysical data, it has added richness to our understanding of
individual differences in visual processing.
3.9 References Ales, J., Carney, T., & Klein, S. A. (2010). The folding fingerprint of visual cortex
reveals the timing of human V1 and V2. Neuroimage, 49(3), 2494-2502.
Araújo, C. S., Souza, G. S., Gomes, B. D., & Silveira, L. C. L. (2013). Visual evoked
cortical potential (VECP) elicited by sinusoidal gratings controlled by pseudo-
random stimulation. PLoS ONE, 8(8), e70207.
Barboni, M., Gomes, B., Souza, G., Rodrigues, A., Ventura, D., & Silveira, L. (2013).
Chromatic spatial contrast sensitivity estimated by visual evoked cortical
62
potential and psychophysics. Brazilian journal of medical and biological
research, 46(2), 154-163.
Baron-Cohen, S., Wheelwright, S., Skinner, R., Martin, J., & Clubley, E. (2001). The
autism-spectrum quotient (AQ): Evidence from Asperger syndrome/high-
functioning autism, males and females, scientists and mathematicians. Journal
of Autism and Developmental Disorders, 31(1), 5-17.
Baseler, H., & Sutter, E. (1997). M and P components of the VEP and their visual field
distribution. Vision Research, 37(6), 675-690.
Baseler, H., Sutter, E., Klein, S., & Carney, T. (1994). The topography of visual evoked
response properties across the visual field. Electroencephalography and clinical
Neurophysiology, 90(1), 65-81.
Bauer, I., Crewther, D. P., Pipingas, A., Rowsell, R., Cockerell, R., & Crewther, S. G.
(2011). Omega-3 fatty acids modify human cortical visual processing—a
double-blind, crossover study. PLoS ONE, 6(12), e28214.
Birch, D. G., Birch, E. E., Hoffman, D. R., & Uauy, R. D. (1992). Retinal development
in very-low-birth-weight infants fed diets differing in omega-3 fatty acids.
Investigative Ophthalmology & Visual Science, 33(8), 2365-2376.
Bridge, H., Leopold, D. A., & Bourne, J. A. (2016). Adaptive pulvinar circuitry
supports visual cognition. Trends in cognitive sciences, 20(2), 146-157.
Brown, A., Corner, M., Crewther, D. P., & Crewther, S. G. (Submitted for Publication).
Human Flicker Fusion Correlates with Physiological Measures of
Magnocellular Neural Efficiency.
Brown, A. C., & Crewther, D. P. (2017). Autistic children show a surprising
relationship between global visual perception, non-verbal intelligence and visual
parvocellular function, not seen in typically developing children. Frontiers in
Human Neuroscience, 11, 239.
Bullier, J. (2001). Integrated model of visual processing. Brain Research Reviews,
36(2–3), 96-107. doi:http://dx.doi.org/10.1016/S0165-0173(01)00085-6
Burbeck, C. A., & Kelly, D. (1981). Contrast gain measurements and the
transient/sustained dichotomy. JOSA, 71(11), 1335-1342.
Burt, A., Hugrass, L., Frith-Belvedere, T., & Crewther, D. (2017). Insensitivity to
Fearful Emotion for Early ERP Components in High Autistic Tendency Is
63
Associated with Lower Magnocellular Efficiency. Frontiers in Human
Neuroscience, 11, 495.
Butler, P. D., Martinez, A., Foxe, J. J., Kim, D., Zemon, V., Silipo, G., . . . Javitt, D. C.
(2006). Subcortical visual dysfunction in schizophrenia drives secondary cortical
impairments. Brain, 130(2), 417-430.
Carney, T., Ales, J., & Klein, S. A. (2008). Combining MRI and VEP imaging to isolate
the temporal response of visual cortical areas. Paper presented at the Human
Vision and Electronic Imaging XIII.
Casagrande, V. A. (1994). A third parallel visual pathway to primate area V1. Trends in
Neurosciences, 17(7), 305-310. doi:http://dx.doi.org/10.1016/0166-
2236(94)90065-5
Chatterjee, S., & Callaway, E. M. (2003). Parallel colour-opponent pathways to primary
visual cortex. Nature, 426(6967), 668-671.
Conway, B. R. (2014). Color signals through dorsal and ventral visual pathways. Visual
Neuroscience, 31(2), 197-209.
Crewther, D. P., Brown, A., & Hugrass, L. (2016). Temporal structure of human
magnetic evoked fields. Exp Brain Res, 234(7), 1987-1995. doi:10.1007/s00221-
016-4601-0
Crewther, D. P., Crewther, D., Bevan, S., Goodale, M. A., & Crewther, S. G. (2015).
Greater magnocellular saccadic suppression in high versus low autistic tendency
suggests a causal path to local perceptual style. Royal Society open science,
2(12), 150226.
Crewther, D. P., & Crewther, S. G. (2010). Different Temporal Structure for Form
versus Surface Cortical Color Systems – Evidence from Chromatic Non-Linear
VEP. PLoS ONE, 5(12), e15266. doi:10.1371/journal.pone.0015266
Crewther, S. G., Crewther, D. P., Barnard, N., & Klistorner, A. (1996).
Electrophysiological and psychophysical evidence for the development of
magnocellular function in children. Clinical & Experimental Ophthalmology,
24(S2), 38-40.
Crewther, S. G., Crewther, D. P., Klistorner, A., & Kiely, P. (1999). Development of
the magnocellular VEP in children: implications for reading disability.
Electroencephalography and clinical neurophysiology. Supplement, 49, 123-
128.
64
Dacey, D. M. (1993). The mosaic of midget ganglion cells in the human retina. Journal
of Neuroscience, 13(12), 5334-5355.
Dandekar, S., Ales, J., Carney, T., & Klein, S. A. (2007). Methods for quantifying intra-
and inter-subject variability of evoked potential data applied to the multifocal
visual evoked potential. Journal of neuroscience methods, 165(2), 270-286.
Derrington, A. M., Krauskopf, J., & Lennie, P. (1984). Chromatic mechanisms in lateral
geniculate nucleus of macaque. The Journal of Physiology, 357, 241-265.
Derrington, A. M., & Lennie, P. (1984). Spatial and temporal contrast sensitivities of
neurones in lateral geniculate nucleus of macaque. The Journal of Physiology,
357(1), 219-240.
DeYoe, E. A., Carman, G. J., Bandettini, P., Glickman, S., Wieser, J., Cox, R., . . .
Neitz, J. (1996). Mapping striate and extrastriate visual areas in human cerebral
cortex. Proceedings of the National Academy of Sciences, 93(6), 2382-2386.
Di Russo, F., Martínez, A., Sereno, M. I., Pitzalis, S., & Hillyard, S. A. (2002). Cortical
sources of the early components of the visual evoked potential. Human Brain
Mapping, 15(2), 95-111.
Ding, Y., & Casagrande, V. (1998). Synaptic and neurochemical characterization of
parallel pathways to the cytochrome oxidase blobs of primate visual cortex.
Journal of Comparative Neurology, 391(4), 429-443.
Dobkins, K. R., Anderson, C. M., & Lia, B. (1999). Infant temporal contrast sensitivity
functions (tCSFs) mature earlier for luminance than for chromatic stimuli:
evidence for precocious magnocellular development? Vision Research, 39(19),
3223-3239.
Dow, B., & Vautin, R. (1987). Horizontal segregation of color information in the
middle layers of foveal striate cortex. Journal of Neurophysiology, 57(3), 712-
739.
Edwards, D. P., Purpura, K. P., & Kaplan, E. (1995). Contrast sensitivity and spatial
frequency response of primate cortical neurons in and around the cytochrome
oxidase blobs. Vision Research, 35(11), 1501-1523.
Ellemberg, D., Hammarrenger, B., Lepore, F., Roy, M.-S., & Guillemot, J.-P. (2001).
Contrast dependency of VEPs as a function of spatial frequency: the
parvocellular and magnocellular contributions to human VEPs. Spatial vision,
15(1), 99-111.
65
Engel, S. A. (2012). The development and use of phase-encoded functional MRI
designs. Neuroimage, 62(2), 1195-1200.
doi:http://dx.doi.org/10.1016/j.neuroimage.2011.09.059
Estévez, O., & Spekreijse, H. (1974). A spectral compensation method for determining
the flicker characteristics of the human colour mechanisms. Vision Research,
14(9), 823-830.
Fortune, B., & Hood, D. C. (2003). Conventional pattern-reversal VEPs are not
equivalent to summed multifocal VEPs. Investigative Ophthalmology & Visual
Science, 44(3), 1364-1375.
Ghodrati, M., Khaligh-Razavi, S.-M., & Lehky, S. R. (2017). Towards building a more
complex view of the lateral geniculate nucleus: recent advances in
understanding its role. Progress in Neurobiology.
Givre, S., Arezzo, J., & Schroeder, C. (1995). Effects of wavelength on the timing and
laminar distribution of illuminance-evoked activity in macaque V1. Visual
Neuroscience, 12(2), 229-239.
Golomb, S. W. (1967). Shift register sequences: Holden-Day.
Hall, S. D., Holliday, I. E., Hillebrand, A., Furlong, P. L., Singh, K. D., & Barnes, G. R.
(2005). Distinct contrast response functions in striate and extra-striate regions of
visual cortex revealed with magnetoencephalography (MEG). Clinical
Neurophysiology, 116(7), 1716-1722.
Hammarrenger, B., Leporé, F., Lippé, S., Labrosse, M., Guillemot, J.-P., & Roy, M.-S.
(2003). Magnocellular and parvocellular developmental course in infants during
the first year of life. Documenta Ophthalmologica, 107(3), 225-233.
Hendry, S. H., & Reid, R. C. (2000). The koniocellular pathway in primate vision.
Annual review of neuroscience, 23(1), 127-153.
Horrocks, L. A., & Farooqui, A. A. (2004). Docosahexaenoic acid in the diet: its
importance in maintenance and restoration of neural membrane function.
Prostaglandins, Leukotrienes and Essential Fatty Acids, 70(4), 361-372.
Horton, J. C., & Hoyt, W. F. (1991). The representation of the visual field in human
striate cortex: a revision of the classic Holmes map. Archives of ophthalmology,
109(6), 816-824.
66
Hupé, J., James, A., Payne, B., Lomber, S., Girard, P., & Bullier, J. (1998). Cortical
feedback improves discrimination between figure and background by V1, V2
and V3 neurons. Nature, 394(6695), 784-787.
Irvin, G. E., Casagrande, V. A., & Norton, T. T. (1993). Center/surround relationships
of magnocellular, parvocellular, and koniocellular relay cells in primate lateral
geniculate nucleus. Visual Neuroscience, 10(2), 363-373.
Irvin, G. E., Norton, T. T., Sesma, M. A., & Casagrande, V. A. (1986). W-like response
properties of interlaminar zone cells in the lateral geniculate nucleus of a
primate (Galago crassicaudatus). Brain research, 362(2), 254-270.
Jackson, B. L., Blackwood, E. M., Blum, J., Carruthers, S. P., Nemorin, S., Pryor, B.
A., . . . Crewther, D. P. (2013). Magno-and parvocellular contrast responses in
varying degrees of autistic trait. PLoS ONE, 8(6), e66797.
Jastrzebski, N. R., Crewther, S. G., & Crewther, D. P. (2015). Mathematical impairment
associated with high-contrast abnormalities in change detection and
magnocellular visual evoked response. Experimental brain research, 233(10),
3039-3046.
Kaplan, E. (2014). The M, P and K pathways of the primate visual system revisited. The
new visual neurosciences (Werner JS, Chalupa LM, eds.). Cambridge, MA:
Massachusetts Institute of Technology.
Kaplan, E., & Shapley, R. M. (1986). The primate retina contains two types of ganglion
cells, with high and low contrast sensitivity. Proceedings of the National
Academy of Sciences, 83(8), 2755-2757.
Klein, S. (1992). Optimizing the Estimation of Nonlinear Kernels. In R. B. Pinter & B.
Nabet (Eds.), Nonlinear Vision: Determination of Neural Receptive Fields,
Function, and Networks (pp. 109-170). Cleveland, Ohio: CRC Press.
Klistorner, A., Crewther, D. P., & Crewther, S. G. (1997). Separate magnocellular and
parvocellular contributions from temporal analysis of the multifocal VEP. Vision
Research, 37(15), 2161-2169.
Klistorner, A., Crewther, D. P., & Crewther, S. G. (1998). Temporal analysis of the
chromatic flash VEP—separate colour and luminance contrast components.
Vision Research, 38(24), 3979-4000. doi:http://dx.doi.org/10.1016/S0042-
6989(97)00394-5

67
Kveraga, K., Boshyan, J., & Bar, M. (2007). Magnocellular Projections as the Trigger
of Top-Down Facilitation in Recognition. The Journal of Neuroscience, 27(48),
13232-13240. doi:10.1523/jneurosci.3481-07.2007
Lalor, E. C., & Foxe, J. J. (2009). Visual evoked spread spectrum analysis (VESPA)
responses to stimuli biased towards magnocellular and parvocellular pathways.
Vision Research, 49(1), 127-133.
Laron, M., Cheng, H., Zhang, B., & Frishman, L. J. (2009). The effect of eccentricity on
the contrast response function of multifocal visual evoked potentials (mfVEPs).
Vision Research, 49(14), 1711-1716. doi:10.1016/j.visres.2009.03.021
Laycock, R., Crewther, S. G., & Crewther, D. P. (2007). A role for the ‘magnocellular
advantage’ in visual impairments in neurodevelopmental and psychiatric
disorders. Neuroscience & Biobehavioral Reviews, 31(3), 363-376.
doi:http://dx.doi.org/10.1016/j.neubiorev.2006.10.003
Lee, B., Martin, P., & Valberg, A. (1989). Sensitivity of macaque retinal ganglion cells
to chromatic and luminance flicker. The Journal of Physiology, 414(1), 223-243.
Livingstone, M. S., & Hubel, D. (1988). Segregation of form, color, movement, and
depth: anatomy, physiology, and perception. Science, 240(4853), 740-749.
Livingstone, M. S., & Hubel, D. H. (1982). Thalamic inputs to cytochrome oxidase-rich
regions in monkey visual cortex. Proceedings of the National Academy of
Sciences, 79(19), 6098-6101.
Livingstone, M. S., & Hubel, D. H. (1987). Psychophysical evidence for separate
channels for the perception of form, color, movement, and depth. Journal of
Neuroscience, 7(11), 3416-3468.
Lovegrove, B. (1996). Dyslexia and a transient/magnocellular pathway deficit: The
current situation and future directions. Australian Journal of Psychology, 48(3),
167-171.
Maddess, T., James, A. C., & Bowman, E. A. (2005). Contrast response of temporally
sparse dichoptic multifocal visual evoked potentials. Visual Neuroscience,
22(2), 153-162.
Martin, P. R., White, A. J., Goodchild, A. K., Wilder, H. D., & Sefton, A. E. (1997).
Evidence that blue-on cells are part of the third geniculocortical pathway in
primates. European Journal of Neuroscience, 9(7), 1536-1541.
68
McCleery, J. P., Akshoomoff, N., Dobkins, K. R., & Carver, L. J. (2009). Atypical Face
Versus Object Processing and Hemispheric Asymmetries in 10-Month-Old
Infants at Risk for Autism. Biological Psychiatry, 66(10), 950-957.
doi:10.1016/j.biopsych.2009.07.031
McKeefry, D., Russell, M., Murray, I., & Kulikowski, J. (1996). Amplitude and phase
variations of harmonic components in human achromatic and chromatic visual
evoked potentials. Visual Neuroscience, 13(4), 639-653.
Momose, K. (2010). Extraction of M and P components from the visual evoked
potential using pseudorandom stimulation with swept parameter technique.
Paper presented at the Engineering in Medicine and Biology Society (EMBC),
2010 Annual International Conference of the IEEE.
Momose, K., & Kasahara, S. (2003). Nonlinear characteristics of visual evoked
potential and their correlation with the visual responses on magnocellular and
parvocellular pathways. Paper presented at the Engineering in Medicine and
Biology Society, 2003. Proceedings of the 25th Annual International Conference
of the IEEE.
Mottron, L., & Burack, J. A. (2001). Enhanced perceptual functioning in the
development of autism.
Nassi, J. J., & Callaway, E. M. (2009). Parallel processing strategies of the primate
visual system. Nature Reviews Neuroscience, 10(5), 360-372.
Nealey, T., & Maunsell, J. (1994). Magnocellular and parvocellular contributions to the
responses of neurons in macaque striate cortex. Journal of Neuroscience, 14(4),
2069-2079.
Nelson, J. I., & Seiple, W. H. (1992). Human VEP contrast modulation sensitivity:
separation of magno-and parvocellular components. Electroencephalography
and Clinical Neurophysiology/Evoked Potentials Section, 84(1), 1-12.
Norcia, A. M., Tyler, C. W., & Hamer, R. D. (1990). Development of contrast
sensitivity in the human infant. Vision Research, 30(10), 1475-1486.
Nowak, L., Munk, M., Girard, P., & Bullier, J. (1995). Visual latencies in areas V1 and
V2 of the macaque monkey. Visual Neuroscience, 12(2), 371-384.
Shapley, R., & Hawken, M. J. (2011). Color in the Cortex: single- and double-opponent
cells. Vision Research, 51(7), 701-717.
doi:http://dx.doi.org/10.1016/j.visres.2011.02.012
69
Sinn, N., & Bryan, J. (2007). Effect of supplementation with polyunsaturated fatty acids
and micronutrients on learning and behavior problems associated with child
ADHD. Journal of Developmental & Behavioral Pediatrics, 28(2), 82-91.
Skottun, B. C. (2000). The magnocellular deficit theory of dyslexia: the evidence from
contrast sensitivity. Vision Research, 40(1), 111-127.
Skottun, B. C. (2014). A few observations on linking VEP responses to the magno-and
parvocellular systems by way of contrast–response functions. International
Journal of Psychophysiology, 91(3), 147-154.
Skottun, B. C., & Skoyles, J. R. (2010). On identifying magnocellular and parvocellular
responses on the basis of contrast-response functions. Schizophrenia bulletin,
37(1), 23-26.
Slotnick, S. D., Klein, S. A., Carney, T., Sutter, E., & Dastmalchi, S. (1999). Using
multi-stimulus VEP source localization to obtain a retinotopic map of human
primary visual cortex. Clinical Neurophysiology, 110(10), 1793-1800.
Solomon, S. G., White, A. J., & Martin, P. R. (1999). Temporal contrast sensitivity in
the lateral geniculate nucleus of a New World monkey, the marmoset Callithrix
jacchus. The Journal of Physiology, 517(3), 907-917.
Stein, J. (2014). Dyslexia: the role of vision and visual attention. Current developmental
disorders reports, 1(4), 267-280.
Stein, J., & Walsh, V. (1997). To see but not to read; the magnocellular theory of
dyslexia. Trends in Neurosciences, 20(4), 147-152.
Sutherland, A., & Crewther, D. P. (2010). Magnocellular visual evoked potential delay
with high autism spectrum quotient yields a neural mechanism for altered
perception. Brain, 133(7), 2089-2097.
Sutter, E. (1992). A deterministic approach to nonlinear systems analysis. In R. B.
Pinter & B. Nabet (Eds.), Nonlinear Vision: Determination of Neural Receptive
Fields, Function, and Networks (pp. 171-220). Cleveland, Ohio: CRC Press.
Tan, M. L., Ho, J. J., & Teh, K. H. (2012). Polyunsaturated fatty acids (PUFAs) for
children with specific learning disorders. Cochrane Database Syst Rev, 12.
Taylor, K., & Richardson, A. (2000). Visual function, fatty acids and dyslexia.
Prostaglandins, Leukotrienes and Essential Fatty Acids (PLEFA), 63(1-2), 89-
93.
70
Vancassel, S., Durand, G., Barthelemy, C., Lejeune, B., Martineau, J., Guilloteau, D., . .
. Chalon, S. (2001). Plasma fatty acid levels in autistic children. Prostaglandins,
Leukotrienes and Essential Fatty Acids (PLEFA), 65(1), 1-7.
Victor, J. D. (1992). Nonlinear Systems Analysis in Vision: Overview of Kernel
Methods. In R. B. Pinter & B. Nabet (Eds.), Nonlinear Vision: Determination of
Neural Receptive Fields, Function, and Networks (pp. 1-38). Cleveland, Ohio:
CRC Press.
Vidyasagar, T., Kulikowski, J., Lipnicki, D., & Dreher, B. (2002). Convergence of
parvocellular and magnocellular information channels in the primary visual
cortex of the macaque. European Journal of Neuroscience, 16(5), 945-956.
Vidyasagar, T. R., & Pammer, K. (2010). Dyslexia: a deficit in visuo-spatial attention,
not in phonological processing. Trends in cognitive sciences, 14(2), 57-63.
Warner, C. E., Kwan, W. C., & Bourne, J. A. (2012). The early maturation of visual
cortical area MT is dependent on input from the retinorecipient medial portion
of the inferior pulvinar. Journal of Neuroscience, 32(48), 17073-17085.
White, A. J., Solomon, S. G., & Martin, P. R. (2001). Spatial properties of koniocellular
cells in the lateral geniculate nucleus of the marmoset Callithrix jacchus. The
Journal of Physiology, 533(2), 519-535.
Wiesel, T. N., & Hubel, D. H. (1966). Spatial and chromatic interactions in the lateral
geniculate body of the rhesus monkey. Journal of Neurophysiology, 29(6),
1115-1156.
Xu, X., Ichida, J. M., Allison, J. D., Boyd, J. D., Bonds, A., & Casagrande, V. A.
(2001). A comparison of koniocellular, magnocellular and parvocellular
receptive field properties in the lateral geniculate nucleus of the owl monkey
(Aotus trivirgatus). The Journal of Physiology, 531(1), 203-218.
Zemon, V., & Gordon, J. (2006). Luminance-contrast mechanisms in humans: visual
evoked potentials and a nonlinear model. Vision Research, 46(24), 4163-4180.
Zhang, X. (2003). Simultaneously recording local luminance responses, spatial and
temporal interactions in the visual system with m-sequences. Vision Research,
43(15), 1689-1698.
Zhang, X., & Hood, D. C. (2004). A principal component analysis of multifocal pattern
reversal VEP. Journal of Vision, 4(1), 4-4.
71
Chapter 4: The Effects of Red Surrounds on Visual Magnocellular
and Parvocellular Cortical Processing and Perception
4.1 Chapter guide Hugrass, L., Verhellen, T., Morrall-Earney, E, Mallon, C & Crewther, D.P. (In Press).
The effects of red surrounds on visual magnocellular and parvocellular cortical
processing and perception. Journal of Vision
This empirical chapter presents a re-formatted version of the original research
article cited above, which has been accepted for publication in Journal of Vision. This
work was conducted with the assistance of an undergraduate student group, who helped
to recruit participants and run the experimental testing sessions. The preliminary
analyses were presented at the Vision Sciences Society conference in 2017.
As reviewed in Chapters 2 and 3, it is not easy to extend results from primate
physiological recordings of the afferent visual pathways to human VEP and behavioural
responses. It is known from primate physiology that red surrounds suppress firing for a
subgroup of M cells. This chapter uses both non-linear VEP and psychophysics to
investigate the long-standing assumption that red backgrounds suppress M contributions
to human cortical responses and perception.
4.1.1 Highlights
• Magnocellular (M) non-linear VEP signatures were not affected by background
colour
• P temporal non-linearity in VEPs was lower with a red than green background
• The effects of background colour on putative M pedestal sensitivity varied with
pedestal chromaticity, luminance and eccentricity
• There were effects of red background on putative P pedestal sensitivity with
grey, but not chromatic pedestals

72
4.2 Abstract More than 50 years ago, Hubel and Wiesel identified a subpopulation of
geniculate magnocellular (M) neurons that are suppressed by diffuse red light. Since
then, many human psychophysical studies have used red and green backgrounds to
study the effects of M suppression on visual task performance, as a means to better
understand neurodevelopmental disorders such as dyslexia and schizophrenia. Few of
these studies have explicitly assessed the relative effects of red backgrounds on the M
and P (parvocellular) pathways. Here we compared the effects of red and green diffuse
background illumination on well-accepted cortical M and P signatures, both
physiologically through non-linear analysis of visual evoked potentials (VEPs; N = 15),
and psychophysically through pulsed and steady pedestal perceptual thresholds (N = 9
with grey pedestals and N = 8 with coloured pedestals). Red surrounds reduced P-
generated temporal non-linearity in the VEPs, but they did not influence M-generated
VEP signatures. The steady and pulsed pedestal results suggest that red surrounds can
have different effects on M and P contrast sensitivities, depending on whether the target
is coloured grey or red, presented centrally or peripherally, or whether it is brighter or
dimmer than the surround. Our results highlight difficulties in interpreting the effects of
red backgrounds on human VEPs or perception in terms of M specific suppression.

73
4.3 Introduction Multiple parallel pathways transmit visual information from the retina to the
cortex, leading to perception of form, colour and motion. The parvocellular (P) pathway
is highly sensitive to (red/green) colour, but it is less sensitive to luminance contrast,
and has a preference for high spatial frequency/low temporal frequency stimulation. The
magnocellular (M) pathway is highly sensitive to luminance contrast but not colour, and
has a preference for low spatial frequency, high temporal frequency stimulation
(Derrington & Lennie, 1984; Kaplan & Shapley, 1986; Livingstone & Hubel, 1988).
The koniocellular (K) pathways are made up of an amalgam of cells with different
properties and presumably different functions, including the transmission of input from
short-wavelength (blue) cones to the visual cortex (Casagrande, 1994; Ghodrati,
Khaligh-Razavi, & Lehky, 2017; Hendry & Reid, 2000; Martin, White, Goodchild,
Wilder, & Sefton, 1997).
There are several reasons why psychologists and cognitive neuroscientists have
studied M function. Firstly, M input reaches the primary visual cortex (V1) faster than P
input, playing an important role in foreground-background segmentation of the visual
scene (Bullier, 2001; Hupé, James, Payne, & Lomber, 1998), a primary stage of object
recognition. Secondly, the dorsal ‘vision for action’ stream receives predominantly M
input (Maunsell, Nealey, & DePriest, 1990). Furthermore, the M system is implicated in
rapid threat detection because it feeds into the collico-pulvinar route to the amygdala
(Schiller, Malpeli, & Schein, 1979). Finally, there is evidence of M dysfunction across
various clinical populations including dyslexia (Lovegrove, 1996; Stein & Walsh,
1997), schizophrenia (Butler et al., 2006) and autism (Laycock, Crewther, & Crewther,
2007). Therefore, it is important for scientists to develop non-invasive techniques to
investigate how M function influences perception and behaviour.
Over 50 years ago, primate single cell studies identified a subpopulation of M
neurons that are suppressed by diffuse red light (Wiesel & Hubel, 1966). These ‘Type
IV’ cells respond transiently to light presented in their receptive field (RF) centres, and
exhibit tonic suppression when long wavelength (red) light is presented in the RF
surround (de Monasterio, 1978; Wiesel & Hubel, 1966). Type IV RF characteristics
have been observed in M (parasol) retinal ganglion cells (RGCs) (de Monasterio, 1978),
the ventral layers of LGN (Wiesel & Hubel, 1966), and within the cytochrome oxidase
blobs in V1 layers 2 and 3 (Livingstone & Hubel, 1984). In the retina, there is a clear
74
distinction between Type IV and Type III M RGCs, which have spatially opponent, but
not spectrally opponent RFs (de Monasterio, 1978). Unlike Type III cells, Type IV cells
tend to have a central retinal distribution, they frequently receive input from short-
wavelength cones, and they do not project to the superior colliculus, as verified by the
absence of antidromic stimulation of Type IV RGCs from electrodes placed in the
superior colliculus (de Monasterio, 1978). At the level of the LGN, the distinction
between Type III and IV cells is less clear, with almost all M cells showing some degree
of chromatic and spatial opponency (Derrington, Krauskopf, & Lennie, 1984).
Based on these physiological studies, many cognitive neuroscientists have
presented tasks on a red background to suppress processing contributions from the M
pathway (Awasthi, Williams, & Friedman, 2016; Bedwell, Brown, & Orem, 2008;
Breitmeyer & Williams, 1990; Chapman, Hoag, & Giaschi, 2004; Edwards, Hogben,
Clark, & Pratt, 1996; West, Anderson, Bedwell, & Pratt, 2010; Williams, Breitmeyer,
Lovegrove, & Gutierrez, 1991). For instance, West et al. (2010) found that with a green
background, fearful faces are perceived more rapidly than neutral faces, whereas with a
red background, this temporal precedence is diminished. The authors suggested that the
red surround could have suppressed M input to the colliculo-pulvinar route to the
amygdala (Schiller et al., 1979). However, this interpretation seems unlikely because
Type IV M cells do not project to the superior colliculus (de Monasterio, 1978).
Despite physiological evidence that most P receptive fields are spatially and
chromatically opponent (Derrington et al., 1984), the psychological studies discussed
above did not adequately consider the effects of a red background on the P pathway.
Skottun (2004) calculated the effects of red and green filters on long, medium and short-
wavelength cone pigments, and on the four broad classes of chromatically opponent
receptive fields (De Valois, Abramov, & Jacobs, 1966). Skotton’s calculations showed
that a red filter would have large effects on red-green and blue-yellow colour opponent
neurons, whereas the green filter had relatively little effect on the modelled responses.
Due to the heterogeneity of K receptive field properties (Hendry & Reid, 2000; White,
Solomon, & Martin, 2001), it is unclear how K cells might contribute to the effects of
red backgrounds on visual processing. Yet, to our knowledge, no behavioural or
neuroimaging experiments have been conducted to measure the effects of a red
surround on the central M and P pathways.
75
In order to investigate the effects of red surrounds on M and P processing, we
used well-validated electrophysiological (Experiment 1) and psychophysical
(Experiment 2) paradigms. Temporal processing in the M and P pathways can be
inferred using non-linear VEP (Baseler & Sutter, 1997; Jackson et al., 2013; Klistorner,
Crewther, & Crewther, 1997) and non-linear MEG (Crewther, Brown, & Hugrass,
2016). In multifocal VEP experiments, multiple patches of light are flashed in
pseudorandom binary sequences, each de-correlated from the others. This not only
allows for simultaneous recordings across the visual field, but also for the analysis of
higher-order temporal non-linearities through Wiener kernel decomposition (Sutter,
1992; Sutter & Tran, 1992). For a temporally linear system, the first order kernel is the
impulse response function of the system (Benardete & Victor, 1994). The first and
second slices of the second order kernel (K2.1 and K2.2) are measures of non-linearity
over one and two video frames respectively. K2.1 responses (and the early components
of K2.2 responses) have high contrast gain and a saturating contrast response function,
consistent with an M pathway generator (Jackson et al., 2013; Klistorner et al., 1997).
The later component (N100-P140) of the K2.2 waveform has low contrast gain and a
non-saturating contrast response function, consistent with a P pathway generator
(Klistorner et al., 1997). A highly efficient system (i.e.; one that recovers rapidly from
stimulation) would produce large K1 responses, with no non-linear responses. Higher
amplitude K2.1 and K2.2 responses are associated with lower temporal efficiency in the
M and P pathways respectively (Bauer et al., 2011; Thompson et al., 2015). Hence, if a
red background decreases M temporal efficiency, we would expect it to increase the
K2.1 amplitude, whereas if it decreases P temporal efficiency, we would expect it to
increase the K2.2 amplitude (Experiment 1).
M and P responses can also be measured psychophysically using pulsed and
steady pedestal paradigms (Pokorny, 2011; Pokorny & Smith, 1997). In both
paradigms, observers are required to detect a brief luminance increment in one of four
pedestal stimuli. When the pedestals are lighter or darker than the background, neural
responses are mediated by ‘on’ or ‘off’ centred cells respectively (Schiller, 1992;
Zemon & Gordon, 2006), such that the spike rate of cells with the preferred polarity
increases along the contrast response function (Pokorny, 2011). When observers adapt
to steady pedestals in between target presentations, thresholds are interpreted as steady-
state M sensitivity, which tends to increase with pedestal luminance, regardless of the
76
surround luminance (Pokorny & Smith, 1997). When the pedestals and target are
pulsed simultaneously, M responses are saturated and detection thresholds are
interpreted in terms of P contrast sensitivity (Pokorny & Smith, 1997). Hence, when
pulsed-pedestal detection thresholds are plotted against pedestal contrast, they form a
‘V’ shape around the point of equiluminance (Pokorny, 2011). If a red surround
suppresses the M pathway, we would expect it to decrease sensitivity to steady
pedestals, whereas if it suppresses the P pathway, we would expect it to decrease
sensitivity to pulsed pedestals (Experiment 2).
4.4 Experiment 1: Method
4.4.1 Participants
Fifteen participants (3 males, M = 21.8 years, SD= 2.5 years) gave written
informed consent for the experiment, which was conducted with the approval of the
Swinburne Human Research Ethics Committee and in accordance with the code of
ethics of the Declaration of Helsinki. The first four authors were included in the sample.
All participants had normal, or corrected to normal, visual acuity as measured with a
Snellen chart, and normal colour vision, as tested with Ishihara colour plates.
4.4.2 Stimuli
The stimuli (illustrated in Figure 4.1) were presented on a 60Hz LCD monitor
(ViewSonic, 80% rise latency = 3ms, 20% fall latency= 2ms, resolution 1024 x 768)
with linearized colour output (measured with a ColorCal II), at a viewing distance of
70cm. The 9-patch multifocal dartboard was created using VPixx software (version 3.2,
http://www.VPixx.com), with a 5.4-degree diameter central patch and two outer rings of
four patches (21.2° and 48°). The luminance for each patch was modulated at the video
frame rate (60Hz) in a pseudorandom binary m-sequence (m = 14), at either low (10%
Michelson) or high (70% Michelson) temporal contrast. The m-sequences for each
patch were maximally offset, so we could record independent responses across the
visual field.
The stimuli are specified in CIE1931 colour space. For the purpose of this
experiment, we only analyzed responses to the central, achromatic patch (42 cd/m 2,
CIE x = 0.32, CIE y = 0.33). Separate recordings were made with red (42cd/m2, CIE x =
0.65, CIE y = 0.34) and green (42cd/m 2, CIE x = 0.33, CIE y = 0.60) surrounds. For
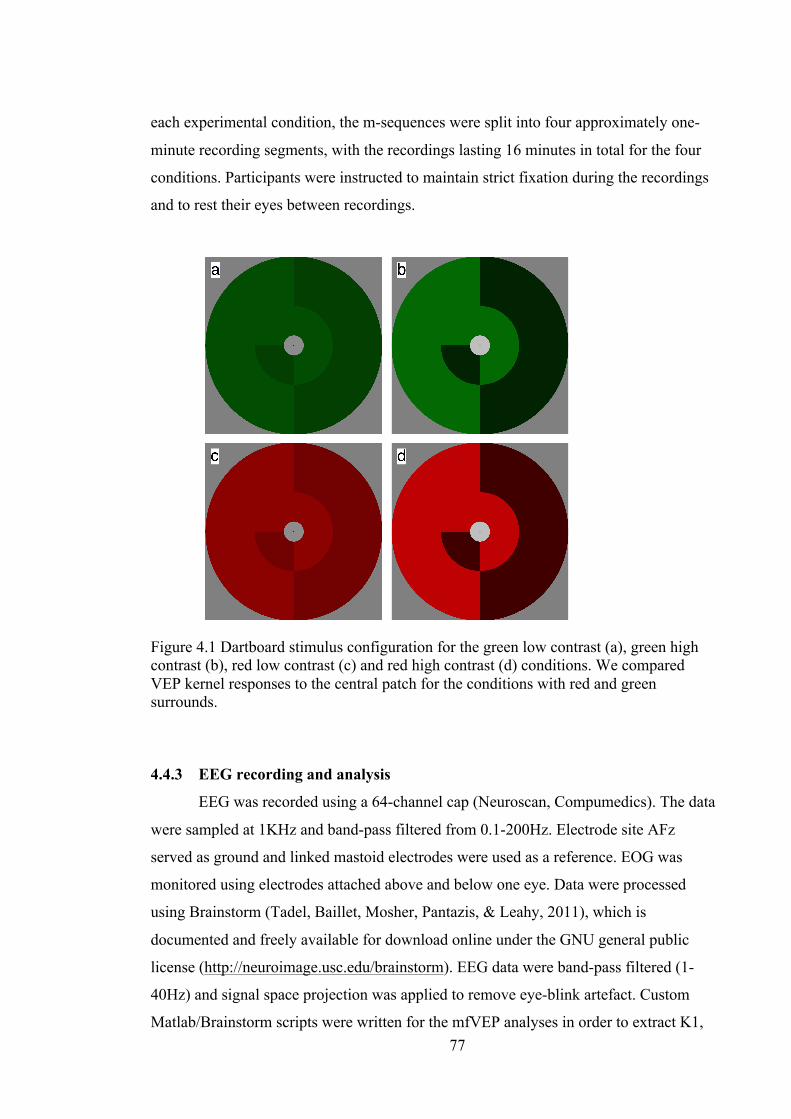
77
each experimental condition, the m-sequences were split into four approximately one-
minute recording segments, with the recordings lasting 16 minutes in total for the four
conditions. Participants were instructed to maintain strict fixation during the recordings
and to rest their eyes between recordings.
Figure 4.1 Dartboard stimulus configuration for the green low contrast (a), green high contrast (b), red low contrast (c) and red high contrast (d) conditions. We compared VEP kernel responses to the central patch for the conditions with red and green surrounds.
4.4.3 EEG recording and analysis
EEG was recorded using a 64-channel cap (Neuroscan, Compumedics). The data
were sampled at 1KHz and band-pass filtered from 0.1-200Hz. Electrode site AFz
served as ground and linked mastoid electrodes were used as a reference. EOG was
monitored using electrodes attached above and below one eye. Data were processed
using Brainstorm (Tadel, Baillet, Mosher, Pantazis, & Leahy, 2011), which is
documented and freely available for download online under the GNU general public
license (http://neuroimage.usc.edu/brainstorm). EEG data were band-pass filtered (1-
40Hz) and signal space projection was applied to remove eye-blink artefact. Custom
Matlab/Brainstorm scripts were written for the mfVEP analyses in order to extract K1,

78
K2.1 and K2.2 kernel responses for the central patch. K1 is the difference between
responses to the light and dark patches (S1 and S2), i.e.K1= 0.5*(S1-S2). K2.1 measures
neural recovery over one frame (16.67ms) by comparing responses when a transition
did or did not occur, i.e., K2.1 = 0.25*(S11+S22-S12-S21). K2.2 measures neural recovery
over two frames (33ms), it is similar to K2.1, but includes an interleaving frame of
either polarity.
For each participant, the electrode with the highest amplitude responses was
selected for group-level averages. The highest amplitude responses were recorded at Oz
for 12 participants, POz for two participants and O2 for one participant. Peak and
trough amplitudes and latencies for the kernel waveforms were identified in Labview,
and exported to SPSS for linear mixed-effects modelling.
4.5 Experiment 1: Results and Discussion Grand averages for the K1, K2.1 and K2.2 responses were calculated for all
experimental conditions (red and green surrounds, high and low contrast). As illustrated
in Figure 4.2, there were some individual differences in the waveforms, yet the
averaged traces for K1 and K2.1 recorded with red and green surrounds overlap almost
perfectly (Fig 4.2a and b), and the K2.2 traces diverge. Separate linear mixed effects
models were computed (using the case ID codes to account for random effects for
participants), to investigate the effects of background colour (red vs. green) and
temporal contrast (10% vs. 70%) on the peak amplitudes of the K1, K2.1 and K2.2
responses.
4.5.1 K1 Amplitude
The results of Klistorner et al. (1997) suggest that the first order response (K1)
is produced by complex interactions between the M and P pathways. Running paired-
samples t-tests (Figures 4.2a, d) showed no significant effect of surround colour on VEP
amplitude, except in the 70% contrast condition at approximately 30ms latency,
however this difference was very small. More detailed analyses of the effects of
surround colour and luminance contrast were performed with linear mixed-effects
models of the main peak-trough amplitudes (K1N60-P90 and K1N120-P150). For both the
early and late peak-trough complexes, there were no significant main effects of
surround colour on K1 peak amplitudes (K1N60-P90: F (1,56) =0.02, p =0.91; K1N120-P150:

79
(F (1,56) = 0.03, p =0.87), nor were there any significant surround by contrast
interactions (K1N60-P90: F (1,56) = 0.04, p =0.84; K1N120-P150: (F (1,56) = 0.05, p =0.83).
As expected, there were significant main effects of contrast on K1 amplitudes, with
greater responses at 70% than 10% temporal contrast (K1N60-P90: F(1,56) = 46.58, p
<0.001; K1N120-P150: F (1,56) = 58.19, p <0.001). In summary, K1 amplitudes are greater
when the central patch is high contrast, but they are not affected greatly by the surround
colour.
Figure 4.2 K1, K2.1 and K2.2 responses to the central patch at 10% (a, b, c) and at 70% (d, e, f) temporal contrast. The bold red and green lines correspond to the averaged waveforms for the conditions with red and green backgrounds respectively. Responses from each participant are illustrated in the faint red and green traces. VEP amplitudes for the red and green surrounds were compared using running paired samples t-tests (df = 14). The absolute t-values are shown in the black traces at the bottom of each panel, with the dashed and dotted horizontal lines signifying the p < .05 and p < .01 two-tailed significance thresholds respectively. Times when the VEP traces differed significantly are flagged with * (p < .05) and ** (p< .01).
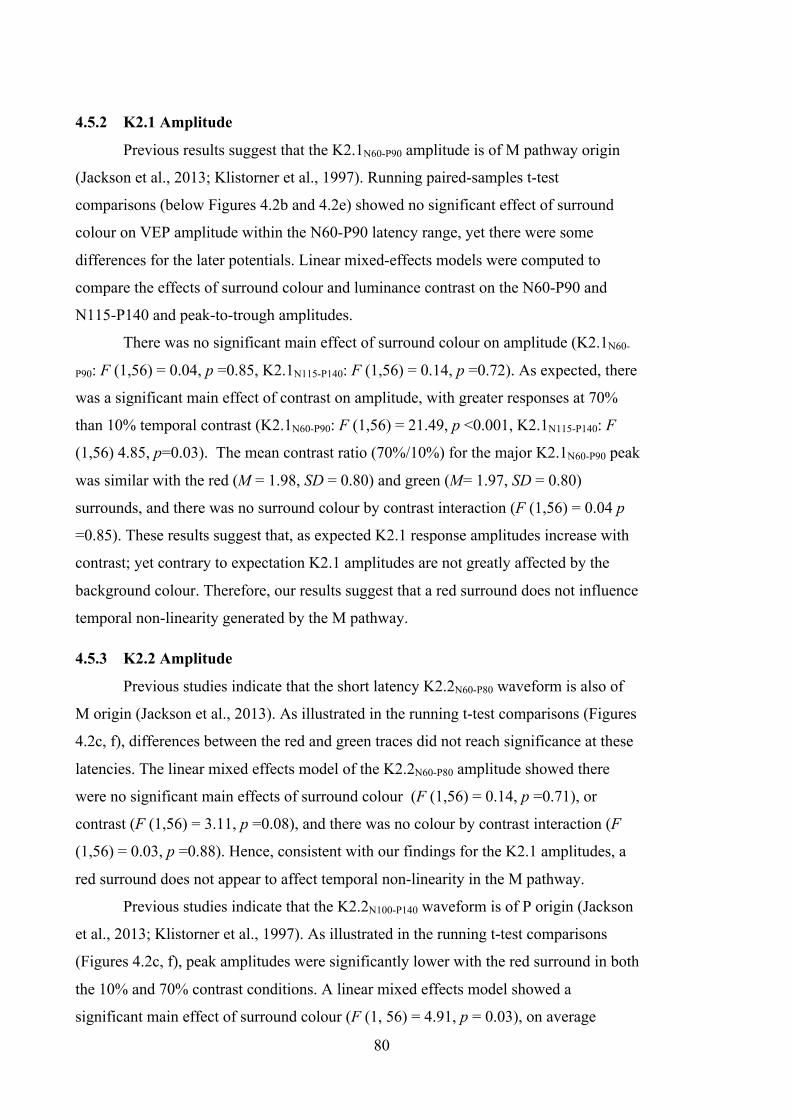
80
4.5.2 K2.1 Amplitude
Previous results suggest that the K2.1N60-P90 amplitude is of M pathway origin
(Jackson et al., 2013; Klistorner et al., 1997). Running paired-samples t-test
comparisons (below Figures 4.2b and 4.2e) showed no significant effect of surround
colour on VEP amplitude within the N60-P90 latency range, yet there were some
differences for the later potentials. Linear mixed-effects models were computed to
compare the effects of surround colour and luminance contrast on the N60-P90 and
N115-P140 and peak-to-trough amplitudes.
There was no significant main effect of surround colour on amplitude (K2.1N60-
P90: F (1,56) = 0.04, p =0.85, K2.1N115-P140: F (1,56) = 0.14, p =0.72). As expected, there
was a significant main effect of contrast on amplitude, with greater responses at 70%
than 10% temporal contrast (K2.1N60-P90: F (1,56) = 21.49, p <0.001, K2.1N115-P140: F
(1,56) 4.85, p=0.03). The mean contrast ratio (70%/10%) for the major K2.1N60-P90 peak
was similar with the red (M = 1.98, SD = 0.80) and green (M= 1.97, SD = 0.80)
surrounds, and there was no surround colour by contrast interaction (F (1,56) = 0.04 p
=0.85). These results suggest that, as expected K2.1 response amplitudes increase with
contrast; yet contrary to expectation K2.1 amplitudes are not greatly affected by the
background colour. Therefore, our results suggest that a red surround does not influence
temporal non-linearity generated by the M pathway.
4.5.3 K2.2 Amplitude
Previous studies indicate that the short latency K2.2N60-P80 waveform is also of
M origin (Jackson et al., 2013). As illustrated in the running t-test comparisons (Figures
4.2c, f), differences between the red and green traces did not reach significance at these
latencies. The linear mixed effects model of the K2.2N60-P80 amplitude showed there
were no significant main effects of surround colour (F (1,56) = 0.14, p =0.71), or
contrast (F (1,56) = 3.11, p =0.08), and there was no colour by contrast interaction (F
(1,56) = 0.03, p =0.88). Hence, consistent with our findings for the K2.1 amplitudes, a
red surround does not appear to affect temporal non-linearity in the M pathway.
Previous studies indicate that the K2.2N100-P140 waveform is of P origin (Jackson
et al., 2013; Klistorner et al., 1997). As illustrated in the running t-test comparisons
(Figures 4.2c, f), peak amplitudes were significantly lower with the red surround in both
the 10% and 70% contrast conditions. A linear mixed effects model showed a
significant main effect of surround colour (F (1, 56) = 4.91, p = 0.03), on average
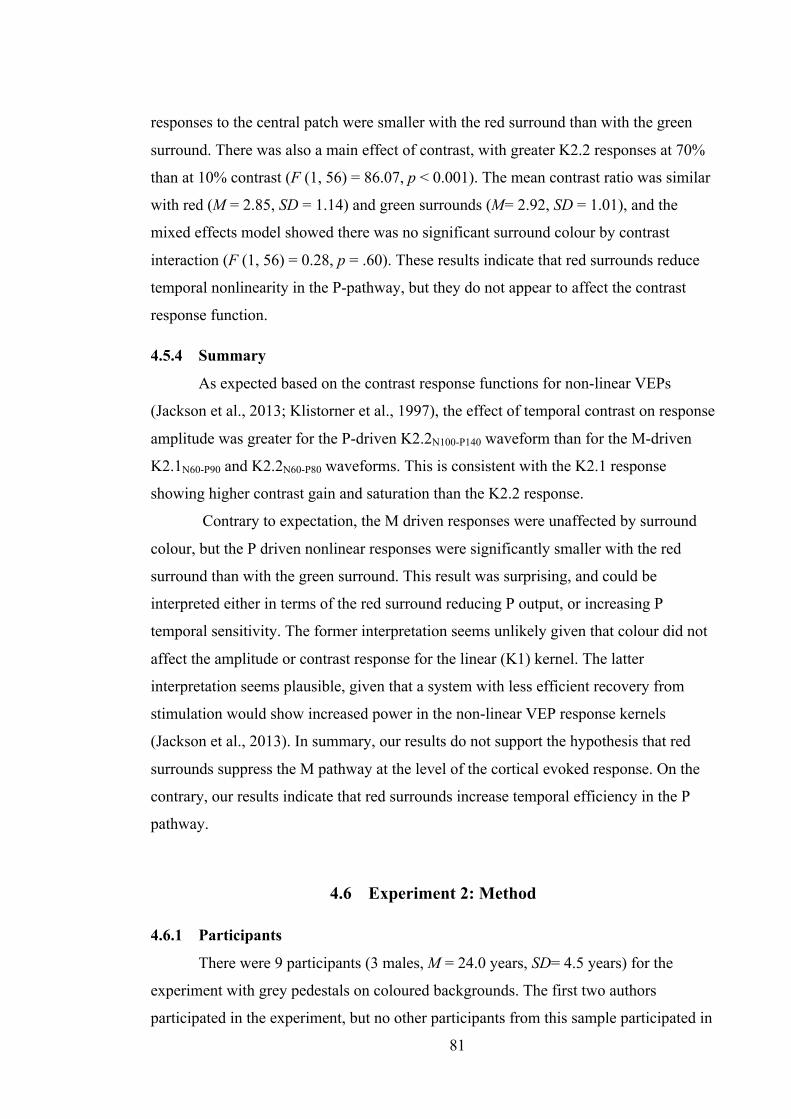
81
responses to the central patch were smaller with the red surround than with the green
surround. There was also a main effect of contrast, with greater K2.2 responses at 70%
than at 10% contrast (F (1, 56) = 86.07, p < 0.001). The mean contrast ratio was similar
with red (M = 2.85, SD = 1.14) and green surrounds (M= 2.92, SD = 1.01), and the
mixed effects model showed there was no significant surround colour by contrast
interaction (F (1, 56) = 0.28, p = .60). These results indicate that red surrounds reduce
temporal nonlinearity in the P-pathway, but they do not appear to affect the contrast
response function.
4.5.4 Summary
As expected based on the contrast response functions for non-linear VEPs
(Jackson et al., 2013; Klistorner et al., 1997), the effect of temporal contrast on response
amplitude was greater for the P-driven K2.2N100-P140 waveform than for the M-driven
K2.1N60-P90 and K2.2N60-P80 waveforms. This is consistent with the K2.1 response
showing higher contrast gain and saturation than the K2.2 response.
Contrary to expectation, the M driven responses were unaffected by surround
colour, but the P driven nonlinear responses were significantly smaller with the red
surround than with the green surround. This result was surprising, and could be
interpreted either in terms of the red surround reducing P output, or increasing P
temporal sensitivity. The former interpretation seems unlikely given that colour did not
affect the amplitude or contrast response for the linear (K1) kernel. The latter
interpretation seems plausible, given that a system with less efficient recovery from
stimulation would show increased power in the non-linear VEP response kernels
(Jackson et al., 2013). In summary, our results do not support the hypothesis that red
surrounds suppress the M pathway at the level of the cortical evoked response. On the
contrary, our results indicate that red surrounds increase temporal efficiency in the P
pathway.
4.6 Experiment 2: Method
4.6.1 Participants
There were 9 participants (3 males, M = 24.0 years, SD= 4.5 years) for the
experiment with grey pedestals on coloured backgrounds. The first two authors
participated in the experiment, but no other participants from this sample participated in
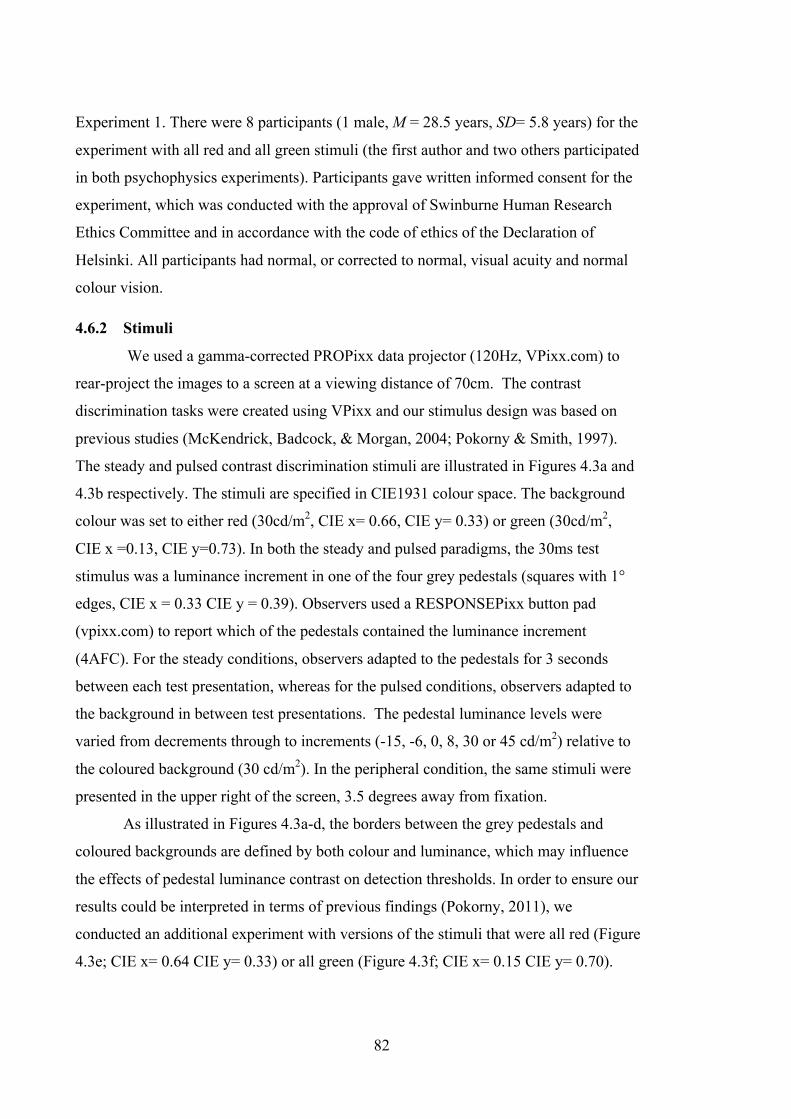
82
Experiment 1. There were 8 participants (1 male, M = 28.5 years, SD= 5.8 years) for the
experiment with all red and all green stimuli (the first author and two others participated
in both psychophysics experiments). Participants gave written informed consent for the
experiment, which was conducted with the approval of Swinburne Human Research
Ethics Committee and in accordance with the code of ethics of the Declaration of
Helsinki. All participants had normal, or corrected to normal, visual acuity and normal
colour vision.
4.6.2 Stimuli
We used a gamma-corrected PROPixx data projector (120Hz, VPixx.com) to
rear-project the images to a screen at a viewing distance of 70cm. The contrast
discrimination tasks were created using VPixx and our stimulus design was based on
previous studies (McKendrick, Badcock, & Morgan, 2004; Pokorny & Smith, 1997).
The steady and pulsed contrast discrimination stimuli are illustrated in Figures 4.3a and
4.3b respectively. The stimuli are specified in CIE1931 colour space. The background
colour was set to either red (30cd/m2, CIE x= 0.66, CIE y= 0.33) or green (30cd/m2,
CIE x =0.13, CIE y=0.73). In both the steady and pulsed paradigms, the 30ms test
stimulus was a luminance increment in one of the four grey pedestals (squares with 1°
edges, CIE x = 0.33 CIE y = 0.39). Observers used a RESPONSEPixx button pad
(vpixx.com) to report which of the pedestals contained the luminance increment
(4AFC). For the steady conditions, observers adapted to the pedestals for 3 seconds
between each test presentation, whereas for the pulsed conditions, observers adapted to
the background in between test presentations. The pedestal luminance levels were
varied from decrements through to increments (-15, -6, 0, 8, 30 or 45 cd/m2) relative to
the coloured background (30 cd/m2). In the peripheral condition, the same stimuli were
presented in the upper right of the screen, 3.5 degrees away from fixation.
As illustrated in Figures 4.3a-d, the borders between the grey pedestals and
coloured backgrounds are defined by both colour and luminance, which may influence
the effects of pedestal luminance contrast on detection thresholds. In order to ensure our
results could be interpreted in terms of previous findings (Pokorny, 2011), we
conducted an additional experiment with versions of the stimuli that were all red (Figure
4.3e; CIE x= 0.64 CIE y= 0.33) or all green (Figure 4.3f; CIE x= 0.15 CIE y= 0.70).
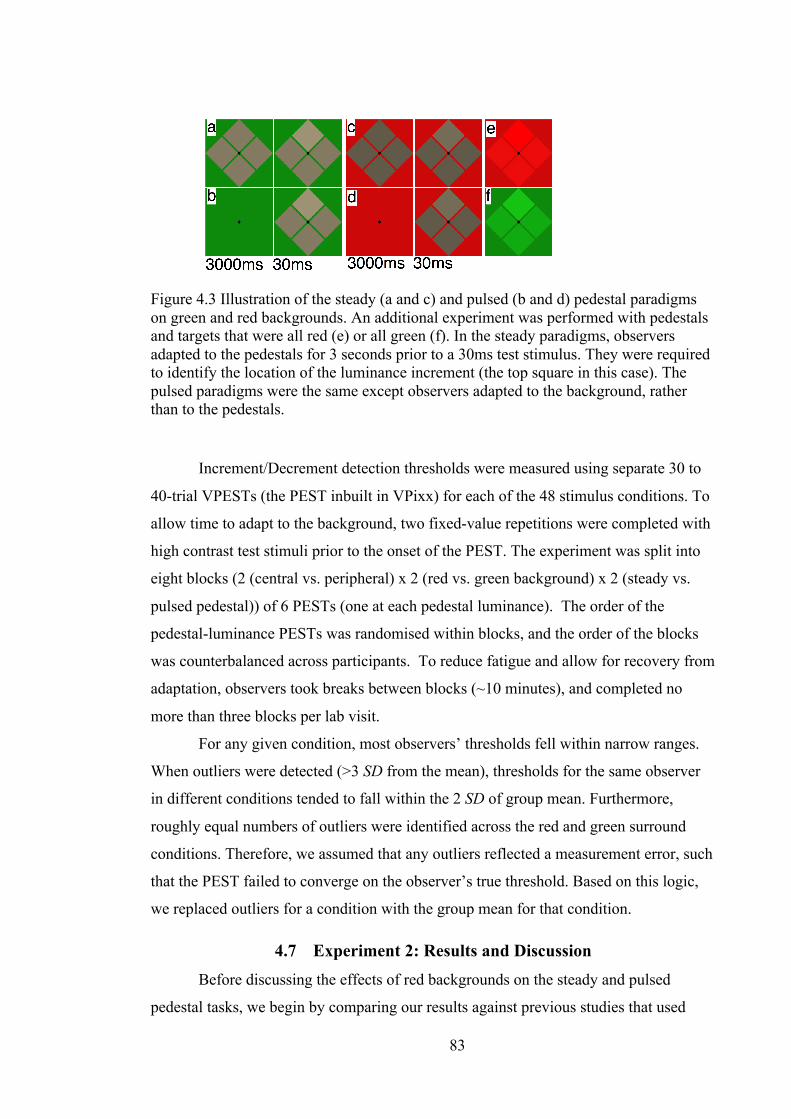
83
Figure 4.3 Illustration of the steady (a and c) and pulsed (b and d) pedestal paradigms on green and red backgrounds. An additional experiment was performed with pedestals and targets that were all red (e) or all green (f). In the steady paradigms, observers adapted to the pedestals for 3 seconds prior to a 30ms test stimulus. They were required to identify the location of the luminance increment (the top square in this case). The pulsed paradigms were the same except observers adapted to the background, rather than to the pedestals.
Increment/Decrement detection thresholds were measured using separate 30 to
40-trial VPESTs (the PEST inbuilt in VPixx) for each of the 48 stimulus conditions. To
allow time to adapt to the background, two fixed-value repetitions were completed with
high contrast test stimuli prior to the onset of the PEST. The experiment was split into
eight blocks (2 (central vs. peripheral) x 2 (red vs. green background) x 2 (steady vs.
pulsed pedestal)) of 6 PESTs (one at each pedestal luminance). The order of the
pedestal-luminance PESTs was randomised within blocks, and the order of the blocks
was counterbalanced across participants. To reduce fatigue and allow for recovery from
adaptation, observers took breaks between blocks (~10 minutes), and completed no
more than three blocks per lab visit.
For any given condition, most observers’ thresholds fell within narrow ranges.
When outliers were detected (>3 SD from the mean), thresholds for the same observer
in different conditions tended to fall within the 2 SD of group mean. Furthermore,
roughly equal numbers of outliers were identified across the red and green surround
conditions. Therefore, we assumed that any outliers reflected a measurement error, such
that the PEST failed to converge on the observer’s true threshold. Based on this logic,
we replaced outliers for a condition with the group mean for that condition.
4.7 Experiment 2: Results and Discussion Before discussing the effects of red backgrounds on the steady and pulsed
pedestal tasks, we begin by comparing our results against previous studies that used
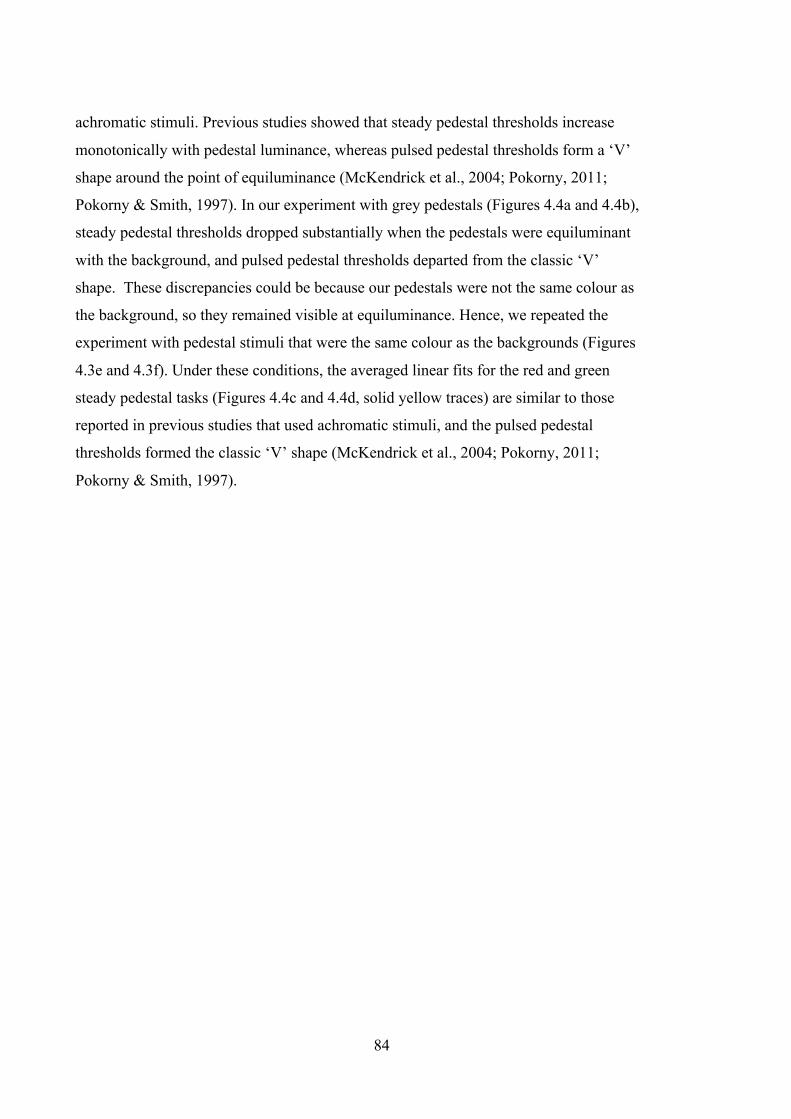
84
achromatic stimuli. Previous studies showed that steady pedestal thresholds increase
monotonically with pedestal luminance, whereas pulsed pedestal thresholds form a ‘V’
shape around the point of equiluminance (McKendrick et al., 2004; Pokorny, 2011;
Pokorny & Smith, 1997). In our experiment with grey pedestals (Figures 4.4a and 4.4b),
steady pedestal thresholds dropped substantially when the pedestals were equiluminant
with the background, and pulsed pedestal thresholds departed from the classic ‘V’
shape. These discrepancies could be because our pedestals were not the same colour as
the background, so they remained visible at equiluminance. Hence, we repeated the
experiment with pedestal stimuli that were the same colour as the backgrounds (Figures
4.3e and 4.3f). Under these conditions, the averaged linear fits for the red and green
steady pedestal tasks (Figures 4.4c and 4.4d, solid yellow traces) are similar to those
reported in previous studies that used achromatic stimuli, and the pulsed pedestal
thresholds formed the classic ‘V’ shape (McKendrick et al., 2004; Pokorny, 2011;
Pokorny & Smith, 1997).
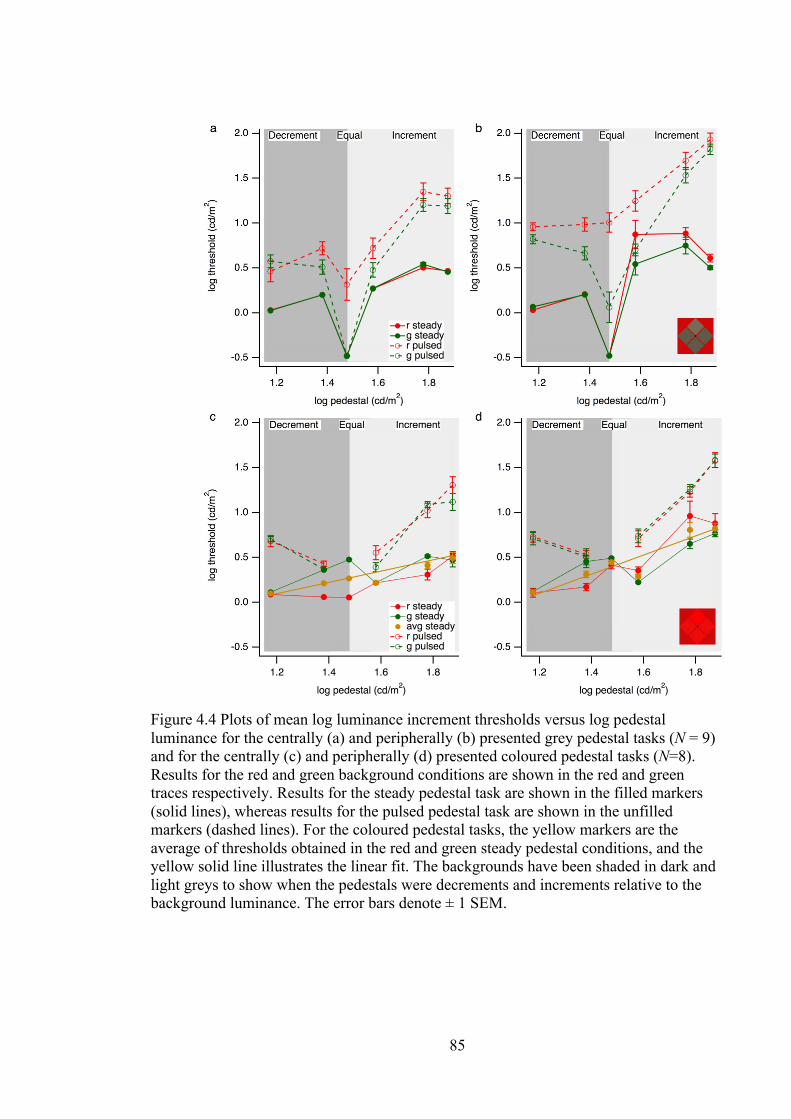
85
Figure 4.4 Plots of mean log luminance increment thresholds versus log pedestal luminance for the centrally (a) and peripherally (b) presented grey pedestal tasks (N = 9) and for the centrally (c) and peripherally (d) presented coloured pedestal tasks (N=8). Results for the red and green background conditions are shown in the red and green traces respectively. Results for the steady pedestal task are shown in the filled markers (solid lines), whereas results for the pulsed pedestal task are shown in the unfilled markers (dashed lines). For the coloured pedestal tasks, the yellow markers are the average of thresholds obtained in the red and green steady pedestal conditions, and the yellow solid line illustrates the linear fit. The backgrounds have been shaded in dark and light greys to show when the pedestals were decrements and increments relative to the background luminance. The error bars denote ± 1 SEM.
86
4.7.1 Grey steady pedestal tasks
For the grey versions of the steady pedestal tasks, thresholds measured with the
red and green backgrounds were almost perfectly overlapping (solid red and green
traces, Figures 4.4a and 4.4b), except for the peripherally presented, increment pedestals
(Figure 4.4b), where thresholds were higher with the red background. There were no
significant effects of background colour on mean thresholds for pedestals that were
equiluminant with (central: t(8) = 0.78, p = 0.50, peripheral; t(8) = 0.04, p = 0.97), or
dimmer than the background (central: F(1,8) = 0.52, p = 0.49, peripheral: F(1,8) = 0.30,
p = 0.87). For increment pedestals, there was no effect of surround colour on thresholds
when the stimuli were presented centrally (F(1,8) = 1.39, p = 0.27). When the stimuli
were presented peripherally, steady increment thresholds were significantly higher with
the red background (F(1,8) = 11.19, p = 0.03, ηp2 = 0.47), but there was no significant
interaction between the effects of background colour and pedestal luminance (F(2,16) =
1.77, p = 0.20). Overall, these results are only partially consistent with the prediction
that red surrounds reduce psychophysical measures of M sensitivity.
4.7.2 Grey pulsed pedestal tasks
Results for the task with grey, pulsed pedestals are illustrated in Figures 4.4a
and 4.4b (dashed lines). At equiluminance, pulsed pedestal thresholds were much lower
with the green background than with the red background (central; t(8)=4.51, p =0.002,
peripheral: (t(8)=4.92, p =0.001). This suggests that M responses are swamped by the
appearance of grey targets on red backgrounds, but can still contribute to contrast
sensitivity when grey targets appear on green backgrounds. For the centrally presented
task, there was a significant interaction between the effects of decrement pedestal
luminance and surround colour (F(1,8) = 7.16 p = .028, ηp2 = .47). Increment pulsed-
pedestal thresholds were significantly higher with the red background (F(1,8) = 8.74, p
= 0.018, ηp2 = 0.52). For the peripherally presented task, thresholds were significantly
higher with the red surround for the decrement (F(1,8) = 14.96, p = 0.005, ηp2 = 0.65),
and increment-pulsed pedestals (F(1,8) = 14.96, p = 0.005, ηp2 = 0.65). There was also a
significant interaction for the peripheral increment pedestals, (F(2,16) = 10.68, p =
0.001, ηp2 = 0.57), with shallower slopes for the red surround. These results indicate that
red surrounds can reduce P sensitivity to grey target stimuli.
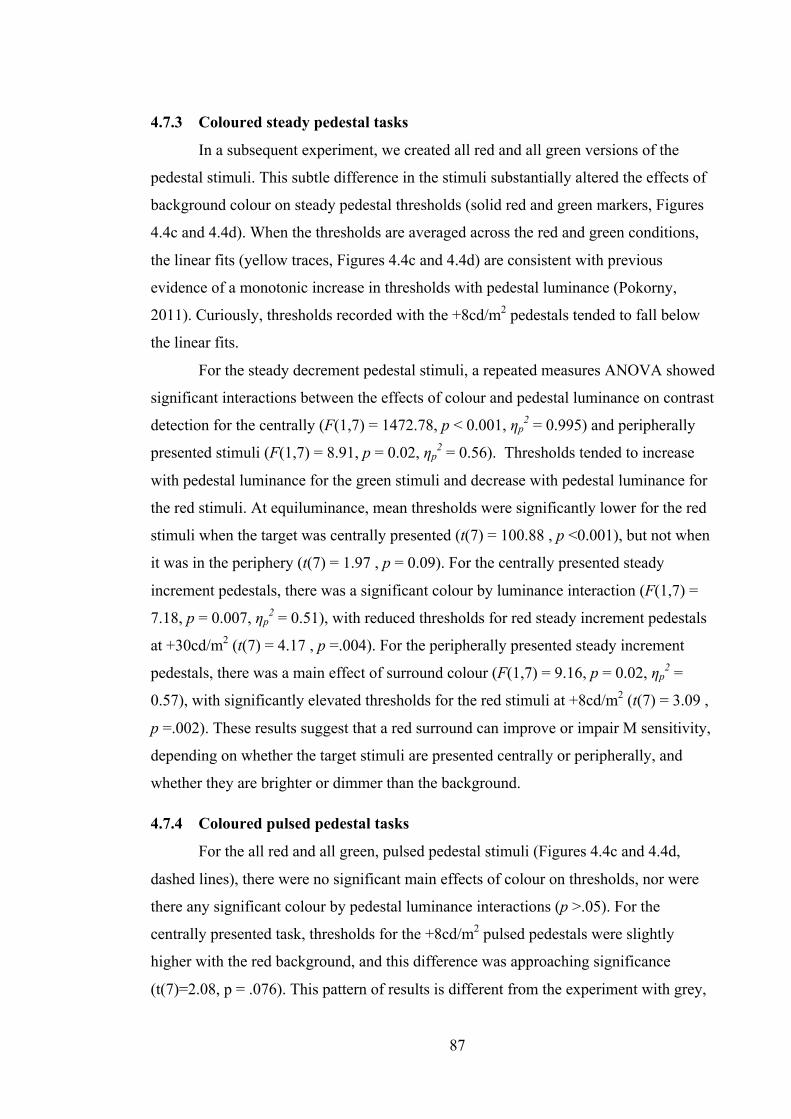
87
4.7.3 Coloured steady pedestal tasks
In a subsequent experiment, we created all red and all green versions of the
pedestal stimuli. This subtle difference in the stimuli substantially altered the effects of
background colour on steady pedestal thresholds (solid red and green markers, Figures
4.4c and 4.4d). When the thresholds are averaged across the red and green conditions,
the linear fits (yellow traces, Figures 4.4c and 4.4d) are consistent with previous
evidence of a monotonic increase in thresholds with pedestal luminance (Pokorny,
2011). Curiously, thresholds recorded with the +8cd/m2 pedestals tended to fall below
the linear fits.
For the steady decrement pedestal stimuli, a repeated measures ANOVA showed
significant interactions between the effects of colour and pedestal luminance on contrast
detection for the centrally (F(1,7) = 1472.78, p < 0.001, ηp2 = 0.995) and peripherally
presented stimuli (F(1,7) = 8.91, p = 0.02, ηp2 = 0.56). Thresholds tended to increase
with pedestal luminance for the green stimuli and decrease with pedestal luminance for
the red stimuli. At equiluminance, mean thresholds were significantly lower for the red
stimuli when the target was centrally presented (t(7) = 100.88 , p <0.001), but not when
it was in the periphery (t(7) = 1.97 , p = 0.09). For the centrally presented steady
increment pedestals, there was a significant colour by luminance interaction (F(1,7) =
7.18, p = 0.007, ηp2 = 0.51), with reduced thresholds for red steady increment pedestals
at +30cd/m2 (t(7) = 4.17 , p =.004). For the peripherally presented steady increment
pedestals, there was a main effect of surround colour (F(1,7) = 9.16, p = 0.02, ηp2 =
0.57), with significantly elevated thresholds for the red stimuli at +8cd/m2 (t(7) = 3.09 ,
p =.002). These results suggest that a red surround can improve or impair M sensitivity,
depending on whether the target stimuli are presented centrally or peripherally, and
whether they are brighter or dimmer than the background.
4.7.4 Coloured pulsed pedestal tasks
For the all red and all green, pulsed pedestal stimuli (Figures 4.4c and 4.4d,
dashed lines), there were no significant main effects of colour on thresholds, nor were
there any significant colour by pedestal luminance interactions (p >.05). For the
centrally presented task, thresholds for the +8cd/m2 pulsed pedestals were slightly
higher with the red background, and this difference was approaching significance
(t(7)=2.08, p = .076). This pattern of results is different from the experiment with grey,
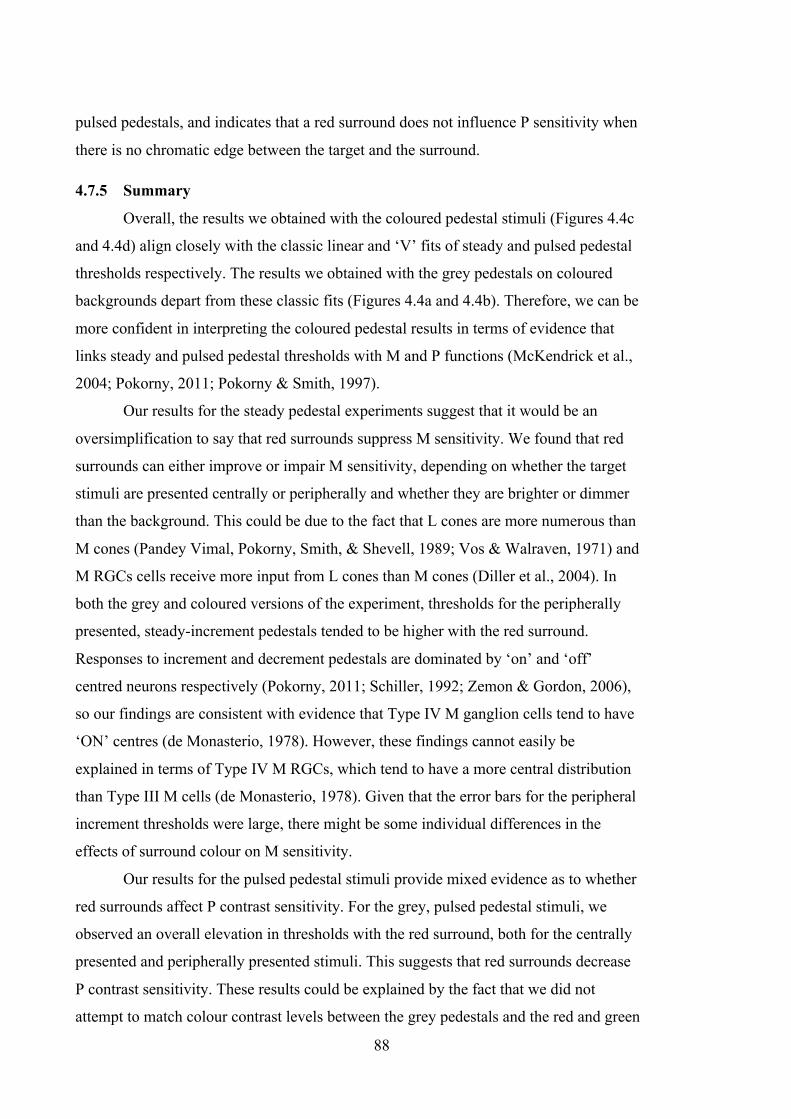
88
pulsed pedestals, and indicates that a red surround does not influence P sensitivity when
there is no chromatic edge between the target and the surround.
4.7.5 Summary
Overall, the results we obtained with the coloured pedestal stimuli (Figures 4.4c
and 4.4d) align closely with the classic linear and ‘V’ fits of steady and pulsed pedestal
thresholds respectively. The results we obtained with the grey pedestals on coloured
backgrounds depart from these classic fits (Figures 4.4a and 4.4b). Therefore, we can be
more confident in interpreting the coloured pedestal results in terms of evidence that
links steady and pulsed pedestal thresholds with M and P functions (McKendrick et al.,
2004; Pokorny, 2011; Pokorny & Smith, 1997).
Our results for the steady pedestal experiments suggest that it would be an
oversimplification to say that red surrounds suppress M sensitivity. We found that red
surrounds can either improve or impair M sensitivity, depending on whether the target
stimuli are presented centrally or peripherally and whether they are brighter or dimmer
than the background. This could be due to the fact that L cones are more numerous than
M cones (Pandey Vimal, Pokorny, Smith, & Shevell, 1989; Vos & Walraven, 1971) and
M RGCs cells receive more input from L cones than M cones (Diller et al., 2004). In
both the grey and coloured versions of the experiment, thresholds for the peripherally
presented, steady-increment pedestals tended to be higher with the red surround.
Responses to increment and decrement pedestals are dominated by ‘on’ and ‘off’
centred neurons respectively (Pokorny, 2011; Schiller, 1992; Zemon & Gordon, 2006),
so our findings are consistent with evidence that Type IV M ganglion cells tend to have
‘ON’ centres (de Monasterio, 1978). However, these findings cannot easily be
explained in terms of Type IV M RGCs, which tend to have a more central distribution
than Type III M cells (de Monasterio, 1978). Given that the error bars for the peripheral
increment thresholds were large, there might be some individual differences in the
effects of surround colour on M sensitivity.
Our results for the pulsed pedestal stimuli provide mixed evidence as to whether
red surrounds affect P contrast sensitivity. For the grey, pulsed pedestal stimuli, we
observed an overall elevation in thresholds with the red surround, both for the centrally
presented and peripherally presented stimuli. This suggests that red surrounds decrease
P contrast sensitivity. These results could be explained by the fact that we did not
attempt to match colour contrast levels between the grey pedestals and the red and green
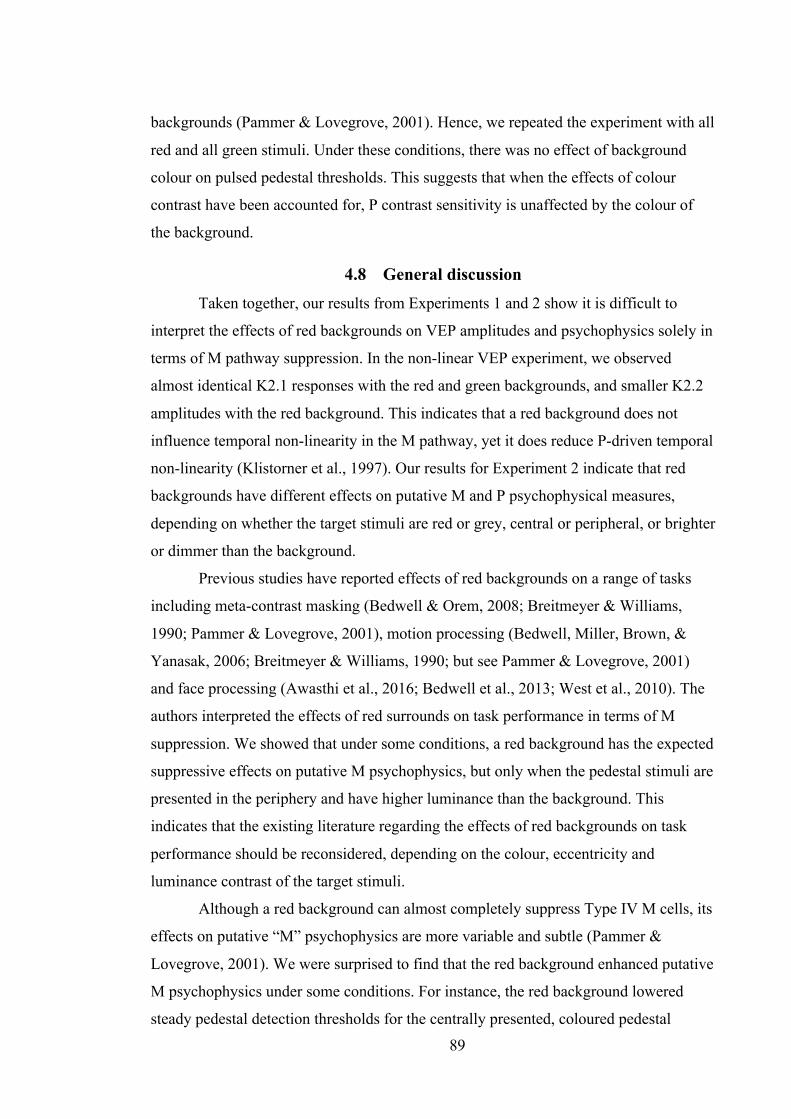
89
backgrounds (Pammer & Lovegrove, 2001). Hence, we repeated the experiment with all
red and all green stimuli. Under these conditions, there was no effect of background
colour on pulsed pedestal thresholds. This suggests that when the effects of colour
contrast have been accounted for, P contrast sensitivity is unaffected by the colour of
the background.
4.8 General discussion Taken together, our results from Experiments 1 and 2 show it is difficult to
interpret the effects of red backgrounds on VEP amplitudes and psychophysics solely in
terms of M pathway suppression. In the non-linear VEP experiment, we observed
almost identical K2.1 responses with the red and green backgrounds, and smaller K2.2
amplitudes with the red background. This indicates that a red background does not
influence temporal non-linearity in the M pathway, yet it does reduce P-driven temporal
non-linearity (Klistorner et al., 1997). Our results for Experiment 2 indicate that red
backgrounds have different effects on putative M and P psychophysical measures,
depending on whether the target stimuli are red or grey, central or peripheral, or brighter
or dimmer than the background.
Previous studies have reported effects of red backgrounds on a range of tasks
including meta-contrast masking (Bedwell & Orem, 2008; Breitmeyer & Williams,
1990; Pammer & Lovegrove, 2001), motion processing (Bedwell, Miller, Brown, &
Yanasak, 2006; Breitmeyer & Williams, 1990; but see Pammer & Lovegrove, 2001)
and face processing (Awasthi et al., 2016; Bedwell et al., 2013; West et al., 2010). The
authors interpreted the effects of red surrounds on task performance in terms of M
suppression. We showed that under some conditions, a red background has the expected
suppressive effects on putative M psychophysics, but only when the pedestal stimuli are
presented in the periphery and have higher luminance than the background. This
indicates that the existing literature regarding the effects of red backgrounds on task
performance should be reconsidered, depending on the colour, eccentricity and
luminance contrast of the target stimuli.
Although a red background can almost completely suppress Type IV M cells, its
effects on putative “M” psychophysics are more variable and subtle (Pammer &
Lovegrove, 2001). We were surprised to find that the red background enhanced putative
M psychophysics under some conditions. For instance, the red background lowered
steady pedestal detection thresholds for the centrally presented, coloured pedestal

90
stimuli, and for the peripherally presented coloured decrement pedestals. Although there
are many processing stages in between LGN afferent responses and perception, these
results imply that contrast sensitivity is enhanced when Type IV M cells are suppressed.
It is worthwhile considering the different roles that Type III (i.e. broadband) and Type
IV M cells might play in visual processing, particularly given their different retinal
distributions, and the absence of Type IV M projections to the superior colliculus (de
Monasterio, 1978).
We also found that red backgrounds can influence P signatures in non-linear
VEPs and psychophysics. In the non-linear VEP experiment, K2.2 responses were
lower with the red surround than with the green surround. The more rapidly neurons
recover from stimulation, the smaller their contributions to non-linear VEP responses
(Bauer et al., 2011; Sutter, 2000; Thompson et al., 2015). Based on this reasoning, our
results suggest that red surrounds increase temporal sensitivity in the P pathway, with
an immediate prediction of enhanced L-M colour fusion frequencies. In Experiment 2,
the red surround decreased contrast sensitivity for grey, pulsed pedestal stimuli. This
may suggest a reduction in P sensitivity; however Pammer and Lovegrove (2001)
argued that confounds between the effects of colour and luminance contrast make it
difficult to interpret the effects of red backgrounds in terms of the M and P afferent
streams. Consistent with this argument, there were no significant differences in pulsed
pedestal thresholds for the coloured pedestal versions of the experiment. This suggests
that when colour contrast has been taken into account, P sensitivity to achromatic
contrast is unaffected by the surround colour.
Although it is well known that red surrounds suppress Type IV M cells in the
retina and LGN (de Monasterio, 1978; De Valois et al., 1966; Derrington et al., 1984;
Wiesel & Hubel, 1966), we cannot rule out the possibility that the effects of chromatic
surrounds on perception also reflect cortical interactions. Livingstone and Hubel (1984)
identified cells with Type-IV receptive fields within the cytochrome oxidase blobs in
V1 layers 2 and 3. Within cytochrome oxidase blobs, cells tend to prefer low spatial
frequency red and blue stimulation, whereas between blobs, cells tend to prefer oriented
edges and green-yellow colours (Dow & Vautin, 1987). Crewther and Crewther’s
(2010) chromatic non-linear VEP study showed that K2.1 responses to diffuse surface
colours almost disappear for yellow-grey or green-grey stimuli, whereas K1 responses
to oriented edges are robust for all colours. Hence, although previous studies have
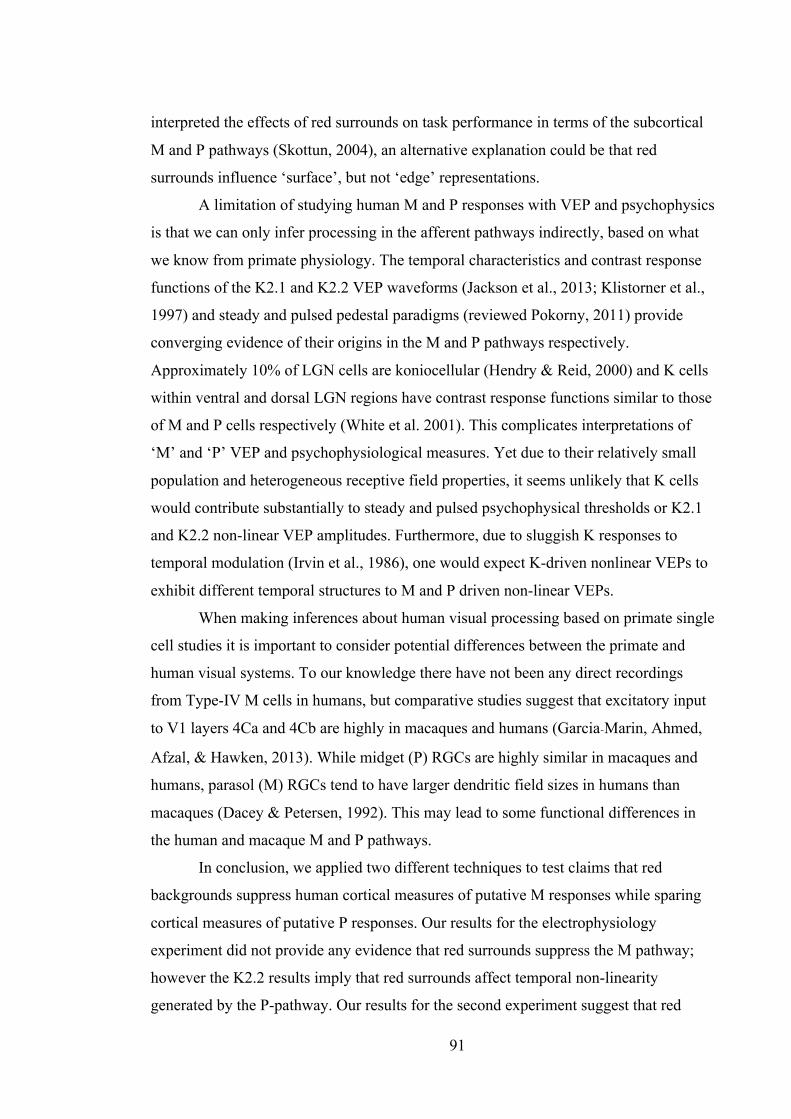
91
interpreted the effects of red surrounds on task performance in terms of the subcortical
M and P pathways (Skottun, 2004), an alternative explanation could be that red
surrounds influence ‘surface’, but not ‘edge’ representations.
A limitation of studying human M and P responses with VEP and psychophysics
is that we can only infer processing in the afferent pathways indirectly, based on what
we know from primate physiology. The temporal characteristics and contrast response
functions of the K2.1 and K2.2 VEP waveforms (Jackson et al., 2013; Klistorner et al.,
1997) and steady and pulsed pedestal paradigms (reviewed Pokorny, 2011) provide
converging evidence of their origins in the M and P pathways respectively.
Approximately 10% of LGN cells are koniocellular (Hendry & Reid, 2000) and K cells
within ventral and dorsal LGN regions have contrast response functions similar to those
of M and P cells respectively (White et al. 2001). This complicates interpretations of
‘M’ and ‘P’ VEP and psychophysiological measures. Yet due to their relatively small
population and heterogeneous receptive field properties, it seems unlikely that K cells
would contribute substantially to steady and pulsed psychophysical thresholds or K2.1
and K2.2 non-linear VEP amplitudes. Furthermore, due to sluggish K responses to
temporal modulation (Irvin et al., 1986), one would expect K-driven nonlinear VEPs to
exhibit different temporal structures to M and P driven non-linear VEPs.
When making inferences about human visual processing based on primate single
cell studies it is important to consider potential differences between the primate and
human visual systems. To our knowledge there have not been any direct recordings
from Type-IV M cells in humans, but comparative studies suggest that excitatory input
to V1 layers 4Ca and 4Cb are highly in macaques and humans (Garcia‐Marin, Ahmed,
Afzal, & Hawken, 2013). While midget (P) RGCs are highly similar in macaques and
humans, parasol (M) RGCs tend to have larger dendritic field sizes in humans than
macaques (Dacey & Petersen, 1992). This may lead to some functional differences in
the human and macaque M and P pathways.
In conclusion, we applied two different techniques to test claims that red
backgrounds suppress human cortical measures of putative M responses while sparing
cortical measures of putative P responses. Our results for the electrophysiology
experiment did not provide any evidence that red surrounds suppress the M pathway;
however the K2.2 results imply that red surrounds affect temporal non-linearity
generated by the P-pathway. Our results for the second experiment suggest that red
92
surrounds can influence either M or P psychophysical signatures, depending on the
colour, eccentricity and luminance of the target stimuli. We argue that it was an
oversimplification for previous studies to have interpreted the effects of red
backgrounds on behavioural performance solely in terms of M suppression. Our results
highlight difficulties in predicting human perceptual effects based on subcortical M and
P physiology.
4.9 Acknowledgements We would like to thank our reviewers for suggesting the additional psychophysics
experiment with all red and all green, pedestal stimuli. This research was funded by the
Australian Government, through the Australian Research Council.
4.10 References Awasthi, B., Williams, M. A., & Friedman, J. (2016). Examining the role of red
background in magnocellular contribution to face perception. PeerJ, 4, e1617.
doi:10.7717/peerj.1617
Baseler, H., & Sutter, E. (1997). M and P components of the VEP and their visual field
distribution. Vision Research, 37(6), 675-690.
Bauer, I., Crewther, D. P., Pipingas, A., Rowsell, R., Cockerell, R., & Crewther, S. G.
(2011). Omega-3 Fatty Acids Modify Human Cortical Visual Processing—A
Double-Blind, Crossover Study. PLoS One, 6(12), e28214.
doi:10.1371/journal.pone.0028214
Bedwell, J. S., Brown, J. M., & Orem, D. M. (2008). The effect of a red background on
location backward masking by structure. Attention, Perception, &
Psychophysics, 70(3), 503-507.
Bedwell, J. S., Chan, C. C., Cohen, O., Karbi, Y., Shamir, E., & Rassovsky, Y. (2013).
The magnocellular visual pathway and facial emotion misattribution errors in
schizophrenia. Progress in Neuro-Psychopharmacology and Biological
Psychiatry, 44, 88-93. doi:https://doi.org/10.1016/j.pnpbp.2013.01.015
Bedwell, J. S., Miller, L. S., Brown, J. M., & Yanasak, N. E. (2006). Schizophrenia and
red light: fMRI evidence for a novel biobehavioral marker. International
Journal of Neuroscience, 116(8), 881-894.
93
Bedwell, J. S., & Orem, D. M. (2008). The effect of red light on backward masking in
individuals with psychometrically defined schizotypy. Cognitive
Neuropsychiatry, 13(6), 491-504.
Benardete, E. A., & Victor, J. D. (1994). An extension of the m-sequence technique for
the analysis of multi-input nonlinear systems. Advanced methods of
physiological system modeling (pp. 87-110): Springer.
Breitmeyer, B. G., & Williams, M. C. (1990). Effects of isoluminant-background color
on metacontrast and stroboscopic motion: Interactions between sustained (P) and
transient (M) channels. Vision Research, 30(7), 1069-1075.
Bullier, J. (2001). Integrated model of visual processing. Brain Research Reviews,
36(2), 96-107.
Butler, P. D., Martinez, A., Foxe, J. J., Kim, D., Zemon, V., Silipo, G., . . . Javitt, D. C.
(2006). Subcortical visual dysfunction in schizophrenia drives secondary cortical
impairments. Brain, 130(2), 417-430.
Casagrande, V. A. (1994). A third parallel visual pathway to primate area V1. Trends in
Neurosciences, 17(7), 305-310. doi:http://dx.doi.org/10.1016/0166-
2236(94)90065-5
Chapman, C., Hoag, R., & Giaschi, D. (2004). The effect of disrupting the human
magnocellular pathway on global motion perception. Vision Research, 44(22),
2551-2557.
Crewther, D. P., Brown, A., & Hugrass, L. (2016). Temporal structure of human
magnetic evoked fields. Experimental Brain Research, 234(7), 1987-1995.
doi:10.1007/s00221-016-4601-0
Crewther, D. P., & Crewther, S. G. (2010). Different temporal structure for form versus
surface cortical color systems–evidence from chromatic non-linear VEP. PLoS
One, 5(12), e15266.
Dacey, D. M., & Petersen, M. R. (1992). Dendritic field size and morphology of midget
and parasol ganglion cells of the human retina. Proceedings of the National
Academy of sciences, 89(20), 9666-9670.
de Monasterio, F. M. (1978). Properties of concentrically organized X and Y ganglion
cells of macaque retina. Journal of Neurophysiology, 41(6), 1394-1417.
De Valois, R. L., Abramov, I., & Jacobs, G. H. (1966). Analysis of response patterns of
LGN cells. Journal of the Optical Society of America, 56(7), 966-977.
94
Derrington, A. M., Krauskopf, J., & Lennie, P. (1984). Chromatic mechanisms in lateral
geniculate nucleus of macaque. The Journal of Physiology, 357, 241-265.
Derrington, A. M., & Lennie, P. (1984). Spatial and temporal contrast sensitivities of
neurones in lateral geniculate nucleus of macaque. The Journal of Physiology,
357(1), 219-240. doi:10.1113/jphysiol.1984.sp015498
Diller, L., Packer, O. S., Verweij, J., McMahon, M. J., Williams, D. R., & Dacey, D. M.
(2004). L and M cone contributions to the midget and parasol ganglion cell
receptive fields of macaque monkey retina. Journal of Neuroscience, 24(5),
1079-1088.
Dow, B., & Vautin, R. (1987). Horizontal segregation of color information in the
middle layers of foveal striate cortex. Journal of Neurophysiology, 57(3), 712-
739.
Edwards, V. T., Hogben, J. H., Clark, C. D., & Pratt, C. (1996). Effects of a red
background on magnocellular functioning in average and specifically disabled
readers. Vision Research, 36(7), 1037-1045.
Garcia‐Marin, V., Ahmed, T. H., Afzal, Y. C., & Hawken, M. J. (2013). Distribution of
vesicular glutamate transporter 2 (VGluT2) in the primary visual cortex of the
macaque and human. Journal of Comparative Neurology, 521(1), 130-151.
Ghodrati, M., Khaligh-Razavi, S.-M., & Lehky, S. R. (2017). Towards building a more
complex view of the lateral geniculate nucleus: recent advances in
understanding its role. Progress in Neurobiology.
Hendry, S. H., & Reid, R. C. (2000). The koniocellular pathway in primate vision.
Annual review of neuroscience, 23(1), 127-153.
Hupé, J., James, A., Payne, B., & Lomber, S. (1998). Cortical feedback improves
discrimination between figure and background by V1, V2 and V3 neurons.
Nature, 394(6695), 784.
Jackson, B. L., Blackwood, E. M., Blum, J., Carruthers, S. P., Nemorin, S., Pryor, B.
A., . . . Crewther, D. P. (2013). Magno-and parvocellular contrast responses in
varying degrees of autistic trait. PLoS One, 8(6), e66797.
Kaplan, E., & Shapley, R. M. (1986). The primate retina contains two types of ganglion
cells, with high and low contrast sensitivity. Proceedings of the National
Academy of sciences, 83(8), 2755-2757.
95
Klistorner, A., Crewther, D., & Crewther, S. (1997). Separate magnocellular and
parvocellular contributions from temporal analysis of the multifocal VEP. Vision
Research, 37(15), 2161-2169.
Laycock, R., Crewther, S., & Crewther, D. P. (2007). A role for the ‘magnocellular
advantage’ in visual impairments in neurodevelopmental and psychiatric
disorders. Neuroscience & Biobehavioral Reviews, 31(3), 363-376.
Livingstone, M., & Hubel, D. (1984). Anatomy and physiology of a color system in the
primate visual cortex. The Journal of Neuroscience, 4(1), 309-356.
Livingstone, M., & Hubel, D. (1988). Segregation of form, color, movement, and depth:
anatomy, physiology, and perception. Science, 240(4853), 740-749.
Lovegrove, B. (1996). Dyslexia and a transient/magnocellular pathway deficit: The
current situation and future directions. Australian Journal of Psychology, 48(3),
167-171.
Martin, P. R., White, A. J., Goodchild, A. K., Wilder, H. D., & Sefton, A. E. (1997).
Evidence that blue-on cells are part of the third geniculocortical pathway in
primates. European Journal of Neuroscience, 9(7), 1536-1541.
Maunsell, J. H., Nealey, T. A., & DePriest, D. D. (1990). Magnocellular and
parvocellular contributions to responses in the middle temporal visual area (MT)
of the macaque monkey. The Journal of Neuroscience, 10(10), 3323-3334.
McKendrick, A. M., Badcock, D. R., & Morgan, W. H. (2004). Psychophysical
measurement of neural adaptation abnormalities in magnocellular and
parvocellular pathways in glaucoma. Investigative ophthalmology & Visual
Science, 45(6), 1846-1853.
Pammer, K., & Lovegrove, W. (2001). The influence of color on transient system
activity: implications for dyslexia research. Perception & Psychophysics, 63(3),
490-500.
Pandey Vimal, R. L., Pokorny, J., Smith, V. C., & Shevell, S. K. (1989). Foveal cone
thresholds. Vision Research, 29(1), 61-78. doi:https://doi.org/10.1016/0042-
6989(89)90174-0
Pokorny, J. (2011). Steady and pulsed pedestals, the how and why of post-receptoral
pathway separation. Journal of Vision, 11(5), 7-7.
96
Pokorny, J., & Smith, V. C. (1997). Psychophysical signatures associated with
magnocellular and parvocellular pathway contrast gain. Journal of the Optical
Society of America. A, Optics, Image Science, and Vision, 14(9), 2477-2486.
Schiller, P. H. (1992). The ON and OFF channels of the visual system. Trends in
Neurosciences, 15(3), 86-92.
Schiller, P. H., Malpeli, J. G., & Schein, S. J. (1979). Composition of geniculostriate
input to superior colliculus of the rhesus monkey. Journal of Neurophysiology,
42(4), 1124-1133.
Skottun, B. C. (2004). On the use of red stimuli to isolate magnocellular responses in
psychophysical experiments: A perspective. Visual neuroscience, 21(1), 63-68.
doi:10.1017/S0952523804041069
Stein, J., & Walsh, V. (1997). To see but not to read; the magnocellular theory of
dyslexia. Trends in Neurosciences, 20(4), 147-152.
Sutter, E. (1992). A deterministic approach to nonlinear systems analysis. In R. B.
Pinter & B. Nabet (Eds.), Nonlinear Vision (pp. 171-220). Cleveland, Ohio:
CRC Press.
Sutter, E. (2000). The interpretation of multifocal binary kernels. Documenta
Ophthalmologica, 100(2-3), 49-75.
Sutter, E., & Tran, D. (1992). The field topography of ERG components in man—I. The
photopic luminance response. Vision Research, 32(3), 433-446.
doi:http://dx.doi.org/10.1016/0042-6989(92)90235-B
Tadel, F., Baillet, S., Mosher, J. C., Pantazis, D., & Leahy, R. M. (2011). Brainstorm: A
User-Friendly Application for MEG/EEG Analysis. Computational Intelligence
and Neuroscience, 2011, 13. doi:10.1155/2011/879716
Thompson, J. I., Peck, C. E., Karvelas, G., Hartwell, C. A., Guarnaccia, C., Brown, A.,
& Crewther, D. P. (2015). Temporal processing as a source of altered visual
perception in high autistic tendency. Neuropsychologia, 69, 148-153.
Vos, J. J., & Walraven, P. L. (1971). On the derivation of the foveal receptor primaries.
Vision Research, 11(8), 799-818. doi:https://doi.org/10.1016/0042-
6989(71)90003-4
West, G. L., Anderson, A. K., Bedwell, J. S., & Pratt, J. (2010). Red diffuse light
suppresses the accelerated perception of fear. Psychological Science, 21(7), 992-
999.
97
White, A. J., Solomon, S. G., & Martin, P. R. (2001). Spatial properties of koniocellular
cells in the lateral geniculate nucleus of the marmoset Callithrix jacchus. The
Journal of Physiology, 533(2), 519-535.
Wiesel, T. N., & Hubel, D. H. (1966). Spatial and chromatic interactions in the lateral
geniculate body of the rhesus monkey. Journal of Neurophysiology, 29(6),
1115-1156.
Williams, M. C., Breitmeyer, B. G., Lovegrove, W. J., & Gutierrez, C. (1991).
Metacontrast with masks varying in spatial frequency and wavelength. Vision
Research, 31(11), 2017-2023.
Zemon, V., & Gordon, J. (2006). Luminance-contrast mechanisms in humans: visual
evoked potentials and a nonlinear model. Vision Research, 46(24), 4163-4180.

98
Chapter 5: The Temporal Structure of Evoked MEG Responses:
Effects of Chromatic Saturation
5.1 Chapter guide
Hugrass, L., & Crewther, D. (In Preparation). The temporal structure of evoked MEG
responses: Effects of chromatic saturation
This empirical chapter presents a re-formatted version of the original research
article cited above, which is in preparation for submission in Frontiers of Neuroscience.
The preliminary analyses were presented at the 2017 Australasian Cognitive
Neurosciences meeting. The overall aim of the work presented in this chapter was to
investigate the cortical sources of non-linear VEP signal that are sensitive to chromatic
saturation. In this experiment, brain signals were measured using MEG rather than
EEG. For the most part, when recorded at the scalp both methods reflect the same
neural processes (da Silva, 2013); however, there are some differences. For instance,
EEG is sensitive to both radial and tangential dipole sources, whereas MEG is only
sensitive to the tangential components of dipole sources (Ahlfors et al., 2010). On the
other hand, the advantage of MEG is that it allows for better spatial resolution of
cortical sources, due to less spatial smearing than EEG (da Silva, 2013). For this reason,
MEG was the most appropriate methodology for the experiment presented in this
chapter.
5.1.1 Highlights
• Non-linear temporal analyses revealed MEG responses that are sensitive to
diffuse blue light
• Cortical sources of responses to saturated blue light were retinotopically mapped
• The effects of chromatic saturation on VEPs were not as clearly mapped on the
cortical surface
• The strongest effects of blue saturation were in the K2.1 response, at
approximately 70ms

99
• This indicates that the underlying neural mechanism recovers quickly from
stimulation
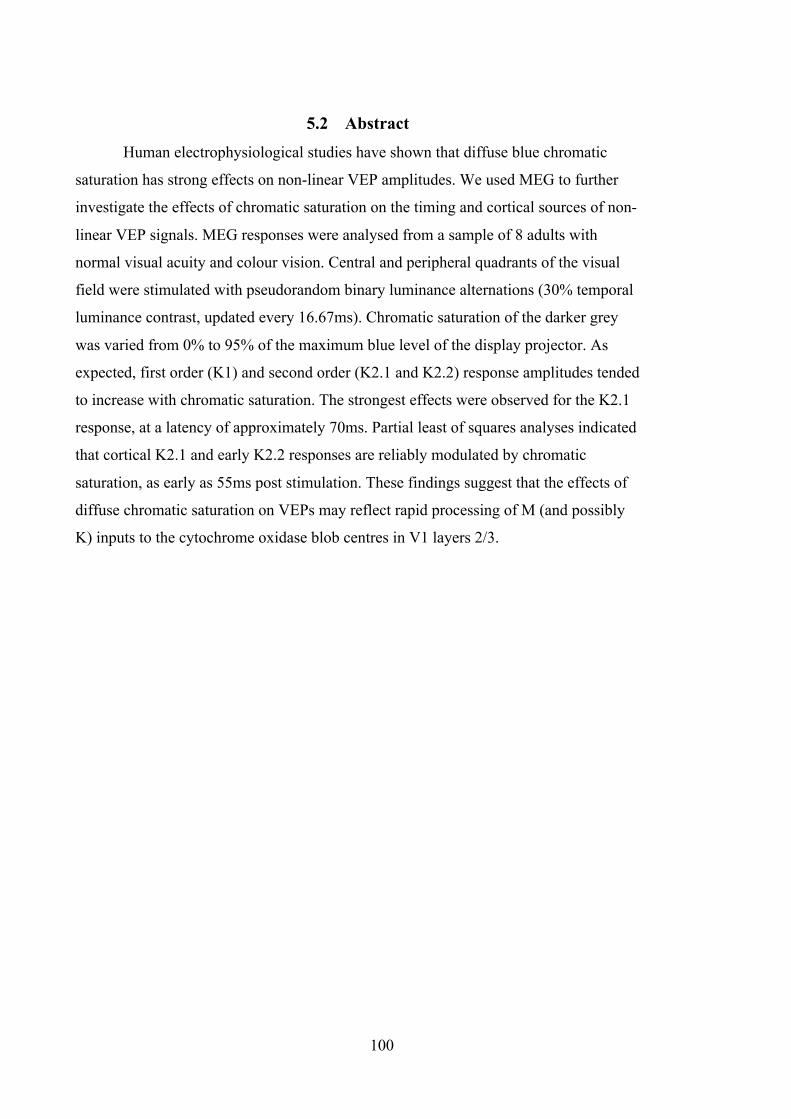
100
5.2 Abstract Human electrophysiological studies have shown that diffuse blue chromatic
saturation has strong effects on non-linear VEP amplitudes. We used MEG to further
investigate the effects of chromatic saturation on the timing and cortical sources of non-
linear VEP signals. MEG responses were analysed from a sample of 8 adults with
normal visual acuity and colour vision. Central and peripheral quadrants of the visual
field were stimulated with pseudorandom binary luminance alternations (30% temporal
luminance contrast, updated every 16.67ms). Chromatic saturation of the darker grey
was varied from 0% to 95% of the maximum blue level of the display projector. As
expected, first order (K1) and second order (K2.1 and K2.2) response amplitudes tended
to increase with chromatic saturation. The strongest effects were observed for the K2.1
response, at a latency of approximately 70ms. Partial least of squares analyses indicated
that cortical K2.1 and early K2.2 responses are reliably modulated by chromatic
saturation, as early as 55ms post stimulation. These findings suggest that the effects of
diffuse chromatic saturation on VEPs may reflect rapid processing of M (and possibly
K) inputs to the cytochrome oxidase blob centres in V1 layers 2/3.
101
5.3 Introduction The major post-receptoral visual pathways play different roles in colour
processing. The rapid magnocellular (M) pathway sums input from L- and M-
wavelength cones at the level of the bipolar cells of the retina (Nassi & Callaway,
2009), and also receives some input from S-cones (Chatterjee & Callaway, 2002).
Although it is highly sensitive to luminance contrast, it is generally considered to be
‘colour blind’ (Hubel & Livingstone, 1987). The parvocellular (P) pathway carries
chromatically opponent L and M cone signals. It has better spatial acuity than the M
pathway at any eccentricity, however P input takes approximately 20ms longer than M
input to activate V1 in monkeys (Bullier, 2001; Nowak, Munk, Girard, & Bullier,
1995). The koniocellular (K) system was characterised more recently (Casagrande,
1994). The best-characterised type of K cell carries s-cone (i.e.; blue on/yellow off)
signal (Hendry & Reid, 2000; Pietersen, Cheong, Solomon, Tailby, & Martin, 2014;
Schiller & Malpeli, 1978).
In V1 layers 2/3, P input is spread uniformly across the cytochrome oxidase blob
and inter-blob regions, whereas M and K inputs are focused around the blob centres
(Edwards, Purpura, & Kaplan, 1995; Hendry & Reid, 2000). The majority of colour
selective cells within the inter-blob regions respond strongly to oriented edges, and
weakly to the chromatic interiors of objects (Johnson, Hawken, & Shapley, 2008). Inter-
blob cells are similar to P cells, in that they have poor luminance contrast sensitivity,
band-pass spatial frequency tuning, and prefer low temporal frequency stimulation. On
the other hand, cells near the centres of blobs lack orientation selectivity (Ts'o &
Gilbert, 1988). Cells close to blob centres are often selective for red/green or
blue/yellow stimulation; however they share some properties with M cells, in that they
exhibit high firing rates, temporal frequency sensitivity and luminance contrast
sensitivity, and they prefer diffuse or low spatial frequency stimulation (Edwards et al.,
1995; Gur & Snodderly, 1997; Pietersen et al., 2014; Shoham, Hübener, Schulze,
Grinvald, & Bonhoeffer, 1997). This indicates that cells within and between the centres
of cytochrome oxidase blobs handle different aspects of chromatic processing.
Chromatic visual evoked potential (VEP) studies in humans have mostly used
isoluminant chromatic grating stimuli (e.g., Berninger, Arden, Hogg, & Frumkes, 1989;
Foxe et al., 2008; Murray, Parry, Carden, & Kulikowski, 1987). The responses to such
stimuli are likely to be dominated by cells in the inter-blob regions, which respond well
102
to chromatic edges (Johnson et al., 2008). However, some interesting results have
emerged from studies that presented diffuse, unpatterned stimuli. For instance, a
transient VEP study revealed a fast latency (~87ms) chromatic response, that was higher
in amplitude for red diffuse stimuli than green or yellow stimuli (Paulus, Hömberg,
Cunningham, Halliday, & Rohde, 1984). A study in macaques showed that responses
from V1 layers 2/3 were higher in amplitude for red or blue diffuse light than for green
or grey light (Givre, Arezzo, & Schroeder, 1995). These wavelength-dependent effects
might reflect responses from cells within cytochrome oxidase blobs, which tend to
respond most strongly to diffuse red or blue light (Dow & Vautin, 1987).
Further support for this idea has come from studies that used multifocal VEP to
analyse the non-linear temporal structure of responses to diffuse colour. Pseudorandom
binary stimulation allows for non-linear temporal analyses through Wiener kernel
decomposition (Sutter, 1992). The first order kernel (K1) is the difference in response to
the light and dark patches, and is analogous to the impulse response function for a linear
system. The first and second slices of the second order response (K2.1 and K2.2)
measure neural recovery over one and two video frames respectively (Klistorner,
Crewther, & Crewther, 1997; Sutter, 1992, 2000).
Klistorner, Crewther, and Crewther (1998) compared responses to diffuse grey-
grey, green-grey and red-grey stimulation, all at the same temporal luminance contrast.
Responses to green-grey stimulation were not different from responses to red-grey
stimulation, whereas chromatically sensitive components emerged for the red/grey
condition. The effects of red chromatic saturation on response amplitudes were
strongest for the K2.1 waveform. Crewther and Crewther (2010) also reported
wavelength-dependent effects of diffuse chromatic stimulation on K2.1 amplitudes,
with stronger responses to blue and red stimulation, than to green or yellow stimulation.
Consistent with the temporal sensitivity of cells close to blob centres, the effects of
colour on the K2.1 waveform suggest that VEP responses to diffuse blue and red
stimulation are dominated by a population of cells that recover rapidly from temporal
stimulation.
The above-mentioned non-linear VEP analyses were based on a single, central
stimulus patch (Crewther & Crewther, 2010; Klistorner et al., 1998). Due the changes in
the polarity and amplitude of responses from across the visual field, this might have
blurred the VEP waveforms. This problem can be reduced by stimulating different
103
quadrants of the central visual field with temporally de-correlated m-sequences (Baseler
& Sutter, 1997; Baseler, Sutter, Klein, & Carney, 1994). The aim of the current study
was to use MEG to further investigate the effects of chromatic saturation on non-linear
VEP responses. Based on existing EEG results (Crewther & Crewther, 2010), we
expected K2.1 magnetic responses to increase with the level of blue chromatic
saturation. Although it has been shown that responses to achromatic multifocal stimuli
originate from retinotopically arranged sources in V1 (Slotnick, Klein, Carney, Sutter,
& Dastmalchi, 1999), no previous studies have mapped non-linear kernel responses to
diffuse chromatic stimuli. We used partial least of squares (PLS) analyses (Krishnan,
Williams, McIntosh, & Abdi, 2011) to investigate the cortical sources of K1, K2.1 and
K2.2 responses that vary reliably with the degree of blue chromatic saturation.
5.4 Methods
5.4.1 Participants
9 participants (2 males, M = 24.4 years, SD= 5.0 years) gave written informed
consent for the experiment, which was conducted with the approval of the Swinburne
Human Research Ethics Committee and in accordance with the code of ethics of the
Declaration of Helsinki. All participants had normal (or corrected to normal) visual
acuity and normal colour vision, as tested with Ishihara colour plates. The results from
one participant were excluded from the analyses, due to low signal to noise ratios in the
recordings.
5.4.2 Stimuli
The stimuli were presented on a Panasonic PTDS100x LCD projector (60Hz,
resolution 1900 x 1200) at a viewing distance of 115 cm. The 8-patch multifocal
dartboard was created using VPixx software (version 3.20, http://www.VPixx.com) and
a DATAPixx display driver (24 bit). The dartboard consisted of 4 central quadrants
(radius = .25°-3.50°) and 4 outer segments (radius = 3.5°-14°). Each patch was
modulated in a pseudorandom binary m-sequence (m = 14) generated in LabVIEW
(National Instruments, USA), which was updated every video frame (16.7ms).
The m-sequences were maximally offset to allow for independent analyses of
responses from each stimulus patch. For the purpose of this experiment, only responses
from the central four quadrants were analysed, and CIE1931 colour space was used to
specify the stimuli. In the achromatic (0% blue saturation) condition, binary exchange
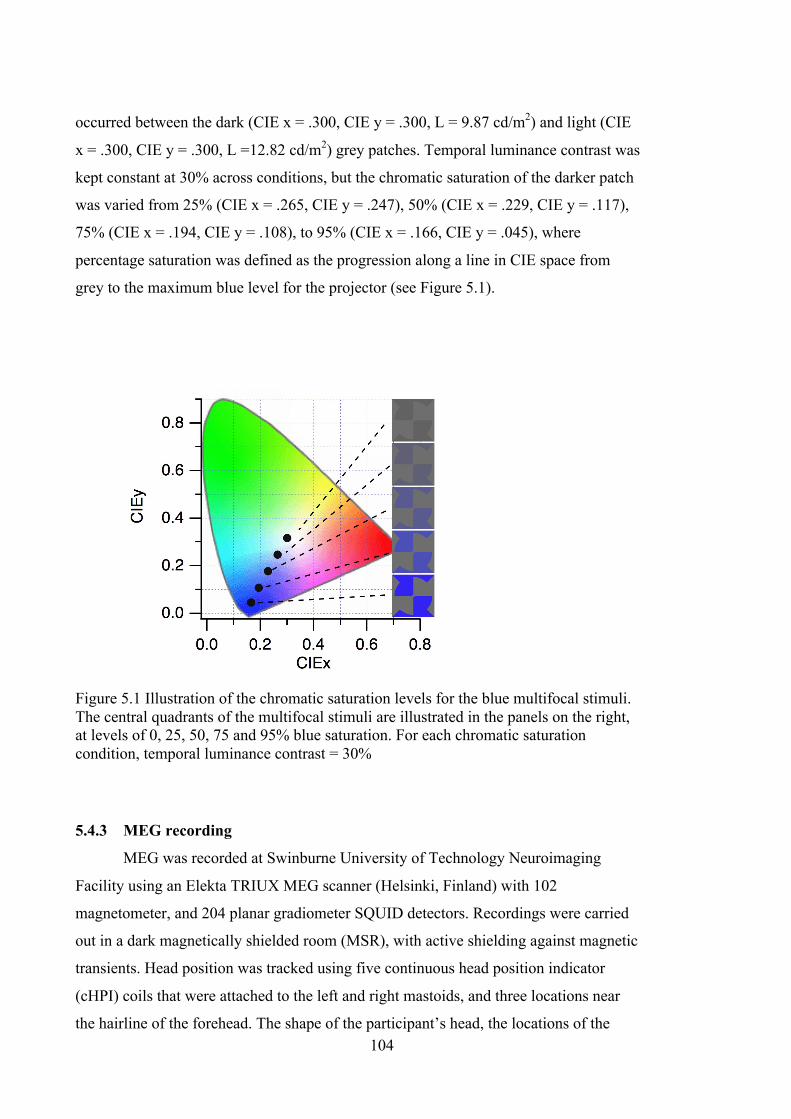
104
occurred between the dark (CIE x = .300, CIE y = .300, L = 9.87 cd/m2) and light (CIE
x = .300, CIE y = .300, L =12.82 cd/m2) grey patches. Temporal luminance contrast was
kept constant at 30% across conditions, but the chromatic saturation of the darker patch
was varied from 25% (CIE x = .265, CIE y = .247), 50% (CIE x = .229, CIE y = .117),
75% (CIE x = .194, CIE y = .108), to 95% (CIE x = .166, CIE y = .045), where
percentage saturation was defined as the progression along a line in CIE space from
grey to the maximum blue level for the projector (see Figure 5.1).
Figure 5.1 Illustration of the chromatic saturation levels for the blue multifocal stimuli. The central quadrants of the multifocal stimuli are illustrated in the panels on the right, at levels of 0, 25, 50, 75 and 95% blue saturation. For each chromatic saturation condition, temporal luminance contrast = 30%
5.4.3 MEG recording
MEG was recorded at Swinburne University of Technology Neuroimaging
Facility using an Elekta TRIUX MEG scanner (Helsinki, Finland) with 102
magnetometer, and 204 planar gradiometer SQUID detectors. Recordings were carried
out in a dark magnetically shielded room (MSR), with active shielding against magnetic
transients. Head position was tracked using five continuous head position indicator
(cHPI) coils that were attached to the left and right mastoids, and three locations near
the hairline of the forehead. The shape of the participant’s head, the locations of the
105
cHPI coils, three head fiducials (nasion, and bilateral preauricular points) were digitised
using a Polhemus FASTRAK (Polhemus Inc., Colchester, VT, USA). EOG and ECG
were recorded using disposable electrodes placed above and below the right eye, and on
the left and right wrists respectively, with a ground electrode attached to the back of the
participant’s elbow.
Separate recordings were made for each of the five chromatic saturation
conditions. In order to prevent fatigue, the m-sequence for each condition was split into
four approximately one-minute blocks (4096 frames), with one-second overlapping
fringes at the start and end of each block (20 blocks in total). Participants were
encouraged to maintain strict fixation on a central marker within blocks, and to blink
and rest their eyes in-between blocks.
5.4.4 Structural T1
A 3T Siemens TIM Trio magnetic resonance imaging (MRI) system (Siemens,
2016, Erlangen, Germany, 32-channel head coil acquisition system) was used to acquire
structural T1 images for each participant. T1-weighted images were acquired on a
sagittal plane with a magnetisation prepared rapid gradient echo (MP-RAGE) pulse
sequence with an inversion recovery (176 slices, slice thickness= 0.75mm, voxel
resolution= 0.75mm3, TR= 1900ms, TE= 2.52ms, TI= 900ms, bandwidth= 170Hz/Px,
flip angle= 9°, orientation sagittal).
5.4.5 MEG analyses
MaxFilter (Version 2.1, Helsinki, Finland Elekta, 2016) was applied to each raw
recording for Temporal Signal Space Separation (tsss) filtering. Subsequent analyses
were performed using the GUI-based MatLab script Brainstorm (Tadel, Baillet, Mosher,
Pantazis, & Leahy, 2011) which is documented and freely available for download
online under the GNU general public license (http://neuroimage.usc.edu/brainstorm).
MEG data were low-pass filtered (0- 40Hz) and signal space projection was applied to
remove ECG and eye-blink artefact.
For each frame of stimulation, a 300ms epoch (-133 to 267ms relative to the
video frame onset) was imported into the Brainstorm database. Custom mfVEP analysis
scripts were written in Matlab/Brainstorm in order to extract K1, K2.1 and K2.2 kernel
responses for the four central quadrants. K1 is the difference between responses to the
light and dark patches. K2.1 measures neural recovery over one frame (16.7ms) by
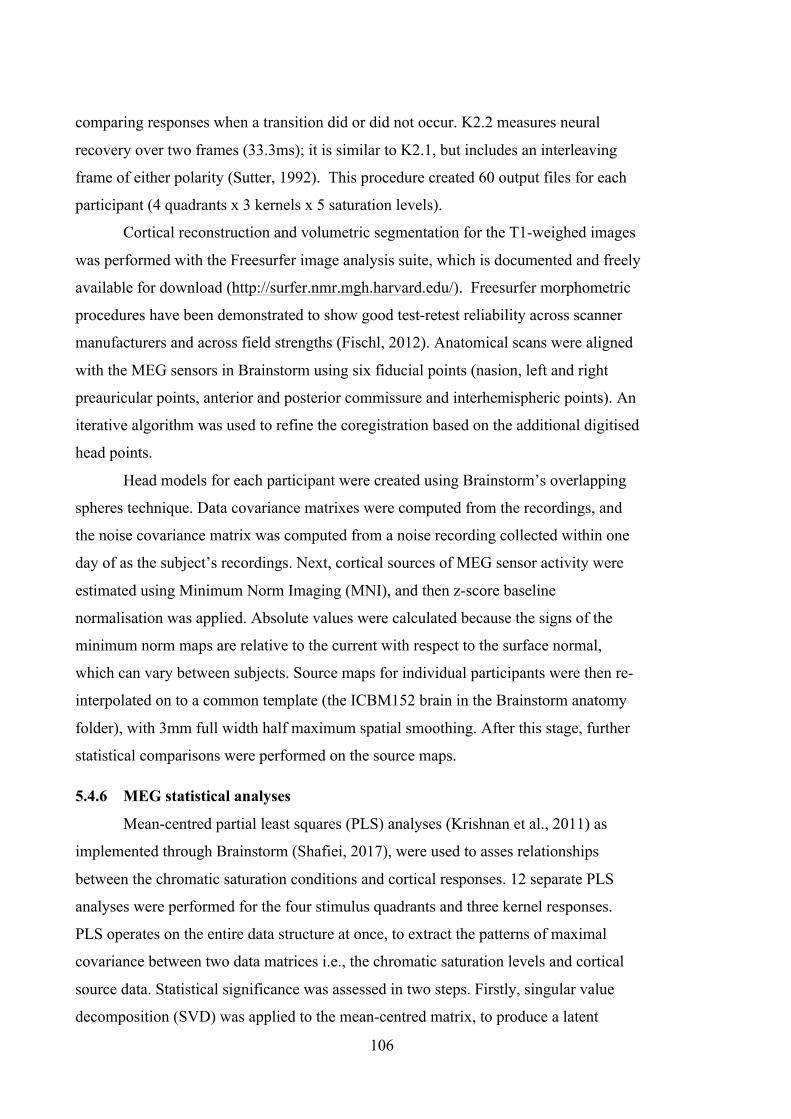
106
comparing responses when a transition did or did not occur. K2.2 measures neural
recovery over two frames (33.3ms); it is similar to K2.1, but includes an interleaving
frame of either polarity (Sutter, 1992). This procedure created 60 output files for each
participant (4 quadrants x 3 kernels x 5 saturation levels).
Cortical reconstruction and volumetric segmentation for the T1-weighed images
was performed with the Freesurfer image analysis suite, which is documented and freely
available for download (http://surfer.nmr.mgh.harvard.edu/). Freesurfer morphometric
procedures have been demonstrated to show good test-retest reliability across scanner
manufacturers and across field strengths (Fischl, 2012). Anatomical scans were aligned
with the MEG sensors in Brainstorm using six fiducial points (nasion, left and right
preauricular points, anterior and posterior commissure and interhemispheric points). An
iterative algorithm was used to refine the coregistration based on the additional digitised
head points.
Head models for each participant were created using Brainstorm’s overlapping
spheres technique. Data covariance matrixes were computed from the recordings, and
the noise covariance matrix was computed from a noise recording collected within one
day of as the subject’s recordings. Next, cortical sources of MEG sensor activity were
estimated using Minimum Norm Imaging (MNI), and then z-score baseline
normalisation was applied. Absolute values were calculated because the signs of the
minimum norm maps are relative to the current with respect to the surface normal,
which can vary between subjects. Source maps for individual participants were then re-
interpolated on to a common template (the ICBM152 brain in the Brainstorm anatomy
folder), with 3mm full width half maximum spatial smoothing. After this stage, further
statistical comparisons were performed on the source maps.
5.4.6 MEG statistical analyses
Mean-centred partial least squares (PLS) analyses (Krishnan et al., 2011) as
implemented through Brainstorm (Shafiei, 2017), were used to asses relationships
between the chromatic saturation conditions and cortical responses. 12 separate PLS
analyses were performed for the four stimulus quadrants and three kernel responses.
PLS operates on the entire data structure at once, to extract the patterns of maximal
covariance between two data matrices i.e., the chromatic saturation levels and cortical
source data. Statistical significance was assessed in two steps. Firstly, singular value
decomposition (SVD) was applied to the mean-centred matrix, to produce a latent
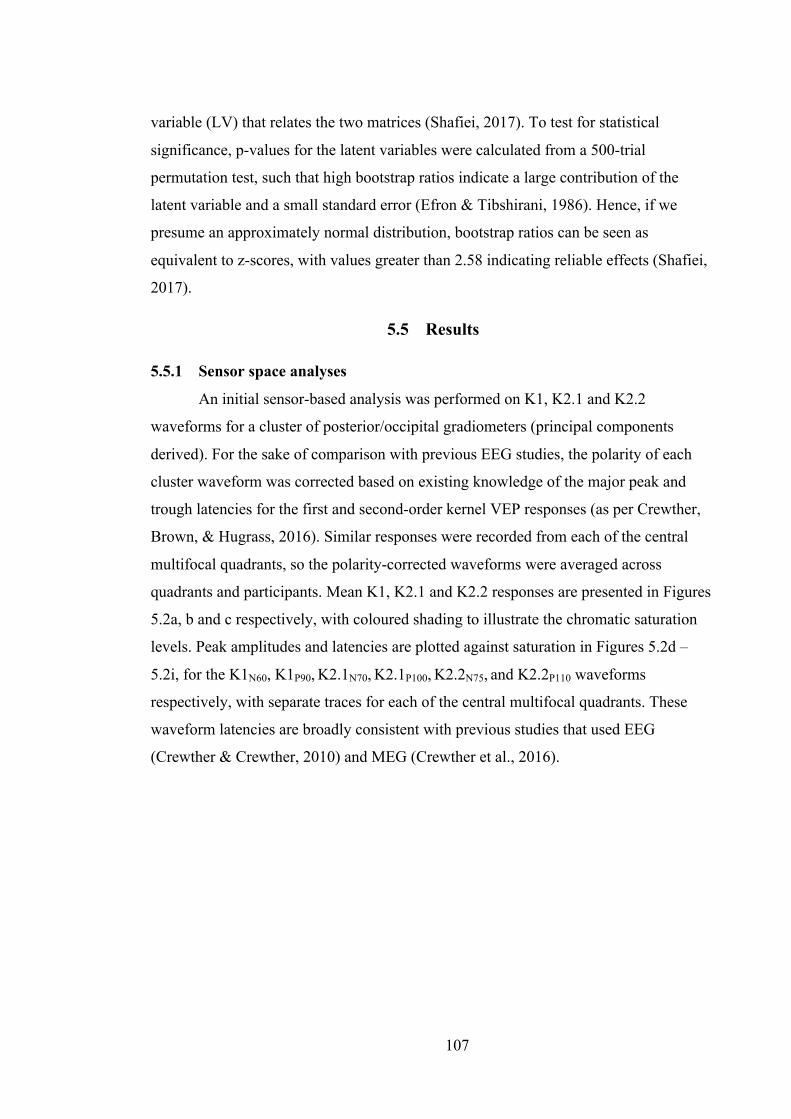
107
variable (LV) that relates the two matrices (Shafiei, 2017). To test for statistical
significance, p-values for the latent variables were calculated from a 500-trial
permutation test, such that high bootstrap ratios indicate a large contribution of the
latent variable and a small standard error (Efron & Tibshirani, 1986). Hence, if we
presume an approximately normal distribution, bootstrap ratios can be seen as
equivalent to z-scores, with values greater than 2.58 indicating reliable effects (Shafiei,
2017).
5.5 Results
5.5.1 Sensor space analyses
An initial sensor-based analysis was performed on K1, K2.1 and K2.2
waveforms for a cluster of posterior/occipital gradiometers (principal components
derived). For the sake of comparison with previous EEG studies, the polarity of each
cluster waveform was corrected based on existing knowledge of the major peak and
trough latencies for the first and second-order kernel VEP responses (as per Crewther,
Brown, & Hugrass, 2016). Similar responses were recorded from each of the central
multifocal quadrants, so the polarity-corrected waveforms were averaged across
quadrants and participants. Mean K1, K2.1 and K2.2 responses are presented in Figures
5.2a, b and c respectively, with coloured shading to illustrate the chromatic saturation
levels. Peak amplitudes and latencies are plotted against saturation in Figures 5.2d –
5.2i, for the K1N60, K1P90, K2.1N70, K2.1P100, K2.2N75, and K2.2P110 waveforms
respectively, with separate traces for each of the central multifocal quadrants. These
waveform latencies are broadly consistent with previous studies that used EEG
(Crewther & Crewther, 2010) and MEG (Crewther et al., 2016).
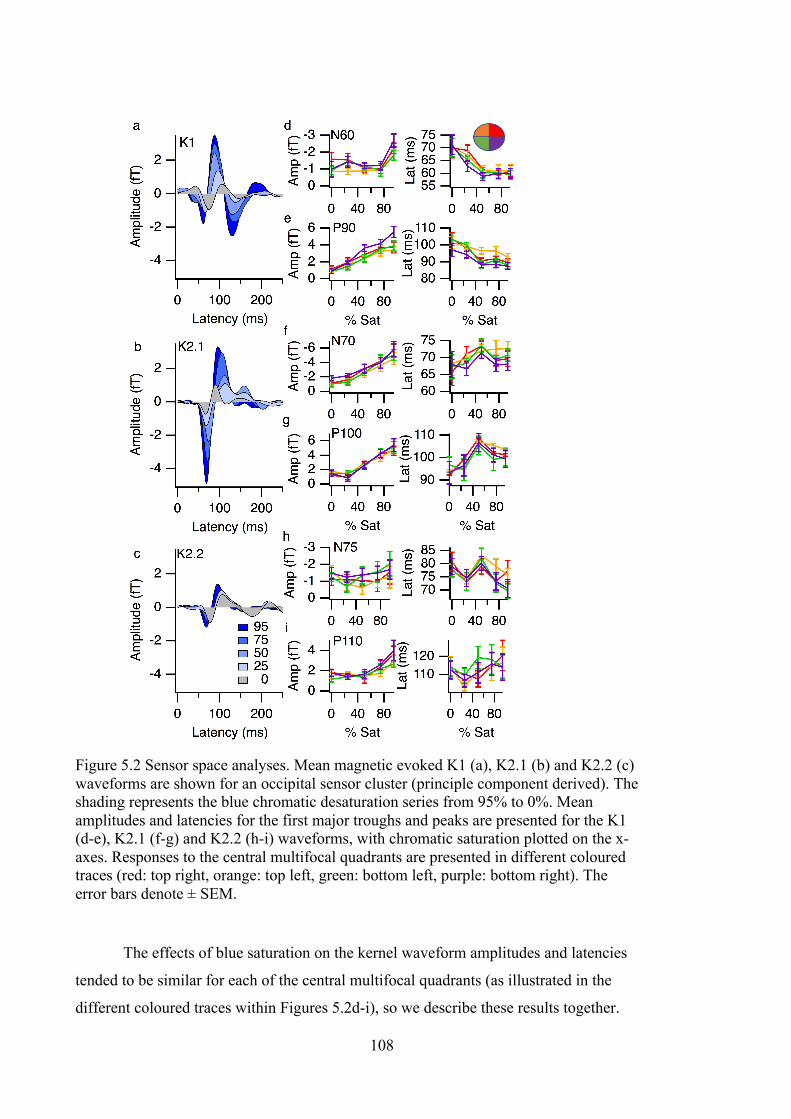
108
Figure 5.2 Sensor space analyses. Mean magnetic evoked K1 (a), K2.1 (b) and K2.2 (c) waveforms are shown for an occipital sensor cluster (principle component derived). The shading represents the blue chromatic desaturation series from 95% to 0%. Mean amplitudes and latencies for the first major troughs and peaks are presented for the K1 (d-e), K2.1 (f-g) and K2.2 (h-i) waveforms, with chromatic saturation plotted on the x-axes. Responses to the central multifocal quadrants are presented in different coloured traces (red: top right, orange: top left, green: bottom left, purple: bottom right). The error bars denote ± SEM.
The effects of blue saturation on the kernel waveform amplitudes and latencies
tended to be similar for each of the central multifocal quadrants (as illustrated in the
different coloured traces within Figures 5.2d-i), so we describe these results together.
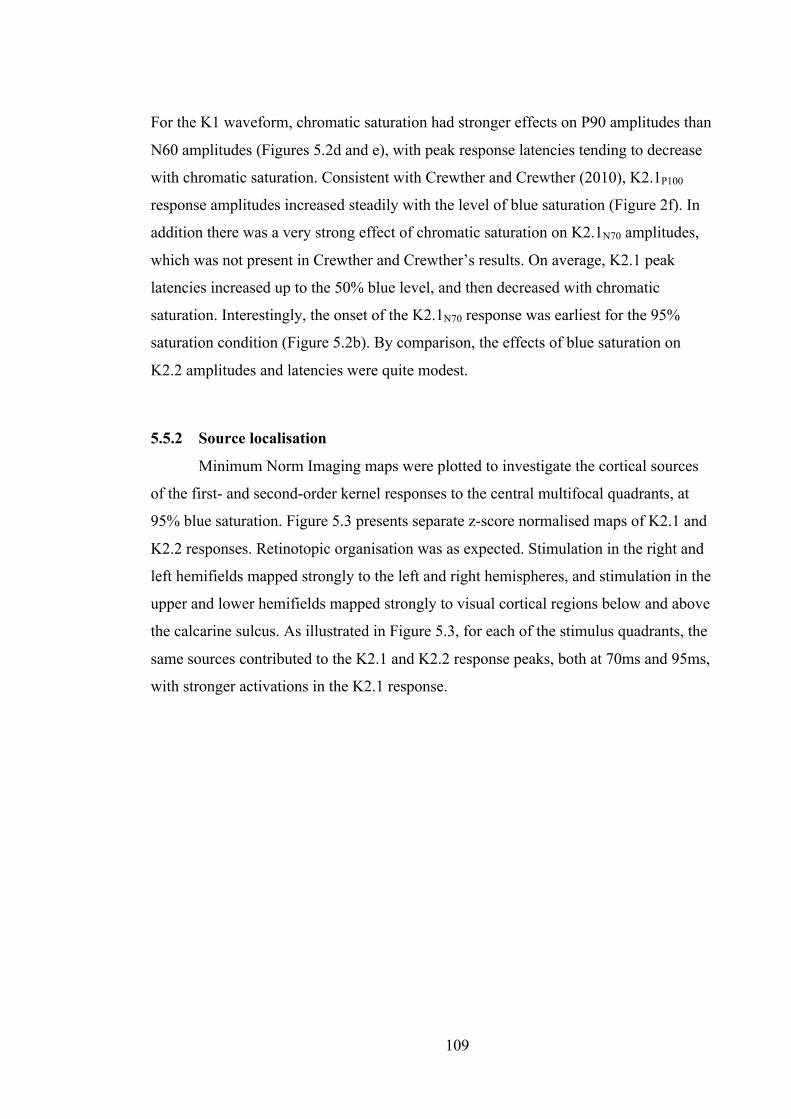
109
For the K1 waveform, chromatic saturation had stronger effects on P90 amplitudes than
N60 amplitudes (Figures 5.2d and e), with peak response latencies tending to decrease
with chromatic saturation. Consistent with Crewther and Crewther (2010), K2.1P100
response amplitudes increased steadily with the level of blue saturation (Figure 2f). In
addition there was a very strong effect of chromatic saturation on K2.1N70 amplitudes,
which was not present in Crewther and Crewther’s results. On average, K2.1 peak
latencies increased up to the 50% blue level, and then decreased with chromatic
saturation. Interestingly, the onset of the K2.1N70 response was earliest for the 95%
saturation condition (Figure 5.2b). By comparison, the effects of blue saturation on
K2.2 amplitudes and latencies were quite modest.
5.5.2 Source localisation
Minimum Norm Imaging maps were plotted to investigate the cortical sources
of the first- and second-order kernel responses to the central multifocal quadrants, at
95% blue saturation. Figure 5.3 presents separate z-score normalised maps of K2.1 and
K2.2 responses. Retinotopic organisation was as expected. Stimulation in the right and
left hemifields mapped strongly to the left and right hemispheres, and stimulation in the
upper and lower hemifields mapped strongly to visual cortical regions below and above
the calcarine sulcus. As illustrated in Figure 5.3, for each of the stimulus quadrants, the
same sources contributed to the K2.1 and K2.2 response peaks, both at 70ms and 95ms,
with stronger activations in the K2.1 response.
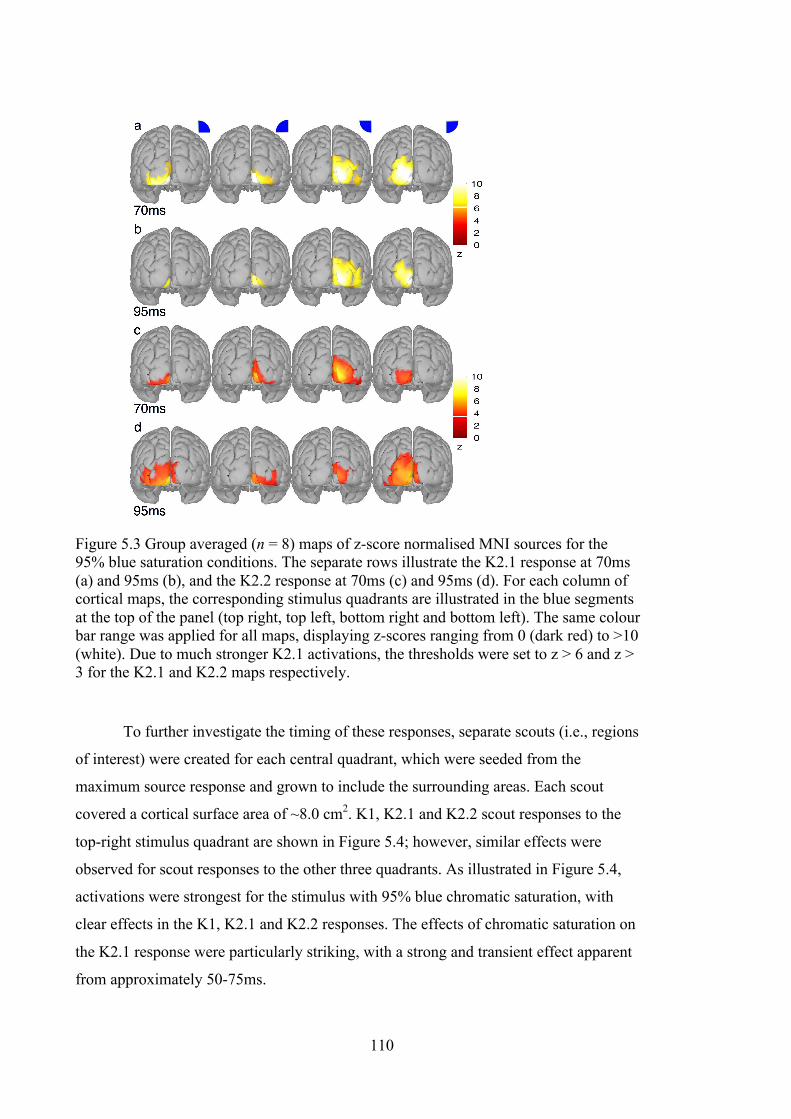
110
Figure 5.3 Group averaged (n = 8) maps of z-score normalised MNI sources for the 95% blue saturation conditions. The separate rows illustrate the K2.1 response at 70ms (a) and 95ms (b), and the K2.2 response at 70ms (c) and 95ms (d). For each column of cortical maps, the corresponding stimulus quadrants are illustrated in the blue segments at the top of the panel (top right, top left, bottom right and bottom left). The same colour bar range was applied for all maps, displaying z-scores ranging from 0 (dark red) to >10 (white). Due to much stronger K2.1 activations, the thresholds were set to z > 6 and z > 3 for the K2.1 and K2.2 maps respectively.
To further investigate the timing of these responses, separate scouts (i.e., regions
of interest) were created for each central quadrant, which were seeded from the
maximum source response and grown to include the surrounding areas. Each scout
covered a cortical surface area of ~8.0 cm2. K1, K2.1 and K2.2 scout responses to the
top-right stimulus quadrant are shown in Figure 5.4; however, similar effects were
observed for scout responses to the other three quadrants. As illustrated in Figure 5.4,
activations were strongest for the stimulus with 95% blue chromatic saturation, with
clear effects in the K1, K2.1 and K2.2 responses. The effects of chromatic saturation on
the K2.1 response were particularly striking, with a strong and transient effect apparent
from approximately 50-75ms.
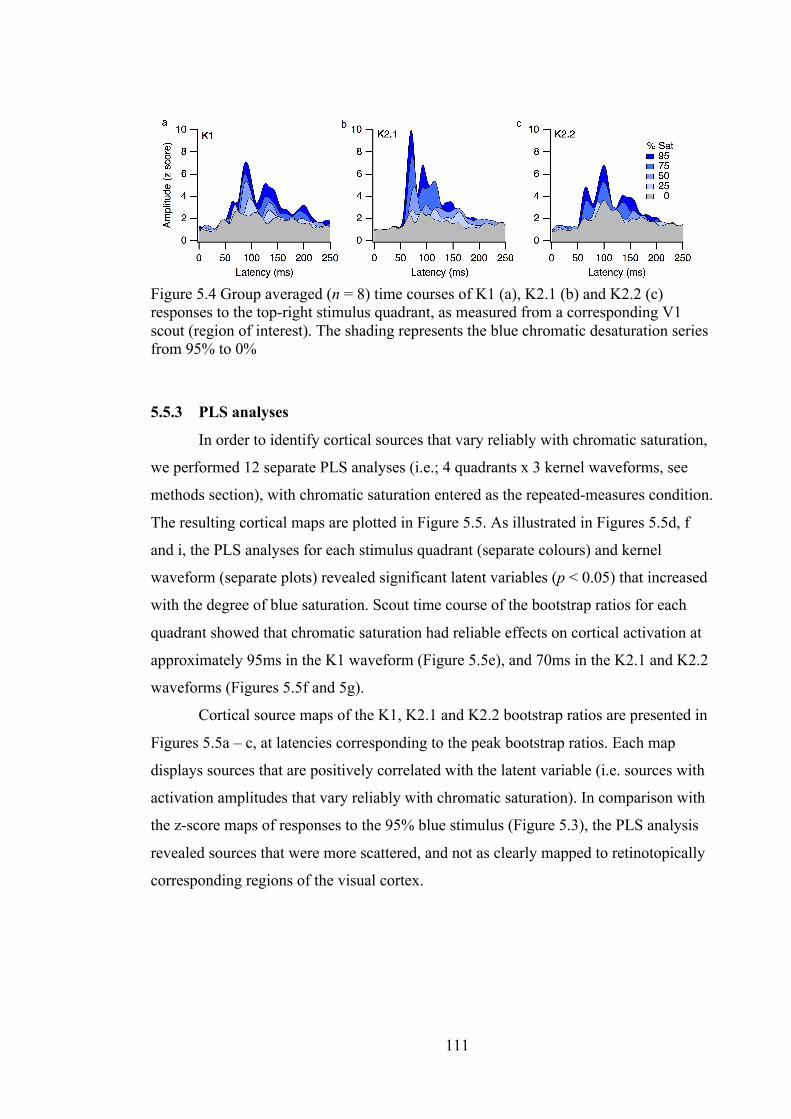
111
Figure 5.4 Group averaged (n = 8) time courses of K1 (a), K2.1 (b) and K2.2 (c) responses to the top-right stimulus quadrant, as measured from a corresponding V1 scout (region of interest). The shading represents the blue chromatic desaturation series from 95% to 0%
5.5.3 PLS analyses
In order to identify cortical sources that vary reliably with chromatic saturation,
we performed 12 separate PLS analyses (i.e.; 4 quadrants x 3 kernel waveforms, see
methods section), with chromatic saturation entered as the repeated-measures condition.
The resulting cortical maps are plotted in Figure 5.5. As illustrated in Figures 5.5d, f
and i, the PLS analyses for each stimulus quadrant (separate colours) and kernel
waveform (separate plots) revealed significant latent variables (p < 0.05) that increased
with the degree of blue saturation. Scout time course of the bootstrap ratios for each
quadrant showed that chromatic saturation had reliable effects on cortical activation at
approximately 95ms in the K1 waveform (Figure 5.5e), and 70ms in the K2.1 and K2.2
waveforms (Figures 5.5f and 5g).
Cortical source maps of the K1, K2.1 and K2.2 bootstrap ratios are presented in
Figures 5.5a – c, at latencies corresponding to the peak bootstrap ratios. Each map
displays sources that are positively correlated with the latent variable (i.e. sources with
activation amplitudes that vary reliably with chromatic saturation). In comparison with
the z-score maps of responses to the 95% blue stimulus (Figure 5.3), the PLS analysis
revealed sources that were more scattered, and not as clearly mapped to retinotopically
corresponding regions of the visual cortex.
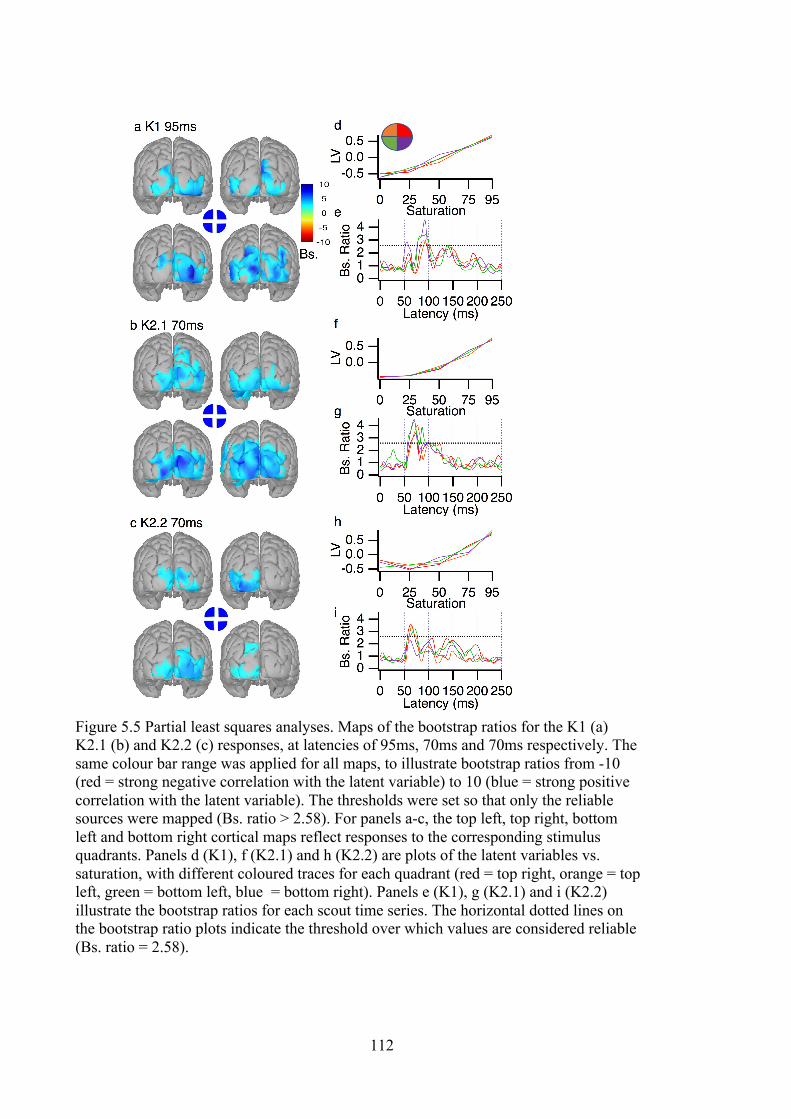
112
Figure 5.5 Partial least squares analyses. Maps of the bootstrap ratios for the K1 (a) K2.1 (b) and K2.2 (c) responses, at latencies of 95ms, 70ms and 70ms respectively. The same colour bar range was applied for all maps, to illustrate bootstrap ratios from -10 (red = strong negative correlation with the latent variable) to 10 (blue = strong positive correlation with the latent variable). The thresholds were set so that only the reliable sources were mapped (Bs. ratio > 2.58). For panels a-c, the top left, top right, bottom left and bottom right cortical maps reflect responses to the corresponding stimulus quadrants. Panels d (K1), f (K2.1) and h (K2.2) are plots of the latent variables vs. saturation, with different coloured traces for each quadrant (red = top right, orange = top left, green = bottom left, blue = bottom right). Panels e (K1), g (K2.1) and i (K2.2) illustrate the bootstrap ratios for each scout time series. The horizontal dotted lines on the bootstrap ratio plots indicate the threshold over which values are considered reliable (Bs. ratio = 2.58).
113
5.6 Discussion We investigated the non-linear temporal structure of magnetic evoked fields, for
a blue chromatic saturation series of diffuse multifocal stimuli, with the temporal
luminance contrast held constant across conditions (30% Michelson). Our analyses
revealed that chromatic saturation modulates cortically evoked responses at very early
stages of visual processing. Interestingly, the PLS analyses showed that the strongest
effects of chromatic saturation on cortical response amplitudes were in the first slice of
the second order non-linear temporal kernel (K2.1). As discussed below, these results
suggest that responses to chromatic saturation are dominated by a visual mechanism
that recovers rapidly from temporal stimulation, which may reflect M (and possibly K)
input to the cytochrome oxidase blob centres in V1 layers 2/3.
Our MEG findings are broadly consistent with EEG results from Crewther and
Crewther (2010). The key difference is that they observed strong effects of chromatic
saturation on the K2.1 response peak at approximately 105ms, with relatively small
effects on the preceding negativity. By contrast, our analyses consistently showed a
strong effect of chromatic saturation on the K2.1 response at approximately 70ms, with
a lesser effect for the peak at 95ms. A possible explanation for this difference could be
that Crewther and Crewther (2010) analysed responses to a single foveal stimulus patch
(4 degrees diameter), so there may have been some signal cancelation from cortical
sources above and below the calcarine sulcus. We addressed this issue in the current
experiment by stimulating the central visual field with temporally de-correlated
quadrants. This is likely to have reduced the degree of source cancellation and temporal
blurring in the waveforms (Baseler & Sutter, 1997; Baseler et al., 1994). Alternatively,
these differences in our results may, at least in part, reflect differences in the sensitivity
of MEG and EEG to radial and tangential sources (Ahlfors, Han, Belliveau, &
Hämäläinen, 2010).
For the 95% blue saturation level, cortical sources of the major K2.1 and K2.2
waveforms were strongly and consistently localised to V1 regions corresponding
retinotopically to the top left, top right, bottom left and bottom right quadrants of the
visual field. The PLS analysis revealed cortical source responses that reliably co-varied
with chromatic saturation; however the maps of the bootstrap ratios across the visual
cortex were not as clearly retinotopically organised. This might in part reflect
differences in the peak latencies of the evoked field responses to stimuli at different
114
blue saturation levels. Alternatively, this may reflect differences in the mapping of
surface and form colour in the cortex. Future studies that perform more detailed source
modelling, taking into account individual differences in cortical folding (Ales, Carney,
& Klein, 2010), may shed further light on the cortical mapping of responses to
chromatic saturation.
Consistent with the results of a macaque physiological study (Givre et al., 1995),
the highly saturated blue multifocal stimulus evoked the fastest VEP onset latencies.
This finding is intriguing, given that blue-on signal is transmitted to the cortex via the K
pathway (Hendry & Reid, 2000), yet K cells in the LGN tend to have sluggish temporal
responses (Irvin, Casagrande, & Norton, 1993). It has been shown that blue-on and
blue-off signals leaving the LGN via the K pathways are slower than signals leaving
from the P and M pathways (Pietersen et al., 2014). This latency delay could be reduced
at the cortical level, due to the direct projection of blue-on input from the LGN to
cytochrome oxidase blobs in V1 layer 3 (Chatterjee & Callaway, 2003). Another
possible explanation of the decrease in VEP response latencies with blue light could be
that S-cones provide approximately 10% of the input to M cells (Chatterjee &
Callaway, 2002), and some M cells project to the centres of cytochrome oxidase blobs
in V1 layers 2/3 (Edwards et al., 1995).
In agreement with previous EEG studies (Crewther & Crewther, 2010;
Klistorner et al., 1998), diffuse chromatic saturation had stronger effects on K2.1 than
K2.2 amplitudes. The K2.1 and K2.2 non-linearities are interpreted in terms of neural
recovery over one and two video frames (in this case 16.7 and 33.3ms) respectively.
Studies of the achromatic contrast response functions suggest that the K2.1 and early
K2.2 waveforms reflect input from the M pathway, and the main K2.2 waveform
reflects input from the P pathway (Jackson et al., 2013; Klistorner et al., 1997).
Consistent with a M generator, K2.1 amplitudes correlate well with psychophysically
measured flicker fusion thresholds (Brown, Corner, Crewther, & Crewther, Submitted
for Publication). For diffuse stimulation, the P pathway does not appear to contribute to
the K2.1 waveform (Klistorner et al., 1997). Although contributions from the K system
to the K2.1 and K2.2 waveforms have not been specifically investigated, the temporal
responses of K cells (Pietersen et al., 2014) indicate it is unlikely that they would
contribute strongly to the K2.1 waveform. Therefore, our results imply that the effects
115
of blue saturation on VEPs are generated by a neural mechanism with rapid, ‘M –like’
recovery from stimulation.
Evidence from macaque physiology suggests that the effects of blue and red
chromatic saturation on VEPs are unlikely to reflect chromatic processing at the level of
the LGN (Givre et al., 1995). In V1, red and blue lights tended to evoke higher
amplitude responses than green or white lights, particularly in layers 2/3 and 4Cβ. There
was no evidence of any chromatic enhancement at the level of the LGN, which suggests
these wavelength-specific effects of diffuse colour on VEPs arise at the cortical level.
Therefore, we interpret the effects of diffuse blue saturation on K2.1 responses in terms
of M input to the cytochrome oxidase blobs. This is consistent with evidence that
temporal frequency sensitivity and firing rates tend to be higher for cells within than in-
between blob centres (Economides, Sincich, Adams, & Horton, 2011; Gur & Snodderly,
1997; Shoham et al., 1997). Therefore, the effects of diffuse chromatic saturation on
VEPs may reflect rapid processing of M (and possibly K) inputs to the cytochrome
oxidase blob centres.
5.7 Conclusions In conclusion, we observed very early effects of blue chromatic saturation on
non-linear magnetic evoked fields. PLS analyses showed that the effects of chromatic
saturation are strongest for the fast-latency K2.1 response. This suggests a potential role
for the M and K projections to V1 cytochrome oxidates blob centres, in the rapid
processing of diffuse chromatic signal. This may facilitate figure ground segmentation
during the first-pass analysis of the visual scene.
5.8 Acknowledgements This research was funded by the Australian Government, through the Australian
Research Council (DP150104172).
5.9 References Ahlfors, S. P., Han, J., Belliveau, J. W., & Hämäläinen, M. S. (2010). Sensitivity of
MEG and EEG to source orientation. Brain topography, 23(3), 227-232.
Ales, J., Carney, T., & Klein, S. A. (2010). The folding fingerprint of visual cortex
reveals the timing of human V1 and V2. Neuroimage, 49(3), 2494-2502.

116
Baseler, H., & Sutter, E. (1997). M and P components of the VEP and their visual field
distribution. Vision Research, 37(6), 675-690.
Baseler, H., Sutter, E., Klein, S., & Carney, T. (1994). The topography of visual evoked
response properties across the visual field. Electroencephalography and clinical
neurophysiology, 90(1), 65-81.
Berninger, T., Arden, G., Hogg, C., & Frumkes, T. (1989). Separable evoked retinal and
cortical potentials from each major visual pathway: preliminary results. British
Journal of Ophthalmology, 73(7), 502-511.
Brown, A., Corner, M., Crewther, D. P., & Crewther, S. G. (Submitted for Publication).
Human Flicker Fusion Correlates with Physiological Measures of
Magnocellular Neural Efficiency.
Bullier, J. (2001). Integrated model of visual processing. Brain Research Reviews,
36(2), 96-107.
Casagrande, V. A. (1994). A third parallel visual pathway to primate area V1. Trends in
Neurosciences, 17(7), 305-310. doi:http://dx.doi.org/10.1016/0166-
2236(94)90065-5
Chatterjee, S., & Callaway, E. M. (2002). S cone contributions to the magnocellular
visual pathway in macaque monkey. Neuron, 35(6), 1135-1146.
Chatterjee, S., & Callaway, E. M. (2003). Parallel colour-opponent pathways to primary
visual cortex. Nature, 426(6967), 668.
Crewther, D. P., Brown, A., & Hugrass, L. (2016). Temporal structure of human
magnetic evoked fields. Exp Brain Res, 234(7), 1987-1995. doi:10.1007/s00221-
016-4601-0
Crewther, D. P., & Crewther, S. G. (2010). Different temporal structure for form versus
surface cortical color systems–evidence from chromatic non-linear VEP. PLOS
one, 5(12), e15266.
da Silva, F. L. (2013). EEG and MEG: relevance to neuroscience. Neuron, 80(5), 1112-
1128.
Dow, B., & Vautin, R. (1987). Horizontal segregation of color information in the
middle layers of foveal striate cortex. Journal of Neurophysiology, 57(3), 712-
739.

117
Economides, J. R., Sincich, L. C., Adams, D. L., & Horton, J. C. (2011). Orientation
tuning of cytochrome oxidase patches in macaque primary visual cortex. Nature
neuroscience, 14(12), 1574.
Edwards, D. P., Purpura, K. P., & Kaplan, E. (1995). Contrast sensitivity and spatial
frequency response of primate cortical neurons in and around the cytochrome
oxidase blobs. Vision Research, 35(11), 1501-1523.
Efron, B., & Tibshirani, R. (1986). Bootstrap methods for standard errors, confidence
intervals, and other measures of statistical accuracy. Statistical science, 54-75.
Fischl, B. (2012). FreeSurfer. Neuroimage, 62(2), 774-781.
Foxe, J. J., Strugstad, E. C., Sehatpour, P., Molholm, S., Pasieka, W., Schroeder, C. E.,
& McCourt, M. E. (2008). Parvocellular and magnocellular contributions to the
initial generators of the visual evoked potential: high-density electrical mapping
of the “C1” component. Brain topography, 21(1), 11-21.
Givre, S., Arezzo, J., & Schroeder, C. (1995). Effects of wavelength on the timing and
laminar distribution of illuminance-evoked activity in macaque V1. Visual
Neuroscience, 12(2), 229-239.
Gur, M., & Snodderly, D. M. (1997). A dissociation between brain activity and
perception: chromatically opponent cortical neurons signal chromatic flicker that
is not perceived. Vision Research, 37(4), 377-382.
Hendry, S. H., & Reid, R. C. (2000). The koniocellular pathway in primate vision.
Annual review of neuroscience, 23(1), 127-153.
Hubel, D. H., & Livingstone, M. S. (1987). Segregation of form, color, and stereopsis in
primate area 18. Journal of Neuroscience, 7(11), 3378-3415.
Irvin, G. E., Casagrande, V. A., & Norton, T. T. (1993). Center/surround relationships
of magnocellular, parvocellular, and koniocellular relay cells in primate lateral
geniculate nucleus. Visual neuroscience, 10(2), 363-373.
Jackson, B. L., Blackwood, E. M., Blum, J., Carruthers, S. P., Nemorin, S., Pryor, B.
A., . . . Crewther, D. P. (2013). Magno-and parvocellular contrast responses in
varying degrees of autistic trait. PLOS one, 8(6), e66797.
Johnson, E. N., Hawken, M. J., & Shapley, R. (2008). The orientation selectivity of
color-responsive neurons in macaque V1. Journal of Neuroscience, 28(32),
8096-8106.
118
Klistorner, A., Crewther, D. P., & Crewther, S. (1997). Separate magnocellular and
parvocellular contributions from temporal analysis of the multifocal VEP. Vision
Research, 37(15), 2161-2169.
Klistorner, A., Crewther, D. P., & Crewther, S. (1998). Temporal analysis of the
chromatic flash VEP—separate colour and luminance contrast components.
Vision Research, 38(24), 3979-4000. doi:http://dx.doi.org/10.1016/S0042-
6989(97)00394-5
Krishnan, A., Williams, L. J., McIntosh, A. R., & Abdi, H. (2011). Partial Least Squares
(PLS) methods for neuroimaging: a tutorial and review. Neuroimage, 56(2),
455-475.
Murray, I. J., Parry, N. R., Carden, D., & Kulikowski, J. J. (1987). Human visual
evoked potentials to chromatic and achromatic gratings. Clinical Vision
Sciences, 1, 231-244.
Nassi, J. J., & Callaway, E. M. (2009). Parallel processing strategies of the primate
visual system. Nature Reviews Neuroscience, 10(5), 360-372.
Nowak, L., Munk, M., Girard, P., & Bullier, J. (1995). Visual latencies in areas V1 and
V2 of the macaque monkey. Visual neuroscience, 12(2), 371-384.
Paulus, W., Hömberg, V., Cunningham, K., Halliday, A., & Rohde, N. (1984). Colour
and brightness components of foveal visual evoked potentials in man.
Electroencephalography and clinical neurophysiology, 58(2), 107-119.
Pietersen, A. N., Cheong, S. K., Solomon, S. G., Tailby, C., & Martin, P. R. (2014).
Temporal response properties of koniocellular (blue-on and blue-off) cells in
marmoset lateral geniculate nucleus. Journal of Neurophysiology, 112(6), 1421-
1438.
Schiller, P. H., & Malpeli, J. G. (1978). Functional specificity of lateral geniculate
nucleus laminae of the rhesus monkey. Journal of Neurophysiology, 41(3), 788-
797.
Shafiei, G. (2017, 2017-01-19). Partial Least Squares (PLS). Retrieved from
http://neuroimage.usc.edu/brainstorm/Tutorials/PLS
Shoham, D., Hübener, M., Schulze, S., Grinvald, A., & Bonhoeffer, T. (1997). Spatio–
temporal frequency domains and their relation to cytochrome oxidase staining in
cat visual cortex. Nature, 385(6616), 529.
119
Slotnick, S. D., Klein, S. A., Carney, T., Sutter, E., & Dastmalchi, S. (1999). Using
multi-stimulus VEP source localization to obtain a retinotopic map of human
primary visual cortex. Clinical neurophysiology, 110(10), 1793-1800.
Sutter, E. (1992). A deterministic approach to nonlinear systems analysis. In R. B.
Pinter & B. Nabet (Eds.), Nonlinear Vision (pp. 171-220). Cleveland, Ohio:
CRC Press.
Sutter, E. (2000). The interpretation of multifocal binary kernels. Documenta
Ophthalmologica, 100(2-3), 49-75.
Tadel, F., Baillet, S., Mosher, J. C., Pantazis, D., & Leahy, R. M. (2011). Brainstorm: a
user-friendly application for MEG/EEG analysis. Computational intelligence
and neuroscience, 2011, 8.
Ts'o, D., & Gilbert, C. D. (1988). The organization of chromatic and spatial interactions
in the primate striate cortex. Journal of Neuroscience, 8(5), 1712-1727.

120
Chapter 6: Intranasal Oxytocin Modulates Very Early Visual
Processing of Emotional Faces
6.1 Chapter guide Hugrass, L., Labuschagne, I., Price, A., & Crewther, D. (In Submission). Part
1: Intranasal oxytocin modulates very early visual processing of emotional faces.
Chapter 6 comprises a re-formatted version of the original research article cited
above, which has been submitted to Hormones and Behaviour as the first of a two-part
original research article. The second part is presented in Chapter 7. David Crewther
presented the preliminary analyses at the 2017 Australasian Cognitive Neurosciences
Society meeting. Taken together, Chapters 6 and 7 contribute to the understanding of
the neural mechanisms by which oxytocin influences affective processing.
For the work presented in the current chapter, I used conventional VEP to
investigate the effects of OXT on the timing of affective face processing. For the work
presented in Chapter 7, I investigated the effects of OXT on M or P signatures of non-
linear VEPs. Data for these two experiments were collected in the same study, for the
same sample of healthy male adults.
6.1.1 Highlights
• Nasal oxytocin affected visual evoked potentials (VEPs) to emotional face
stimuli
• At 40-60ms, oxytocin reduced amplitudes of right and central VEPs to fearful
faces
• At ~100ms, oxytocin reduced amplitudes of left VEPs to fearful faces
• At 400-600ms, oxytocin reduced VEP amplitudes to fearful, happy and neutral
faces
• Oxytocin did not influence the accuracy or latency of emotion identification
121
6.2 Abstract Functional imaging and behavioural studies have shown that the neuropeptide
oxytocin influences processing of emotional faces. However, it is not clear whether
these effects reflect modulation at the early or late stages of affective processing. We
investigated the effects of oxytocin administration on early and late visual evoked
potentials (VEP) in response to faces with neutral, fearful and happy expressions. In a
randomized, double-blind, cross-over design, 27 healthy male participants self-
administered a nasal spray of either oxytocin (24 IU) or placebo. At very early latencies
(40-60ms), oxytocin reduced right-temporal responses to fearful faces (d = .51), and
central responses to both fearful (d = .48) and neutral faces (d = .54). At left occipito-
temporal electrode sites, oxytocin decreased P100 reactivity to fearful expressions (d =
0.72). At later stages of visual processing, oxytocin decreased the amplitudes of the
vertex positive potential (140-180ms) and late positive potential (400-600ms),
regardless of whether the faces had fearful, happy or neutral expressions. These results
suggest that at early stages of visual processing, oxytocin modulates responses to facial
emotions, whereas at later stages of visual processing, it appears to influence more
general face processing mechanisms.
122
6.3 Introduction The neuropeptide oxytocin (OXT) is most commonly known for its powerful
role in childbirth and mother-infant bonding, but has also shown to have a crucial role
in modulating complex social behaviours in humans (Bartz & Hollander, 2008; Meyer-
Lindenberg, 2008; Meyer-Lindenberg, Domes, Kirsch, & Heinrichs, 2011). Some
authors have argued that this modulation can be traced to the effects of OXT on sensory
processing of affective cues (Domes et al., 2007). The amygdala plays an important role
in processing social stimuli (Adolphs, 2008; LeDoux, 1998). Early amygdala responses
to affective stimuli appear to be automatic, and do not require awareness, whereas later
responses are modulated by attention and are more highly tuned for behaviourally
relevant input (Adolphs, 2008; Anderson, Christoff, Panitz, De Rosa, & Gabrieli, 2003).
Functional imaging studies have shown that intranasal OXT administration can suppress
amygdala responses to fearful and happy faces (Domes et al., 2007; Kirsch et al., 2005),
and influence functional connectivity between the amygdala and the superior colliculus
(Gamer, Zurowski, & Büchel, 2010) and frontal cortex (Sripada et al., 2012). Intranasal
OXT has also been shown to improve recognition of facial emotions (Lischke et al.,
2012; Marsh, Henry, Pine, & Blair, 2010; Schulze et al., 2011). Interestingly, intranasal
OXT normalizes amygdala responses to affective faces in groups with generalized
social anxiety disorder and autism (Domes, Heinrichs, et al., 2013; Domes, Kumbier,
Heinrichs, & Herpertz, 2014; Labuschagne et al., 2010).
Due to the limited temporal resolution of fMRI, it is unclear whether OXT
primarily influences affective processing at early or late stages of the visual hierarchy.
Other techniques, such as visual evoked potentials (VEPs) have been applied to
investigate the timing of affective processing (Hajcak, Dunning, & Foti, 2009; Pourtois,
Schettino, & Vuilleumier, 2013). The visual P100 is a fast response that typically peaks
between 80 and 120ms, and appears to originate from striate and extrastriate neural
generators (Allison, Puce, Spencer, & McCarthy, 1999; Clark & Hillyard, 1996).
Several studies have shown that P100 responses are influenced by the perceptual
processing of facial expressions, with greater amplitudes in response to viewing fearful
and happy faces than to neutral faces (Batty & Taylor, 2003; Vlamings, Goffaux, &
Kemner, 2009). There is also evidence that viewing of facial emotions influences EEG
and MEG activity even prior to the P100, as early as 40-60ms post stimulus
123
presentation (Liu & Ioannides, 2010; Morel, Beaucousin, Perrin, & George, 2012;
Morel, Ponz, Mercier, Vuilleumier, & George, 2009).
The N170 and the vertex positive potential (VPP) are responses that occur
between 140 and 190ms, over right occipito-temporal and central sensors, respectively
(Henson et al., 2003; Joyce & Rossion, 2005; Vlamings et al., 2009). Both the
negativity and positivity reflect configural face processing, with greater responses to
faces than objects, and to upright than inverted faces (Bentin, Allison, Puce, Perez, &
McCarthy, 1996; Joyce & Rossion, 2005). While these responses are sensitive to
emotion, some evidence suggests their amplitudes are modulated by emotional
intensity, rather than valence (Luo, Feng, He, Wang, & Luo, 2010). Although the
literature has treated the N170 and VPP as two separate components, there is some
evidence to suggest they are two sides of the same generator (Joyce & Rossion, 2005).
The late positive potential (LPP) is a centrally generated, positive potential that
begins 300 to 400ms after stimulus presentation and continues for several hundred
milliseconds (Crites, Cacioppo, Gardner, & Berntson, 1995). Previous studies have
shown that LPP amplitudes are greater for both pleasant and unpleasant stimuli than for
neutral stimuli (Hajcak et al., 2009; Pastor et al., 2008). LPP amplitudes appear to
reflect both automatic capture of attention, and goal-directed attention towards
motivationally relevant stimuli (Hajcak et al., 2009).
There have not been many VEP studies into the effects of OXT administration
on affective processing (reviewed, Wigton et al., 2015). In a sample of healthy females,
Huffmeijer et al. (2013) investigated the effects of OXT administration on VPP and
LPP responses to happy and disgusted faces, which were presented as performance cues
in a flanker task. OXT increased VPP and LPP amplitudes, regardless of the emotional
valence of the faces. However, the study did not include a neutral face condition, so it is
unclear whether these results specifically reflect modulation of affective processing, or
face processing mechanisms in general. Althaus et al. (2015) compared the effects of
intranasal OXT on LPP responses to positive, negative and neutral scenes in males with
functioning autism and a healthy male control group. There were no effects of OXT for
either group; however, they found some effects of OXT on LPP responses to scenes
featuring people, but only for healthy participants with high sensitivity to punishment,
and for autistic participants with high blood plasma levels of OXT at baseline (Althaus
et al., 2016). Differences in the effects of OXT on affective processing for these two
124
studies (Althaus et al., 2015; Huffmeijer et al., 2013) may be due to the fact that OXT
has a greater modulatory influence on amygdala responses to faces than to scenes
(Kirsch et al., 2005).
To our knowledge, no previous studies have investigated the effects of OXT
administration on the early visual responses to affective faces. We therefore compared
early and late VEP responses to neutral, fearful and happy faces after the administration
of nasal sprays containing OXT or a placebo. Previous studies have shown that OXT
administration does not influence P100 or N170 responses to non-affective face stimuli
(Herzmann, Bird, Freeman, & Curran, 2013; Rutherford et al., 2017). However, based
on evidence that OXT administration inhibits amygdala reactivity to fearful and happy
faces (Domes et al., 2007), we hypothesized that it would reduce the effects of facial
emotion processing on early (40-60ms), P100, N170 and VPP responses. Later
potentials (LPP) are influence by both stimulus salience and goal directed attention
(Hajcak et al., 2009), and therefore it was unclear whether OXT would enhance or
diminish the effects of facial emotion processing on LPP amplitudes. We also
investigated whether individual differences in trait-level autism and social anxiety may
influences the effects of OXT on VEP responses.
6.4 Methods
6.4.1 Participants
A power analysis, calculated using G*Power (Faul, Erdfelder, Lang, & Buchner,
2007), indicated that a sample of 27 participants is adequate to detect a mean difference
ERP responses between the OXT and placebo sessions, with α = 0.05, β = 0.80, and
moderate effect size (Cohen’s d = 0.5). 27 healthy males aged 18 to 40 (24 right
handed, M = 25.22 years, SD = 4.72 years), gave written informed consent for the
experiment, which was conducted with the approval of the Australian Catholic
University Human Research Ethics Committee and in accordance with the code of
ethics of the Declaration of Helsinki. One additional participant completed the placebo
session, but did not return for the oxytocin session and hence his results were excluded
from the analysis. The happy facial expression condition was not added to the protocol
until after the first four participants had completed the experiment, so we only have data

125
for 23 participants in this condition. People who regularly used other nasal sprays were
not invited to participate in the study.
6.4.2 Questionnaires
Prior to attending the lab sessions, participants completed online versions of
several scales. For the online emotion recognition test (Labuschagne et al., 2013),
participants reported the emotion (anger, disgust, fear, happiness, sadness, and surprise)
of 60 faces from the Ekman and Friesen face set (Ekman & Friesen, 1976). The Autism
Spectrum Quotient (AQ) (Baron-Cohen, Wheelwright, Skinner, Martin, & Clubley,
2001) measures autistic personality traits, with higher scores indicating higher levels of
trait autism (range, 0–50). The Social Interaction Anxiety Scale (SIAS) (Mattick &
Clarke, 1998) was used to measure social anxiety, with higher scores indicating a
greater degree of social anxiety (range, 0–80). The State-Trait Anxiety Inventory
(Spielberger, 2010) was administered to measure state anxiety prior to nasal spray
administration (STAIpre), and the change in state anxiety by the end of the session
(STAIchange). State anxiety results from this sample are reported in more detail in Part 2
(Hugrass & Crewther, Submitted for Publication). In short, STAIchange was not
significantly affected by OXT or PBO administration so this variable was redundant,
and it was not included in the current analyses. We entered STAIpre as a covariate in the
preliminary models, to test whether subjective reports of state anxiety may influence the
results.
6.4.3 Facial emotion VEP task
The task was created using VPixx software (version 3.20,
http://www.VPixx.com), and presented using a DATAPixx display driver and a
Viewsonic LCD monitor (60Hz, 1024 x 768 pixel resolution) with linearized colour
output (as measured with a ColorCal II – Cambridge Research Systems). Seven face
identities (3 female) were selected from the Nimstim Face Set (Tottenham et al., 2009)
with neutral, fearful and happy expressions (all with closed mouths, to minimise low-
level differences between the stimuli). The images were converted to greyscale, the
external features (hair, neck and ears) were removed, and the luminance and root mean
square contrast were equated using a custom Matlab script (The Mathworks, Natick,
MA). The stimuli were presented within a 20 × 19.5 degree mid-grey frame (47 cd/m2)
on a grey background (65 cd/m2).

126
Participants were seated 70 cm in front of the display. A phase-scrambled
neutral face (luminance and RMS contrast matched with the test stimuli) was presented
during the baseline period (1800ms), followed by the target face (500ms), and a central
fixation cross. After the face disappeared, participants used a RESPONSEPixx button
box to report whether the expression was fearful (right button), neutral (top button) or
happy (left button). Participants were told that this was not a speeded task, and were
instructed to respond as accurately as possible. In total, there were 240 trials (80
replications each, for the fearful, neutral and happy faces). To prevent fatigue, the task
was divided into two blocks of 120 trials, with a self-timed break in between blocks.
6.4.4 Procedure
Participants attended the laboratory twice, with at least a one-week washout
period in between sessions. Participants were asked on the day of testing to confirm that
they are not suffering from illness or congestion. Participants were instructed not to
drink alcohol on the night before their session, to refrain from drinking caffeine on the
day of their session, and to refrain from eating or drinking (except for water) within an
hour of their session. The order of treatment conditions was counterbalanced across
participants. The spray bottles were relabelled so that neither the experimenters nor
participants were aware of which spray bottle contained the oxytocin. Participants self-
administered OXT (24 IU) or placebo sprays (PBO, containing all ingredients except for
the peptide). Participants were given standardised instructions for how to administer the
sprays, as per the recommended guidelines (Guastella et al., 2013). Spray bottles were
first primed by puffing three sprays into the air, then participants inhaled a full spray in
one nostril (4 IU), and waited 45s before inhaling a full spray into the opposite nostril.
This was repeated until they had made three sprays per nostril. The facial emotion VEP
task commenced at approximately 45 minutes after the last spray application (OXT: M=
43.81, SD= 4.00, PBO: M = 44.37, SD= 2.99).
6.4.5 EEG recording and pre-processing
EEG was recorded using a 64-channel cap (Neuroscan, Compumedics). The data
were sampled at 1KHz and band-pass filtered from 0.1-200Hz. The ground electrode
was positioned at AFz and linked mastoid electrodes were used as a reference. EOG
was monitored using electrodes attached above and below one eye. Data were processed
using Brainstorm (Tadel, Baillet, Mosher, Pantazis, & Leahy, 2011), which is
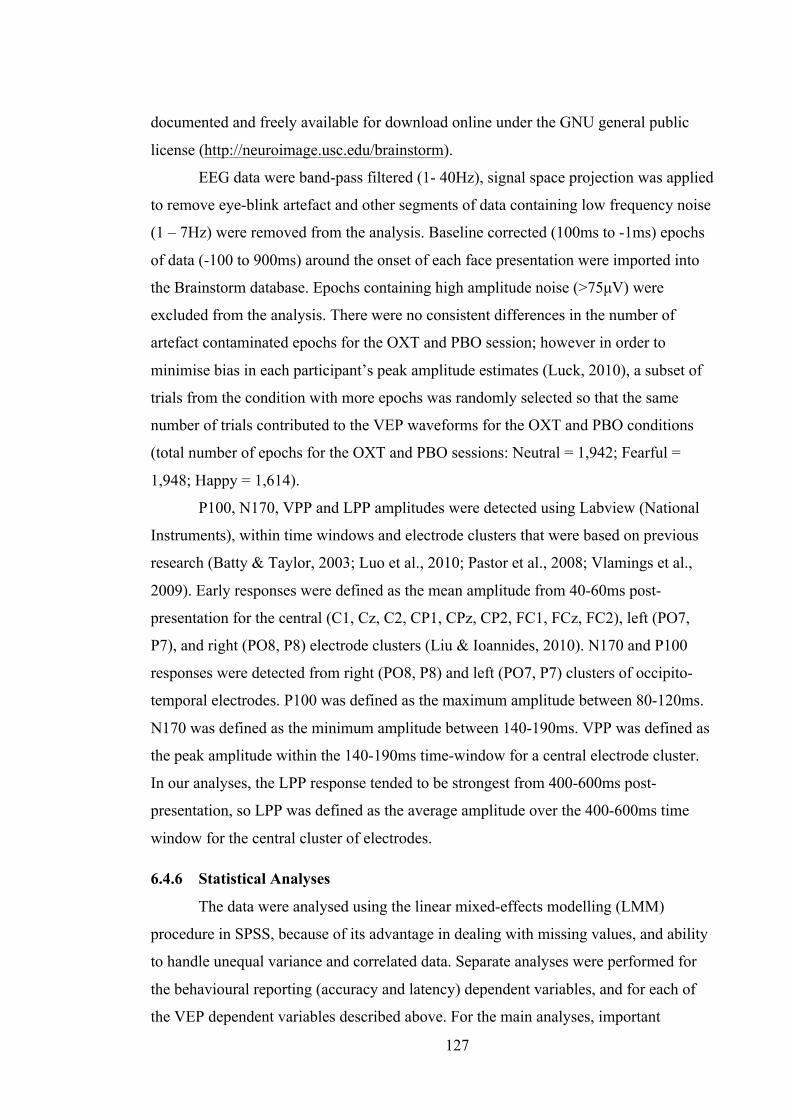
127
documented and freely available for download online under the GNU general public
license (http://neuroimage.usc.edu/brainstorm).
EEG data were band-pass filtered (1- 40Hz), signal space projection was applied
to remove eye-blink artefact and other segments of data containing low frequency noise
(1 – 7Hz) were removed from the analysis. Baseline corrected (100ms to -1ms) epochs
of data (-100 to 900ms) around the onset of each face presentation were imported into
the Brainstorm database. Epochs containing high amplitude noise (>75µV) were
excluded from the analysis. There were no consistent differences in the number of
artefact contaminated epochs for the OXT and PBO session; however in order to
minimise bias in each participant’s peak amplitude estimates (Luck, 2010), a subset of
trials from the condition with more epochs was randomly selected so that the same
number of trials contributed to the VEP waveforms for the OXT and PBO conditions
(total number of epochs for the OXT and PBO sessions: Neutral = 1,942; Fearful =
1,948; Happy = 1,614).
P100, N170, VPP and LPP amplitudes were detected using Labview (National
Instruments), within time windows and electrode clusters that were based on previous
research (Batty & Taylor, 2003; Luo et al., 2010; Pastor et al., 2008; Vlamings et al.,
2009). Early responses were defined as the mean amplitude from 40-60ms post-
presentation for the central (C1, Cz, C2, CP1, CPz, CP2, FC1, FCz, FC2), left (PO7,
P7), and right (PO8, P8) electrode clusters (Liu & Ioannides, 2010). N170 and P100
responses were detected from right (PO8, P8) and left (PO7, P7) clusters of occipito-
temporal electrodes. P100 was defined as the maximum amplitude between 80-120ms.
N170 was defined as the minimum amplitude between 140-190ms. VPP was defined as
the peak amplitude within the 140-190ms time-window for a central electrode cluster.
In our analyses, the LPP response tended to be strongest from 400-600ms post-
presentation, so LPP was defined as the average amplitude over the 400-600ms time
window for the central cluster of electrodes.
6.4.6 Statistical Analyses
The data were analysed using the linear mixed-effects modelling (LMM)
procedure in SPSS, because of its advantage in dealing with missing values, and ability
to handle unequal variance and correlated data. Separate analyses were performed for
the behavioural reporting (accuracy and latency) dependent variables, and for each of
the VEP dependent variables described above. For the main analyses, important
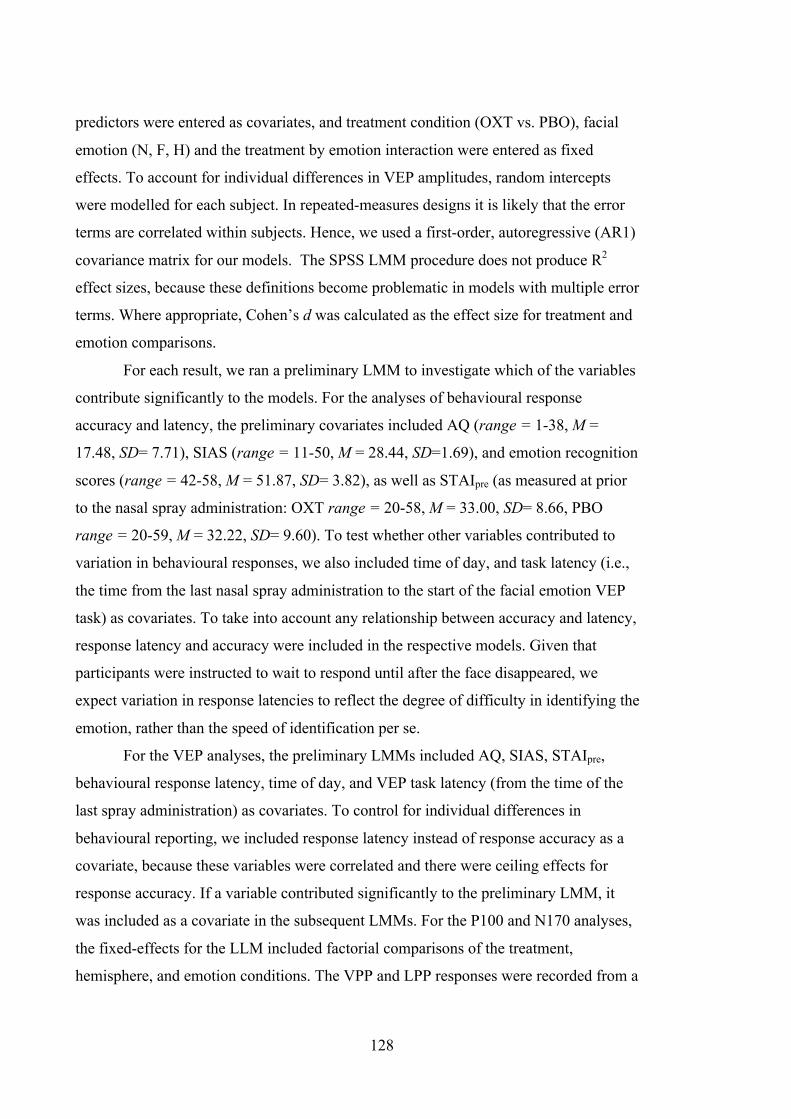
128
predictors were entered as covariates, and treatment condition (OXT vs. PBO), facial
emotion (N, F, H) and the treatment by emotion interaction were entered as fixed
effects. To account for individual differences in VEP amplitudes, random intercepts
were modelled for each subject. In repeated-measures designs it is likely that the error
terms are correlated within subjects. Hence, we used a first-order, autoregressive (AR1)
covariance matrix for our models. The SPSS LMM procedure does not produce R2
effect sizes, because these definitions become problematic in models with multiple error
terms. Where appropriate, Cohen’s d was calculated as the effect size for treatment and
emotion comparisons.
For each result, we ran a preliminary LMM to investigate which of the variables
contribute significantly to the models. For the analyses of behavioural response
accuracy and latency, the preliminary covariates included AQ (range = 1-38, M =
17.48, SD= 7.71), SIAS (range = 11-50, M = 28.44, SD=1.69), and emotion recognition
scores (range = 42-58, M = 51.87, SD= 3.82), as well as STAIpre (as measured at prior
to the nasal spray administration: OXT range = 20-58, M = 33.00, SD= 8.66, PBO
range = 20-59, M = 32.22, SD= 9.60). To test whether other variables contributed to
variation in behavioural responses, we also included time of day, and task latency (i.e.,
the time from the last nasal spray administration to the start of the facial emotion VEP
task) as covariates. To take into account any relationship between accuracy and latency,
response latency and accuracy were included in the respective models. Given that
participants were instructed to wait to respond until after the face disappeared, we
expect variation in response latencies to reflect the degree of difficulty in identifying the
emotion, rather than the speed of identification per se.
For the VEP analyses, the preliminary LMMs included AQ, SIAS, STAIpre,
behavioural response latency, time of day, and VEP task latency (from the time of the
last spray administration) as covariates. To control for individual differences in
behavioural reporting, we included response latency instead of response accuracy as a
covariate, because these variables were correlated and there were ceiling effects for
response accuracy. If a variable contributed significantly to the preliminary LMM, it
was included as a covariate in the subsequent LMMs. For the P100 and N170 analyses,
the fixed-effects for the LLM included factorial comparisons of the treatment,
hemisphere, and emotion conditions. The VPP and LPP responses were recorded from a
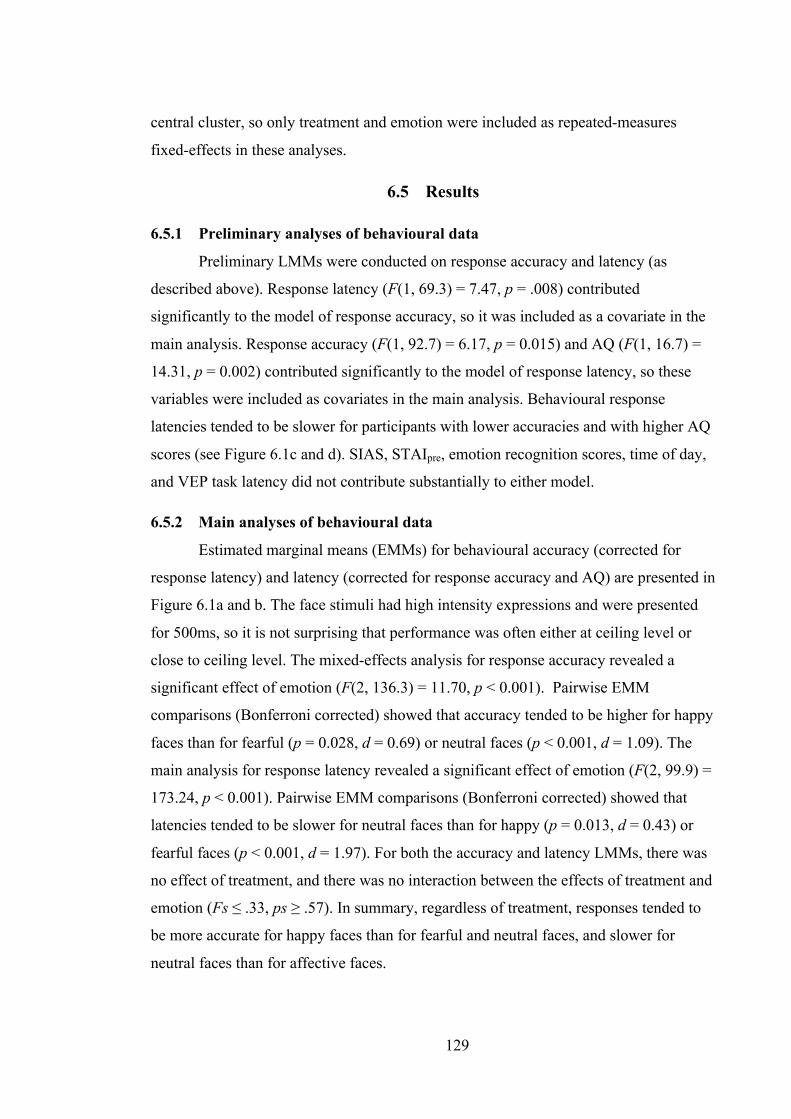
129
central cluster, so only treatment and emotion were included as repeated-measures
fixed-effects in these analyses.
6.5 Results
6.5.1 Preliminary analyses of behavioural data
Preliminary LMMs were conducted on response accuracy and latency (as
described above). Response latency (F(1, 69.3) = 7.47, p = .008) contributed
significantly to the model of response accuracy, so it was included as a covariate in the
main analysis. Response accuracy (F(1, 92.7) = 6.17, p = 0.015) and AQ (F(1, 16.7) =
14.31, p = 0.002) contributed significantly to the model of response latency, so these
variables were included as covariates in the main analysis. Behavioural response
latencies tended to be slower for participants with lower accuracies and with higher AQ
scores (see Figure 6.1c and d). SIAS, STAIpre, emotion recognition scores, time of day,
and VEP task latency did not contribute substantially to either model.
6.5.2 Main analyses of behavioural data
Estimated marginal means (EMMs) for behavioural accuracy (corrected for
response latency) and latency (corrected for response accuracy and AQ) are presented in
Figure 6.1a and b. The face stimuli had high intensity expressions and were presented
for 500ms, so it is not surprising that performance was often either at ceiling level or
close to ceiling level. The mixed-effects analysis for response accuracy revealed a
significant effect of emotion (F(2, 136.3) = 11.70, p < 0.001). Pairwise EMM
comparisons (Bonferroni corrected) showed that accuracy tended to be higher for happy
faces than for fearful (p = 0.028, d = 0.69) or neutral faces (p < 0.001, d = 1.09). The
main analysis for response latency revealed a significant effect of emotion (F(2, 99.9) =
173.24, p < 0.001). Pairwise EMM comparisons (Bonferroni corrected) showed that
latencies tended to be slower for neutral faces than for happy (p = 0.013, d = 0.43) or
fearful faces (p < 0.001, d = 1.97). For both the accuracy and latency LMMs, there was
no effect of treatment, and there was no interaction between the effects of treatment and
emotion (Fs ≤ .33, ps ≥ .57). In summary, regardless of treatment, responses tended to
be more accurate for happy faces than for fearful and neutral faces, and slower for
neutral faces than for affective faces.
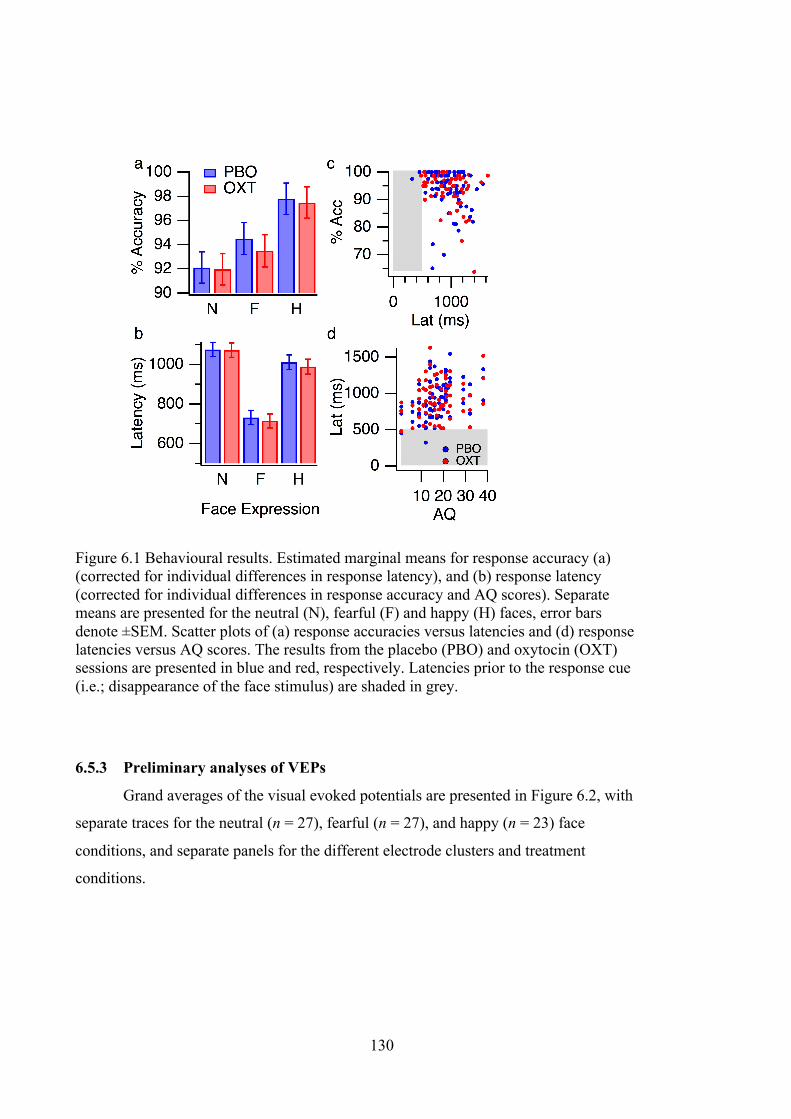
130
Figure 6.1 Behavioural results. Estimated marginal means for response accuracy (a) (corrected for individual differences in response latency), and (b) response latency (corrected for individual differences in response accuracy and AQ scores). Separate means are presented for the neutral (N), fearful (F) and happy (H) faces, error bars denote ±SEM. Scatter plots of (a) response accuracies versus latencies and (d) response latencies versus AQ scores. The results from the placebo (PBO) and oxytocin (OXT) sessions are presented in blue and red, respectively. Latencies prior to the response cue (i.e.; disappearance of the face stimulus) are shaded in grey.
6.5.3 Preliminary analyses of VEPs
Grand averages of the visual evoked potentials are presented in Figure 6.2, with
separate traces for the neutral (n = 27), fearful (n = 27), and happy (n = 23) face
conditions, and separate panels for the different electrode clusters and treatment
conditions.
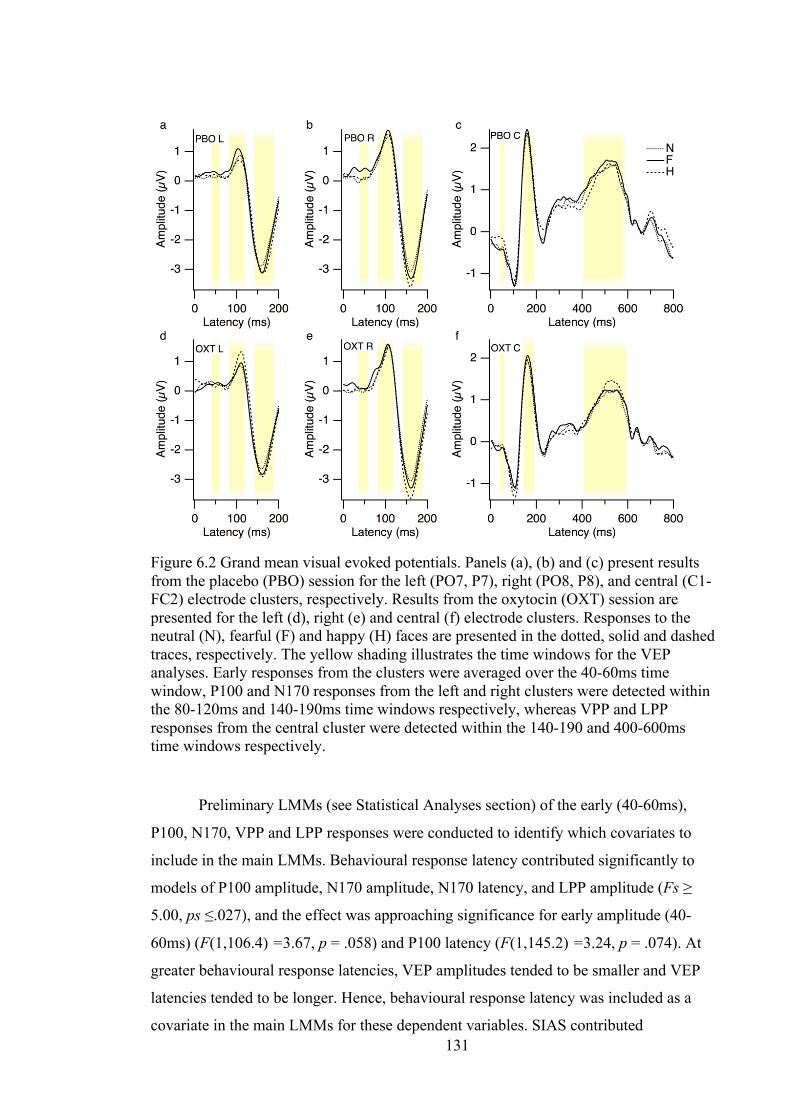
131
Figure 6.2 Grand mean visual evoked potentials. Panels (a), (b) and (c) present results from the placebo (PBO) session for the left (PO7, P7), right (PO8, P8), and central (C1-FC2) electrode clusters, respectively. Results from the oxytocin (OXT) session are presented for the left (d), right (e) and central (f) electrode clusters. Responses to the neutral (N), fearful (F) and happy (H) faces are presented in the dotted, solid and dashed traces, respectively. The yellow shading illustrates the time windows for the VEP analyses. Early responses from the clusters were averaged over the 40-60ms time window, P100 and N170 responses from the left and right clusters were detected within the 80-120ms and 140-190ms time windows respectively, whereas VPP and LPP responses from the central cluster were detected within the 140-190 and 400-600ms time windows respectively.
Preliminary LMMs (see Statistical Analyses section) of the early (40-60ms),
P100, N170, VPP and LPP responses were conducted to identify which covariates to
include in the main LMMs. Behavioural response latency contributed significantly to
models of P100 amplitude, N170 amplitude, N170 latency, and LPP amplitude (Fs ≥
5.00, ps ≤.027), and the effect was approaching significance for early amplitude (40-
60ms) (F(1,106.4) =3.67, p = .058) and P100 latency (F(1,145.2) =3.24, p = .074). At
greater behavioural response latencies, VEP amplitudes tended to be smaller and VEP
latencies tended to be longer. Hence, behavioural response latency was included as a
covariate in the main LMMs for these dependent variables. SIAS contributed

132
significantly to the model of early amplitudes for the central cluster (F(1,21.3) =5.32, p
= .031); those with higher social anxiety tended to have stronger, central negativities
during the 40-60ms time window. AQ contributed significantly to the preliminary
LMM of N170 amplitudes (F(1,22.6) =8.92, p = .007), with amplitudes tending to be
higher in those with high AQ. Hence, AQ was included as a covariate in the main N170
amplitude LMM. STAIpre, time of day and task latency did not contribute to any of the
preliminary analyses, nor was there any evidence that they interacted with the effects of
treatment, so these variables were not included in the main LMMs.
6.5.4 Early effects (40-60ms)
We observed some very early effects of OXT administration. The VEP
topographies and EMMs of amplitudes (averaged over the 40-60ms time window) are
presented in Figure 6.3. We performed separate LMMs on these early amplitudes for the
left, right and central electrode clusters. There were no effects of emotion or treatment
on the left cluster amplitudes (Fs ≤ 1.04, ps ≥ .36). The effect of treatment was
significant for the central cluster (F(1, 44.9) = 8.99, p = 0.004), and the effect of
emotion was approaching significance for the right cluster (F(2, 98.5) = 2.85, p =
0.063). Paired samples comparisons of the EMMs (Bonferroni corrected) revealed that
for the right cluster, early responses to fearful faces were significantly reduced after
OXT administration (p = 0.048, d = .51). For the central cluster, early responses to
fearful (p = 0.013, d = .48) and neutral (p = 0.005, d = .54) faces were significantly
reduced after OXT administration.
Although the preliminary analyses showed that SIAS contributed significantly to
the model for the central cluster, a follow-up analysis showed that it did not contribute
significantly to the main analysis, nor was there any SIAS by treatment interaction (Fs ≤
2.5, ps ≥ .13).
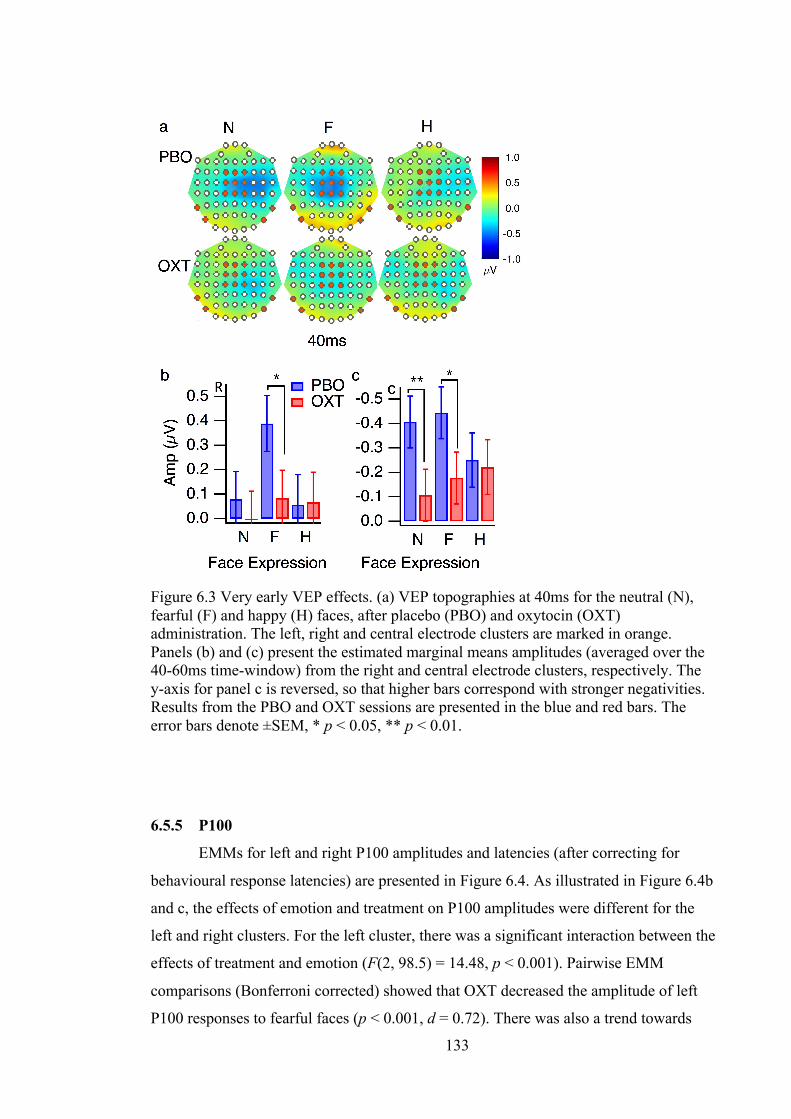
133
Figure 6.3 Very early VEP effects. (a) VEP topographies at 40ms for the neutral (N), fearful (F) and happy (H) faces, after placebo (PBO) and oxytocin (OXT) administration. The left, right and central electrode clusters are marked in orange. Panels (b) and (c) present the estimated marginal means amplitudes (averaged over the 40-60ms time-window) from the right and central electrode clusters, respectively. The y-axis for panel c is reversed, so that higher bars correspond with stronger negativities. Results from the PBO and OXT sessions are presented in the blue and red bars. The error bars denote ±SEM, * p < 0.05, ** p < 0.01.
6.5.5 P100
EMMs for left and right P100 amplitudes and latencies (after correcting for
behavioural response latencies) are presented in Figure 6.4. As illustrated in Figure 6.4b
and c, the effects of emotion and treatment on P100 amplitudes were different for the
left and right clusters. For the left cluster, there was a significant interaction between the
effects of treatment and emotion (F(2, 98.5) = 14.48, p < 0.001). Pairwise EMM
comparisons (Bonferroni corrected) showed that OXT decreased the amplitude of left
P100 responses to fearful faces (p < 0.001, d = 0.72). There was also a trend towards
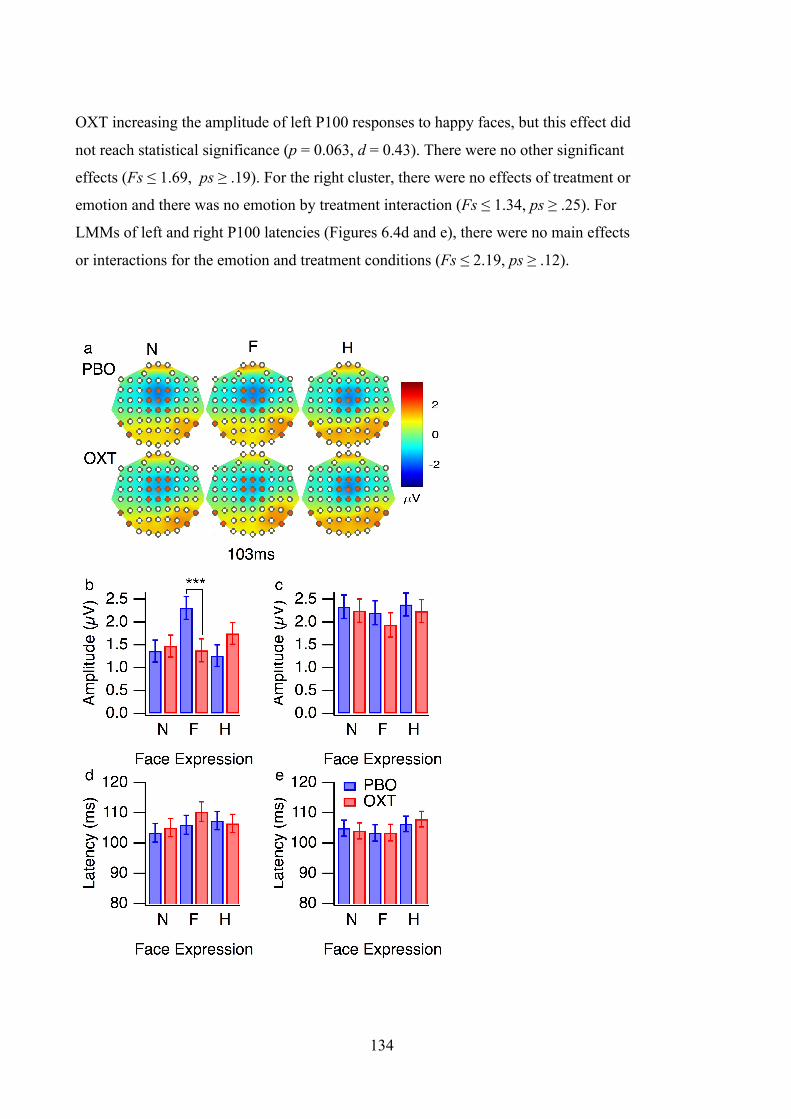
134
OXT increasing the amplitude of left P100 responses to happy faces, but this effect did
not reach statistical significance (p = 0.063, d = 0.43). There were no other significant
effects (Fs ≤ 1.69, ps ≥ .19). For the right cluster, there were no effects of treatment or
emotion and there was no emotion by treatment interaction (Fs ≤ 1.34, ps ≥ .25). For
LMMs of left and right P100 latencies (Figures 6.4d and e), there were no main effects
or interactions for the emotion and treatment conditions (Fs ≤ 2.19, ps ≥ .12).

135
Figure 6.4 P100 results. (a) VEP topographies at 103ms for the neutral (N), fearful (F) and happy (H) faces, after placebo (PBO) and oxytocin (OXT) administration. The left, right and central electrode clusters are marked in orange. Estimated marginal means for (b) left P100 amplitude, (c) right P100 amplitude, (d) left P100 latency and (e) right P100 latency in response to neutral (N), fearful (F), and happy (H) faces. The estimated marginal means are corrected for individual differences in response latency. The results from the placebo (PBO) and oxytocin (OXT) sessions are presented in the blue and red bars. The error bars denote ±SEM, *** p < 0.001.
In summary, OXT administration modulates the effects of facial emotion on
P100 amplitudes from electrodes over left occipito-temporal regions. It decreases P100
amplitudes for fearful faces and it may also increase P100 amplitudes for happy faces.
However, it does not appear to influence right P100 amplitudes or P100 latencies from
either hemisphere.
6.5.6 N170 and VPP
N170 and VPP topographies are presented in Figure 6.5a, and EMMs for the
amplitudes and latencies are presented in Figures 6.5b-g. Emotion contributed
significantly to the LMM of right N170 amplitudes (F(2, 121.0) = 4.55, p = 0.012).
Pairwise EMM comparisons (Bonferroni corrected) showed that right N170 amplitudes
were greater (i.e., more negative) for happy faces than neutral faces (p = .010, d =0.26).
The AQ and behavioural response latency covariates contributed significantly to the
model of left N170 amplitudes (Fs ≥ 6.00, ps ≤ .022), with greater amplitudes for longer
behavioural response latencies and greater AQ scores. A follow-up analysis did not
reveal any interactions between AQ and treatment. There were no other significant main
effects or treatment by emotion interactions for the left or right N170 LMMs (Fs ≤ 1.55,
ps ≥ .22).
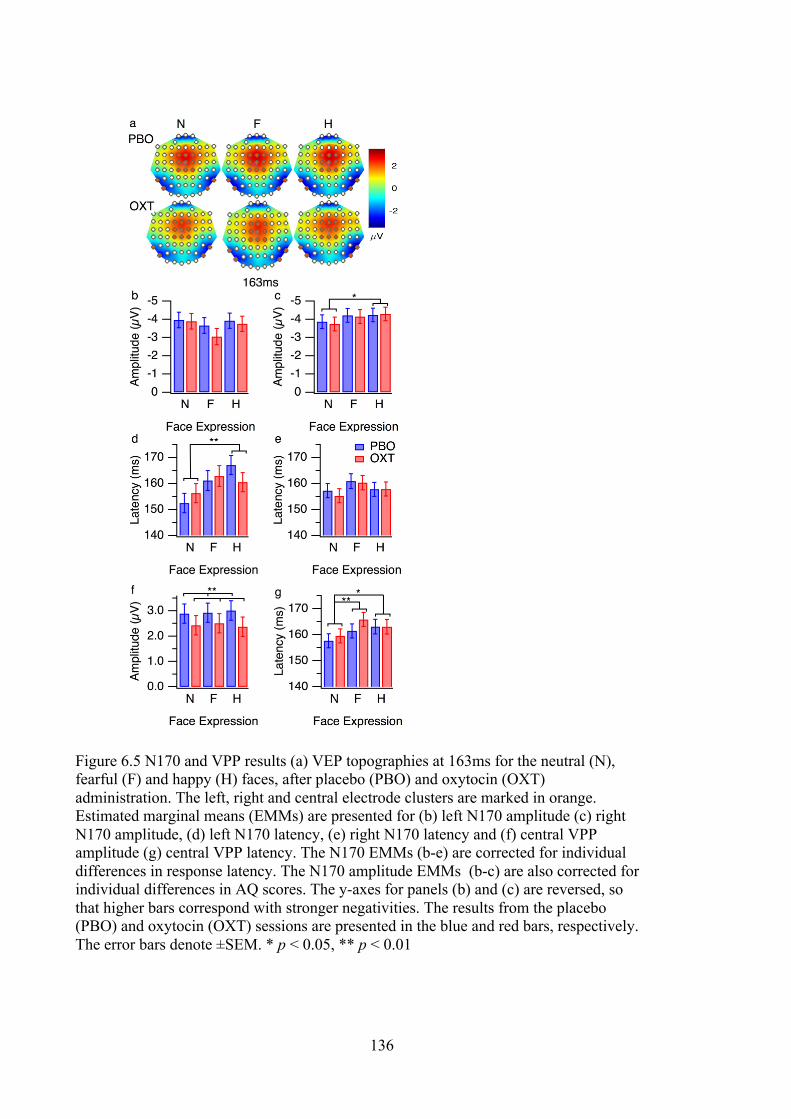
136
Figure 6.5 N170 and VPP results (a) VEP topographies at 163ms for the neutral (N), fearful (F) and happy (H) faces, after placebo (PBO) and oxytocin (OXT) administration. The left, right and central electrode clusters are marked in orange. Estimated marginal means (EMMs) are presented for (b) left N170 amplitude (c) right N170 amplitude, (d) left N170 latency, (e) right N170 latency and (f) central VPP amplitude (g) central VPP latency. The N170 EMMs (b-e) are corrected for individual differences in response latency. The N170 amplitude EMMs (b-c) are also corrected for individual differences in AQ scores. The y-axes for panels (b) and (c) are reversed, so that higher bars correspond with stronger negativities. The results from the placebo (PBO) and oxytocin (OXT) sessions are presented in the blue and red bars, respectively. The error bars denote ±SEM. * p < 0.05, ** p < 0.01
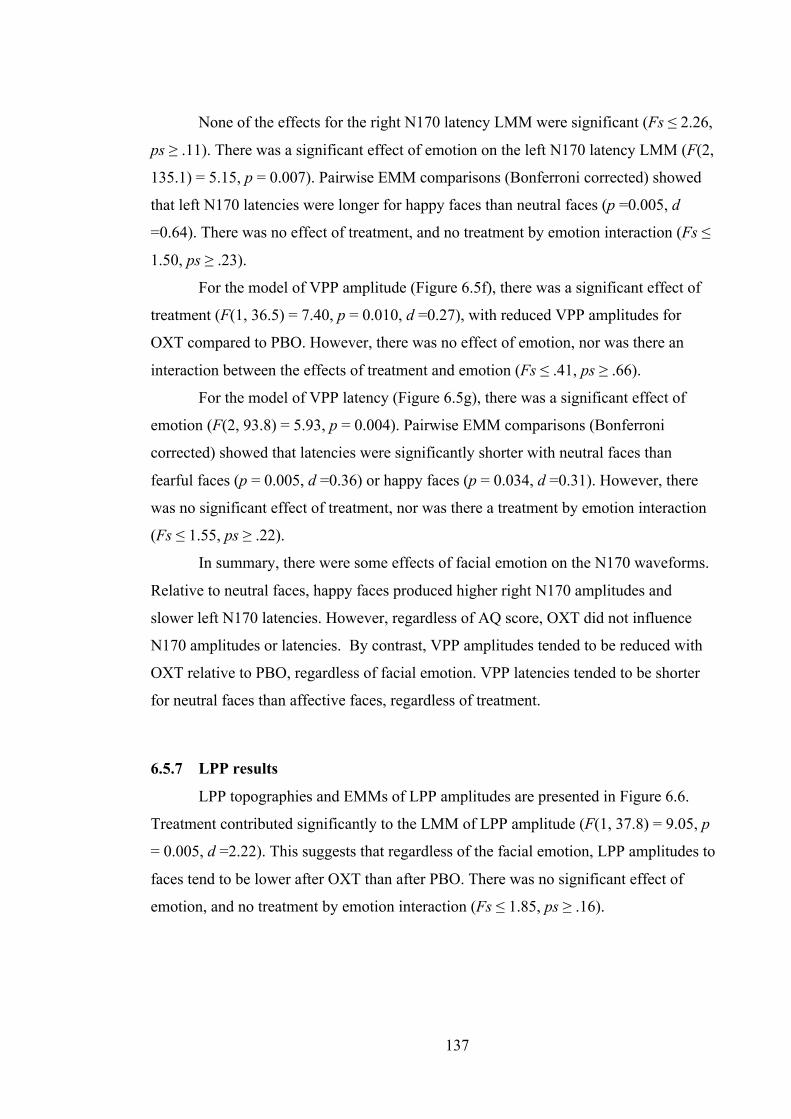
137
None of the effects for the right N170 latency LMM were significant (Fs ≤ 2.26,
ps ≥ .11). There was a significant effect of emotion on the left N170 latency LMM (F(2,
135.1) = 5.15, p = 0.007). Pairwise EMM comparisons (Bonferroni corrected) showed
that left N170 latencies were longer for happy faces than neutral faces (p =0.005, d
=0.64). There was no effect of treatment, and no treatment by emotion interaction (Fs ≤
1.50, ps ≥ .23).
For the model of VPP amplitude (Figure 6.5f), there was a significant effect of
treatment (F(1, 36.5) = 7.40, p = 0.010, d =0.27), with reduced VPP amplitudes for
OXT compared to PBO. However, there was no effect of emotion, nor was there an
interaction between the effects of treatment and emotion (Fs ≤ .41, ps ≥ .66).
For the model of VPP latency (Figure 6.5g), there was a significant effect of
emotion (F(2, 93.8) = 5.93, p = 0.004). Pairwise EMM comparisons (Bonferroni
corrected) showed that latencies were significantly shorter with neutral faces than
fearful faces (p = 0.005, d =0.36) or happy faces (p = 0.034, d =0.31). However, there
was no significant effect of treatment, nor was there a treatment by emotion interaction
(Fs ≤ 1.55, ps ≥ .22).
In summary, there were some effects of facial emotion on the N170 waveforms.
Relative to neutral faces, happy faces produced higher right N170 amplitudes and
slower left N170 latencies. However, regardless of AQ score, OXT did not influence
N170 amplitudes or latencies. By contrast, VPP amplitudes tended to be reduced with
OXT relative to PBO, regardless of facial emotion. VPP latencies tended to be shorter
for neutral faces than affective faces, regardless of treatment.
6.5.7 LPP results
LPP topographies and EMMs of LPP amplitudes are presented in Figure 6.6.
Treatment contributed significantly to the LMM of LPP amplitude (F(1, 37.8) = 9.05, p
= 0.005, d =2.22). This suggests that regardless of the facial emotion, LPP amplitudes to
faces tend to be lower after OXT than after PBO. There was no significant effect of
emotion, and no treatment by emotion interaction (Fs ≤ 1.85, ps ≥ .16).
138
Figure 6.6 LPP results. (a) LPP topographies at 540ms for the neutral (N), fearful (F) and happy (H) faces, after placebo (PBO) and oxytocin (OXT) administration. (b) Estimated marginal means for LPP amplitude (corrected for behavioural response latency). The results from the placebo (PBO) and oxytocin (OXT) sessions are presented in the blue and red bars, respectively. The error bars denote ±SEM, ** p < 0.01.
6.6 Discussion To our knowledge, this is the first study to report modulation of early VEP
responses to facial emotion after OXT administration. We found that OXT
administration diminished the effects of facial emotion on early VEP amplitudes. After
PBO treatment, central VEP amplitudes from 40-60ms discriminated between happy
expressions and fearful or neutral expressions, whereas early right (40-60ms) and later
left P100 amplitudes discriminated between fearful expressions and neutral or happy
expressions. The latencies and topographies of these early effects are broadly consistent
with the existing EEG and MEG literature (Liu & Ioannides, 2010; Morel et al., 2012;
Morel et al., 2009). Affective discrimination at these early latencies is unlikely to rely
on the geniculo-cortical visual processing route; rather it is thought to reflect a fast
subcortical route to the amygdala, via the superior colliculus and pulvinar (Liddell et al.,
139
2005; Vuilleumier, Armony, Driver, & Dolan, 2001). The decrease in early VEP
responses to facial affect after OXT administration are interesting in light of
psychophysical evidence that OXT improves recognition of briefly (18-53ms) presented
happy and angry faces (Schulze et al., 2011). Taken together, these results support the
theory that OXT modulates the salience of social cues at very early, automatic stages of
affective processing (Bartz, Zaki, Bolger, & Ochsner, 2011; Ebitz, Watson, & Platt,
2013).
The effects of OXT on left posterior P100 amplitudes depended on facial
emotion, with reduced amplitudes for fearful faces and a trend towards increased
amplitudes for happy faces. Consistent with previous studies that only used non-
affective face stimuli (Herzmann et al., 2013), OXT did not influence P100 responses to
faces with neutral expressions. We did not observe any effects of OXT on P100
amplitudes from right, posterior electrodes. This is surprising because affective
processing of faces tends to be biased towards the right hemisphere (Ley & Bryden,
1979). Studies have shown that different aspects of affective processing involve the left
(Morris et al., 1998; Vuilleumier et al., 2001) or right amygdala (Adolphs, Damasio,
Tranel, & Damasio, 1996; Pegna, Khateb, Lazeyras, & Seghier, 2005). Likewise, acute
OXT administration can modulate right (Domes et al., 2007), left (Domes et al., 2014)
or bilateral (Labuschagne et al., 2010) amygdala reactivity to emotional faces. The
neuromodulatory role of OXT on face processing appears to be more complicated than
one would predict based on a simple right-hemisphere dominated model of emotional
processing.
Despite the fact that N170 and VPP responses occur at the same time, and may
share a common generator (Joyce & Rossion, 2005), we observed differences in the
effects of OXT administration on the two potentials. Across the facial emotion
conditions, VPP amplitudes tended to decrease after OXT administration, whereas
N170 amplitudes were unaffected by treatment condition. Huffmeijer et al. (2013)
found that OXT increased the amplitude of VPP responses to disgusted and happy
faces. They interpreted this finding as evidence that OXT modulates early affective
processing, but their experiment did not include a neutral face condition. Our results
indicate that the effects of OXT administration on VPP responses are not specific to
affective stimuli, and may reflect a more general modulation of face processing.

140
However, even if this is the case, it is unclear why OXT modulated VPP but not N170
responses.
Consistent with our VPP analyses, OXT administration decreased the amplitude
of LPP responses to faces with neutral, fearful and happy expressions. This is contrary
to Huffmeijer et al. (2013), who found that OXT increased the amplitude of VPP and
LPP responses to disgusted and happy faces. It is important to note that Huffmeijer et
al.’s participants were healthy females and ours were healthy males. There are
significant sex differences in brain responses to OXT; fMRI studies have found that
OXT suppresses amygdala reactivity to affective faces in healthy males (Domes et al.,
2007) while enhancing it in healthy females (mid-luteal phase) (Domes et al., 2010).
Future VEP studies that directly compare the timing of affective processing in male and
female participants are required to elucidate potential sex differences in the
neuromodulatory effects of OXT on affective processing.
We did not observe any effects of OXT administration on the accuracy or
latency of emotion identification. In order to evoke strong electrophysiological
responses, our face stimuli had strong emotional intensity, and long presentation
durations (500ms). This meant that identification accuracy was close to ceiling level in
both the PBO and OXT conditions. Previous studies have shown that OXT has greater
effects on emotion identification for face stimuli with low intensity expressions
(Lischke et al., 2012; Marsh et al., 2010) and short presentation durations (i.e., 100ms
cf. 500ms) (Domes, Sibold, et al., 2013). Hence, our results are not necessarily
inconsistent with the literature on the effects of OXT on facial emotion identification.
It is well known that there are individual differences in the effects of OXT on
social processing (Bartz et al., 2011). Previous studies have shown that OXT has
differential effects on neural responses to emotional faces in groups with autism and
generalized social anxiety disorder, relative to healthy control groups (Domes,
Heinrichs, et al., 2013; Labuschagne et al., 2010, 2012). Hence, for our healthy male
sample, we investigated whether differences in autistic traits and social anxiety may
influence the effects of OXT on VEPs. We found that participants with higher levels of
autistic tendency tended to have higher N170 amplitudes, yet we did not find any
evidence to suggest that autistic tendency or social anxiety interacted with the effects of
OXT administration. Although there were wide ranges of AQ and SIAS scores in our
sample (see analysis section), we did not specifically recruit people with extreme
141
scores, i.e; AQ scores greater than 23, which is 1 SD above the population mean
(Ruzich, et al., 2015). Measuring autistic traits in the general population: a systematic
review of the Autism-Spectrum Quotient (AQ) in a nonclinical population sample of
6,900 typical adult males and females. Molecular autism, 6(1), 2.
). Given the small sample size, our study was not sufficiently powerful to detect
weak to moderate correlations, if they exist at the population level. However, previous
studies found that OXT only modulated LPP responses in healthy males with high
sensitivity to punishment, and autistic males with high baseline levels of OXT in their
blood (Althaus et al., 2015; Althaus et al., 2016). This suggests there may be nuanced
individual differences in the effects of OXT on VEPs.
6.7 Conclusions In summary, analysing VEPs enabled us to study the effects of OXT
administration on the early and late stages of affective processing. OXT administration
decreased reactivity to fearful expressions as early as 40-60ms for central and right
electrode clusters, and as early as the P100 for left electrode clusters. It may also
increase left P100 reactivity to happy expressions. By contrast, OXT administration
decreased VPP and LPP amplitudes regardless of facial emotion. Our results indicate
that OXT modulates the salience of social cues at very early stages of visual processing
(Bartz et al., 2011; Ebitz et al., 2013), and that it modulates more general face
processing mechanisms at later stages of visual processing.
6.8 Acknowledgements We are grateful to the undergraduate students who helped to collect the data. LH
and DC were supported by the Australian Research Council (ARC) (150104172). Nasal
sprays were purchased with funding from Swinburne University of Technology and the
Australian Catholic University.
6.9 References Adolphs, R. (2008). Fear, faces, and the human amygdala. Current Opinion in
Neurobiology, 18(2), 166-172. doi:10.1016/j.conb.2008.06.006

142
Adolphs, R., Damasio, H., Tranel, D., & Damasio, A. R. (1996). Cortical systems for
the recognition of emotion in facial expressions. Journal of Neuroscience,
16(23), 7678-7687.
Allison, T., Puce, A., Spencer, D. D., & McCarthy, G. (1999). Electrophysiological
Studies of Human Face Perception. I: Potentials Generated in Occipitotemporal
Cortex by Face and Non-face Stimuli. Cerebral Cortex, 9(5), 415-430.
doi:10.1093/cercor/9.5.415
Althaus, M., Groen, Y., Wijers, A., Noltes, H., Tucha, O., & Hoekstra, P. (2015).
Oxytocin enhances orienting to social information in a selective group of high-
functioning male adults with autism spectrum disorder. Neuropsychologia, 79,
53-69.
Althaus, M., Groen, Y., Wijers, A. A., Noltes, H., Tucha, O., Sweep, F. C., . . .
Hoekstra, P. J. (2016). Do blood plasma levels of oxytocin moderate the effect
of nasally administered oxytocin on social orienting in high-functioning male
adults with autism spectrum disorder? Psychopharmacology (Berl), 233(14),
2737-2751.
Anderson, A. K., Christoff, K., Panitz, D., De Rosa, E., & Gabrieli, J. D. (2003). Neural
correlates of the automatic processing of threat facial signals. Journal of
Neuroscience, 23(13), 5627-5633.
Baron-Cohen, S., Wheelwright, S., Skinner, R., Martin, J., & Clubley, E. (2001). The
autism-spectrum quotient (AQ): Evidence from asperger syndrome/high-
functioning autism, malesand females, scientists and mathematicians. Journal of
Autism and Developmental Disorders, 31(1), 5-17.
Bartz, J. A., & Hollander, E. (2008). Oxytocin and experimental therapeutics in autism
spectrum disorders. Progress in brain research, 170, 451-462.
Bartz, J. A., Zaki, J., Bolger, N., & Ochsner, K. N. (2011). Social effects of oxytocin in
humans: context and person matter. Trends in cognitive sciences, 15(7), 301-
309.
Batty, M., & Taylor, M. J. (2003). Early processing of the six basic facial emotional
expressions. Cognitive Brain Research, 17(3), 613-620. doi:10.1016/S0926-
6410(03)00174-5
143
Bentin, S., Allison, T., Puce, A., Perez, E., & McCarthy, G. (1996).
Electrophysiological Studies of Face Perception in Humans. J Cogn Neurosci,
8(6), 551-565. doi:10.1162/jocn.1996.8.6.551
Clark, V. P., & Hillyard, S. A. (1996). Spatial selective attention affects early
extrastriate but not striate components of the visual evoked potential. J Cogn
Neurosci, 8(5), 387-402. doi:10.1162/jocn.1996.8.5.387
Crites, S. L., Cacioppo, J. T., Gardner, W. L., & Berntson, G. G. (1995). Bioelectrical
echoes from evaluative categorization: II. A late positive brain potential that
varies as a function of attitude registration rather than attitude report. Journal of
personality and social psychology, 68(6), 997.
Domes, G., Heinrichs, M., Gläscher, J., Büchel, C., Braus, D. F., & Herpertz, S. C.
(2007). Oxytocin attenuates amygdala responses to emotional faces regardless of
valence. Biological Psychiatry, 62(10), 1187-1190.
Domes, G., Heinrichs, M., Kumbier, E., Grossmann, A., Hauenstein, K., & Herpertz, S.
C. (2013). Effects of intranasal oxytocin on the neural basis of face processing
in autism spectrum disorder. Biological Psychiatry, 74(3), 164-171.
Domes, G., Kumbier, E., Heinrichs, M., & Herpertz, S. C. (2014). Oxytocin promotes
facial emotion recognition and amygdala reactivity in adults with asperger
syndrome. Neuropsychopharmacology, 39(3), 698-706.
Domes, G., Lischke, A., Berger, C., Grossmann, A., Hauenstein, K., Heinrichs, M., &
Herpertz, S. C. (2010). Effects of intranasal oxytocin on emotional face
processing in women. Psychoneuroendocrinology, 35(1), 83-93.
Domes, G., Sibold, M., Schulze, L., Lischke, A., Herpertz, S. C., & Heinrichs, M.
(2013). Intranasal oxytocin increases covert attention to positive social cues.
Psychological medicine, 43(8), 1747-1753.
Ebitz, R. B., Watson, K. K., & Platt, M. L. (2013). Oxytocin blunts social vigilance in
the rhesus macaque. Proceedings of the National Academy of Sciences, 110(28),
11630-11635.
Ekman, P., & Friesen, W. V. (1976). Pictures of Facial Affect Palo Alto: Consulting
Psychologists Press.
Faul, F., Erdfelder, E., Lang, A.-G., & Buchner, A. (2007). G* Power 3: A flexible
statistical power analysis program for the social, behavioral, and biomedical
sciences. Behavior research methods, 39(2), 175-191.
144
Gamer, M., Zurowski, B., & Büchel, C. (2010). Different amygdala subregions mediate
valence-related and attentional effects of oxytocin in humans. Proceedings of the
National Academy of Sciences, 107(20), 9400-9405.
doi:10.1073/pnas.1000985107
Guastella, A. J., Hickie, I. B., McGuinness, M. M., Otis, M., Woods, E. A., Disinger, H.
M., . . . Banati, R. B. (2013). Recommendations for the standardisation of
oxytocin nasal administration and guidelines for its reporting in human research.
Psychoneuroendocrinology, 38(5), 612-625.
doi:10.1016/j.psyneuen.2012.11.019
Hajcak, G., Dunning, J. P., & Foti, D. (2009). Motivated and controlled attention to
emotion: time-course of the late positive potential. Clinical Neurophysiology,
120(3), 505-510.
Henson, R. N., Goshen-Gottstein, Y., Ganel, T., Otten, L. J., Quayle, A., & Rugg, M. D.
(2003). Electrophysiological and Haemodynamic Correlates of Face Perception,
Recognition and Priming. Cerebral Cortex, 13(7), 793-805.
doi:10.1093/cercor/13.7.793
Herzmann, G., Bird, C. W., Freeman, M., & Curran, T. (2013). Effects of oxytocin on
behavioral and ERP measures of recognition memory for own-race and other-
race faces in women and men. Psychoneuroendocrinology, 38(10), 2140-2151.
Huffmeijer, R., Alink, L. R., Tops, M., Grewen, K. M., Light, K. C., Bakermans-
Kranenburg, M. J., & van Ijzendoorn, M. H. (2013). The impact of oxytocin
administration and maternal love withdrawal on event-related potential (ERP)
responses to emotional faces with performance feedback. Horm Behav, 63(3),
399-410. doi:10.1016/j.yhbeh.2012.11.008
Hugrass, L., & Crewther, D. P. (Submitted for Publication). Acute intranasal oxytocin
does not influence the non-linear temporal structure of cortical visual evoked
potentials
Joyce, C., & Rossion, B. (2005). The face-sensitive N170 and VPP components
manifest the same brain processes: the effect of reference electrode site. Clinical
Neurophysiology, 116(11), 2613-2631.
Kirsch, P., Esslinger, C., Chen, Q., Mier, D., Lis, S., Siddhanti, S., . . . Meyer-
Lindenberg, A. (2005). Oxytocin Modulates Neural Circuitry for Social
145
Cognition and Fear in Humans. The Journal of Neuroscience, 25(49), 11489-
11493. doi:10.1523/jneurosci.3984-05.2005
Labuschagne, I., Jones, R., Callaghan, J., Whitehead, D., Dumas, E. M., Say, M. J., . . .
Santos, R. C. D. (2013). Emotional face recognition deficits and medication
effects in pre-manifest through stage-II Huntington's disease. Psychiatry
research, 207(1), 118-126.
Labuschagne, I., Phan, K. L., Wood, A., Angstadt, M., Chua, P., Heinrichs, M., . . .
Nathan, P. J. (2010). Oxytocin attenuates amygdala reactivity to fear in
generalized social anxiety disorder. Neuropsychopharmacology, 35(12), 2403-
2413.
Labuschagne, I., Phan, K. L., Wood, A., Angstadt, M., Chua, P., Heinrichs, M., . . .
Nathan, P. J. (2012). Medial frontal hyperactivity to sad faces in generalized
social anxiety disorder and modulation by oxytocin. International Journal of
Neuropsychopharmacology, 15(7), 883-896.
LeDoux, J. E. (1998). The emotional brain : the mysterious underpinnings of emotional
life (1st Touchstone ed.. ed.). New York: New York : Simon & Schuster.
Ley, R. G., & Bryden, M. P. (1979). Hemispheric differences in processing emotions
and faces. Brain and language, 7(1), 127-138.
Liddell, B. J., Brown, K. J., Kemp, A. H., Barton, M. J., Das, P., Peduto, A., . . .
Williams, L. M. (2005). A direct brainstem–amygdala–cortical ‘alarm’system
for subliminal signals of fear. Neuroimage, 24(1), 235-243.
Lischke, A., Berger, C., Prehn, K., Heinrichs, M., Herpertz, S. C., & Domes, G. (2012).
Intranasal oxytocin enhances emotion recognition from dynamic facial
expressions and leaves eye-gaze unaffected. Psychoneuroendocrinology, 37(4),
475-481.
Liu, L., & Ioannides, A. A. (2010). Emotion separation is completed early and it
depends on visual field presentation. PLoS ONE, 5(3), e9790.
Luck, S. J. (2010). Is it legitimate to compare conditions with different numbers of
trials. UC-Davis Center for Mind & Brain, 1-4.
Luo, W., Feng, W., He, W., Wang, N.-Y., & Luo, Y.-J. (2010). Three stages of facial
expression processing: ERP study with rapid serial visual presentation.
Neuroimage, 49(2), 1857-1867.
146
Marsh, A. A., Henry, H. Y., Pine, D. S., & Blair, R. (2010). Oxytocin improves specific
recognition of positive facial expressions. Psychopharmacology (Berl), 209(3),
225-232.
Mattick, R. P., & Clarke, J. C. (1998). Development and validation of measures of
social phobia scrutiny fear and social interaction anxiety1. Behaviour Research
and Therapy, 36(4), 455-470. doi:https://doi.org/10.1016/S0005-
7967(97)10031-6
Meyer-Lindenberg, A. (2008). Impact of prosocial neuropeptides on human brain
function. Progress in brain research, 170, 463-470.
Meyer-Lindenberg, A., Domes, G., Kirsch, P., & Heinrichs, M. (2011). Oxytocin and
vasopressin in the human brain: social neuropeptides for translational medicine.
Nature Reviews Neuroscience, 12(9), 524-538.
Morel, S., Beaucousin, V., Perrin, M., & George, N. (2012). Very early modulation of
brain responses to neutral faces by a single prior association with an emotional
context: evidence from MEG. Neuroimage, 61(4), 1461-1470.
Morel, S., Ponz, A., Mercier, M., Vuilleumier, P., & George, N. (2009). EEG-MEG
evidence for early differential repetition effects for fearful, happy and neutral
faces. Brain research, 1254, 84-98.
Morris, J. S., Friston, K. J., Buchel, C., Frith, C. D., Young, A. W., Calder, A. J., &
Dolan, R. J. (1998). A neuromodulatory role for the human amygdala in
processing emotional facial expressions. Brain, 121, 47-57. doi:Doi
10.1093/Brain/121.1.47
Pastor, M. C., Bradley, M. M., Löw, A., Versace, F., Moltó, J., & Lang, P. J. (2008).
Affective picture perception: emotion, context, and the late positive potential.
Brain research, 1189, 145-151.
Pegna, A. J., Khateb, A., Lazeyras, F., & Seghier, M. L. (2005). Discriminating
emotional faces without primary visual cortices involves the right amygdala.
Nature neuroscience, 8(1), 24-25.
Pourtois, G., Schettino, A., & Vuilleumier, P. (2013). Brain mechanisms for emotional
influences on perception and attention: what is magic and what is not. Biological
Psychology, 92(3), 492-512.
Ruzich, E., Allison, C., Smith, P., Watson, P., Auyeung, B., Ring, H., & Baron-Cohen,
S. (2015). Measuring autistic traits in the general population: a systematic
147
review of the Autism-Spectrum Quotient (AQ) in a nonclinical population
sample of 6,900 typical adult males and females. Molecular autism, 6(1), 2.
Rutherford, H. J., Guo, X. M., Graber, K. M., Hayes, N. J., Pelphrey, K. A., & Mayes,
L. C. (2017). Intranasal oxytocin and the neural correlates of infant face
processing in non-parent women. Biological Psychology, 129, 45-48.
Schulze, L., Lischke, A., Greif, J., Herpertz, S. C., Heinrichs, M., & Domes, G. (2011).
Oxytocin increases recognition of masked emotional faces.
Psychoneuroendocrinology, 36(9), 1378-1382.
Spielberger, C. D. (2010). State‐Trait anxiety inventory: Wiley Online Library.
Sripada, C. S., Phan, K. L., Labuschagne, I., Welsh, R., Nathan, P. J., & Wood, A. G.
(2012). Oxytocin enhances resting-state connectivity between amygdala and
medial frontal cortex. International Journal of Neuropsychopharmacology,
16(2), 255-260.
Tadel, F., Baillet, S., Mosher, J. C., Pantazis, D., & Leahy, R. M. (2011). Brainstorm: A
User-Friendly Application for MEG/EEG Analysis. Computational Intelligence
and Neuroscience, 2011, 13. doi:10.1155/2011/879716
Tottenham, N., Tanaka, J. W., Leon, A. C., McCarry, T., Nurse, M., Hare, T. A., . . .
Nelson, C. (2009). The NimStim set of facial expressions: Judgments from
untrained research participants. Psychiatry research, 168(3), 242-249.
doi:10.1016/j.psychres.2008.05.006
Vlamings, P. H. J. M., Goffaux, V., & Kemner, C. (2009). Is the early modulation of
brain activity by fearful facial expressions primarily mediated by coarse low
spatial frequency information? Journal of Vision, 9(5). doi:Artn 12
10.1167/9.5.12
Vuilleumier, P., Armony, J. L., Driver, J., & Dolan, R. J. (2001). Effects of attention
and emotion on face processing in the human brain: an event-related fMRI
study. Neuron, 30(3), 829-841.
Wigton, R., Radua, J., Allen, P., Averbeck, B., Meyer-Lindenberg, A., McGuire, P., . . .
Fusar-Poli, P. (2015). Neurophysiological effects of acute oxytocin
administration: systematic review and meta-analysis of placebo-controlled
imaging studies. J Psychiatry Neurosci, 40(1), E1-22.
148
Chapter 7: Acute Intranasal Oxytocin does not Influence the Non-
Linear Temporal Structure of Cortical Visual Evoked Potentials
7.1 Chapter guide Hugrass, L., & Crewther, D. (In Submission). Part 2: Acute intranasal oxytocin does
not influence the non-linear temporal structure of cortical visual evoked
potentials.
Chapter 7 presents a re-formatted version of the original article cited above,
which has been submitted to Hormones and Behaviour as the second part of a two-part
original research article. The first part is presented in Chapter 6. David Crewther
presented the preliminary analyses at the 2017 Australasian Cognitive Neurosciences
Society meeting. Taken together, Chapters 6 and 7 contribute to the understanding of
the neural mechanisms by which oxytocin influences affective processing.
In the previous chapter, I use conventional VEP to investigate the effects of
OXT on the timing of affective face processing. In the current chapter, I investigate the
effects of OXT on M and P signatures of non-linear VEP waveforms. Data for these two
experiments were collected in the same study, for the same sample of healthy male
adults.
7.1.1 Highlights
• Non-linear visual evoked potentials (VEPs) were influenced by luminance contrast
• Social anxiety also influenced non-linear VEP amplitudes
• This effect was limited to the magnocellular (M) driven VEP waveforms
• Nasal oxytocin did not influence M or parvocellular VEP waveforms
• Nasal oxytocin did not modulate the effect of social anxiety on VEPs
149
7.2 Abstract Oxytocin is a neuropeptide that plays an important role in a range of complex
social behaviours. Some evidence suggests that oxytocin enhances social information
processing by increasing the salience of socially relevant cues, even at the earliest
stages of visual processing. We used non-linear visual evoked potentials (VEPs) to
investigate whether oxytocin facilitates or impedes the temporal efficiency of visual
processing in the magnocellular and parvocellular afferent streams, and whether trait
level anxiety and autism modulate the effects of oxytocin on early visual processing. In
a randomized, double blind, crossover design, 27 healthy male participants self-
administered a nasal spray of either oxytocin (24 IU) or placebo prior to the recording
of non-linear VEPs. There were no effects of oxytocin on VEP peak amplitudes. We
observed some effects of anxiety on VEP amplitudes, with high levels of social anxiety
associated with increased M-driven non-linear VEP amplitudes. This suggests that trait
anxiety slows recovery from prior stimulation in the M pathway. Our results suggest
that OXT does not play a role in gating M and P afferent responses to non-social
stimuli. However, this does not rule out the possibility that it alters early visual
processing under conditions when socially relevant information is available.
150
7.3 Introduction The neuropeptide oxytocin (OXT) modulates a range of complex social
behaviours, including social bonding, social anxiety and maternal behaviour (Bartz &
Hollander, 2008; Meyer-Lindenberg, 2008) via mechanisms that are not well
understood (Bartz, Zaki, Bolger, & Ochsner, 2011). One proposal is that OXT enhances
social processing by reducing anxiety (McCarthy, McDonald, Brooks, & Goldman,
1996). This theory is supported by evidence that OXT reduces the effects of social
stress on salivary cortisol levels (Heinrichs, Baumgartner, Kirschbaum, & Ehlert, 2003).
A reduction in anxiety may also explain the effects of OXT administration on amygdala
and prefrontal responses in groups with generalised social anxiety disorder or autism
spectrum disorders (Domes et al., 2013; Labuschagne et al., 2010, 2012).
Other theories suggest that OXT enhances processing of social information by
increasing affiliative motivation (Bartz & Hollander, 2008; Heinrichs, von Dawans, &
Domes, 2009), which could in turn bias goal directed attentional resources towards
socially relevant cues (Bartz et al., 2011). A third possibility is that OXT enhances the
perceptual salience of social cues (Ross & Young, 2009; Schulze et al., 2011). This
proposed mechanism is supported by evidence that OXT increases gaze to facial eye
regions (Ebitz, Watson, & Platt, 2013), functional coupling between the amygdala and
superior colliculi (Gamer, Zurowski, & Büchel, 2010) and resting-state functional
coupling between the amygdala and frontal cortex (Sripada et al., 2012). This suggests
that OXT may have profound effects on the earliest stages of social information
processing (Ebitz et al., 2013).
In Chapter 6, we presented evidence that OXT administration influences very
early (40-60ms) stages of affective face processing (Hugrass, Labuschagne, Price, &
Crewther, Submitted for Publication). At these early stages, social processing involves
the projection of coarse, but rapid visual input from the magnocellular (M) pathway to
the superior colliculus, LGN, amygdala and frontal cortices (Bar et al., 2006; Kveraga,
Boshyan, & Bar, 2007; Pessoa & Adolphs, 2010). Due to fast conduction speeds, visual
input into the M pathway enables rapid detection of potentially threatening stimuli, in
time to gate the processing of slower and more detailed visual input from the
parvocellular (P) pathway (Bar et al., 2006; Bullier, 2001; Hupé et al., 1998; Kveraga et
al., 2007; Vlamings, Goffaux, & Kemner, 2009). Differences relating to M pathway
functions may explain some of the facial emotion processing abnormalities in people
151
with high levels of autistic personality traits (Burt, Hugrass, Frith-Belvedere, &
Crewther, 2017). Furthermore, fMRI and behavioural evidence suggests that trait
anxiety facilitates processing of ambiguous threat cues in the M pathway, while
impairing processing of clear threat cues in the P pathway (Im et al., 2017). However, to
our knowledge, no studies have explicitly assessed the effects of OXT administration on
magnocellular visual processing.
Temporal processing in the M and P pathways can be inferred through Wiener
kernel decomposition of non-linear visual evoked potentials (VEPs) (Klistorner,
Crewther, & Crewther, 1997). In multifocal VEP (mfVEP) experiments, diffuse patches
of light are flashed in de-correlated pseudorandom binary sequence of luminance levels
(Sutter, 1992). In a linear system, the first order kernel (K1) measures the impulse
response function generated by brief stimuli (Benardete & Victor, 1994). However, the
visual system cannot process extremely high temporal frequencies and hence we
observe higher-order VEP kernel responses. The K2.1 and K2.2 kernels are measures of
temporal non-linearity over one and two video frames respectively (see Figures 7.1b
and c). Analyses of contrast response functions indicate that K2.1 waveforms, and early
components of K2.2 waveforms originate from the M pathway, whereas the later
component of the K2.2 originates from afferents of the P pathway (Jackson et al., 2013;
Klistorner et al., 1997). Previous non-linear VEP studies have shown that high levels of
autistic personality traits are associated with higher amplitude K2.1 and early K2.2
responses (Burt et al., 2017; Jackson et al., 2013), which is indicative of temporal
inefficiency in the projection of information in the M pathway to the visual cortex
(Sutherland & Crewther, 2010).
If OXT facilitates M contributions to visual processing, one would expect it to
decrease the amplitude of M-driven nonlinear VEP amplitudes (i.e., K2.1 and early
K2.2 amplitudes). On the other hand, if OXT increases the temporal efficiency of P
processing, one would expect P-driven nonlinear VEP amplitudes (i.e., later K2.2
amplitudes) to decrease after OXT administration. Previous studies have shown that
autistic and anxious personality traits contribute to individual differences in the effects
of OXT on brain activation and behaviour (Alvares, Chen, Balleine, Hickie, &
Guastella, 2012; Scheele et al., 2014). Therefore, we investigated whether the effects of
OXT on VEP amplitudes would tend to be greater in participants with higher trait levels
of autism and social anxiety.
152
7.4 Method
7.4.1 Participants
A power analysis, calculated using G*Power (Faul, Erdfelder, Lang, & Buchner,
2007), indicated that a sample of 27 participants is adequate to detect a mean difference
ERP responses between the OXT and placebo sessions, with α = 0.05, β = 0.80, and
moderate effect size (Cohen’s d = 0.5). The same sample of 27 healthy males aged 18 –
40 (M = 25.22 years, SD = 4.72 years), with normal or corrected to normal vision,
participated in this experiment, and the experiment presented in Chapter 6. One
additional participant completed the placebo session, but did not return for the oxytocin
session and hence any results were excluded from analysis. The participants gave
written informed consent for the experiment, which was conducted with the approval of
the Australian Catholic University Human Research Ethics Committee and in
accordance with the code of ethics of the Declaration of Helsinki.
7.4.2 Procedure
We utilised a randomized, double blind, placebo-controlled, crossover design.
Prior to attending the lab session, participants completed online demographic questions
and psychometric scales to measure their levels of autistic and anxious personality
traits. Participants were instructed not to drink alcohol on the night before their session.
They were also required to refrain from drinking caffeine on the day of their session,
and to refrain from eating or drinking (except for water) within an hour of their session.
The OXT and placebo (PBO) sessions were separated by a washout period of at least
one week. For both sessions, state anxiety was measured prior to treatment
administration (STAIpre). After treatment administration, VEPs were recorded during
presentation of the low and high contrast multifocal stimuli, and then a second state
anxiety (STAIpost) measurement was made.
Treatment conditions were randomized and counterbalanced, such that the
participants and experimenters were unaware of which spray bottle contained the
oxytocin. Subjects self-administered an intranasal spray of either OXT (24 IU) or
placebo (PBO, containing all ingredients except for the peptide) in three puffs of 4 IU
per nostril. Participants were given instructions for how to self-administer the nasal
spray, consistent with recommended guidelines (Guastella et al., 2013). Participants
153
primed the bottle by puffing three sprays into the air. They inhaled a full spray in one
nostril and then waited 45s between applications until they had completed three sprays
per nostril, in alternating order. Before completing the tasks that are presented in this
chapter, participants completed the experiments presented in Chapter 6, at
approximately 45 minutes after the last spray. The first experimental block of low
contrast mfVEP started at approximately 60 minutes after the last spray application
(OXT: M= 57.70, SD= 4.20, PBO: M = 58.96, SD= 4.64). The second experimental
block of high contrast mfVEP started at approximately 65 minutes after the last spray
application (OXT: M= 62.93, SD= 5.03, PBO: M = 64.33, SD= 4.49). STAIpost was
recorded approximately 75 minutes after the last spray application (OXT: M= 76.22,
SD= 5.62, PBO: M = 77.22, SD= 6.06).
7.4.3 Questionnaires
Prior to attending the session, participants completed online demographic and
personality scales. Autistic personality traits were measured with an online version of
the Autism Spectrum Quotient (AQ) (Baron-Cohen, Wheelwright, Skinner, Martin, &
Clubley, 2001), with higher scores (range, 0 – 50) indicating higher levels of trait
autism. Social anxiety was measured using the Social Interaction Anxiety Scale (SIAS)
(Mattick & Clarke, 1998), with higher scores (range, 0 – 80) indicating a greater degree
of social anxiety. State anxiety was measured prior to OXT and PBO nasal spray
administration (STAIpre), and at the end of the testing sessions (STAIpost) using the
State-Trait Anxiety Inventory (Form Y1, range: 20 - 80, Spielberger, 2010).
7.4.4 mfVEP Stimuli
The stimuli were presented on a 60Hz LCD monitor (ViewSonic, resolution
1024 x 768) with linearized colour output (measured with a ColorCal II). The 9-patch
dartboard stimuli (Figure 7.1a) were created using VPixx software (version 3.20,
http://www.VPixx.com), with a central patch (5.4° diameter) and two outer rings of four
patches (21.2° and 48° diameter). The luminance for each patch was modulated at the
video frame rate (60Hz, mean luminance = 42 cd/m 2, CIEx = 0.32, CIEy = 0.33), in
pseudorandom binary m-sequences (m = 14), at either low (10% Michelson) or high
(70% Michelson) temporal contrast. The m-sequences for each patch were maximally
offset, so we could record independent responses across the visual field. For the purpose
of this experiment, we only analyzed responses to the central patch.
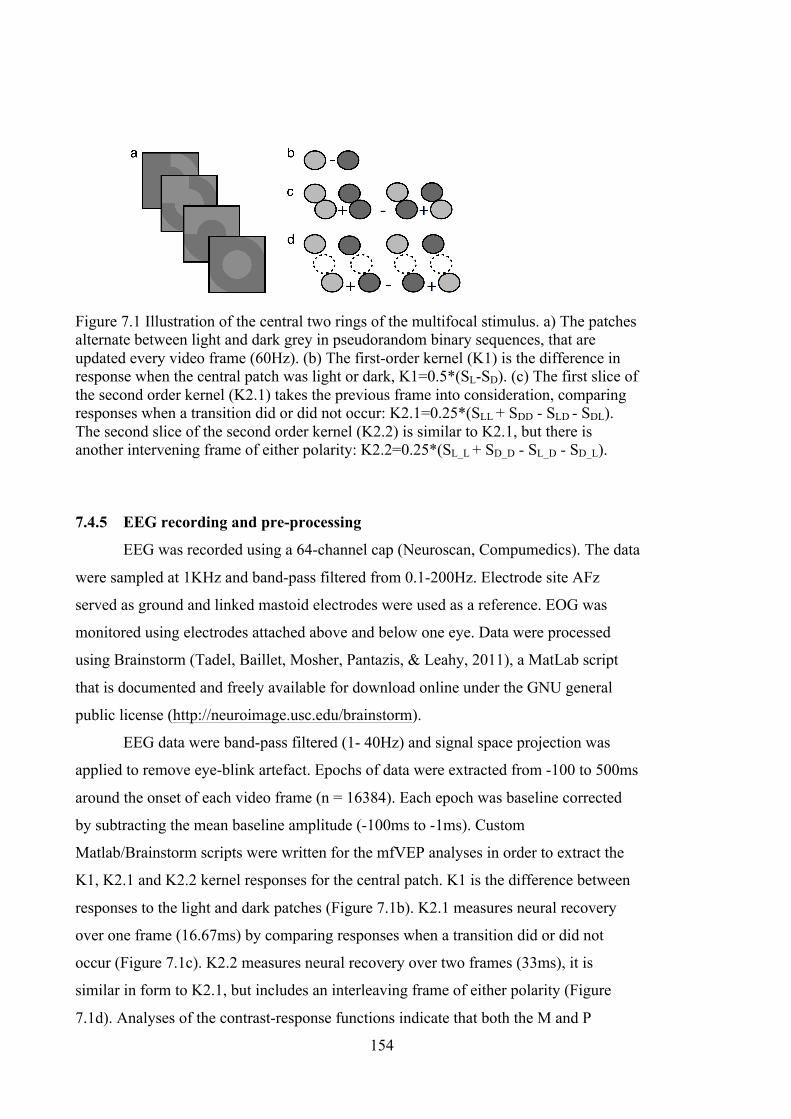
154
Figure 7.1 Illustration of the central two rings of the multifocal stimulus. a) The patches alternate between light and dark grey in pseudorandom binary sequences, that are updated every video frame (60Hz). (b) The first-order kernel (K1) is the difference in response when the central patch was light or dark, K1=0.5*(SL-SD). (c) The first slice of the second order kernel (K2.1) takes the previous frame into consideration, comparing responses when a transition did or did not occur: K2.1=0.25*(SLL + SDD - SLD - SDL). The second slice of the second order kernel (K2.2) is similar to K2.1, but there is another intervening frame of either polarity: K2.2=0.25*(SL_L + SD_D - SL_D - SD_L).
7.4.5 EEG recording and pre-processing
EEG was recorded using a 64-channel cap (Neuroscan, Compumedics). The data
were sampled at 1KHz and band-pass filtered from 0.1-200Hz. Electrode site AFz
served as ground and linked mastoid electrodes were used as a reference. EOG was
monitored using electrodes attached above and below one eye. Data were processed
using Brainstorm (Tadel, Baillet, Mosher, Pantazis, & Leahy, 2011), a MatLab script
that is documented and freely available for download online under the GNU general
public license (http://neuroimage.usc.edu/brainstorm).
EEG data were band-pass filtered (1- 40Hz) and signal space projection was
applied to remove eye-blink artefact. Epochs of data were extracted from -100 to 500ms
around the onset of each video frame (n = 16384). Each epoch was baseline corrected
by subtracting the mean baseline amplitude (-100ms to -1ms). Custom
Matlab/Brainstorm scripts were written for the mfVEP analyses in order to extract the
K1, K2.1 and K2.2 kernel responses for the central patch. K1 is the difference between
responses to the light and dark patches (Figure 7.1b). K2.1 measures neural recovery
over one frame (16.67ms) by comparing responses when a transition did or did not
occur (Figure 7.1c). K2.2 measures neural recovery over two frames (33ms), it is
similar in form to K2.1, but includes an interleaving frame of either polarity (Figure
7.1d). Analyses of the contrast-response functions indicate that both the M and P
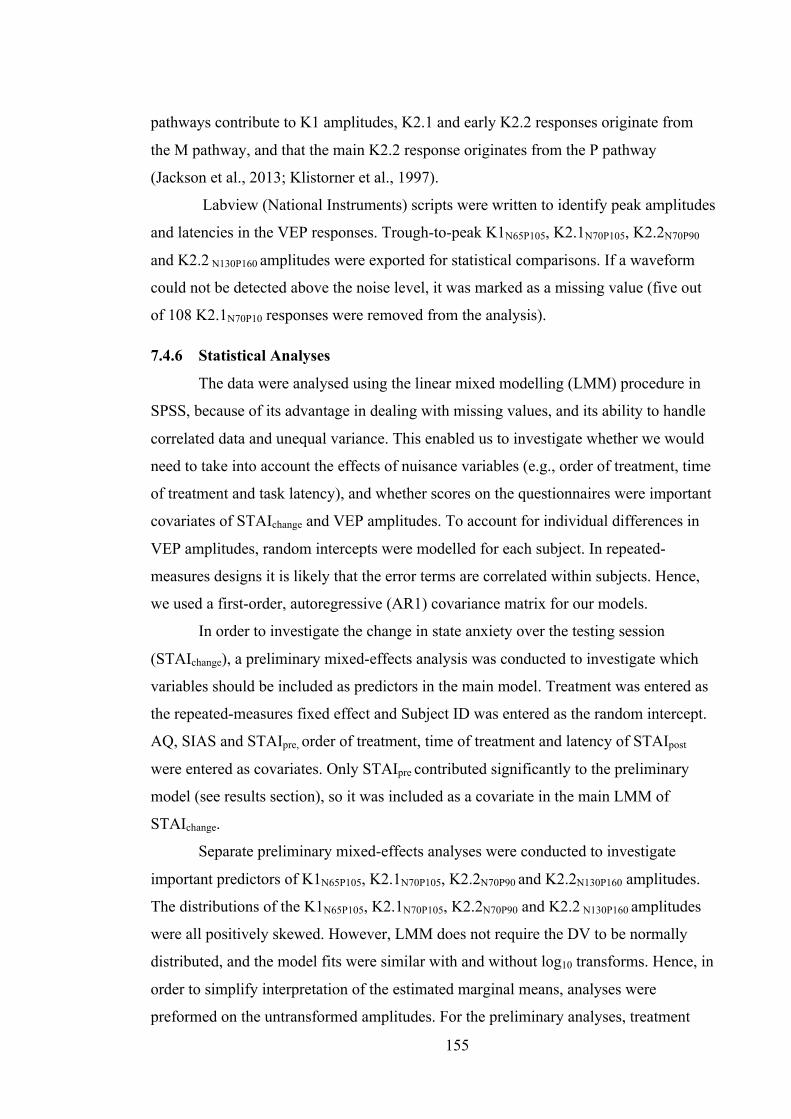
155
pathways contribute to K1 amplitudes, K2.1 and early K2.2 responses originate from
the M pathway, and that the main K2.2 response originates from the P pathway
(Jackson et al., 2013; Klistorner et al., 1997).
Labview (National Instruments) scripts were written to identify peak amplitudes
and latencies in the VEP responses. Trough-to-peak K1N65P105, K2.1N70P105, K2.2N70P90
and K2.2 N130P160 amplitudes were exported for statistical comparisons. If a waveform
could not be detected above the noise level, it was marked as a missing value (five out
of 108 K2.1N70P10 responses were removed from the analysis).
7.4.6 Statistical Analyses
The data were analysed using the linear mixed modelling (LMM) procedure in
SPSS, because of its advantage in dealing with missing values, and its ability to handle
correlated data and unequal variance. This enabled us to investigate whether we would
need to take into account the effects of nuisance variables (e.g., order of treatment, time
of treatment and task latency), and whether scores on the questionnaires were important
covariates of STAIchange and VEP amplitudes. To account for individual differences in
VEP amplitudes, random intercepts were modelled for each subject. In repeated-
measures designs it is likely that the error terms are correlated within subjects. Hence,
we used a first-order, autoregressive (AR1) covariance matrix for our models.
In order to investigate the change in state anxiety over the testing session
(STAIchange), a preliminary mixed-effects analysis was conducted to investigate which
variables should be included as predictors in the main model. Treatment was entered as
the repeated-measures fixed effect and Subject ID was entered as the random intercept.
AQ, SIAS and STAIpre, order of treatment, time of treatment and latency of STAIpost
were entered as covariates. Only STAIpre contributed significantly to the preliminary
model (see results section), so it was included as a covariate in the main LMM of
STAIchange.
Separate preliminary mixed-effects analyses were conducted to investigate
important predictors of K1N65P105, K2.1N70P105, K2.2N70P90 and K2.2N130P160 amplitudes.
The distributions of the K1N65P105, K2.1N70P105, K2.2N70P90 and K2.2 N130P160 amplitudes
were all positively skewed. However, LMM does not require the DV to be normally
distributed, and the model fits were similar with and without log10 transforms. Hence, in
order to simplify interpretation of the estimated marginal means, analyses were
preformed on the untransformed amplitudes. For the preliminary analyses, treatment
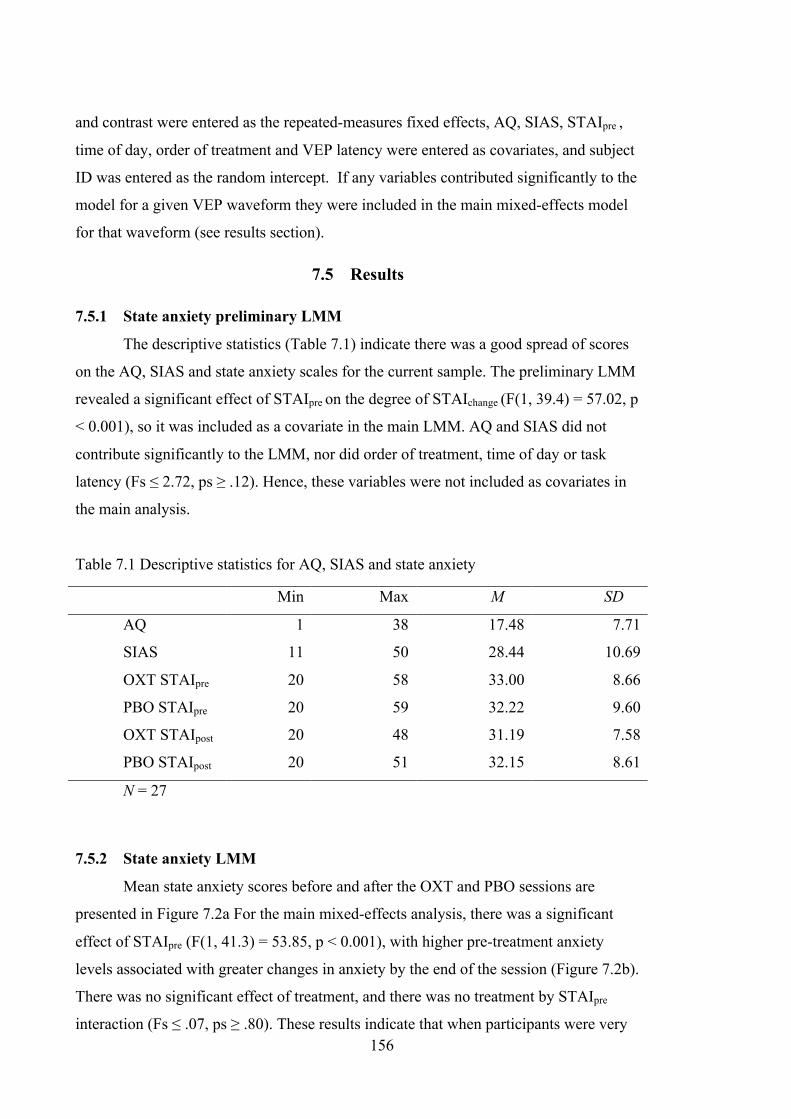
156
and contrast were entered as the repeated-measures fixed effects, AQ, SIAS, STAIpre ,
time of day, order of treatment and VEP latency were entered as covariates, and subject
ID was entered as the random intercept. If any variables contributed significantly to the
model for a given VEP waveform they were included in the main mixed-effects model
for that waveform (see results section).
7.5 Results
7.5.1 State anxiety preliminary LMM
The descriptive statistics (Table 7.1) indicate there was a good spread of scores
on the AQ, SIAS and state anxiety scales for the current sample. The preliminary LMM
revealed a significant effect of STAIpre on the degree of STAIchange (F(1, 39.4) = 57.02, p
< 0.001), so it was included as a covariate in the main LMM. AQ and SIAS did not
contribute significantly to the LMM, nor did order of treatment, time of day or task
latency (Fs ≤ 2.72, ps ≥ .12). Hence, these variables were not included as covariates in
the main analysis.
Table 7.1 Descriptive statistics for AQ, SIAS and state anxiety
Min Max M SD
AQ 1 38 17.48 7.71
SIAS 11 50 28.44 10.69
OXT STAIpre 20 58 33.00 8.66
PBO STAIpre 20 59 32.22 9.60
OXT STAIpost 20 48 31.19 7.58
PBO STAIpost 20 51 32.15 8.61
N = 27
7.5.2 State anxiety LMM
Mean state anxiety scores before and after the OXT and PBO sessions are
presented in Figure 7.2a For the main mixed-effects analysis, there was a significant
effect of STAIpre (F(1, 41.3) = 53.85, p < 0.001), with higher pre-treatment anxiety
levels associated with greater changes in anxiety by the end of the session (Figure 7.2b).
There was no significant effect of treatment, and there was no treatment by STAIpre
interaction (Fs ≤ .07, ps ≥ .80). These results indicate that when participants were very
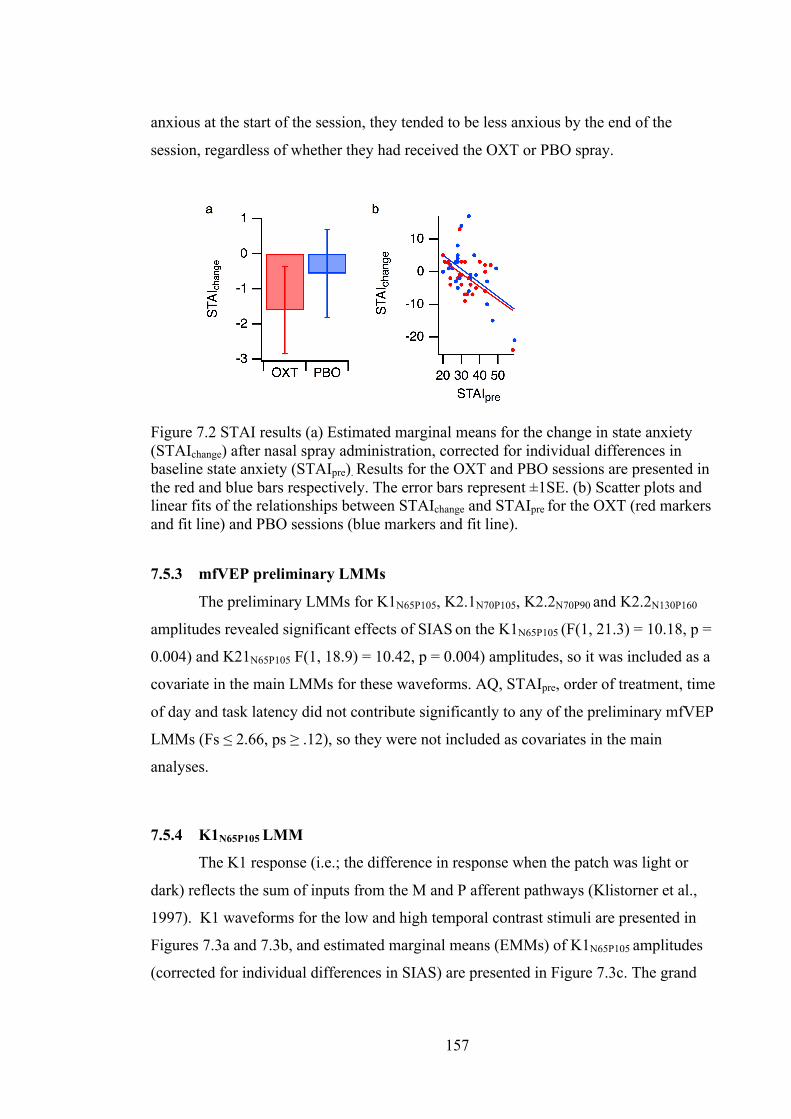
157
anxious at the start of the session, they tended to be less anxious by the end of the
session, regardless of whether they had received the OXT or PBO spray.
Figure 7.2 STAI results (a) Estimated marginal means for the change in state anxiety (STAIchange) after nasal spray administration, corrected for individual differences in baseline state anxiety (STAIpre). Results for the OXT and PBO sessions are presented in the red and blue bars respectively. The error bars represent ±1SE. (b) Scatter plots and linear fits of the relationships between STAIchange and STAIpre for the OXT (red markers and fit line) and PBO sessions (blue markers and fit line).
7.5.3 mfVEP preliminary LMMs
The preliminary LMMs for K1N65P105, K2.1N70P105, K2.2N70P90 and K2.2N130P160
amplitudes revealed significant effects of SIAS on the K1N65P105 (F(1, 21.3) = 10.18, p =
0.004) and K21N65P105 F(1, 18.9) = 10.42, p = 0.004) amplitudes, so it was included as a
covariate in the main LMMs for these waveforms. AQ, STAIpre, order of treatment, time
of day and task latency did not contribute significantly to any of the preliminary mfVEP
LMMs (Fs ≤ 2.66, ps ≥ .12), so they were not included as covariates in the main
analyses.
7.5.4 K1N65P105 LMM
The K1 response (i.e.; the difference in response when the patch was light or
dark) reflects the sum of inputs from the M and P afferent pathways (Klistorner et al.,
1997). K1 waveforms for the low and high temporal contrast stimuli are presented in
Figures 7.3a and 7.3b, and estimated marginal means (EMMs) of K1N65P105 amplitudes
(corrected for individual differences in SIAS) are presented in Figure 7.3c. The grand
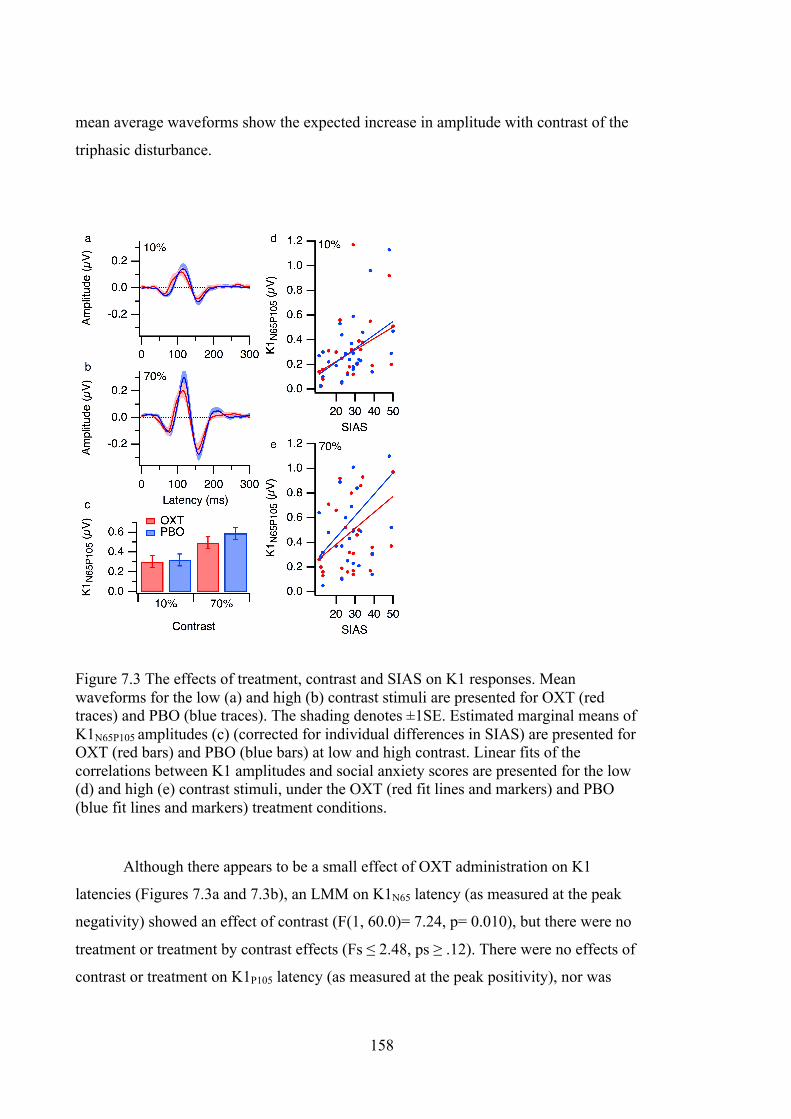
158
mean average waveforms show the expected increase in amplitude with contrast of the
triphasic disturbance.
Figure 7.3 The effects of treatment, contrast and SIAS on K1 responses. Mean waveforms for the low (a) and high (b) contrast stimuli are presented for OXT (red traces) and PBO (blue traces). The shading denotes ±1SE. Estimated marginal means of K1N65P105 amplitudes (c) (corrected for individual differences in SIAS) are presented for OXT (red bars) and PBO (blue bars) at low and high contrast. Linear fits of the correlations between K1 amplitudes and social anxiety scores are presented for the low (d) and high (e) contrast stimuli, under the OXT (red fit lines and markers) and PBO (blue fit lines and markers) treatment conditions.
Although there appears to be a small effect of OXT administration on K1
latencies (Figures 7.3a and 7.3b), an LMM on K1N65 latency (as measured at the peak
negativity) showed an effect of contrast (F(1, 60.0)= 7.24, p= 0.010), but there were no
treatment or treatment by contrast effects (Fs ≤ 2.48, ps ≥ .12). There were no effects of
contrast or treatment on K1P105 latency (as measured at the peak positivity), nor was
159
there a contrast by treatment interaction (Fs ≤ 2.45, ps ≥ .12). This suggests that if OXT
administration influences K1 latencies, it does not do so at the major peaks.
The main mixed-effects analysis revealed there were significant effects of
contrast (F(1, 48.7)= 41.50, p< 0.001) and SIAS (F(1, 24.9)= 7.43, p= 0.012) on
K1N65P105 amplitudes. However, there was no significant effect of treatment, no
treatment by contrast interaction and no SIAS by treatment interaction (Fs ≤ .98, ps ≥
.33). Bivariate correlations (Figure 7.3d and 7.3e) showed that K1N65P105 amplitudes
tended to be greater for people with higher SIAS scores, both for the low (OXT r = .39,
p = .045; PBO r = .45, p = .017) and high contrast stimuli (OXT r = .39, p = .046; PBO r
= .44, p = .022). In summary, our results suggest that K1N65P105 amplitudes tend to
increase with social anxiety and stimulus contrast, but they are not affected by OXT vs.
PBO.
7.5.5 K2.1N70P105
The K2.1 response (i.e.; recovery of flash VEP over one video frame) is likely to
originate from M inputs (Klistorner et al., 1997). K2.1 waveforms for the low and high
temporal contrast stimuli are presented in Figures 7.4a and 7.4b, and EMMs of
K2.1N70P105 amplitudes (corrected for individual differences in SIAS) are presented in
Figure 7.4c. The grand mean waveforms show the expected increase in amplitude with
contrast.

160
Figure 7.4 The effects of treatment, contrast and SIAS on K2.1 responses. Mean waveforms for the low (a) and high (b) contrast stimuli are presented for OXT (red traces) and PBO (blue traces). The shading denotes ±1SE. Estimated marginal means of K2.1N70P105 amplitudes (c) (corrected for individual differences in SIAS) are presented for OXT (red bars) and PBO (blue bars) at low and high contrast. Linear fits of the correlations between K1 amplitudes and social anxiety scores are presented for the low (d) and high (e) contrast stimuli, under the OXT (red fit lines and markers) and PBO (blue fit lines and markers) treatment conditions.
The LMM of K2.1 N70P105 amplitudes revealed significant effects of contrast
(F(1, 29.5) =32.89, p<0.001) and SIAS (F(1, 24.5) =7.16, p= 0.013) on K2.1N70P105
amplitudes. However, there was no significant effect of treatment and there was no
treatment by contrast interaction (Fs ≤ 1.23, ps ≥ .27). Bivariate correlations (Figure
7.4d and 7.4e) showed that K2.1N70P105 amplitudes tended to be greater for people with
higher SIAS scores for the PBO session (10% contrast r = .54, p = .005; 70% contrast r
= .41, p = .043), but these correlations were not statistically significant for the OXT
session (10% contrast r = .36, p = .060; 70% contrast r = .26, p = .196). However, the
LMM showed that the SIAS by treatment interaction was not statistically significant (F
=2.07, p = .16). Consistent with the analysis of K1 amplitudes, our results suggest that
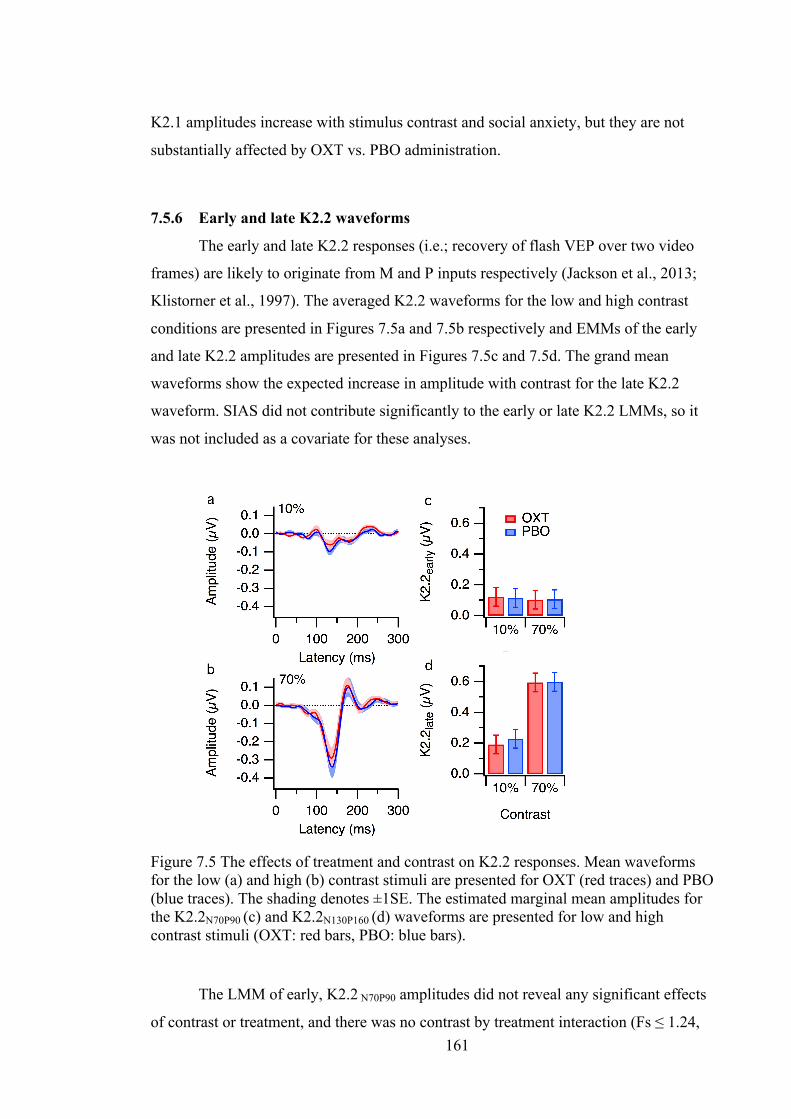
161
K2.1 amplitudes increase with stimulus contrast and social anxiety, but they are not
substantially affected by OXT vs. PBO administration.
7.5.6 Early and late K2.2 waveforms
The early and late K2.2 responses (i.e.; recovery of flash VEP over two video
frames) are likely to originate from M and P inputs respectively (Jackson et al., 2013;
Klistorner et al., 1997). The averaged K2.2 waveforms for the low and high contrast
conditions are presented in Figures 7.5a and 7.5b respectively and EMMs of the early
and late K2.2 amplitudes are presented in Figures 7.5c and 7.5d. The grand mean
waveforms show the expected increase in amplitude with contrast for the late K2.2
waveform. SIAS did not contribute significantly to the early or late K2.2 LMMs, so it
was not included as a covariate for these analyses.
Figure 7.5 The effects of treatment and contrast on K2.2 responses. Mean waveforms for the low (a) and high (b) contrast stimuli are presented for OXT (red traces) and PBO (blue traces). The shading denotes ±1SE. The estimated marginal mean amplitudes for the K2.2N70P90 (c) and K2.2N130P160 (d) waveforms are presented for low and high contrast stimuli (OXT: red bars, PBO: blue bars).
The LMM of early, K2.2 N70P90 amplitudes did not reveal any significant effects
of contrast or treatment, and there was no contrast by treatment interaction (Fs ≤ 1.24,
162
ps ≥ .27). The LMM of K2.2 N130P160 amplitudes revealed a significant effect of stimulus
contrast (F(1, 24.5)=31.19, p<0.001). There was no effect of treatment, nor was there a
treatment by contrast interaction (Fs ≤ .41, ps ≥ .53) Our results suggest that late, but
not early, K2.2 amplitudes are influenced by contrast, and that neither early nor late
K2.2 waveforms are affected by OXT vs. PBO administration.
7.6 Discussion In summary, OXT had no effect on state anxiety, or on any of the nonlinear VEP
kernel amplitudes. Furthermore, there were no OXT by stimulus contrast interactions.
Based on these results, there is no evidence that OXT modulates activation of the
primary visual cortex via either the M or P afferent pathways (when using simple flash
stimuli). As expected, based on the existing literature, kernel responses were greater in
amplitude for the high contrast stimulus, and the effects of contrast on amplitude were
stronger for the P-driven (late K2.2) responses than for the M-driven (K2.1 and early
K2.2) responses (Jackson et al., 2013; Klistorner et al., 1997). Interestingly, some of
the individual variation in VEP amplitudes could be attributed to the participants’ scores
on a self-reported social anxiety measure. Specifically, M-driven (K2.1) amplitudes
increased with social anxiety, whereas P-driven (late K2.2) amplitudes were not
significantly associated with social anxiety. By contrast, autistic tendency did not
predict non-linear VEP amplitudes. We provide more detailed interpretations of the
effects of OXT, anxiety and autistic tendency on visual processing below.
There are several possible explanations as to why OXT did not affect VEP
amplitudes. Differences in OXT spray administration methods can influence its dosage
and bioavailability (Bradfield, 1965). Although we did not measure blood or salivary
levels of OXT, we followed procedures to maximise the likelihood of the drug being
absorbed efficiently at the mucosal surface (Guastella et al., 2013). The latencies from
nasal spray delivery to the VEP and STAI measurements were well within the periods
for which salivary OXT remains elevated (Van IJzendoorn, Bhandari, Van der Veen,
Grewen, & Bakermans-Kranenburg, 2012), and peripherally measured OXT
concentrations tend to be reliable indicators of central OXT concentrations after nasal
spray administration (Valstad et al., 2017). Although the sample size was relatively
small, the study was adequately powered to detect moderate to large effects of treatment
condition. Furthermore, many studies have reported effects of OXT on brain activation
163
for crossover designs with similar or smaller sample sizes (Domes, Heinrichs, Michel,
Berger, & Herpertz, 2007; Kirsch et al., 2005; Labuschagne et al., 2010; Perry et al.,
2010; Sripada et al., 2012). The results presented in Chapter 6 (Hugrass et al.,
Submitted for Publication) are consistent with the interpretation that a
biologically relevant dose of OXT was administered to the brain. Therefore, perhaps the
most plausible explanation as to why OXT did not influence VEP amplitudes is that our
testing paradigm did not involve any social engagement.
The effects of OXT can vary depending on the context in which it is
administered (Bartz et al., 2011). According to the social salience hypothesis, OXT
enhances the salience of social cues (Ross & Young, 2009; Schulze et al., 2011). There
is evidence that the oxytocin receptor (OXT-R) gene impacts functional activation in
the visual cortex (O’Connell et al., 2012). Furthermore, OXT enhances functional
coupling between the amygdala and the superior colliculus (Gamer et al., 2010), a
subcortical region involved in gaze direction, which receives predominantly M input
(Wurtz & Albano, 1980). While it is plausible that OXT could modulate processing in
the afferent pathways, the results presented here and in Chapter 6 (Hugrass et al.,
Submitted for Publication) indicate that it only modulates early visual processing when
there is socially salient input.
In addition to contextual effects, stable individual differences, such as
endogenous plasma OXT levels and personality variables can also influence the effects
of OXT administration on brain and behavioural measures (Bartz et al., 2011). Previous
studies have shown that OXT has greater effects on amygdala activation in generalised
social anxiety disorder and in autism than in control groups (Domes et al., 2013;
Labuschagne et al., 2010). Trait anxiety can also moderate the effects of OXT on brain
and behavioural measures in non-clinical samples (Alvares et al., 2012). Therefore, we
were interested in whether social anxiety levels in a neurotypical sample contribute to
individual variation in non-linear VEP amplitudes. High social anxiety was associated
with higher amplitudes for the M-driven (K2.1) nonlinear VEP amplitudes. This is
consistent with evidence that trait anxiety improves M processing of ambiguous threat
cues (Im et al., 2017). Correlations between K2.1 amplitudes and social anxiety were
weaker after OXT administration; however our study was not sufficiently powerful to
detect whether OXT blunts the effect of SIAS on M-driven VEP amplitudes at the
population level.
164
We did not observe any effects of autistic tendency on M or P driven VEP
amplitudes. By contrast, previous studies have shown that M-driven K2.1 amplitudes
tend to be higher in neurotypical groups with high, compared with low, autistic
tendency (Burt et al., 2017; Jackson et al., 2013). It is important to note that these
studies were specifically designed to compare groups with low and high AQ scores,
whereas we simply recorded AQ in order to control for any potential interactions
between the effects of AQ and OXT administration on VEP amplitudes. Although our
sample included some participants with very low and high AQ scores, the majority
scored in the mid range. Previous studies have shown that OXT administration can
improve face processing in groups with ASD (Domes, Heinrichs, Gläscher, et al.,
2007), and furthermore that M abnormalities may contribute to differences in affective
face processing in groups with low and high AQ scores (Burt et al., 2017). Therefore, it
is reasonable to ask whether OXT administration can reduce the effects of autistic
tendency on M-driven VEP amplitudes. In order to answer this question, future studies
will require larger numbers of participants at the low and high ends of the autistic
personality spectrum.
In summary, we investigated differences in the acute effects of nasal OXT
administration on the non-linear temporal structure of visual evoked potentials. We
were specifically interested in whether OXT would increase temporal efficiency in the
M pathway; however the absence of any treatment or treatment by temporal contrast
effects on non-linear VEP amplitudes suggest that OXT does not influence processing
in the main afferent streams to the primary visual cortex. High levels of social anxiety
were associated with increased M-driven non-linear VEP amplitudes; this suggests that
anxiety reduces temporal efficiency in the M pathway. However, this effect was not
significantly different for the sessions when participants received OXT or PBO.
Therefore although nasal OXT has been shown to bias top-down attentional resources
towards socially relevant visual stimuli (Bartz et al., 2011), our results indicate that it
does not play a role in gating non-social M and P input to the primary visual cortex.
7.7 Acknowledgements We are grateful to Izelle Labuschagne for her input and advice in designing the
study and preparing the manuscript. We would like to make a special thanks to the
undergraduate students who helped to collect the data. This project was funded by the
Australian Research Council (ARC) (150104172). Nasal sprays were purchased with
165
funding from Swinburne University of Technology and the Australian Catholic
University.
7.8 References Alvares, G. A., Chen, N. T., Balleine, B. W., Hickie, I. B., & Guastella, A. J. (2012).
Oxytocin selectively moderates negative cognitive appraisals in high trait
anxious males. Psychoneuroendocrinology, 37(12), 2022-2031.
Bar, M., Kassam, K. S., Ghuman, A. S., Boshyan, J., Schmid, A. M., Dale, A. M., . . .
Halgren, E. (2006). Top-down facilitation of visual recognition. Proceedings of
the National Academy of Sciences of the United States of America, 103(2), 449-
454. doi:10.1073/pnas.0507062103
Baron-Cohen, S., Wheelwright, S., Skinner, R., Martin, J., & Clubley, E. (2001). The
autism-spectrum quotient (AQ): Evidence from asperger syndrome/high-
functioning autism, males and females, scientists and mathematicians. Journal of
Autism and Developmental Disorders, 31(1), 5-17.
Bartz, J. A., & Hollander, E. (2008). Oxytocin and experimental therapeutics in autism
spectrum disorders. Progress in brain research, 170, 451-462.
Bartz, J. A., Zaki, J., Bolger, N., & Ochsner, K. N. (2011). Social effects of oxytocin in
humans: context and person matter. Trends in cognitive sciences, 15(7), 301-
309.
Benardete, E. A., & Victor, J. D. (1994). An extension of the m-sequence technique for
the analysis of multi-input nonlinear systems Advanced methods of
physiological system modeling (pp. 87-110): Springer.
Bradfield, A. (1965). Reservations on the safety of oxytocin nasal spray in obstetrics.
Australian and New Zealand Journal of Obstetrics and Gynaecology, 5(3), 138-
143.
Bullier, J. (2001). Integrated model of visual processing. Brain Research Reviews,
36(2–3), 96-107. doi:http://dx.doi.org/10.1016/S0165-0173(01)00085-6
Burt, A., Hugrass, L., Frith-Belvedere, T., & Crewther, D. (2017). Insensitivity to
Fearful Emotion for Early ERP Components in High Autistic Tendency Is
Associated with Lower Magnocellular Efficiency. Frontiers in human
neuroscience, 11, 495.
166
Domes, G., Heinrichs, M., Gläscher, J., Büchel, C., Braus, D. F., & Herpertz, S. C.
(2007). Oxytocin attenuates amygdala responses to emotional faces regardless of
valence. Biological Psychiatry, 62(10), 1187-1190.
Domes, G., Heinrichs, M., Kumbier, E., Grossmann, A., Hauenstein, K., & Herpertz, S.
C. (2013). Effects of intranasal oxytocin on the neural basis of face processing
in autism spectrum disorder. Biological Psychiatry, 74(3), 164-171.
Domes, G., Heinrichs, M., Michel, A., Berger, C., & Herpertz, S. C. (2007). Oxytocin
improves “mind-reading” in humans. Biological Psychiatry, 61(6), 731-733.
Ebitz, R. B., Watson, K. K., & Platt, M. L. (2013). Oxytocin blunts social vigilance in
the rhesus macaque. Proceedings of the National Academy of Sciences, 110(28),
11630-11635.
Faul, F., Erdfelder, E., Lang, A.-G., & Buchner, A. (2007). G* Power 3: A flexible
statistical power analysis program for the social, behavioral, and biomedical
sciences. Behavior research methods, 39(2), 175-191.
Gamer, M., Zurowski, B., & Büchel, C. (2010). Different amygdala subregions mediate
valence-related and attentional effects of oxytocin in humans. Proceedings of the
National Academy of Sciences, 107(20), 9400-9405.
doi:10.1073/pnas.1000985107
Guastella, A. J., Hickie, I. B., McGuinness, M. M., Otis, M., Woods, E. A., Disinger, H.
M., . . . Banati, R. B. (2013). Recommendations for the standardisation of
oxytocin nasal administration and guidelines for its reporting in human research.
Psychoneuroendocrinology, 38(5), 612-625.
doi:10.1016/j.psyneuen.2012.11.019
Heinrichs, M., Baumgartner, T., Kirschbaum, C., & Ehlert, U. (2003). Social support
and oxytocin interact to suppress cortisol and subjective responses to
psychosocial stress. Biological Psychiatry, 54(12), 1389-1398.
Heinrichs, M., von Dawans, B., & Domes, G. (2009). Oxytocin, vasopressin, and
human social behavior. Frontiers in neuroendocrinology, 30(4), 548-557.
Hugrass, L., Labuschagne, I., Price, A., & Crewther, D. P. (Submitted for Publication).
Part 1: Intranasal oxytocin modulates very early visual processing of emotional
faces
167
Hupé, J., James, A., Payne, B., Lomber, S., Girard, P., & Bullier, J. (1998). Cortical
feedback improves discrimination between figure and background by V1, V2
and V3 neurons. Nature, 394(6695), 784-787.
Im, H. Y., Adams, R. B., Boshyan, J., Ward, N., Cushing, C. A., & Kveraga, K. (2017).
Observer’s anxiety facilitates magnocellular processing of clear facial threat
cues, but impairs parvocellular processing of ambiguous facial threat cues.
Scientific reports, 7(1), 15151.
Jackson, B. L., Blackwood, E. M., Blum, J., Carruthers, S. P., Nemorin, S., Pryor, B.
A., . . . Crewther, D. P. (2013). Magno- and Parvocellular Contrast Responses in
Varying Degrees of Autistic Trait. PLoS ONE, 8(6), e66797.
doi:10.1371/journal.pone.0066797
Kirsch, P., Esslinger, C., Chen, Q., Mier, D., Lis, S., Siddhanti, S., . . . Meyer-
Lindenberg, A. (2005). Oxytocin Modulates Neural Circuitry for Social
Cognition and Fear in Humans. The Journal of Neuroscience, 25(49), 11489-
11493. doi:10.1523/jneurosci.3984-05.2005
Klistorner, A., Crewther, D. P., & Crewther, S. G. (1997). Separate magnocellular and
parvocellular contributions from temporal analysis of the multifocal VEP.
Vision Research, 37(15), 2161-2169.
Kveraga, K., Boshyan, J., & Bar, M. (2007). Magnocellular Projections as the Trigger
of Top-Down Facilitation in Recognition. The Journal of Neuroscience, 27(48),
13232-13240. doi:10.1523/jneurosci.3481-07.2007
Labuschagne, I., Phan, K. L., Wood, A., Angstadt, M., Chua, P., Heinrichs, M., . . .
Nathan, P. J. (2010). Oxytocin attenuates amygdala reactivity to fear in
generalized social anxiety disorder. Neuropsychopharmacology, 35(12), 2403-
2413.
Labuschagne, I., Phan, K. L., Wood, A., Angstadt, M., Chua, P., Heinrichs, M., . . .
Nathan, P. J. (2012). Medial frontal hyperactivity to sad faces in generalized
social anxiety disorder and modulation by oxytocin. International Journal of
Neuropsychopharmacology, 15(7), 883-896.
Mattick, R. P., & Clarke, J. C. (1998). Development and validation of measures of
social phobia scrutiny fear and social interaction anxiety1. Behaviour Research
and Therapy, 36(4), 455-470. doi:https://doi.org/10.1016/S0005-
7967(97)10031-6
168
McCarthy, M. M., McDonald, C. H., Brooks, P. J., & Goldman, D. (1996). An
anxiolytic action of oxytocin is enhanced by estrogen in the mouse. Physiology
& behavior, 60(5), 1209-1215.
Meyer-Lindenberg, A. (2008). Impact of prosocial neuropeptides on human brain
function. Progress in brain research, 170, 463-470.
O’Connell, G., Whalley, H. C., Mukherjee, P., Stanfield, A. C., Montag, C., Hall, J., &
Reuter, M. (2012). Association of genetic variation in the promoter region of
OXTR with differences in social affective neural processing. Journal of
Behavioral and Brain Science, 2(01), 60.
Perry, A., Bentin, S., Shalev, I., Israel, S., Uzefovsky, F., Bar-On, D., & Ebstein, R. P.
(2010). Intranasal oxytocin modulates EEG mu/alpha and beta rhythms during
perception of biological motion. Psychoneuroendocrinology, 35(10), 1446-1453.
doi:10.1016/j.psyneuen.2010.04.011
Pessoa, L., & Adolphs, R. (2010). Emotion processing and the amygdala: from a 'low
road' to 'many roads' of evaluating biological significance. Nat Rev Neurosci,
11(11), 773-783.
doi:http://www.nature.com/nrn/journal/v11/n11/suppinfo/nrn2920_S1.html
Ross, H. E., & Young, L. J. (2009). Oxytocin and the neural mechanisms regulating
social cognition and affiliative behavior. Frontiers in neuroendocrinology, 30(4),
534-547.
Scheele, D., Kendrick, K. M., Khouri, C., Kretzer, E., Schläpfer, T. E., Stoffel-Wagner,
B., . . . Hurlemann, R. (2014). An oxytocin-induced facilitation of neural and
emotional responses to social touch correlates inversely with autism traits.
Neuropsychopharmacology, 39(9), 2078-2085.
Schulze, L., Lischke, A., Greif, J., Herpertz, S. C., Heinrichs, M., & Domes, G. (2011).
Oxytocin increases recognition of masked emotional faces.
Psychoneuroendocrinology, 36(9), 1378-1382.
Spielberger, C. D. (2010). State‐Trait anxiety inventory: Wiley Online Library.
Sripada, C. S., Phan, K. L., Labuschagne, I., Welsh, R., Nathan, P. J., & Wood, A. G.
(2012). Oxytocin enhances resting-state connectivity between amygdala and
medial frontal cortex. International Journal of Neuropsychopharmacology,
16(2), 255-260.
169
Sutherland, A., & Crewther, D. P. (2010). Magnocellular visual evoked potential delay
with high autism spectrum quotient yields a neural mechanism for altered
perception. Brain, 133(7), 2089-2097.
Sutter, E. (1992). A deterministic approach to nonlinear systems analysis. In R. B.
Pinter & B. Nabet (Eds.), Nonlinear Vision (pp. 171-220). Cleveland, Ohio:
CRC Press.
Tadel, F., Baillet, S., Mosher, J. C., Pantazis, D., & Leahy, R. M. (2011). Brainstorm: A
User-Friendly Application for MEG/EEG Analysis. Computational Intelligence
and Neuroscience, 2011, 13. doi:10.1155/2011/879716
Valstad, M., Alvares, G. A., Egknud, M., Matziorinis, A. M., Andreassen, O. A.,
Westlye, L. T., & Quintana, D. S. (2017). The correlation between central and
peripheral oxytocin concentrations: a systematic review and meta-analysis.
Neuroscience & Biobehavioral Reviews.
Van IJzendoorn, M. H., Bhandari, R., Van der Veen, R., Grewen, K. M., & Bakermans-
Kranenburg, M. J. (2012). Elevated salivary levels of oxytocin persist more than
7 h after intranasal administration. Frontiers in neuroscience, 6.
Vlamings, P. H. J. M., Goffaux, V., & Kemner, C. (2009). Is the early modulation of
brain activity by fearful facial expressions primarily mediated by coarse low
spatial frequency information? Journal of Vision, 9(5). doi:Artn 12
10.1167/9.5.12
Wurtz, R. H., & Albano, J. E. (1980). Visual-motor function of the primate superior
colliculus. Annual review of neuroscience, 3(1), 189-226.
170
Chapter 8: General Discussion The overall aim of this body of work was to use non-invasive techniques to infer
cortical processing of visual input from the human M and P pathways. The two reviews
and four experimental chapters addressed different aspects of this aim.
Chapters 2 and 3 contributed to knowledge in this area by reviewing techniques
for identifying M and P dominated signals in scalp-recorded VEPs. There were two
main conclusions drawn from the review presented in Chapter 2. Firstly, in comparison
to currently available VEP techniques, non-linear VEP provides the cleanest separation
of putative M and P signals (Jackson et al., 2013; Klistorner, Crewther, & Crewther,
1997; Momose, 2010). Secondly, the major advantage of non-linear VEP is that it
allows for simultaneous comparison of M and P contributions to the same visual
stimuli, unlike other techniques that rely on different stimulus characteristics, in
separate recordings, to target the M and P pathways (e.g.; Ellemberg, Hammarrenger,
Lepore, Roy, & Guillemot, 2001; Foxe et al., 2008; Lalor & Foxe, 2009; Souza et al.,
2008). As reviewed in Chapter 3, the non-linear VEP technique has been applied to
address a broad range of questions regarding input from the human M and P pathways
to cortical visual processing mechanisms.
The experiments presented within this thesis have made several contributions to
knowledge in the area, which are discussed in more detail below. The work presented in
Chapter 4 improved the understanding of how red backgrounds affect visual processing
(Section 8.1). The work presented in Chapter 5 furthered current knowledge regarding
the effects of diffuse chromatic saturation on temporally non-linear responses arising
from the primary visual cortex (Section 8.2). Chapters 6 and 7 made substantial
contributions to knowledge regarding the effects of oxytocin on visual processing
(Section 8.3). The final sections of this chapter link the key findings together and
outline the general conclusions and implications of this thesis as a whole. Section 8.4
addresses limitations in inferring processing in the subcortical visual pathways based on
scalp-recorded VEPs, and suggests some directions for future research. Finally, the
main conclusions of this thesis are laid out in Section 8.5.
8.1 Understanding the effects of red surrounds on visual processing The results presented in Chapter 4 challenge the assumption that red
backgrounds selectively suppress M contributions to visual processing at the cortical
level. A large number of studies have interpreted the effects of red backgrounds on
171
human behavioural and neuroimaging signals in terms of M specific suppression (e.g.;
Awasthi, Williams, & Friedman, 2016; Bedwell, Brown, & Orem, 2008; Bedwell et al.,
2013; West, Anderson, Bedwell, & Pratt, 2010). Therefore, this thesis has important
implications for this area of research.
8.1.1 Overview of original contributions
The experiments presented in Chapter 4 used non-linear VEP and psychophysical
techniques to compare widely accepted signatures of M and P responses to stimuli that
were presented on red and green backgrounds. Primate physiological studies identified a
subpopulation of M cells (i.e.; Type IV M cells), for which firing responses are
tonically suppressed when diffuse red light is presented in the receptive field surround
(de Monasterio, 1978; Derrington, Krauskopf, & Lennie, 1984; Hubel & Livingstone,
1990; Livingstone & Hubel, 1982). Based on this evidence, a large number of human
studies were conducted under the assumption that red backgrounds can be used as a
non-invasive tool for selectively suppressing M contributions to visual processing (e.g.;
Awasthi et al., 2016; Bedwell et al., 2008; Bedwell et al., 2013; West et al., 2010).
There are several reasons for questioning the validity of this assumption. Firstly,
there is no reason to believe a red surround would completely suppress M contributions
to visual processing. The majority of M cells (i.e.; Type III M cells) have receptive
fields that are spatially, but not chromatically opponent (Hubel & Livingstone, 1990).
Secondly, it is possible that a red background would also influence responses of the P
and K cells that transmit chromatic input to the cortex (Skottun, 2004) . Thirdly, in the
supragranular layers of macaque V1, transmembrane current flow is stronger in
response to red light than white or green light (Givre, Arezzo, & Schroeder, 1995). This
effect occurs to a lesser extent in layer 4Cβ, it does not reach statistical significance in
input layer 4Cα, and it is not observed in the M and P layers of the LGN. This suggests
that mechanisms within V1 may contribute to the effects of red backgrounds on visual
perception.
Based on these considerations, I designed non-linear VEP and steady and pulsed
psychophysics experiments to compare signatures of M and P responses to stimuli that
were presented on red and green backgrounds. The non-linear VEP experiment showed
that K2.1 responses were unaffected by background colour, yet the main K2.2 peak was
lower in amplitude with the red background than with the green background. These
results did not provide any evidence that a red background suppresses M contributions
172
to scalp-recorded VEPs. On the contrary, they imply that a red background may
enhance P recovery from stimulation.
The results of the steady and pulsed psychophysics experiment were somewhat
more complicated. For the initial version of the psychophysics task, I had designed
stimuli with grey pedestals on red and green backgrounds. Under these conditions,
steady pedestal thresholds were unaffected by background colour, and pulsed pedestal
thresholds were elevated with the red background. On the surface, these results would
imply that a red background does not affect steady state contrast gain in the M pathway,
but that it suppressed contrast sensitivity of P cells (Pokorny, 2011). Yet, the presence
of chromatic edges between the pedestals and backgrounds, in addition to some
departures from the classic response curves, made it difficult to interpret these findings
in terms of Pokorny and Smith’s (1997) original, achromatic version of the task.
In response to suggestions from an anonymous peer reviewer, I conducted a
follow-up psychophysics experiment, in which the pedestals and targets were the same
colour as the background (Figure 4.3). This eliminated the presence of chromatic edges
between the pedestals and backgrounds. For the pulsed pedestal experiment, there was
no effect of background colour on contrast discrimination thresholds. When the steady
pedestals were dimmer than the red background, thresholds tended to be lower in the
red conditions. When the steady pedestals were brighter than the background, the red
condition was associated with lower thresholds for the central targets and higher
threshold for the peripheral targets. These results suggest that a red background can
have different effects on putative M and P contrast sensitivities, depending on whether
the targets are brighter or dimmer than the surround, and whether they are presented
centrally or peripherally.
8.1.2 Implications
An immediate implication of this work is that it is necessary to re-interpret
existing literature that used red surrounds to infer the effects of M suppression on
human psychophysical and neuroimaging results. These inferences were based on the
assumption that red surrounds specifically suppress M contributions to visual
processing. I have challenged this assumption by demonstrating that the effects of red
backgrounds on vision vary depending on the nature of the stimuli.
For instance, under conditions of fast m-sequence stimulation, there was no
evidence that the red background suppressed the M pathway. Rather, red surrounds
173
appeared to decrease non-linearity in the K2.2 responses. This implies that diffuse red
light enables the P system to recover more rapidly from stimulation. For the
psychophysical task, under conditions when grey, pulsed pedestal stimuli were
presented on a coloured background, the current results suggest a red background
decreases the contrast gain of the P system (Pokorny, 2011). Under conditions when
steady pedestals were the same colour as the background stimuli, the results indicate
that a red background can either increase or decrease contrast detection thresholds,
depending on whether the pedestals are brighter or dimmer than the background, and
whether they are presented centrally or peripherally. This suggests that red surrounds
have different effects on the steady state gain of the ON and OFF subdivisions of the M
pathway. These mixed results demonstrate that it would be an oversimplification to
attribute all of the effects of red background on visual processing to selective
suppression of Type IV M cells.
The second key implication is that Type III and Type IV M cells might play
different roles in visual processing. Red surrounds produce profound and tonic
suppression of firing responses in Type IV M cells (de Monasterio, 1978; Hubel &
Livingstone, 1990), yet they do not appear to affect putative M signatures in non-linear
VEPs, and their effects on M contrast discrimination mechanisms range from subtle
facilitation to subtle suppression. This suggests that VEP and psychophysical signatures
of M processing are more sensitive to input from Type III than Type IV M cells, and
that the two M subpopulations might play different roles in visual processing. In support
of this idea, macaque physiological studies showed that Type IV M cells have a more
central retinal distribution than Type III M cells, and that unlike Type III M cells, they
do not project to the superior colliculus (de Monasterio, 1978).
8.2 Understanding the effects of diffuse chromatic saturation The MEG experiment reported in Chapter 5 was conducted to further investigate
EEG evidence that diffuse red or blue chromatic saturation increases K2.1 amplitudes
(Crewther & Crewther, 2010; Klistorner, Crewther, & Crewther, 1998). The novel
findings were an early peak in the K2.1 waveform that increased in amplitude for blue
chromatic saturation, and the localization of this peak to retinotopically mapped regions
of V1. This suggests that early processing of chromatic saturation reflects a neural
mechanism that recovers rapidly from stimulation. Such a mechanism may facilitate
174
figure ground segmentation during the first-pass analysis of the visual scene. The
implications of this finding, in relation to the existing literature, are discussed below.
8.2.1 Overview of original contributions
The majority of studies within the chromatic VEP literature presented
isoluminant red/green or blue/yellow gratings, in order to identify VEP signatures of
chromatically opponent processing (Gomes et al., 2006; Rabin, Switkes, Crognale,
Schneck, & Adams, 1994). However, this makes it difficult to separate the relative
influences of particular colours. Klistorner et al. (1998) showed that for diffuse (i.e.
unpatterned) multifocal VEP stimulation; the effects of luminance on responses to
pseudorandom green/grey alternations, are relatively simple, with no evidence of
chromatically sensitive signals over and above responses to achromatic luminance
contrast. On the other hand, for pseudorandom red/grey alternations, the non-linear VEP
waveforms were more complex, indicating a significant contribution of red sensitive
signals to the K2.1 response. In a related study, Crewther and Crewther (2010) found
that the amplitude of the K2.1 response increased steadily with the degree of blue or red
chromatic saturation.
I investigated the effects of blue chromatic saturation on the nonlinear temporal
structure of MEG signals, with the particular aim of identifying the cortical sources of
K1, K2.1 and K2.2 signals, specifically those which vary in amplitude with chromatic
saturation. Consistent with previous studies (Crewther & Crewther, 2010; Klistorner et
al., 1998) the K1, K2.1 and K2.2 peak amplitudes increased with chromatic saturation.
These waveforms appeared to be generated by the same retinotopically mapped cortical
sources in V1. The greatest effects of chromatic saturation were observed in the K2.1
waveform, at approximately 70ms. This is somewhat earlier in latency than the
chromatic effects reported in Crewther and Crewther’s (2010) EEG experiment
(~105ms). The current study might have been more sensitive to the early peak, because
independent responses were obtained from each quadrant of the foveal region. Previous
EEG studies reported responses to a single region centered on the fovea (Crewther &
Crewther, 2010; Klistorner et al., 1998), which may have masked the early effects of
chromatic saturation, due to cancellation of sources with different polarities (Baseler &
Sutter, 1997).
175
8.2.2 Implications
Given that the overarching aim of this thesis was to use non-linear VEPs to
investigate M and P contributions to visual processing, it was tempting to attribute the
effects of chromatic saturation on the early K2.1 waveform to signals arising from the
subcortical M pathway. For diffuse achromatic stimulation, converging evidence
suggests that the K2.1 waveform originates from M input to the visual cortex
(Crewther, Brown, & Hugrass, 2016; Jackson et al., 2013; Klistorner et al., 1997;
Momose, 2010). Due to receiving non-opponent input from both long and medium
wavelength cones, the M pathway does not appear to play a role in conscious perception
of hue, and it is commonly described as ‘colour blind’. Therefore, it would be intriguing
if the effects of chromatic saturation on the K2.1 response originated from the
subcortical M pathway; however closer examination of the literature led to a more
sophisticated interpretation.
The results of a physiological study in macaques shed light on the enhancement
of V1 responses to diffuse chromatic stimuli. Givre et al. (1995) used VEPs, current
source density and multi-unit activity to investigate responses to white, red, blue and
green light. Responses were recorded from V1 layers 4Cα, 4Cβ and 2/3, as well as from
the M and P layers of the LGN. Red and blue light tended to evoke higher amplitude V1
responses than green or white light, particularly in layers 2/3 and 4Cβ, and the effect
was always largest for red light. There was no evidence of chromatic enhancement of
responses at the level of the LGN, which suggests these wavelength specific effects
arise at the cortical level.
Crewther and Crewther (2010) found that the effects of diffuse chromatic
stimulation on K2.1 amplitudes are wavelength-dependent, with stronger responses to
blue and red stimulation, than to green and yellow stimulation. For patterned
stimulation, most of the response power is in the first order kernel, and amplitudes were
similar across a full range of hues. A plausible explanation is that the effects of diffuse
colour on VEPs arise from cells within the cytochrome oxidase blobs of V1 layers 2/3,
which respond most strongly to diffuse red and blue inputs (Dow & Vautin, 1987). P
input to layers 2/3 is spread uniformly across blob and inter-blob regions, whereas M
and K input is focused around the blob centres (Edwards, Purpura, & Kaplan, 1995;
Hendry & Reid, 2000). The majority of colour selective cells in V1 layers 2/3 show
strong responses to oriented edges, and relatively weak responses to the interiors of
176
objects (Johnson, Hawken, & Shapley, 2008). Within these cells, the poor luminance
contrast sensitivity, and preference for high spatial frequency stimulation are consistent
with input from the P pathway. By contrast, cells near the centres of cytochrome
oxidase blobs tend to have similar properties to cells in the M pathway, in that they
show high luminance contrast sensitivity, high temporal frequency sensitivity and a
preference for diffuse or low spatial frequency stimulation (Edwards et al., 1995;
Shoham, Hübener, Schulze, Grinvald, & Bonhoeffer, 1997).
In summary, the results presented in this thesis contribute to evidence that K2.1
amplitudes increase with chromatic saturation. The key contributions made to this body
of work were the discovery of an early (~70ms) K2.1 waveform that is highly sensitive
to diffuse blue chromatic saturation. The use of MEG enabled cortical source
localisation of the effects of chromatic saturation on non-linear VEP amplitudes in V1.
The fact that most of the power of this blue-saturation dependent signal is in the K2.1
waveform (rather than in the K2.2 waveform) suggests that this signal is generated by
neurons that recover rapidly from stimulation. Current evidence suggests that M (and
possibly K) input to the cytochrome oxidase blobs in V1 may play a role in the rapid
processing of chromatic surfaces, which could facilitate figure ground segmentation
during the first-pass analysis of the visual scene.
8.3 Understanding of the effects of oxytocin on early visual processing The experiments reported in Chapters 6 and 7 were conducted to investigate the
ways in which the neuropeptide, oxytocin (OXT) influences visual responses to
emotional face stimuli, and whether these effects might reflect a general enhancement
of M processing. These experimental chapters present complementary results from the
same sample of healthy male participants. The key discovery presented in Chapter 6
was that OXT modulates very early responses to facial emotion. The key discovery
presented in Chapter 7 is that OXT does not influence M or P responses to non-social
stimuli (diffuse flashes). Taken together, these findings imply that OXT influences early
stages of visual processing, but only in response to socially relevant stimuli.
8.3.1 Overview of original contributions
OXT is well known for its effects on social processing (Bartz & Hollander,
2008). Neuroimaging studies have shown that intranasal OXT administration can
suppress amygdala responses to emotional faces (Domes et al., 2007; Kirsch et al.,
177
2005), and influence the functional connectivity of the amygdala and superior colliculus
(Gamer, Zurowski, & Büchel, 2010) and frontal cortex (Sripada et al., 2012). It is also
known that intranasal OXT can improve recognition of facial emotions (Lischke et al.,
2012; Marsh, Henry, Pine, & Blair, 2010; Schulze et al., 2011). To date, very few
studies have used VEPs to investigate the effects of OXT on the timing of affective
processing, and none of these studies have included a condition with neutral facial
expressions (Althaus et al., 2015; Huffmeijer et al., 2013; Peltola, Strathearn, & Puura,
2018).
The experiments presented as a part of this thesis compared the acute effects of
OXT and placebo (PBO) administration on VEPs to fearful, happy and neutral faces
(Chapter 6) and non-linear VEPs to pseudorandom binary luminance modulation
(Chapter 7). To my knowledge, this is the first study to have reported modulation of
early (i.e.; 40- 100ms) VEP responses to facial emotion after OXT administration.
These results suggest that at early stages of visual processing, oxytocin modulates
responses to facial emotions, whereas at later stages of visual processing, it appears to
influence more general face processing mechanisms.
There is a growing body of evidence that the earliest stages of facial emotion
processing rely on the rapid projection of M input to the amygdala and frontal cortices
(Burt, Hugrass, Frith-Belvedere, & Crewther, 2017; Kveraga, Boshyan, & Bar, 2007;
Vlamings, Goffaux, & Kemner, 2009; Vuilleumier, Armony, Driver, & Dolan, 2003).
The experiment presented in Chapter 7 was the first to investigate whether OXT
modulates the flow of afferent input from the M and P streams to the cortex.
Interestingly, across the sample of healthy male participants, the magnitude of the K2.1
waveform was greater in participants with high trait social anxiety. This suggests that
trait anxiety slows recovery from prior stimulation in the M pathway. There were no
significant effects of OXT on the amplitudes or latencies of the K2.1 or K2.2 responses.
The key implication of Chapter 7 is that OXT does not play a role in gating M and P
afferent responses to non-social stimuli.
8.3.2 Implications
The results presented in Chapters 6 and 7 have made contributions to the
understanding of the mechanisms by which OXT modulates social and affective
processing (Bartz & Hollander, 2008). Theories regarding the effects of OXT on social
cognition can be grouped into three related categories, suggesting it enhances social
178
processing either by: increasing affiliative motivation, reducing anxiety, or altering the
perceptual salience of social cues (reviewed, Bartz, Zaki, Bolger, & Ochsner, 2011).
Although the studies presented within this thesis did not address the affiliative
motivation theory, implications for the latter two theories are discussed below.
Support for the anxiety reduction theory has come from studies that demonstrated
beneficial effects of OXT in groups of participants with social anxiety disorder or
autism (Bartz & Hollander, 2008; Bartz et al., 2010). Although the current experiments
were performed on a non-clinical sample of healthy males, the results suggest that
social anxiety is associated with less efficient M recovery from rapid stimulation. In a
related study, my colleagues and I showed that for participants with high levels of
autistic personality traits, increased temporal nonlinearity in the M pathway may
underlie the blunted effects of facial emotion on early VEP waveforms (Burt et al.,
2017). However, the results presented in Chapters 6 and 7, did not provide any evidence
that OXT lowered state anxiety, nor that it reduced the effects of social anxiety on M-
driven non-linear VEP responses. Therefore, the results presented here are consistent
with the argument that anxiety reduction might only contribute to the effects of OXT on
social processing in participants with very high levels of trait anxiety, or under
conditions when the experimental task increases state anxiety (Bartz et al., 2011).
Support for the theory that OXT enhances the perceptual salience of social cues
(Ross & Young, 2009; Schulze et al., 2011) has come from evidence that it increases
gaze to facial eye regions (Ebitz, Watson, & Platt, 2013), as well as functional coupling
between the amygdala and superior colliculi (Gamer et al., 2010). The results presented
in Chapter 6 are consistent with the claim that OXT has profound effects on the earliest
stages of social information processing (Ebitz et al., 2013). Whereas the differences in
the results presented in Chapters 6 and 7 highlight the importance of context in
mediating the effects of OXT on brain signals (Bartz et al., 2011). The current results
suggest that OXT moderates the rapid, M-driven volley of affective input to the
amygdala, but that it does not gate M-input to the cortex in the absence of social or
affective visual input.
8.4 Limitations and future directions
As discussed above, this body of work made contributions to knowledge across
a broad range of topics. The experiments presented within this thesis applied non-linear
VEP, in combination with other techniques, to make inferences about M and P
179
contributions to visual processing. Specific limitations and future directions were
discussed in each chapter; however there are some issues that apply to this body of work
as a whole. This section outlines limitations that arise when interpreting scalp-recorded
VEPs in terms of contributions from the subcortical afferent pathways, and provides
suggestions for future research in this area.
8.4.1 Relating primate physiology to human behaviour
Much of what we know about the M, P and K pathways is based on physiological
studies in primates, in particular macaques. Therefore, it is worthwhile considering
whether the properties of cells in the afferent pathways are comparable in macaques and
humans. Studies have shown broad similarities between the human and macaque midget
(i.e., P) and parasol (i.e., M) retinal ganglion cells, (Curcio & Allen, 1990; Dacey, 1993;
Dacey & Petersen, 1992; Goodchild, Ghosh, & Martin, 1996). Likewise, anatomical
studies of the human LGN show distinctions between cells in the ventral (M), dorsal (P)
and interlaminar (K) layers (Hickey & Guillery, 1981). However, there are some
relevant interspecies differences. For instance, human parasol retinal ganglion cells tend
to have larger dendritic fields (Dacey & Petersen, 1992). This may explain some
discrepancies in M psychophysics for humans and macaques (Cavonius & Robbins,
1973). Furthermore, without single cell physiological investigations, one cannot say for
certain whether there is a distinction between Type III and Type IV M cells in the
human retina and LGN.
Studies in macaques that have compared VEPs, current source density, and
multiunit activity have been particularly useful in supporting physiological
interpretations of scalp recorded VEPs in humans (Givre et al., 1995; Schroeder, Mehta,
& Givre, 1998; Schroeder, Tenke, Givre, Arezzo, & Vaughan Jr, 1991). Comparisons of
VEPs recorded from V1 layers 2/3, 4Cα and 4Cβ, as well as M and P layers of the
LGN, have been particularly useful in understanding how input from the afferent
pathways, and intracortical mechanisms contribute to the generation of scalp recorded
signals (Givre et al., 1995; Schroeder et al., 1991). Using these recording techniques in
combination with fast m-sequence/multifocal stimulation would help to clarify
contributions from the M, P and K pathways to the K1, K2.1 and K2.2 VEP waveforms.
180
8.4.2 Separation of K signals from M and P signals
It is also important to acknowledge the potential for overlapping effects from the
different afferent pathways. The putative M and P signals that we measured with non-
linear VEP analyses and paired and pulsed psychophysics are broadly consistent with
the properties of the primate M and P systems (Klistorner et al., 1997; Pokorny &
Smith, 1997). Yet, such distinctions are complicated by subpopulations of K cells with
similar contrast response functions to those of the M and P pathways (Hendry & Reid,
2000). However, due to sluggish temporal responses (Irvin, Casagrande, & Norton,
1993), it is unlikely that K cells produce non-linear temporal signatures that overlap
with those generated within the M pathway.
8.4.3 Updating the three-pathway hypothesis
It is convenient to describe the afferent visual pathways from the retina to the
LGN and V1 in terms of segregated M, P and K streams that subserve different
functions. However, current evidence suggests that this view is far too simplistic, and
that the three stream hypothesis should be replaced by either a multi-stream hypothesis
or a network model, in which most cell types contribute to the perception of most
attributes (Jazayeri & Movshon, 2006; Kaplan, 2014). These considerations call for
cognitive neuroscientists to develop more sophisticated techniques for teasing apart
contributions from multiple, overlapping afferent pathways.
8.4.4 Other M-driven subcortical visual pathways
Due to the nature of fast-m sequence stimulation, non-linear VEP kernel
waveforms are strongly localised to V1, without much contribution from extrastriate
sources (Fortune & Hood, 2003). This makes the non-linear VEP technique well suited
for studying M and P contributions to processing within V1. However, this technique is
not well suited to studying M projections via other subcortical pathways.
Object recognition was once viewed as a hierarchical, bottom up neural process,
but current models indicate that rapid projection of M input to the orbitofrontal cortex
facilitates bottom-up object perception (Kveraga et al., 2007). In addition, current
models of emotional processing suggest that visual input is projected from the retina to
the amygdala within several M-driven subcortical routes via the superior colliculus and
pulvinar (Yoshor, Bosking, Ghose, & Maunsell, 2007). Human studies of M-driven
subcortical routes to the cortex have mostly relied on creating stimuli that bias visual
181
processing towards the M or P pathways. For example, low luminance contrast versus
isoluminant chromatic stimulation, or low and high spatial frequency stimulation
(Kveraga et al., 2007; Vlamings et al., 2009; Vuilleumier et al., 2003). A challenge for
this area of research will be to develop more robust, non-invasive methods for probing
these alternate M pathways.
8.4.5 Individual differences
Comparisons of scalp-recorded VEPs across individuals are complicated by a
large degree of inter-subject variability in the waveforms. This is likely to reflect
individual differences both in cortical folding patterns, and retinotopic maps of V1
(DeYoe et al., 1996; Engel, 2012). When singular value decomposition (SVD) and
principle components analysis (PCA) are applied to multifocal VEPs, two components
account for a high percentage of intra- and inter-subject variance in the data (Dandekar,
Ales, Carney, & Klein, 2007; Zhang & Hood, 2004). This makes it possible to resolve
VEPs that arise from very close cortical sources, such as V1 and V2 (Ales, Carney, &
Klein, 2010; Carney, Ales, & Klein, 2008). Future studies that apply these techniques
would enable more accurate comparisons of K2.1 and K2.2 waveforms across groups
with low and high autistic tendency, dyslexia and dyscalculia (see Chapter 2).
8.5 Conclusions In conclusion, non-linear analysis of multifocal VEPs has enabled researchers to
study scalp-recorded signals that appear to arise from the M and P visual pathways. This
has led to a great deal of research into the ways in which input from the M and P
pathways contributes to visual processing.
This thesis used non-linear VEP, in combination with other techniques to
provide novel contributions to three main areas of research. The results demonstrate that
it would be an oversimplification to attribute the effects of a red background on
stimulus processing to suppression of the subcortical M pathway. Furthermore, it would
be an oversimplification to attribute all aspects of chromatic processing to signals
arising from the P and K pathways. On the contrary, the work presented here implies
that the effects of blue chromatic saturation on cortical evoked responses are generated
by a mechanism with rapid recovery from stimulation, which may reflect M input to the
cytochrome oxidase blob centres in V1. Finally, evidence presented within this thesis
182
suggests that the effects of oxytocin on the very early stages of visual processing vary,
depending on the presence of emotionally relevant stimuli.
This thesis highlights difficulties in linking human behaviour and scalp-recorded
VEPs with M and P physiology, and speaks to the advantages of using a variety of
complementary techniques to investigate the earliest stages of visual processing. Future
research would benefit from the development of non-invasive techniques for studying
the multiple parallel pathways from the retina to the cortex.
8.6 References Ales, J., Carney, T., & Klein, S. A. (2010). The folding fingerprint of visual cortex
reveals the timing of human V1 and V2. Neuroimage, 49(3), 2494-2502.
Althaus, M., Groen, Y., Wijers, A., Noltes, H., Tucha, O., & Hoekstra, P. (2015).
Oxytocin enhances orienting to social information in a selective group of high-
functioning male adults with autism spectrum disorder. Neuropsychologia, 79,
53-69.
Awasthi, B., Williams, M. A., & Friedman, J. (2016). Examining the role of red
background in magnocellular contribution to face perception. PeerJ, 4, e1617.
doi:10.7717/peerj.1617
Bartz, J. A., & Hollander, E. (2008). Oxytocin and experimental therapeutics in autism
spectrum disorders. Progress in brain research, 170, 451-462.
Bartz, J. A., Zaki, J., Bolger, N., Hollander, E., Ludwig, N. N., Kolevzon, A., &
Ochsner, K. N. (2010). Oxytocin selectively improves empathic accuracy.
Psychological Science, 21(10), 1426-1428.
Bartz, J. A., Zaki, J., Bolger, N., & Ochsner, K. N. (2011). Social effects of oxytocin in
humans: context and person matter. Trends in cognitive sciences, 15(7), 301-
309.
Baseler, H., & Sutter, E. (1997). M and P components of the VEP and their visual field
distribution. Vision Research, 37(6), 675-690.
Bedwell, J. S., Brown, J. M., & Orem, D. M. (2008). The effect of a red background on
location backward masking by structure. Attention, Perception, &
Psychophysics, 70(3), 503-507.
Bedwell, J. S., Chan, C. C., Cohen, O., Karbi, Y., Shamir, E., & Rassovsky, Y. (2013).
The magnocellular visual pathway and facial emotion misattribution errors in

183
schizophrenia. Progress in Neuro-Psychopharmacology and Biological
Psychiatry, 44, 88-93. doi:https://doi.org/10.1016/j.pnpbp.2013.01.015
Burt, A., Hugrass, L., Frith-Belvedere, T., & Crewther, D. (2017). Insensitivity to
Fearful Emotion for Early ERP Components in High Autistic Tendency Is
Associated with Lower Magnocellular Efficiency. Frontiers in Human
Neuroscience, 11, 495.
Carney, T., Ales, J., & Klein, S. A. (2008). Combining MRI and VEP imaging to isolate
the temporal response of visual cortical areas. Paper presented at the Human
Vision and Electronic Imaging XIII.
Cavonius, C., & Robbins, D. (1973). Relationships between luminance and visual
acuity in the rhesus monkey. The Journal of Physiology, 232(2), 239-246.
Crewther, D. P., Brown, A., & Hugrass, L. (2016). Temporal structure of human
magnetic evoked fields. Exp Brain Res, 234(7), 1987-1995. doi:10.1007/s00221-
016-4601-0
Crewther, D. P., & Crewther, S. G. (2010). Different Temporal Structure for Form
versus Surface Cortical Color Systems – Evidence from Chromatic Non-Linear
VEP. PLoS ONE, 5(12), e15266. doi:10.1371/journal.pone.0015266
Curcio, C. A., & Allen, K. A. (1990). Topography of ganglion cells in human retina.
Journal of Comparative Neurology, 300(1), 5-25.
Dacey, D. M. (1993). The mosaic of midget ganglion cells in the human retina. Journal
of Neuroscience, 13(12), 5334-5355.
Dacey, D. M., & Petersen, M. R. (1992). Dendritic field size and morphology of midget
and parasol ganglion cells of the human retina. Proceedings of the National
Academy of Sciences, 89(20), 9666-9670.
Dandekar, S., Ales, J., Carney, T., & Klein, S. A. (2007). Methods for quantifying intra-
and inter-subject variability of evoked potential data applied to the multifocal
visual evoked potential. Journal of neuroscience methods, 165(2), 270-286.
de Monasterio, F. M. (1978). Properties of concentrically organized X and Y ganglion
cells of macaque retina. Journal of Neurophysiology, 41(6), 1394-1417.
Derrington, A. M., Krauskopf, J., & Lennie, P. (1984). Chromatic mechanisms in lateral
geniculate nucleus of macaque. The Journal of Physiology, 357, 241-265.

184
DeYoe, E. A., Carman, G. J., Bandettini, P., Glickman, S., Wieser, J., Cox, R., . . .
Neitz, J. (1996). Mapping striate and extrastriate visual areas in human cerebral
cortex. Proceedings of the National Academy of Sciences, 93(6), 2382-2386.
Domes, G., Heinrichs, M., Gläscher, J., Büchel, C., Braus, D. F., & Herpertz, S. C.
(2007). Oxytocin attenuates amygdala responses to emotional faces regardless of
valence. Biological Psychiatry, 62(10), 1187-1190.
Dow, B., & Vautin, R. (1987). Horizontal segregation of color information in the
middle layers of foveal striate cortex. Journal of Neurophysiology, 57(3), 712-
739.
Ebitz, R. B., Watson, K. K., & Platt, M. L. (2013). Oxytocin blunts social vigilance in
the rhesus macaque. Proceedings of the National Academy of Sciences, 110(28),
11630-11635.
Edwards, D. P., Purpura, K. P., & Kaplan, E. (1995). Contrast sensitivity and spatial
frequency response of primate cortical neurons in and around the cytochrome
oxidase blobs. Vision Research, 35(11), 1501-1523.
Ellemberg, D., Hammarrenger, B., Lepore, F., Roy, M.-S., & Guillemot, J.-P. (2001).
Contrast dependency of VEPs as a function of spatial frequency: the
parvocellular and magnocellular contributions to human VEPs. Spatial vision,
15(1), 99-111.
Engel, S. A. (2012). The development and use of phase-encoded functional MRI
designs. Neuroimage, 62(2), 1195-1200.
doi:http://dx.doi.org/10.1016/j.neuroimage.2011.09.059
Fortune, B., & Hood, D. C. (2003). Conventional pattern-reversal VEPs are not
equivalent to summed multifocal VEPs. Investigative Ophthalmology & Visual
Science, 44(3), 1364-1375.
Foxe, J. J., Strugstad, E. C., Sehatpour, P., Molholm, S., Pasieka, W., Schroeder, C. E.,
& McCourt, M. E. (2008). Parvocellular and magnocellular contributions to the
initial generators of the visual evoked potential: high-density electrical mapping
of the “C1” component. Brain topography, 21(1), 11-21.
Gamer, M., Zurowski, B., & Büchel, C. (2010). Different amygdala subregions mediate
valence-related and attentional effects of oxytocin in humans. Proceedings of the
National Academy of Sciences, 107(20), 9400-9405.
doi:10.1073/pnas.1000985107

185
Givre, S., Arezzo, J., & Schroeder, C. (1995). Effects of wavelength on the timing and
laminar distribution of illuminance-evoked activity in macaque V1. Visual
Neuroscience, 12(2), 229-239.
Gomes, B. D., Souza, G. S., Rodrigues, A. R., Saito, C. A., Silveira, L. C. L., & Da
Silva Filho, M. (2006). Normal and dichromatic color discrimination measured
with transient visual evoked potential. Visual Neuroscience, 23(3-4), 617-627.
Goodchild, A. K., Ghosh, K. K., & Martin, P. R. (1996). Comparison of photoreceptor
spatial density and ganglion cell morphology in the retina of human, macaque
monkey, cat, and the marmoset Callithrix jacchus. Journal of Comparative
Neurology, 366(1), 55-75.
Hendry, S. H., & Reid, R. C. (2000). The koniocellular pathway in primate vision.
Annual review of neuroscience, 23(1), 127-153.
Hickey, T., & Guillery, R. (1981). A study of Golgi preparations from the human lateral
geniculate nucleus. Journal of Comparative Neurology, 200(4), 545-577.
Hubel, D. H., & Livingstone, M. S. (1990). Color and contrast sensitivity in the lateral
geniculate body and primary visual cortex of the macaque monkey. Journal of
Neuroscience, 10(7), 2223-2237.
Huffmeijer, R., Alink, L. R., Tops, M., Grewen, K. M., Light, K. C., Bakermans-
Kranenburg, M. J., & van Ijzendoorn, M. H. (2013). The impact of oxytocin
administration and maternal love withdrawal on event-related potential (ERP)
responses to emotional faces with performance feedback. Horm Behav, 63(3),
399-410. doi:10.1016/j.yhbeh.2012.11.008
Irvin, G. E., Casagrande, V. A., & Norton, T. T. (1993). Center/surround relationships
of magnocellular, parvocellular, and koniocellular relay cells in primate lateral
geniculate nucleus. Visual Neuroscience, 10(2), 363-373.
Jackson, B. L., Blackwood, E. M., Blum, J., Carruthers, S. P., Nemorin, S., Pryor, B.
A., . . . Crewther, D. P. (2013). Magno-and parvocellular contrast responses in
varying degrees of autistic trait. PLoS ONE, 8(6), e66797.
Jazayeri, M., & Movshon, J. A. (2006). Optimal representation of sensory information
by neural populations. Nature neuroscience, 9(5), 690.
Johnson, E. N., Hawken, M. J., & Shapley, R. (2008). The orientation selectivity of
color-responsive neurons in macaque V1. Journal of Neuroscience, 28(32),
8096-8106.
186
Kaplan, E. (2014). The M, P and K pathways of the primate visual system revisited. The
new visual neurosciences (Werner JS, Chalupa LM, eds.). Cambridge, MA:
Massachusetts Institute of Technology.
Kirsch, P., Esslinger, C., Chen, Q., Mier, D., Lis, S., Siddhanti, S., . . . Meyer-
Lindenberg, A. (2005). Oxytocin Modulates Neural Circuitry for Social
Cognition and Fear in Humans. The Journal of Neuroscience, 25(49), 11489-
11493. doi:10.1523/jneurosci.3984-05.2005
Klistorner, A., Crewther, D. P., & Crewther, S. G. (1997). Separate magnocellular and
parvocellular contributions from temporal analysis of the multifocal VEP. Vision
Research, 37(15), 2161-2169.
Klistorner, A., Crewther, D. P., & Crewther, S. G. (1998). Temporal analysis of the
chromatic flash VEP—separate colour and luminance contrast components.
Vision Research, 38(24), 3979-4000. doi:http://dx.doi.org/10.1016/S0042-
6989(97)00394-5
Kveraga, K., Boshyan, J., & Bar, M. (2007). Magnocellular Projections as the Trigger
of Top-Down Facilitation in Recognition. The Journal of Neuroscience, 27(48),
13232-13240. doi:10.1523/jneurosci.3481-07.2007
Lalor, E. C., & Foxe, J. J. (2009). Visual evoked spread spectrum analysis (VESPA)
responses to stimuli biased towards magnocellular and parvocellular pathways.
Vision Research, 49(1), 127-133.
Lischke, A., Berger, C., Prehn, K., Heinrichs, M., Herpertz, S. C., & Domes, G. (2012).
Intranasal oxytocin enhances emotion recognition from dynamic facial
expressions and leaves eye-gaze unaffected. Psychoneuroendocrinology, 37(4),
475-481.
Livingstone, M. S., & Hubel, D. H. (1982). Thalamic inputs to cytochrome oxidase-rich
regions in monkey visual cortex. Proceedings of the National Academy of
Sciences, 79(19), 6098-6101.
Marsh, A. A., Henry, H. Y., Pine, D. S., & Blair, R. (2010). Oxytocin improves specific
recognition of positive facial expressions. Psychopharmacology (Berl), 209(3),
225-232.
Momose, K. (2010). Extraction of M and P components from the visual evoked
potential using pseudorandom stimulation with swept parameter technique.
187
Paper presented at the Engineering in Medicine and Biology Society (EMBC),
2010 Annual International Conference of the IEEE.
Peltola, M. J., Strathearn, L., & Puura, K. (2018). Oxytocin Promotes Face-Sensitive
Neural Responses to Infant and Adult Faces in Mothers.
Psychoneuroendocrinology.
Pokorny, J. (2011). Steady and pulsed pedestals, the how and why of post-receptoral
pathway separation. Journal of Vision, 11(5), 7-7.
Pokorny, J., & Smith, V. C. (1997). Psychophysical signatures associated with
magnocellular and parvocellular pathway contrast gain. Journal of the Optical
Society of America. A, Optics, Image Science, and Vision, 14(9), 2477-2486.
Rabin, J., Switkes, E., Crognale, M., Schneck, M. E., & Adams, A. J. (1994). Visual
evoked potentials in three-dimensional color space: correlates of spatio-
chromatic processing. Vision Research, 34(20), 2657-2671.
Ross, H. E., & Young, L. J. (2009). Oxytocin and the neural mechanisms regulating
social cognition and affiliative behavior. Frontiers in neuroendocrinology,
30(4), 534-547.
Schroeder, C., Mehta, A. D., & Givre, S. J. (1998). A spatiotemporal profile of visual
system activation revealed by current source density analysis in the awake
macaque. Cerebral cortex (New York, NY: 1991), 8(7), 575-592.
Schroeder, C., Tenke, C., Givre, S., Arezzo, J., & Vaughan Jr, H. (1991). Striate cortical
contribution to the surface-recorded pattern-reversal VEP in the alert monkey.
Vision Research, 31(7-8), 1143-1157.
Schulze, L., Lischke, A., Greif, J., Herpertz, S. C., Heinrichs, M., & Domes, G. (2011).
Oxytocin increases recognition of masked emotional faces.
Psychoneuroendocrinology, 36(9), 1378-1382.
Shoham, D., Hübener, M., Schulze, S., Grinvald, A., & Bonhoeffer, T. (1997). Spatio–
temporal frequency domains and their relation to cytochrome oxidase staining in
cat visual cortex. Nature, 385(6616), 529.
Skottun, B. C. (2004). On the use of red stimuli to isolate magnocellular responses in
psychophysical experiments: A perspective. Visual Neuroscience, 21(1), 63-68.
doi:10.1017/S0952523804041069
Souza, G. S., Gomes, B. D., Lacerda, E. M. C., Saito, C. A., Da Silva Filho, M., &
Silveira, L. C. L. (2008). Amplitude of the transient visual evoked potential
188
(tVEP) as a function of achromatic and chromatic contrast: contribution of
different visual pathways. Visual Neuroscience, 25(3), 317-325.
Sripada, C. S., Phan, K. L., Labuschagne, I., Welsh, R., Nathan, P. J., & Wood, A. G.
(2012). Oxytocin enhances resting-state connectivity between amygdala and
medial frontal cortex. International Journal of Neuropsychopharmacology,
16(2), 255-260.
Vlamings, P. H. J. M., Goffaux, V., & Kemner, C. (2009). Is the early modulation of
brain activity by fearful facial expressions primarily mediated by coarse low
spatial frequency information? Journal of Vision, 9(5). doi:Artn12
10.1167/9.5.12
Vuilleumier, P., Armony, J. L., Driver, J., & Dolan, R. J. (2003). Distinct spatial
frequency sensitivities for processing faces and emotional expressions. Nature
neuroscience, 6(6), 624-631. doi:10.1038/nn1057
West, G. L., Anderson, A. K., Bedwell, J. S., & Pratt, J. (2010). Red diffuse light
suppresses the accelerated perception of fear. Psychological Science, 21(7), 992-
999.
Yoshor, D., Bosking, W. H., Ghose, G. M., & Maunsell, J. H. R. (2007). Receptive
Fields in Human Visual Cortex Mapped with Surface Electrodes. Cerebral
Cortex, 17(10), 2293-2302. doi:10.1093/cercor/bhl138
Zhang, X., & Hood, D. C. (2004). A principal component analysis of multifocal pattern
reversal VEP. Journal of Vision, 4(1), 4-4.

189
Appendix A: Certificates of ethics approval
A.1 SUHREC Project 2015/064: Transformations in Visual Cortex: From neural
input to recognition
The experiments presented in Chapters 4 and 5 were part of the above-
mentioned project. The procedures were approved by the Swinburne University Human
Research Ethics Committee, and were conducted in accordance with the Declaration of
Helsinki
190
01/03/2018 Mail - [email protected]
https://outlook.office.com/owa/?realm=swin.edu.au&exch=1&path=/mail/inbox 1/1
FW: Acknowledgement of Report for SUHREC Project ‐ 2015/064
FYI again Laila, Sally
‐‐‐‐‐Original Message‐‐‐‐‐ From: [email protected] [mailto:[email protected]] Sent: Thursday, 1 March 2018 8:18 AM To: David Crewther <[email protected]> Cc: RES Ethics <[email protected]> Subject: Acknowledgement of Report for SUHREC Project ‐ 2015/064
Dear David,
Re: End of Student Involvement Report for the project 2015/064
'Transformation in Human Visual Cortex ‐ from Neural Input to Recognition' ﴾Report Date: 28‐02‐2018﴿
The End of Student Involvement report for the above project has been processed and satisfies the reportingrequirements set under the terms of ethics clearance.
Thank you for your attention to this matter.
Regards Research Ethics Team
Swinburne Research ﴾H68﴿ Swinburne University of Technology PO Box 218 HAWTHORN VIC 3122 Tel: 03 9214 3845 Fax: 03 9214 5267 Email: [email protected]
Sally Fried on behalf of RES EthicsThu 1/03/2018 8:18 AM
To:Laila Hugrass <[email protected]>; RES Ethics <[email protected]>;
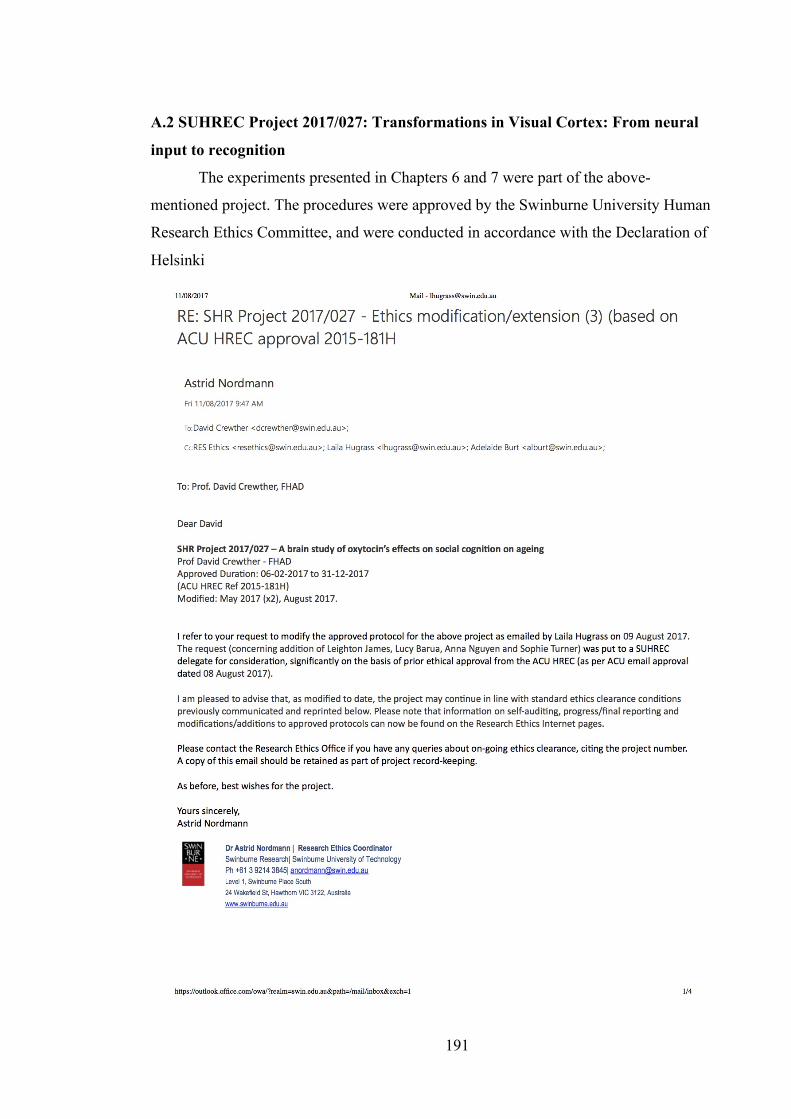
191
A.2 SUHREC Project 2017/027: Transformations in Visual Cortex: From neural
input to recognition
The experiments presented in Chapters 6 and 7 were part of the above-
mentioned project. The procedures were approved by the Swinburne University Human
Research Ethics Committee, and were conducted in accordance with the Declaration of
Helsinki

192
06/03/2018 Mail - [email protected]
https://outlook.office.com/owa/?realm=swin.edu.au&exch=1&path=/mail/search 1/1
FW: Acknowledgement of Report for SUHREC Project ‐ 2017/027
FYI again Laila...Sally
‐‐‐‐‐Original Message‐‐‐‐‐ From: [email protected] [mailto:[email protected]] Sent: Wednesday, 28 February 2018 2:05 PM To: David Crewther <[email protected]> Cc: RES Ethics <[email protected]> Subject: Acknowledgement of Report for SUHREC Project ‐ 2017/027
Dear David,
Re: End of Student Involvement Report for the project 2017/027
'A brain study of oxytocin's effects on social cognition on ageing' ﴾Report Date: 28‐02‐2018﴿
The End of Student Involvement report for the above project has been processed and satisfies the reportingrequirements set under the terms of ethics clearance.
Thank you for your attention to this matter.
Regards Research Ethics Team
Swinburne Research ﴾H68﴿ Swinburne University of Technology PO Box 218 HAWTHORN VIC 3122 Tel: 03 9214 3845 Fax: 03 9214 5267 Email: [email protected]
Sally Fried on behalf of RES EthicsWed 28/02/2018 2:06 PM
To:Laila Hugrass <[email protected]>; RES Ethics <[email protected]>;

193
Appendix B: Authorship Indication Forms
B.1 Authorship indication for the paper presented in Chapter 2

194
B.2 Authorship indication for the paper presented in Chapter 3

195
B.3 Authorship indication for the paper presented in Chapter 4
196

197
B.4 Authorship indication for the paper presented in Chapter 5

198
B.5 Authorship indication for the paper presented in Chapter 6

199
B.6 Authorship indication for the paper presented in Chapter 7

200
Appendix C: Summary of Journals in which paper are/are to be
published
Papers In Press
Hugrass, L., Verhellen, T., Morrall-Earney, E, Mallon, C & Crewther, D.P. (In Press).
The effects of red surrounds on visual magnocellular and parvocellular cortical
processing and perception. Journal of Vision

201
Papers In Submission Hugrass, L., & Crewther, D. (In Submission). The afferent pathway origins of scalp
recorded visual evoked potentials - A review
• This work has been submitted for publication as a review in Experimental Brain
Research. It is currently with the reviews editor.
Hugrass, L., & Crewther, D. (In Submission). A review of non-linear visual evoked
potential research into contributions from the human M and P pathways to
cortical vision.
• This work has been submitted for publication as a review in the European
Journal of Neuroscience
Hugrass, L., Labuschagne, I., Price, A., & Crewther, D. (In Submission). Part 1:
Intranasal oxytocin modulates very early visual processing of emotional faces.
• This paper has been submitted for publication as an original research article in
Hormones and Behaviour. It is currently under review.
Hugrass, L., & Crewther, D. (In Submission). Part 2: Acute intranasal oxytocin does not
influence the non-linear temporal structure of cortical visual evoked potentials.
• This paper has been submitted for publication as an original research article in
Hormones and Behaviour. It is currently under review.
Papers In Preparation
Hugrass, L., & Crewther, D. (In Preparation). The temporal structure of evoked MEG
responses: Effects of chromatic saturation
• This work is currently in preparation for submission as an original research
article for the journal, Frontiers in Neuroscience.