The effects of subcortical lesions on evoked potentials and spontaneous high frequency (gamma-band)...
12
BRAIN RESEARCH ELSEVIER Brain Research 721 (1996) 155-166 Research report The effects of subcortical lesions on evoked potentials and spontaneous high frequency (gamma-band) oscillating potentials in rat auditory cortex Barbara Brett, Geetha Krishnan, Daniel S. Barth * Department of Psychology, University of Colorado, Campus Box 345, Boulder, CO 80309-0345, USA Accepted 30 January 1996 Abstract Functional subdivisions of auditory cortex in the rat were identified based on the distribution of temporal components of the mid-latency auditory evoked potential (MAEP) recorded with a multichannel epipial electrode array. Spontaneous data collected from the same location exhibited spindle-shaped bursts of oscillations in the gamma-band (20-40 Hz) whose location and spatial distribution were similar to that of the MAEP complex in that the bursts were localized to primary and secondary auditory cortex, the principle targets of thalamocortical projections. This suggested that the neural generators of these electrophysiological events may be similar. However, ablation of the medial geniculate nucleus (MG) of the thalamus revealed that while this nucleus is required for the generation of MAEPs, it is not required for the generation of spontaneous gamma-band oscillations. Ablation of subcortical cholinergic nuclei revealed that cholinergic input via the thalamus or the basal forebrain is not necessary for the generation of either MAEPs or spontaneous gamma-band oscillations recorded in this study. These results indicated that there may be networks of ceils in sensory cortical areas endowed with an intrinsic capacity to oscillate independently of sensory or cholinergic input, but that may be modulated by this input. Keywords: Auditory; Evoked potential; EEG; Gamma-band 1. Introduction Donald Hebb's [25] proposal that representations of sensations should consist of assemblies of cooperatively interacting neurons is exemplified in the recording of extracellular evoked potentials, and both stimulus-induced and spontaneous oscillatory potentials, which reflect coher- ent spatiotemporal summation of many thousands of simi- larly aligned dendritic processes [10]. Single click stimuli initiate a stereotypical response sequence in assemblies of neurons within cytoarchitecturally defined areas of rat auditory cortex [2,3,8,11,12] recordable as MAEPs. Rat auditory cortex, and sensory cortex of other modalities and species, also produces high frequency (> 20 Hz) oscilla- tions of potential during trains of repetitive stimuli [17,19- 21], following single brief or prolonged stimuli [7,15- 18,22,23,29,33,34,36], and spontaneously, in the absence of any overt stimulation [17,28,29]. Rhythmic potentials in this gamma frequency band have received attention be- cause of their occurrence in both humans and animals, their possible relevance to the concept of grouping stimu- * Corresponding author. E-mail: [email protected] 0006-8993/96/$15.00 © 1996 Elsevier Science B.V. All rights reserved Pll S0006-8993(96)00168-0 lus features into perceptual objects (the 'binding problem'; see Singer, for review [43]), and because of their associa- tion with focused arousal [5-7,33,38,40,41,51]. While the neurogenesis of cortical evoked potentials such as the MAEP has been studied in the rat, and appears to involve parallel activation of specific and nonspecific thalamocortical projections to layer IV [8] and a systematic cascade of excitation and inhibition across the cortical lamina [1,2], the neurogenesis of induced and spontaneous gamma-band oscillations is less established. Most theories propose the involvement of some form of reciprocal con- nections between distributed neuronal elements [43]. This involvement may consist of common oscillatory input from subcortical centers, such as the thalamus, where oscillatory activities have been observed with extracellular field potential, multi-unit, and action potential recordings [44,45,47-50]. Oscillations of 20-40 Hz recorded intra- cellularly from thalamic cells of the cat intralaminar nuclei (IL) [49,50], particularly the centrolateral nucleus (CL) which has widespread connections to the cortex, suggest that thalamocortical connections may play a direct pace- making role in cortical gamma-band activity. Stimulation of the nucleus basalis (NB), a major source of neocortical
Transcript of The effects of subcortical lesions on evoked potentials and spontaneous high frequency (gamma-band)...
BRAIN RESEARCH
E L S E V I E R Brain Research 721 (1996) 155-166
Research report
The effects of subcortical lesions on evoked potentials and spontaneous high frequency (gamma-band) oscillating potentials in rat auditory cortex
Barbara Brett, Geetha Krishnan, Daniel S. Barth *
Department of Psychology, University of Colorado, Campus Box 345, Boulder, CO 80309-0345, USA
Accepted 30 January 1996
Abstract
Functional subdivisions of auditory cortex in the rat were identified based on the distribution of temporal components of the mid-latency auditory evoked potential (MAEP) recorded with a multichannel epipial electrode array. Spontaneous data collected from the same location exhibited spindle-shaped bursts of oscillations in the gamma-band (20-40 Hz) whose location and spatial distribution were similar to that of the MAEP complex in that the bursts were localized to primary and secondary auditory cortex, the principle targets of thalamocortical projections. This suggested that the neural generators of these electrophysiological events may be similar. However, ablation of the medial geniculate nucleus (MG) of the thalamus revealed that while this nucleus is required for the generation of MAEPs, it is not required for the generation of spontaneous gamma-band oscillations. Ablation of subcortical cholinergic nuclei revealed that cholinergic input via the thalamus or the basal forebrain is not necessary for the generation of either MAEPs or spontaneous gamma-band oscillations recorded in this study. These results indicated that there may be networks of ceils in sensory cortical areas endowed with an intrinsic capacity to oscillate independently of sensory or cholinergic input, but that may be modulated by this input.
Keywords: Auditory; Evoked potential; EEG; Gamma-band
1. Introduct ion
Donald Hebb ' s [25] proposal that representations of sensations should consist of assemblies of cooperat ively interacting neurons is exemplif ied in the recording of extracellular evoked potentials, and both st imulus-induced and spontaneous oscil latory potentials, which reflect coher- ent spatiotemporal summation of many thousands of simi- larly aligned dendritic processes [10]. Single click stimuli initiate a stereotypical response sequence in assemblies of neurons within cytoarchitecturally defined areas of rat auditory cortex [2,3,8,11,12] recordable as MAEPs. Rat auditory cortex, and sensory cortex of other modali t ies and species, also produces high frequency ( > 20 Hz) oscilla- tions of potential during trains of repetitive stimuli [17,19- 21], following single brief or prolonged stimuli [7 ,15- 18,22,23,29,33,34,36], and spontaneously, in the absence of any overt stimulation [17,28,29]. Rhythmic potentials in this gamma frequency band have received attention be- cause of their occurrence in both humans and animals, their possible relevance to the concept of grouping stimu-
* Corresponding author. E-mail: [email protected]
0006-8993/96/$15.00 © 1996 Elsevier Science B.V. All rights reserved Pll S0006-8993(96)00168-0
lus features into perceptual objects (the 'b inding problem' ; see Singer, for review [43]), and because of their associa- tion with focused arousal [5-7,33,38,40,41,51].
While the neurogenesis of cortical evoked potentials such as the MAEP has been studied in the rat, and appears to involve parallel activation of specific and nonspecific thalamocortical projections to layer IV [8] and a systematic cascade of excitation and inhibition across the cortical lamina [1,2], the neurogenesis of induced and spontaneous gamma-band oscillations is less established. Most theories propose the involvement of some form of reciprocal con- nections between distributed neuronal elements [43]. This involvement may consist of common oscillatory input from subcortical centers, such as the thalamus, where oscillatory activities have been observed with extracellular field potential, multi-unit, and action potential recordings [44,45,47-50]. Oscillations of 2 0 - 4 0 Hz recorded intra- cellularly from thalamic cells of the cat intralaminar nuclei (IL) [49,50], particularly the centrolateral nucleus (CL) which has widespread connections to the cortex, suggest that thalamocortical connections may play a direct pace- making role in cortical gamma-band activity. Stimulation of the nucleus basalis (NB), a major source of neocortical
156 B. Brett et al./Brain Research 721 (1996) 155 166
acetylcholine (ACh) input, has also been shown to produce 20 -40 Hz oscillations in subthreshold membrane potential fluctuations of rat cortical neurons, suggesting a subcorti- cal modulatory influence [31]. However, in vitro record- ings of rat sensorimotor cortex reveal single cells of layer V with autorhythmic firing at gamma frequencies accom- panying sufficiently strong current injection [42]. Similar intrinsic oscillatory activity has been recorded from sparsely spinous interneurons of guinea pig frontal cortex [28], suggesting that single cells and small assemblies of cells in isolated cortex have the capacity to produce gamma-band oscillations without input from thalamic or other subcortical structures. Desynchronization of gamma- band oscillations between hemispheres following collosec- tomy in the cat [16,32] may also indicate a contribution of corticocortical connections.
Our laboratory has recently demonstrated the existence of spontaneous gamma-band oscillations in auditory cortex of lightly anesthetized rats, using high spatial resolution, multichannel epipial recording [17,29]. Spontaneous gamma-band oscillations appear as spindle-shaped bursts whose location and spatial distribution is similar to the spatial distribution of MAEPs in that the bursts are local- ized to primary and secondary auditory cortex. The pur- pose of the present study was to directly compare the neurogenesis of these spontaneous gamma-band oscilla- tions with that of the MAEP complex in the same animals. Our specific objectives were to: (1) identify functional subdivisions of auditory cortex based on the distribution of temporal components of the MAEP, (2) use power spec- trum analysis of spontaneous data recorded from auditory cortex to determine the frequency content and spatial
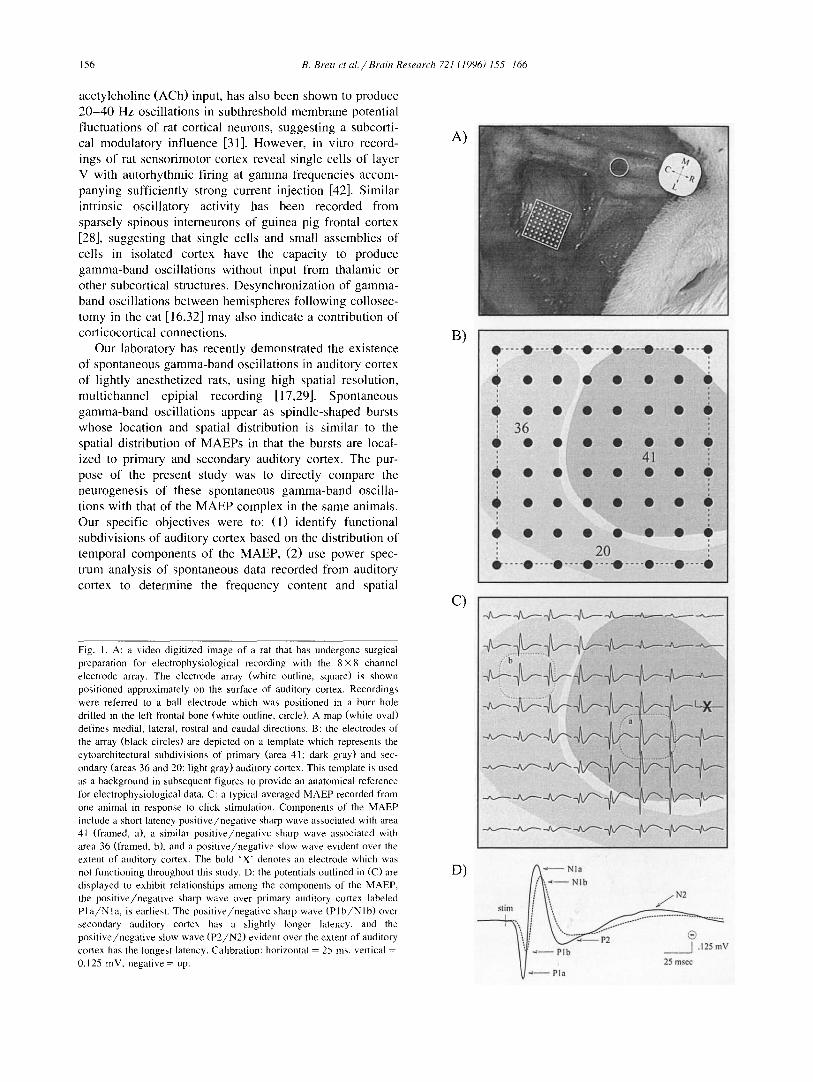
Fig. 1. A: a video digitized image of a rat that has undergone surgical preparation for electrophysiological recording with the 8 × 8 channel electrode array. The electrode array (white outline, square) is shown positioned approximately on the surface of auditory cortex. Recordings were referred to a ball electrode which was positioned in a burr hole
drilled in the left frontal bone (white outline, circle). A map (white oval) defines medial, lateral, rostral and caudal directions. B: the electrodes of the array (black circles) are depicted on a template which represents the cytoarchitectural subdivisions of primary (area 41; dark gray) and sec- ondary (areas 36 and 20; light gray) auditory cortex. This template is used as a background in subsequent figures to provide an anatomical reference for electrophysiological data. C: a typical averaged MAEP recorded from one animal in response to click stimulation. Components of the MAEP include a short latency pos i t ive /nega t ive sharp wave associated with area 41 (framed, a), a similar pos i t ive /nega t ive sharp wave associated with area 36 (framed, b), and a pos i t ive /nega t ive slow wave evident over the extent of auditory cortex. The bold 'X" denotes an electrode which was not functioning throughout this study. D: the potentials outlined in (C) are displayed to exhibit relationships among the components of the MAEP, the pos i t ive /nega t ive sharp wave over primary auditory cortex labeled P l a / N l a , is earliest. The pos i t ive /nega t ive sharp wave ( P l b / N l b ) over secondary auditory cortex has a slightly longer latency, and the pos i t ive /nega t ive slow wave ( P 2 / N 2 ) evident over the extent of auditory cortex has the longest latency. Calibration: horizontal = 25 ms, vertical - 0.125 mV, negative = up.
A)
B)
C)
D)
O' . . . . "O-'-'I
l~ O q l
O • ql ! 3 6
4 • q l +
+ • + l
i • +'II
Q O ¸¸¸¸4
: 2 0 :
Nla ~ - - NIb
"'. N2 ~tim I / I - J /
i
~ 1 25 m~oc

B. Brett et a l . / Brain Research 721 (1996) 155-166 157
distribution of gamma-band oscillations and compare their distribution to that of the MAEP and, (3) lesion subcortical nuclei to determine their role in the generation of sponta- neous gamma-band oscillations and MAEPs.
2. Materials and methods
2.1. Surgical procedure
Twelve male Sprague-Dawley rats (300-400 g) were anesthetized with intramuscular injections of ketamine HCL (66 mg/kg) and subcutaneous injections of xylazine (13 mg/kg). Each animal was then positioned in a stereotaxic frame equipped with hollow ear bars. Normal body tem- perature was maintained with a regulated heating pad. A unilateral craniotomy, extending from Bregma to Lambda and approximately 12 mm lateral to midline, exposed the temporal, parietal and occipital cortices of the right hemi- sphere (see Fig. 1A). The dura was reflected, and the pial surface moistened with saline periodically throughout the experiment. Recording commenced following a 1 h recov- ery period while light anesthetic levels, bordering con- sciousness, were monitored using tail pinch and eye blink ref lexes.
2.2. Stimulation, recording and ablation
Auditory click stimuli were presented bilaterally via high frequency ribbon speakers placed approximately 10 cm lateral to each ear. Clicks were driven with computer- controlled, monophasic square wave pulses (0.3 ms; 0.5 V). Epipial MAEPs were recorded with an array of 64 stainless steel electrodes (tip diameter: 100 /zm) config- ured in an 8 X 8 matrix with an interelectrode distance of 0.5 mm, which covered a 3.5 x 3.5 mm 2 area of auditory cortex. MAEPs from the 64 electrodes were simultane- ously amplified (Grass 12 A5 amplifiers; 1-100 Hz band- pass), digitally sampled (1000 Hz) and averaged (N = 100). The array was initially positioned over auditory cortex according to stereotaxic coordinates and cerebral vascula- ture, and was subsequently adjusted to align the spatial distribution of MAEP waveforms across animals. Slight pressure was applied to ensure adequate contact of all electrodes on the curved cortex. This pressure has not produced any detectable effects on the MAEP complex in our previous studies. Spontaneous potentials were recorded once the array was in the appropriate position. Along with the MAEP complex, approximately 4 min of spontaneous data were collected both before and 1 h after subcortical ablation. Each sample consisted of 2 rain of spontaneous data filtered at 1-100 Hz bandpass, so that low frequency transients and oscillations could be monitored, and an additional 2 min filtered at 30-100 Hz bandpass to empha- size high frequency activity. Both evoked and spontaneous
recordings were referred to a silver ball electrode mounted in a burr hole drilled in the left frontal bone.
Animals were assigned to one of three subcortical abla- tion conditions. Six animals in condition 1 received com- plete radio frequency generated lesions of the MG nucleus. Three animals in condition 2 received partial lesions of the IL nuclei, and the remaining three animals in condition 3 received complete lesions of the NB. The radio frequency lesioning electrode was mounted in a stereotaxic arm and advanced to the appropriate coordinates, where lesions were produced by maintaining the tip temperature at 100°C until a drop in impedance prevented its maintenance (5 min). This typically produced a circular lesion which was approximately 2 mm in diameter. Lesioning coordinates posterior (P) to Bregma, lateral (L) to midline, and ventral (V) to the cortical surface were: MG ( - 5.4 mm P, 3.4 mm L, 5.8 mm V), IL ( - 2 . 2 mm P, 1.0 mm L, 5.0 mm V), and NB ( - 1.0 mm P, 3.0 mm L, 6.0 mm V).
2.3. Data analysis
Average MAEPs were collected for each subject both before and after a treatment condition. Spontaneous data was also collected for each subject before and after lesion- ing. The analysis of spontaneous data involved the extrac- tion of bursts of gamma activity from the spontaneous potentials: For each subject, 2-s blocks of spontaneous data were examined and accepted for further analysis based on the absence of visually identified artifacts such as high amplitude fast waves which are occasionally produced by ketamine anesthesia. Accepted blocks of spontaneous data were further examined for the presence of gamma-band oscillations. Gamma-band oscillations were identified based on their characteristic frequency and duration. Upon identification, 128 ms segments of data centered around each burst of gamma were extracted from all channels in the electrode array. Twenty-five bursts were extracted per 2 min sample of spontaneous data for each subject. Each burst was analyzed using a fast Fourier transform (FFT) [37] and the corresponding power spectrum estimations were obtained. The power spectra of 25 bursts were aver- aged for each animal. Finally, the variance of the average MAEP and power spectra complexes were statistically analyzed between and within subjects before and after lesioning using a repeated measures analysis of variance (ANOVA).
2.4. Histology
After completion of recording, animals were deeply anesthetized and perfused intracardially with saline. This init ial pe r fu sa t e was f o l l o w e d by 1.25% gluteraldehyde/1.0% paraformaldehyde buffered fixative solution, and cold 10% buffered sucrose solution. The brains were removed, blocked to include the appropriate nuclei, and stored at 4°C in 30% buffered sucrose solution
1 5 8 B . B r e t t e t a l . / B r a i n R e s e a r c h 7 2 1 ( 1 9 9 6 ) 1 5 5 1 6 6
A)
B)
e - - e - - 5 7
• 4 9
o,' • 41 : • 3 3
4' • 25
• • 17
• 9
6.- - e - - I
j .
. , ~ i Z ~ ! ) , : -
. ' !£ _ ~ . . . .
J 3 3
2 5
a I b i c ] d I e i _ 1 . 2 5 , 1 1 7
' ! J ! ] 2 5 0 m s e c [ r
C) i i i :~i ; . . i ; i ~ i ~ ~ ; : 2 ; ; . i 2 1 i
. . . . . . . . . . . . . . . - . . . . . . . . . . . . . . . . . . ~ . . . . . - . . . . . . 5 7 2 ; ~ 2 . 7 i 2222;; . _ 2 .
. i i f ~ ; " ~ i " ~ . . . . . . . . . . . . . . . . . . . . . . . . . . 4 9
??:):
. . . . . . . . . . . . . . . . . . . . . . . . . . . . . . . ~ . . . . . . . . . . . . . . . 3 3 Z ~ i ~ "7 ~ ~ i ~ , ~ ; , ~ ~iii 2 ~ ; i ? ; ~ " i~ Z I ~ . - ~ / ~ " . ; , ~ I / IZIII~I~I, 2 ~ ' L .~21~~i~;~i?~i~i~ i1712 ~ I I Z ~ 7 ~ ,. , i
~!~: ~/i ~! ~!?~ii~ i!;;)~ ii~i~ii~ili!~ii!~ ~ii~!~i~ ~i i~ ~ !~ 15)ii~i ~i~ i~i~iii~ii!(~iii~/!i! i~ ~ ~i ~ iii~;!!~iii!i!i~!iii~!Z~ii~! i~i)i ~/!51 i~/~ i :'¸ . . . . . . . . . . . 7 . ~ . . . . . . . . . . . . . . . . . . ~ . . . . . . . . . . . . . . ~.,:,,! . . . . . . . . . . . . . . . . .
. . . . . . . . . , . . . . . . . . . . . . . . . . . . . . . . . . . . . . • . . . . . . 2 5
. ; ) . ; 2 ~ " - ;
? £ ) : Z 2 i : " i " . 7 2 o : . 2 : : : : : : ; i ) i ' ~ : ; ; -
. . . . ; . . . . . . . ; 2 7 ~ 2 i " . . . . 12 2
. . . . . . I
B. Brett et a l . / Brain Research 721 (1996) 155-166 159
until they sank. The tissue was frozen, sectioned coronally at 40 /z on a cyrocut microtome, mounted on gelatinized slides, counter-stained with neutral red and cover-slipped.
3. Results
Fig. 1A shows an outline of the 8 × 8 channel electrode array placed epipially in the approximate location of audi- tory cortex to record evoked and spontaneous data. Elec- trodes in the array (Fig. 1B; O ) covered the extent of primary (area 41) and secondary (areas 36 and 20) audi- tory cortex, depicted schematically in Fig. 1B and subse- quent figures as dark and light shaded regions. The borders of primary and secondary auditory cortex shown in this template must be considered approximate since no cytoar- chitectural analysis of auditory cortex was performed in this experiment. The template was based instead on previ- ous histological studies [4,13,27,35,53] which have estab- lished the extent of the cytoarchitectural subdivisions.
A typical MAEP complex is displayed in Fig. 1C. Similar to previous studies [2,3,8,11,12], the morphology and spatial distribution of distinct temporal components of the MAEP were highly stereotyped and repeatable across subjects (Fig. 4A, 5A,C and 6A,C), and thus provided a reliable functional verification of the boundaries of pri- mary and secondary auditory cortex. At rostro-lateral elec- trode positions covering area 41, the MAEP was charac- terized by a short latency positive/negative sharp wave (Fig. 1C; frame a; Fig. 1D; dark solid trace), with ampli- tude peaks labeled Pla and Nla to indicate their polarity, sequence of occurrence in the MAEP complex, and early post-stimulus latency (15 and 28 ms, respectively). At caudo-medial positions over area 36, a similar biphasic sharp wave was evident (Fig. 1C; frame b; Fig. 1D; light dashed trace), with amplitude peaks labeled Plb and Nlb to reflect their slightly longer latency (19 and 32 ms). These sharp waves were followed by a biphasic slow wave with amplitude peaks (Fig. 1D; P2/N2) of longer latency (50 and 140 ms) recordable in most areas of auditory cortex and characteristically present in the near absence of early sharp waves at the juncture between areas 36 and 20.
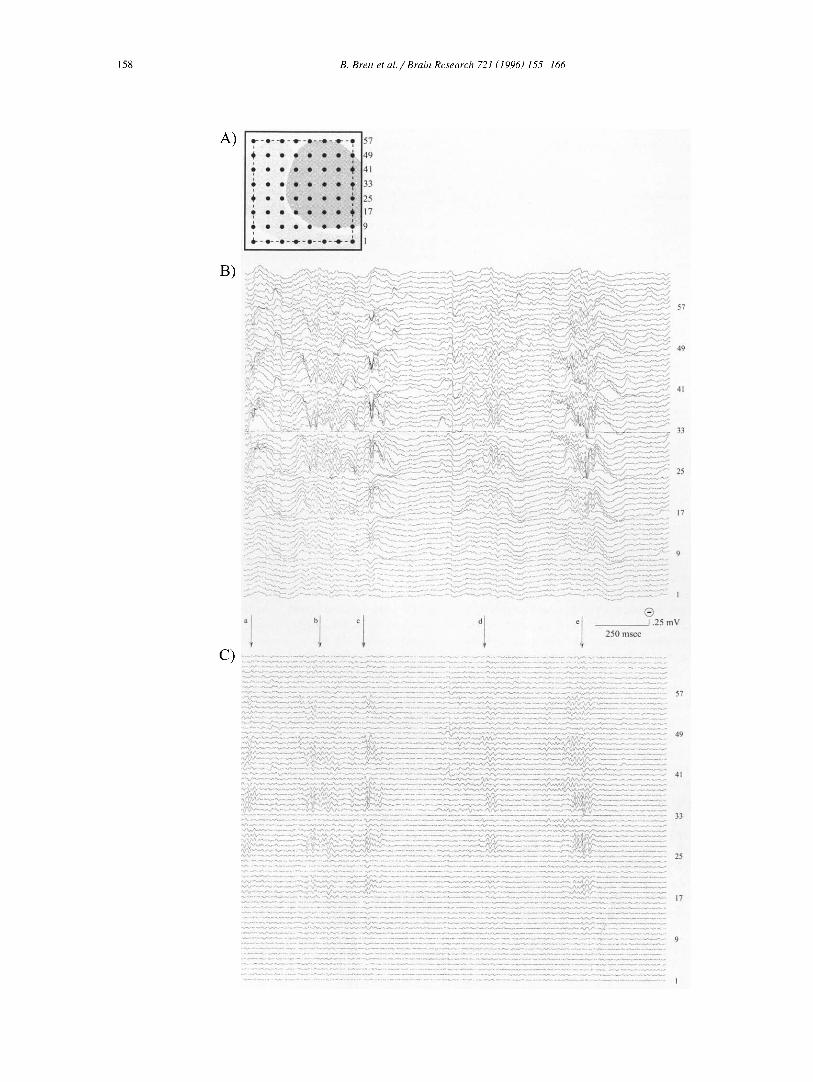
Fig. 2B shows a typical 2-s block of spontaneous activity recorded at a wide bandwidth (1-100 Hz) over rat auditory cortex. Fig. 2C shows the same sample digitally filtered at 30-100 Hz to emphasize high frequency activ- ity. This activity appeared as spindle-shaped bursts of oscillations in the gamma frequency range (> 20 Hz; referred to as 'bursts' or 'oscillations' throughout this
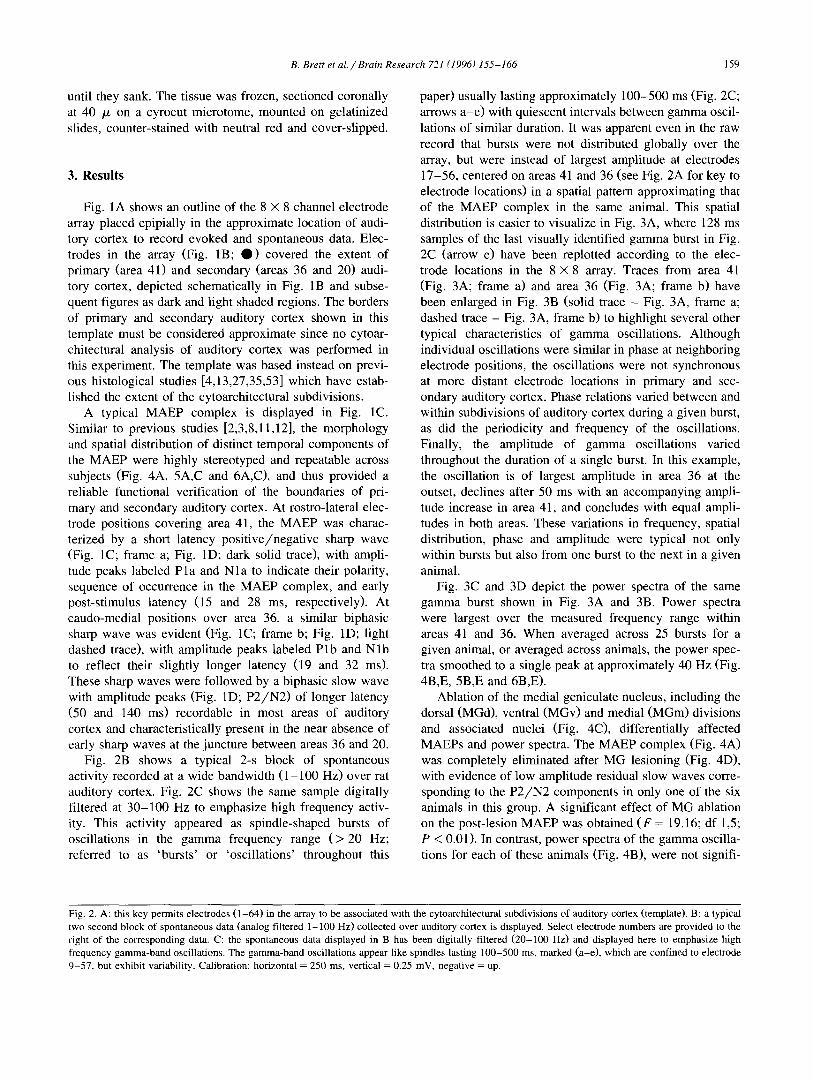
paper) usually lasting approximately 100-500 ms (Fig. 2C; arrows a-e) with quiescent intervals between gamma oscil- lations of similar duration. It was apparent even in the raw record that bursts were not distributed globally over the array, but were instead of largest amplitude at electrodes 17-56, centered on areas 41 and 36 (see Fig. 2A for key to electrode locations) in a spatial pattern approximating that of the MAEP complex in the same animal. This spatial distribution is easier to visualize in Fig. 3A, where 128 ms samples of the last visually identified gamma burst in Fig. 2C (arrow e) have been replotted according to the elec- trode locations in the 8 X 8 array. Traces from area 41 (Fig. 3A; frame a) and area 36 (Fig. 3A; frame b) have been enlarged in Fig. 3B (solid trace - Fig. 3A, frame a; dashed trace - Fig. 3A, frame b) to highlight several other typical characteristics of gamma oscillations. Although individual oscillations were similar in phase at neighboring electrode positions, the oscillations were not synchronous at more distant electrode locations in primary and sec- ondary auditory cortex. Phase relations varied between and within subdivisions of auditory cortex during a given burst, as did the periodicity and frequency of the oscillations. Finally, the amplitude of gamma oscillations varied throughout the duration of a single burst. In this example, the oscillation is of largest amplitude in area 36 at the outset, declines after 50 ms with an accompanying ampli- tude increase in area 41, and concludes with equal ampli- tudes in both areas. These variations in frequency, spatial distribution, phase and amplitude were typical not only within bursts but also from one burst to the next in a given animal.
Fig. 3C and 3D depict the power spectra of the same gamma burst shown in Fig. 3A and 3B. Power spectra were largest over the measured frequency range within areas 41 and 36. When averaged across 25 bursts for a given animal, or averaged across animals, the power spec- tra smoothed to a single peak at approximately 40 Hz (Fig. 4B,E, 5B,E and 6B,E).
Ablation of the medial geniculate nucleus, including the dorsal (MGd), ventral (MGv) and medial (MGm) divisions and associated nuclei (Fig. 4C), differentially affected MAEPs and power spectra. The MAEP complex (Fig. 4A) was completely eliminated after MG lesioning (Fig. 4D), with evidence of low amplitude residual slow waves corre- sponding to the P2 /N2 components in only one of the six animals in this group. A significant effect of MG ablation on the post-lesion MAEP was obtained (F = 19.16; df 1,5; P < 0.01). In contrast, power spectra of the gamma oscilla- tions for each of these animals (Fig. 4B), were not signifi-
Fig. 2. A: this key permits electrodes (1-64) in the array to be associated with the cytoarchitectural subdivisions of auditory cortex (template). B: a typical two second block of spontaneous data (analog filtered 1-100 Hz) collected over auditory cortex is displayed. Select electrode numbers are provided to the right of the corresponding data. C: the spontaneous data displayed in B has been digitally filtered (20-100 Hz) and displayed here to emphasize high frequency gamma-band oscillations. The gamma-band oscillations appear like spindles lasting 100-500 ms, marked (a-e), which are confined to electrode 9-57, but exhibit variability. Calibration: horizontal = 250 ms, vertical = 0.25 mV, negative = up.

160 B. Brett et al. / Brain Research 721 (1996) 155-166
cantly affected by MG lesioning (Fig. 4E). In fact, the spatial distribution and amplitude of the post-lesion power spectra remains quite consistent. Ablation of several in- tralaminar nuclei, including the ventro-anterior (VA), ven- trolateral (VL), CL and associated nuclei (Fig. 5C) had no significant effect on either the MAEP (Fig. 5A,D) or
power spectra (Fig. 5B,E). Similarly, complete lesions of the NB (Fig. 6C) produced no significant effect on either the MAEP complex (Fig. 6A,D) or power spectra (Fig. 6B,E).
4. Discussion
A)
B) "" '"
0 25 50 75 100 125 (msec)
c )
1
D) 0 40 80 120 160 180 220
(Hz)
MAEPs reflect the response of large assemblies of neurons distributed over primary and secondary auditory cortex. The response over primary auditory cortex (area 41), consisting of an early biphasic potential (P 1 a / N 1 a), is followed approximately 4 ms later by a similar biphasic potential ( P l b / N l b ) over secondary auditory cortex (area 36). These early biphasic potentials are followed by a longer latency, lower amplitude biphasic potential (P2/N2) , which is evident over the extent of primary and secondary auditory cortex. The neurophysiological basis of the latency shift of the MAEP recorded from primary and secondary auditory cortex has been studied in detail [2,3,8,11,12], and has been attributed primarily to the asynchronous activation of parallel thalamocortical projec- tions to these regions. This hypothesis is supported by several lines of evidence. First, layer IV injections of the retrograde tracer horseradish peroxidase (HRP) into areas 41 or 36, based on coordinates derived exclusively from temporal components of the MAEP complex, reveal inde- pendent thalamocortical projections originating from sub- divisions of the MG [8]. Injections into the region produc- ing the earliest response of the P l a / N l a (area 41) indicate that thalamocortical fibers originating in the MGv initiate the MAEP. Injections into cortical regions producing the later response of the P l b / N l b (area 36) labels parallel thalamocortical fibers originating in the MGd. These re- sults agree closely with known parallel pathways from subdivisions of the MG to primary and secondary auditory cortex [24,26,35,39,52]. Second, it is possible to activate primary and secondary auditory cortex separately by elec- trically stimulating the MGv and MGd [l 1]. Finally, the duration of the latency shift between the MAEP in primary and secondary auditory cortex (approximately 4 ms) can- not be readily accounted for by short intracortical connec- tions.
Fig. 3. A: 125 ms of data centered on burst (e) (see Fig. 2C) has been extracted from the block of spontaneous data and displayed in relation to the template• The burst is localized within primary and secondary audi- tory cortex. B: the oscillations recorded at electrodes number 36 (see A; framed, a) and 47 (see A; framed, b) have been enlarged and displayed in relation to time to depict variations in frequency, phase and spatial distribution (a, solid; b, dashed). C: the data in (A) has been analyzed for frequency content using a FFT, and power spectrum estimations are displayed. The oscillations are localized to primary and secondary audi- tory cortex and power is greatest over area 41. D: the power spectra of the two oscillations (framed, a and b in C) peak in the gamma-band at approximately 40 Hz.

B. Brett et al./Brain Research 721 (1996) 155-166 161
Spontaneous gamma oscillations recorded in the present study were quite similar to the MAEP in their spatial distribution and restriction to primary and secondary audi- tory cortex; oscillations were nonexistent or of very low
amplitude outside of this region, indicating a cortical local- ization that is closely associated with known targets of specific thalamocortical projection pathways from the MG. This localization alone suggested that thalamic auditory
A) B)
C)
D)
-4.80 -5.20 -5.50
(mm caudal to bregma)
I.
-5.80 -6.20
~ i i I iiill
Fig. 4. A: pre-lesion MAEPs from six animals are superimposed (thin lines) along with a grand average MAEP from these subjects(thick lines). B: baseline power spectra from the same six animals are superimposed (thin lines) along with a grand average power spectrum (thick lines). C: video-digitized images display a typical rostral-caudal series of 40 /x coronal sections from the brain of one animal. For each animal a radio frequency lesion generator was positioned at approximately 5.4 mm caudal to Bregma, 3.4 mm lateral to midline, and 5.8 mm ventral to the cortical surface to produce a very large lesion which destroyed all tissue approximately 2 mm around this initial position, encompassing the entire MG and associated nuclei. D: individual post-lesion MAEPs as well the grand average are significantly attenuated. E: individual post-lesion power spectra as well as the grand average are not significantly
affected.

162 B. Brett et al. / Brain Research 721 (1996) 155-166
re lay nucle i , r e spons i b l e for p r o d u c t i o n o f the M A E P
complex , m a y be equa l ly i n v o l v e d in e i the r the m o d u l a t i o n
or p a c e - m a k i n g o f g a m m a osci l la t ions . Yet , our resul t s do
not suppor t this hypo thes i s and sugges t ins tead that the
p r ima ry genera to r s o f g a m m a osc i l l a t ions are no t t ha l amic
re lay nucle i . Pe rhaps the mos t c o m p e l l i n g e v i d e n c e is tha t
des t ruc t ion o f the M G , a les ion of suf f ic ien t s ize to a lso
p roduce ex t ens ive d a m a g e to f ibers o f passage, comple t e ly
e l imina t e s the M A E P c o m p l e x and has no s ign i f i can t
e f fec t on any charac te r i s t i c o f osc i l la t ions e x a m i n e d here.
S te r iade et al. ( 1991) [50] repor t that g a m m a - b a n d
osc i l la t ions in var ious cor t ical areas obse rved sponta-
A) B)
C)
D)
-1.80 -ZOO -2.30
(ram caudal to brcgma)
E)
-2.50 -2.80
Fig. 5. This figure is similar to Fig. 4, except the results of IL lesioning in three animals are depicted. A typical rostral-caudal series of 40 /x coronal sections is displayed in which IL lesions were produced using a radio frequency lesion generator positioned at approximately 2.2 mm caudal to Bregma, 1.0 mm lateral to midline, and 5.0 mm ventral to the cortical surface destroying the VA. VL, CL and associated nuclei. Post-lesion MAEPs as well as power spectra are not significantly affected.

B. Brett et al./Brain Research 721 (1996) 155-166 163
neously during increased arousal, or upon optimal sensory stimulation, may result from the facilitation of transmis- sion of gamma activity in thalamic nuclei to the cortex via brainstem-thalamic cholinergic input. For example, it is suggested that stimulation of the cholinergic brainstem pedunculopontine (PPT) nucleus potentiates gamma-band oscillations in electroencephalogram (EEG) recorded over
the precruciate and anterior suprasylvian gyri of anes- thetized cats. Since mesopontine cholinergic nuclei are thought to maintain activation processes in thalamocortical systems, and since cells in the VA, VL and CL nuclei of the thalamus exhibit gamma bursts and cholinergic activ- ity, it is plausible that the brainstem-thalamic-cholinergic system is involved in the neurogenesis of gamma-band
A) B)
. , , ,
~ . . . A._.
c)
-0.50 -0.80 - 1.00 - 1.20 - 1,50
(ram caudal to brcgma)
D) E)
Fig. 6. This f igure is s imilar to Fig. 5, except the results of NB lesioning in three animals are depicted. Les ions were p roduced with a radio f requency
lesion genera tor posi t ioned at approx imate ly 1.0 m m caudal to Bregma , 3.0 m m lateral to midline, and 6.0 m m ventral to the cort ical surface el iminat ing
the NB and associa ted nuclei. Post- les ion M A E P s as well as p o w e r spectra are not s ignif icant ly affected.

164 B. Brett et al. / Brain Research 721 (1996) 155-166
oscillations recorded in motor and sensory cortex, espe- cially considering that the CL is one of the intralaminar nuclei (IL), known to innervate widespread cortical areas. However, lesioning the VA, VL, e L and associated nuclei has no significant effect on the frequency content or spatial distribution of gamma-band oscillations, or on the MAEP complex. Facilitative cholinergic transmission of thalamic gamma activity is apparently not necessary for sponta- neous cortical oscillations in the lightly anesthetized ani- mals of the present study. However, our results do not rule out the possibility that this system could modulate gamma oscillations in unanesthetized and behaving animals. The lack of effect from lesioning these nuclei may be ac- counted for by the fact that stimulation of the PPT is thought to mimic arousal. It is quite possible that brain- stem-cholinergic facilitated activity in these nuclei might modulate gamma activity in an aroused or optimally stimu- lated animal.
Another cholinergic system, involving the nucleus basalis of Meynert (NB), which receives input from the reticular formation, is considered to be the primary source of cholinergic input to the cortex, including auditory cortex [46]. This cholinergic system has also been implicated in EEG activation associated with arousal. Metherate et al. [31] report that in vivo stimulation of the NB elicits EEG activation, depolarizes cortical neurons, and produces a change in their subthreshold membrane oscillations from slow (1-5 Hz) to fast (20-40 Hz). The mechanism for this change is thought to involve cholinergic input via the NB to muscarinic receptors on intrinsically oscillating cortical neurons, presumably layer V pyramidal cells. While it is also possible that this system may be important for the modulation of gamma-band oscillations in an aroused ani- mal, lesioning the NB and associated nuclei produces little effect on the frequency content and spatial distribution of spontaneous gamma oscillations or the MAEP.
Thus, while subcortical nuclei may perform a modula- tory function in the appearance and perhaps synchroniza- tion of gamma oscillations in behaving animals, our evi- dence indicates that these nuclei need not be intact for the appearance of oscillations, and that the basic cellular gen- erator may be cortical, an hypothesis that has also been proposed by others [14-16,22,23] to explain the neurogen- esis of induced gamma oscillations in cat visual cortex. Cellular mechanisms for the production of coherent oscil- lations in the gamma frequency range have been demon- strated in isolated slices of cortex [9,28], indicating further that the cortex is at least capable of producing gamma oscillations in the absence of major subcortical influence.
Similar to the MAEP complex, spontaneous gamma- band oscillations are localized to primary and secondary auditory cortex as well as primary and secondary cortex of other sensory modalities [17,29]. However, in contrast to the highly stereotyped phase relationships between primary and secondary cortex evident in the MAEP complex pro- duced presumably by asynchronous activation of parallel
thalamocortical projections, spontaneous oscillations vary markedly in their frequency, phase and spatial distribution. The foci of oscillations, while consistently centered on auditory cortex, appear as randomly varying active areas which differ in size, shape, and amplitude, between bursts within an animal, and between animals. The characteristics of spontaneous gamma-band oscillations reported here are quite similar to previous recordings performed by Freeman and colleagues [7,18] in the olfactory system of unanes- thetized cats, rabbits and rats. The inherent variability of gamma-band oscillations is suggestive of a more complex generator as opposed to the thalamocortical generator pro- ducing the stereotypical MAEP. Additional results from our laboratory support the conclusion that the neural gener- ators of MAEPs and spontaneous gamma-band oscillation are different [17]. When click stimuli are presented during spontaneous oscillations, the interactions are directly re- lated to components of the MAEP. During the P1/N1 and P2 components, oscillations are suppressed, recover during the N2, and are subsequently enhanced, indicating that MAEPs interrupt spontaneous oscillations, but are other- wise unrelated. These results are similar to those obtained by Eckhorn [15] in cat visual cortex, where it was pro- posed that the period of enhanced gamma may result from post-inhibitory rebound, during which cortical generators are activated by a tonic excitatory drive. In addition, there does not appear to be any phase-locking between MAEPs and post-stimulus gamma, suggesting that gamma-band oscillations occur independently.
5. Conclusion
Epipial field potential mapping suggests that cells in rat auditory cortex may have the capacity to generate sponta- neous gamma-band oscillations in the absence of input from specific and nonspecific thalamocortical projections originating in the MG, and in the absence of major cholin- ergic activation of the thalamus, or the cortex. Additional research on pyramidal and stellate cells of isolated cortex indicates that these cells among others may possess au- torhythmic oscillatory properties [9,28]. This capacity is established due to differentially distributed ionic conduc- tances. It determines action potential properties of the cell, and is modulated by synaptic input and output. Whether the neurogenesis of gamma-band activity is due to the intrinsic autorhythmic properties of cells in sensory cortex remains an issue, however, these results present the inter- esting possibility that there are networks of cells in sensory cortical areas endowed with an intrinsic capacity to oscil- late independently of sensory or cholinergic input, but that may be modulated by this input.[30]
Acknowledgements
This research was supported by United States Public Health Service Grant 1-R01-NS22575, National Science

B. Brett et al. / Brain Research 721 (1996) 155-166 165
F o u n d a t i o n G r a n t I B N - 9 1 1 9 5 2 5 , a n d a G r a n t in A i d f r o m
the G r a d u a t e S c h o o l C o u n c i l o n R e s e a r c h a n d C r e a t i v e
W o r k at t he U n i v e r s i t y o f C o l o r a d o at B o u l d e r . T h e c o n -
t en t s o f th is r e p o r t a re s o l e l y t h e r e s p o n s i b i l i t y o f t he
a u t h o r s a n d d o n o t n e c e s s a r i l y r e p r e s e n t t h e o f f i c i a l v i e w s
o f any o f t h e a b o v e f u n d i n g a g e n c i e s .
References
[1] Barth, D.S. and Di, S., Laminar excitability cycles in neocortex, J. Neurophysiol., 65 (1990) 891-898.
[2] Barth, D.S. and Di, S., Three dimensional analysis of auditory evoked potentials in rat neocortex, J. Neurophysiol., 64 (1990) 1527-1536.
[3] Barth, D.S. and Di, S , The functional anatomy of auditory evoked potentials in rat neocortex, Brain Res., 565 (1991) 109-115.
[4] Barth, D.S., Goldberg, N., Brett, B. and Di, S., The spatiotemporal organization of auditory, visual, and polysensory evoked potentials in rat cortex, Brain Res., 678 (1995) 177-180.
[5] Bouyer, J.J., Montaron, M.F. and Rougeul, A., Fast fronto-parietal rhythms during combined focused attentive behavior and immobility in cat: cortical and thalamic localizations, Electroencephalogr. Clin. Neurophysiol., 51 (1981) 244-252.
[6] Bressler, S.L., The gamma wave: a cortical information carrier?, Trends Neurosci., 13 (1990) 161-162.
[7] Bressler, S.L. and Freeman, W.J., Frequency analysis of olfactory system EEG in cat, rabbit, and rat, Electroencephalogr. Clin. Neuro- physiol., 50 (1980) 19-24.
[8] Brett, B., Di, S., Watkins, L. and Barth, D.S., An HRP study of parallel thalamocortical projections responsible for the generation of mid-latency auditory evoked potentials, Brain Res., 647 (1994) 65-75.
[9] Connors, B.W. and Gutnick, M.J., Intrinsic firing patterns of diverse cortical neurons, TINS, 13 (1990) 99-104.
[10] Creutzfeldt, O.D. and Houchin, J., Neuronal basis of EEG-waves. In A. Remond (Eds.), Handbook of Electroencephalography and Clini- cal Neurophysiology, Vol. 2C, Elsevier, Amsterdam, 1974, pp. 5-55.
[11] Di, S. and Barth, D.S., The functional anatomy of middle latency auditory evoked potentials: Thalamocortical connections, J. Neuro- physiol., 68 (1992) 425-431.
[12] Di, S. and Barth, D.S., Binaural vs. monaural auditory evoked potentials in rat neocortex, Brain Res., 630 (1993) 303-314.
[13] Di, S., Brett, B. and Barth, D.S., Polysensory evoked potentials in rat parietotemporal cortex: Auditory and somatosensory responses, Brain Res., 64 (1994) 267-280.
[14] Eckhorn, R., Bauer, R., Jordan, W., Brosch, W., Kruse, W., Munk, M. and Reitboeck, H.J., Coherent oscillations: A mechanism of feature linking in visual cortex?, Biol. Cybern., 60 (1988) 121-130.
[15] Eckhorn, R., Schanze, T., Brosch, M., Salem, W. and Bauer, R., Stimulus-specific synchronizations in cat visual cortex: multiple microelectrode and correlation studies from several cortical areas. In E. Basar and T.H. Bullock (Eds.), Induced Rhythms in the Brain, Vol. 4, Quinn-Woodbine, Boston, 1992, pp. 47-82.
[16] Engel, A.K., Kreiter, A.K., K~inig, P. and Singer, W., Synchroniza- tion of oscillatory neuronal responses between striate and extrastriate visual cortical areas of the cat, Proc. Natl. Acad. Sci. USA, 88 (1991) 6048-6052.
[17] Franowicz, M.N. and Barth, D.S., A comparison of evoked poten- tials and high frequency (gamma-band) oscillating potentials in rat auditory cortex, J. Neurophysiol., 74 (1995)
[18] Freeman, W.J., Spatial properties of an EEG event in the olfactory bulb and cortex, Electroencephalogr. Clin. Neurophysiol., 44 (1978) 586-605.
[19] Galambos, R., Tactile and auditory stimuli repeated at high rates (30-50 per sec) produce similar event related potentials, Ann. N.E Acad. Sci., 388 (1982) 722-728.
[20] Galambos, R., A Comparison of Certain Gamma Band (40-Hz) Brain Rhythms in Cat and Man. In E. Basar and T.H. Bullock (Eds.), Induced Rhythms in the Brain, Vol. 4, Quinn-Woodbine, Boston, 1992, pp. 201-216.
[21] Galambos, R., Makeig, S. and Talmachoff, P.J., A 40-Hz auditory potential recorded from the human scalp, Proc. Natl. Acad. Sci. USA, 78 (1981) 2643-2647.
[22] Gray, C.M., Engel, A.K., K~Snig, P. and Singer, W., Mechanisms Underlying the Generation of Neuronal Oscillations in Cat Visual Cortex. In E. Basar and T.H. Bullock (Eds.), Induced Rhythms in the Brain, Vol. 4, Quinn-Woodbine, Boston, 1992, pp. 29-46.
[23] Gray, C.M. and Singer, W., Stimulus-specific neuronal oscillations in orientation columns of cat visual cortex, Proc. Natl. Acad. Sci. USA, 86 (1989) 1698-1702.
[24] Guldin, W.O. and Markowitsch, H.J., Cortical and thalamic afferent connections of the insular and adjacent cortex of the rat, J. Comp. Neurol., 215 (1983) 135-153.
[25] Hebb, D.O., The Organization of Behavior, Wiley, New York, 1949. [26] Kelly, J.B., Rat auditory cortex. In B. Kolb and R.C. Tees (Eds.),
The Cerebral Cortex of the Rat, The MIT Press, Cambridge, 1990, pp. 381-405.
[27] Krieg, W.J.S., Connections of the cerebral cortex I. The albino rat. A) Topography of the cortical areas, J. Comp. Neurol., 84 (1946) 221-275.
[28] Llin~s, R.R., Grace, A. and Yarom, Y., In vitro neurons in mam- malian cortical layer 4 exhibit intrinsic oscillatory activity in the 10- to 50-Hz frequency range, Proc. Natl. Acad. Sci. USA, 88 (1991) 897 -901.
[29] MacDonald, K.D. and Barth, D.S., High frequency (gamma-band) oscillating potentials in rat somatosensory and auditory cortex, Brain Res., in press.
[30] Matousek, M., Frequency and correlation analysis. In A. Remond (Eds.), Handbook of Electroencephalography and Clinical Neuro- physiology, Vol. 5, Elsevier, Amsterdam, 1973, pp. 5A33-5A60.
[31] Metherate, R., Cox, C.L. and Ashe, J.H., Cellular basis of neocorti- cal activation: modulation of neural oscillations by the nucleus basalis and endogenous acetylcholine, J. Neurosci., 12 (1992) 4701 4711.
[32] Munk, M.H.J., Nowak, L.G., Chouvet, G., Nelson, J.I. and Bullier, J., The structural basis of cortical synchronization, Eur. J. Neurosci. Suppl., 5 (1992) 21.
[33] Murthy, V.N. and Fetz, E.E., Coherent 25- to 35-Hz oscillations in the sensorimotor cortex of awake behaving monkeys, Proc. Natl. Acad. Sci. USA, 89 (1992) 5670-5674.
[34] Pantev, C., Makeig, S., Hoke, M., Galambos, R., Hampson, S. and Gallen, C., Human auditory evoked gamma-band magnetic fields, Proc. Natl. Acad. Sci. USA, 88 (1991) 8669-9000.
[35] Patterson, H., An anterograde degeneration and retrograde axonal transport study of the cortical projections of the rat medial genicu- late body, Doctoral dissertation, Boston University., (1977).
[36] Prechtl, J.C., Visual motion induces synchronous oscillations in turtle visual cortex, Proc. Natl. Acad. Sci. USA, 91 (1994) 12467- 12471.
[37] Press, W.R., Flannery, B.P., Teukolsky, S.A. and Vetterling, W.T., Numerical Recipes, Cambridge University Press, Cambridge, 1986.
[38] Ribary, U., Ioannides, A.A., Singh, K.D., Hasson, R., Bolton, J.P.R., Lado, F., Mogilner, A. and Llin~s, R.R., Magnetic field tomography of coherent thalamocortical 40-Hz oscillations in humans, Proc. NatL Acad. Sci. USA, 88 (1991) 11037-11041.
[39] Ryugo, D.K., An attempt towards an integration of structure and function in the auditory system, Doctoral dissertation, Universi~ of California, lrvine, 1976.
[40] Sheer, D.E., Focused arousal, 40 Hz EEG, and dysfunction. In B.R.T. Elbert, W. Lutzenberger and N. Birmbaumer (Eds.), Self

166 B. Brett et a l . / Brain Research 721 (1996) 155-166
Regulation of the Brain and Behauior, Springer, New York, 1984, pp, 66-84.
[41] Sheer, D.E., Sensory and cognitive 40 Hz event-related potentials. In T.B.E. Basar (Eds.), Brain Dynamics, Springer, Berlin, 1989, pp. 338-374.
[42] Silva, L.R., Amitai, Y. and Connors, B.W., Intrinsic oscillations of neocortex generated by layer 5 pyramidal neurons, Science, 25 (1991) 432-435.
[43] Singer, W., Putative functions of temporal correlations in neocortical processing. In C. Koch and J.L. Davis (Eds.), Large-scale Neuronal Theories of the Brain, MIT Press, Cambridge, Mass., 1994, pp. 201-237.
[44] Steriade, M., The excitatory-inhibitory response sequence in thala- mic and neocortical cells: state-related changes and regulatory sys- tems. In G.M. Edelman, W.E. Gall and W.M. Cowan (Eds.), Dy- namic Aspects of Neoeortical Function, John Wiley and Sons, New York, 1984, pp. 107-157.
[45] Steriade, M., Amzica, F. and Contreras, D., Cortical and thalamic cellular correlates of electroencephalographic burst-suppression, Electroencephalogr. Clin. Neurophysiol., 90 (1994) 1 - 16.
[46] Steriade, M. and Buzsaki, G., Parallel activation of thalamic and cortical neurons by brainstem and basal forebrain cholinergic sys- tems. In M. Steriade and D. Biesold (Eds.), Brain Cholinergic Systems, Oxford Science Publication, Oxford, 1990, pp. 19-47.
[47] Steriade, M., Deschenes, M., Domich, L. and Mulle, C., Abolition of spindle oscillations in thalamic neurons disconnected from nu- cleus reticularis thalami, J. Neurophysiol., 54 (1985) 1473 1497.
[48] Steriade, M., Domich, L., Oakson, G. and Deschenes, M., The deafferented reticular thalamic nucleus generates spindle rhythmic- ity, J. Neurophysiol., 57 (1987)260-273.
[49] Steriade, M., Dossi, R.C. and Contreras, D., Electrophysiological properties of intralaminar thalamocortical cells discharging rhythmic ( ~ 40 Hz) spike-bursts at ~ 1000 Hz during waking and rapid eye movement sleep, Neuroscience, 56 (1993) 1-9.
[50] Steriade, M., Dossi, R.C., Pare, D. and Oakson, G., Fast oscillations (20-40 Hz) in thalamocortical systems and their potentiation by mesopontine cholinergic nuclei in the cat, Proc. Natl. Acad. Sci. USA, 88 (1991) 4396-4400.
[51 ] Tiitinen, H., Sinkkonen, J., Reinikainen, K., Alho, K., Lavikainen, J. and N~i~it~inen, R., Selective attention enhances the auditory 40-Hz transient response in humans, Lett. Nature. 364 (1993) 59-60.
[52] Webster, W.R., Auditory system. In G. Paxinos (Ed.), The Rat Neruous System: Hindbrain and Spinal Cord, Vol. 2, Academic Press, Sydney, 1985, pp. 153-184.
[53] Zilles, K., Anatomy of the neocortex: cytoarchitecture and myeloar- chitecture. In B. Kolb and R.C. Tees (Eds.), The Cerebral Cortex of the Rat, MIT Press, Cambridge, 1990, pp. 77- I 12.