Sex and ear differences of brain-stem acoustic evoked potentials in a sample of normal full-term...
10
Electroencephalography and clinical Neurophysiology, 1988, 71 : 357-366 357 Elsevier Scientific Publishers Ireland, Ltd. EEG02061 Sex and ear differences of brain-stem acoustic evoked potentials in a sample of normal full-term newborns. Normative study Giuseppe A. Chiarenza, Giulia M. D'Ambrosio and Adriana Guareschi Cazzullo lstituto di Neuropsichiatria Infantile, Unioersit~ degli Studi di Milano, Via Besta 1, 20161 Milan (Italy) (Accepted for publication: 31 December 1987) Summary The present paper reports a normative study of the BAEPs recorded from 80 normal full-term newborns by using a rarefaction click at 70, 60, 40, 20 dB HL. Positive, negative peaks and the relative amplitudes were measured. Means, standard deviations and 95% and 99% confidence limits were calculated for each component, for positive and negative IPLs and amplitude ratios. A normality test distribution showed that each component had normal distribution except for wave PIII at 70 dB and at 60 dB HL because of its index of kurtosis and for IPLs PII-PIII and NII-NIII at 70 and 60 dB HL. MLRA was performed and significant statistical differences were found for sex, ears and intensities. Females had the latencies of waves PIII, PIV, PV, NII and NIV shorter than males. The BAEPs obtained from the left ear had shorter latencies for positive and negative peaks. Latencies, amplitude and morphology of the BAEPs vary with variations of the intensity. The IPLs PII-PV, PIII-PV and PIV-PV were not affected by changes of intensity. Key words: Sex; Ear; BAEPs; Newborns From the first days of life, the brain-stem audi- tory evoked potentials (BAEPs) provide an objec- tive evaluation of the auditory function of the cochlea and brain-stem structures. BAEP changes were observed following treatment of high risk newborns (Starr et al. 1977; Hecox et al. 1981; Stockard and Stockard 1981, 1983; Hecox and Burkard 1982). Further, various correlations be- tween BAEPs and the clinical development of infants at risk were found (Marshall et al. 1980; Hecox and Cone 1981; Chiarenza et al. 1982; Hecox and Burkard 1982; Stockard et al. 1983; Salamy and Eldredge 1986). Consequently, BAEPs seem to be a promising clinical diagnostic and prognostic instrument. BAEPs change with the maturation of the CNS and reach latency and amplitude values similar to those of the adult at about the 18th month of life Correspondence to: G.A. Chiarenza, Istituto di Neuro- psichiatria Infantile, Via Besta 1, 20161 Milan (Italy). (Hecox and Galambos 1974; Salamy et al. 1975, 1980; Salamy and McKean 1976; Starr et al. 1977; Goldstein et al. 1979; Stockard et al. 1979; Hecox et al. 1981; Hecox and Burkard 1982; Mochizuki et al. 1982). In addition to age, other variables such as sex and the stimulated ears influence the BAEPs. These variables have been widely studied and the differences found in adults have been un- questionably acccepted (Hecox and Galambos 1974; Stockard et al. 1978, 1979; Fabiani et al. 1979; Goldstein et al. 1979; Hecox et al. 1981; Picton et al. 1981; John et al. 1982; Mochizuki et al. 1982; Levine and McGaffigan 1983; Stockard and Stockard 1983). In infants, however, dif- ferences related to sex and the stimulated ear are still controversial (Stockard et al. 1979, 1980; Jacobson et al. 1980; Durieux-Smith et al. 1985). Different normality criteria used to select the nor- mal newborn population might explain some of these differences. At present, the clinical evalua- tion of BAEPs is based exclusively on the latencies of positive peaks and amplitude ratios. 0168-5597/88/$03.50 © 1988 Elsevier Scientific Publishers Ireland, Ltd.
-
Upload
independent -
Category
Documents
-
view
0 -
download
0
Transcript of Sex and ear differences of brain-stem acoustic evoked potentials in a sample of normal full-term...
Electroencephalography and clinical Neurophysiology, 1988, 71 : 357-366 357 Elsevier Scientific Publishers Ireland, Ltd.
EEG02061
Sex and ear differences of brain-stem acoustic evoked potentials in a sample of normal full-term newborns. Normative study
Giuseppe A. Chiarenza, Giulia M. D'Ambrosio and Adriana Guareschi Cazzullo lstituto di Neuropsichiatria Infantile, Unioersit~ degli Studi di Milano, Via Besta 1, 20161 Milan (Italy)
(Accepted for publication: 31 December 1987)
Summary The present paper reports a normative study of the BAEPs recorded from 80 normal full-term newborns by using a rarefaction click at 70, 60, 40, 20 dB HL.
Positive, negative peaks and the relative amplitudes were measured. Means, standard deviations and 95% and 99% confidence limits were calculated for each component, for positive and negative IPLs and amplitude ratios. A normality test distribution showed that each component had normal distribution except for wave PIII at 70 dB and at 60 dB HL because of its index of kurtosis and for IPLs PII-PIII and NII-NIII at 70 and 60 dB HL. MLRA was performed and significant statistical differences were found for sex, ears and intensities. Females had the latencies of waves PIII, PIV, PV, NII and NIV shorter than males. The BAEPs obtained from the left ear had shorter latencies for positive and negative peaks. Latencies, amplitude and morphology of the BAEPs vary with variations of the intensity. The IPLs PII-PV, PIII-PV and PIV-PV were not affected by changes of intensity.
Key words: Sex; Ear; BAEPs; Newborns
F r o m the first days of life, the b ra in - s t em audi - to ry evoked po ten t i a l s (BAEPs) p rov ide an objec- t ive eva lua t ion of the aud i to ry funct ion of the cochlea and b ra in - s t em structures. B A E P changes were observed fol lowing t r ea tmen t of high risk newborns (Starr et al. 1977; Hecox et al. 1981; S tockard and S tockard 1981, 1983; Hecox and Burka rd 1982). Fur the r , var ious cor re la t ions be- tween BAEPs and the cl inical deve lopmen t of infants at r isk were found (Marsha l l et al. 1980; Hecox and Cone 1981; Chia renza et al. 1982; Hecox and Burka rd 1982; S tockard et al. 1983; Sa l amy and Eldredge 1986). Consequent ly , BAEPs seem to be a p romis ing cl inical d iagnos t ic and
p rognos t i c ins t rument . BAEPs change wi th the m a t u r a t i o n of the C N S
and reach la tency and amp l i t ude values s imi lar to those of the adu l t at abou t the 18th m o n t h of l ife
Correspondence to: G.A. Chiarenza, Istituto di Neuro- psichiatria Infantile, Via Besta 1, 20161 Milan (Italy).
(Hecox and G a l a m b o s 1974; Sa lamy et al. 1975, 1980; Sa lamy and M c K e a n 1976; S tar r et al. 1977; Go lds t e in et al. 1979; S tockard et al. 1979; Hecox et al. 1981; Hecox and Burka rd 1982; Mochizuk i et al. 1982).
In add i t i on to age, o ther var iab les such as sex and the s t imula ted ears inf luence the BAEPs. These var iables have been wide ly s tud ied and the d i f ferences found in adul t s have been un- ques t ionab ly acccepted (Hecox and G a l a m b o s 1974; S tockard et al. 1978, 1979; F a b i a n i et al. 1979; Go lds t e in et al. 1979; Hecox et al. 1981; P ic ton et al. 1981; John et al. 1982; Mochizuk i et al. 1982; Levine and M c G a f f i g a n 1983; S tockard and S tockard 1983). In infants , however, dif- ferences re la ted to sex and the s t imula ted ear are still cont rovers ia l (S tockard et al. 1979, 1980; J acobson et al. 1980; Dur i eux -Smi th et al. 1985). Dif ferent no rma l i t y cr i ter ia used to select the nor - mal newborn popu l a t i on might expla in some of these differences. A t present , the cl inical evalua- t ion of BAEPs is based exclusively on the la tencies of posi t ive peaks and amp l i t ude rat ios.
0168-5597/88/$03.50 © 1988 Elsevier Scientific Publishers Ireland, Ltd.
358 G.A. CHIARENZA ET AL.
Recently, Wada and Start (1983) demonstrated that positive and negative peaks originate from different brain-stem structures. According to Start (1985), for example, the Pi l l wave is generated by the medial part of the superior olivary complex while the N I I I wave is generated by the ventral part of the lateral lemniscus contralateral to the stimulated ear. While the literature contains normative data on positive peaks in adults and newborns (Stockard et al. 1979), the negative waves of normal newborns have not yet been studied systematically.
The present paper presents normative data on the latencies of the positive and negative waves and on the amplitudes of the BAEPs in a group of full-term newborns and evaluates possible dif- ferences related to sex, the stimulated ear and click intensity.
Material and methods
BAEPs were recorded in 80 full-term normal infants, 38 males and 42 females. The duration of pregnancy was defined according to the criteria of Dubowitz et al. (1970). The normal infants were selected according to the following criteria: nor- mal pregnancy; mother between 20 and 38 years of age; not more than 2 previous normal preg- nancies; not more than 1 spontaneous abortion before the 13th week of pregnancy; A P G A R score at the 1st and 5th rain equal to or greater than 8; weight at birth between 2.8 and 3.8 kg; vertex presentation; no obstetrical instruments used at birth; absence of perinatal, postnatal, somatic and metabolic pathology; absence of pharmacological therapy during pregnancy and during the neonatal period; positive acoustic reattometry. The gesta- tional ages of the selected newborns were between 38 and 41 weeks: 17 of 38 weeks; 18 of 39 weeks; 36 of 40 weeks and 9 of 41 weeks. The records were made between the 2nd and the 5th days of life.
The newborns were tested in a quiet room where they lay in cribs in spontaneous sleep after a meal. The non-stimulated ear was placed against a pillow. An earphone encased in a rubber support was placed over the ear to be stimulated. Stimuli
were 9/sec, 0.1 msec rarefaction clicks. Single-ear stimulation was carried out at intensities of 70, 60, 40, 20 dB HL (equal to 100, 90, 70, 50 dB peSPL). The same loudspeaker was used for stimulating both the right and the left ears.
Ag/AgC1 electrodes were attached with collod- ion to the vertex and to each mastoid. Interelec- trode impedance was always lower than 3 kl2. The EEG was amplified (gain 4 x 10 4 ) using a band- pass of 160-3000 Hz (with a 12 dB octave slope) and averaged using a sweep of 10 msec. Two averages of 2048 stimuli were obtained of stimula- tion of each ear, recording from Cz to the ipsi- lateral (Mi) and contralateral (Ci) mastoids. The EEG was monitored on an oscilloscope and re- cording was interrupted each time noticeable artifacts were present in the EEG.
The test lasted for about 1.5 h. Recording was suspended when the newborn awoke.
Measurement of the BAEPs All positive and negative peaks, labelled
according to Jewett and Williston (1971), of the ipsilateral and contralateral responses were mea- sured. Components were identified by superim- posing the first and the second averages and the responses of both ears at the same intensity. BAEPs obtained from decreasing intensities were compared.
The following criteria were adopted for measur- ing the positive and negative components. Wave PI was identified as the first positive peak after 1.3 msec. If several peaks appeared within 0.7 msec, wave I was judged to be an average point among all peaks of equivalent amplitude. This rule was also adopted for wave P i l l and PV. Wave PII was measured both as a hump on the descending limb of wave I and as a separated peak. The wide negative trough that distinctly separated the posi- tive waves P I - P I I I from the successive compo- nents was designated as NII . Wave Pi l l was mea- sured as the first positive peak after the large negative trough (Nil). The latency of N I I I was measured on the negative peak of the descending limb of wave I I I and not over 0.8 msec. In cases in which PIV and PV were clearly distinct, the latency of wave NIV was evaluated. Wave PV was judged to be the widest positive peak recorded ipsilater-
BAEPs OF N E W B O R N S
ally and contralaterally after the N I I I trough and constantly present at all intensities after 6 msec. The latency of wave NV was measured at the end of the descending limb of wave PV, at not more than 1.0 msec. The peak-to-peak amplitudes were measured on the descending limb of each wave.
Statistical analysis The following statistical analyses were per-
formed on peak latencies, interpeak latencies (IPL) and on amplitudes and amplitude ratios (AR): means, standard deviations (S.D.) and tests of normal distribution. Kurtosis and skewness values were assumed to be indices of normal distribution, with confidence limits at 95% and 99%. Variables that did not have normal distribution were re- calculated after using power, logarithmic or square root transformations. Further, the t test for de- pendent variables was calculated to evaluate relia- bility among the average and ear and for indepen- dent variables, to ascertain possible age and sex differences. Confidence limits of the various com- ponents were calculated at 99% and 95%. Analysis of variance for the multiple linear regression was performed. Peak latencies, amplitudes, IPLs and ARs were the dependent variables. Independent variables were chronological age, gestational age, sex, ear, intensity and averages. Analysis of vari- ance was computed to test the significance of the partial individual regression coefficients that gave the t values. The sign ( + or - ) that precedes the t values of the individual regression coefficients indicates the direction of the regression.
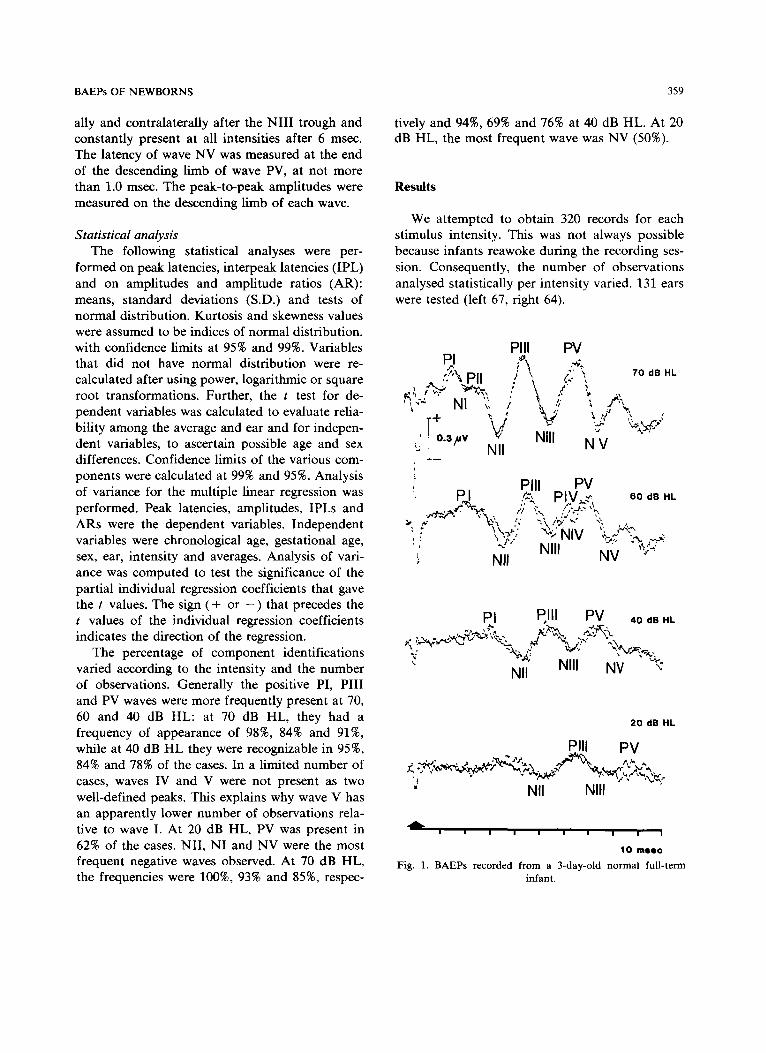
The percentage of component identifications varied according to the intensity and the number of observations. Generally the positive PI, P i l l and PV waves were more frequently present at 70, 60 and 40 dB HL: at 70 dB HL, they had a frequency of appearance of 98%, 84% and 91%, while at 40 dB H L they were recognizable in 95%, 84% and 78% of the cases. In a limited number of cases, waves IV and V were not present as two well-defined peaks. This explains why wave V has an apparently lower number of observations rela- tive to wave I. At 20 dB HL, PV was present in 62% of the cases. Ni l , NI and NV were the most frequent negative waves observed. At 70 dB HL, the frequencies were 100%, 93% and 85%, respec-
359
tively and 94%, 69% and 76% at 40 dB HL. At 20 dB HL, the most frequent wave was NV (50%).
Results
We attempted to obtain 320 records for each stimulus intensity. This was not always possible because infants reawoke during the recording ses- sion. Consequently, the number of observations analysed statistically per intensity varied. 131 ears were tested (left 67, right 64).
Pill PV PI F\ ",';~ " ~ Dll ; \ /:'" ~' 70 dB HL ' " / 1 1 . %'~" \
_ . , ',k , , , , . / ~\ ,
' | o.3,~v ~ Nill N V u 1_ Nil
,' PI I PV . pJ ez~ PIV, " " 60 d n HL
- ~ ~-~ l ; "," r , j .~ ' ,L
!,' INIII NV ";~ Nil
PI Pill PV 4o dB H,
v %~i ' ~ ','v,~,,% Nil ~ NIII NV ~-c
20 dB HL
PIll P V ..~.~:. . • . ~ ~ ?~,., • ~ . ~
Nil NIII "
A a i g I I l I I l I
10 msec
Fig. 1. BAEPs recorded from a 3-day-old normal full-term infant.
360 G.A. C H I A R E N Z A ET AL.
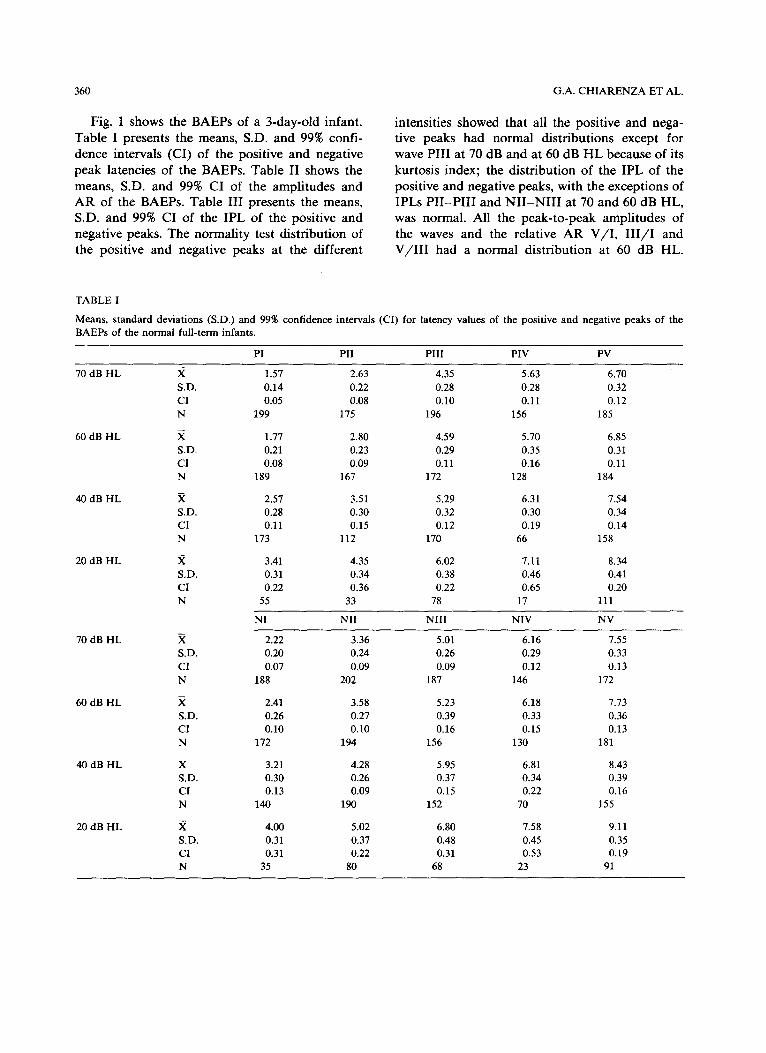
Fig. 1 shows the BAEPs of a 3-day-old infant. Table I presents the means, S.D. and 99% confi- dence intervals (CI) of the positive and negative peak latencies of the BAEPs. Table II shows the means, S.D. and 99% CI of the amplitudes and AR of the BAEPs. Table III presents the means, S.D. and 99% CI of the IPL of the positive and negative peaks. The normality test distribution of the positive and negative peaks at the different
intensities showed that all the positive and nega- tive peaks had normal distributions except for wave PIII at 70 dB and at 60 dB HL because of its kurtosis index; the distribution of the IPL of the positive and negative peaks, with the exceptions of IPLs PII-PIII and NII -NII I at 70 and 60 dB HL, was normal. All the peak-to-peak amplitudes of the waves and the relative AR V/I , I I I / I and V/I I I had a normal distribution at 60 dB HL.
TABLE I
Means, s tandard deviations (S.D.) and 99% confidence intervals (CI) for latency values of the positive and negative peaks of the BAEPs of the normal full-term infants.
PI PII PIII PIV PV
70 dB HL ,X 1.57 2.63 4.35 5.63 6.70 S.D. 0.14 0.22 0.28 0.28 0.32 CI 0.05 0.08 0.10 0.11 0.12 N 199 175 196 156 185
60 dB HL ,X 1.77 2.80 4.59 5.70 6.85 S.D. 0.21 0.23 0.29 0.35 0.31 CI 0.08 0.09 0.11 0.16 0.11 N 189 167 172 128 184
40 dB HL .X 2.57 3.51 5.29 6.31 7.54 S.D. 0.28 0.30 0.32 0.30 0.34 CI 0.11 0.15 0.12 0.19 0.14 N 173 112 170 66 158
20 dB HL X 3.41 4.35 6.02 7.11 8.34 S.D. 0.31 0.34 0.38 0.46 0.41 CI 0.22 0.36 0.22 0.65 0.20 N 55 33 78 17 111
NI Ni l NIII NIV NV
70 dB HL ,X 2.22 3.36 5.01 6.16 7.55 S.D. 0.20 0.24 0.26 0.29 0.33 CI 0.07 0.09 0.09 0.12 0.13 N 188 202 187 146 172
60 dB HL ,X 2.41 3.58 5.23 6.18 7.73 S.D. 0.26 0.27 0.39 0.33 0.36 CI 0.10 0.10 0.16 0.15 0.13 N 172 194 156 130 181
40 dB HL X 3.21 4.28 5.95 6.81 8.43 S.D. 0.30 0.26 0.37 0.34 0.39 CI 0.13 0.09 0.15 0.22 0.16 N 140 190 152 70 155
20 dB HL X 4.00 5.02 6.80 7.58 9.11 S.D. 0.31 0.37 0.48 0.45 0.35 C1 0.31 0.22 0.31 0.53 0.19 N 35 80 68 23 91
BAEPs OF NEWBORNS 361
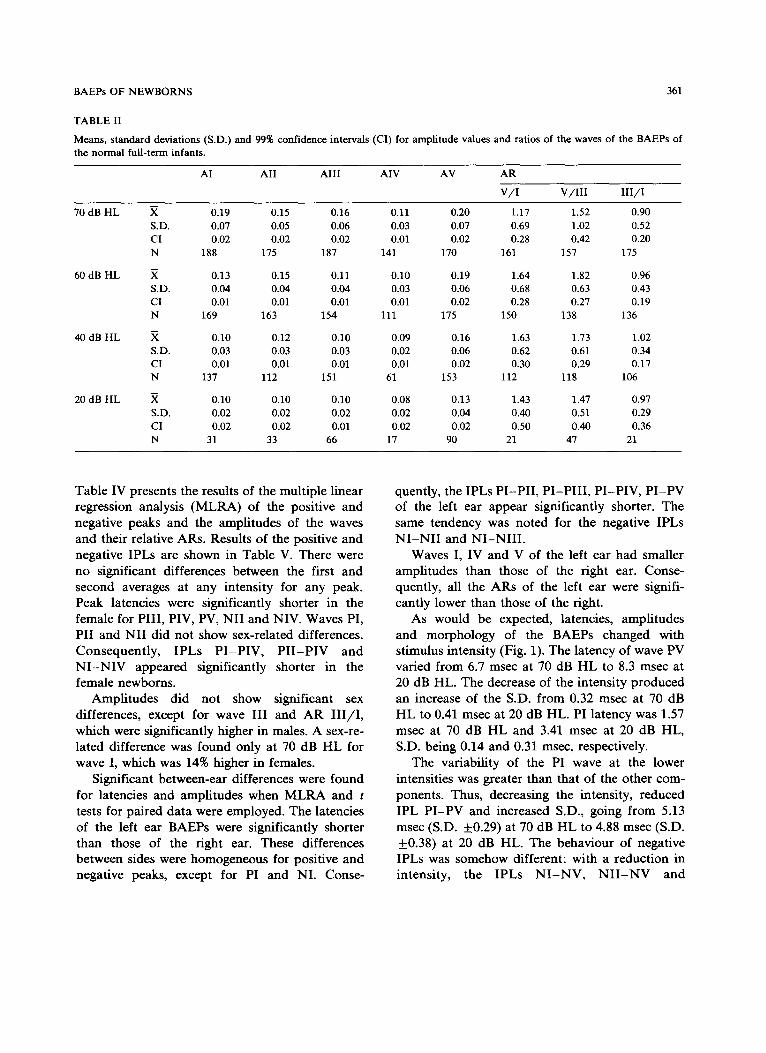
TABLE II
Means, standard deviations (S.D.) and 99% confidence intervals (CI) for amplitude values and ratios of the waves of the BAEPs of the normal full-term infants.
AI AII AIII AIV AV AR
V / I V / I I I I I I / I
70 dB HL ,X 0.19 0.15 0.16 0.11 0.20 1.17 1.52 0.90 S.D. 0.07 0.05 0.06 0.03 0.07 0.69 1.02 0.52 CI 0.02 0.02 0.02 0.01 0.02 0.28 0.42 0.20 N 188 175 187 141 170 161 157 175
60 dB HL X 0.13 0.15 0.11 0.10 0.19 1.64 1.82 0.96 S.D. 0.04 0.04 0.04 0.03 0.06 0.68 0.63 0.43 CI 0.01 0.01 0.01 0.01 0.02 0.28 0.27 0.19 N 169 163 154 111 175 150 138 136
40 dB HL ,X 0.10 0.12 0.10 0.09 0.16 1.63 1.73 1.02 S.D. 0.03 0.03 0.03 0.02 0.06 0.62 0.61 0.34 CI 0.01 0.01 0.01 0.01 0.02 0.30 0.29 0.17 N 137 112 151 61 153 112 118 106
20 dB HL X 0.10 0.10 0.10 0.08 0.13 1.43 1.47 0.97 S.D. 0.02 0.02 0.02 0.02 0.04 0,40 0.51 0.29 CI 0.02 0.02 0.01 0.02 0.02 0.50 0.40 0.36 N 31 33 66 17 90 21 47 21
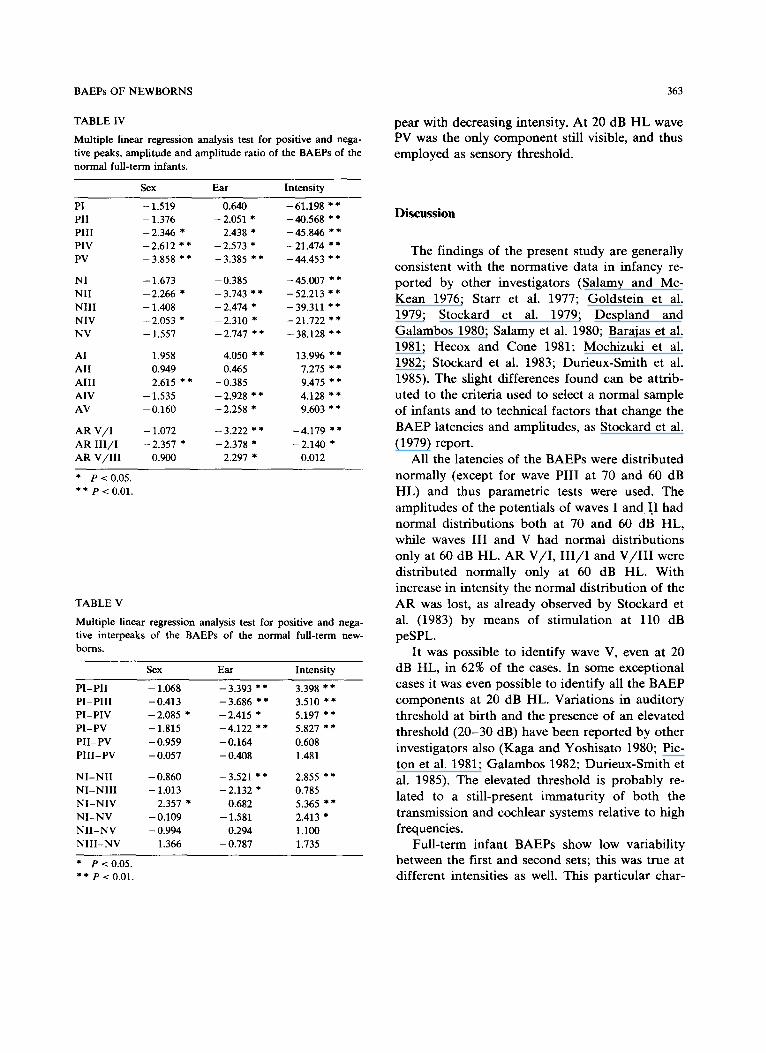
Table IV presents the results of the multiple linear regression analysis (MLRA) of the positive and negative peaks and the amplitudes of the waves and their relative ARs. Results of the positive and negative IPLs are shown in Table V. There were no significant differences between the first and second averages at any intensity for any peak. Peak latencies were significantly shorter in the female for PIII, PIV, PV, Ni l and NIV. Waves PI, PII and NII did not show sex-related differences. Consequently, IPLs P I -P IV , P I I - P I V and N I - N I V appeared significantly shorter in the female newborns.
Amplitudes did not show significant sex differences, except for wave III and AR I I I / I , which were significantly higher in males. A sex-re- lated difference was found only at 70 dB HL for wave I, which was 14% higher in females.
Significant between-ear differences were found for latencies and amplitudes when MLRA and t tests for paired data were employed. The latencies of the left ear BAEPs were significantly shorter than those of the right ear. These differences between sides were homogeneous for positive and negative peaks, except for PI and NI. Conse-
quently, the IPLs PI-PII , PI -PI I I , PI-PIV, P I -PV of the left ear appear significantly shorter. The same tendency was noted for the negative IPLs N I - N I I and NI -NI I I .
Waves I, IV and V of the left ear had smaller amplitudes than those of the right ear. Conse- quently, all the ARs of the left ear were signifi- cantly lower than those of the right.
As would be expected, latencies, amplitudes and morphology of the BAEPs changed with stimulus intensity (Fig. 1). The latency of wave PV varied from 6.7 msec at 70 dB H L to 8.3 msec at 20 dB HL. The decrease of the intensity produced an increase of the S.D. from 0.32 msec at 70 dB HL to 0.41 msec at 20 dB HL. PI latency was 1.57 msec at 70 dB HL and 3.41 msec at 20 dB HL, S.D. being 0.14 and 0.31 msec, respectively.
The variability of the PI wave at the lower intensities was greater than that of the other com- ponents. Thus, decreasing the intensity, reduced IPL PI -PV and increased S.D., going from 5.13 msec (S.D. +0.29) at 70 dB H L to 4.88 msec (S.D. +0.38) at 20 dB HL. The behaviour of negative IPLs was somehow different: with a reduction in intensity, the IPLs N I - N V , N I I - N V and
362 G.A. CHIARENZA ET AL.
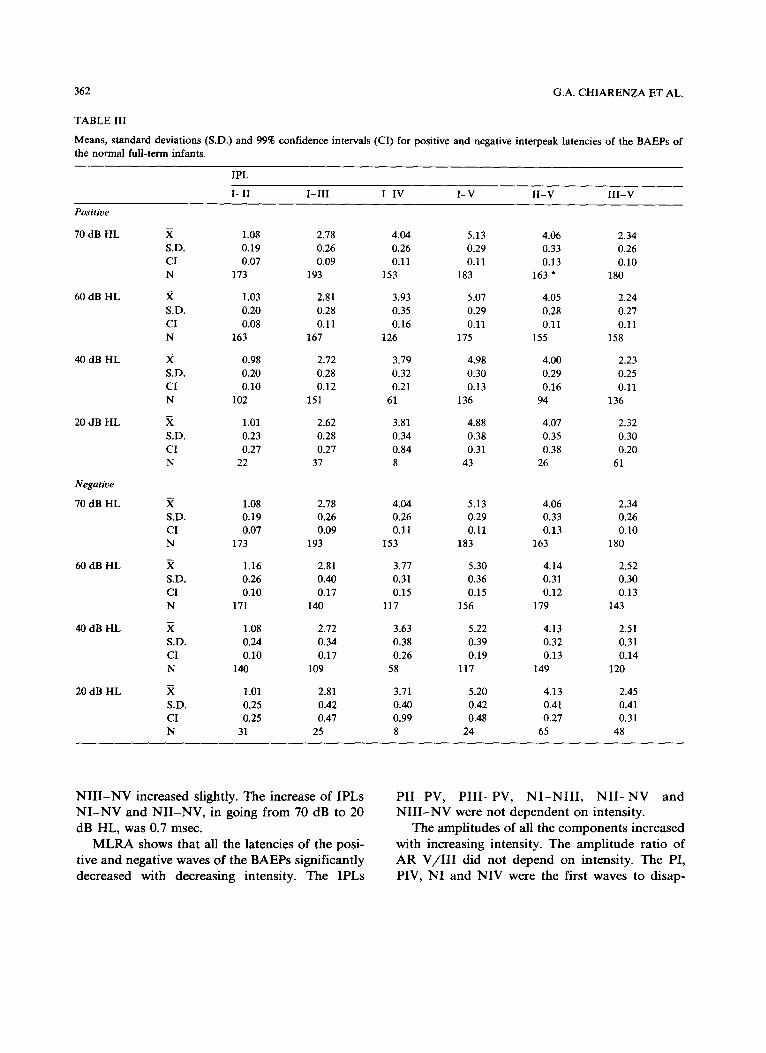
TABLE III
Means, standard deviations (S.D.) and 99% confidence intervals (CI) for positive and negative interpeak latencies of the BAEPs of the normal full-term infants.
IPL
I - I I I - I I I I - IV I -V I I -V III-V
Positive
70 dB HL
60 dB HL
40 dB HL
20 dB HL
Negative
70 dB HL
60 dB HL
40 dB HL
20 dB HL
.X 1.08 2.78 4.04 5.13 4.06 2.34 S.D. 0.19 0.26 0.26 0.29 0.33 0.26 CI 0.07 0.09 0.11 0.11 0.13 0.10 N 173 193 153 183 163 '~ 180
,~ 1.03 2.81 3.93 5.07 4.05 2.24 S.D. 0.20 0.28 0,35 0.29 0.28 0.27 CI 0.08 0.11 0,16 0.11 0.11 0.11 N 163 167 126 175 155 158
,X 0.98 2.72 3.79 4.98 4.00 2.23 S.D. 0.20 0.28 0.32 0.30 0.29 0.25 CI 0.10 0.12 0.21 0.13 0.16 0.11 N 102 151 61 136 94 136
,X 1.01 2.62 3.81 4.88 4.07 2.32 S.D. 0.23 0.28 0.34 0.38 0.35 0.30 CI 0.27 0.27 0.84 0.31 0.38 0.20 N 22 37 8 43 26 61
.~ 1.08 2.78 4.04 5.13 4.06 2.34 S.D. 0.19 0.26 0.26 0.29 0.33 0.26 CI 0.07 0.09 0.11 0.11 0.13 0.10 N 173 193 153 183 163 180
,X 1.16 2.81 3.77 5.30 4.14 2.52 S.D. 0.26 0.40 0.31 0.36 0.31 0.30 CI 0.10 0.17 0.15 0.15 0.12 0.13 N 171 140 117 156 179 143
,~ 1.08 2.72 3.63 5.22 4.13 2.51 S.D. 0.24 0.34 0.38 0.39 0.32 0.31 CI 0.10 0.17 0.26 0.19 0.13 0.14 N 140 109 58 117 149 120
X, 1.01 2.81 3.71 5.20 4.13 2.45 S.D. 0.25 0.42 0.40 0.42 0.41 0.41 CI 0.25 0.47 0.99 0,48 0.27 0.31 N 31 25 8 24 65 48
N I I I - N V i n c r e a s e d s l igh t ly . T h e i n c r e a s e o f I P L s
N I - N V a n d N I I - N V , i n g o i n g f r o m 70 d B to 20
d B H L , was 0 .7 msec .
M L R A s h o w s t h a t a l l t h e l a t e n c i e s o f t h e p o s i -
t ive a n d n e g a t i v e w a v e s o f t h e B A E P s s i g n i f i c a n t l y
d e c r e a s e d w i t h d e c r e a s i n g i n t e n s i t y . T h e I P L s
P I I - P V , P I I I - P V , N I - N I I I , N I I - N V a n d
N I I I - N V w e r e n o t d e p e n d e n t o n i n t e n s i t y .
T h e a m p l i t u d e s o f a l l t h e c o m p o n e n t s i n c r e a s e d
w i t h i n c r e a s i n g i n t e n s i t y . T h e a m p l i t u d e r a t i o o f
A R V / I I I d i d n o t d e p e n d o n i n t e n s i t y . T h e PI ,
P IV , N I a n d N I V w e r e t he f i r s t w a v e s t o d i s a p -
B A E P s O F N E W B O R N S 363
T A B L E I V
M u l t i p l e l i n e a r r e g r e s s i o n a n a l y s i s t e s t f o r p o s i t i v e a n d n e g a -
t i v e p e a k s , a m p l i t u d e a n d a m p l i t u d e r a t i o o f t h e B A E P s o f t h e
n o r m a l f u l l - t e r m i n f a n t s .
Sex E a r I n t e n s i t y
P I - 1 . 5 1 9 0 . 6 4 0 - 6 1 . 1 9 8 * *
P I I - 1 . 3 7 6 - 2 . 0 5 1 * - 4 0 . 5 6 8 * *
P i l l - 2 . 3 4 6 * - 2 . 4 3 8 * - 4 5 . 8 4 6 * *
P I V - 2 . 6 1 2 * * - 2 . 5 7 3 * - 2 1 . 4 7 4 * *
P V - 3 . 8 5 8 * * - 3 . 3 8 5 * * - 4 4 . 4 5 3 * *
N I - 1 . 6 7 3 - 0 . 3 8 5 - 4 5 . 0 0 7 * *
N I I - 2 . 2 6 6 * - 3 . 7 4 3 * * - 5 2 . 2 1 3 * *
N I I I - 1 . 4 0 8 - 2 . 4 7 4 * - 3 9 . 3 1 1 * *
N I V - 2 . 0 5 3 * - 2 . 3 1 0 * - 2 1 . 7 2 2 * *
N V - 1 . 5 5 7 - 2 . 7 4 7 * * - 3 8 . 1 2 8 * *
A I 1 . 9 5 8 4 . 0 5 0 * * 1 3 . 9 9 6 * *
A l l 0 . 9 4 9 0 . 4 6 5 7 . 2 7 5 * *
A I I I - 2 . 6 1 5 * * - 0 . 3 8 5 9 . 4 7 5 * *
A I V - 1 . 5 3 5 - 2 . 9 2 8 * * 4 . 1 2 8 * *
A V - 0 . 1 6 0 - 2 . 2 5 8 * 9 . 6 0 3 * *
A R V / I - 1 . 0 7 2 - 3 . 2 2 2 * * - 4 . 1 7 9 * *
A R I I I / I - 2 . 3 5 7 * - 2 . 3 7 8 * - 2 . 1 4 0 *
A R V / I I I 0 . 9 0 0 - 2 . 2 9 7 * 0 . 0 1 2
* P < 0 . 0 5 .
* * P < 0 . 0 1 .
T A B L E V
M u l t i p l e l i n e a r
t i r e i n t e r p e a k s
b o r n s .
r e g r e s s i o n a n a l y s i s t e s t f o r p o s i t i v e a n d n e g a -
o f t h e B A E P s o f t h e n o r m a l f u l l - t e r m n e w -
Sex E a r I n t e n s i t y
P I - P I I - 1 . 0 6 8 - 3 . 3 9 3 * * 3 . 3 9 8 * *
P I - P I I I - 0 . 4 1 3 - 3 . 6 8 6 * * 3 . 5 1 0 * *
P I - P I V - 2 . 0 8 5 * - 2 . 4 1 5 * 5 . 1 9 7 * *
P I - P V - 1 . 8 1 5 - 4 . 1 2 2 * * 5 . 8 2 7 * *
P I I - P V - 0 . 9 5 9 - 0 . 1 6 4 0 . 6 0 8
P I I I - P V - 0 . 0 5 7 - 0 . 4 0 8 1 .481
N I - N I I - 0 . 8 6 0 - 3 . 5 2 1 * * 2 . 8 5 5 * *
N I - N I I 1 - 1 . 0 1 3 - 2 . 1 3 2 * 0 . 7 8 5
N I - N I V - 2 . 3 5 7 * - 0 . 6 8 2 5 . 3 6 5 * *
N I - N V - 0 . 1 0 9 - 1 .581 2 . 4 1 3 *
N I I - N V - 0 . 9 9 4 0 . 2 9 4 1 . 1 0 0
N I I I - N V 1 . 3 6 6 - 0 . 7 8 7 1 .735
* P < 0 . 0 5 .
* * P < 0 . 0 1 .
pear with decreasing intensity. At 20 dB H L wave PV was the only component still visible, and thus employed as sensory threshold.
Discussion
The findings of the present study are generally consistent with the normative data in infancy re- ported by other investigators (Salamy and Mc- Kean 1976; Starr et al. 1977; Goldstein et al. 1979; Stockard et al. 1979; Despland and Galambos 1980; Salamy et al. 1980; Barajas et al. 1981; Hecox and Cone 1981; Mochizuki et al. 1982; Stockard et al. 1983; Durieux-Smith et al. 1985). The slight differences found can be attrib- uted to the criteria used to select a normal sample of infants and to technical factors that change the BAEP latencies and amplitudes, as Stockard et al. (1979) report.
All the latencies of the BAEPs were distributed normally (except for wave PIII at 70 and 60 dB HL) and thus parametric tests were used. The amplitudes of the potentials of waves I and I.I had normal distributions both at 70 and 60 dB HL, while waves III and V had normal distributions only at 60 dB HL. AR V / I , I I I / I and V / I I I were distributed normally only at 60 dB HL. With increase in intensity the normal distribution of the AR was lost, as already observed by Stockard et al. (1983) by means of stimulation at 110 dB peSPL.
It was possible to identify wave V, even at 20 dB HL, in 62% of the cases. In some exceptional cases it was even possible to identify all the BAEP components at 20 dB HL. Variations in auditory threshold at birth and the presence of an elevated threshold (20-30 dB) have been reported by other investigators also (Kaga and Yoshisato 1980; Pic- ton et al. 1981; Galambos 1982; Durieux-Smith et al. 1985). The elevated threshold is probably re- lated to a still-present immaturity of both the transmission and cochlear systems relative to high frequencies.
Full-term infant BAEPs show low variability between the first and second sets; this was true at different intensities as well. This particular char-
364 G.A. CHIARENZA ET AL.
acteristic consequently makes the BAEPs a highly reliable index of brain-stem function in infants as well as in adults.
Numerous studies have reported sex-related differences in the latency and amplitude of wave V and IPL I - V of BAEPs in adults (McClelland and McCrea 1977; Stockard et al. 1978, 1979; Michalewski et al. 1980; Stockard and Stockard 1983) even at lower intensities and when the click was administered at a high frequency (Picton et al. 1981).
Results in children and babies are less clear. Mochizuki et al. (1982) reported sex differences after 5 years of age, O 'Donovan (1980) after 7 years and McClelland and McCrea (1977) only after 14 years; they attributed them to variations in hormonal rates. Cox et al. (1981) and Durieux- Smith et al. (1985) did not find any statistically significant differences in infants.
Our normative study shows a difference be- tween the sexes. Females have a statistically sig- nificantly shorter latency of waves PIII , PIV, PV, N i l and NIV and a statistically significantly smaller amplitude of wave III . The sex-related differences refer to the absolute latency values and not to the various IPLs. The significant differences ascertained for IPLs P I -P IV , P I I -P IV , N I - N I V can probably be attributed to the fact that waves PI, PII and NI do not show statistically significant sex-related differences.
Data on possible sex-related amplitude dif- ferences are not as plentiful as those relative to the latencies. Picton et al. (1981) reported that the amplitudes of waves I, I71 and V were greater in adult males. Mochizuki et al. (1982) reported that the amplitude of wave V in females is larger after 2 years of age, but this difference is statistically significant only between 10 and 20 years of age.
In our group of normal infants wave I was the only wave which was greater in females at each intensity; this was statistically significant only at 70 dB HL. These data show that sex-related dif- ferences in BAEPs are already present at birth, thus implying the presence of anatomical dif- ferences early in life. In the females, the reduced latency and the increased amplitude could be at- tributed to shorter anatomical pathways and to an increase in synchronization.
Studies of maturity in babies and children re- port that the main sex-related difference is a faster female maturat ion - - gaining 1 week in 10 from conception, so that females reach puberty 2 years before males - - and this has a genetic origin too, common to primates and probably to all mammals (Reynolds 1976).
The differences in the data reported by other investigators can be attributed to the heteroge- neous composition of the groups of infants studied. Our normality criteria were multiple and therefore led to the composition of a particularly homoge- neous group, examined between the 2nd at 5th days of life.
Interaural differences were reported in a normative study of adults by John et al. (1982). Durieux-Smith et al. (1985) did not find any dif- ferences between the right and left ears of a group of infants. The differences found in our normative study cannot be attributed to technical factors. The same loudspeaker, preamplification and aver- age channels were used to record the ipsilateral response of the stimulated ear. Further, these dif- ferences cannot be due to amplitude changes of the EEG signal since they would also have had an effect on PI and NI.
With variations of intensity, the characteristics of the BAEPs were similar to those described by other investigators in studies carried out on adults (Stockard et al. 1979; Picton et al. 1981). From birth on, the latencies increase and the amplitudes diminish with the lowering of intensity, thus pro- ducing morphological changes of the evoked potentials.
Positive and negative IPLs I I - V and I I I - V , in addition to negative IPL I - I I I , are not affected by intensity variations and therefore can be employed as more reliable cerebral transmission times in the brain-stem than IPL I - V alone.
Many workers who screen neonates for audi- tory function with BAEPs use the latency of wave V at a single intensity as the sole indicator of normal hearing threshold. This single criterion is not very reliable and can lead to errors in evaluat- ing the BAEPs. Indeed, reduced ventilation of the middle ear because of a modest inflammation of the pr imary airways could lead to an increase in latency of wave V, simulating a transmission-type
BAEPs OF NEWBORNS 365
deficit. In these cases, an examination a short time later will show the complete reversibility of the alteration of wave V latency.
Further, a normal wave V can be found in subjects with neurosensory hypoacousia due to the recruitment effect. In these cases it is necessary to use different intensities to reconstruct the laten- c y / intensity curve. Using more than one intensity gives the further advantage of more accurate iden- tification of the components. The criterion of comparing the ipsilateral response with the con- tralateral response should be used regularly.
In the same way, a single parameter, IPL I -V , is not sufficient to exclude neurological damage conclusively. Indeed, we have found a normal IPL I -V , together with abnormally prolonged IPLs P I I -PV, P I I I - P V and N I I - N V , in some subjects with myelomeningocele.
The most awkward cases, by far, are those which show a neurological and neurosensory hear- ing deficit with elevated threshold. In these cases it is particularly difficult to identify wave V be- cause only high intensity stimuli are used and the morphology varies considerably even at the same intensity.
This situation also has the difficulty of identify- ing wave I for the measurement of IPLs. Other strategies have been tried in those cases: reduction of the stimulus frequency, reverse stimulus phase, change bandpass from 160 Hz to 16 Hz (Stockard et al. 1983). When wave I cannot be identified, we have found it is most convenient to use negative IPL N I - N I I I , N I I - N V and N I I I - N V , which are intensity independent. When it is required to use the amplitude ratios as further parameters to evaluate brain-stem function, it should be remem- bered that non-parametric tests should be used for subjects with auditory thresholds greater than 60 dB, because the normal distribution of the ampli- tude ratio of V / I and V / I l l is lost above that intensity.
The present normative study led to the follow- ing considerations: multiple normality criteria should be used in the perinatal age to form a homogeneous normal control group; the BAEPs have to be recorded using more than 2 different intensities to identify the various components; it is necessary to separate the data for sex and ear to
compare pathological with normal subjects; the IPLs less affected by intensity could be more reliable to evaluate the central conduction time.
Research Supported by the National Research Council, Special Project on Preventive and Rehabilitative Medicine. C.N.R. 85.0064. 56.115.06887.
References
Barajas, J.J., Olaizola, F., Tapia, M.C., Alarcon, J.L. and Alaminos, D. Audiometric study of the neonate: impedance audiometry, behavioural responses and brainstem audiome- try. Audiology, 1981, 20: 41-52.
Chiarenza, G.A., Console, V., Airaghi, M., Oriani, S., Acquistapace, V., D'Ambrosio, G.M., Bindelh, D.R., Moro, F: and Diasio, G. Brainstem acoustic evoked potentials in preterm and fullterm newborns. A follow-up study. In: G.A. Chiarenza and D. Papakostopoulos (Eds.), Clinical Application of Cerebral Evoked Potentials in Pediatric Medicine. Excerpta Medica, Amsterdam, 1982: 363-378.
Cox, C., Hach, M. and Metz, D. Brainstem-evoked response audiometry: normative data from the preterm infant. Audiology, 1981, 20: 53-64.
Despland, P. and Galambos, R. The auditory brainstem re- sponse (ABR) is a useful diagnostic tool in the intensive care nursery. Pediat. Res., 1980, 14: 154-158.
Dubowitz, L.M., Dubowitz, V. and Goldberg, C. Clinical as- sessment of gestational age in the newborn infants. J. Pediat., 1970, 77: 1-10.
Durieux-Smith, A., Edwards, C.G., Picton, T.W. and McMur- ray, B. Auditory brainstem response to clicks in neonates. J. Otolaryngol., 1985, Suppl. 14: 12-18.
Fabiani, M., Sohmer, H., Tait, C., Gafni, M. and Kinarti, R.A. Functional measure of brain activity: brainstem transmis- sion time. Electroenceph. clin. Neurophysiol., 1979, 47: 483-491.
Galambos, R. Maturation of auditory evoked potentials. In: G.A. Chiarenza and D. Papakostopoulos (Eds.), Clinical Application of Cerebral Evoked Potentials in Pediatric Medicine. Excerpta Medica, Amsterdam, 1982: 323-343.
Goldstein, P.J., Krumholz, A., Felix, J.K. and Shannon, D. Brainstem evoked response in neonates. Am. J. Obstet. Gynecol., 1979, 135: 622-628.
Hecox, K. and Burkard, R. Developmental dependencies of the human auditory evoked response. Ann. NY Acad. Sci., 1982, 388: 538-556.
Hecox, K. and Cone, B. Prognostic importance of brainstem auditory evoked responses after asphyxia. Neurology, 1981, 31: 1429-1433.
Hecox, K. and Galambos, R. Brainstem auditory evoked responses in human infants and adults. Arch. Otolaryngol., 1974, 99: 30-33.
Hecox, K.E., Cone, B. and Blaw, M.E. Brainstem auditory evoked response in the diagnosis of pediatric neurologic diseases. Neurology, 1981; 31: 832-840.
366 G.A. CHIARENZA ET AL.
Jacobson, J.T., Novotny, G.M and Elliot, S. Clinical considera- tions in the interpretation of auditory brainstem response audiometry. J. Otolaryngol., 1980, 9: 493-504.
Jewett, D,L. and Williston, J.S. Auditory evoked far-fields averaged from the scalp of humans. Brain, 1971, 94: 681-696.
John, E.R., Baird, H., Fridman, J. and Bergelson, M. Norma- tive values for brain-stem auditory evoked potentials ob- tained by digital filtering and automatic peak detection. Electroenceph. clin. Neurophysiol., 1982, 54: 153-160.
Kaga, K. and Yoshisato, T. Auditory brainstem response and behavioural audiometry. Developmental correlates. Arch. Otolaryngol., 1980, 106: 546-566.
Levine, R.A. and McGaffigan, P.M. Right-left asymmetries in the human brain-stem: auditory evoked potentials. Electro- enceph, olin. Neurophysiol., 1983, 55: 532-537.
Marshall, R.E., Reichert, T.J., Kerley, S.M. and Hallowel, D. Auditory function in newborn intensive care unit patients revealed by auditory brainstem potentials. J. Pediat., 1980, 96: 731-735.
McClelland, R. and McCrea, R. Gender differences in the auditory evoked brainstem responses. Electroenceph. clin. Neurophysiol., 1977, 43: 578.
Michalewski, H.J., Thompson, L.W., Patterson, J.V., Bowman, T.E. and Litzelman, D. Sex differences in the amplitudes and latencies of the human auditory brain stem potentials. Electroenceph. din. Neurophysiol., 1980, 48: 351-356.
Mochizuki, Y., Go, T., Ohkubo, H., Tatara, T. and Motomura, T. Developmental changes of brainstem auditory evoked potentials (BAEPs) in normal human subjects from infants to young adults. Brain Dev., 1982, 4: 127-136.
O'Donovan, C.A. Latency of brainstem response in children. Brit. J. Audiol., 1980, 14: 23-29.
Picton, T.W., Stapells, D.R. and Cambell, K.B. Auditory evoked potentials from the human cochlea and brainstem. J. Otolaryngol., 1981, Suppl. 9: 1-35.
Reynolds, V. The Biology of Human Action. Freeman and Co., Reading, 1976.
Salamy, A. and Eldredge, L. ABRs in the ICN. In: J.W. Rohrbaugh, J.R. Johnson and R. Parasuraman (Eds.), Eighth International Conference on Event Related Poten- tials of the Brain. Research Report, Stanford, CA, 1986: 31-33.
Salamy, A. and McKean, C.M. Postnatal development of hu- man brain stem potentials during the first year of life. Electroenceph. din. Neurophysiol., 1976, 40: 418-426.
Salamy, A., McKean, C.M. and Buda, F.B. Maturational changes in auditory transmission as reflected in human brainstem potentials. Brain Res., 1975, 96: 361-366.
Salamy, A., Mendelson, T., Tooley, W.H. and Chaplin, E.R. Contrasts in brainstem function between normal and high- risk infants in early postnatal life. Early Hum. Dev., 1980, 4: 179-185.
Staff, A. Auditory pathway origins of scalp-derived auditory brainstem responses. In: C. Morocutti and P.A. Rizzo (Eds.), Evoked Potentials. Neurophysiological and Clinical Aspects. Elsevier Science Publishers, Amsterdam, 1985: 133-143.
Staff, A., Amlie, R.N., Martin, W.H. and Sanders, S. Develop- ment of auditory function in newborn infants revealed by auditory brainstem potentials. Pediatrics, 1977, 60: 831-839.
Stockard, J.E. and Stockard, J.J. Brainstem auditory evoked potentials in normal and otoneurologically impaired new- bores and infants. In: C.E. Henry (Ed.), Current Clinical Neurophysiology: Update on EEG and Evoked Potentials. Symposium Specialists, Miami, FL, 1981: 421-466.
Stockard, J.E. and Stockard, J.J. Recording and analyzing auditory brainstem responses. In: E. Moore (Ed.), Bases of Auditory Brainstem Evoked Responses. Grune and Strat- ton, New York, 1983: 255-286.
Stockard, J.J., Stoekard, J.E. and Sharbrough, F.W. Non path- ologic factors influencing brainstem auditory evoked poten- tials. Am. J. EEG Technol., 1978, 18: 177-193.
Stockard, J.E., Stockard, J.J., Westmoreland, B.F. and Corfits, J.L. Brainstem auditory evoked responses. Normal varia- tions as a function of stimulus and subject characteristics. Arch. Neurol., 1979, 36: 823-831.
Stockard, J.J., Stockard, J.E. and Sharbrough, F.W. Brainstem auditory evoked potentials in neurology: methodology, in- terpretation, clinical application. In: M.J. Aminoff (Ed.), Electrodiagnosis in Clinical Neurology. Churchill Living- stone, New York, 1980: 370-398.
Stockard, J.E., Stoekard, J.J., Kleinberg, F. and Westmoreland, B.F. Prognostic value of brainstem auditory evoked poten- tials in neonates. Arch. Neurol., 1983, 40: 360-365.
Wada, S.I. and Starr, A. Generation of auditory brain stem responses (ABRs). 3. Effects of lesions on the superior olive lateral lemniscus and inferior colliculus on the ABR in guinea pig. Electroenceph. din. Neurophysiot., 1983, 56: 352-366.