EEG, Auditory Evoked Potentials and Evoked Rhythmicities in Three-Year-Old Children
17
Intern. J. Newoscience. 1994, Vol. 75. pp. 239-255 Reprints available directly from the publisher Photocopying permitted by license only 0 1994 Gordon and Breach Science Publishers S.A. Printed in the United States of America EEG, AUDITORY EVOKED POTENTIALS AND EVOKED RHYTHMICITIES IN THREE- YEAR-OLD CHILDREN CANAN BASAR-EROGLU Institute of Physiology, Medical University Liibeck, Ratzeburger Allee 160, 23538 Liibeck, Germany VASIL KOLEV Brain Research Institute, Bulgarian Academy of Sciences, Acad. G. Bonchev str., bl. 23, 1113 Sofia, Bulgaria BIRGIT RITTER Evang . Krankenhaus Hamm, Markische Kinderklinik, 59071 Hamm, Germany FUAT AKSU Vestische Kinderklinik, Department of Neuropediatrics, 4571 1 Datteln, Germany EROL BASAR Institute of Physiology, Medical University Liibeck, Ratzeburger Allee 160, 23538 Liibeck, Germany (Received July 13, 1993) According to our working hypothesis, the resonance properties of the brain systems play an important role in internal brain communications (e.g., Bapr, 1992; Bqar, BaSar-Eroglu, Demiralp & Schiirmann, 1992). It was assumed that evoked potentials (EPs) reflect brain resonance properties, showing enhance- ment, time and frequency-locking during the poststimulus period. All these phenomena might be referred to the spontaneous (intrinsic) EEG rhythms according to the excitability rule and the related concept of brain system response susceptibility: a brain system could react to internal or external stimuli producing those rhythms or frequency components, which have already been present in intrinsic or spontaneous activity (Bagar, 1980). In order to test the hypothesis of response susceptibility, in the present paper we used an natural model-3-year-old children-to investigate how brain systems respond to external stimu- lation if their spontaneous rhythms are different in comparison to the spontaneous EEG rhythms in adults. For that yxpose we used a combined time and frequency domain approach. The spectral characteristics of the spontaneous EEGs as well as the frequency components of auditory EPs elicited under identical auditory stimulation in 3-year-old children and adults aged 20-22 years were compared. Our observa- tions support the hypothesis for response susceptibility; if in a given frequency channel the spontaneous brain rhythms are missing, they are also absent in the evoked and induced rhythmicities and vice versa: children at 3 years do not create alpha resonance upon sensory stimulation while they do not have developed EEG rhythms in the range of 8-15 Hz. Elicited under identical experimental conditions (au- ditory stimulation with fixed stimulus parameters) children and adult evoked rhythms differ. It was concluded that the AEPs recorded in 3-year-old children might be regarded mainly as a superposition Supported by DFG grants Ba-831/5-1 and 436-BUL-l12/12/92. Correspondence to: Prof. E. Bapr, Institut fur Physiologie, Medizinische Universitat zu Lubeck, Ratzeburger Allee 160, 23538 Liibeck, 1, Germany. 239 Int J Neurosci Downloaded from informahealthcare.com by Lulea University Of Technology on 08/08/13 For personal use only.
Transcript of EEG, Auditory Evoked Potentials and Evoked Rhythmicities in Three-Year-Old Children
Intern. J . Newoscience. 1994, Vol. 75. pp. 239-255 Reprints available directly from the publisher Photocopying permitted by license only
0 1994 Gordon and Breach Science Publishers S.A. Printed in the United States of America
EEG, AUDITORY EVOKED POTENTIALS AND EVOKED RHYTHMICITIES IN THREE-
YEAR-OLD CHILDREN
CANAN BASAR-EROGLU
Institute of Physiology, Medical University Liibeck, Ratzeburger Allee 160, 23538 Liibeck, Germany
VASIL KOLEV
Brain Research Institute, Bulgarian Academy of Sciences, Acad. G . Bonchev str. , bl. 23 , 1113 Sofia, Bulgaria
BIRGIT RITTER
Evang . Krankenhaus Hamm, Markische Kinderklinik, 59071 Hamm, Germany
FUAT AKSU
Vestische Kinderklinik, Department of Neuropediatrics, 4571 1 Datteln, Germany
EROL BASAR
Institute of Physiology, Medical University Liibeck, Ratzeburger Allee 160, 23538 Liibeck, Germany
(Received July 13, 1993)
According to our working hypothesis, the resonance properties of the brain systems play an important role in internal brain communications (e.g., Bapr, 1992; Bqar, BaSar-Eroglu, Demiralp & Schiirmann, 1992). It was assumed that evoked potentials (EPs) reflect brain resonance properties, showing enhance- ment, time and frequency-locking during the poststimulus period. All these phenomena might be referred to the spontaneous (intrinsic) EEG rhythms according to the excitability rule and the related concept of brain system response susceptibility: a brain system could react to internal or external stimuli producing those rhythms or frequency components, which have already been present in intrinsic or spontaneous activity (Bagar, 1980). In order to test the hypothesis of response susceptibility, in the present paper we used an natural model-3-year-old children-to investigate how brain systems respond to external stimu- lation if their spontaneous rhythms are different in comparison to the spontaneous EEG rhythms in adults. For that yxpose we used a combined time and frequency domain approach. The spectral characteristics of the spontaneous EEGs as well as the frequency components of auditory EPs elicited under identical auditory stimulation in 3-year-old children and adults aged 20-22 years were compared. Our observa- tions support the hypothesis for response susceptibility; if in a given frequency channel the spontaneous brain rhythms are missing, they are also absent in the evoked and induced rhythmicities and vice versa: children at 3 years do not create alpha resonance upon sensory stimulation while they do not have developed EEG rhythms in the range of 8-15 Hz. Elicited under identical experimental conditions (au- ditory stimulation with fixed stimulus parameters) children and adult evoked rhythms differ. It was concluded that the AEPs recorded in 3-year-old children might be regarded mainly as a superposition
Supported by DFG grants Ba-831/5-1 and 436-BUL-l12/12/92. Correspondence to: Prof. E. Bapr, Institut fur Physiologie, Medizinische Universitat zu
Lubeck, Ratzeburger Allee 160, 23538 Liibeck, 1, Germany.
239
Int J
Neu
rosc
i Dow
nloa
ded
from
info
rmah
ealth
care
.com
by
Lul
ea U
nive
rsity
Of
Tec
hnol
ogy
on 0
8/08
/13
For
pers
onal
use
onl
y.

240 C. BASAR-EROGLU et al .
of rhythmicities in delta and theta ranges. These rhythmicities are prolonged and delayed in comparison to the corresponding rhythms in adults.
Keywords: Evoked rhythmicity, induced rhythmicity, auditon evoked potentials, response susceptibility, children EEG, children AEPs.
The brain rhythmicities evoked or modulated by stimuli and observed at neuronal or field potential levels are suggested to be called “induced rhythmicities” (Bapr, 1992; Bullock, 1992). In our opinion the induced rhythmicities concept is related to a hy- pothesis according to which the evoked or event-related brain potentials reflect ex- ternal stimulus and/or endogenously evoked synchronization, frequency stabil- ization, frequency selective enhancement and phase reordering of the ongoing EEG activity (Bapr & Ozesmi, 1972; Sayers, Beagly, & Henshall, 1974; BaSar, Gonder, Ozesmi, & Ungan, 1975; BaSar, Gonder, & Ungan, 1976; Davis, 1976; Parvin, Torres, & Johnson, 1980; BaSar, 1980, 1983; BaSar, BaSar-Eroglu, Par- nefjord, Rahn, & Schurmann, 1992). Thus, a new approach for understanding and interpreting brain functions emerged, based on the rhythmic phenomena recorded at neuronal or field potential level.
The application of induced rhythmicities approach has led to building a concept for brain system response susceptibility: The brain structures (systems) are consid- ered as dynamic systems having the property of continuously and spontaneously changing their states. If such a dynamic system is stimulated, it is to be expected that for every state a different excitability or different response susceptibility will exist. The response susceptibility of a brain structure depends mostly on its own intrinsic rhythmic activity (Narici, Pizzella, Romani, Tomoli, Traversa, & Rossini, 1990; BaSar, BaSar-Eroglu, Demiralp, & Schurmann, 1992; BaSar, 1992). A brain system could react to external or internal stimuli producing those rhythms or fre- quency components, which have already been present in its intrinsic or spontaneous activity. i.e., if in a given frequency range the spontaneous brain rhythms are miss- ing, they will be absent in the induced rhythmicities and vice versa. The concept for response susceptibility is strongly connected with the rule of excitement states of neuronal populations as suggested by Bapr (1980, 1983, 1992). According to this rule, if a neuronal population is able to produce spontaneous activity in a given frequency range, then this structural group can be brought to a state of excitement in the same frequency range by sensory stimuli. For that reason, it might be expected that excitability is related to spontaneity. It seems that this is a common principle for biological systems.
It is useful to search for phenomena that could bring new evidence to the concept of response susceptibility. EEG in children might provide a useful natural model for this aim. It is known that children’s EEG usually shows different rhythms in com- parison to adult EEG (Petersen & Eeg-Olofsson, 197 1; Matthis, Scheffner, Bennin- ger, Lipinski, & Stolzis, 1980; Katada, Ozaki, Suzuki, & Suhara, 1981). Since, in children, some of the spontaneous rhythms are not yet developed, according to the concept of response susceptibility, the evoked rhythmicities recorded after sensory stimulation are expected to show no response or enhancement in the frequency ranges not yet developed. Our preliminary results on alpha response in 3-year-old children support this statement (BaSar-Eroglu & Bapr, 1990, Bapr , 1992).
The aim of the present study was to compare the frequency components evoked under identical sensory stimulation in children and adults applying the combined time and frequency domain approach (Bapr, 1980). For that reason auditory evoked po- tentials (AEPs), spontaneously recorded EEGs and their frequency and time domain
Int J
Neu
rosc
i Dow
nloa
ded
from
info
rmah
ealth
care
.com
by
Lul
ea U
nive
rsity
Of
Tec
hnol
ogy
on 0
8/08
/13
For
pers
onal
use
onl
y.

AEPs IN CHILDREN 24 1
characteristics were studied in 3-year-old children and compared with the corre- sponding data in adults aged 20-22 years.
METHODS
Subjects
The investigations were carried out on 12 normal children (mean age 37 mo, standard error 1.39 mo) and on 12 voluntary, healthy subjects (20-22 years of age). All subjects investigated did not have any neurological disorders.
Environment
The subjects sat in a soundproof and echo-free room which was dimly illuminated. The room was also shielded to attenuate the environmental electrical noise.
Special attention was paid to the environmental conditions in the experiments on children. In order to predispose them to be more cooperative, the experimental room was decorated with different gaily decorated balloons, and toys, hanging on the walls.
Data Recording Conditions
The EEG data were derived using Ag-AgC1 disc electrodes affixed with electrode paste and tape, placed on central, parietal and occipital sites (Cz, P3, P4, 01, 02) of the international 10-20 system against the reference of earlobes. In order to mark the eye movement artifacts the EOG was also registered with electrodes placed below and at the outer canthus of the left eye. During the experiment all electrode imped- ances were kept equal to or less than 5 KOhms. After the electrode placement a few minutes of rest time was given to the subjects to get them familiar with the envi- ronment.
EEG and evoked potentials (EPs) were recorded while the subject’s eyes were open. The children were seated on a parent’s lap. They were encouraged to remain in a relatively calm behavioral state and attend to the stimuli during the sequence presentation. Rest periods were provided if necessary.
All bioelectrical signals were amplified by means of a Schwarzer EEG apparatus with band limits between .1 and 70 Hz. An additional 50 Hz notch filter was also applied to remove the mains interference.
The data recording as well as stimulus presentation were controlled by a HP-1000F computer which was also used for off-line data analysis.
EEG and single sweep EP epochs were digitized with a sampling rate of 500 points/s (12 bit ADC) and stored on the computer’s hard disk.
Procedure
In each recording session the spontaneous EEG was first recorded for a few minutes. The number of the artifact-free 1 s epochs obtained and further analyzed was between 40 and 70.
The auditory EP experiments consisted of the presentation of 2000 Hz tone bursts with intensity of 80 dB SPL and 1000 ms duration ( . 5 ms rise-time). The stimuli were presented binaurally in a free sound field. The interstimulus intervals varied randomly between 2.5 and 5.5 s with a mean value of 4 s. A total of 120 single
Int J
Neu
rosc
i Dow
nloa
ded
from
info
rmah
ealth
care
.com
by
Lul
ea U
nive
rsity
Of
Tec
hnol
ogy
on 0
8/08
/13
For
pers
onal
use
onl
y.

142 C. BASAR-EROGLU et a1
stimuli were presented from which a minimum 60 artifact-free epochs (consisted of segments of 1 s activity preceding and 1 s of evoked activity following the stimulus) were selected and further analyzed.
Artifact sweeps were eliminated after on-line rejection procedure based on the rejection of trials with extremely high amplitudes as well as after off-line visual inspection of the paper recorded EEG tracings. Also, finally, all single sweeps were checked for artifacts by visual inspection of the EEG and EOG sweeps, presented on the control display.
Data Analysis
Spontaneous EEG. For a comparative presentation of the spontaneous EEGs, the instantaneous power spectra for 1 s epochs were calculated using the method of compressed spectral arrays (Bickford, 1977).
Auditory Evoked Potentials. We used methods of EP component analysis in both time and frequency domains, which included selective averaging, computation of the amplitude-frequency characteristics (AFCs), response adaptive digital filtering with- out phase shift, EEG-EP epochs evaluation (for details, see e.g. , BaSar, 1980; BaSar et al., 1992a. Batjar-Eroglu, BaSar, Demiralp, & Schiirmann, 1992). The short de- scription of the methods used is as follows:
Selective Averaging. The stored raw single sweep EEG-EP epochs were selected with specified criteria off-line: epochs showing slow (swinging-artifact) waves, sleep patterns, movement or ocular artifacts were eliminated.
Computation of Amplitude-Frequency Characteristics (AFCs). The selectively av- eraged EPs were transformed to the frequency domain with fast Fourier transform (BaSar, 1980). The AFC were computed according to the formula:
where G(jw) is the frequency characteristic of the system investigated, w = 29$, f is the frequency of the input signal, c ( t ) is the step response of the system, here- the sensory evoked potential.
Although this transform is valid only for linear systems, it can be applied to non- linear systems (which seems to be the brain systems) as a first approach (Batjar, 1980)-the errors due to system nonlinearities are smaller than the errors resulting from the duration of the measurements and the changes of the functional state of the brain systems investigated.
Digital Filtering. The EP frequency components were derived by the method of adaptive digital filtering which provides zero phase shift (BaSar & Ungan, 1973). The band limits of the digital filters were chosen according to the local maxima of the AFCs.
The whole methodology to evaluate EPs, AFCs and digitally filtered data as well as the limitations of the methods were previously described (e.g., Batjar, 1980, 1983; Bagar-Eroglu et al., 1992).
Int J
Neu
rosc
i Dow
nloa
ded
from
info
rmah
ealth
care
.com
by
Lul
ea U
nive
rsity
Of
Tec
hnol
ogy
on 0
8/08
/13
For
pers
onal
use
onl
y.

AEPs IN CHILDREN 243
Statistical Analysis. For the purposes of statistical analysis the following parame- ters in EEG and filtered AEPs were measured:
a) spontaneous EEG: For each subject the root mean square (rms) amplitudes of 40 successive artifact-free 500 ms EEG epochs were measured in four frequency ranges (.5-3.5 Hz, 4-7 Hz, 8-15 Hz, and 15-30 Hz). The percentage of the rms amplitude for each frequency range was calculated with respect to the sum of the rms amplitudes for all frequency ranges.
b) filtered AEPs: The individual averaged AEPs were filtered in three frequency ranges (.5-3.5 Hz, 4-7 Hz, and 8-15 Hz). The maximal peak-to-peak amplitudes in the time window 0-250 ms after stimulus presentation were measured.
The measured parameters in spontaneous EEG and filtered AEPs were subjected to 2-way analysis of variance. The factors were age (A: levels: children, adults), and electrode position (L: levels: Cz, P3, P4, 0 1 , 02). For all analyses of variance the degrees of freedom ( d f ) were corrected by using the Greenhouse-Geisser procedure for violations of the sphericity assumption with repeated measures designs (see, e.g., Vasey & Thayer, 1987). In the present paper, the original dfare reported, but all probability values result from the application of the correction procedure.
Additionally, the corresponding parameters for different electrode positions and frequency ranges between children and adults were compared post-hoc (if necessary) by using the standard r-test statistics. The results from post-hoc analyses were vi- sualized graphically, presenting the mean values (+ 1 standard error) and reached probabilities for different frequency ranges (Fig. 6).
RESULTS
Differences Between the Spontaneous EEG in Children and Adults
Figure 1 presents a dynamic picture of the instantaneous power spectra recorded from spontaneous EEG from the leads Cz and 0 1 in one representative adult (a) and in one representative child (b). The spontaneous EEGs recorded from different sites in the 3-year-olds were characterized by slow waves (.5-4 Hz) with nonstable fre- quency maxima and magnitudes. Lower amplitude waves in the range of 7.5-9 Hz usually accompanied the slow waves. Less prominent peaks in 7-9 Hz range and increased slow waves (.5-4 Hz) in children’s EEG at the occipital lead (observed in Fig. 1 b) is known in the literature as posterior slowing (Petersen & Eeg-Olofsson, 197 1 ; Niedermeyer, 1987).
In contrast to children’s EEG, stable alpha rhythm in the range 8-10 Hz was clearly seen in adult’s EEG (Fig. 1 a).
Time Domain Averaged Auditory Evoked Potentials (AEPs) in Children and Adults
The children’s AEPs are waveformed similarly to the adult AEPs, but their time domain peaks are delayed in comparison to those in adults. Figure 2 shows the grand mean averaged AEPs for the five leads investigated (thin line-adult’s AEPs, thick line-children’s AEPs) for analysis epoch from 300 ms before to 700 ms after stim- ulus presentation. In the children’s AEPs after an initial positive peak (about 80- 100 ms poststimulus) a slow negative deflection was observed at about 200 ms fol- lowed by a positive deflection at Cz (at about 300 ms) or a slow wave at the electrode sites P3, P4, 0 1 and 02 . It is clearly demonstrated that children’s negative peak at
Int J
Neu
rosc
i Dow
nloa
ded
from
info
rmah
ealth
care
.com
by
Lul
ea U
nive
rsity
Of
Tec
hnol
ogy
on 0
8/08
/13
For
pers
onal
use
onl
y.

244 C. BASAR-EROGLU et a1
f
.” ‘ 5 23 2i ei 5 10 15 20 25 mi
B cz , 01 P
,.-
5 5 10 15 20 25 h i !O ‘ 5 20 25 di
FIGURE 1 Instantaneous power spectra of EEG epochs recorded in one respresentative adult (a) and in one representative 3 years old child (b), derivations-Cz (left column) and 01 (right column). Each curve presents record of 1 s duration. Note the differences in the spectral characteristics in adults and children, as well as the different dynamics during the experiment.
200 ms develops in adult’s P2 latency range. The AEPs recorded in children at occipital leads (01 and 0 2 ) are with similar magnitudes and opposite phases in com- parison to the adult’s AEPs.
Adaptive Filtering of the Auditoq EPs
The results on filtered AEPs are presented in Figs. 3, 4, 5 , divided in three groups as follows:
(a) Superimposed grand averaged AEPs (thin line-adults, thick line-children), filtered in the frequency ranges of .5-3.5 Hz (Fig. 3), 4-7 Hz (Fig. 4), and 8-15 Hz (Fig. 5),
(b) Superimposed individual averaged AEPs from all children investigated, fil- tered in the same frequency range as in a) .5-3.5 Hz (Fig. 3), 4-7 Hz (Fig. 4), and 8-15 Hz (Fig. 5 ) .
(c) Superimposed individual averaged AEPs from all adults investigated, filtered in the same frequency range as in a) .5-3.5 Hz (Fig. 3), 4-7 Hz (Fig. 4), and 8-15 Hz (Fig. 5 ) .
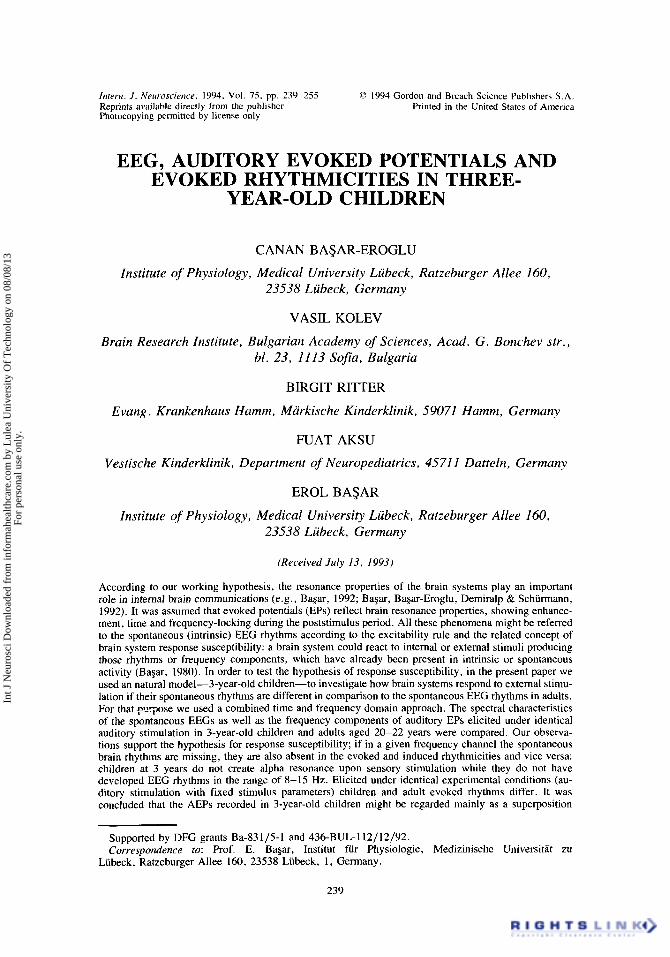
Delta Frequency Components (S-3.5 Hz) . Adult delta responses were markedly reproducible at all leads, showing negative-positive-negative deflection in the post- stimulus period with maximal positive phase at around 200 ms (Fig. 3a, c). As shown in Fig. 3(a), (b), the children’s delta responses were delayed and at the posterior electrode sites contain usually a single wave with negative phase peaking at 200- 300 ms which is opposite in phase to the adult’s delta response. Some of the chil-
Int J
Neu
rosc
i Dow
nloa
ded
from
info
rmah
ealth
care
.com
by
Lul
ea U
nive
rsity
Of
Tec
hnol
ogy
on 0
8/08
/13
For
pers
onal
use
onl
y.

AEPs IN CHILDREN 245
/ Children - \
FIGURE 2 Grand mean averaged auditory EPs in adults (thin line) and 3 years old children (thick line) for different electrode sites as designated. Each group consists of 12 subjects. Stimulus onset-at 0 ms.
dren's AEPs at Cz lead showed considerable delayed delta responses in the range of 400-600 ms (Fig. 3b).
The individual delta responses in children were characterized by large variability in the poststimulus period. About 50% from the children investigated did not show time-locked delta responses for the occipital leads.
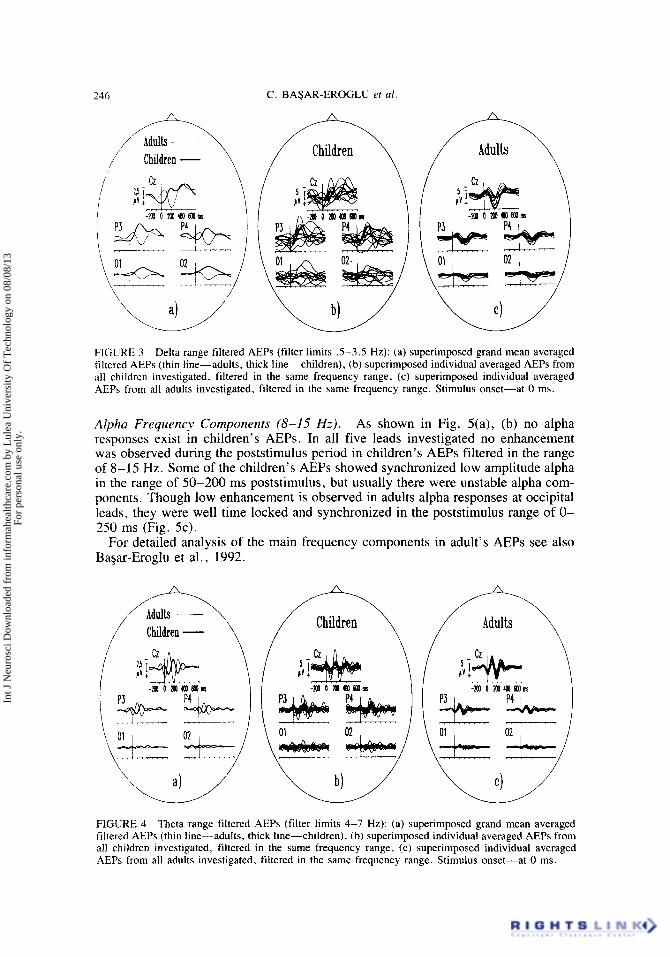
Theta Frequency Components (4-7 H z ) . The main theta response component both in children and adult AEPs was observed at Cz (Fig. 4). Theta responses in both groups (children and adults) decreased from central to posterior leads. The wave- shape of children's theta response was similar to those in adults, but with opposite phases to the corresponding peaks at the sites Cz, P3 and P4. In adults, theta response in Cz, P3 and P4 consisted of a maximal negative-positive deflection in the time range of 100-200 ms, whereas in children it was a maximal positive-negative de- flection in the same time range (100-200 ms poststimulus). The children's theta response was observed to be most reproducible at Cz in comparison to the other leads investigated.
Int J
Neu
rosc
i Dow
nloa
ded
from
info
rmah
ealth
care
.com
by
Lul
ea U
nive
rsity
Of
Tec
hnol
ogy
on 0
8/08
/13
For
pers
onal
use
onl
y.
246 C. BASAR-EROGLU ef al
,/- f i Children A Adults
FIGURE 3 Delta range filtered AEPs (filter limits .5-3.5 Hz): (a) superimposed grand mean averaged filtered AEPs (thin line-adults, thick line-children), (b) superimposed individual averaged AEPs from all children investigated, filtered in the same frequency range, (c) superimposed individual averaged AEPs from all adults investigated, filtered in the same frequency range. Stimulus onset-at 0 ms.
Alpha Frequency Components (8-15 Hz). As shown in Fig. 5(a), (b) no alpha responses exist in children’s AEPs. In all five leads investigated no enhancement was observed during the poststimulus period in children’s AEPs filtered in the range of 8-15 Hz. Some of the children’s AEPs showed synchronized low amplitude alpha in the range of 50-200 ms poststimulus, but usually there were unstable alpha com- ponents. Though low enhancement is observed in adults alpha responses at occipital leads, they were well time locked and synchronized in the poststimulus range of 0- 250 ms (Fig. 5c).
For detailed analysis of the main frequency components in adult’s AEPs see also BaSar-Eroglu et al., 1992.
FIGURE 4 Theta range filtered AEPs (filter limits 4-7 Hz): (a) superimposed grand mean averaged filtered AEPs (thin line-adults, thick line-children), (b) superimposed individual averaged AEPs from all children investigated, filtered in the same frequency range, (c) superimposed individual averaged AEPs from all adults investigated, filtered in the same frequency range. Stimulus onset-at 0 ms.
Int J
Neu
rosc
i Dow
nloa
ded
from
info
rmah
ealth
care
.com
by
Lul
ea U
nive
rsity
Of
Tec
hnol
ogy
on 0
8/08
/13
For
pers
onal
use
onl
y.

AEPs IN CHILDREN 247
FIGURE 5 Alpha range filtered AEPs (filter limits 8-15 Hz): (a) superimposed grand mean averaged filtered AEPs (thin line-adults, thick line-children), (b) superimposed individual averaged AEPs from all children investigated, filtered in the same frequency range, (c) superimposed individual averaged AEPs from all adults investigated, filtered in the same frequency range. Stimulus onset-at 0 ms.
Statistical Analysis
Spontaneous EEG. In order to perform statistical testing of the differences between children’s and adult’s EEG rhythms the measurements were made according to the following steps:
a) for each subject the root mean square (rms) amplitudes of 40 successive arti- fact-free EEG epochs, lasting 500 ms each, were measured in different frequency bands (delta: .5-3.5 Hz, theta: 4-7 Hz, alpha: 8-15 Hz and beta: 15-30 Hz);
b) the measurements in each frequency range were normalized, calculating the percentage of the corresponding rms amplitude to the sum of the rms ampli- tudes for all frequency bands, and then subjected to 2-way analysis of variance (Age X Lead). Table 1 (A) presents the results from 2-way analysis of variance for three dif- ferent frequency ranges. For all frequency ranges a significant main effect for age was observed [F(1,18) > 6.5, p < .05]. The factor lead was significant only for delta and theta ranges [F(4,72) > 3.6, p < .05]. The interaction for the rrns EEG amplitude between age and leads was not significant [F(4,72) < 1 . 6 8 , ~ > .18]. Figure 6(a) presents the mean values (+ 1 standard error) and reached proba- bilities, calculated for the corresponding rms amplitude comparisons between children and adults data in three frequency ranges-delta, theta and alpha, and all leads investigated (children’s EEG-empty bars, adult’s EEG-shaded bars). For all leads investigated the post-hoc t-test showed significant differences be- tween children’s and adult’s EEG rhythms in delta and alpha range-delta rhythms in the children were significantly greater ( p < .001) than these in adults and alpha rhythms in the children were significantly smaller (p < .OOl) than these in adults. No significant differences between children and adults were seen also for the measurements in theta range at Cz, whereas for the other leads, except 01, significantly greater ( p < .05) children’s theta amplitude was observed.
Int J
Neu
rosc
i Dow
nloa
ded
from
info
rmah
ealth
care
.com
by
Lul
ea U
nive
rsity
Of
Tec
hnol
ogy
on 0
8/08
/13
For
pers
onal
use
onl
y.

248 C. BASAR-EROGLU et a / .
0 children f i adultsA
FIGURE 6 Mean group values (+ 1 standard error) measured at different electrode sites in different frequency ranges (empty bars-children, shaded bars-adults): (a) root mean square amplitudes in the spontaneous EEG (measured in o/c from the sum of the amplitudes in all frequency ranges), (b) maximal peak to peak amplitudes ( p V ) in the range of 0-250 ms post-stimulus. Significance of the differences: ( * ) p < = .05. (**) p < = .01, and (***) p < = ,001.
Filtered AEPs. The differences between adult’s and children’s frequency compo- nents derived from the AEPs using the adaptive digital filtering method were also studied. For that purpose the following steps were performed:
a) the individual subjects’ responses were filtered in the corresponding frequency
b) the maximum peak to peak amplitudes in the time window 0 to 250 ms post-
The results from 2-way analysis of variance for different frequency ranges are presented in Table 1 (B). Figure 6(b) shows the group mean amplitude values (+1 standard error) as well as reached probabilities for different electrode sites in delta, theta and alpha ranges (empty bars-children, shaded bars-adults).
A significant main effect for age was observed for delta and alpha frequency ranges [F(1,20) > 22.1, p < ,0011. For delta range children had significantly higher am- plitudes than adults, whereas for the alpha range adults had significantly higher am- plitudes than children. Due to the higher amplitudes of the measurements in both groups observed in Cz, the factor lead was significant for all three ranges [F(4,80) > 9.58, p < .OOl]. The interaction for the maximal amplitude measurements be- tween age and leads was also significant for all frequency ranges [F(4,80) > 3.72,
The results of t-test performed post-hoc, showed that the children’s delta response amplitude was significantly greater ( p < .001) then adult’s delta response amplitude in all electrode recordings except Cz (significant A X L interaction for delta range),
bands (.5-3.5 Hz, 4-7 Hz, 8-15 Hz);
stimulus were measured.
p < .02].
Int J
Neu
rosc
i Dow
nloa
ded
from
info
rmah
ealth
care
.com
by
Lul
ea U
nive
rsity
Of
Tec
hnol
ogy
on 0
8/08
/13
For
pers
onal
use
onl
y.

AEPs IN CHILDREN 249
TABLE 1 Results from 2-way Analysis of Variance (age X lead) for (A) RMS Amplitudes of the Spontaneous
EEG, and (B) Maximal Amplitudes in the Poststimulus Period (0-250 ms) of the AEPs, for Different Frequency Ranges
Delta range Theta range Alpha range (.5-3.5 Hz) (4-7 Hz) (8-15 Hz)
P F P F P Factor (df) F ~~
(A) Age ( 1 , W 58.3 .oo 6.50 .02 61.1 .oo Lead (4,72) 3.60 .02 11.9 .oo 2.34 .09 L X A (4,72) .91 .43 .30 .70 1.68 .18 (B) Age (1,20) 22.1 .oo .01 .91 59.1 . 00 Lead (4,80) 9.58 .oo 41.6 .oo 34.9 .oo L X A (4,80) 3.72 .02 11.9 .oo 38.5 .oo
whereas children’s alpha response amplitude was significantly smaller then adult’s alpha response amplitude ( p < .001 at Cz, P3 and P4, p < .05 at 01, and p < .01 at 02)-significant A X L interaction for alpha range.
The auditory theta response amplitude in adults was significantly greater ( p < .01) than children’s theta response amplitude only at Cz. The other electrode com- parisons showed no significant difference at the parietal leads (P3 and P4) and sig- nificantly greater ( p < .05) children’s theta components at the occipital leads (01 and 02). This could explain the significant A X L interaction for theta range mea- surements.
As seen in Fig. 6(b) the children’s filtered AEPs tend to show a systematic de- crease in the amplitude of the responses in delta, theta and alpha ranges for all leads investigated, whereas in adults theta response was more pronounced at Cz, but at P3, P4, 0 1 and 0 2 the three (theta, delta and alpha) responses did not differ sig- nificantly.
Contribution of Different Frequency Components to Children’s AEPs
The frequency components analysis derived from the filtered AEPs in different fre- quency ranges showed that delta (.5-3.5 Hz) and theta (4-7 Hz) components mainly contributed to the children’s AEPs. Our analysis show further that no alpha (8-15 Hz) components exist. Both delta and theta responses in children were delayed in comparison to those in adults (Figs. 3 and 4):
a) the first major theta oscillation (positive wave), as well as descending part of the delta deflection contributed to the children’s positive component at around 80-100 ms poststimulus,
b) the negative children’s component at about 200 ms was shaped mainly by con- tributions of the theta and delta synchronized responses in this time range,
c) the positive deflection observed in children’s AEPs at about 300 ms was due to the contribution of the third theta phase and not well expressed delta de- flections at the central and parietal leads.
Int J
Neu
rosc
i Dow
nloa
ded
from
info
rmah
ealth
care
.com
by
Lul
ea U
nive
rsity
Of
Tec
hnol
ogy
on 0
8/08
/13
For
pers
onal
use
onl
y.

350
PV 25 I---------'
C. BASAR-EROGLU et al.
pass-band 8-15 Hz
12 - ' I
!
child
I I P
I I
adult
25 I PV +
12 7 P V +
-250 0 250 500 rns -250 0 250 500 rns
4 b)
2.5 - 2.5 - r v T 4 PV i I I I I
-500 0 500 1000 ms -500 0 500 1000 rns
FIGURE 7 Single sweeps (EEG-EP epochs) recorded at Cz, pass-band filtered in the range of 8-15 Hz for (a) one representative child, and (b) one representative adult. The lowermost row shows the corresponding averaged AEPs calculated from the presented single sweeps. (c) Grand mean averaged AEPs (N = 12) in children (left) and adults (right) at Cz, filtered in the same frequency range (8-15 Hz) . Stimulus onset-at 0 ms.
Single Sweeps Analysis of Children's and Adult's AEPs in Different Frequency Ranges
In order to investigate enhancement as well as time-locking phenomena in the post- stimulus period we performed digital filtering of the single sweeps (EEG-EP epochs), recorded in the time range of 500 ms before to 500 ms after stimulus presentation. Figure 7 shows single sweeps from one representative child (a) and one represen- tative adult (b), recorded during the AEP experiment. Both recordings are pass-band filtered in the frequency range of 8-15 Hz.
The children's EEG-EP epochs did not show alpha components in the frequency range of 8-15 Hz, indicating that no significant evoked alpha rhythms contribute to the AEP recordings. Quite differently, the adults EEG-EP epochs, filtered in the alpha range, were well time-locked and synchronized during the first 250 ms after stimulus presentation. This observation indicate the significant contribution of the alpha components to the poststimulus EEG changes in adults.
Int J
Neu
rosc
i Dow
nloa
ded
from
info
rmah
ealth
care
.com
by
Lul
ea U
nive
rsity
Of
Tec
hnol
ogy
on 0
8/08
/13
For
pers
onal
use
onl
y.

AEPs IN CHILDREN 25 1
DISCUSSION
Response Susceptibility Is Related to Spontaneous Activity: Children’s EEG/AEP Versus Adult EEG/AEP
As outlined in the introduction, the hypothesis which we tested in the present paper concerns a response susceptibility of the brain systems. It was supposed that the internal brain communications are based on resonance principle which is common for the brain systems (Bapr, 1980, 1992). The resonance properties of the brain systems might be related to their intrinsic (or spontaneous) rhythms according to “the excitability rule” as suggested by Bapr (1980): a brain system could react to external or internal stimuli producing those rhythms or frequency components, which are already present in its intrinsic (or spontaneous) activity.
Brain response susceptibility in several frequency channels was demonstrated in experiments on cats (BaSar, 1980, 1983). In the present paper we used a natural model, e.g., 3-year-old children, to investigate further how brain systems respond to external stimulation if their intrinsic (spontaneous) rhythms are different (or not yet developed) in comparison to the EEG rhythms in adults. The reason we per- formed our experiments on children not older than 3-3.5 years was that children up to this age do not have developed 10 Hz (in the frequency range of 8-15 Hz) activity. During the third year of life a posterior basic rhythm between 7-8/s is most com- monly found which is within the slow frequency alpha range (Niedermeyer, 1987; Eeg-Olofsson, 1971; Petersen & Eeg-Olofsson, 1971). The findings of Petersen and Eeg-Olofsson (1971) based on investigations on a big population sample (743 normal children between 1 and 15 years old, uniformly distributed across age) show that alpha frequency increases linearly with age, reaching the mean value of 9 Hz at age of 7 years (see also Hughes, 1987). Therefore, children’s and adult’s spontaneous EEG activity was hypothesized to represent different types of intrinsic background rhythmic activity with respect to both alpha and slow frequency ranges. According to the concept of brain systems response susceptibility it was expected that
a) upon sensory stimulation the induced brain rhythmicities (poststimulus en- hancement, time and frequency-locking during the poststimulus period) as well as the corresponding evoked frequency EP components, differ between children and adults if their spontaneous EEG rhythms are different; and
b) the induced rhythms in children and adults reflect their spontaneous EEG fre- quency patterns, respectively.
Our findings showed:
1. The spontaneous EEG rhythms in 3-year-old children are characterized by slow waves (showing frequency peaks in the range of .5-4 Hz) with nonstable fre- quency maxima and magnitudes, and lower amplitude waves in the range of 7.5-9 Hz (Figs. 1, 6a). These findings are in accordance with the investiga- tions dealing with EEG development (e.g., Petersen & Eeg-Olofsson, 1971; Niedermeyer, 1987; Matthis et al., 1980, etc.). The adult’s spontaneous EEG rhythms differ with respect to those in children’s EEG (Figs. 1, 6a): their delta and theta background EEG rhythms are with significantly smaller amplitudes, but their alpha rhythms are prominent and stable.
2. Children’s averaged AEPs filtered in the range of 8-15 Hz do not show en- hancement in the poststimulus period between 0-250 ms (Fig. 5a, b), whereas adults averaged AEPs filtered in the same range show large poststimulus en- hancement (called ”alpha enhancement,” Bapr , 1980) (Fig. 5a, c). ‘
Int J
Neu
rosc
i Dow
nloa
ded
from
info
rmah
ealth
care
.com
by
Lul
ea U
nive
rsity
Of
Tec
hnol
ogy
on 0
8/08
/13
For
pers
onal
use
onl
y.
252 C. BASAR-EROGLU et al.
In adult’s single sweeps large enhancements of the EEG/EP epochs filtered in 8-15 Hz frequency range were observed also in the poststimulus period up to 250 ms after stimulus presentation (Fig. 7b). The children’s single sweeps fil- tered in the same frequency range (8-15 Hz) did not show enhancement during the poststimulus period (Fig. 7a).
3. Using the combined EEG-EP epoch analysis we can show that in adults, upon auditory stimulation, there exist perfect time-locking and very often enhance- ment of the single sweeps in the frequency range of 8-15 Hz and the time epoch 0-250 ms after stimulus presentation (Fig. 7b). The children’s EEG-EP epochs filtered in the same frequency range, do not show synchronization to the stimulus and expressed phase-locking in the poststimulus period (Fig. 7a).
4. Slower EEG rhythms (.5-7 Hz) with large amplitudes (around 50 pV) exist in 3 year olds and, accordingly, it is possible to see poststimulus enhancement only in the filtered AEPs in the ranges of .5-3.5 and 4-7 Hz (Figs. 3b and 4b). This fact might be connected to the presence of different excitement states in delta and theta frequency ranges (BaSar, BaSar-Eroglu, Rahn, & Schiirmann, 1991).
All these facts mean that the induced rhythmicities observed in both children and adults correspond to their spontaneous EEG rhythms. If spontaneous rhythms are not yet developed, they are missing in the induced (or evoked) brain responses-children at the age of 3 years do not create alpha resonance upon sensory stimulation while they do not have developed EEG rhythms in the range of 8-15 Hz.
The Auditory Theta and Delta Responses in 3-Year-Old Children-Their Specific EP Frequency Components
Several authors investigated the time components of the children’s auditory EPs, mainly using the method of time domain averaging (Klorman, Thomson, & Elling- son, 1978; Kurtzberg, Vaughan, Courchesne, Friedman, Harter, & Putnam, 1984; Kurtzberg, Stone, & Vaughan, 1986). It is pertinent to mention especially the com- parative investigation on developmental changes in the EP morphology performed by Courchesne (1990) using his own as well as literature data from different age groups. In a passive condition listening to speech stimuli the exogenous vertex po- tential in infants and children has been demonstrated. Though the group of 3-year- old children were not tested, it was shown that instead of an N100, as in adults, infants and children had a positivity of about 85-100 ms; instead of a P200, as in adults, children had a negativity of about 240 ms. Also, a positivity of about 360 ms was observed in children at all ages from 2 years to adulthood. Our investigations on the time course of AEPs in 3-year-olds camed out with passive listening paradigm to tone bursts (2000 Hz) lasting lo00 ms show similar results (Fig. 2). Furthermore, the combined time and frequency components analysis, which we performed on the same data, showed that theta and delta responses might contribute to the different latency peaks in the averaged original AEPs in children (Figs. 3, 4, 5).
Earlier studies demonstrated that sensory AEPs recorded in adults resulted from a combination or a superposition of various brain rhythmicities in various frequency ranges, mainly in delta, theta, alpha and gamma (40 Hz) ranges (BaSar, 1980; Bagar, Rosen, BaSar-Eroglu, & Greitschus, 1987; Bagar et al., 1991; BaSar et al., 1992a, 1992b). Accordingly, as our results show, the AEPs recorded in 3-year-old children might be regarded as a superposition of rhythmicities in delta and theta ranges, which
Int J
Neu
rosc
i Dow
nloa
ded
from
info
rmah
ealth
care
.com
by
Lul
ea U
nive
rsity
Of
Tec
hnol
ogy
on 0
8/08
/13
For
pers
onal
use
onl
y.

AEPs IN CHILDREN 253
are time-locked to the stimulus, but prolonged and delayed in comparison to the corresponding rhythms in adults.
The individual differences in the children’s delta and theta responses are possibly influenced by the different processes of cerebral maturation (Kellaway , 1957).
Elicited under identical experimental conditions (auditory stimulation with fixed stimulus parameters) children’s and adult’s induced rhythms differ. During the au- ditory stimuli experiments both children and adults accomplish processes of percep- tion and sensory processing. Also, these processes might be reflected in the different EP time and frequency components. Single sweep analysis revealed that the AEPs in 3-year-old children usually consist of two subsets of oscillatory waveforms or rhythmicities-mainly in theta and delta frequency ranges. It might be possible to suggest that the delayed (and/or prolonged in comparison to adult AEPs) delta and theta evoked responses are the specific children’s AEP frequency components.
Here, we want to emphasize the need for measurements and new standardization in children’s evoked potentials. This new standardization would be correlated with the EEG of the children. An interesting and important study would be to make mea- surements from l year till the age of 20 years and to perform an analysis of both time and frequency components of the EPs together with the spectral analysis of the spontaneously recorded EEG.
CONCLUDING REMARKS
The development of the brain takes place over the first 20 years of life. It is con- nected with the process of maturation of the cortex and the different brain systems. As Courchesne (1990) pointed out, there exist two versions of a hypothesis which supposes that the brain matures as a functional whole. According to the first version, the variety of brain systems develop in a roughly parallel fashion. The second version views brain development as neither hierarchical nor parallel, but rather as a pro- gressive change in the configuration of complex, interacting neural networks. Al- though too little neurobiological evidence on human exist to confirm either of these views of brain development, there are a number of studies showing facts and evi- dence that various brain structures and systems develop in a different manner during the first 20 years of the human life (Yakovlev & Lecours, 1967, Stuss & Benson, 1986; Rakic, Bourgeois, Eckenhoff, Zecevic, & Goldman-Rakic, 1986; Courchesne, 1990).
Are all these processes reflected in the delayed delta and theta components in the children’s AEPs? It is not possible to answer this question now, but it is clear that the EP components (in time and/or frequency domain) change in a complex way during the development.
Our investigations based on EEG and auditory EP recordings in adults and 3-year- old children demonstrate the relation between the spontaneous (intrinsic) EEG rhythms and the frequency components of AEPs-if in a given frequency channel the spon- taneous (or intrinsic) brain rhythms are missing, they are absent in the evoked (or induced) rhythmicities and vice versa. Thus, the excitability rule and the related concept for brain systems response susceptibility are supported using a natural model of children’s EEG and EPs.
Furthermore, the relation between spontaneous EEG rhythms and frequency com- ponents in children’s as well as in adult’s sensory evoked potentials, as our inves- tigations demonstrate, might serve as further evidence that the spontaneous EEG is
Int J
Neu
rosc
i Dow
nloa
ded
from
info
rmah
ealth
care
.com
by
Lul
ea U
nive
rsity
Of
Tec
hnol
ogy
on 0
8/08
/13
For
pers
onal
use
onl
y.

254 C. BASAR-EROGLU et al .
not simple noise with respect to the evoked brain potentials, and plays an active role to influence the evoked potential’s oscillatory response.
REFERENCES
Bagar, E. & Ozesmi, C. (1972). The hippocampal EEG-activity and systems-analytical interpretation of averaged evoked of the brain. Kybernerik, 12. 45-54.
BaSar, E. & Ungan, P. (1973). A component analysis and principles derived for the understanding of evoked potentials of the brain: Studies in the hippocampus. Kybernetik, 12. 133-140.
Bagar, E., Gonder, A , , Ozesmi. C. & Ungan, P. (1975). Dynamics of brain rhythmic and evoked potentials. I. Some computer methods for the analysis of electrical signals from the brain. Biolog- ical Cybernetics, 20, 137-145.
BaSar, E., Gonder, A. & Ungan. P. (1976). Important relation between EEG and brain evoked poten- tials. If. A system analysis of electrical signals from the human brain. Biological Cybernetics, 25 ,
Bagar, E. , Rosen, B., Bagar-Eroglu, C. & Greitschus, F. (1987). The association between 40 Hz-EEG and the middle latency response of the auditory evoked potential. International Journal of Neu- roscience. 33, 103-1 17.
BaSar, E. , Bagar-Eroglu, C. . Rahn, E. & Schiirmann, M. (1991). Sensory and cognitive components of brain resonance responses: An analysis of responsiveness in human and cat brain upon visual and auditory stimulation. Acra Otolaryngologica (Stockholm), Suppl. 491, 25-35.
Bagar. E.. Bapr-Eroglu, C.. Parnefjord. R., Rahn, E. & Schiirmann, M. (1992a). Evoked potentials: Ensembles of brain induced rhythmicities in the alpha. theta and gamma ranges. In E. Bagar & T. H. Bullock (Eds.). Induced rhythms in the brain (pp. 155-181) Boston: Birkhauser.
Bagar. E. , Bagar-Eroglu, C. , Demiralp. T. & Schiirmann, M. (1992b). Synergetics, resonance phenom- ena and brain internal codes. In R. Friedrich & A. Wunderlin (Eds.), Evolution of dynamical structures in complex sysfems. Springer Proceedings in Physics, 69 (pp. 266-27 I ) Berlin, Hei- delberg: Springer-Verlag.
Bagar, E. (1980). EEG brain dynamics. Relarion beht7een EEG arid brain ei$okedpotentials. Amsterdam: Elsevier.
BaSar, E. (1983). Synergetics of neuronal populations. A survey on experiments. In E. Bagar, H. Flohr, H. Haken & A. Mandell (Eds.). Synergetics of the brain (pp. 183-200) Berlin: Springer-Verlag.
Bapr, E. (1992). Brain natural frequencies are causal factors for resonances and induced rhythms. In E. Bapr & T. H. Bullock (Eds.). Induced rhythms in the brain (pp. 425-467) Boston: Birkhauser.
Bazar-Eroglu, C. & BaSar, E. (1990). A comparative analysis of evoked potentials in children and adults. Elecrroencephalogr. Clin. Neurophysiol. 75. 70P.
BaSar-Eroglu, C. , Bagar. E. , Demiralp, T. & Schiirmann, M. (1992). P300-response: possible psycho- physiological correlates in delta and theta frequency channels. A review. Intern. J . Psychophysiol., 13, 161-179.
Bickford, R. G. (1977). Computer analysis of background activity. In A. Remond (Ed.), EEG infor- matics: a didactic reiien. of methods and applications of EEG data processing (pp. 215-232) Amsterdam: Elsevier.
Bullock, T. H. (1992). Introduction to induced rhythms: A widespread, heterogeneous class of oscil- lations. In E. Bagar & T. H. Bullock (Eds.), Induced rhythms in the brain (pp. 1-26) Boston: Birkhauser.
Courchesne. E. ( 1990). Chronology of postnatal human brain development: Event-related potential, pos- itron emission tomography. myelinogenesis. and synaptogenesis studies. In J. W. Rohrbaugh, R. Parasuraman & J. Johnson, Jr. (Eds.) Everit-related potentials: Basic issues and applications (pp. 2 10-341). Oxford: Oxford University Press.
Davis, H. ( 1976). Principles of electric response audiometry. Annals Orology Rhynology Lavngology, Suppl. 28, 85.
Eeg-Olofsson. 0. (1971). The development of the EEG in normal children from age 1 to 15 years. The 14 and 6 Hz positive spike phenomenon. Neuropadiarrie. 3, 11-45.
Hughes. .I. R. (1987). Normal limits in the EEG. In A. M. Halliday, S. R. Butler & R. Paul (Eds.), A textbook of’ clinical neurophysiology (pp. 105- 154), Chichester, New York: John Wiley & Sons.
Katada, A,, Ozaki, H.. Suzuki. H. & Suhara. K. (1981). Developmental characteristics of normal and mentally retarded children’s EEGs. Electroencephalography and Clinical Neurophysiology. 52, 192- ‘01.
Kellaway, P. (1957). Ontogenetic evolution of the electrical activity of the brain in man and animals. Fourth Internat. Congress Electroenceph. Cliti. Neurophysiol. Acto Med. Belg.. 141- 154.
41-48.
Int J
Neu
rosc
i Dow
nloa
ded
from
info
rmah
ealth
care
.com
by
Lul
ea U
nive
rsity
Of
Tec
hnol
ogy
on 0
8/08
/13
For
pers
onal
use
onl
y.

AEPs IN CHILDREN 255
Klorman, R., Thomson, L. & Ellingson. R. (1978). Event related brain potentials across the life span. In E. Callaway, P. Tueting & S. Koslow (Eds.), Event-related brain potentials in man (pp. 511- 570), New York: Academic Press.
Kurtzberg, D., Vaughan, H., Jr., Courchesne, E., Friedman, D., Harter, M. R. & Putnam, L. (1984). Developmental aspects of event-related potentials. Annals of the New York Academy of Sciences,
Kurtzberg, D., Stone, C. L. & Vaughan, H. G., Jr. (1986). Cortical responses to speech sounds in the infant. In R. Cracco & I. Bodis-Wollner (Eds.), Frontiers of clinical neuroscience, vol. 3 , Evoked Potentials (pp. 513-520), New York: Alan R. Liss.
Matthis, P., Scheffner, D., Benninger, Chr., Lipinski, Chr. & Stolzis, L. (1980). Changes in the back- ground activity of the electroencephalogram according to age. Electroencephalography and Clinical Neurophysiology, 49, 626-635.
Narici, L., Pizella, V., Romani, G. L., Torrioli, G., Traversa, R. & Rossini, P. M. (1990). Evoked alpha and mu rhythm in humans: a neuromagnetic study. Brain Research, 520, 222-231.
Niedermeyer, E. (1987). Maturation of the EEG: Development of waking and sleep patterns. In E. Niedermeyer & F. Lopes da Silva (Eds.). Electroencephalography-basic principles, clinical ap- plications and relatedfields (pp. 133-157), Baltimore: Urban & Schwarzenberg.
Parvin, C., Torres, F. & Johnson, E. (1980). Synchronization of single evoked response components: Estimation and interrelation of reproducibility measures. In G. Pfurtscheller, P. Busser, F. Lopes da Silva & H. Petsche (Eds.), Rhythmic EEG activities and cortical functioning (pp. 203-217). Amsterdam: Elsevier.
Petersen, I. & Eeg-Olofsson, 0. (1971). The development of the electroencephalogram in normal chil- dren from the age of l through 15 years. Neuropiidiatrie, 3, 247-304.
Rakic, P., Bourgeois, J. P., Eckenhoff, M. F., Zecevic, N. & Goldman-Rakic, P. S. (1986). Concurrent overproduction of synapses in diverse regions of the primate cerebral cortex. Science, 232, 232- 235.
Sayers, B. McA., Beagley, H. A. & Henshall, W. R. (1974). The mechanism of auditory evoked EEG responses. Nature, 247, 481-483.
Stuss, D. T. & Benson, D. F. (1986). The frontal lobes. New York: Raven Press. Vasey, M. W. & Thayer, J. F. (1987). The continuing problem of false positives in repeated measures
ANOVA in psychophysiology: A multivariate solution. Psychophysiology, 24, 479-486. Yakovlev, P. I. & Lecours, A. R. (1967). The myelogenetic cycles of regional maturation of the brain.
In A. Minkowski (Ed.), Regional development of the brain in early life, (pp. 3-70), Philadelphia: F. A. Davis.
425, 300-3 18.
Int J
Neu
rosc
i Dow
nloa
ded
from
info
rmah
ealth
care
.com
by
Lul
ea U
nive
rsity
Of
Tec
hnol
ogy
on 0
8/08
/13
For
pers
onal
use
onl
y.