
Propranolol-induced inhibition of unconditioned stimulus ...
Upload
independentCategory
view
0download
0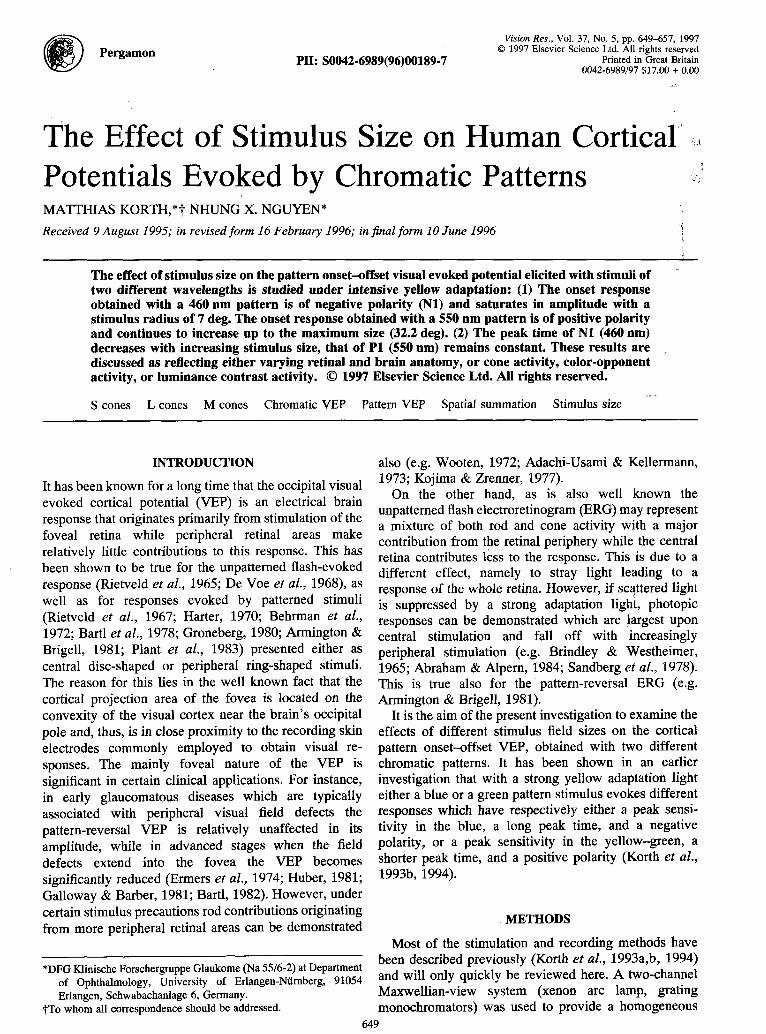
@Pergamon
PII:
VisionRes., Vol.37,No.5, pp.649-657,199701997 ElsevierScienceLtd.All rightsreserved
S0042-6989(96)00189-7 Printedin GreatBritain0042-6989/97$17.00+ 0.00
.,.-.
The Effect of Stimulus Size on Human Cortical tPotentials Evoked by Chromatic Patterns ‘*.MATTHIAS KORTH,*TNHUNG X. NGUYEN*
Received 9 August 1995; in revisedform 16 February 1996; in final form 10 June 1996 7
The effect of stimulus size on the pattern onset-offset visual evoked potential elicited with stimuli oftwo different wavelengths is studied under intensive yellow adaptation: (1) The onset responseobtained with a 460 nm pattern is of negative polarity (Nl) and saturates in amplitude with astimulus radius of 7 deg. The onset response obtained with a 550 nm pattern is of positive polarityand continues to increase up to the maximum size (32.2 deg). (2) The peak time of N1 (460 nm)decreases with increasing stimulus size, that of P1 (550 nm) remains constint. These results are .discussed as reflecting either varying retinal and brain anatomy, or cone activity, color-opponentactivity, or luminance contrast activity. 01997 Elsevier Science Ltd. All rights reserved.
S cones L cones M cones ChromaticVEP PatternVEP Spatialsummation Stimulussize,,
INTRODUCTION
It has been known for a long time that the occipitalvisualevoked cortical potential (VEP) is an electrical brainresponsethat originatesprimarily from stimulationof thefoveal retina while peripheral retinal areas makerelatively little contributions to this response. This hasbeen shown to be true for the unpatterned flash-evokedresponse (Rietveld et al., 1965; De Voe et al., 1968), aswell as for responses evoked by patterned stimuli(Rietveld et al., 1967; Harter, 1970; Behrman et al.,1972; Bartl et al., 1978; Groneberg, 1980;Armington &Brigell, 1981; Plant et al., 1983) presented either ascentral disc-shaped or peripheral ring-shaped stimuli.The reason for this lies in the well known fact that thecortical projection area of the fovea is located on theconvexity of the visual cortex near the brain’s occipitalpole and, thus, is in close proximity to the recordingskinelectrodes commonly employed to obtain visual re-sponses. The mainly foveal nature of the VEP issignificant in certain clinical applications.For instance,in early glaucomatous diseases which are typicallyassociated with peripheral visual field defects thepattern-reversal VEP is relatively unaffected in itsamplitude, while in advanced stages when the fielddefects extend into the fovea the VEP becomessignificantlyreduced (Errners et al., 1974; Huber, 1981;Galloway & Barber, 1981;Bartl, 1982).However, undercertain stimulusprecautionsrod contributionsoriginatingfrom more peripheral retinal areas can be demonstrated
*DFGKlinischeForschergruppeGlaukome(Na 55/6-2)at Departmentof Ophthalmology, University of Erlangen-Niimberg, 91054Erlangen, Schwabachardage6, Germany.
~Towhom all correspondenceshouldbe addressed.
also (e.g. Wooten, 1972; Adachi-Usami & Kellermann,1973;Kojima & Zrenner, 1977).
On the other hand, as is also well known theunpatternedflashelectroretinogram(ERG) may representa mixture of both rod and cone activity with a majorcontributionfrom the retinal periphery while the centralretina contributes less to the response. This is due to adifferent effect, namely to stray light leading to aresponse of the whole retiga. However, if scattered lightis suppressed by a strong adaptation light, photopicresponses can be demonstrated which are largest uponcentral stimulation and fall off with increasinglyperipheral stimulation (e.g. Brindley & Westheimer,1965;Abraham & Alpern, 1984; Sandberg et al., 1978).This is true also for the pattern-reversal ERG (e.g.Armington & Brigell, 1981).
It is the aim of the present investigationto examine theeffects of different stimulus field sizes on the corticalpattern onset-offset VEP, obtained with two differentchromatic patterns. It has been shown in an earlierinvestigation that with a strong yellow adaptation lighteither a blue or a green pattern stimulusevokes differentresponses which have respectively either a peak sensi-tivity in the blue, a long peak time, and a negativepolarity, or a peak sensitivity in the yellow–green, ashorter peak time, and a positive polarity (Korth et al.,1993b, 1994).
METHODS
Most of the stimulation and recording methods havebeen described previously (Korth et al., 1993a,b, 1994)and will only quickly be reviewed here. A two-channelMaxwellian-view system (xenon arc lamp, gratingmonochromators)was used to provide a homogeneous
650 M. KORTHand N. X. NGUYEN
A) k460nm, p=570nm
0sss(4 Offsst
i=wJ-’K~ - 1- /
Stimuhssradius~)
16.1
14.0
12.4
9.9
6.8
4.1
2.6
2.4
2.3
1.9
0.9
Stimuiusares (“~
807.62
613.9
482.6
307.3
147.7
52,5
“2L3
18.7
16.4
11.5
2.6
B) b550nm, p=570nm
On.sst. oifset ,,,......
0.0-
S.O-Jlv
l-f--t- ’--0 100 200 300ms
Stimsdusradius~)
16.1
14.0
12.4
9.9
‘6%
4.1
2.6
2.4
2.3
1.4
0.9
area f’)z
807.62
613.9
482.6
307.3
147.7
52.5
21.3
18.7
16.4
6.5”
2.6
I ! 1
0 100 200 300ms
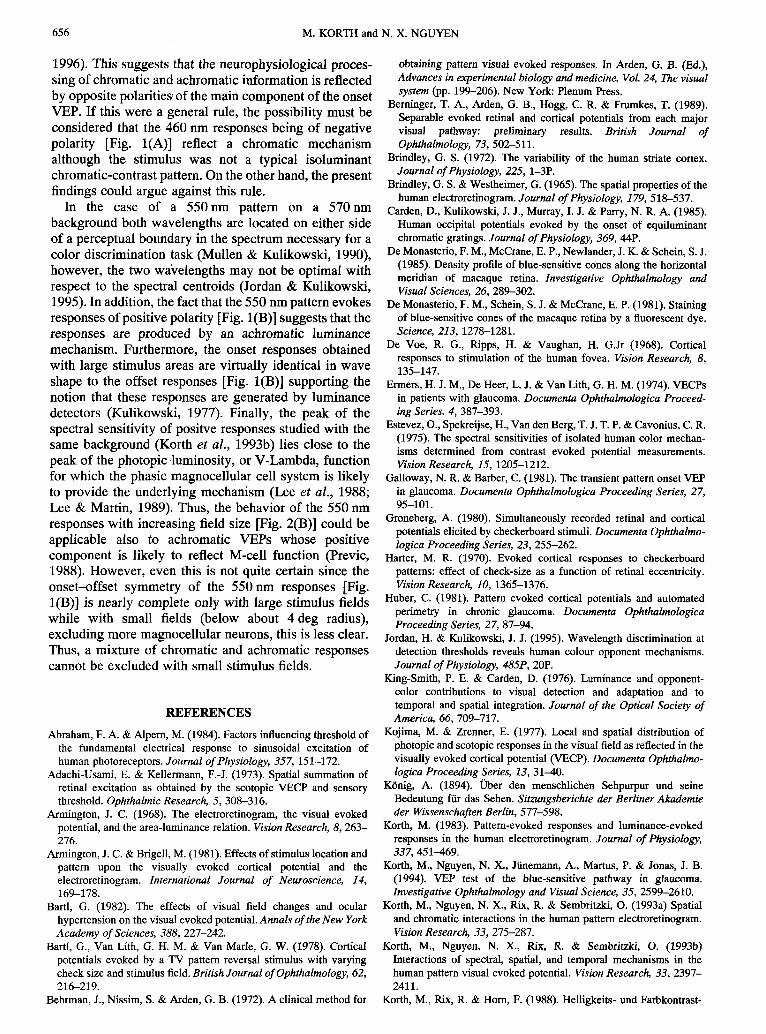
FIGURE 1. (A) Pattern onset-offset responses obtained with increasing mdii of the circular field sizes. The pattern was a460 nm, 0.88’c;deg square-wavestripe pa;tem presentedon an unpatt~me~570nmbackgrouridof high hnninanc;. Subject SP.(B) As in (A), except that a 550 nm pattern was used. Subject SP. The vertical lines in (A) and (B) indicate the moments ofpattern onset and offset, the arrows indicate the method of measurement of amplitude and peak latency of the N1 and PI
components.The records are averages of five recordings (A) and four recordings(B) with 100 sweeps each.
yellow (570 nm) background light (channel 1, 4.1 log -phot td) superimposed on a, patterned light (channel 2,2.52 log phot td) of equal size filled with either blue(460 nm) or green (550 nm) stripes. These were verticalsquare-wave stripe patterns which in most experimentshad a fundamental spatial frequency of 0.88 c/deg. Thefocus in each channelcouldbe adjustedindependentlybyremote-controlledmicromanipulators.Pattern onset-off-set stimulation (Spekreijse, 1966) was accomplishedbyusing the method of the vibrating scanner (Korth, 1983;Korth et al., 1993a).The durationof the onsetperiodwas200 msec, that of the offset period 500 msec. InExperiment 1 the diameter of both fields was adjustedto different sizes using an iris diaphragm placed behindthe final lens of the viewing system. Central fixationwasensured by cross hairs. The positionof the pattern withinthe viewing systemwas adjustedsuch that the cross hairswere always on an edge of the stripe pattern. Under thiscondition no change in luminance tested with a photo-
diode (SDC) was observedwith the onset or offset of thepattern. In Experiment 2, central blanked areas in theviewing field were employed in order to provide annularstimuliwith a varying inner diameterbut with a constantouter diameter of 32.2 deg. These stimuliwere producedby placing in the plane of the iris diaphragm thin planesheets of glass having round spots of opaque black paintof differentdiameterswith a tiny centralpin hole in orderto enable fixation. Thus, black round spots of differentsizeswere seen leavingblank the centralparts of both thebackground and the stimulusfield.
The VEP was recorded from the midline of the head2 cm above the inion referenced to the contralateral earlobe, while the ipsilateral ear lobe was grounded. Apositivityof the occipital electroderesulted in an upwarddeflectionof the records.After amplification(3 dB pointsat 0.5 and 30 Hz plus notch filter at 50 Hz) the EEG wasaveraged in a digitalcomputer (PC AT) equippedwith anAD-converter. The sampling rate was 500 Hz and 100

STIMULUSSIZE AND CHROMATICVEP 651
A) k = 460nm, p = 570nm-+-SP
-= 1s
* RR
-0-NN
~ MK
-1 Io 0.5 1.0 1.5 2.0 2.5 3.0
Log area (deg)2
I1 2 4 8 16
Radius (deg)
8
[
B) A= 550nm,w = 570nm
7 + SP
6 ++Is
+ RR
-Q-NN*
-o.MK
■
4 10 0.5 1.0 1.5 2.0 2.5 3.0
Log area (deg)z*
t“1 2 4 8 16
Radius (deg)
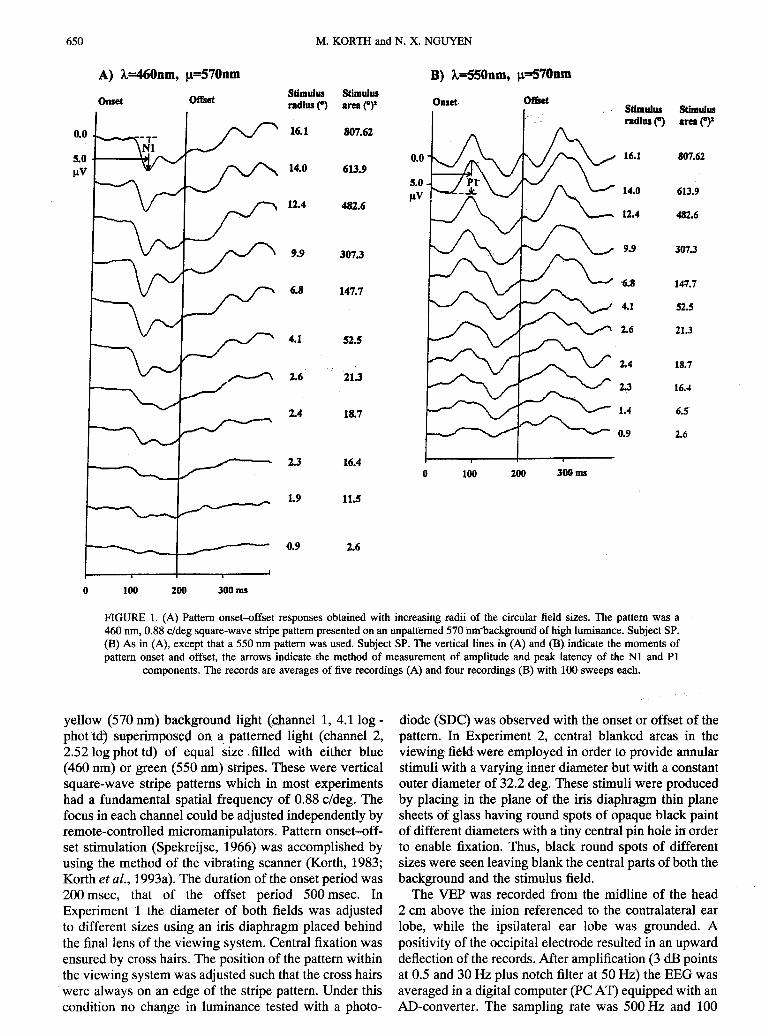
FIGURE 2. (A) Amplitudes of the onset response (Nl) of five subjects obtained with the 460 nm pattern presented on the570 nm backgroundas a functionof stimulusarea. (B) Amplitudesof the onset response(PI) obtainedwith the 550 nm patternas a function of stimulus size. Vertical bars in (A) and (B) indicate standard deviationscalculated from five measurements.
sweeps were averaged per trial. Each trial was repeatedthree to five times in order to check for reproducibilityorto enable a statisticalevaluation.Before recordingbeganthe subject adapted to the bright stimulusfield for 1 min.The amplitudes of the negative and positive responsecomponents obtained with the 460 nm and the 550 nmstimulus, respectively, were determined from the baseline preceding the response to the peak of the wave. Thepeak times of the responses were measured from thebeginning of pattern onset to the peak of the response.Five normal subjects with normal color vision (Nagel-anomaloscope,Panel D15 test, Farnsworth-Munsell100-hue test) were examined.
RESULTS
Experiment 1: Circular stimulusjield sizesFigure l(A) illustrates pattern onset VEPS obtained
with a 460 nm, 0.88 cldeg stripe pattern of increasing.stimulusfield area. As can be seen, the responseis mainlya negative-going,large waveform (Nl) of relatively longpeak.time. Based on its spectral sensitivitythis responsehas been shown previously to be initiated by the short-wave sensitive(S) cones (Korth et al., 1993b).Beginningwith the smallest stimulus field its amplitude increaseswith increasing field size but soon reaches a saturationlevel with no further increase. This behavior is repre-sentedgraphicallyfor the fivesubjectstested in Fig. 2(A).It indicates that an amplitude saturation is reached withstimulus field areas of about 148(deg)2 (about 7 degradius). The responsesof most subjectsconverge to verysimilar amplitudevalues with small field sizes except forsubject RR. The curve of this subject is shifted mainlyrightwards to larger field sizes, although the point ofamplitude saturation is the same as in the other subjects.Thus, this subject appears to be less sensitive to centralblue stimuli of small sizes. The fact that the responses
show no further increase with larger sizes may suggestthat peripheralstimulusareas make no contributionto theresponses.
In Fig. l(B) pattern onset VEPS are shown obtained
A) k = 460nm, l.J,= 570nm
190-
180- -
170- -
160--
150--
g140--
; 130--.-3e 120--
21101
100
90
801
L,\
B) k = 550nm, w= 570nm
70; Io 0.5 1.0 1.5 2.0 2.5 3.0
Log area (deg)2
II 2 4 8 16
Radius (deg)
FIGURE3. (A) Peak latencies of the N1 onset responseof five subjectsobtainedwith the 460 nm pattern presentedon the 570 nm backgroundas a function of stimulus area. Vertical error bars indicate staudarddeviation calculated from five measurements. (B) Peak times of the
onset response (PI) obtainedwith the 550 ~m pattern.
652 M. KORTH and N. X. NGUYEN
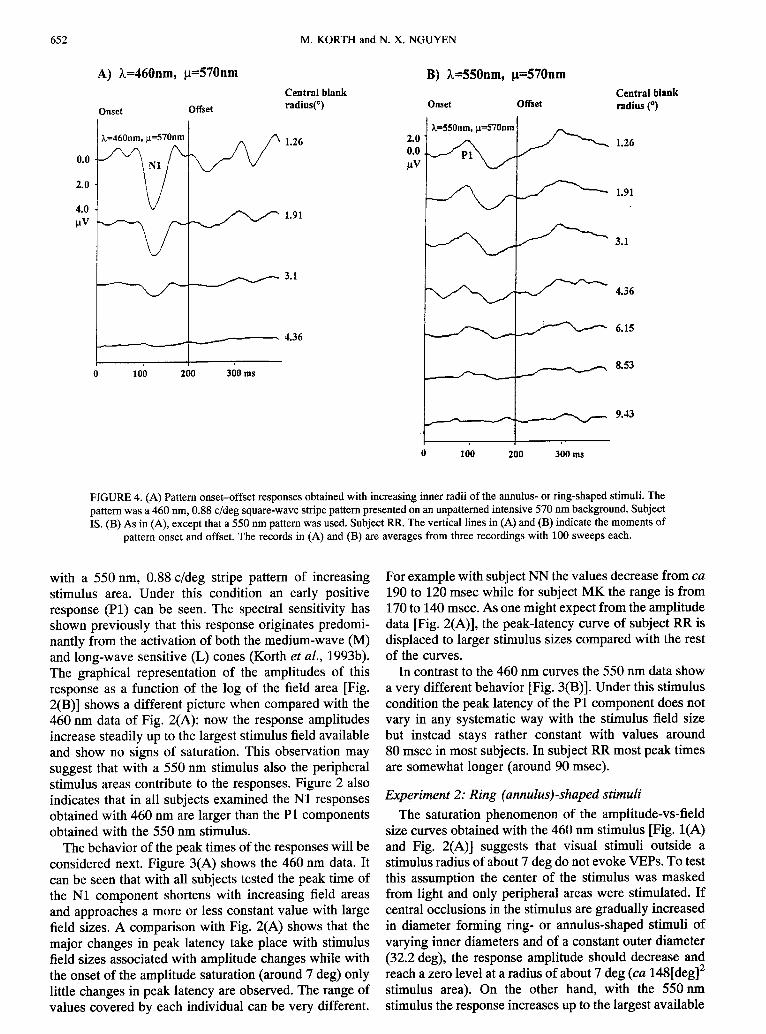
A) X=460nm, ~=570nmCentral blank
Onset Offset risdius(”)
k=460nm,v=570nm 1.26
0.0-
2.0-
4.0 .1.91pv
~ 3.1
.4.36/ ~
o 100 200 ‘300ms
B) 2.=550nm, #=570nm
Onset Offset
,uV ‘- v
l-+----
Central blankradius (0)
1.26
1.91
3.1
4.36
6.15
8.53
9.43
I 1
0 100 200 300ms
FIGURE4. (A) Pattern onset-offset responsesobtainedwith increasinginner radii of the annulus-or ring-shapedstimuli. Thepattern was a 460 nm, 0.88 c/deg square-wavestripe pattern presentedon an unpatternedintensive570 runbackground.SubjectIS. (B) As in (A), except that a 550 nm pattern was used. SubjectRR. The vertical lines in (A) and (B) indicate the momentsof
pattern onset and offset. The records in (A) and (B) are averages from three recordingswith 100 sweeps each.
with a 550 nm, 0.88 cldeg stripe pattern of increasingstimulus area. Under this condition an early positiveresponse (PI) can be seen. The spectral sensitivity hasshown previously that this response originatespredomi-nantly from the activationof both the medium-wave(M)and long-wave sensitive (L) cones (Korth et al., 1993b).The graphical representation of the amplitudes of thisresponse as a function of the log of the field area [Fig.2(B)] shows a different picture when compared with the460 nm data of Fig. 2(A): now the response amplitudesincrease steadily up to the largest stimulusfield availableand show no signs of saturation. This observation maysuggest that with a 550 nm stimulus also the peripheralstimulus areas contribute to the responses.Figure 2 alsoindicates that in all subjects examined the N1 responsesobtained with 460 nm are larger than the PI componentsobtained with the 550 nm stimulus.
The behaviorof the peak times of the responseswill beconsidered next. Figure 3(A) shows the 460 nm data. Itcan be seen that with all subjects tested the peak time ofthe N1 component shortens with increasing field areasand approaches a more or less constant value with largefield sizes. A comparison with Fig. 2(A) shows that themajor changes in peak latency take place with stimulusfieldsizes associatedwith amplitudechangeswhile withthe onset of the amplitudesaturation(around 7 deg) onlylittle changes in peak latency are observed.The range ofvalues covered by each individualcan be very different.
For examplewith subjectNN the values decreasefrom ca190 to 120 msec while for subject MK the range is from170to 140 msec.As onemightexpect from the amplitudedata [Fig. 2(A)], the peak-latency curve of subject RR isdisplaced to larger stimulussizes compared with the restof the curves.
In contrast to the 460 nm curves the 550 nm data showa very differentbehavior [Fig.3(B)]. Under this stimulusconditionthe peak latency of the P1 componentdoes notvary in any systematic way with the stimulus field sizebut instead stays rather constant with values around80 msec in most subjects. In subjectRR most peak timesare somewhat longer (around 90 msec).
Experiment 2: Ring (annulus)-shapedstimuli
The saturation phenomenon of the amplitude-vs-fieldsize curves obtainedwith the 460 nm stimulus [Fig. l(A)and Fig. 2(A)] suggests that visual stimuli outside astimulusradiusof about7 deg do not evokeVEPS.To testthis assumption the center of the stimulus was maskedfrom light and only peripheral areas were stimulated. Ifcentral occlusionsin the stimulusare gradually increasedin diameter forming ring- or annulus-shaped stimuli ofvarying inner diameters and of a constantouter diameter(32.2 deg), the response amplitude should decrease andreach a zero level at a radiusof about7 deg (ca 148[deg]2stimulus area). On the other hand, with the 550 nmstimulusthe responseincreasesup to the largest available

STIMULUSSIZE AND CHROMATICVEP 653
‘? A)A=460mn,k=Y7hn + SP
7
\
+ Is
6+ RR
~ 5/. -b NN
\\ a MK
0“ 2 4 6 8 10
8
I B) A= 550nm, p = 570nm 4 SP7
+ IS6
?
-JR
+ RR55 +0 0 -b NN
i ~\ A MK
-0.:
o 2 4 6 8 10
Central blank radius (deg)
FIGURE5. (A) Amplitudesof the onset response(Nl) of five subjectsobtainedwith the 460 nm pattern presented on the 570 nmbackgroundas a functionof the inner radius of the annular stimulus.Vertical errorbars indicate standard deviation calculated from five measurements.
(B) As in (A), except that a 550 nm pattern was used.
field size of 32.2 deg radius, suggestinga contributiontothe response also from the peripheral stimulus areas.Consequently,under this conditionthe responseobtainedwith ring-shapedstimuli shoulddecrease to zero at larger
0.7 T A) h = 460nm, p = 570nm
0.5
0.4
0.3
0.2
0.1
Lo 0.5 1.0 I .5 2,0 2.5 3.0
Log area (de,g)2
inner diameters of the annuli than with the 460 nmstimuli.
Figure4 showsVEPSobtainedwith an increasinginnerradius of the ring-shaped stimulus for both wavelengthstested. It is evident that with the 550 nm [Fig, 4(B)]stimulus, responses can be obtained with larger centralblanked areas than with the 460 nm stimulus [Fig. 4(A)].Thus, under the latter conditionthe VEP is more sensitiveto blocking the central part of the stimulus.The graph ofFig. 5 which plots response amplitudes as a function ofthe increasing radius of the central occlusion demon-strates the results obtained under the two stimulusconditions for all subjects tested. As can be seen, theamplitudes [Fig. 5(A)] decrease at a higher rate with the460 nm stimulusand approach the zero level at a smallercentral blanked-area size than with the 550 nm stimulus[Fig. 5(B)]. As was noticed in Fig. 2(A), the 460 nmresponse amplitudes of subject RR showed a noticeableincrease at considerablylarger field areas than the rest ofthe subjects.From this behavior one would expect in theexperiment with the ring-shaped stimuli less amplitudereduction at the smaller central occlusions.This predic-tion comes true in as much as this subject’s responsecurve in Fig. 5(A) appearsalso to be shiftedrightwardstolarger inner diameters of the annular stimuli leading tohigher amplitudescompared with the rest of the curves.
For the 550 nm stimulusno amplitudesaturationof thePI component could be observed [Fig. 2(B)] with thefield sizes employed. Thus, the response amplitudesshouldconvergeto zero at larger centralblanked areas ascan be observed in Fig. 5(B). But now this limitation isnot determinedby a saturationphenomenon,as might bethe case with the 460 nm stimulus,but by the maximumstimulus field size available.
One method for determining the local responsecontributionfrom different parts of the visual field is todividethe responseamplitudeby the stimulusarea that isused to obtain the response and to plot this ratio as afunction of increasing stimulus area or retinal eccen-tricity. In this way Bartl et al. (1978) who used a similarstimulus paradigm as in the present report, and
0.7 T B) h = 550nm,p = 570nm
0’ 0:5 1:0 1.5 2.0 2.5 3.0
Log area (deg)z
FIGURE 6. Relative responsivenessof the 460 nm (A) and of the 550 nm (B) VEP. The ratio amplitude/stimuhrsarea wasplotted as a function of the log of the stimulus area.

654 M. KORTHand N. X. NGUYEN
Armington and Brigell (1981) stimulating with con-centric rings of increasingeccentricity,obtainedan indexof responsivenessper retinal location.A similar analysiswas made with the data of the present investigationbydividing the response amplitude by the area of thestimulusfield used and plotting this ratio as a functionofthe log of the stimulus area. Figures 6(A) and (B) showthe results for the 460 nm and the 550 nm conditions,respectively. It can be seen that in general the respon-sivenessis largestwith central retinal stimulationin mostsubjectsand graduallyfalls off with larger stimulusfieldsfor both wavelengths.For the 460 nm conditionthe ratiosare in general higher than under the 550 nm conditionsince the N1 componentsare of larger amplitudethan theP1 responses (c~ Fig. 2). The curve of subject RRobtained with the 460 nm stimulus,however[Fig. 6(A)],shows very low ratios with a slight maximum occurringwith larger stimulusfields.This verifiesthe suggestionofFig. 2(A) that this subjecthas a low responsivenessunder460 nm stimulationwith small fields.
DISCUSSION
The present VEP study which was undertakento studyareal effects with chromatic patterns led to two interest-ing results: (1) The 460 nm responses are mainly ofnegative polarity and their amplitudessaturate at a smallstimulus radius of about 7 deg (148[deg]2) while the550 nm responses are mainly of positive polarity andincrease steadily up to the largest field available(16.1 de~ radius). (2) The peak times of the 460 nm
of about 3 deg. Armington (1968) found with a muchcoarserpattern-reversalstimulus(1 c/deg stripes)a linearrelationship between response amplitude and stimulussize up to the largest field diameter (12 deg). Behrman etal. (1972) found with small check sizes (9 min arc,pattern reversal)an amplitudesaturationwith small fields(between 1 and 2 deg) while with coarse patternssaturation occurred at larger field sizes or was notobserved at all (35 min arc). Similar observations weremade by Groneberg (1980) for pattern reversal and byPlant et al. (1983) for reversal and onset stimuli. Inaddition,Groneberg(1980) and Plant et al. (1983) foundthat the amplitude tuning of the VEP occurred with alarge stimulusfield at larger checks and with a small fieldat smaller checks, again a finding explained on the basisof different receptive field organizations. Interestingly,with pattern onset-offset stimulation Padmos et al.(1973) observed in the monkey no amplitude saturationwith a 24 min arc check size, while with an unpatternedstimulussaturationset in at 6 deg field diameter. Plant etal. (1983) found a linear relation between the spatialfrequency of a luminance-contraststripe pattern and thelog of the stimulusarea at which amplitudesaturationofthe P1- and N1-onset- and reversal responses occurred.According to them an amplitude saturation with a 0.88c/deg pattern shouldoccurbeyond a field size of 32.2 degdiameter as used here. However, in the present experi-ment two differentmechanismswere studiedwhich couldinteract with spatial tuning in different ways. It will bearguedbelowthat the P1 potentialin the 550 nm response
.. is probably a luminance-contrastor M-cell type compo-. .,responses shorten with increasing fields while those of ~
ne~t which shows a spatial low-pass behavio~(Korth etthe 550 nm responses remain constant.These results canbe interpreted as reflecting either varying retinal andbrain anatomy, or cone activity, color-opponentactivity,or luminance contrast activity. The peak time behaviorsuggests different physiological mechanisms of spatialsummationbetween two types of pathways.
The effect of the stimulus field size on the VEPamplitudehas been investigatedpreviouslywith colorlessstimuli, either unpatterned flashes (Rietveld et al., 1965,1967; De Voe et al., 1968; Kojima & Zrenner, 1976),patterned flashes (Rietveld et al., 1967;Harter, 1970)orpattern-reversal(Armington,1968;Behrman et al., 1972;Bartl et al., 1978; Groneberg, 1980; Rover et al., 1980;Armington & Brigell, 1981; Plant et al., 1983) andpattern onset-offset stimuli (Padmos et al., 1973; Plantet al., 1983). In studies employing patterned stimuli thespatial frequency seems to be crucial. Thus, Harter(1970) found that responses decreased with eccentricpattern flashes and that with foveal stimulation smallchecks (15–30 min arc) evoked the greatest amplitude,whereas in the periphery (up to 7.5 deg eccentricity)larger checks (up to 60 min arc) evoked the largestresponse. This was confirmedby Armington and Brigell(1981) with pattern reversal stimulation.This suggestedthat the receptive field organizationplayed an importantrole. Rietveld et al. (1967)working with flashedpatternsof 20 min arc checks found for a certain responsecomponent an amplitude saturation with a field size
al., 1988; Previc, 1988). For this response a low spatialfrequency seems to lead to increasing amplitudes withvery large fields, while a high spatial frequency mightlead to saturationwith smaller fields. On the other hand,the N1 component in the 460 nm response could be achromatic or P-cell type response (see below) whichgenerally shows a spatial band-passbehavior (Murray etal., 1987; Korth et al., 1988; Previc, 1!388).With thepresently used stimulation the S cone initiated VEP hasits spatial tuning at relatively low spatial frequencies(Korth et al., 1993b) and it is uncertain what theamplitude saturation would be with other spatialfrequencies.
The behavior of the VEP responsepeak time has beenstudied less intensively.Van Balen et al. (1966) and DeVoe et al. (1968) reported smaller and delayed responseswith peripheralflashes.Rietveldet al. (1965, 1967)foundthat certain response components varying in peak timewith the luminance of unpatterned and patterned flashesdo not do so with varying stimulusfield size, while othercomponentsdecrease in peak time with increasing lightflux, independent of whether this is due to stimulusluminance or size. De Voe et aL (1968) observed withunpatterned.flashes of small areas (up to 2 deg 40 minarc) faster responseswith increasingluminanceas well asstimulus size. Area-intensity data derived from lumi-nance curvesfor a constantcriterionpeak time resulted in
STIMULUSSIZE AND CHROMATICVEP 655
threshold curves which were very similar to psychophy-sical thresholds obtained under the same stimulusconditions. Kojima and Zrenner (1976) using the sameparadigm under scotopic conditions with stimulus fielddiametersup to 110 deg found spatial integrationto occurin both psychophysicaland VEP measurementsover thewhole range of stimulus sizes. Adachi-Usami andKellermann (1973) observed spatial summation in thescotopic VEP for a stimulus diameter of at least 18 deg.The peak-time data of Fig. 3 suggestthatwith the 550 nmstimulus no spatial integration occurs while with the460 nm stimulus, summation can be followed up to aradius of about 7 deg, the point where amplitudesaturationsets in [Fig.2(A)]. Whetherpeak-timechangesoccur in the 550 nm pattern-onset VEP for very smallstimulus sizes (<1 deg) as examined by De Voe et al.(1968) has not been tested in the present experiment.Thus, with respect to spatial integration the 460 nmresponse behaves similar to the rod response, while the550 nm response integrates probably over only a verysmall area and parallel processing might occur withlarger stimulus field sizes.
The discussion of the present data obtained withchromatic stimuli has different aspects pertaining to thequestion whether the responses reflect cone activity,chromaticcolor-opponentactivity,or luminance-contrastmechanisms. It has been shown before (Estevez et al.,1975)that the VEP which is recordedfrom a late stageofprocessingcan in fact reflect the activityof differentconetypes. If this were true also with the present data, thedifferencesin the response-amplitudefunctionsobservedwith the two wavelengths (Fig. 2) could be based on thedifferent anatomical distribution of S, L, and M conesacross the retina. It has been shown (Marc & Sperling,1977; De Monasterio et aZ., 1981, 1985) that in theprimate the densityof the L and M cones is highest in thefoveola and falls off towards the periphery. The densityof the S cones, on the otherhand, is highestat about 1 degeccentricity and drops sharply towards the foveola andfalls gradualIy towards the periphery. In addition, theproportion of the S cones is much lower (about 12–14%between eccentricitiesof 5 and 40 deg) than that of the Land M cones. If this appliedalso to the human, it might inpart explain the amplitude saturation of the N1component with increasing field sizes [Fig. l(A) andFig. 2(A)]: if the cone density falls below a certain valuethe response initiated by them could be too low to bedetected in the VEP. This seems to occur at aneccentricity of about 7 deg in the human where in theprimate the S cone densityis about2.25x 103/mm2(Marc& Sperling, 1977)to 9 x 10²/mm2(De Monasterioet al.,1981). The L plus M cone density, on the other hand,remains far above this level for eccentricities up to40 deg, thus explainingthe continuingincrease of the P1component.
The decrease in S cone density towards the foveola asobserved by Marc and Sperling (1977) and De Mon-asterio et al. (1981, 1985) could not be demonstratedinthe present study sinceresponsesoriginatingfrom retinal
areas below 1 deg radiusbecome too small to be reliablydetected in the VEP. In addition, the spatial frequencyused may not be optimal to demonstrate the “fovealtritanopia” (Konig, 1894; Wald, 1967; Williams et al.,1981) since one cycle of the stripe pattern used has awidth of 1.14 deg of visual angle. The use of a finerpattern might be more appropriatefor the examinationofsmall foveal areas.
However, when VEP amplitude is used to measurecone responses as a function of stimulus size, not onlyretinal anatomy and cortical representationbut also othersecondary factors become important like e.g. macularpigmentation and chromatic aberration. The effect ofmacular pigment absorption relative to 460 nm hasrecently be shown psychophysically using a blue-on-yellow stimulus paradigm to be 0.4 log units at thefoveola while it was negligible at 5.5 deg eccentricity(Wild & Hudson, 1995).This would mean that with the460 nm pattern as used here the response curves of Fig.2(A) might be attenuated especially with the small fieldsizes. As mentioned above and as expressed in severalfigures, the data obtained under the 460 nm conditionfrom subject RR deviate from the rest of the subjectsalthough this subject did not show any blue-color visionanomalies. In order to understand this deviation adifferent retinaI anatomy could be considered like alarger central area free of S cones (extendedtritanopia)ora high density of the macular pigment. In addition, sincethe VEP, although dependent on retinal receptors, isgenerated by cortical neurons the high inter-subjectvariabilityof the expressionof the central visual field onthe convexityof the cortex at the occipitalpole (Brindley,1972)must be considered.Thus, a source of error in thepresentexperimentsmightbe introducedbecausevariousresponsecomponentssummate and cancel dependingonindividual cortical representation and consequent topo-graphic potential distribution. Also, spatially extensivestimuli can produce additionalstimulusintrusionsdue tochromatic aberration (Robson & Kulikowski, 1995).
The possibility must be considered that the presentdata could reflect either chromatic or achromatic(luminance contrast) mechanisms in the brain. Previousreports have shown that not only yellow but also whitebackgrounds are able to disclose opponent-color con-tributions to visual detection. The balance between thechromatic mechanisms can be altered depending onwhether yellow or white is used for adaptation anddependingon the colortemperatureof the white (Nacer etal., 1995). Furthermore, with a white background achange from a chromatic to a luminancemechanism canbe observedwhen the size or the durationof the test flashis reduced (King-Smith& Carden, 1976).With respect tothe VEP it has been shown that a main component ofpattern-onset responses elicited with isoluminant chro-matic-contrastgratings is of negativepolarity while withluminance-modulated (achromatic) patterns it is ofpositive polarity (Carden et al., 1985; Murray et al.,1987;Korth et al., 1988;Berninger et al., 1989; Murray& Parry, 1989; Kulikowski et al., 1989; Regan & He,
656 M. KORTHand N. X. NGUYEN
1996). This suggests that the neurophysiologicalproces-sing of chromatic and achromaticinformationis reflectedby oppositepolaritiesof the main componentof the onsetVEP. If this were a general rule, the possibilitymust beconsidered that the 460 nm responses being of negativepolarity [Fig. l(A)] reflect a chromatic mechanismalthough the stimulus was not a typical isoluminantchromatic-contrastpattern. On the otherhand, the presentfindingscould argue against this rule.
In the case of a 550 nm pattern on a 570 nmbackground both wavelengths are located on either sideof a perceptual boundary in the spectrumnecessary for acolor discrimination task (Mullen & Kulikowski, 1990),however, the two wavelengths may not be optimal withrespect to the spectral centroids (Jordan & Kulikowski,1995).In addition,the fact that the 550 nm pattern evokesresponsesof positivepolarity [Fig. l(B)] suggeststhat theresponses are produced by an achromatic luminancemechanism. Furthermore, the onset responses obtainedwith large stimulus areas are virtually identical in waveshape to the offset responses [Fig. l(B)] supporting thenotion that these responses are generated by luminancedetectors (Kulikowski, 1977). Finally, the peak of thespectral sensitivity of positve responses studied with thesame background (Korth et al., 1993b) lies close to thepeak of the photopic luminosity,or V-Lambda, functionfor which the phasic magnocellularcell system is likelyto provide the underlying mechanism (Lee et al., 1988;Lee & Martin, 1989). Thus, the behavior of the 550 nmresponseswith increasing field size [Fig. 2(B)] could beapplicable also to achromatic VEPS whose positivecomponent is likely to reflect M-cell function (Previc,1988). However, even this is not quite certain since theonset-offset symmetry of the 550 nm responses [Fig.l(B)] is nearly complete only with large stimulus fieldswhile with small fields (below about 4 deg radius),excluding more magnocellularneurons, this is less clear.Thus, a mixture of chromatic and achromatic responsescannot be excluded with small stimulus fields.
REFERENCES
Abraham, F. A. & Alpern, M. (1984).Factors influencingthresholdofthe fundamental electrical response to sinusoidal excitation ofhuman photoreceptors..Iournal of Physiology, 357, 151–172.
Adachi-Usami, E. & Kellemrann, F.-J. (1973). Spatial summation ofretinal excitation as obtained by the scotopic VECP and sensorythreshold. Ophthalmic Research, 5, 308-316.
Armington, J. C. (1968). The electroretinogram, the visual evokedpotential, and the area-luminancerelation. Vision Research, 8, 263–276.
Armington,J. C. & Brigell, M. (1981).Effects of stimuluslocationandpattern upon the visually evoked cortical potential and theelectroretinogram. International Journal of Neuroscience, 14,169–178.
Bartl, G. (1982). The effects of visual field changes and ocularhypertensionon the visual evokedpotential.Annals of the New YorkAcademy of Sciences, 388,227-242.
Bartl, G., Van Lith, G. H. M. & Van Marie, G. W. (1978). Corticalpotentials evoked by a TV pattern reversal stimulus with varyingcheck size and stimulusfield.British Journal of Ophthalmology, 62,216-219.
Behrman,J., Nissim, S. & Arden, G. B. (1972).A clinical methodfor
obtaining pattern visual evoked responses. In Arden, G. B. (Ed.),Advances in experimental biolo~ and medicine, Vol. .24, The visualsystem (pp. 199–206).New York: Plenum Press.
Berninger, T. A., Arden, G. B., Hogg, C. R. & Fmmkes, T, (1989).Separable evoked retinal and cortical potentials from each majorvisual pathway: preliminary results. British Journal of
Ophthalmology, 73, 502–511.Brindley, G. S. (1972). The variability of the human striate cortex.
Journal of Physiology, 225, 1-3P.Brindley,G. S. & Westheimer,G. (1965).The spatial properties of the
human electroretinogram.Journal of Physiolo~, 179,518-537.Carden, D., Kulikowski,J. J., Murray, I. J. & Parry, N. R. A. (1985).
Human occipital potentials evoked by the onset of equiluminantchromatic gratings.Journal of Physiolo~, 369, 44P.
De Monasterio,F. M., McCrrme,E. P., Newlander,J. K. & Schein,S. J.(1985). Densityprofile of blue-sensitive cones along the horizontalmeridian of macaque retina. Investigative Ophthalmology andVisual Sciences, 26, 289-302.
De Monasterio,F. M., Schein,S. J. & McCrane,E. P. (1981).Stainingof blue-sensitive cones of the macaque retina by a fluorescent dye.Science, 213, 1278-1281.
De Voe, R. G., Ripps, H. & Vaughan, H. G.Jr (1968). Corticalresponses to stimulation of the human fovea. Vision Research, 8,135–147.
Ermers, H. J. M., De Heer, L. J. & Van Lith, G. H. M. (1974).VECPSin patients with glaucoma, Documenta Ophthalmologic Proceed-ing Series, 4, 387–393.
Estevez, O., Spekreijse,H., Van denBerg,T. J. T. P. & Cavonius,C. R.(1975). The spectral sensitivities of isolated human color mechan-isms determined from contrast evoked potential measurements.Vision Research, 15, 1205-1212.
Galloway,N. R. & Barber, C. (1981).The transient pattern onset VEPin glaucoma.Documenta Ophthalmologic Proceeding Series, 27,95–101.
Groneberg, A. (1980). Simultaneously recorded retinal and corticalpotentials elicited by checkerboardstimuli.Documenta Ophtha2mo-logica Proceeding Series, 23, 255–262.
Harter, M. R. (1970). Evoked cortical responses to checkerboardpatterns: effect of check-size as a function of retinal eccentricity.Vision Research, 10, 1365-1376.
Huber, C. (1981). Pattern evoked cortical potentials and automatedperimetry in chronic glaucoma. Documenta OphthalmologicProceeding Series, 27, 87-94.
Jordan, H. & Kulikowski,J. J. (1995). Wavelength discrimination atdetection thresholds reveals human colour opponent mechanisms.Journal of Physiology, 485P, 20P.
King-Smith, P. E. & Carden, D. (1976). Luminance and opponent-color contributions to visual detection and adaptation and totemporal and spatial integration.Journal of the Optical Socie~ ofAmerica, 66, 709-717.
Kojima, M. & Zrenner, E. (1977). Local and spatird distribution ofphotopicand scotopicresponsesin the visua~field as reflected in thevisually evoked cortical potential (VECP).Documenta Ophtha2mo-iogica Proceeding Series, 13,3140.
Konig, A. (1894). br den menschlichen Sehpurpur und seineBedeutungfiir das Sehen. Sitzungsberichte der Berliner Ahwdemieder Wissenschaj?en Berlin, 577–598.
Korth, M. (1983). Pattern-evoked responses and luminance-evokedresponses in the human electroretinogram.Journal of Physiology,337,451-469.
Korth, M., Nguyen, N. X., Jtinemann, A., Martus, P. & Jonas, J. B.(1994). VEP test of the blue-sensitive pathway in glaucoma.Investigative Ophthalmology and Visual Science, 35, 259%2610.
Korth, M., Nguyen, N. X., Rix, R. & Sembritzki, O. (1993a) Spatialand chromatic interactions in the human pattern electroretinogram.Vision Research, 33, 275-287.
Korth, M,, Nguyen, N. X., Rix, R. & Sembritzki, O. (1993b)Interactions of spectral, spatial, and temporal mechanisms in thehuman pattern visual evoked potential. Vision Research, 33, 2397–2411.
Korth, M., Rix, R. & Horn, F. (1988). Helligkeits- und Farbkontrast-
STIMULUSSIZE AND CHROMATICVEP 657
evozierte Muster-Elektroretinogramme und visuell evoziertePotential. Fortschritte Ophthalmologie, 85, 534-540.
Kulikowski, J. J. (1977). Separation of occipital potentials related tothe detection of pattern and movement. .In Desmed$,J. E. (Ed.)Visual evoked potentials in [email protected]). Oxford: ClarendonPress.
.,
Krdikowski, J. J., Murray, 1. J. & Parry, N. R. A. (1989).Electrophysiological correlates of chromatic-oppo!zenfan~.}c!rro-matic stimuli in man. Documenta Ophthalm’ologica ProceedingsSeries, 52, 145–153.
Lee, B. B. & Martin, P. R. (1989).Chromaticand luminancechannelsin the primate visual pythway.In Kulikowski,J. J., Dickinson,C. M.& Murray, 1. J. (Eds) Seeing contour and colour (pp. 21-35).Oxford: PergamonPress.
Lee, B. B., Martin,P. R. & Valberg,A. (1988).The physiologicalbasisof heterochromaticflicker photometrydemonstratedin the ganglioncells of the macaque retina. Journal of Physiology, 404, 323–347.
Marc, R. E. & Sperling, H. G. (1977). Chromatic organizationof theprimate cones. Science, 196,454456.
Mullen, K. T. & Kulikowski,J. J. (1990).Wavelength discriminationat detectionthreshold.Journal of the Optical Society ofAmerica, A7,733–742.
Murray, I. J. & Parry, N. R. A. (1989). Generating VEPSspecific toparvo and magno pathways in humans. In Kulikowski, J. J.,Dickinson, C. M. & Murray, I. J. (Eds) Seeing contour and colour(W. 471477). Oxford: PergamonPress.
Murray, I. J., Parry, N. R. A., Carden, D. & Kulikowski,J. J. (1987).Human visual evoked potentials to chromatic and achromaticgratings. Clinical Vision Sciences, 1, 231–244.
Nacer, A., Murray, I. J. & Kulikowski, J. J. (1995). Balancingsensitivityof humanchromaticopponentmechanismsby adaptation.Journal of Physiology, 485.P, 21P.
Padmos, P., Haaijman, J. J. & Spekreijse, H. (1973).Visually evokedcortical potentials to patterned stimuli in monkey and man.Electroencephalograph and Clinical Neurophysiology, 35, 153–163.
Plant, G. T., Zimmern, R. L. & Durden,K. (1983).Transient visuallyevoked potentials to the pattern reversal and onset of sinusoidalgratings. Electroencephalograph and Clinical Neurophysiology,56, 147–158.
Previc, F. H. (1988). The neurophysiologicalsignificance of the N1
and P1 componentsof the visual evoked potential. Clinical VisionSciences, 3, 195–202.
Regan, D. & He, P. (1996).Magnetic and electrical brain responses tochromatic contrast in human. Vision Research, 35, 1–18.
Rietveld,W. J., Tordoir,W. E. M. & Duyff,J. W. (1965).Contributionof fovea and parafovea to the visual evoked response. ActaPhysiologic Pharmacologic Neerlandica, 13, 330-339.
Rietveld,W. J., Tordoir,W. E. M., Hagenouw,J. R. B., Lubbers,J. A.& Spoor,Th. A. C. (1967).Visual evokedresponses to blank and tocheckerboardpatterned flashes.Acta Physiolocica PharmacologicNeerlandica, 14, 259–285.
Robson,A. G. & Kulikowski,J. J. (1995).Verificationof humanvisualevoked potentials (VEPS)elicited by gratings containing tritanopicpairs of hues.Journal of Physiology, 485P, 22P.
Rover, J., Schaubele, G. & Berndt, K. (1980). Macula and periphery:their contributionsto the visual evokedpotentials (VEP) in humans.Albrecht von Graefes Archiv fiir Klinische und ExperimentelleOphthalmologic, 214, 47–51.
Sandberg, M. A., Efron, M. H. & Berson, E. L. (1978). Focal coneelectroretinograms in dominant retinitis pigmentosa with reducedpenetrance. Investigative Ophthalmology and Visual Science, 17,1096-1101.
Spekreijse, H. (1966).Analysis of EEG responses in man evoked bysine wave modulated light. The Hague: Junk.
VanBaIen,Th. M., Van der Gon,J. J. D. & Hellendoorn,E. H. (1966).The differentiation between responses of foveal and extrafovealstimuli in the ERG and EEG. Vision Research, (Clinical electro-retinography,Suppl.) 255-262.
Wald, G. (1967). Blue-blindness in the normal fovea. Journal of theOptical Socie~ of America, 57, 1289–1303.
Wild, J. M. & Hudson,C. (1995). The attenuation of blue-on-yellowperimetry by the macular pigment. Ophthalmology, 102, 911–917.
Williams, D. R., MacLeod,D. I. A. & Mayhoe,M. M. (1981).Fovealtritanopia. Vision Research, 21, 1341–1356.
Wooten, B. R. (1972). Photopic and scotopic contributions to thehuman visually evoked cortical potential. Vision Research 12,1647–1660.
Acknowledgement-We thank J. J. Kulikowski for his valuablecommentson an earlier version of the manuscript.
Copyright © 2022 FDOKUMEN