3He MRI in mouse models of asthma
17
3 He MRI in Mouse Models of Asthma Bastiaan Driehuys 1 , Julia Walker 2 , Jim Pollaro 1 , Gary P. Cofer 1 , Nilesh Mistry 1,3 , David Schwartz 4 , and G. Allan Johnson 1 1 Center for In Vivo Microscopy, Duke University Medical Center, Durham, NC 2 Pulmonary Medicine, Duke University Medical Center, Durham, NC 3 Department of Biomedical Engineering, Duke University, Durham, NC 4 NIEHS, Research Triangle Park, NC Abstract In the study of asthma, a vital role is played by mouse models because knock-out or transgenic methods can be used to alter disease pathways and identify therapeutic targets that affect lung function. Assessment of lung function in rodents by available methods is insensitive because these techniques lack regional specificity. A more sensitive method for evaluating lung function in human asthma patients uses hyperpolarized (HP) 3 He MR imaging before and after broncho-constriction induced by methacholine (MCh). We now report the ability to perform such 3 He imaging of MCh response in mice, where voxels must be ~3000 times smaller than in humans and 3 He diffusion becomes an impediment to resolving the airways. We show three-dimensional (3D) images that reveal airway structure down to the 5 th branching and visualize ventilation at a resolution of 125×125×1000μm 3 . Images of ovalbumin-sensitized mice acquired after MCh show both airway closure and ventilation loss. To also observe the MCh response in naïve mice, we developed a non- slice-selective 2D protocol with 187×187μm 2 resolution that was fast enough to record the MCh response and recovery with 12 s temporal resolution. The extension of 3 He MRI to mouse models should make it a valuable translational tool in asthma research. Introduction In asthma research, efforts to understand the disease pathways and identify new therapeutic targets are increasingly reliant on mouse models. The value of the mouse is driven by several factors. First, the murine genome has been mapped in detail. Second, the mouse immune system is well characterized, providing a detailed understanding of how recurrent antigen presentation relates to inflammatory response. Third, mice can be genetically engineered to over-express or suppress targeted genes. These powerful capabilities to create and modify disease generate an equally strong demand for methods to evaluate the associated physiological phenotype. Common methods to assess lung function in small animals rely on inducing broncho- constriction with methacholine (MCh) and measuring the resultant changes in airway pressure or resistance (1,2). Unfortunately, such metrics, which provide only global lung function information, cannot answer many of the most critical questions. What is the degree of small versus large airway involvement? Is the disease focal or diffuse? Are the sites of airway hyper- responsiveness (AHR) reproducible? Are airways closing or merely narrowing? How well do mouse models reproduce human disease? These long-standing questions could be addressed by measuring regional ventilation and airway caliber changes through imaging. Correspondence: Bastiaan Driehuys, Ph.D. Center for In Vivo Microscopy Box 3302, Duke University Medical Center Durham, NC 27710 (TEL) 919-684-7786 (FAX) 919-684-7122 [email protected]. NIH Public Access Author Manuscript Magn Reson Med. Author manuscript; available in PMC 2009 September 17. Published in final edited form as: Magn Reson Med. 2007 November ; 58(5): 893–900. doi:10.1002/mrm.21306. NIH-PA Author Manuscript NIH-PA Author Manuscript NIH-PA Author Manuscript
-
Upload
dukemedschool -
Category
Documents
-
view
0 -
download
0
Transcript of 3He MRI in mouse models of asthma

3He MRI in Mouse Models of Asthma
Bastiaan Driehuys1, Julia Walker2, Jim Pollaro1, Gary P. Cofer1, Nilesh Mistry1,3, DavidSchwartz4, and G. Allan Johnson11Center for In Vivo Microscopy, Duke University Medical Center, Durham, NC2Pulmonary Medicine, Duke University Medical Center, Durham, NC3Department of Biomedical Engineering, Duke University, Durham, NC4NIEHS, Research Triangle Park, NC
AbstractIn the study of asthma, a vital role is played by mouse models because knock-out or transgenicmethods can be used to alter disease pathways and identify therapeutic targets that affect lungfunction. Assessment of lung function in rodents by available methods is insensitive because thesetechniques lack regional specificity. A more sensitive method for evaluating lung function in humanasthma patients uses hyperpolarized (HP) 3He MR imaging before and after broncho-constrictioninduced by methacholine (MCh). We now report the ability to perform such 3He imaging of MChresponse in mice, where voxels must be ~3000 times smaller than in humans and 3He diffusionbecomes an impediment to resolving the airways. We show three-dimensional (3D) images thatreveal airway structure down to the 5th branching and visualize ventilation at a resolution of125×125×1000μm3. Images of ovalbumin-sensitized mice acquired after MCh show both airwayclosure and ventilation loss. To also observe the MCh response in naïve mice, we developed a non-slice-selective 2D protocol with 187×187μm2 resolution that was fast enough to record the MChresponse and recovery with 12 s temporal resolution. The extension of 3He MRI to mouse modelsshould make it a valuable translational tool in asthma research.
IntroductionIn asthma research, efforts to understand the disease pathways and identify new therapeutictargets are increasingly reliant on mouse models. The value of the mouse is driven by severalfactors. First, the murine genome has been mapped in detail. Second, the mouse immune systemis well characterized, providing a detailed understanding of how recurrent antigen presentationrelates to inflammatory response. Third, mice can be genetically engineered to over-expressor suppress targeted genes. These powerful capabilities to create and modify disease generatean equally strong demand for methods to evaluate the associated physiological phenotype.Common methods to assess lung function in small animals rely on inducing broncho-constriction with methacholine (MCh) and measuring the resultant changes in airway pressureor resistance (1,2). Unfortunately, such metrics, which provide only global lung functioninformation, cannot answer many of the most critical questions. What is the degree of smallversus large airway involvement? Is the disease focal or diffuse? Are the sites of airway hyper-responsiveness (AHR) reproducible? Are airways closing or merely narrowing? How well domouse models reproduce human disease? These long-standing questions could be addressedby measuring regional ventilation and airway caliber changes through imaging.
Correspondence: Bastiaan Driehuys, Ph.D. Center for In Vivo Microscopy Box 3302, Duke University Medical Center Durham, NC27710 (TEL) 919-684-7786 (FAX) 919-684-7122 [email protected].
NIH Public AccessAuthor ManuscriptMagn Reson Med. Author manuscript; available in PMC 2009 September 17.
Published in final edited form as:Magn Reson Med. 2007 November ; 58(5): 893–900. doi:10.1002/mrm.21306.
NIH
-PA Author Manuscript
NIH
-PA Author Manuscript
NIH
-PA Author Manuscript

Ventilation imaging in human asthma patients has gained prominence since Altes et al., firstdemonstrated that subtle defects could be observed in the lungs of even asymptomaticasthmatics by HP 3He magnetic resonance (MR) imaging (3). Images acquired before and afterMCh challenge allowed patients to act as their own control and thereby shed new light onasthmatic response by isolating the contribution to airway resistance of specific airways andlung regions (4). Such regional characterization of AHR by 3He MRI offers a more sensitiveand specific way to study asthma.
It is similarly desirable to use 3He MR imaging to study AHR in mouse models of asthma.However, 3He imaging in mice introduces several additional hurdles. First, the 3He distributionbefore and after MCh challenge must be imaged with sufficient spatial resolution to resolvethe branches of the airways. Second, 3He diffusion can completely eliminate the airway signalif not properly managed. Third, the image should be acquired sufficiently rapidly to capturethe response before the airways relax back to their open state. These issues are all exacerbatedin small animal MRI, where airway relaxation to baseline is likely to be faster than in humans(5) and voxels must be ~3000 times smaller. High spatial resolution is typically achieved insmall animals by acquiring images over multiple breaths (6,7). However, such averaging alsolengthens the scan time, which conflicts with the transient nature of the MCh response. Thus,as in many MR experiments, temporal and spatial resolution are in perpetual conflict forimaging airways hyper-responsiveness, and this problem is particularly acute in rodents.
AHR imaging in rodents was significantly advanced by Chen et al., who showed that MCh-induced changes in ventilation and airway caliber could be observed in non-sensitized Fisherrats by using 3He MRI (8). Radial 3He images of a single 4 mm slice were acquired at 4 timepoints of the inspiration with a spatial resolution of 200×200 μm2. The images, which took 2.5minutes to acquire, demonstrated a heterogeneous and relatively long-lasting (~10 min in someanimals) alteration of regional ventilation and airway caliber. Although these results wereobtained after a relatively large MCh dose (~1200 μg/kg), they provided evidence that 3HeMR could play a role in studying AHR in small animal models of asthma. The next step wasto transition the imaging method from rats to mice.
3He MRI in mice has been difficult because exquisite resolution is needed to resolve theirairways and 3He administration is made difficult by their small tidal breathing volumes.Compared to the ~2 ml tidal volume of the rat, its ~200 μl tidal volume makes the mousechallenging to ventilate and image with hyperpolarized 3He. The first HP 3He MR imaging ofa mouse was demonstrated by Dugas et al. who used an asymmetric readout gradient recalledecho (GRE) multislice sequence with 1.2 ms echo time to achieve a resolution of 0.25×0.25×3mm3 (9). 3He imaging of mice was subsequently demonstrated by Haczku et al., who employeda conventional single slice gradient echo (GRE) sequence with TE=3.4ms to achieve similar(0.24×0.24×3 mm3) resolution images in a mouse model of asthma (10). In a mouse sensitizedby and challenged with Aspergillus fumigatus (Af), Haczku demonstrated reduced regionalventilation compared to a healthy control (11). However, neither of these imaging studies wereable to visualize the mouse airways. The non-visibility of the airways is significant impedimentin the study of asthma where their role is the central question at hand. In this paper we willshow that absence of airway signal is a limitation of conventional Cartesian GRE 3He imageacquisition. Although it has been a mainstay sequence of clinical and small animal 3He MRI,this sequence is severely impacted by diffusion attenuation of the MR signal. Attenuation isexacerbated in 3He mouse imaging (as noted by Dugas) due to the high resolution required.We will show that diffusion attenuation can be nearly completely avoided by employing radialencoding sequences.
The successful use of radial sequences for 3He imaging in mice was illustrated in a recent studyby Chen et al. whose 70×70×800 μm3 resolution images readily depict several airway branches
Driehuys et al. Page 2
Magn Reson Med. Author manuscript; available in PMC 2009 September 17.
NIH
-PA Author Manuscript
NIH
-PA Author Manuscript
NIH
-PA Author Manuscript
(12). While succeeding in the goal of airway imaging, this imaging protocol a required a largequantity of 3He (~1.2 liters) and image acquisition was too slow (25 min) to have been practicalfor imaging MCh response. In this paper, we now report the ability to produce 2D and 3Dimages of 3He distribution in the lungs of mice sufficiently quickly to capture theirheterogeneous response to MCh challenge. These images, which depict airway response downto the 5th branching, are enabled by radial encoding. The significant advantage of radial versusCartesian encoding in mouse 3He MRI is also explained.
The 3He Diffusion Attenuation ProblemDiffusion-induced attenuation of 3He signal is a profound problem when imaging airwaystructures on the small scale of a mouse. The diffusion problem has begun to receive attentionin clinical 3He imaging, where its careful consideration can yield measurable improvementsin signal-to-noise ratio (SNR) (13–15). Here we show that for small animal imaging, theproblem can be largely eliminated by starting the image acquisition at the center of Fourierspace. This simple switch from Cartesian sampling, which starts at the edge of k-space, has aremarkable impact on small animal 3He image quality. An additional problem in smallanimal 3He MRI is diffusion attenuation caused by slice selection. This problem can beovercome by avoiding slice selection and using 3D encoding. Because both problems are socritical to small animal 3He MRI, and neither has received significant attention in the literature,we present calculations of the scale of the effect. Such calculations lead us to conclude thathigh-resolution 3He MRI of mouse airways should be performed using non-slice-selective 2Dand 3D radial imaging sequences.
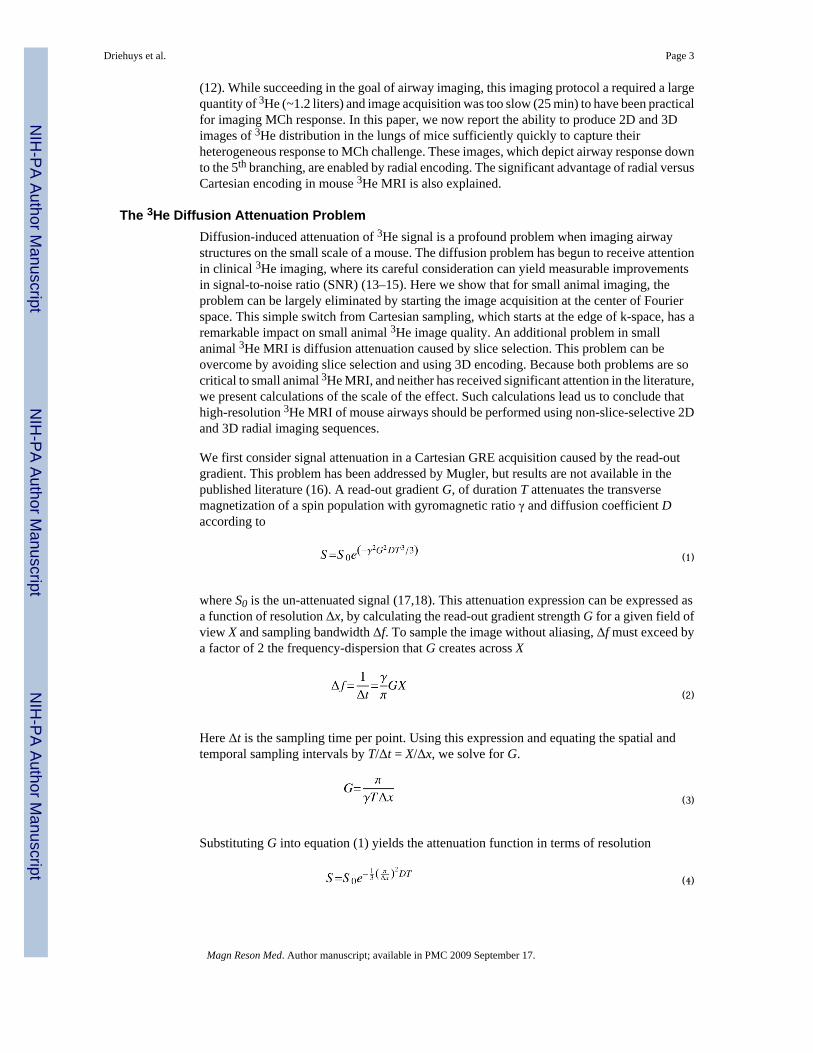
We first consider signal attenuation in a Cartesian GRE acquisition caused by the read-outgradient. This problem has been addressed by Mugler, but results are not available in thepublished literature (16). A read-out gradient G, of duration T attenuates the transversemagnetization of a spin population with gyromagnetic ratio γ and diffusion coefficient Daccording to
(1)
where S0 is the un-attenuated signal (17,18). This attenuation expression can be expressed asa function of resolution Δx, by calculating the read-out gradient strength G for a given field ofview X and sampling bandwidth Δf. To sample the image without aliasing, Δf must exceed bya factor of 2 the frequency-dispersion that G creates across X
(2)
Here Δt is the sampling time per point. Using this expression and equating the spatial andtemporal sampling intervals by T/Δt = X/Δx, we solve for G.
(3)
Substituting G into equation (1) yields the attenuation function in terms of resolution
(4)
Driehuys et al. Page 3
Magn Reson Med. Author manuscript; available in PMC 2009 September 17.
NIH
-PA Author Manuscript
NIH
-PA Author Manuscript
NIH
-PA Author Manuscript

The relationship in Equation 4 represents the SNR reduction of a Cartesian versus radiallyacquired GRE image. This is because image SNR is dominated by the signal at the center ofk-space. In a Cartesian acquisition, k=0 is not sampled until after the pre-phasing gradient hastaken the magnetization to the edge of k-space and the first half of the read-gradient has returnedit to center. This excursion creates a period of diffusion-induced attenuation that under theidealized assumption of equal pre-phasing and read-out gradient amplitudes, lasts for time T.This period does not exist for a radial acquisition because it starts at the center of k-space andthus no attenuation is accumulated. Of course, both radial and Cartesian acquisition will beattenuated on the remaining k-space trajectory, thus reducing the amplitudes of the higherspatial frequencies. The associated effects of such filtering on hyperpolarized gas MRmicroscopy will be the subject of an upcoming paper.
The practical consequences of diffusion attenuation in a Cartesian GRE image are illustratedin Figure 1a, which assuming a 1 ms data-sampling period, shows the dramatic signal drop atincreased resolution. Attenuation is calculated in two scenarios—restricted 3He diffusion inthe parenchyma of the lung (D=0.2 cm2/s) and nearly free 3He diffusion in the airways (D=2cm2/s). Under conditions of restricted diffusion in the parenchyma, the signal is completelyextinguished at a resolution below ~200μm. For free diffusion in the airways, the signal isextinguished below ~500μm. By contrast, radially acquired images shown in this paper depictthe airways down to the 5th order branching where the diameter is ~350μm (19). Thesecalculations show that, in addition to motion insensitivity and reduced susceptibility problemstouted since the early development of HP gas MRI (20–22), the single most importantadvantage of radial encoding may be “diffusion-proofing”.
Yet another pathway for diffusion attenuation of signal is presented by the slice select gradient.The issue has been addressed in some detail for clinical 3He imaging by Wild and co-workers(15) who note a marked advantage of 3D versus multi-slice 2D imaging as slice thickness dropsbelow 10 mm. For our goal of 1 mm thick slices, diffusion attenuation makes slice selectionimpossible.
To calculate the attenuating effects of slice selection using Equation (1), we must calculate theamplitude and duration of the slice select gradient Gslice. The slice gradient is set such thatacross a slice of thickness Δz it causes a frequency dispersion of Δf which matches thebandwidth of the rf pulse used for excitation.
(5)
The excitation bandwidth of a sinc-shaped rf pulse, for example, is the inverse of the time t0from its peak to its first zero-crossing. However, the excitation frequency profile is only aperfectly boxcar shaped if the rf pulse is infinitely long and possesses infinite zero crossings.An acceptable profile is generally attained by truncating the pulse with 4–10 zero crossings.Denoting these as N0 and then substituting Δf=N0/tpulse into Equation (5) gives the slice gradientstrength
(6)
A final step is to calculate the time period over which the slice gradient and the re-phasinggradient contribute to the attenuation. The effective period of attenuation from the slice selectgradient lasts from the center of the rf pulse to its end or tpulse/2 (15). Then, the rephrasinglobe, if we assume it to be of equal amplitude to the slice select gradient, must also last for
Driehuys et al. Page 4
Magn Reson Med. Author manuscript; available in PMC 2009 September 17.
NIH
-PA Author Manuscript
NIH
-PA Author Manuscript
NIH
-PA Author Manuscript

tpulse/2. Thus, the combined attenuation period becomes tpulse,, which, when combined withEquations (6) and (1), gives the attenuation due to slice selection
(7)
This expression is exactly analogous to Equation (4) derived for the read-out gradient, exceptthat the exponent is amplified by an additional factor of 4N0
2. This exacerbation results fromthe need to create a frequency profile that is as close to perfectly square as possible, thusrequiring the pulse to have more zero-crossings. The additional zero crossings shorten t0 andthereby increase the bandwidth of the pulse. To match this pulse bandwidth with equalfrequency dispersion across the desired slice, the gradient must be commensurately increased.It is thus because well-defined slices require very large gradients, that diffusion attenuation bythe slice selection is particularly problematic.
The practical consequences of 3He signal attenuation as a function of slice thickness areillustrated in Figure 1b. Assuming a slice selected by a 1 ms sinc pulse with N0=4 zero crossings,all signal will vanish in the parenchyma (D=0.2 cm2/s) for a thickness below 1.5 mm and inthe airways (2 cm2/s) for a thickness below 3 mm. Such calculations illustrate that for high-resolution imaging of the mouse lung, slice selection is non-viable. Combined with theattenuation calculations for the read-out gradient discussed in the previous paragraphs, theseresults show that for 3He MRI of mouse airways, non-slice selective radial encoding shouldbe used.
MethodsOverview
HP 3He imaging before and after MCh administration was performed in five BALB/c mice (2control and 3 ovalbumin sensitized) and four non-sensitized (naïve) C57BL/6 mice. Thesemouse strains where chosen because BALB/c mice are most commonly used in allergic modelsof asthma, and because C57BL/6 is the common platform for many genetically modifiedanimals. The BALB/c mice were imaged using a 3D radial acquisition taking 5.8 min tocomplete and consuming 96 ml of HP 3He to yield a resolution of 125×125×1000μm3. TheC57BL/6 mice underwent non-selective 2D radial imaging taking 12 sec to complete andconsuming 3 ml of 3He to yield a resolution of 187×187μm2.
Animal Preparation - SensitizationAirway hyper-responsiveness in mice is commonly achieved by sensitization and recurrentchallenge with ovalbumin (OVA) (23). Under a protocol approved by the Duke InstitutionalAnimal Care and Use Committee, 10.0μg OVA (Sigma, St. Louis, MO) was administered viaintraperitoneal injection on days 0 and 14 to BALB/c mice (Jackson Labs, Bar Harbor, ME).The mice were subsequently challenged with 1% OVA aerosol on days 21, 22, and 23 (23) andimaged on day 24.
3He Polarization3He was polarized by spin exchange optical pumping (SEOP) in a prototype commercialpolarizer (IGI.9600.He, Magnetic Imaging Technologies, Durham, NC). This system uses 60Wof 795 nm laser light to optically pump Rb (24) and typically produces 1.2 liters of 3He (SpectraGases, Alpha, NJ) overnight with a time constant of 4–5 hr and P≈30%. Once the 3Hepolarization was saturated, the optical cell was cooled to room temperature and the 3He wasdispensed into a 1 liter Tedlar bag (Jensen Inert Products, Coral Springs, FL) housed in a
Driehuys et al. Page 5
Magn Reson Med. Author manuscript; available in PMC 2009 September 17.
NIH
-PA Author Manuscript
NIH
-PA Author Manuscript
NIH
-PA Author Manuscript

Plexiglas cylinder. The cylinder was then detached from the polarizer and attached to ahyperpolarized gas-compatible ventilator. The cylinder sits about 1 m from the opening to the2T MR scanner, where gradient-induced longitudinal 3He relaxation (25) is about 20 min,allowing imaging to be performed with acceptable SNR for approximately that duration.
Animal Preparation - ImagingMice were anesthetized using an intraperitoneal (i.p.) injection of 75mg/kg Nembutal (AbbottLabs, Chicago, IL) and maintained with iv maintenance doses of 20mg/kg every 30 min. Eachmouse received a 2F-gauge catheter (Sherwood Medical, Tullamore, Ireland) in their jugularvein for delivery of methacholine. The MCh delivery line was extended with a 100 cm longpre-filled PE50 tube connected to a syringe accessible from outside of the magnet. The mousereceived a tracheostomy to allow placement of a 18G tracheal tube which was secured bysutures to end 2–3 mm above the carina. The tracheal tube was connected to a low-dead-volume(~40 μl) Y-connector separating the inhalation and exhalation lines of an MR compatibleconstant volume ventilator (12). The mouse was ventilated in the supine position at 100 breathsper minute with 0.2 ml tidal volume (26). A single breath was characterized by a 260 msinhalation, 100 ms breath-hold, and a 240 ms passive exhalation resulting in a typical peakairway pressure of 8 cm H2O prior to MCh challenge. To minimize the mouse's potentialrespiratory efforts against the ventilator, Doxacurium Chloride (0.25 mg/kg) (Abbott Labs,Chicago, IL) paralytic was administered roughly 20 minutes prior to imaging. The animal wasinserted into an 85.1/64.8 MHz dual-tuned birdcage coil (L=5.5cm, ϕ=3.5cm) and the entireassembly inserted into the magnet. The animal's airway pressure, ECG, and body temperaturewere continuously monitored throughout the study. Body temperature was maintained viafeedback from a rectal temperature probe that controlled warm air circulating through themagnet bore.
MR Imaging HardwareImages were acquired on a 2.0 T horizontal 30 cm clear bore magnet (Oxford Instruments,Oxford, UK) with shielded gradients (18 G/cm), controlled by a GE EXCITE 11.0 console(GE Healthcare, Milwaukee, WI). The scanner was interfaced to the dual-tuned coil using aseparate integrated transmit/receive switch with 31 dB gain preamplifier (Nova Medical,Wilmington, MA) for the 1H or 3He frequency. These frequencies were created by modifyingthe intrinsic 63.86 MHz frequency of the scanner to 85.1 or 64.8 or MHz using an up-downconverter (Cummings Electronics Labs, North Andover, MA).
3He MR Imaging SequencesHigh-resolution 3D images were acquired with a field of view (FOV) of 3.2 cm in the coronalplane and 1.6 cm in the sagittal direction using 3D radial encoding (27). Images were acquiredusing a 132 μs hard excitation pulse, TR=5ms, TE=132 μs, BW=62.5kHz, with 20 radial k-space views per breath. Data acquisition continued over 5.8 min until 11,520 radial k-spaceviews had been accumulated. Radial data was then re-gridded on a Cartesian matrix of256×256×16 and Fourier-transformed to give images with a Nyquist-limited resolution of125×125×1000 μm3. Although these images were acquired over multiple breaths, they weregiven the characteristics of a single breath imaging by using a variable flip angle (VFA) toexcite subsequent views in a breath (28). From the first to last view, the flip angle wasincremented from α1=13° to α20=90° to both maintain constant magnetization from view toview and prevent residual magnetization from contributing signal to the next breath. In additionto optimal use of the available 3He magnetization, this method has the further beneficial effectof highlighting the airways over the parenchyma.
Non-slice-selective coronal 2D images were similarly acquired with FOV=2.4 cm, using 2Dradial encoding. Images employed a 132 μs hard excitation pulse, TR=5ms, TE=132 μs,
Driehuys et al. Page 6
Magn Reson Med. Author manuscript; available in PMC 2009 September 17.
NIH
-PA Author Manuscript
NIH
-PA Author Manuscript
NIH
-PA Author Manuscript

BW=31.25 kHz, with 20 radial k-space views per breath. Data acquisition continued for 12 suntil 400 radial k-space views had been accumulated. Radial data was re-gridded on a Cartesianmatrix of 128×128 and Fourier-transformed to yield images with a Nyquist-limited resolutionof 187×187 μm2. The images were acquired employing the same VFA scheme outlined for 3Dimaging in order to highlight the airways relative to the parenchyma.
Experimental ProtocolThe protocol consisted of the following steps. The lungs of the mouse were centered in thefield of view by using a coarse 1H localizer. Then, hyperpolarized 3He was dispensed and 3Heimaging was immediately commenced by switching the ventilator breathing gas from air to amixture of 75% HP 3He mixed with 25% O2. Gas mixing occurred at a junction just before thetracheal tube to minimize the depolarizing effects of oxygen on 3He (29). Roughly 10 breathswere sufficient to establish stable 3He magnetization in the lungs and image acquisition wasstarted. Image data was collected during the 100ms held breath by using the ventilator to triggerthe MR acquisition at end inspiration. The first 3He image acquired in this manner was thebaseline image. Immediately upon its completion, MCh was administered (250μg/kg) in 0.1ml of saline in a rapid bolus (~1s). Before MCh reaches the lungs, it acts on the cholinergicreceptors of the heart and causes a transient slowing of the heart rate (30). As soon as this heart-rate reduction was noted (1–2 s post injection), image acquisition was started. Images wereacquired one before and one after MCh for our 3D protocol. For our 2D protocol, 1 image wasacquired before MCh and subsequent images were continuously acquired every 12 s for 3–5minutes following MCh.
Image AnalysisBoth 3D and 2D image data were evaluated to quantify the degree of ventilation alterationinduced by MCh. The ventilated lung was first roughly cropped slice-by slice to prevent anybackground artifacts from being counted. Then a region outside the cropped lung was selectedto measure the noise mean and standard deviation. These values we used to retain only voxelswith signal 3 standard deviations above the background noise mean and these voxelsrepresented the ventilated lung. The ventilated voxels were counted in the pre- and post-Mchimages and their ratio was computed to provide a global measure of change in ventilation.
One series of 2D temporal image series was analyzed to demonstrate the post-MCh temporalevolution of both regional ventilation and airway caliber. Regional ventilation was evaluatedby selecting three regions of interest (ROIs) representing parts of the lung that appeared toevolve differently in time. Ventilation in the ROIs was calculated for each image according tothe method above. For airway analysis, we selected 6 bronchi that could be visualized in all23 image frames. These were the left and right main stem bronchus (lSt, and rSt), the rightaccessory lobe bronchus (V), and the first three lateral bronchi of the left lung (1L1, 1L2, and1L3). The nomenclature used to label these airways is that set forth by Wallau (31) and theirlocations are depicted in Figure 5a. Airway diameters were measured by importing the imagestack into ImageJ (NIH, Bethesda, MD), drawing a transverse line across the bronchi of interestand using the “plot profile” function to identify the increased signal intensity of the airway.The edges of the signal increase were determined by finding the point on either side of theprofile where the signal dropped to half of the maximum-baseline intensity and this was takento be the airway edge.
ResultsA typical 3He dataset is shown in Figure 2. The images cover the entire lung from front to backwith six 1 mm coronal partitions and have an SNR of 50 in the major airways and 19 in theparenchyma. These SNR values were typical of images acquired immediately after
Driehuys et al. Page 7
Magn Reson Med. Author manuscript; available in PMC 2009 September 17.
NIH
-PA Author Manuscript
NIH
-PA Author Manuscript
NIH
-PA Author Manuscript

dispensing 3He. Subsequent images exhibited reduced SNR due to 3He polarization decay witha T1 of roughly 20 min. All images exhibited higher SNR in the airways than parenchyma.This effect is largely attributable to the use of a variable flip angle acquisition (VFA),particularly the final 90° flip, which consumes all remaining magnetization in each breath. Thishighlights the airways because with each breath they replenish 60–90% of their 3He whereasthe parenchyma replenishes only 5–30% of its 3He (11,32). The VFA acquisition with terminal90 degree pulse thus effectively presents a single breath “snapshot” of ventilation despitehaving been acquired over multiple breaths. Images acquired in this manner could resolve theairways to approximately the 5th generation where they measure ~350 μm (3 pixels) across.
To readily identify the most responsive airways in the 3D images, we display them as maximumintensity projections (MIPS). Such representations are shown in Figure 3 depicting imagesbefore and after MCh challenge from 3 mice—a naïve control, and 2 OVA-sensitized mice. Inthe sensitized mice, the images show focal bronchoconstriction that is sufficient to fully closeseveral large bronchi for at least the 5.8 minutes required to acquire the 3D scan. Accompanyingthe constriction is a reduction of 3He signal intensity in the periphery of the lung served bythese airways. By contrast, images of the naïve mouse do not show any readily observablereduction in airway caliber or ventilation. However, reduced ventilation was measurable bythe pixel-counting method.
Table 1 summarizes our findings on ventilation and airway caliber in all 9 mice studied withMCh challenge. All the mice exhibited a reduction in the number of ventilated pixels afterMCh challenge. Of the mice that underwent 3D imaging, two OVA sensitized mice showed alarge ventilation reduction (43 and 51%) compared to two naïve mice (21 and 26%). One OVA-sensitized mouse showed a ventilation reduction comparable to that of naïve mice (24%). Thismouse may not have received the full 250 μg/kg dose of MCh due to a blockage in the catheter.All mice that underwent 2D imaging showed measurably reduced ventilation after MCh eventhough they were not specifically sensitized to be hyper-responsive. These mice also showedmeasurable narrowing of several branches of airways.
For mapping the temporal dynamics of regional ventilation and airway caliber following MChchallenge, the more rapid 2D imaging was most fruitful. Images from such a time-course studyare depicted in Figure 4 which shows a non-sensitized C57BL/6 mouse that neverthelessexhibited a very strong MCh response. In this animal, the left main stem bronchus is severelyconstricted and the left apical lung shows dramatic reduction of ventilation while its right mainstem bronchus is less constricted and ventilation appears largely unaltered on the right side.The only portion of the right lung that experiences severe constriction is the bronchus feedingthe right accessory lobe. After the initial MCh response, all afflicted lung regions and bronchishow a gradual recovery over time. Then, a deep inspiration, applied by stacking 3 breathswithout exhalation at t=228 s, causes nearly complete recovery of ventilation and airwaycaliber. When this same mouse was given a subsequent MCh challenge 10 min later, it showedthe identical pattern of response and recovery. This observation seems to indicate that the lungresponse in this mouse on a short time scale is reproducible.
The temporal evolution of airway caliber and ventilation can be readily quantified. Ventilationreduction and recovery shown in Figure 5b reveals very different temporal dynamics in theselected ROIs. ROI1 in the right lung has unaltered ventilation for the entire time course. ROI2in the apex of the left lung is severely impacted, dropping to zero ventilation, making a slightrecovery, dropping to zero, and finally making a slight recovery. ROI3 is in an intermediatezone where it is initially severely impacted before making a gradual, but nearly completerecovery. By contrast, the recovery dynamics of the airways shown in Figure 5c all follow afairly similar time course. However in these airways the initial magnitude of response wasdifferent. The observation that ventilation recovers differently from airway caliber may suggest
Driehuys et al. Page 8
Magn Reson Med. Author manuscript; available in PMC 2009 September 17.
NIH
-PA Author Manuscript
NIH
-PA Author Manuscript
NIH
-PA Author Manuscript

that airways smaller than those we can observe are significantly involved in the response. Theability to measure both airway caliber and ventilation changes by 3He MRI provides a meansto assess the impact of both resolved and of non-resolved airways.
DiscussionWe have illustrated that 3He MRI of the mouse lung can be performed with sufficient temporaland spatial resolution to capture its transient response to a challenge with methacholine. Theseimages reveal both changes in ventilation and airway caliber. The ability to resolve the airwaysof small animals by 3He MRI is particularly important to the study of airways hyper-reactivityand has historically been accomplished only by groups employing radial sampling, includingDuke, Wisconsin (33), and Lyon (34,35). In this paper, we have provided simple calculationsto explain how using radial imaging and avoiding slice selection mitigates the effects of 3Hediffusion, and makes airway imaging in mice possible.
While we have demonstrated both 3D and 2D 3He imaging of airways hyper-reactivity, wecurrently find the additional temporal information provided by 2D imaging to be most valuable.Although the 2D images lack resolution in the ventral-dorsal direction the loss of informationis alleviated by the relatively short extent of the mouse lung (~1 cm) in this direction, and useof the variable flip angle technique to highlight the airways against the parenchyma. Becausethe 2D images can be acquired rapidly, additional information about how specific regionsrecover ventilation, and specific airways return to their fully open state could provide furtherinsights into a variety of asthma models.
These encouraging preliminary imaging results open up the way for considerable continuedtechnical and biological investigations of airways hyper-responsiveness. Future technicalmilestones will include developing 3D imaging sequences that can be acquired nearly asquickly as the present 2D images. Examples of more efficient 3D sequences include 3D PRIZE(PRojections Inside Z Encoding) or ZIPR (Z encoding Inside Projections) which phase encodethe z-direction, while employing radial encoding within the slices (36). Such approaches couldcover k-space with about ¼ of the views of our present fully radial 3D sequence and thus permita shorter scan. Furthermore, scan times could be cut 4-fold by using newly emergingapproaches for radial image reconstruction that employ non-uniform fast Fourier transform(NUFFT) without re-gridding (37). Thus, the very real potential exists to use these methods toobtain 3D 3He images of the resolution demonstrated here in less than 1 minute of scan time.Though trade-offs between scan time and spatial resolution will continue to be a challenge, weare optimistic that the outlined approaches will generate considerable improvements.
ConclusionThe ability to image alterations in mouse lung function after MCh administration with highspatial and temporal resolution opens up exciting possibilities for quantitative evaluation ofasthma phenotypes. These phenotypes are currently only assessed by methods that, though inubiquitous use in the airway biology community, lack spatial information and are limited ininformation content. By instead assessing murine asthma models via 3He imaging, we have anopportunity to open up new avenues of investigation. Imaging will be particularly powerful if,as our initial results suggest, airway hyper-responsiveness is a heterogeneous phenomenon.The ability of imaging to isolate those regions of the lung that contribute most significantly toits response should provide increased sensitivity. The ability to now image AHR from mouseto human (38), should make hyperpolarized 3He MRI a truly translational tool in asthmaresearch.
Driehuys et al. Page 9
Magn Reson Med. Author manuscript; available in PMC 2009 September 17.
NIH
-PA Author Manuscript
NIH
-PA Author Manuscript
NIH
-PA Author Manuscript

AcknowledgementsThe authors are grateful to Scott Shofer for discussions, and Boma Fubara for technical assistance. We thank SallyZimney for assistance in preparation of the manuscript. This work was performed at the Duke Center for In VivoMicroscopy, an NCRR/NCI National Resource (P41 RR005959/R24 CA092656), with additional support from NIH/NHLBI (R01 HL055348).
References1. Bates JHT, Irvin CG. Measuring lung function in mice: the phenotyping uncertainty principle. J Appl
Physiol 2003;94(4):1297–1306. [PubMed: 12626466]2. Irvin CG, Bates JH. Measuring the lung function in the mouse: the challenge of size. Respiratory
Research 2003;4(4)3. Altes TA, Powers PL, Knight-Scott J, Rakes G, Platts-Mills TAE, DeLange EE, Alford BA, Mugler
JP, Brookeman JR. Hyperpolarized 3He MR Lung Ventilation Imaging in Asthmatics: PreliminaryFindings. J Mag Res Imag 2001;13:378–384.
4. Samee S, Altes T, Powers P, de Lange EE, Knight-Scott J, Rakes G, Mugler JP, Ciambotti JM, AlfordBA, Brookeman JR, Platts-Mills TAE. Imaging the lungs in asthmatic patients by using hyperpolarizedhelium-3 magnetic resonance: Assessment of response to methacholine and exercise challenge. JAllergy Clin Immunol 2003;111(6):1205–1211. [PubMed: 12789218]
5. Cartier A, Malo JL, Begin P, Sestier M, Martin RR. Time Course of the Bronchoconstriction Inducedby Inhaled Histamine and Methacholine. J Appl Physiol 1983;54(3):821–826. [PubMed: 6341339]
6. Hedlund LW, Johnson GA. Mechanical Ventilation for Imaging the Small Animal Lung. ILAR Journal2002;43(3):159–174. [PubMed: 12105383]
7. Hedlund LW, Cofer GP, Owen SJ, Johnson GA. MR-compatible ventilator for small animals:computer-controlled ventilation for proton and noble gas imaging. Magn Reson Imaging 2000;18(6):753–759. [PubMed: 10930785]
8. Chen BT, Johnson GA. Dynamic Lung Morphology of Methacholine-induced HeterogeneousBronchoconstriction. Magn Reson Med 2004;52(5):1080–1086. [PubMed: 15508158]
9. Dugas JP, Garbow JR, Kobayashi DK, Conradi MS. Hyperpolarized He-3 MRI of mouse lung. MagnReson Med 2004;52(6):1310–1317. [PubMed: 15562478]
10. Haczku A, Emami K, Fischer MC, Kadlecek S, Ishii M, Panettieri RA, Rizi RR. Hyperpolarized He-3MRI in asthma: Measurements of regional ventilation following allergic sensitization and challengein mice - Preliminary results. Acad Radiol 2005;12(11):1362–1370. [PubMed: 16253848]
11. Deninger AJ, Mansson S, Petersson JS, Pettersson G, Magnusson P, Svensson J, Fridlund B, HanssonG, Erjefeldt I, Wollmer P, Golman K. Quantitative measurement of regional lung ventilation using3He MRI. Magn Reson Med 2002;48(2):223–232. [PubMed: 12210930]
12. Chen BT, Yordanov AT, Johnson GA. Ventilation-synchronous magnetic resonance microscopy ofpulmonary structure and ventilation in mice. Magn Reson Med 2005;53(1):69–75. [PubMed:15690504]
13. Gao JH, Lemen L, Xiong J, Patyal B, Fox P. Magnetization and Diffusion Effects in NMR Imagingof Hyperpolarized Substances. MRM 1997;37:153–158.
14. Wild JM, Paley MNJ, Viallon M, Schreiber WG, van Beek EJR, Griffiths PD. k-space filtering in 2Dgradient-echo breath-hold hyperpolarized He-3 MRI: Spatial resolution and signal-to-noise ratioconsiderations. Magn Reson Med 2002;47(4):687–695. [PubMed: 11948729]
15. Wild JM, Woodhouse N, Paley MNJ, Fichele S, Said Z, Kasuboski L, van Beek EJR. Comparisonbetween 2D and 3D gradient-echo sequences for MRI of human lung ventilation with hyperpolarizedHe-3. Magn Reson Med 2004;52(3):673–678. [PubMed: 15334590]
16. Mugler, JP. Imaging Strategies for Hyperpolarized Elements and Molecules. Weekend EducationalSyllabus; ISMRM 14th Annual Meeting; Seattle. 2006.
17. Turner R, Lebihan D, Maier J, Vavrek R, Hedges LK, Pekar J. Echo-Planar Imaging of IntravoxelIncoherent Motion. Radiology 1990;177(2):407–414. [PubMed: 2217777]
18. Callaghan PT, Eccles CD. Diffusion-limited resolution in nuclear magnetic resonance microscopy.J Magn Reson 1988;78:1–8.
Driehuys et al. Page 10
Magn Reson Med. Author manuscript; available in PMC 2009 September 17.
NIH
-PA Author Manuscript
NIH
-PA Author Manuscript
NIH
-PA Author Manuscript

19. Oldham MJ, Phalen RF. Dosimetry implications of upper tracheobronchial airway anatomy in twomouse varieties. Anat Rec 2002;268(1):59–65. [PubMed: 12209565]
20. Gewalt SL, Glover GH, MacFall JR, Hedlund LW, Johnson GA. MR microscopy of the rat lung usingprojection reconstruction. Magn Reson Med 1993;29:99–106. [PubMed: 8419748]
21. Black RD, Middleton HL, Cates GD, Cofer GP, Driehuys B, Happer W, Hedlund LW, Johnson GA,Shattuck MD, Swartz JC. In vivo He-3 MR images of guinea pig lungs. Radiology 1996;199(3):867–870. [PubMed: 8638019]
22. Johnson GA, Cates G, Chen XJ, Cofer GP, Driehuys B, Happer W, Hedlund LW, Saam B, ShattuckMD, Swartz J. Dynamics of magnetization in hyperpolarized gas MRI of the lung. Magn Reson Med1997;38(1):66–71. [PubMed: 9211381]
23. Whitehead GS, Walker JKL, Berman KG, Foster WM, Schwartz DA. Allergen-induced airwaydisease is mouse strain dependent. American Journal Of Physiology-Lung Cellular And MolecularPhysiology 2003;285(1):L32–L42. [PubMed: 12626335]
24. Leawoods JC, Yablonskiy DA, Saam B, Gierada DS, Conradi MS. Hyperpolarized He-3 gasproduction and MR imaging of the lung. Conc Magn Reson 2001;13(5):277–293.
25. Cates GD, Schaefer SR, Happer W. Relaxation of Spins Due to Field Inhomogeneities in GaseousSamples at Low Magnetic Fields and Low Pressures. Phys Rev A 1988;37(8):2877–2885. [PubMed:9900016]
26. Chen BT, Brau AC, Johnson GA. Measurement of regional lung function in rats using hyperpolarized3helium dynamic MRI. Magn Reson Med 2003;49(1):78–88. [PubMed: 12509822]
27. Shattuck MD, Gewalt SL, Glover GH, Hedlund LW, Johnson GA. MR microimaging of the lungusing volume projection encoding. Magn Reson Med 1997;38(6):938–942. [PubMed: 9402195]
28. Zhao L, Mulkern R, Tseng CH, Williamson D, Patz S, Kraft R, Walsworth RL, Jolesz FA, AlbertMS. Gradient-echo imaging considerations for hyperpolarized 129Xe MR. J Magn Reson B 1996;113(2):179–183.
29. Saam B, Happer W, Middleton H. Nuclear relaxation of 3He in the presence of O2. Phys Rev A1995;52(1):862–865. [PubMed: 9912313]
30. Koelle, G. Parasympathomimetic Agents. In: Goodman, L.; A, G., editors. Goodman And Gilman'sThe Pharmacological Basis of Therapeutics. Vol. 4th Edition. The MacMillan Company; New York:1970. p. 466-523.
31. Wallau BR, Schmitz A, Perry SF. Lung morphology in rodents (Mammalia, Rodentia) and itsimplications for systematics. J Morphol 2000;246(3):228–248. [PubMed: 11077434]
32. Spector ZZ, Emami K, Fischer MC, Zhu J, Ishii M, Yu J, Kadlecek S, Driehuys B, Panettieri RA,Lipson DA, Gefter W, Shrager J, Rizi RR. A small animal model of regional alveolar ventilationusing (HPHe)-He-3 MRI. Acad Radiol 2004;11(10):1171–1179. [PubMed: 15530811]
33. Holmes JH, Sorkness RL, Meibom SK, Sundaram SK, Perlman SB, Converse AK, Pyzalski RW,Hahn AD, Korosec FR, Grist TM, Fain SB. Noninvasive mapping of regional response to segmentalallergen challenge using magnetic resonance imaging and [F-18]fluorodeoxyglucose positronemission tomography. Magn Reson Med 2005;53(6):1243–1250. [PubMed: 15906295]
34. Cremillieux Y, Berthezene Y, Humblot H, Viallon M, Canet E, Bourgeois M, Albert T, Heil W,Briguet A. A Combined 1H Perfusion/3He Ventilation NMR Study in Rat Lungs. Mag Res Med1999;41(4):645–648.
35. Dupuich D. Dynamic 3He Imaging for Quantification of Regional Lung Ventilation Parameters. MagnReson Med 2003;50:777–783. [PubMed: 14523964]
36. Peters DC, Korosec FR, Grist TM, Block WF, Holden JE, Vigen KK, Mistretta CA. Undersampledprojection reconstruction applied to MR angiography. Magn Reson Med 2000;43(1):91–101.[PubMed: 10642735]
37. Song J, Liu QH. Improved Non-Cartesian MRI Reconstruction through Discontinuity Subtraction.International Journal of Biomedical Imaging 2006;2006:1–9.
38. Samee S, Altes T, Powers PL, Rakes G, Knight-Scott J, Mata J, Christopher JM, Delange EE, AlfordBA, Brookeman J, Platts-Mills TA. Identification of reversible ventilation defects in the lungs ofasthmatic patients using hyperpolarized helium-3 MR. J Allergy Clin Immunol 2001;107(2):757.
Driehuys et al. Page 11
Magn Reson Med. Author manuscript; available in PMC 2009 September 17.
NIH
-PA Author Manuscript
NIH
-PA Author Manuscript
NIH
-PA Author Manuscript

Figure 1.Impact of resolution and slice thickness on diffusion-induced signal attenuation a. Signalattenuation at the center of k-space versus resolution of an idealized single echo Cartesian GREacquisition with 1ms read-out period. This shows the non-viability of Cartesian GREacquisition for high-resolution (<500 μm) imaging airways by 3He. b. Signal attenuation as afunction of slice thickness assuming a sinc pulse of 1 ms duration with 4 zero crossings. Thisshows that slice selection is non viable for 3He imaging of airways below a slice thickness of~4 mm. For both calculations we have assumed D=0.2cm2/s in the parenchyma, andD=2.0cm2/s in the airway.
Driehuys et al. Page 12
Magn Reson Med. Author manuscript; available in PMC 2009 September 17.
NIH
-PA Author Manuscript
NIH
-PA Author Manuscript
NIH
-PA Author Manuscript

Figure 2.Representative 3He image partitions from a 3D dataset acquired in a naïve BALB/C mouse(#1 in Table 1). The image has a resolution of 125×125×1000 μm3, consumed 96 ml ofhyperpolarized 3He, and was acquired in 5.8 minutes.
Driehuys et al. Page 13
Magn Reson Med. Author manuscript; available in PMC 2009 September 17.
NIH
-PA Author Manuscript
NIH
-PA Author Manuscript
NIH
-PA Author Manuscript

Figure 3.Maximum intensity projections (MIPs) generated from 3D 3He images of 3 BALB/C micebefore (top row) and after (bottom row) 250μg/kg MCh challenge. From left to right in thefigure are a naive (#1), Ova-sensitized (#3), and Ova-sensitized (#4) mouse. The numberingrelates these mice to Table 1. In the Ova-sensitized mice, the MCh effect is readily observed(arrows), but it is not readily apparent in the naïve mouse. Presumably, in this non-sensitizedanimal the airway constriction is less severe and does not last for the full 5.8 min of the imageacquisition.
Driehuys et al. Page 14
Magn Reson Med. Author manuscript; available in PMC 2009 September 17.
NIH
-PA Author Manuscript
NIH
-PA Author Manuscript
NIH
-PA Author Manuscript

Figure 4.Temporal response to MCh challenge in an un-sensitized C57BL/6 mouse (#7) showing 10out of 23 frames acquired every 12 seconds. The mouse exhibits dramatic collapse of the leftmain stem bronchus and the airway feeding the right accessory lobe. After the mouse receivesa deep inspiration (before the t=228 s frame), its airway caliber and ventilation recover nearlyfully to their baseline state.
Driehuys et al. Page 15
Magn Reson Med. Author manuscript; available in PMC 2009 September 17.
NIH
-PA Author Manuscript
NIH
-PA Author Manuscript
NIH
-PA Author Manuscript

Figure 5.Quantitative measurements of the regional ventilation and airway dynamics after MChchallenge. a. Labeling of airways and lung lobes according to Wallau (31). In addition to theROIs, we tracked the caliber of the left and right main stem bronchus (lSt, and rSt), the rightaccessory lobe bronchus (V), and the first three lateral bronchi of the left lung (1L1, 1L2, and1L3). b. Recovery of ventilation in 3 ROIs exhibiting distinct temporal dynamics. c. Recoveryof airway caliber in selected bronchi showing similar temporal dynamics, but different initialresponse.
Driehuys et al. Page 16
Magn Reson Med. Author manuscript; available in PMC 2009 September 17.
NIH
-PA Author Manuscript
NIH
-PA Author Manuscript
NIH
-PA Author Manuscript

NIH
-PA Author Manuscript
NIH
-PA Author Manuscript
NIH
-PA Author Manuscript
Driehuys et al. Page 17Ta
ble
1Su
mm
ary
of Im
agin
g R
esul
ts*
IDT
ype
Spec
ies
2D/3
DR
espo
nse
(%)
Nar
row
ing
1N
aive
BA
LB/c
J3D
21N
o
2N
aive
BA
LB/c
J3D
26N
o
3O
VA
BA
LB/c
J3D
43Y
es
4O
VA
BA
LB/c
J3D
51Y
es
5O
VA
BA
LB/c
J3D
24Y
es
6N
aive
C57
BL/
62D
36Y
es
7N
aive
C57
BL/
72D
42Y
es
8N
aive
C57
BL/
62D
21Y
es
9N
aive
C57
BL/
62D
20Y
es
* Ven
tilat
ion
was
redu
ced
afte
r MC
h ch
alle
nge
in a
ll an
imal
s, bo
th n
aive
and
ova
lbum
in-s
ensi
tized
. Tw
o ou
t of t
hree
sens
itize
d an
imal
s sho
wed
a m
easu
rabl
y la
rger
MC
h re
spon
se th
an n
aive
con
trols
.A
irway
nar
row
ing
afte
r MC
h w
as se
en in
all
imag
es, e
xcep
t the
3D
imag
es o
f nai
ve a
nim
als.
Magn Reson Med. Author manuscript; available in PMC 2009 September 17.