Predictability modulates motor–auditory interactions in self-triggered audio–visual apparent...
12
RESEARCH ARTICLE Predictability modulates motor–auditory interactions in self-triggered audio–visual apparent motion Mikhail Zvyagintsev Andrey R. Nikolaev Krystyna A. Mathiak Hans Menning Ingo Hertrich Klaus Mathiak Received: 9 September 2007 / Accepted: 6 May 2008 / Published online: 26 May 2008 Ó Springer-Verlag 2008 Abstract We studied an effect of predictability in an audio–visual apparent motion task using magnetoenceph- alography. The synchronous sequences of audio–visual stimuli were self-triggered by subjects. The task was to detect the direction of the apparent motion in experimental blocks in which the motion either started from the side selected by subjects (predictable condition) or was random (unpredictable condition). Magnetic fields yielded three patterns of activity in the motor, auditory, and visual areas. Comparison of the dipole strength between predictable and unpredictable conditions revealed a significant difference of the preparatory motor activity in the time interval from -450 to -100 ms before self-triggering the stimulus. Perception of the audio–visual apparent motion was also modulated by predictability. However, the modulation was found only for the auditory activity but not for the visual one. The effect of predictability was selective and modu- lated only the auditory component N1 (100 ms after stimulus), which reflects initial evaluation of stimulus meaning. Importantly, the preparatory motor activity cor- relates with the following auditory activity mainly in the same hemisphere. Similar modulation by predictability of the motor and auditory activities suggests interactions between these two systems within an action–perception cycle. The mechanism of these interactions can be under- stood as an effect of anticipation of the own action outcomes on the preparatory motor and perceptual activity. Keywords Magnetoencephalography Predictability Apparent motion Self-triggering Motor Auditory Visual systems Introduction Our response to environmental changes highly depends on how well we can anticipate them. An unpredictable event may bring vitally important information and should get priority in processing compared to a predictable event. Electronic supplementary material The online version of this article (doi:10.1007/s00221-008-1423-8) contains supplementary material, which is available to authorized users. M. Zvyagintsev (&) K. A. Mathiak K. Mathiak Department of Psychiatry and Psychotherapy, RWTH Aachen, Pauwelsstr. 30, 52074 Aachen, Germany e-mail: [email protected] M. Zvyagintsev Institute of Neuroscience and Biophysics, Research Center Ju ¨lich GmbH, 52425 Ju ¨lich, Germany A. R. Nikolaev Laboratory for Perceptual Dynamics, RIKEN Brain Science Institute, 2-1 Hirosawa, Wako 351-0198, Japan A. R. Nikolaev Institute of Higher Nervous Activity, Butlerov str. 5a, 117485 Moscow, Russia K. A. Mathiak Department of Psychology, University of Warsaw, ul. Stawki 5/7, 00-183 Warsaw, Poland H. Menning Department of Psychology, University of Zurich, Scheuchzerstr. 21, 8006 Zu ¨rich, Switzerland I. Hertrich Center for Neurology, University of Tu ¨bingen, Hoppe-Seyler-Str. 3, 72076 Tu ¨bingen, Germany K. Mathiak Institute of Psychiatry, King’s College London, De Crespigny Park, London SE5 8AF, UK 123 Exp Brain Res (2008) 189:289–300 DOI 10.1007/s00221-008-1423-8
-
Upload
rwth-aachen -
Category
Documents
-
view
0 -
download
0
Transcript of Predictability modulates motor–auditory interactions in self-triggered audio–visual apparent...

RESEARCH ARTICLE
Predictability modulates motor–auditory interactionsin self-triggered audio–visual apparent motion
Mikhail Zvyagintsev Æ Andrey R. Nikolaev ÆKrystyna A. Mathiak Æ Hans Menning Æ Ingo Hertrich ÆKlaus Mathiak
Received: 9 September 2007 / Accepted: 6 May 2008 / Published online: 26 May 2008
� Springer-Verlag 2008
Abstract We studied an effect of predictability in an
audio–visual apparent motion task using magnetoenceph-
alography. The synchronous sequences of audio–visual
stimuli were self-triggered by subjects. The task was to
detect the direction of the apparent motion in experimental
blocks in which the motion either started from the side
selected by subjects (predictable condition) or was random
(unpredictable condition). Magnetic fields yielded three
patterns of activity in the motor, auditory, and visual areas.
Comparison of the dipole strength between predictable and
unpredictable conditions revealed a significant difference
of the preparatory motor activity in the time interval from
-450 to -100 ms before self-triggering the stimulus.
Perception of the audio–visual apparent motion was also
modulated by predictability. However, the modulation was
found only for the auditory activity but not for the visual
one. The effect of predictability was selective and modu-
lated only the auditory component N1 (100 ms after
stimulus), which reflects initial evaluation of stimulus
meaning. Importantly, the preparatory motor activity cor-
relates with the following auditory activity mainly in the
same hemisphere. Similar modulation by predictability of
the motor and auditory activities suggests interactions
between these two systems within an action–perception
cycle. The mechanism of these interactions can be under-
stood as an effect of anticipation of the own action
outcomes on the preparatory motor and perceptual activity.
Keywords Magnetoencephalography � Predictability �Apparent motion � Self-triggering � Motor � Auditory �Visual systems
Introduction
Our response to environmental changes highly depends on
how well we can anticipate them. An unpredictable event
may bring vitally important information and should get
priority in processing compared to a predictable event.
Electronic supplementary material The online version of thisarticle (doi:10.1007/s00221-008-1423-8) contains supplementarymaterial, which is available to authorized users.
M. Zvyagintsev (&) � K. A. Mathiak � K. Mathiak
Department of Psychiatry and Psychotherapy, RWTH Aachen,
Pauwelsstr. 30, 52074 Aachen, Germany
e-mail: [email protected]
M. Zvyagintsev
Institute of Neuroscience and Biophysics, Research Center
Julich GmbH, 52425 Julich, Germany
A. R. Nikolaev
Laboratory for Perceptual Dynamics, RIKEN Brain Science
Institute, 2-1 Hirosawa, Wako 351-0198, Japan
A. R. Nikolaev
Institute of Higher Nervous Activity,
Butlerov str. 5a, 117485 Moscow, Russia
K. A. Mathiak
Department of Psychology, University of Warsaw,
ul. Stawki 5/7, 00-183 Warsaw, Poland
H. Menning
Department of Psychology, University of Zurich,
Scheuchzerstr. 21, 8006 Zurich, Switzerland
I. Hertrich
Center for Neurology, University of Tubingen,
Hoppe-Seyler-Str. 3, 72076 Tubingen, Germany
K. Mathiak
Institute of Psychiatry, King’s College London,
De Crespigny Park, London SE5 8AF, UK
123
Exp Brain Res (2008) 189:289–300
DOI 10.1007/s00221-008-1423-8

Predictable and unpredictable events differ in their per-
ception, as well as in corresponding motor response. For
example, activity of the pre-motor and supplementary
motor areas reflects predictability of the externally trig-
gered movements (Dassonville et al. 1998; Berndt et al.
2002). Predictability of tracking tactile stimuli was found
to be reflected in the joint activation of the somatosensory
and frontal motor regions evidencing for the interactions
between sensory and motor systems (Nelson et al. 2004).
The common finding in these studies is an increased brain
activation associated with unpredictable stimulation in
comparison with the predictable one.
Unequal predictability may be a reason of difference
between perceptual consequences of externally and self-
produced actions. Both behavioral and electroencephalog-
raphy (EEG)/magnetoencephalography (MEG) studies
showed that the brain responds weaker to the self-produced
than to the external stimuli. For example, Blakemore et al.
(2000) found that tickling oneself is felt less intensively
compared to being tickled by somebody else. Schafer and
Marcus (1973) showed that cortical potentials evoked by
self-produced tones have significantly smaller amplitudes
than those produced externally. Neuromagnetic response to
one’s own speech was smaller than to the same recorded
utterances (Curio et al. 2000). Martikainen et al. (2005)
observed that the amplitude of the auditory N1 MEG
response was weaker when a tone was self-triggered than
when the same tone was listened to passively. Interestingly,
if the self-produced stimuli are rare enough, i.e. become
unpredicted, the brain response can increase overriding the
external stimulation: the amplitude of the ERP component
P3 evoked by the rare deviant target was higher during self-
triggered stimulation in comparison with the external one
(McCarthy and Donchin 1976; Nittono and Ullsperger
2000, Nittono 2006).
The factors of predictability and whether perceptual
events occur in consequence of self-generated actions can
be dissociated. In a PET study Blakemore et al. (1998)
observed an interaction between predictability and self-
produced action in cingulate cortex, insula, thalamus, and
right temporal cortex and concluded that the detection of
predictable events and detection of self-produced actions
are functionally distinct processes. However, this study
cannot show temporal relationship of interactions between
motor and perceptual systems because of low temporal
resolution of PET.
In the current work, we study time course of the pre-
dictability effect on the motor and perceptual activity
during self-produced stimulation using MEG. We manip-
ulated the probability of stimulus appearance from the side
of a button press which triggered a stimulus: the stimuli
might appear at this side with 100% (predictable condi-
tion) or with 50% (unpredictable condition) probability.
The first aim of the current study was to reveal how the
predictability affects the motor preparation to self-trig-
gering and subsequent perception of the self-triggered
stimuli.
Another goal of our study was to evaluate the effect of
predictability on integration of the auditory and visual
stimuli during audio–visual apparent motion. For this aim,
we used a combined audio–visual stimulation which led to
an apparent motion illusion. Previously it was found that
the direction of the visual motion in the bimodal audio–
visual stimulation can affect the direction of the auditory
motion, but not vice versa (Allen and Kolers 1981;
Mateeff et al. 1985; Ohmura 1987; Soto-Faraco et al.
2002, 2004; Strybel and Vatakis 2004). Such visual
dominance in detection of motion direction is evidence for
asymmetry between the auditory and the visual modalities
in the audio–visual apparent motion. This asymmetry
originates from integration of modalities. Predictability
may separately affect the visual and auditory modalities
(Johnson and Shapiro 1989), but it is not clear whether
this factor modulates them after integration. Thus, the
second aim of our study was to figure out whether the
predictability would change the auditory and visual
modalities after their integration in audio–visual apparent
motion.
Materials and methods
Subjects
Twenty paid healthy subjects (age range 22–36 years, mean
age 27.1; 12 females) participated in the study. All the
subjects were right-handed, had no audiological abnor-
malities, and had normal or corrected-to-normal vision.
Written informed consent was obtained from all subjects
prior to participation in the study. The study was approved
by the ethics committee of the University of Tubingen.
Visual stimuli
We combined auditory and visual stimuli to elicit the
audio–visual apparent motion illusion. The visual stimuli
were prepared and presented using MATLAB 6.5 software
(The MathWorks, Natick, MA) and the Psychophysics
toolbox for MATLAB. The visual stimuli were two white
1� circles back-projected on the screen at the distance
0.8 m from the subject (Fig. 1). The stimuli were located
on horizontal with the distance of 15� of visual angle at
either side of the screen center. The apparent motion illu-
sion was elicited by presenting the stimuli for 67 ms at the
one side and then after 67 ms delay—for 67 ms at the
opposite side.
290 Exp Brain Res (2008) 189:289–300
123
Auditory stimuli
Auditory stimuli were presented to both ears using an
Enhanced Digital Sound Processor RX2 (Tucker-Davis
Technologies, TDTTM
, Alachua, FL) at 70 dB SPL via non-
magnetic air-conducting plastic tubes (E-A-R-tone 3A,
Cabot Safety Corporation, Indianapolis, IN).
The auditory stimuli were the white noise bursts pro-
cessed in such a way that the sound was spatially perceived
at the position of the visual stimuli (+15� and -15�). For
this aim the bursts were, first, convoluted with spatial
impulse responses using individualized head-related
transfer functions (Algazi et al. 2001). We applied ear
models that represented the head-related impulse response
(HRIR) which was recorded with spatial resolution of 15�horizontal and 10� vertical (Djelani et al. 2000). We chose
the most appropriate ear model individually for each sub-
ject by testing his(her) perception of the virtual auditory
locations as follows: for each subject we presented a set of
100-ms long sounds that were generated by convolution of
HRIRs of each head models obtained by Djelani et al.
(2000) and white noise. As HRIR we used responses
obtained from 24 positions with each of 15� horizontal at
0� vertical. Subjects were asked to locate the perceived
sound on the monitor screen. We selected the ear model for
which the tested angles were recognized maximally cor-
rectly (the mean correct recognition rate across subjects
was 79 ± 6% SD). Second, using a ‘‘shoebox’’ room
simulation, we created an echo train to make an effect of
external sound, as we did in the previous experiments
(Mathiak et al. 2003). We located two virtual sound sour-
ces in such a way that the noise bursts were perceived as
originating from one of the two locations corresponding to
the visual stimuli. The onset of the auditory and visual
stimuli was synchronized using Psychophysics toolbox.
The measured jitter of the onset of auditory and visual
stimuli was strictly less than 2 ms. Sound duration was
67 ms (including 5 ms rise and fall times), that is the same
as duration of the visual stimuli.
Procedure
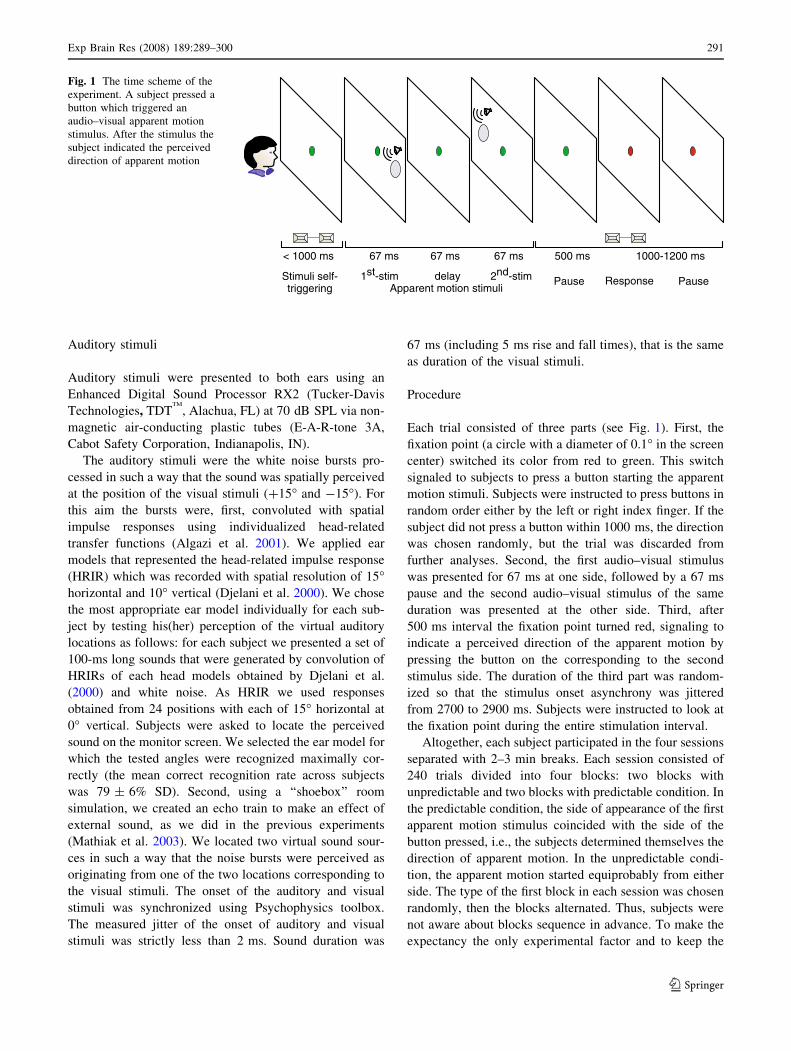
Each trial consisted of three parts (see Fig. 1). First, the
fixation point (a circle with a diameter of 0.1� in the screen
center) switched its color from red to green. This switch
signaled to subjects to press a button starting the apparent
motion stimuli. Subjects were instructed to press buttons in
random order either by the left or right index finger. If the
subject did not press a button within 1000 ms, the direction
was chosen randomly, but the trial was discarded from
further analyses. Second, the first audio–visual stimulus
was presented for 67 ms at one side, followed by a 67 ms
pause and the second audio–visual stimulus of the same
duration was presented at the other side. Third, after
500 ms interval the fixation point turned red, signaling to
indicate a perceived direction of the apparent motion by
pressing the button on the corresponding to the second
stimulus side. The duration of the third part was random-
ized so that the stimulus onset asynchrony was jittered
from 2700 to 2900 ms. Subjects were instructed to look at
the fixation point during the entire stimulation interval.
Altogether, each subject participated in the four sessions
separated with 2–3 min breaks. Each session consisted of
240 trials divided into four blocks: two blocks with
unpredictable and two blocks with predictable condition. In
the predictable condition, the side of appearance of the first
apparent motion stimulus coincided with the side of the
button pressed, i.e., the subjects determined themselves the
direction of apparent motion. In the unpredictable condi-
tion, the apparent motion started equiprobably from either
side. The type of the first block in each session was chosen
randomly, then the blocks alternated. Thus, subjects were
not aware about blocks sequence in advance. To make the
expectancy the only experimental factor and to keep the
Stimuli self-triggering
1st-stim delay 2nd-stimApparent motion stimuli
ResponsePause
< 1000 ms 67 ms 67 ms 67 ms 1000-1200 ms500 ms
Pause
Fig. 1 The time scheme of the
experiment. A subject pressed a
button which triggered an
audio–visual apparent motion
stimulus. After the stimulus the
subject indicated the perceived
direction of apparent motion
Exp Brain Res (2008) 189:289–300 291
123

physical properties of stimulation in predictable and
unpredictable conditions identical, we applied further
analyses only on the trials in which the side of first stimulus
coincided with the button pressed: all trials in the
predictable and approximately half of trials in the unpre-
dictable condition. To compensate the lack of such trials in
the unpredictable condition the amount of trials in the
unpredictable and predictable blocks was unequal (70 and
50 trials, respectively).
MEG recording
Neuromagnetic responses were recorded in a magnetically
shielded booth using a 151-sensors whole-head gradiome-
ter (CTF Systems Inc., Vancouver, Canada). Measurements
were performed in a sitting position of the subjects. The
MEG signals were sampled at 312.5 Hz.
Data processing
MEG data were band-pass filtered at 0.1–25 Hz. The data
were segmented into epochs 1400 ms long: -800 ms
before and 600 ms after the onset of the first audio–visual
stimulus. Baseline correction was done relative to the
interval between -800 and -500 ms before the onset of
the first stimulus to ensure the use of the interval preceded
the preparatory motor activity.1 Trials containing artifacts
due to eye blinks (criterion: eye dipole moment[80 nAm)
were discarded in an automatic procedure. We analyzed the
data using custom software in MATLAB 6.5.
As we mentioned earlier, we used in the analysis only
those trials which were in agreement with the two criteria:
(1) the first button was pressed timely (i.e., within
1000 ms) and (2) the first stimulus was at the same side as
the button pressed: all trials in the predictable condition
and approximately half of trials in the unpredictable one.
Moreover, we excluded the first 10 trials of each block, as
according to the subject’s reports it took them about 10
trials to realize that they may control the motion direction
in this block. The data for each subject were separately
averaged relative to the first stimulus onset for the pre-
dictable and the unpredictable conditions, as well as left
and right sides of the first stimulus appearance.
Dipole pattern and fitting
Grand average of the magnetic field revealed three con-
sistent dipole patterns in the time interval from -20 to
180 ms after the first stimulus onset. The first pattern (from
-20 to 40 ms) reflected motor activity due to the button
press. The activity was consistent with the right motor area
for conditions with the left button press and in the left
motor area for conditions with the right button press (Fig. 2
upper panels). The second pattern (from 50 to 110 ms)
represented bilateral auditory activity (Fig. 2, middle
panels). The third pattern (from 120 to 180 ms) reflected
the activity in the right visual cortex when the first stimulus
was at the left side (left-to-right motion) and in the left
visual area when the first stimulus was at the right side
(right-to-left motion; Fig. 2, lower panels).
The sources of neuromagnetic activity were modeled as
equivalent current dipoles. Dipole fitting was performed as
follows: first, we calculated reference position and direc-
tion of the motor, auditory, and visual dipoles based on
grand averages. To that end, magnetic fields were averaged
over time in the corresponding intervals (from -20 to
40 ms for motor, from 50 to 110 ms for auditory, and from
120 to 180 ms for visual dipole). Then, to reduce outliers’
effect of distant sensors, we selected 35–80 sensors for
dipole fitting. The semiautomatic sensor selection included
two parts: the automatic procedure selected the sensors
which had the amplitude not lower than 75% of maximal
amplitude; then, we manually adjusted the selection by
choosing the sensors located over each dipolar pattern
Left-to-Right motionRight-to-Left motion
ytivitcaroto
Ms
m04
–02-
ytivitcayrotidu
As
m011
–05
ytivitcalausiV
sm
081–
021
150
75
0
-75
-150
fT
100
50
0
-50
-100
fT
200
100
0
-100
-200
fT
Fig. 2 Grand averaged maps of magnetic activity within specified
time windows. The upper panel shows magnetic activity in the
interval -20 to +40 ms relative to the triggering button press and the
first stimulus onset. The dipole in the motor areas explains the major
part of the field variance. The middle panel shows magnetic activity
in the interval 50-110 ms after the first stimulus onset. The dipole in
the auditory areas explains the major part of the field variance. The
lower panel shows magnetic activity in the interval 120–180 ms after
the first stimulus onset. The dipole in the visual areas explains the
major part of the field variance. The sensors selected for the dipole
fitting are marked
1 See Electronic supplementary material for the control of the
baseline interval selection.
292 Exp Brain Res (2008) 189:289–300
123

(Fig. 2; for the similar procedures, see Curio et al. 2000,
Martikainen et al. 2005).
Fitting the auditory dipoles was performed in the
average of all conditions (motion from left-to-right and
from right-to-left, predictable and unpredictable) together.
Dipole fitting for the motor and visual activities was
performed in the averages for the right and left dipoles
separately. Since different modalities manifested their
activity in different time intervals and motor and visual
activities precisely lateralized the source model used for
dipole fitting that included a single dipole model for motor
and visual activities and two dipoles model for auditory
activity. We applied the standard spherical head model for
the source localization.
Second, the obtained dipole positions and directions
were used as starting points for dipole fitting individual
MEG data. The procedure was performed similar to fitting
on grand averages. The obtained dipoles were projected on
individual MRI (see Fig. 3). Then we calculated dipole
moments in the respective areas during the entire time
interval and based on all sensors. We used spatio-temporal
dipole model proposed by Scherg and Von Cramon (1985).
For the subjects with low explained variance values the
calculation was based on the dipoles’ positions and direc-
tions obtained from dipole fitting in the grand averages.
Since the audio–visual stimuli were applied at both sides,
but the motor activity occurred only on one side, in the
conditions with the left-to-right motion (left button was
pressed) the dipole model included two auditory, two
visual, and the right motor dipoles; in the conditions with
the right-to-left motion (right button was pressed), the
dipole model contained two auditory, two visual, and the
left motor dipole. We calculated dipole moments for each
subject. Then we filtered the obtained auditory and visual
dipole moments using 3–25 Hz band-pass filter. Motor
activity was filtered using two different filter ranges: the
preparatory activity before button press was band-pass
filtered in 0.1–7 Hz, in the same way as in EEG readiness
potential (RP) studies (see below), and the activity after
button press was band-pass filtered in 3–25 Hz, similarly to
filtering the activity in other modalities2 (see Fig. 4a, b).
The time course of the motor, auditory, and visual
source activities was reflected in the dipole strength curves
(Fig. 4). The curves represent activity contralateral to the
stimulus for the motor and the visual dipoles and contra-
lateral and ipsilateral for the auditory dipole.
Motor dipole strength
We analyzed the preparatory motor dipole moment in the
interval from -5503 to -100 ms (Fig. 5a). The ramp-like
shape and time course of this wave (Fig. 4a) suggests that it
is an MEG analog of EEG readiness potential (Kornhuber
and Deecke 1965). We divided this wave into ten 50-ms
windows and estimated weighted mean amplitude within
each window. Then the amplitude in each window was
averaged across the left-to-right and the right-to-left
motions, excluding the factor of motion direction from the
further analysis.
The curves representing the strength of the motor dipole
after the button press are shown in Fig. 4b. The dipole
moment disclosed two peaks. The first negative peak was
found about the point of the first stimulus onset—it was
marked as M0. Its minimal amplitude and its latency were
measured in the time window from -20 to 40 ms. The
second positive peak emerging at about 100 ms after the
first stimulus onset was marked as M100 and was measured
in the time window from 70 to 120 ms. We estimated both
Fig. 3 Location and orientation of motor (pink, the leftmost map), auditory (green, two central maps) and visual (red, the rightmost map) dipoles
projected on individual MRI of one representative subject
2 The obtained motor activity was used in the control analysis of
possible propagation of activity between the auditory and motor
dipoles which were located close to each other (see Results).3 Here and below all the latencies are given relatively presentation of
the first stimulus.
Exp Brain Res (2008) 189:289–300 293
123

the peaks at sides contralateral to the pressed button. We
averaged the amplitude and latency of each peak across the
left-to-right and the right-to-left motions, excluding the
factor of motion direction from the further analysis.
Auditory dipole strength
The auditory dipole revealed two sequential pairs of peaks:
the first pair was evoked by the first stimulus and the
second pair of peaks resulted from the activity evoked by
the second stimulus overlapped with the tail of the activity
evoked by the first stimulus (Fig. 4c). Therefore, we used a
prime to mark the second pair of peaks. We marked the
first pair of peaks P50 (in the 50–80 ms) and N1 (90–
130 ms) and the second pair of peaks P500 (180–230 ms)
and N10 (230–280 ms). For each of the four peaks, we
measured the maximal amplitude and the latency for right
and left auditory dipoles, right-to-left and left-to-right
apparent motion directions, and predictable and unpre-
dictable conditions. Then for each dipole side, we averaged
amplitude and latency of each peak across the left-to-right
and the right-to-left motion directions obtaining the activ-
ities in contralateral and ipsilateral sides in relation to the
first stimulus appearance.
Visual dipole strength
The dipole moments of the visual dipoles revealed three
pairs of peaks—each three peaks in contralateral and
ipsilateral hemispheres in relation to the first stimulus
appearance (Fig. 4d). We marked the peaks in the same
manner as the auditory ones: related to the first stimulus
N75 (in the 60–90 ms time interval), P1 (90–120 ms),
N145 (130–160 ms) and related to the second stimulus
N750 (180–230 ms), P10 (210–260 ms), N1450 (260–
310 ms). We measured amplitudes and latency for each
peak for the right-to-left and left-to-right motion directions
for the predictable and the unpredictable conditions. Then,
we averaged the amplitudes and the latencies of each peak
across the right-to-left and the left-to-right motion direc-
tions obtaining the activities in contralateral and ipsilateral
sides in relation to the first stimulus appearance (Fig. 4d).
For statistical evaluation of amplitude and latency, we
used a repeated-measures analysis of variance (ANOVA).
Fisher’s least significant difference (LSD) test was applied
for the post hoc analyses. Statistical analysis was per-
formed using SPSS 12.0 software (SPSS Inc., Chicago, IL).
We quantified localization accuracy of dipole fitting
using a crosstalk metric (Liu et al. 1998). The crosstalk
metric estimates how the activity at the current location
depends on the activity at other locations. We calculated
the crosstalk value according to the formula:
time [ms]
Mot
orac
tivity
dipo
lem
omen
t [nA
m]
dipo
lem
omen
t [nA
m]
dipo
lem
omen
t [nA
m]
Aud
itory
activ
ityV
isua
lac
tivity
predictable contralateral unpredictable contralateral
predictable ipsilateral unpredictable ipsilateral
M100
P50
N1
P50’
N1’
N75
P1
N145
N75’
P1’
N145’
M0
Mot
orac
tivity
dipo
lem
omen
t[n
Am
]RP
predictable unpredictable
predictable unpredictable
a
b
c
d
Fig. 4 Grand averaged dipole strength of preparatory motor activity
(a), motor activity after button press (b), auditory (c), and visual (d)
dipoles. The red lines indicate the temporal position of the first and
the second stimuli. All evoked components under study are marked.
The laterality of auditory (c) and visual (d) components is considered
relatively to the first stimulus
294 Exp Brain Res (2008) 189:289–300
123

n2ij ¼jwiajj2
jwiaij2; ð1Þ
where wi represents linear inverse estimator of dipole i, ai
represents a leadfield matrix of dipole i. A crosstalk value
of 0% means that the estimated activity at one location is
completely insensitive to activity at another location. A
crosstalk value of 100% means that the activity at one
location is equally sensitive to activity at this location and
another location. We estimated crosstalk between all pairs
of six dipoles in each subject. Thereto, we located the
dipoles on individual head models. Then we simulated the
activity of each dipole with elementary dipole moment and
projected it onto the remaining five dipoles according to the
formula (1). The dipole crosstalk values obtained for each
were averaged between subjects. We also evaluated the
distance between all pairs of the dipoles.
Results
All subjects reported that they perceived the presented
stimuli as an audio–visual apparent motion. The direction
of the motion was detected correctly in 86.7 and 83.7% of
the predictable and unpredictable trials, respectively, that is
more often in the predictable than in the unpredictable con-
dition (Mann–Whitney U test: Z value = 4.66, P \ 0.01).
Moreover, the detection of the motion direction in the
predictable condition was significantly faster than during
the unpredictable one [856 ms (SEM = 5 ms) vs. 924 ms
(SEM = 6 ms); Z = 8.76, P \ 0.01].
Triggering the stimulus and the apparent motion illusion
emerged the sequential activation of the brain areas as follows:
• In the time window from 20 ms before to 40 ms after
the first stimulus onset we observed the neuromagnetic
activity at in the contralateral to the pressed button
motor areas (Fig. 2, upper panels). In grand averages,
the single dipole model explained 95 and 97% of the
field variance across the selected sensors for the left-to-
right (right motor dipole) and the right-to-left (left
motor dipole) conditions, respectively. In the data of 19
subjects, the motor dipole explained always more than
85% of variances (Fig. 3). Only in one subject the
explained variance was lower (48%).
• In the time window 50–110 ms, we found the expected
pattern of auditory evoked fields (Fig. 2, middle
panels). Two dipoles explained 97% of the field
variance across the selected sensors (Fig. 3). In indi-
vidual data of 16 subjects, the explained variances were
always higher than 75%. In the other four subjects, the
mean of explained variances was 54% (SD ± 7%).
• In the time window 120–180 ms, the topographical
distribution of the activity for the left-to-right and
the right-to-left apparent motion was in accordance
with the right and the left sources in the occipital
areas, respectively (Fig. 2, lower panels). The dipole
explained 93 and 95% of field variance across the
selected channels for the left-to-right and the right-to-
left conditions, respectively (Fig. 3). In individual data
of 14 subjects, the explained variances were always
higher than 75%. In the other six subjects, the mean of
explained variances was 57% (SD ± 9%).
In the motor dipole moment, we observed three compo-
nents: RP, M0, M100 (Fig. 4a, b). To compare time course
of RP in the predictable and unpredictable conditions we
applied a repeated-measures ANOVA on the RP amplitude
with factors of predictability (two levels: predictable vs.
unpredictable) and time window (10 levels) from –550 to
-100 ms. ANOVA revealed significant effects of predict-
ability (F1,19 = 10.7, P \ 0.01) and time window
time windows ms[ ]
dipo
lem
omen
t [nA
m]
predictable
unpredictable
unpredictablepredictable
contralateral N1
contralateral N1’
ipsilateral N 1
ipsilateral N 1’
dipo
lem
omen
t[n
Am
]
**
* **
* *
*
*
*
**
*
*
a bFig. 5 a The mean (±SEM)
amplitudes of preparatory motor
activity in ten 50-ms time
windows from -550 to
-100 ms before the stimulus
onset. b The mean (±SEM)
amplitude of the N1 and N10
components of the contralateral
and the ipsilateral auditory
response for the predictable and
the unpredictable conditions.
*P \ 0.05, **P \ 0.01
Exp Brain Res (2008) 189:289–300 295
123

(F9,171 = 13.1, P \ 0.001, Huynh–Feldt e = 0.26). The
interaction was not significant (F9,171 = 2.1, P [ 0.1,
Huynh–Feldt e = 0.53). Post hoc LSD test revealed that
the difference between the predictable and unpredictable
conditions was significant from -450 ms and lasted until
-100 ms relative to the button press (Fig. 5a).
To be sure that the baseline interval (-800 to -500 ms),
which might include the early phase of RP (Kristeva et al.
1991), does not differ between conditions, we made a
control analysis of the preparatory motor activity using as a
baseline the interval -1000 to -900 ms (see Electronic
supplementary material and Fig. S1 for details). We found
that the time course of the difference between the pre-
dictable and unpredictable conditions remained to be the
same as in the analysis described earlier. This evidences
that the baseline interval (-800 to -500 ms) does not
contain the differential activity which could affect the
observed differences between the conditions.
The components M0 and M100 reflect the executive
stage of the motor activity and exhibit a similar latency as
the auditory components P50 and N1. The mean amplitude
and the latency of M0 and M100 are given in Table 1. We
evaluated an effect of predictability on the M0 and M100
motor components. A repeated-measures ANOVA with
factor of predictability (predictable vs. unpredictable) did
not show any significant difference between the predictable
and unpredictable conditions in both the amplitude and the
latency of these components (F1,19 always less than 1.7,
P [ 0.1). This evidences that predictability modulating the
preparatory motor activity does not effect on the execution
of the motor program. Moreover, taking into account the
predictability effect found in the post-stimulus interval in
the auditory domain (described later) this suggests inde-
pendence of auditory and motor activities.4
The auditory dipole moments revealed P50 and N1
components to the first and second apparent motion stimuli.
These components emerged in both the contralateral and
ipsilateral to the stimulus hemispheres (Fig. 4c). Their
mean amplitudes and latencies are given in Table 2. A
2 9 2 repeated-measures ANOVA evaluated the effect of
predictability (predictable vs. unpredictable) and the effect
of laterality (contralateral vs. ipsilateral) for each compo-
nent. For the N1 amplitude, we found the effect of
predictability (F1,19 = 6.8, P \ 0.05) with more negative
amplitude in the unpredictable than predictable condition
and the near significant effect of laterality (F1,19 = 4.2,
P = 0.06) with larger amplitude in ipsilateral than the
contralateral side. Interestingly, the interaction between the
factors was highly significant (F1,19 = 16.3, P \ 0.01).
The post hoc LSD test revealed that the predictability
effect was prominent only in the contralateral to the first
stimulus side (P \ 0.001). For the N10 component, we also
found the significant effect of predictability (F1,19 = 15.7,
P \ 0.01) with larger amplitude in the unpredictable than
predictable condition; however, for this component the
effect was observed for both the ipsilateral and contralat-
eral activities (Fig. 5b). Latency of the components was not
influenced by either laterality or predictability (F1,19
always less than 2.3, P [ 0.1).
The time course of the visual dipole moments exhibited
N75, P1, and N145 components in the hemisphere con-
tralateral to each stimulus onset side (Fig. 4d). The mean
values of the amplitude and the latency of the visual
components are presented in Table 3. Predictability did not
influence the amplitude of the visual components (F1,19
always less than 2.1, P [ 0.1). The only significant effect
of the predictability was found on the latency of N145
component: it emerged earlier in the unpredictable condi-
tion (F1,19 = 4.39, P \ 0.05).
The predictability effect found for both the auditory and
the motor activities suggests a systematic relationship. To
further investigate this issue we correlated the differences
(predictable minus unpredictable) between the amplitude
of the RP and two auditory peaks N1 and N10 in the pre-
dictable and the unpredictable conditions (DRP vs. DN1
and DRP vs. DN10). We considered DRP on the side con-
tralateral to the first stimulus onset for 10 time intervals
within the time window from -550 to -100 ms, with
interval duration 50 ms. The DN1 and DN10 differences
were considered in both contralateral and ipsilateral sides.
In each time interval, we computed Pearson correlation
coefficient between DN1 (DN10) and DRP. We found sig-
nificant positive correlations for both DN1 and DN10 on the
side contralateral to the first stimulus within time intervals
-300 to -150 ms (r [ 0.45, P \ 0.05) (except -200 ms;
Fig. 6). Correlation of the DRP and DN10 on the ipsilateral
side was significant in the time interval -100 ms before
the button press. Correlation of the DRP and DN1 on the
ipsilateral side was not significant. Thus, we found that the
effect of predictability was accompanied with selective
correlations between activities in auditory and motor
domains.
Table 1 Mean amplitude and latency (±SEM) of M0 and M100
motor components
Amplitude [nAm] Latency (ms)
P U P U
M0 -7.1 ± 0.8 -7.2 ± 0.8 23 ± 2 22 ± 2
M100 8.9 ± 0.7 9.2 ± 0.8 123 ± 4 122 ± 3
Statistical analysis did not show any influence of predictability on the
amplitude and the latency of these components
P predictable, U, unpredictable conditions
4 The absence of propagation of activity between auditory and motor
dipoles was also confirmed by evaluation of crosstalk (Table S1).
296 Exp Brain Res (2008) 189:289–300
123

Crosstalk between each pair of dipoles did not exceed
35% (Table S1). The distance between the dipoles was
always larger than 40 mm which evidences for the good
spatial source separation (Fujimaki et al. 2002). Taking
into account that the timing of preparatory motor activity
and auditory components was different (see Fig. 4) it is
unlikely that the correlation between preparatory motor and
auditory activity was influenced by a propagation of
activity between auditory and motor areas. In the post-
stimulus interval the interaction between motor M100 and
auditory N1 components could not be excluded, however,
we found no evidence of influence of predictability on the
M100 (see earlier).
Discussion
Our study demonstrates how predictability effects on the
motor preparation to stimulus self-triggering and on the
following perception of an audio–visual apparent motion.
We found that predictability modulated the motor and
auditory but not visual activity. The preparatory motor
Table 3 The mean of the amplitudes and the latencies (±SEM) of
the visual components
Amplitude (nAm) Latency (ms)
P U P U
N75 -0.3 ± 0.1 -0.3 ± 0.1 60 ± 2 58 ± 1
P1 1.0 ± 0.1 1.0 ± 0.2 101 ± 2 102 ± 2
N145 -1.2 ± 0.2 -1.2 ± 0.2 151 ± 3 146 ± 2
N750 -0.7 ± 0.2 -0.8 ± 0.2 196 ± 5 199 ± 4
P10 1.3 ± 0.2 1.3 ± 0.2 235 ± 6 234 ± 5
N1450 -1.4 ± 0.2 -1.4 ± 0.2 278 ± 7 277 ± 6
Statistically significant difference between predictable and unpre-
dictable conditions is marked bold
P predictable, U unpredictable conditions
∆N1
Con
tral
ater
alco
rrel
atio
n
Ipsi
late
ral
corr
elat
ion
time windows [ms] time windows [ms]
∆N1′Fig. 6 Correlation coefficients
between DRP and DN1 (DN10)in time windows from -550 to
-100 ms. DN1 and DN10 are
derived from the contralateral
and ipsilateral side relative to
the stimulus onset. DRP is
derived only from the
contralateral side. The asterisksindicate the significance of the
correlations: *P \ 0.05,
**P \ 0.01
Table 2 Mean amplitude and latency (±SEM) of auditory components for the contra- and ipsilateral activity
Contralateral activity Ipsilateral activity
Amplitude (nAm) Latency (ms) Amplitude (nAm) Latency (ms)
P U P U P U P U
P50 9.5 ± 1.0 8.8 ± 1.0 65 ± 2 68 ± 2 10.4 ± 1.1 10.1 ± 1.0 66 ± 2 68 ± 3
N1 -12.8 ± 1.4 -14.9 ± 1.5 111 ± 3 110 ± 3 -15.6 ± 1.5 -15.4 ± 1.7 109 ± 3 111 ± 3
P500 12.4 ± 1.1 13.2 ± 1.5 180 ± 5 180 ± 4 11.0 ± 1.0 11.6 ± 1.1 185 ± 5 184 ± 5
N10 -11.3 ± 1.3 -12.6 ± 1.4 242 ± 6 239 ± 5 -10.9 ± 1.0 -12.2 ± 1.0 249±6 251 ± 6
P50 and N1 components evoked by the first stimulus and P500 and N10 by the second stimulus
Statistically significant difference between predictable and unpredictable conditions is marked bold
P predictable, U unpredictable conditions
Exp Brain Res (2008) 189:289–300 297
123

component (‘RP’) was affected within the time interval
from -450 to -100 ms before button press triggering the
stimulus. Analyzing the components related to perception
of the audio–visual apparent motion we found larger
amplitude in the unpredictable than predictable conditions
in accordance with the previous studies (Schafer and
Marcus 1973; Curio et al. 2000; Martikainen et al. 2005).
This predictability effect was found for the auditory com-
ponent N1 (100 ms): for N1 evoked by the first event of the
apparent motion sequence the effect was observed on the
side contralateral to the stimulus appearance, whereas for
N10 evoked by the second event the effect was observed on
both sides. The predictable–unpredictable difference of the
N1 and N10 correlated with that of the preparatory motor
activity before the button press. The correlation was more
prominent on the side contralateral to the stimulus
appearance. These findings suggest that predictability
mediates interactions between auditory and motor systems
in self-triggered stimulation.
Self-triggering of apparent motion
Predictability affected the amplitude of the preparatory
motor component (an analog of EEG ‘RP’) on the side
contralateral to the pressed button in the time interval from
-450 to -100 ms. From EEG RP studies it is known that
more negative amplitude of the RP is the evidence for more
effortful preparation process (Deecke 1996). But we cannot
extrapolate this fact to our preparatory motor component as
MEG measures the tangential component of the source,
whereas EEG picks its radial component, and therefore the
comparison of MEG and EEG polarity is problematic.
However, this leaves intact our finding that the predictable
and unpredictable conditions differ already in motor
preparation.
Despite that the predictable and unpredictable conditions
were presented in the separate blocks, the effect of pre-
dictability on the RP was observed only in the limited time
interval -450 to -100 ms. The predictability had no effect
on the motor components M0 and M100 that accompanied
the execution of the button press. This suggests that the
predictability information becomes relevant for the motor
system right before movement execution and does not
constitute a constant background shift of the motor activity.
Perception of apparent motion
The effect of predictability on the perception of apparent
motion appeared to be highly selective: we observed it only
on the auditory peak N1, but neither on another auditory
peak nor on the visual activity. Therefore, it is unlikely that
the predictability is a general factor which steadily shifted
the level of excitability of the brain systems in our blocked
design. The predictability rather modulates certain percep-
tual stages crucial for evaluation of stimulus meaning. This
idea is supported by the fact that predictability has no effect
on the early sensory P50 components evoked by both the
first and second auditory events, but its effect starts from the
N1 component which is ‘‘flanked’’ by P50 components
related to the first and second events. The latency of the N1
component is 100 ms or higher, which is sufficient for
initial evaluation of meaning of the auditory stimulus
(Naatanen and Picton 1987). Moreover, it was shown that
the brain activity starting from about 100 ms may be
modulated by top–down influences, e.g., attention (Hillyard
et al. 1998). This suggests that predictability modulates the
activity of the auditory cortex in top–down manner.
The absence of the predictability effect on the visual
activity in our study may be explained by asymmetry of the
multisensory interactions in perception of apparent motion
direction. The dominance of the visual motion information
over the auditory one in perception of motion direction in
multisensory apparent motion was repeatedly reported
(Allen and Kolers 1981; Mateeff et al. 1985; Ohmura 1987;
Soto-Faraco et al. 2004; Strybel and Vatakis 2004). This
dominance is especially prominent when the visual and
auditory information exactly coincides spatially and is
synchronized temporally (Soto-Faraco et al. 2002), i.e.,
when the audio–visual integration is facilitated, that was
the case in our study. The visual dominance in perception
of motion direction is explained by the higher accuracy of
vision in detection of spatial attributes in comparison with
audition (Soto-Faraco et al. 2004). Thus, we may conclude
that the audio–visual integration makes the visual compo-
nent of the apparent motion more robust against influence
of external factors, such as predictability.
Motor–auditory interaction
The effect of predictability was initially observed on the
motor activity between -450 and-100 ms before stimulus
triggering; then, about 200 ms later on the auditory com-
ponents N1 for the first stimulus and again after some
delay, on the N10 for the second stimulus. These changes
were limited topographically: the effect of predictability on
the auditory N1 after first stimulus was observed only on
the contralateral to the stimulus side. This side corresponds
to the motor area, which participated in triggering the
stimulus. This evidences that predictability affects the
auditory and motor systems within the same brain hemi-
sphere. We also found that the differences between the
predictable and unpredictable conditions for the motor and
auditory activity were correlated. The correlations of the
motor activity with auditory component N1 evoked by the
first and second stimuli were also mainly observed con-
tralateral to the stimulus (Fig. 6). Such correlations limited
298 Exp Brain Res (2008) 189:289–300
123

to one hemisphere suggest interactions of motor and
auditory systems during the preparation and the perception
of outcomes of self-generated actions. These interactions
may be either direct projections from the motor to the
sensory system or be driven by other high-order brain
mechanisms, such as anticipation (see later).
The difference between sensory outcomes of self-gen-
erated vs. external actions is often explained by an internal
forward model (Wolpert 1997; Blackmore and Decety
2001; Martikainen et al. 2005). Our results can be only
partially modeled in terms of this concept as follows: in the
predictable condition the forward model is built, which
accounts an intention to launch the stimulus from a certain
side. The model predicts the sensory consequences of the
movements. The prediction is then compared with the actual
consequences of the motor act to determine the source of
sensory events. The correct prediction in the predictable
condition attenuates the response of the auditory system. In
the unpredictable condition such a forward model is not
built. Therefore, the auditory response is not attenuated.
However, the internal forward model cannot embrace all
of our results: in our experiment predictability also affected
the preparatory motor activity in the interval -450 to
-100 ms before self-triggering. It cannot be explained by
the forward model which accounts for the causal relation-
ship only between actions and their outcomes. The
predictability-related changes of the preparatory motor
activity might have resulted from anticipation of action
outcomes. In our study we used block design in which the
consequences of own actions can be easily predicted.
Anticipation of action consequences represented in mem-
ory play a powerful role in planning and selection of an
action (Hommel et al. 2001). Moreover, during preparation
of the motor program anticipation of its outcomes pre-tunes
the brain to the perception of action effects, which was
found to be reflected in early perceptual components of
event-related potentials (Nikolaev et al. 2008). The current
study provides evidence that anticipation of own action
outcomes selectively modulates the preparatory motor
activity, as well as its perceptual consequences.
Acknowledgments This research was supported by the BICW
(Brain Imaging Center West, Clinical MEG) of the BMBF and the
German Research Foundation (SFB 550/B1). K.M. is supported by an
AstraZeneca foundation. The authors thank Maike Borutta for her
excellent technical assistance and Argiro Vatakis and Zoe Kourtzi for
helpful discussion.
References
Algazi VR, Duda RO, Thompson DM, Avendano C (2001) The
CIPIC HRTF database. In: Proc. 2001 IEEE workshop on
applications of signal processing to audio and electroacoustics,
pp 99–102
Allen PG, Kolers PA (1981) Sensory specificity of apparent motion.
J Exp Psychol Hum Percept Perform 7:1318–1326
Berndt I, Franz VH, Bulthoff HH, Wascher E (2002) Effects of
pointing direction and direction predictability on event-related
lateralizations of the EEG. Hum Mov Sci 21:387–410
Blakemore S-J, Rees G, Frith CD (1998) How do we predict the
consequences of our actions? A functional imaging study.
Neuropsychologia 25:410–418
Blakemore S-J, Wolpert DM, Frith CD (2000) Why can’t you tickle
yourself? Neuroreport 11:11–16
Curio G, Neuloh G, Numminen J, Jousmaki V, Hari R (2000)
Speaking modifies voice-evoked activity in the human auditory
cortex. Hum Brain Mapp 9:183–191
Dassonville P, Lewis SM, Zhu X-H, Ugurbil K, Kim S-G, Ashe J
(1998) Effects of movement predictability on cortical motor
activation. Neurosci Res 32:65–74
Deecke L (1996) Planning, preparation, execution, and imagery of
volitional action. Brain Res Cogn Brain Res 3:59–64
Djelani T, Porschmann C, Sahrhage J, Blauert J (2000) An interactive
virtual-environment generator for psychoacoustic research II:
collection of head related impulse responses and evaluation of
auditory localization. ACUSTICA/acta acustica 86:1046–1053
Fujimaki N, Hayakawa T, Nielsen M, Knosche TR, Miyauchi S (2002)
An fMRI-constrained MEG source analysis with procedures for
dividing and grouping activation. Neuroimage 17:324–43
Hillyard SA, Vogel EK, Luck SJ (1998) Sensory gain control
(amplification) as a mechanism of selective attention: Electro-
physiological and neuroimaging evidence. Philos Trans R Soc
Lond B Biol Sci 353:1257–1270
Hommel B, Musseler J, Aschersleben G, Prinz W (2001) The theory
of event coding (TEC): a framework for perception and action
planning. Behav Brain Sci 24:849–878
Johnson TL, Shapiro KL (1989) Attention to auditory and peripheral
visual stimuli: effects of arousal and predictability. Acta Psychol
(Amst) 72:233–45
Kornhuber HH, Deecke L (1965) Hirnpotentialanderungen bei
Willkiirbewegungen und passiven Bewegungen des Menschen:
Bereitscbaftspotential und reafferente Potentiale. Pfluegers Arch
248:1–17
Kristeva R, Cheyne D, Deecke L (1991) Neuromagnetic fields
accompanying unilateral and bilateral voluntary movements:
topography and analysis of cortical sources. Electroencephalogr
Clin Neurophysiol 81:284–298
Liu AK, Belliveau JW, Dale AM (1998) Spatiotemporal imaging of
human brain activity using functional MRI constrained magne-
toencephalography data: Monte Carlo simulations. Proc Natl
Acad Sci USA 95:8945–8950
Martikainen MH, Kaneko K, Hari R (2005) Suppressed responses to
self-triggered sounds in the human auditory cortex. Cereb Cortex
15:299–302
Mateeff S, Hohnsbein J, Noack T (1985) Dynamic visual capture:
apparent auditory motion induced by a moving visual target.
Perception 14:721–727
Mathiak K, Hertrich I, Kincses WE, Riecker A, Lutzenberger W,
Ackermann H (2003) The right supratemporal plane hears the
distance of objects: neuromagnetic correlates of virtual reality.
Neuroreport 14:307–311
McCarthy G, Donchin E (1976) The effects of temporal and event
uncertainty in determining the waveforms of the auditory event
related potential (ERP). Psychophysiology 13:581–590
Naatanen R, Picton T (1987) The N1 wave of the human electric and
magnetic response to sound: a review and an analysis of the
component structure. Psychophysiology 24:375–425
Nelson AJ, Staines WR, McIlroy WE (2004) Tactile stimulus
predictability modulates activity in a tactile-motor cortical
network. Exp Brain Res 154:22–32
Exp Brain Res (2008) 189:289–300 299
123

Nikolaev AR, Ziessler M, Dimova K, van Leeuwen C (2008)
Anticipated action consequences as a nexus between action and
perception: evidence from event-related potentials. Biol Psychol
78:53–65
Nittono H (2006) Voluntary stimulus production enhances deviance
processing in the brain. Int J Psychophysiol 59:15–21
Nittono H, Ullsperger P (2000) Event-related potentials in a self-
paced novelty oddball task. Neuroreport 11:1861–1864
Ohmura H (1987) Intersensory influences on the perception of
apparent movement. Jpn Psychol Res 29:1–19
Schafer EWP, Marcus M (1973) Self-stimulation alters human
sensory brain responses. Science 181:175–177
Scherg M, Von Cramon D (1985) Two bilateral sources of the late
AEP as identified by a spatio-temporal dipole model. Electro-
encephalogr Clin Neurophysiol 62:32–44
Soto-Faraco S, Lyons J, Gazzaniga M, Spence C, Kingstone A (2002)
The ventriloquist in motion: illusory capture of dynamic
information across sensory modalities. Cogn Brain Res
14:139–146
Soto-Faraco S, Spence C, Kingstone A (2004) Moving multisensory
research along: motion perception across sensory modalities.
Curr Dir Psychol Sci 13:29–32
Strybel TZ, Vatakis A (2004) A comparison of auditory and visual
apparent motion presented individually and with crossmodal
moving distractors. Perception 33:1033–1048
Wolpert DM (1997) Computational approaches to motor control.
Trends Cogn Sci 1:209–216
300 Exp Brain Res (2008) 189:289–300
123