Unsupervised distance metric learning using predictability
11
University of Pennsylvania ScholarlyCommons Technical Reports (CIS) Department of Computer & Information Science June 2008 Unsupervised distance metric learning using predictability Abhishek A. Gupta University of Pennsylvania, [email protected] Dean P. Foster University of Pennsylvania, [email protected] Lyle H. Ungar University of Pennsylvania, [email protected] Follow this and additional works at: hp://repository.upenn.edu/cis_reports University of Pennsylvania Department of Computer and Information Science Technical Report No. MS-CIS-08-23. is paper is posted at ScholarlyCommons. hp://repository.upenn.edu/cis_reports/885 For more information, please contact [email protected]. Recommended Citation Gupta, Abhishek A.; Foster, Dean P.; and Ungar, Lyle H., "Unsupervised distance metric learning using predictability" (2008). Technical Reports (CIS). Paper 885. hp://repository.upenn.edu/cis_reports/885
-
Upload
independent -
Category
Documents
-
view
3 -
download
0
Transcript of Unsupervised distance metric learning using predictability

University of PennsylvaniaScholarlyCommons
Technical Reports (CIS) Department of Computer & Information Science
June 2008
Unsupervised distance metric learning usingpredictabilityAbhishek A. GuptaUniversity of Pennsylvania, [email protected]
Dean P. FosterUniversity of Pennsylvania, [email protected]
Lyle H. UngarUniversity of Pennsylvania, [email protected]
Follow this and additional works at: http://repository.upenn.edu/cis_reports
University of Pennsylvania Department of Computer and Information Science Technical Report No. MS-CIS-08-23.
This paper is posted at ScholarlyCommons. http://repository.upenn.edu/cis_reports/885For more information, please contact [email protected].
Recommended CitationGupta, Abhishek A.; Foster, Dean P.; and Ungar, Lyle H., "Unsupervised distance metric learning using predictability" (2008).Technical Reports (CIS). Paper 885.http://repository.upenn.edu/cis_reports/885

Unsupervised distance metric learning using predictability
AbstractDistance-based learning methods, like clustering and SVMs, are dependent on good distance metrics. Thispaper does unsupervised metric learning in the context of clustering. We seek transformations of data whichgive clean and well separated clusters where clean clusters are those for which membership can be accuratelypredicted. The transformation (hence distance metric) is obtained by minimizing the blur ratio, which isdefined as the ratio of the within cluster variance divided by the total data variance in the transformed space.For minimization we propose an iterative procedure, Clustering Predictions of Cluster Membership (CPCM).CPCM alternately (a) predicts cluster memberships (e.g., using linear regression) and (b) clusters thesepredictions (e.g., using k-means). With linear regression and k-means, this algorithm is guaranteed to convergeto a fixed point. The resulting clusters are invariant to linear transformations of original features, and tend toeliminate noise features by driving their weights to zero.
CommentsUniversity of Pennsylvania Department of Computer and Information Science Technical Report No. MS-CIS-08-23.
This technical report is available at ScholarlyCommons: http://repository.upenn.edu/cis_reports/885

Unsupervised distance metric learning usingpredictability
Abhishek A. GuptaDepartment of Statistics
University of [email protected]
Dean P. FosterDepartment of Statistics
University of [email protected]
Lyle H. UngarDepartment of Computer and Information Science
University of [email protected]
Abstract
Distance-based learning methods, like clustering and SVMs, are dependent ongood distance metrics. This paper doesunsupervisedmetric learning in the contextof clustering. We seek transformations of data which givecleanand well separatedclusters wherecleanclusters are those for which membership can be accuratelypredicted. The transformation (hence distance metric) is obtained by minimizingtheblur ratio, which is defined as the ratio of the within cluster variance dividedby the total data variance in the transformed space. For minimization we proposean iterative procedure,Clustering Predictions of Cluster Membership(CPCM).CPCM alternately (a) predicts cluster memberships (e.g., using linear regression)and (b) clusters these predictions (e.g., usingk-means). With linear regression andk-means, this algorithm is guaranteed to converge to a fixed point. The resultingclusters are invariant to linear transformations of original features, and tend toeliminate noise features by driving their weights to zero.
1 Introduction
In data mining one often wants to findgoodclusters in a set of data using e.g.k-means, agglomera-tive or spectral clustering methods (Jain et al., 1999; Ng etal., 2002). Though it is clear that clustersdepend on the distance metric, what constitutes agoodcluster is a difficult question, and depends onthe goal of the clustering. Many probabilistic, information theoretic, and graph theoretic measureshave been proposed to capture the quality of clustering (Kannan et al., 2000). Most of these criteriatry to measure the similarity between points in a cluster, and thus depend on some distance metric.In a supervised setting, such as for classification problems, researchers have developed criteria forlearning the distance metrics, either when all points are labeled with clusters (Shalev-Shwartz et al.,2004; Shental et al., 2002), or when “side information” about pairs of points either being, or notbeing in the same cluster (Xing et al., 2003) are available.
We propose a method of learning metrics in an unsupervised setting. A good distance metric wouldlead to tight and well-separated clusters in some projectedspace. We quantify this by introducinga new criterion, the ratio of the average distance of points to their nearest cluster centers to theaverage distance of the data points to their overall mean in the transformed space. For a lineartransformationA of the data, we call our criterion theblur ratio BR(A). Our goal then is to findtheA which minimizes thisblur ratio. The criterion resembles the one thatLinear DiscriminantAnalysis(LDA) minimizes, except that we are doing unsupervised learning, while LDA assumes that
1

labels are known. In effect, we are learning a distance metric such that the transformation obtainedprojects the data to a subspace where the clusters are tight.Minimization of theblur ratio handlesdata with high-dimensional noise features by tending to drive their weights to zero.
For the minimization we propose an iterative algorithm,Clustering Predictions of Cluster Member-ship (CPCM), which first predicts cluster membership, and then defines new clusters by clusteringthe predictions of cluster membership. In CPCM we combine a hard clustering algorithm with a softprediction algorithm (i.e. the prediction step predicts cluster probabilities and not cluster member-ships). The intuition behind using predictability is that if we generate clusters using a set of features,we should also be able to predict the membership of the clusters using the same features. By usingpredictions of cluster membership, we can take advantage ofsupervised learning methods to bet-ter solve unsupervised and semi-supervised problems (Chapelle et al., 2003). This paper explainsthe CPCM algorithm in detail and characterizes some of its properties for the case where linear re-gression is used for prediction, including showing that it gives clusters which are invariant to lineartransformations of the data. CPCM can be easily extended to different prediction and clusteringtechniques; we discuss the use of Reproducing Kernel Hilbert Spaces (RKHS) for prediction in thiscontext, and show that CPCM gives superior perfomance to similar metric learning and unsuper-vised methods when there are many spurious features. CPCM reduces the contribution of irrelevantfeatures, greatly improving cluster quality.
2 Optimal Distance Metric and Blur Ratio
Consider aN × p dimensional matrixX whereN is the number of points andp is the number offeatures. We will useXi to denote theith row andX·i to denote theith column inX. This makes thefeature vector into a row vector. We will use row vectors throughout. DefineC = {C1, · · · , CK} tobe the set of clusters. Let4C be the simplex over theK dimensions (the subspace ofK dimensionssuch that every point looks like a probability, with components lying in (0,1) and summing to 1) withek ∈ 4C denoting a unit direction. Denoting the clustering function by c, we have the followingmap
Xk-means−→ c( ) : Rp → C (1)
Usingc(), we define the matrixZ such thatZi = ek:c(Xi)=Ck. Note thatZi is aK dimensional row
vector on the simplex4C. 4C can be regarded as a probability simplex for the cluster membershipwith Zik equaling the probability of pointi being in clusterk. Defineµk ∈ Rp as the center in thefeature space for clusterCk.
Our goal is to find the linear transformation of the dataX such that the distance metricd(x, y) =√(x − y)A(x − y)T gives the lowestblur ratio. We will build up theblur ratio by a sums of
squares decomposition: Within cluster variance, SSC ≡
K∑
k=1
∑
i:c(Xi)=Ck
(Xi − µk)A(Xi − µk)T
and, Total variance, SST ≡
N∑
i=1
(Xi−µ)A(Xi−µ)T . Hereµ = X andA is a symmetric positive
semi-definite matrix. We can then define theblur ratio and the optimization problem as
minA,c
BR(A, c) ≡SSC
SST
Following the argument fork-means type algorithms (Peng & Xia, 2005), it is clear that optimizingtheblur ratio is NP-hard. Thus we rely on the existence of good approximateclustering algorithms.Given the cluster partition, the optimumA matrix unfortunately will be of rank one (a similarproperty was pointed out by Xing et al., 2003) Instead we wantto ensure that the transformationminimizes the distance between cluster centers and aK-dimensional simplex, while maintainingthe simplex structure. We therefore add the following constraint (∀i 6= j) (µi − µj)A(µi −µj)
T = 2 which prevents the centers of two different clusters from overlapping, and keeps theA matrix from collapsing to a rank one matrix. Note that the RHSof the constraint just has tobe any positive number (which we choose as 2). Without loss ofgenerality, under this constraint,we can take that there exists a decomposition ofA = ββT (sinceA is positive definite) so that,
2

Algorithm 1 CPCMInput: DataX. Sett=0Generate an initial set of random clustersC(0)
repeatPredict cluster membershipZ(t)
i based onX andC(t)
GenerateC(t+1) by clusteringZ(t) and incrementt.until BlurRatio(t) = BlurRatio(t − 1) + ε.
SSC =
K∑
k=1
∑
i:c(i)=Ck
(Xiβ−θk)(Xiβ−θk)T . Thus given the clustering, the SSC can be minimized
by minimizing theL2 distance shown above, which boils down to finding the optimalβ and henceA. Thus we can considerθk ∈ 4C ⊂ RK as the center in the prediction space for clusterCk.
Finding the optimalBR can thus be seen as a two stage optimization procedure. We first find an op-timal partitioning of the data using a clustering method. Then, we find the optimalA which reducesthe within cluster variance in the transformed space. Thesetwo steps can be iterated till a fixed point.The basic intuition behind a two step procedure is that the points which cluster together lie aroundthe corners of a simplex. In CPCM we use a hard clustering algorithm and a soft prediction algo-rithm. The soft prediction from linear regression finds the probabilities of cluster memberships andseparates the clusters based on features. Hard clustering then drives the transformed points towardsthe simplex corners.1 Armed with this insight, we now introduce the CPCM algorithm.
3 CPCM: An Iterative Clustering Prediction algorithm
The CPCM algorithm alternates between two stages - Clustering and Prediction. In this paper weuse linear regression as the prediction algorithm, andk-means as the clustering algorithm. Moreformally, the cluster prediction model is given by:Zi = Xiβ + noise, whereβ ∈ Rp×K .Estimating the cluster memberships of each point by least squares gives a predictionZi. SinceZi ∈ RK (instead of just a scalar as in the case of a usual regression setting), we run a regres-sion on each of theK columns ofZ (N × K matrix) to generate the predictions. The points arethen clustered in the cluster-prediction space, which is a linear transformation of the original points:
Zhard clustering algo.
−→ c′( ) : RK → C′ . The algorithm is then iterated.
Figure 1 shows an example dataset consisting of a blurry version of two line segments. Whenk-means was used for clustering, the clusters produced failedto capture the structure of the data; sincek-means tries to minimize the within-cluster variance parallel bands are produced (Figure 1(a)). Incontrast, CPCM finds clusters that better capture the structure (Figure 1(b)). Figure 1(c) shows theprojection of the points in the simplex space, which is a linear transformation of the original data.Key to CPCM is the fact that it clusters in a simplex space. We can view theseK clusters in aK − 1-simplex4C. The predicted cluster memberships can then be viewed as probabilities.
3.1 CPCM computes a (local) minimum of theblur ratio
Recall thatµ(·) live in the feature space andθ(·), are their projections in the simplex space. Whenusingk-means,Zi are at the corners of the simplex,4C and soZi = ek when pointi is in clusterCk. Also, we haveXi ∈ Rp. As discussed above, CPCM works in two stages:
1. Prediction Stage:Given cluster membershipsZi, we minimizeRSSP (β) =∑N
i=1 ||Zi−
Xiβ||2 for β ∈ Rp×K . The solutionXiβ ∈ 4C gives the predicted location of the points
in the cluster probability simplex. When LSR is used with an intercept, the predictedprobabilities automatically sum to one for each point (Hastie et al., 2001).
1Alternatively, one could combine a hard prediction with a soft clustering algorithm where the hard regres-sion drives the transformed points towards the simplex corners. Using a hard clustering and hard prediction orsoft clustering and soft prediction would yield a trivial fixed point.
3

−30 −20 −10 0 10 20 30−
20−
100
1020
30x
y
(a)k-means
−30 −20 −10 0 10 20 30
−20
−10
010
2030
x
y
(b) CPCM-LSR
Cluster 1
Cluster 2Cluster 3
(c) The cluster simplex
−30 −20 −10 0 10 20 30
−20
−10
010
2030
x
y
(d) Three parallel clouds
Cluster 1
Cluster 2Cluster 3
(e) The cluster simplex
−5 0 5 10
−10
−5
05
10
x
y
(f) Three concentric circles
Figure 1: An example run is shown from (a)-(c). Data is from two parallel lines with Gaussiannoise. (a)K-means creates parallel vertical bands to reduce the withincluster variance, and failsto cluster “correctly.” Blur ratio for K = 3, BR3 = 0.26 and forK = 2, BR2 = 0.447 (b) Incontrast, CPCM finds the underlying elongated band structure. Blur ratio for K = 3, BR3 = 0.148and forK = 2, BR2 = 0.041. Thus,blur ratio is indeed minimized by CPCM for the right numberof clusters. (c) Linear regression transforms the data linearly on to the simplex. Examples usingCPCM-RKHSwith a Gaussian kernel are shown from (d)-(f). (d) Three parallel lines (e) Projectionon the simplex space shows that CPCM tries to pull the clustercenters to the simplex corners. (f)Three concentric circles.
2. Clustering Stage: Now minimize the objective function for thek-means algorithm,RSSC(µ, c(·)) =
∑N
i=1 ||Xiβ − µkβ||2. Clearlyµk is only identified for the subspace
spanned byβ. Effectively, we are taking the distance orthogonal to theβ subspace as hav-ing zero distance. To make this clearer,θk ≡ µkβ ∈ RK . The clustering function then isbasically,c(Xi) = argmin
1≤k≤K
||Xiβ − θk||2 where,θk ≡ (Xi/|Ck|)β = µkβ.
3.2 Properties of the fixed point
We now state and prove two guarantees about CPCM: it gives a result which is invariant to lineartransformations of the original space, and it always converges.
Property 1 (Linear Transformation Invariance) The algorithm is invariant to linear transforma-tions of the data.
Proof The data,Xi is only used directly by the linear regression step; clustering only uses theprojectedXiβ. Since the linear regression estimates aβ which is invariant to linear transformation,the whole algorithm is invariant to linear transformations. Note that if regularization is used, it will
4

enforce some structure on the initial data. Hence we will lose this particular invariance property.This regularization is necessary in the RKHS setting.
Since the initial cluster labels are chosen at random, thereare a multitude of possible ending labels.Thus we need to know that regardless of the initial state, that the algorithm will converge. We definethe set of possible convergent points asF :
Definition 1 (Fixed Point) Define the set of sets of points,F , as thefixed point if F = C(j) =C(j+1). Thus at the fixed point the clusters remain invariant after successive iterations.
Property 2 (Existence of Fixed Point) For any initial starting assignment of labels, the algorithmconverges to a fixed point,F in finite time.
Proof We first show that the algorithm converges to a local minimum of the blur ratio and thenshow that this local minimum corresponds to a fixed point as defined above. Since we update only iftheblur ratio decreases, the iterations monotonically decrease theblur ratio. Hence, the algorithmstops when a local minimum of theblur ratio is reached. A trivial proof of the second part relies onthere only being a finite number of possible splits into clusters. Hence due to the monotonicity, itmust find a local minimum.
These two properties together show that the set of fixed points,F , is invariant to linear transforma-tions inX. Also sincek-means isO(Np) and LSR isO(Np2), convergence is usually fast.
3.3 Extensions using RKHS
Whenever the clusters are linearly separable, the prediction step using linear regression is able to findthe clusters. But, when the original feature space is not linearly separable, we will need a non-lineartransformation of the features, say by using a Reproducing Kernel Hilbert Space (RKHS) (Hastieet al., 2001) for the prediction step. CPCM works well on the prototypical datasets considered inspectral clustering literature (Ng et al., 2002). Figure 1(d-f) show examples using an RKHS, whereCPCM is able to correctly identify the three parallel bands and three concentric circles. Predictingwith an RKHS can be viewed as transforming the data by a non-linear map to a linearly separablefeature space and then applying CPCM in this image space.
4 Related Work
4.1 Unsupervised Learning
One of the most popular clustering techniques,k-means, minimizes theblur ratio with theA = I.Another, related, approach to clustering is to use a model-based clustering, e.g, Gaussian MixtureModels (GMM) (Dasgupta, 1999). GMMs with a single covariance also minimize theblur ratio, asthey cluster in a linearly transformed space.
Another alternative to the prediction step of the blur ratiooptimization would be to reduce to ageneralized eigenvalue problem. Given a partitionC, theblur ratio can be considered asBR(A =
ββT , c()) ≡ tr(X(c)AX
(c)T )tr(X(m)AX(m)T )
= tr(βTScβ)
tr(βT Smβ) whereX(c) is the matrix withith row asXi − µc(Xi),
X(m) is the matrix withith row asXi − µ, Sc = X
(c)TX
(c) andSm = X(m)T
X(m). Theβi
are solutions to the generalized eigenvalue problemScβi = λSmβi. The minimumblur ratio isobtained by taking the minimum eigenvalue, and taking all other directions zero (and henceβ isrank 1). To avoid projection to a line, we constrain the minimum to be a projection ontoK-1dimensions. Optimizing this ratio is equivalent to CPCM with Linear Discriminant Analysis (LDA,with K classes) as the prediction step (Fukunaga, 1990, Hastie et al., 2001).
Recently we have been made aware of similar work done by Ding and Li (2007) who introduce LDA-km. This is an extension of the adaptive dimension reductionmethodology (Ding et al., 2002), wherethey introduce ADR-EM. The ADR framework aims to do subspaceclustering and uses clustermembership to define aK-1 dim space, but it still uses projections based on Euclidean distances.LDA-km, on the other hand, minimizes a criterion related toblur-ratio, and is similar to the CPCM-LDA suggested above. LDA and multiple regression are closely related techniques; See Hastie et al.
5
(1994) and Hastie et al. (1995) for a detailed discussion on the similarity and differences betweenthe two. Key advantage of CPCM is that we can extend it to different prediction techniques e.g.toRKHS above, and to stepwise in next section. We compare LDA-km to CPCM in section 5.
Almost none of the traditional clustering and dimensionality reduction methods are invariant tolinear transformations of the data (Frey & Jojic, 2003; Kumar & Orlin, 2005). For example,k-meansrequires a distance function which can be changed drastically by doing a linear transformation of thefeatures. Different transformations lead to different clusters. One way to obtain invariant clustersis to use a clustering criterion which itself is invariant. This is the approach taken by Friedmanand Rubin (1967) where they use the Mahalanobis distance. The circulark-means (Charalampidis,2005) which is rotation invariant also utilizes the Mahalanobis distance in its criteria. Other relatedwork includes Fitzgibbon and Zisserman (2002), Kumar and Orlin (2005), and Frey and Jojic (2003).Though invariant, none of these procedures learn metrics.
4.2 Distance Metric Learning
Several supervised learning methods, including the Mahalanobis Metric for Clustering (MMC, Xinget al., 2003) and Pseudo-metric Online Learning Algorithm (POLA, Shalev-Shwartz et al., 2004) useconvex optimization to compute optimal transformations ofthe original feature space. MMC findsthe transformation which maximizes the sum of squared distances between differently labeled in-puts, while maintaining an upper bound on the sum of distances between similarly labeled inputs.Weinberger et al. (2006) extend this approach to k-Nearest Neighbor classification. A related ap-proach was taken by Schultz and Joachims (2004) who employ relative comparisons to generatea distance metric. Bar-Hillel et al. (2005) also learn an inner product distance using equivalenceconstraints. Bilenko et al. (2004) integrate the learning of the distance metric and clustering of thedata. The CPCM method shares some similarity in spirit to thesupervised methods, but is purelyunsupervised; it uses a different optimality criterion. The blur ratio could, of course, be optimizedby methods similar to those used in the supervised setting.
5 Higher Dimensional Problems
5.1 Simulated datasets
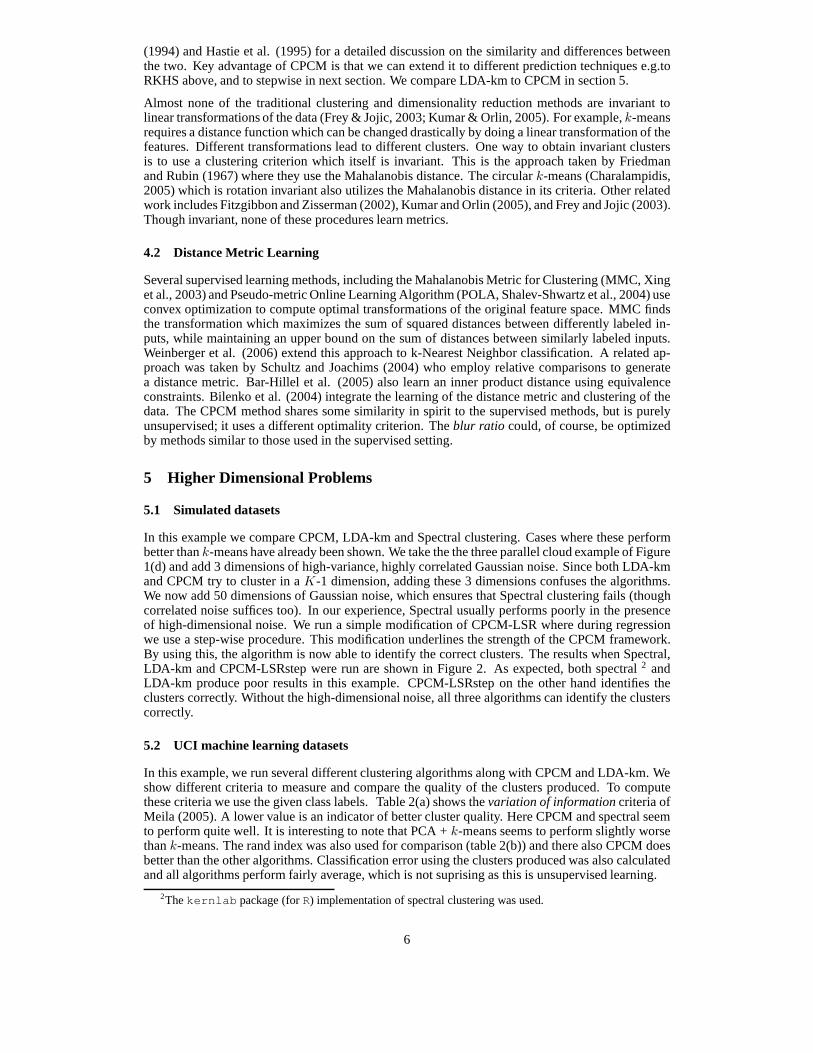
In this example we compare CPCM, LDA-km and Spectral clustering. Cases where these performbetter thank-means have already been shown. We take the the three parallel cloud example of Figure1(d) and add 3 dimensions of high-variance, highly correlated Gaussian noise. Since both LDA-kmand CPCM try to cluster in aK-1 dimension, adding these 3 dimensions confuses the algorithms.We now add 50 dimensions of Gaussian noise, which ensures that Spectral clustering fails (thoughcorrelated noise suffices too). In our experience, Spectralusually performs poorly in the presenceof high-dimensional noise. We run a simple modification of CPCM-LSR where during regressionwe use a step-wise procedure. This modification underlines the strength of the CPCM framework.By using this, the algorithm is now able to identify the correct clusters. The results when Spectral,LDA-km and CPCM-LSRstep were run are shown in Figure 2. As expected, both spectral2 andLDA-km produce poor results in this example. CPCM-LSRstep on the other hand identifies theclusters correctly. Without the high-dimensional noise, all three algorithms can identify the clusterscorrectly.
5.2 UCI machine learning datasets
In this example, we run several different clustering algorithms along with CPCM and LDA-km. Weshow different criteria to measure and compare the quality of the clusters produced. To computethese criteria we use the given class labels. Table 2(a) shows thevariation of informationcriteria ofMeila (2005). A lower value is an indicator of better clusterquality. Here CPCM and spectral seemto perform quite well. It is interesting to note that PCA +k-means seems to perform slightly worsethank-means. The rand index was also used for comparison (table 2(b)) and there also CPCM doesbetter than the other algorithms. Classification error using the clusters produced was also calculatedand all algorithms perform fairly average, which is not suprising as this is unsupervised learning.
2Thekernlab package (forR) implementation of spectral clustering was used.
6

−10 −5 0 5 10−
20
−1
00
10
20
W[,1]
W[,2
]
(a) Spectral
−10 −5 0 5 10
−2
0−
10
01
02
0
W[,1]
W[,2
]
(b) LDA-km
−10 −5 0 5 10
−2
0−
10
01
02
0
W[,1]
W[,2
]
(c) CPCM-LSRstep
Figure 2: Comparison of Spectral, LDA-km and CPCM on a simulated dataset.
Table 1: Comparison of different algorithms on the UCI dataset
CPCM CPCM Spectral k-means k-means LDA- LSR - RKHS + PCA -km
Glass 0.383 0.371 0.27 0.316 0.37 0.397Ionosphere 0.205 0.202 0.215 0.198 0.205 0.203Pima Indian 0.189 0.167 0.136 0.17 0.181 0.2Sonar 0.236 0.231 0.147 0.257 0.229 0.229Vehicle 0.323 0.318 0.285 0.325 0.372 0.339Vowel 0.429 0.465 0.432 0.426 0.466 0.49
(a) Variation of information
CPCM CPCM Spectral k-means k-means LDA- LSR - RKHS + PCA -km
Glass 0.68 0.73 0.627 0.681 0.67 0.665Ionosphere 0.571 0.501 0.538 0.589 0.573 0.577Pima Indian 0.516 0.521 0.547 0.551 0.572 0.502Sonar 0.508 0.499 0.498 0.503 0.499 0.499Vehicle 0.674 0.568 0.564 0.651 0.648 0.669Vowel 0.861 0.842 0.709 0.859 0.85 0.852
(b) Rand index
5.3 Gene expressions
Alizadeh et al. (2000) characterize the gene expression of B-cell malignancies which cause diffuselarge B-cell lymphoma (DLBCL). They study 96 samples of normal and malignant lymphocyteswith 4096 gene expressions each. Using domain expertise, the tissue samples were classified into 9categories like DLBCL, Germinal centre B and so on. We aim to recreate theseK = 9 categoriesusing clustering. The distribution of the classes is very uneven (46, 2, 2, 10, 6, 6, 9, 4, 11) making ita tough clustering problem (refer to Figure 1 in (Alizadeh etal., 2000)). We take the firstK − 1PCA components as our features and use them for clustering (Ding & He, 2004). For comparisons,k-means and spectral clustering were used in addition to CPCM-RKHS. 100 runs of each algorithmwere run and the average Rand indices are reported in table 2.The clustering from CPCM is muchbetter thank-means or spectral in terms of the Rand index.
Table 2: Rand index for different algorithms (averaged over100 runs) on the Alizadeh et. al. datak-means Spectral CPCM-RKHS
Rand index 0.748 0.777 0.845
7

6 Discussion
Learning metrics is critical when features come on very different scales, and when many featuresare irrelevant or highly correlated. We have shown that CPCMis able to learn transformations of thedata that give good clusters in the presence of high dimensional noise, for cases that spectral clus-tering and LDA-km produce poor results. A big advantage of the proposed method is the flexibilityof substituting different prediction algorithms, eg step-wise regression in the example effectivelyhandles correlated noise.
One attractive feature of the transformations that CPCM learns is that it is invariant under non-singular linear transformations of the data. Transformingthe original points just results in a com-pensatory transformation of the distance metric; the clusters remain unchanged.3 Clearly gainingthis invariance must come at a price. Since CPCM considers a much richer space of clusters thanstandardk-means (or, equivalently, has more free parameters to fit), it could end up fitting morenoise thank-means does. Viewed differently, if the clusters are overlapping, it could be the casethat k-means does better given the correct metric. Our preliminary empirical studies have shownthat in such cases where the linear regression step is not able to find separation, the regression doesnot warp the data very much, so CPCM returns similar results to k-means. In short, CPCM workswell if there are better separated clusters insomespace generated from a linear combination of theoriginal features.
References
Alizadeh, A. A., et al. (2000). Distinct types of diffuse large b-cell lymphoma identified by geneexpression profiling.Nature, 403, 503–511.
Bar-Hillel, A., Hertz, T., Shental, N., & Weinshall, D. (2005). Learning a mahalanobis metric fromequivalence constraints.Journal of Machine Learning Research, 6, 937–965.
Bilenko, M., Basu, S., & Mooney, R. J. (2004). Integrating constraints and metric learning in semi-supervised clustering.ICML ’04.
Chapelle, O., Weston, J., & Scholkopf, B. (2003). Cluster kernels for semi-supervised learning.NIPS 15.
Charalampidis, D. (2005). A modified k-means algorithm for circular invariant clustering.IEEETransactions on Pattern Analysis and Machine Intelligence, 27, 1856–1865.
Dasgupta, S. (1999). Learning mixtures of gaussians.FOCS ’99.
Ding, C., & He, X. (2004). K-means clustering via principal component analysis.ICML ’04.
Ding, C., He, X., Zha, H., & Simon, H. (2002). Adaptive dimension reduction for clustering highdimensional data.ICDM ’02.
Ding, C., & Li, T. (2007). Adaptive dimension reduction using discriminant analysis and k-meansclustering.to be presented in ICML ’07.
Fitzgibbon, A. W., & Zisserman, A. (2002). On affine invariant clustering and automatic cast listingin movies.ECCV ’02.
Frey, B. J., & Jojic, N. (2003). Transformation-invariant clustering using the em algorithm.IEEETransactions on Pattern Analysis and Machine Intelligence, 25, 1–17.
Friedman, H. P., & Rubin, J. (1967). On some invariant criteria for grouping data.Journal ofAmerican Statistical Association, 1159–1178.
Fukunaga, K. (1990).Introduction to statistical pattern recognition. Academic Press. 2nd edition.
Hastie, T., Tibshirani, R., & Friedman, J. (2001).The elements of statistical learning: Data mining,inference, and prediction. New York: Springer.
Hastie, T. J., Buja, A., & Tibshirani, R. (1995). Penalized discriminant analysis.Annals of Statistics.
Hastie, T. J., Tibshirani, R., & Buja, A. (1994). Flexible discriminant analysis by optimal scoring.Journal of American Statistical Association.
3The invariance in this paper is much stronger thanscale invariancesuggested by Kleinberg (2003) in whichthe distance function is scaled.
8

Jain, A. K., Murty, M. N., & Flynn, P. J. (1999). Data clustering: a review.ACM Computing Surveys,31, 264–323.
Kannan, R., Vempala, S., & Vetta, A. (2000). On clusterings:Good, bad, and spectral.FOCS ’00.
Kleinberg, J. (2003). An impossibility theorem for clustering. NIPS 15.
Kumar, M., & Orlin, J. B. (2005). Scale-invariant clustering using minimum volume ellipsoids.RUTCOR Research Report.
Meila, M. (2005). Comparing clusterings - an axiomatic view. ICML ’05.
Ng, A. Y., Jordan, M. I., & Weiss, Y. (2002). On spectral clustering: Analysis and an algorithm.NIPS 14.
Peng, J., & Xia, Y. (2005). A new theoretical framework for k-means-type clustering. InFoundationsand advances in data mining, 79–96. Springer-Verlag.
Schultz, M., & Joachims, T. (2004). Learning a distance metric from relative comparisons.NIPS16.
Shalev-Shwartz, S., Singer, Y., & Ng, A. Y. (2004). Online and batch learning of pseudo-metrics.ICML ’04.
Shental, N., Hertz, T., Weinshall, D., & Pavel, M. (2002). Adjustment learning and relevant compo-nent analysis.ECCV ’02.
Weinberger, K., Blitzer, J., & Saul, L. (2006). Distance metric learning for large margin nearestneighbor classification.NIPS 18.
Xing, E. P., Ng, A. Y., Jordan, M. I., & Russell, S. (2003). Distance metric learning with applicationto clustering with side-information.NIPS 15.
9