Pssst...or Boo! Assessing the Predictability of Notification ...
199
Pssst...or Boo! Assessing the Predictability of Notification Delivery Preferences by Julie Sage Weber A dissertation submitted in partial fulfillment of the requirements for the degree of Doctor of Philosophy (Computer Science and Engineering) in The University of Michigan 2010 Doctoral Committee: Professor Martha E. Pollack, Chair Professor Mark Ackerman Professor Benjamin Kuipers Assistant Professor Mark W. Newman
-
Upload
khangminh22 -
Category
Documents
-
view
4 -
download
0
Transcript of Pssst...or Boo! Assessing the Predictability of Notification ...
Pssst...or Boo!
Assessing the Predictability of
Notification Delivery Preferences
by
Julie Sage Weber
A dissertation submitted in partial fulfillmentof the requirements for the degree of
Doctor of Philosophy(Computer Science and Engineering)
in The University of Michigan2010
Doctoral Committee:
Professor Martha E. Pollack, ChairProfessor Mark AckermanProfessor Benjamin KuipersAssistant Professor Mark W. Newman

To M. C. Kinley
ii

TABLE OF CONTENTS
DEDICATION . . . . . . . . . . . . . . . . . . . . . . . . . . . . . . . . . . . . . . . . . . ii
LIST OF FIGURES . . . . . . . . . . . . . . . . . . . . . . . . . . . . . . . . . . . . . . vi
LIST OF TABLES . . . . . . . . . . . . . . . . . . . . . . . . . . . . . . . . . . . . . . . ix
LIST OF APPENDICES . . . . . . . . . . . . . . . . . . . . . . . . . . . . . . . . . . . xii
ABSTRACT . . . . . . . . . . . . . . . . . . . . . . . . . . . . . . . . . . . . . . . . . . . xiii
CHAPTER
I. Introduction . . . . . . . . . . . . . . . . . . . . . . . . . . . . . . . . . . . . . . . 1
1.1 Proposed Context Ontology . . . . . . . . . . . . . . . . . . . . . . . . . . . 31.2 Definition of a Notification . . . . . . . . . . . . . . . . . . . . . . . . . . . . 41.3 Research Overview . . . . . . . . . . . . . . . . . . . . . . . . . . . . . . . . 4
II. Background & Related Research . . . . . . . . . . . . . . . . . . . . . . . . . . 10
2.1 Defining Context . . . . . . . . . . . . . . . . . . . . . . . . . . . . . . . . . 102.2 Commercial Notification Tools . . . . . . . . . . . . . . . . . . . . . . . . . . 122.3 Context-Sensitive Notification: The “When” . . . . . . . . . . . . . . . . . . 13
2.3.1 Interruptibility . . . . . . . . . . . . . . . . . . . . . . . . . . . . . 142.3.2 System Deployments . . . . . . . . . . . . . . . . . . . . . . . . . . 16
2.4 Context-Sensitive Notification: The “How” . . . . . . . . . . . . . . . . . . . 192.4.1 Animation . . . . . . . . . . . . . . . . . . . . . . . . . . . . . . . . 192.4.2 Multi-modality . . . . . . . . . . . . . . . . . . . . . . . . . . . . . 21
2.5 User Modeling & Personalization . . . . . . . . . . . . . . . . . . . . . . . . . 232.6 Notifications and Assistive Technology . . . . . . . . . . . . . . . . . . . . . 24
III. Visual Notifications: Preliminary User Study . . . . . . . . . . . . . . . . . . 25
3.1 Phase 1: Intrusiveness . . . . . . . . . . . . . . . . . . . . . . . . . . . . . . . 263.1.1 Experimental Design . . . . . . . . . . . . . . . . . . . . . . . . . . 273.1.2 Protocol & Evaluation Metrics . . . . . . . . . . . . . . . . . . . . 313.1.3 Results . . . . . . . . . . . . . . . . . . . . . . . . . . . . . . . . . . 31
3.2 Phases 2 and 3: Setting & Content . . . . . . . . . . . . . . . . . . . . . . . 333.3 Phase 4: Combining Setting & Content . . . . . . . . . . . . . . . . . . . . . 34
3.3.1 Experimental Design . . . . . . . . . . . . . . . . . . . . . . . . . . 353.3.2 Protocol & Evaluation Metrics . . . . . . . . . . . . . . . . . . . . 353.3.3 Results . . . . . . . . . . . . . . . . . . . . . . . . . . . . . . . . . . 37
3.4 Discussion . . . . . . . . . . . . . . . . . . . . . . . . . . . . . . . . . . . . . 41
iii

IV. Multi-format Notifications in a Multi-task Environment . . . . . . . . . . . 43
4.1 Differentiating Task Load . . . . . . . . . . . . . . . . . . . . . . . . . . . . . 444.2 Evaluating Multi-format Notifications in a Multi-task Environment . . . . . 45
4.2.1 Participants . . . . . . . . . . . . . . . . . . . . . . . . . . . . . . . 464.2.2 Tasks . . . . . . . . . . . . . . . . . . . . . . . . . . . . . . . . . . . 464.2.3 Notifications . . . . . . . . . . . . . . . . . . . . . . . . . . . . . . . 474.2.4 Experimental Design . . . . . . . . . . . . . . . . . . . . . . . . . . 484.2.5 Hypotheses . . . . . . . . . . . . . . . . . . . . . . . . . . . . . . . 51
4.3 Results . . . . . . . . . . . . . . . . . . . . . . . . . . . . . . . . . . . . . . . 514.4 Discussion . . . . . . . . . . . . . . . . . . . . . . . . . . . . . . . . . . . . . 55
4.4.1 Participant Reactions to Notification Timing . . . . . . . . . . . . 56
V. A Survey Study of Workplace Notifications . . . . . . . . . . . . . . . . . . . 58
5.1 Motivation . . . . . . . . . . . . . . . . . . . . . . . . . . . . . . . . . . . . . 595.2 Overview . . . . . . . . . . . . . . . . . . . . . . . . . . . . . . . . . . . . . . 60
5.2.1 Notification Formats . . . . . . . . . . . . . . . . . . . . . . . . . . 615.2.2 Surveys . . . . . . . . . . . . . . . . . . . . . . . . . . . . . . . . . 61
5.3 Findings . . . . . . . . . . . . . . . . . . . . . . . . . . . . . . . . . . . . . . 635.4 Discussion . . . . . . . . . . . . . . . . . . . . . . . . . . . . . . . . . . . . . 65
VI. Notifications in the Workplace . . . . . . . . . . . . . . . . . . . . . . . . . . . . 67
6.1 Observation & Information Gathering . . . . . . . . . . . . . . . . . . . . . . 686.1.1 A Day in the Life . . . . . . . . . . . . . . . . . . . . . . . . . . . . 696.1.2 Workplace Notifications . . . . . . . . . . . . . . . . . . . . . . . . 70
6.2 Prototype Development & Testing . . . . . . . . . . . . . . . . . . . . . . . . 716.3 User Testing . . . . . . . . . . . . . . . . . . . . . . . . . . . . . . . . . . . . 73
6.3.1 Participant Selection . . . . . . . . . . . . . . . . . . . . . . . . . . 736.3.2 Configuration, Deployment, & Experimentation . . . . . . . . . . . 746.3.3 Obstacles & Limitations . . . . . . . . . . . . . . . . . . . . . . . . 756.3.4 Hypotheses . . . . . . . . . . . . . . . . . . . . . . . . . . . . . . . 76
VII. Methodology: Collecting & Coding Rich Video Data . . . . . . . . . . . . . 77
7.1 Collecting Rich Video Data . . . . . . . . . . . . . . . . . . . . . . . . . . . . 787.1.1 Protocol . . . . . . . . . . . . . . . . . . . . . . . . . . . . . . . . . 787.1.2 Data Collection Limitations . . . . . . . . . . . . . . . . . . . . . . 797.1.3 Selected Context-Capturing Method . . . . . . . . . . . . . . . . . 80
7.2 Content Analysis: Video Coding . . . . . . . . . . . . . . . . . . . . . . . . . 817.2.1 Selection of Observers . . . . . . . . . . . . . . . . . . . . . . . . . 847.2.2 Iterative Revisions to Coding Materials . . . . . . . . . . . . . . . . 857.2.3 The Coding Process . . . . . . . . . . . . . . . . . . . . . . . . . . 88
VIII. Methodology: Rich Video Data Analysis . . . . . . . . . . . . . . . . . . . . . 90
8.1 Reliability Assessment . . . . . . . . . . . . . . . . . . . . . . . . . . . . . . 908.2 Tackling Missing Data . . . . . . . . . . . . . . . . . . . . . . . . . . . . . . 93
8.2.1 What Leads to Missing Data? . . . . . . . . . . . . . . . . . . . . . 938.2.2 Summary of Missing Data Resolution Techniques . . . . . . . . . . 968.2.3 Multiple Imputation and Preference Data . . . . . . . . . . . . . . 97
8.3 Preference Modeling . . . . . . . . . . . . . . . . . . . . . . . . . . . . . . . . 1008.3.1 Preference Modeling . . . . . . . . . . . . . . . . . . . . . . . . . . 101
iv
8.4 Accounting for Individuality . . . . . . . . . . . . . . . . . . . . . . . . . . . 104
IX. Results . . . . . . . . . . . . . . . . . . . . . . . . . . . . . . . . . . . . . . . . . . . 106
9.1 Data Summarization . . . . . . . . . . . . . . . . . . . . . . . . . . . . . . . 1069.2 Agreement . . . . . . . . . . . . . . . . . . . . . . . . . . . . . . . . . . . . . 1109.3 Reliability . . . . . . . . . . . . . . . . . . . . . . . . . . . . . . . . . . . . . 1139.4 Imputation . . . . . . . . . . . . . . . . . . . . . . . . . . . . . . . . . . . . . 1149.5 Preference Modeling . . . . . . . . . . . . . . . . . . . . . . . . . . . . . . . . 116
9.5.1 Correlation . . . . . . . . . . . . . . . . . . . . . . . . . . . . . . . 1209.5.2 Multiple Regression . . . . . . . . . . . . . . . . . . . . . . . . . . . 122
9.6 Individuality . . . . . . . . . . . . . . . . . . . . . . . . . . . . . . . . . . . . 1259.7 Data Enhancement & Alternative Modeling . . . . . . . . . . . . . . . . . . 128
9.7.1 The Singly-Coded Data Set . . . . . . . . . . . . . . . . . . . . . . 1299.7.2 Regularization . . . . . . . . . . . . . . . . . . . . . . . . . . . . . . 130
X. Discussion & Conclusion . . . . . . . . . . . . . . . . . . . . . . . . . . . . . . . 134
10.1 Summaries & Results . . . . . . . . . . . . . . . . . . . . . . . . . . . . . . . 13410.2 Lessons Learned & Guidelines for Future Research . . . . . . . . . . . . . . . 138
10.2.1 Data Attrition . . . . . . . . . . . . . . . . . . . . . . . . . . . . . . 14010.2.2 Automated Notification Delivery . . . . . . . . . . . . . . . . . . . 143
10.3 Future Research Directions . . . . . . . . . . . . . . . . . . . . . . . . . . . . 14410.4 Contributions . . . . . . . . . . . . . . . . . . . . . . . . . . . . . . . . . . . 147
APPENDICES . . . . . . . . . . . . . . . . . . . . . . . . . . . . . . . . . . . . . . . . . . 150
BIBLIOGRAPHY . . . . . . . . . . . . . . . . . . . . . . . . . . . . . . . . . . . . . . . . 161
v
LIST OF FIGURES
Figure
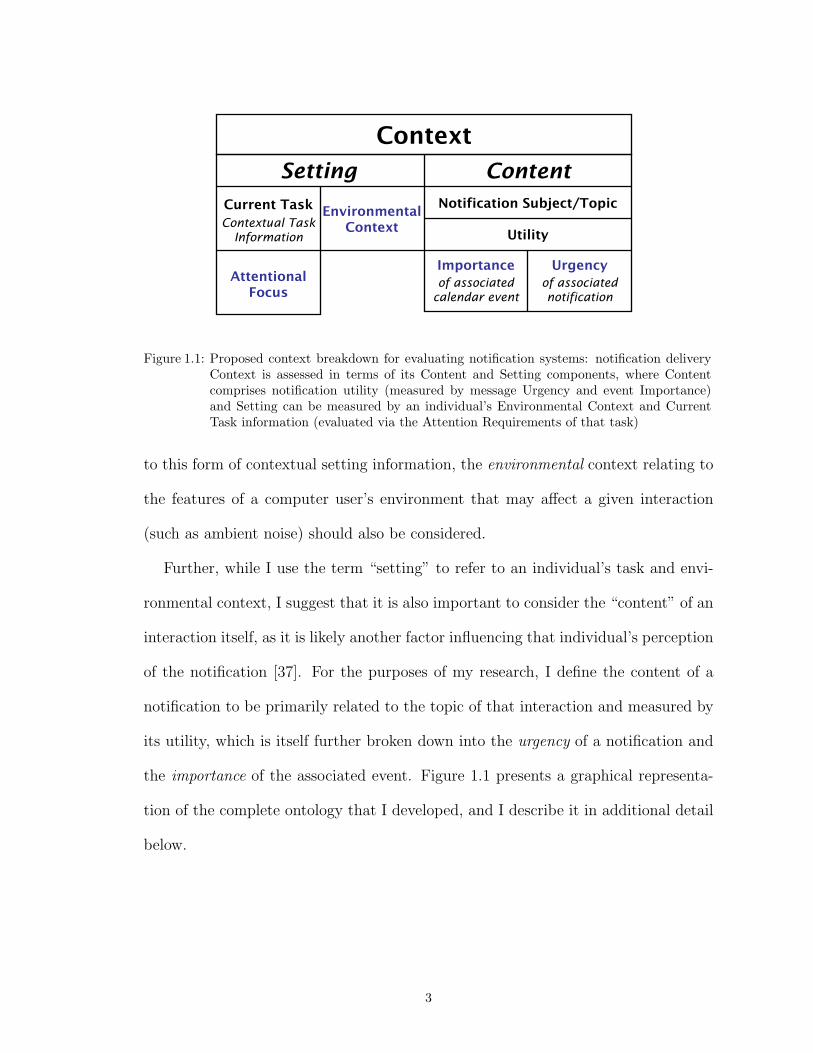
1.1 Proposed context breakdown for evaluating notification systems: notification de-livery Context is assessed in terms of its Content and Setting components, whereContent comprises notification utility (measured by message Urgency and eventImportance) and Setting can be measured by an individual’s Environmental Con-text and Current Task information (evaluated via the Attention Requirements ofthat task) . . . . . . . . . . . . . . . . . . . . . . . . . . . . . . . . . . . . . . . . . 3
3.1 Reminder presentation styles used in experimentation . . . . . . . . . . . . . . . . 28
3.2 Mean Annoyance Values for each of the eight reminder presentation styles . . . . . 32
3.3 Preference Results for the final phase of Study 1 displaying general trends andindividual preference differences. . . . . . . . . . . . . . . . . . . . . . . . . . . . . 40
4.1 The Bonus game. . . . . . . . . . . . . . . . . . . . . . . . . . . . . . . . . . . . . . 47
4.2 A small Memory board displaying an occluding notification. . . . . . . . . . . . . . 48
4.3 A large Memory board displaying a peripheral notification. . . . . . . . . . . . . . 49
4.4 Feedback buttons for rating each notification delivery format upon receipt of anotification. . . . . . . . . . . . . . . . . . . . . . . . . . . . . . . . . . . . . . . . . 50
4.5 The number of positive ratings for each type of notification delivered in each ofthe eight contextual scenarios: {high, low} task focus x {high, low} importance x{high, low} urgency. Each notification was rated individually; with 28 participants,any notification in any context could receive up to 28 positive ratings. . . . . . . . 53
4.6 The number of times Occluding, Peripheral and Auditory notifications were rankedhighest in participants’ reflective ratings, in all contexts with the low focus task(left) and high focus task (right). . . . . . . . . . . . . . . . . . . . . . . . . . . . . 55
vi
4.7 Individual reflective preferences paired with reactive preference ratings, groupedby task session (high and low focus): each column represents a single user; the toprow of boxes in each session displays individual users’ format preferences duringthat session (corresponding to the groupings indicated by the reflectively preferrednotification format), and the four boxes beneath each user’s reflective preferencepresent a visual description of that user’s reactive preference ratings: light blue sig-nifies a positive rating for the occluding notification delivered in the given context,orange indicates a positive rating for the peripheral notification, and dark blue in-dicates a positive rating for the auditory notification. If more than one notificationwas rated positively, multiple colors share the space. Empty spaces indicate thatno notification was rated positively in that context. . . . . . . . . . . . . . . . . . . 57
5.1 Effects of importance, urgency and attention requirements on desirability ratingsfor each notification delivery format as part of the abstract survey (n=17). Valuesin each cell represent the proportion of scenarios characterized by a certain con-textual element (high or low importance, urgency, or task concentration) for whichrespondents indicated that the associated notification delivery format would be de-sirable. For example, the top left cell in this figure indicates that of all the scenariosin which event importance was high, 43% of responses included an designation ofCommunicator (instant) messages as desirable means of notification delivery. . . . 66
5.2 Effects of importance, urgency and attention requirements on desirability ratings foreach notification delivery format as part of the grounded survey (n=17). Each valuerepresents the proportion of scenarios characterized by a certain contextual element(high or low importance, urgency, or task concentration) for which respondentsindicated that the associated notification delivery format would be desirable. . . . 66
5.3 Extent of differences in reported satisfaction with each notification format: thedarker the square, the larger the difference in satisfaction rating between surveys. . 67
6.1 Feedback buttons used by participants to log their notification preferences . . . . . 77
7.1 Above: A sample text file listing each feedback instance logged during Study 4experimentation. Below: The associated spreadsheet and observer’s coded values. . 92
9.1 Percentage of missing values for each variable in the Study 4 feature set of 1302total feedback instances. . . . . . . . . . . . . . . . . . . . . . . . . . . . . . . . . . 111
9.2 Visualization of missingness in the set of feedback instances for which both observersagreed on Notification Type (N=361). . . . . . . . . . . . . . . . . . . . . . . . . . 113
9.3 Raw inter-observer agreement across variables in the Study 4 feature set: the dark-est section at the bottom of each bar represents the number of instances on whichraters agree for a given variable; the second bar from the bottom in the next darkestgray represents two observers providing conflicting values for a variable; the thirdbar from the bottom represents the instances for which only one observer provideda value; and the top segment of each bar in the lightest shade of gray representsinstances for which neither observer provided a value for that variable. . . . . . . . 115
9.4 Raw inter-observer agreement across variables in the Study 4 NTA feature set:Much higher proportions of between-coder agreement can be observed, as well as amuch lower percentage of instances for which neither observer provided a value. . . 118
vii

9.5 A graphical depiction of individual effects on the log odds of positive notificationfeedback. Each data point represents a single participant’s effect, and the solidhorizontal line describes the model’s intercept, -0.75, which, as expected, separatesthe individual effects roughly in half. . . . . . . . . . . . . . . . . . . . . . . . . . . 133
9.6 Percentage of missing values for each variable in the SC feature set (N=482). Notethat only one observer’s coded values are represented for each instance. . . . . . . . 136
10.1 A graphical depiction of the areas in which data attrition occurred during Study 4data collection and coding. . . . . . . . . . . . . . . . . . . . . . . . . . . . . . . . . 147
10.2 Specific areas of data attrition in Study 4 and some potential solutions to be adoptedin future studies. . . . . . . . . . . . . . . . . . . . . . . . . . . . . . . . . . . . . . 149
viii
LIST OF TABLES
Table
3.1 Estimated marginal means over scenarios . . . . . . . . . . . . . . . . . . . . . . . 39
7.1 A sample set of video names depicting the adopted naming scheme, including bothscreen capture and environment capture videos . . . . . . . . . . . . . . . . . . . . 91
7.2 Sample coding spreadsheet for four feedback instances provided by participant 349on May 11th & 12th—values for each of these variables were included in each spread-sheet provided to observers. . . . . . . . . . . . . . . . . . . . . . . . . . . . . . . . 92
8.1 Pseudocode for the 2-step imputation process that was adopted for handling missingvalues and observer disagreement. In Step 1, five data sets with no missing valuesare generated for each coder through multiple imputation; in Step 2, disagreementsbetween coders are resolved to create five complete data sets that do contain missingvalues, and the values for this missing data are generated using single imputationto arrive at a final five complete data sets. . . . . . . . . . . . . . . . . . . . . . . . 103
9.1 Agreed-upon values (N=361) in the NTA data set for the Notification Type feature:this table lists each notification type, the number of instances (n) of that type, andthe proportion of those instances provided a positive rating. Note that of thenotification type values for which both coders agreed, there were no instances of aText Message (T), and types described as Other (O) are excluded from this tablebecause they provide no additional information and were as a result combined intothe NA (unknown) category. . . . . . . . . . . . . . . . . . . . . . . . . . . . . . . 116
9.2 Confusion matrix for notification formats as coded by observers. Email and emailnotifications (E/EN) were most frequently confused (k=40), followed by face-to-face notifications and email (F/E, k=19); and confusion was also high betweeninstant messages and emails (IM/E, k=13), email notifications (IM/E, k=13), andface-to-face notifications (IM/F, k=12). . . . . . . . . . . . . . . . . . . . . . . . . 117
9.3 Krippendorff’s Alpha scores for reliability: overall (N=1302) and for the NTA in-stances, for which both observers agreed on the notification type category (N=361).Scores denoted with an asterisk (*) indicate that they are above 0.5, and embold-ened scores signify values above the 0.67 research threshold. . . . . . . . . . . . . . 119
9.4 Krippendorff’s Alpha scores for reliability after the first phase of imputation (inwhich there are still two sets of coded values for each feedback instance). Mostnotable is the deviation in reliability (to a much lower value) for the Number ofRecipients feature. Other features showed little change, with nearly the same setof reliable features post-imputation. . . . . . . . . . . . . . . . . . . . . . . . . . . . 121
ix
9.5 A summary of NTA feedback instances (N=361) for which notification type wasgrouped into three broader categories: phone-based notifications (delivered to mo-bile or desk phones), computer-based notifications (emails and email notifications,instant messages, and reminders), and in-person (or face-to-face) notifications. Thetable indicates the total number of feedback ratings associated with each notifica-tion type category, and the percentage of positive feedback ratings for any notifica-tion type within that category. Again the T and O types are omitted due to lackof data. . . . . . . . . . . . . . . . . . . . . . . . . . . . . . . . . . . . . . . . . . . 124
9.6 Chi-square tests for independence between notification type and feedback rating(positive or negative), for the instances in which (1) both observers agreed on thenotification type, and (2) notification type was grouped into three categories: in-person, phone-based, and computer-based. Results indicate that in both cases,notification type is indeed influential on preference ratings (especially after catego-rizing notifications, which provides strong evidence for rejecting the null hypothesisthat feedback ratings are independent of notification type category. . . . . . . . . . 125
9.7 Correlation coefficients between reliable numerical variables: there is only one mod-erately strong, positive correlation between Application Panes and # Chat Windowsand no other pair of distinct numerical variables. . . . . . . . . . . . . . . . . . . . 126
9.8 The value of Cramer’s V association coefficient for each pair of reliable categoricalvariables. No two distinct variables are found to be strongly correlated (no 95%confidence interval extends beyond 0.39, which is considered only weak correlation). 127
9.9 Parameter estimates for each of the predictor variables in the model with highestpredictive ability (where Notification Type is grouped into “Computer Based” (CB),“In-Person” (IP), and “Phone Based” (PB—not exhibited because it is used as thereference) notification delivery methods. The two rightmost columns show trainingand test set Dxy values, which equate to A′ values of 0.68 and 0.66 respectively. . . 130
9.10 A visualization of the notification formats to which each individual provided posi-tive (white rows) and negative (shaded rows) feedback. . . . . . . . . . . . . . . . . 132
9.11 Parameter estimates: log odds effect and odds effect (again with a categorizedversion of Notification Type) for each of the predictor variables in the model withhighest predictive ability, with (rightmost two columns) and without (first twocolumns after predictor names) the inclusion of a random effect to account forindividual differences. . . . . . . . . . . . . . . . . . . . . . . . . . . . . . . . . . . 133
9.12 Parameter estimates for the SC data set: log odds effect and odds effect for thosevariables (with coefficients larger than 0.1 in either direction from zero) foundparticularly predictive in a regularized model. . . . . . . . . . . . . . . . . . . . . . 137
9.13 Parameter estimates for the NTA data set: log odds effect and odds effect for thosevariables (with coefficients larger than 0.1 in either direction from zero) foundparticularly predictive in a regularized model. . . . . . . . . . . . . . . . . . . . . . 138
9.14 Predictive accuracy measures for (1) SC and NTA preference models prior to reg-ularization, i.e., as a set of learned coefficients paired with every one of the reliablevariables; (2) SC and NTA preference models after regularization has been per-formed to reduce the number of prominent model variables; and (3) the regularizedSC model evaluated on the NTA data set and the regularized NTA model evaluatedon the SC data set. . . . . . . . . . . . . . . . . . . . . . . . . . . . . . . . . . . . . 139
x
D.1 Summary statistics for each of the three categorical variables Notification Type,Topic, and Desk Position, followed throughout the imputation process. The firstcolumn lists variable names, and each of the next three columns describe howdata values were divided among categories. The second column describes the twoinitial data sets (coded by two sets of observers) and includes category names (forNotification Type: C=cell phone, D=desk phone, E=email, EN=email notification,F=face-to-face, IM=instant message, and R=reminder; for Topic: E=experimenterinitiated, P=personal, and W=work; and for Desk Position, SA=seated but facingaway, SF=seated and facing the computer, SDA=standing and facing away, andSDF=standing and facing computer. The second column also indicates the totalnumber of coded values (the rest were missing); both other columns describe post-imputation data and thus no missing values existed. The format of each of thetables following is similar, but for the type of variables (continuous and binary). . . 174
D.2 Summary statistics for each continuous variable throughout the imputation process.The two numbers in brackets describe low and high values (e.g., the lowest valuecoded for the number of Application Panes was 2 and the highest was 127 forthe first observer set, and 118 for the second). Bolded numbers represent themean value, and in parentheses the standard deviation. Again “N” describes thenumber of coded values in the two original coded data sets upon being turned inby observers, and N is missing in the last two columns, because they both describedata after an imputation process has rendered each data set complete. . . . . . . . 175
D.3 Summary statistics for each binary variable throughout the imputation process.The first element of the two summary values describes the number of “False” oc-currences, and the second number represents “True”—as an example, in the firstdata set, there were thought to be Blinking Panes in the task bar upon receipt of26 notifications, and in 333 instances nothing was blinking when the notificationarrived. . . . . . . . . . . . . . . . . . . . . . . . . . . . . . . . . . . . . . . . . . . 176
D.4 Summary statistics for binary variables throughout the imputation process. Thefirst value in each numbered pair represents “False” and the second represents“True”. For instance, in the first data set, there was an Immediate Response to anotification in just over twice as many instances as those in which the participant’sresponse was not thought to be immediate. . . . . . . . . . . . . . . . . . . . . . . 177
D.5 Summary statistics for binary variables throughout the imputation process. Likethe two preceding tables, the first value in each summary-pair represents “False”(as in, in 4 cases there was no Blackout), and the second value indicates thoseinstances that observers coded as “True”. . . . . . . . . . . . . . . . . . . . . . . . 178
xi

LIST OF APPENDICES
Appendix
A. Coding Protocol . . . . . . . . . . . . . . . . . . . . . . . . . . . . . . . . . . . . . . . 159
B. Non-Disclosure Agreement . . . . . . . . . . . . . . . . . . . . . . . . . . . . . . . . . 162
C. Code Book . . . . . . . . . . . . . . . . . . . . . . . . . . . . . . . . . . . . . . . . . . 164
D. Preference Data Evolution through Imputation . . . . . . . . . . . . . . . . . . . . . 173
xii
ABSTRACT
Pssst...or Boo!Assessing the Predictability of Notification Delivery Preferences
byJulie Sage Weber
Chair: Martha E. Pollack
The focus of my dissertation research is on the examination of notification systems
that harness different presentation formats for notification delivery, the preferences
that individuals express for these various types of notifications, and how these pref-
erences are affected by contextual information surrounding notification delivery. My
research is unique from other work in the literature in two primary ways. First, while
the majority of prior work addressing notification delivery, both in terms of format
and timing, has focused on the effects of a notification on an individual’s performance
on a given task or set of tasks, my focus is the individual’s perception of notifications,
and particularly on that individual’s preferences for different notification formats de-
livered within different contextual scenarios. An interest in this question is motivated
by prior studies that have shown that annoyance with computer-human interactions
is a primary reason behind user abandonment of interactive software systems [57, 88].
xiii

Second, my preliminary findings suggest that different people prefer different types
of notifications in different contexts, which motivates a change of focus in the devel-
opment of such systems toward customizing notifications not only to the features of
an individual’s context but also to the individual him- or herself. In this dissertation,
in an attempt to model the ability of a machine attempting to customize its interac-
tions to the user input it receives, individuality is measured at the level of revealed
preferences; I do not attempt to understand the underlying individual differences
that may also prove themselves to be factors behind the stated notification prefer-
ences examined here. I will describe four user studies I conducted to understand
how preferences are exhibited in different contextual situations, detail the method-
ology followed and a set of guidelines for conducting similar studies (specifically in
a rarely studied, naturalistic setting), and show how certain techniques from the
area of statistics and user modeling can address the apparent need for personalized,
context-sensitive notifications. An additional element of novelty in my work is that
my final study was conducted in a purely naturalistic office environment, in which
the notifications evaluated were precisely those notifications being delivered to study
participants throughout their workday.
The primary contribution of this dissertation is twofold: a detailed analysis of the
methodology for the design, data collection, and analysis of a study of notification
preferences in a naturalistic setting with a great deal of inherent complexity; and a set
of results, based on the analysis of preference data acquired in various settings, about
how an individual’s contextual environment, and the content of a given notification,
can affect that individual’s preferences for notification delivery.
xiv

CHAPTER I
Introduction
Of today’s intelligent notification systems, there can be considered three broad
categories: those whose intelligence lies in their natural (i.e., pre-configured) ability
to understand their users (and, in turn, the needs and preferences of those users)
but without the ability to distinguish between users—essentially acting as “glori-
fied alarm clocks” [73]; those systems that can be adjusted (or re-configured) by
their users to understand users’ (individual) needs and preferences (such as Google
Calendar’s ability to accept modifications to its event-reminder alarm [15])—often
a cumbersome process, however; and those systems that automatically adjust (or
continually configure) themselves in response to implicit user input (e.g., Microsoft
Word’s menu modification mechanism to account for frequency of use [20]). Noti-
fication systems in this third, self-configuring, category can be further categorized
by the type of input and information to which they can adapt (and some of these
even fold in an element of customizability [14]). Some systems, for instance, are
designed to adapt their user interactions to an individual’s contextual setting [50],
such as current task information, or to some aspect of the individual’s environmental
context, such as ambient noise [46] or a user’s location [81] or devices currently in
use [7].
1

Timing the delivery of a notification, as in, adapting appropriately to a user’s
current situation, is also an important consideration for intelligent interactive devices.
There has been a series of research efforts devoted to examining the question of
when to interrupt a computer user engaged in a particular task, e.g., [22, 48, 50].
One important limitation of these studies is that they consider only a measure of an
individual’s interruptibility, whereas I suggest that the problem of pinpointing the
exact moment at which a computer user is “most interruptible” may be mitigated by
considering, in addition or instead, the presentation modality for a given notification
appropriate to the given context. If, for example, a notification must be delivered
at a time at which a computer user may not appreciate an interruption, delivery of
that notification in a minimally intrusive manner may in fact be acceptable, such
that instead of attending to that notification immediately and becoming irritated
or losing his or her train of thought, the user could address the notification content
at the next convenient point in time. This assertion, though difficult to address
without simultaneously studying both questions of when and how to interrupt, will
be examined in part within my dissertation research.
A further limitation of many of the present-day systems that continually configure
themselves, specifically to address the question of when to issue a notification, relates
to their examination of the context accompanying an interaction. More specifically,
they tend to consider a restricted form of context, often focusing solely on the infor-
mation regarding a user’s current task or activity, as a measure of interruptibility.
Instead, I introduce a new ontology for considering a more general, comprehensive
form of context with respect to notification delivery. While current task information
is a component of the general setting associated with a notification, it only relates to
the context associated with an individual’s activity or computer usage. In addition
2
Context
Content
Current Task
Utility
Environmental Context
AttentionalFocus
Importance Urgency
Contextual Task Information
of associated calendar event
of associated notification
Notification Subject/Topic
Setting
Figure 1.1: Proposed context breakdown for evaluating notification systems: notification deliveryContext is assessed in terms of its Content and Setting components, where Contentcomprises notification utility (measured by message Urgency and event Importance)and Setting can be measured by an individual’s Environmental Context and CurrentTask information (evaluated via the Attention Requirements of that task)
to this form of contextual setting information, the environmental context relating to
the features of a computer user’s environment that may affect a given interaction
(such as ambient noise) should also be considered.
Further, while I use the term “setting” to refer to an individual’s task and envi-
ronmental context, I suggest that it is also important to consider the “content” of an
interaction itself, as it is likely another factor influencing that individual’s perception
of the notification [37]. For the purposes of my research, I define the content of a
notification to be primarily related to the topic of that interaction and measured by
its utility, which is itself further broken down into the urgency of a notification and
the importance of the associated event. Figure 1.1 presents a graphical representa-
tion of the complete ontology that I developed, and I describe it in additional detail
below.
3
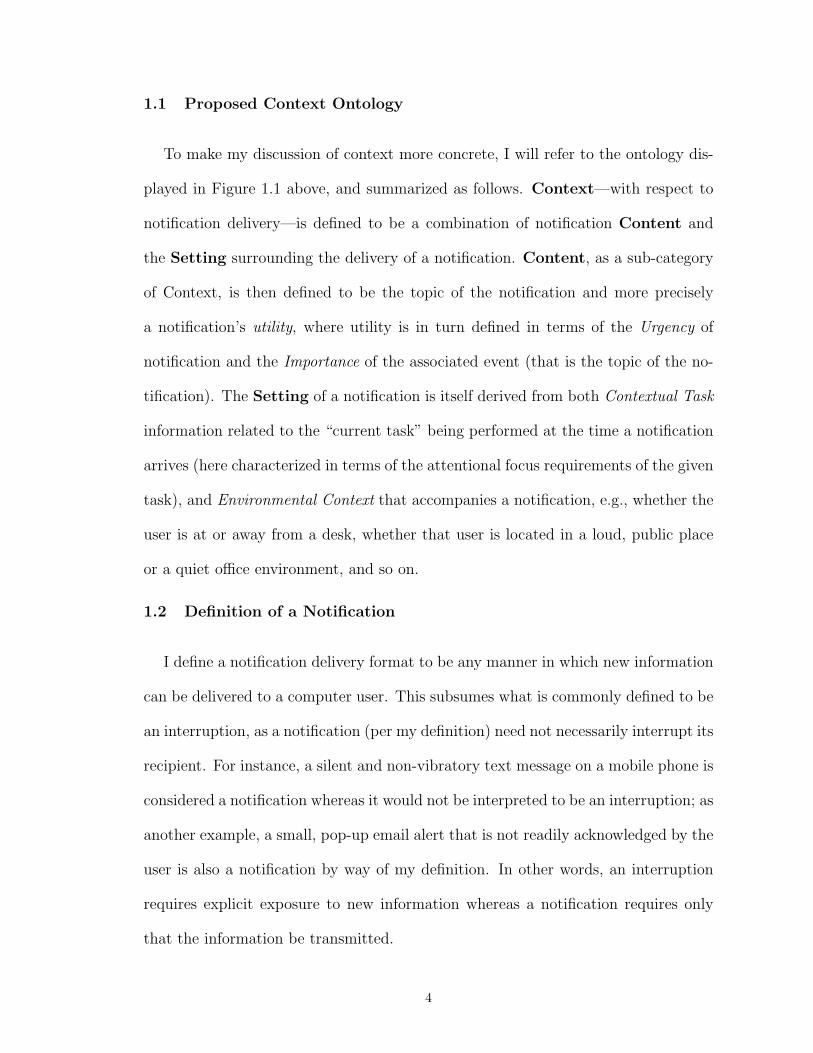
1.1 Proposed Context Ontology
To make my discussion of context more concrete, I will refer to the ontology dis-
played in Figure 1.1 above, and summarized as follows. Context—with respect to
notification delivery—is defined to be a combination of notification Content and
the Setting surrounding the delivery of a notification. Content, as a sub-category
of Context, is then defined to be the topic of the notification and more precisely
a notification’s utility, where utility is in turn defined in terms of the Urgency of
notification and the Importance of the associated event (that is the topic of the no-
tification). The Setting of a notification is itself derived from both Contextual Task
information related to the “current task” being performed at the time a notification
arrives (here characterized in terms of the attentional focus requirements of the given
task), and Environmental Context that accompanies a notification, e.g., whether the
user is at or away from a desk, whether that user is located in a loud, public place
or a quiet office environment, and so on.
1.2 Definition of a Notification
I define a notification delivery format to be any manner in which new information
can be delivered to a computer user. This subsumes what is commonly defined to be
an interruption, as a notification (per my definition) need not necessarily interrupt its
recipient. For instance, a silent and non-vibratory text message on a mobile phone is
considered a notification whereas it would not be interpreted to be an interruption; as
another example, a small, pop-up email alert that is not readily acknowledged by the
user is also a notification by way of my definition. In other words, an interruption
requires explicit exposure to new information whereas a notification requires only
that the information be transmitted.
4
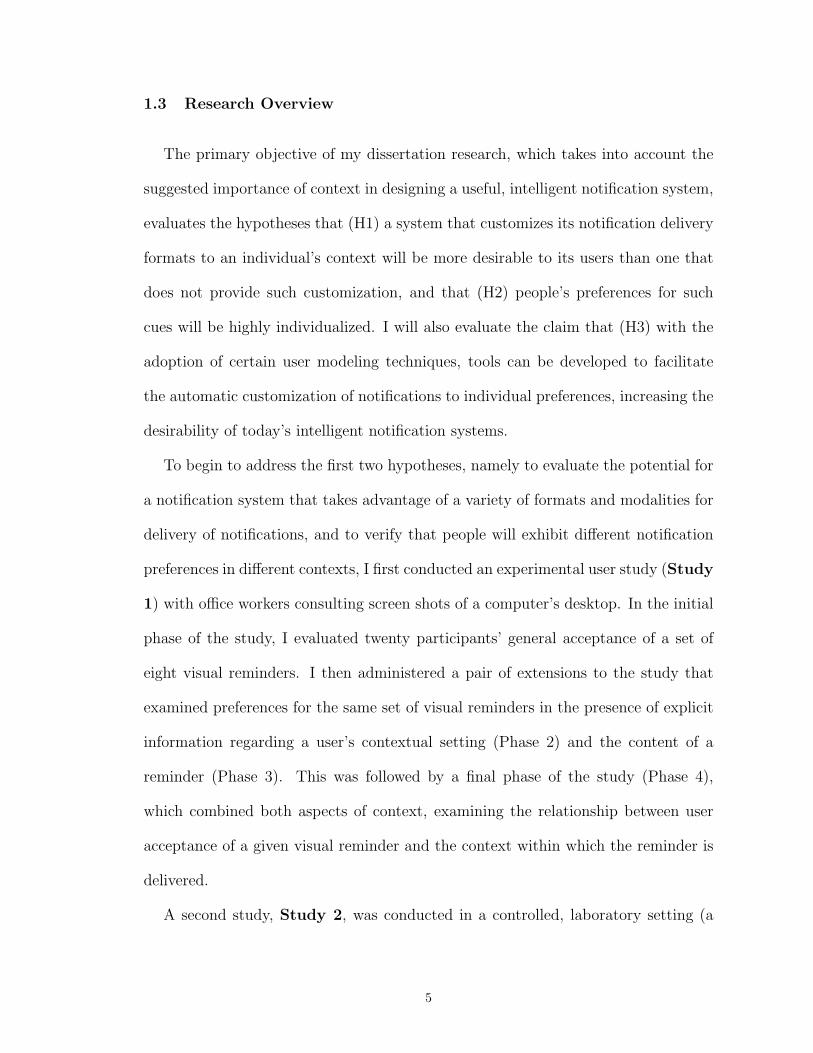
1.3 Research Overview
The primary objective of my dissertation research, which takes into account the
suggested importance of context in designing a useful, intelligent notification system,
evaluates the hypotheses that (H1) a system that customizes its notification delivery
formats to an individual’s context will be more desirable to its users than one that
does not provide such customization, and that (H2) people’s preferences for such
cues will be highly individualized. I will also evaluate the claim that (H3) with the
adoption of certain user modeling techniques, tools can be developed to facilitate
the automatic customization of notifications to individual preferences, increasing the
desirability of today’s intelligent notification systems.
To begin to address the first two hypotheses, namely to evaluate the potential for
a notification system that takes advantage of a variety of formats and modalities for
delivery of notifications, and to verify that people will exhibit different notification
preferences in different contexts, I first conducted an experimental user study (Study
1) with office workers consulting screen shots of a computer’s desktop. In the initial
phase of the study, I evaluated twenty participants’ general acceptance of a set of
eight visual reminders. I then administered a pair of extensions to the study that
examined preferences for the same set of visual reminders in the presence of explicit
information regarding a user’s contextual setting (Phase 2) and the content of a
reminder (Phase 3). This was followed by a final phase of the study (Phase 4),
which combined both aspects of context, examining the relationship between user
acceptance of a given visual reminder and the context within which the reminder is
delivered.
A second study, Study 2, was conducted in a controlled, laboratory setting (a
5
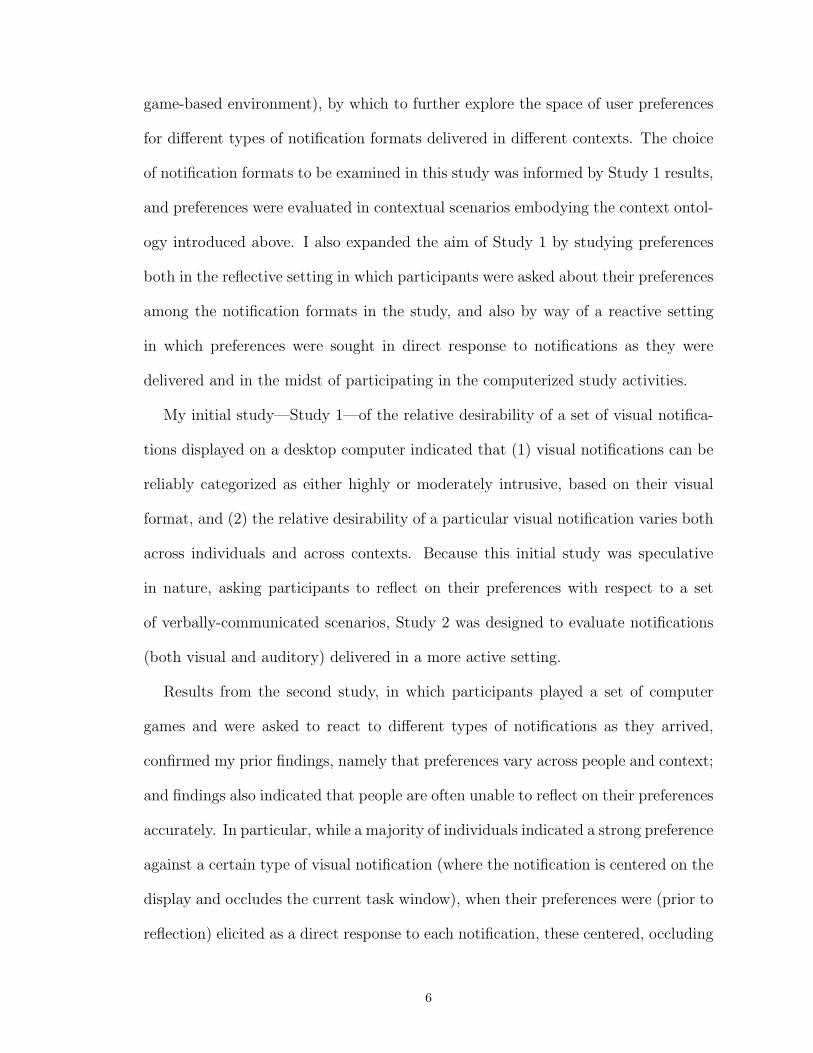
game-based environment), by which to further explore the space of user preferences
for different types of notification formats delivered in different contexts. The choice
of notification formats to be examined in this study was informed by Study 1 results,
and preferences were evaluated in contextual scenarios embodying the context ontol-
ogy introduced above. I also expanded the aim of Study 1 by studying preferences
both in the reflective setting in which participants were asked about their preferences
among the notification formats in the study, and also by way of a reactive setting
in which preferences were sought in direct response to notifications as they were
delivered and in the midst of participating in the computerized study activities.
My initial study—Study 1—of the relative desirability of a set of visual notifica-
tions displayed on a desktop computer indicated that (1) visual notifications can be
reliably categorized as either highly or moderately intrusive, based on their visual
format, and (2) the relative desirability of a particular visual notification varies both
across individuals and across contexts. Because this initial study was speculative
in nature, asking participants to reflect on their preferences with respect to a set
of verbally-communicated scenarios, Study 2 was designed to evaluate notifications
(both visual and auditory) delivered in a more active setting.
Results from the second study, in which participants played a set of computer
games and were asked to react to different types of notifications as they arrived,
confirmed my prior findings, namely that preferences vary across people and context;
and findings also indicated that people are often unable to reflect on their preferences
accurately. In particular, while a majority of individuals indicated a strong preference
against a certain type of visual notification (where the notification is centered on the
display and occludes the current task window), when their preferences were (prior to
reflection) elicited as a direct response to each notification, these centered, occluding
6

notifications received more positive ratings than either small, peripheral notifications
or auditory notifications. This corroborates results from prior studies—including my
own Study 1—that suggest that even those notifications deemed annoying, intrusive,
or dissatisfying are acceptable on certain occasions (e.g., when perceived notification
utility is high [37]). Understanding notification preferences is thus closely tied to
determining the contexts within which specific notification formats are desirable to
a given individual.
To attempt to develop a more grounded sense of the role of context in under-
standing notification preferences, I conducted two additional studies in a naturalistic
office setting. The first, Study 3, consisted of a pair of surveys administered to office
workers in the same environment in which I also conducted Study 4 (summarized
in the paragraph below). Here in Study 3, people were asked about their general
notification delivery preferences in a similar fashion to the elicitation conducted in
Study 1, and they were also asked to consider various contextualized scenarios and
indicate the effects of these scenarios on their notification preferences. Findings were
consistent with my prior studies: while people’s individual preferences were indeed
individualized, the trend across contextualized scenarios was generally maintained.
Specifically when notification utility was high did respondents find more notification
delivery formats desirable. This trend also persisted across time; two similar surveys
were administered at the beginning and end of a three-month period, and while slight
shifts in preferences (as would be expected) were exhibited, general trends remained
the same.
A fourth and final experiment (Study 4) was then conducted in a truly natural-
istic setting: a bustling office environment. Notification preferences were evaluated
for actual, incoming notifications of various formats, and a large collection of rich
7

video data was acquired in the process. While collecting meaningful contextual data
was quite challenging, preliminary findings align well with each of the prior studies.
Specifically, notification formats as delivered in-the-wild are indeed differentiable
with respect to how they are perceived, and certain groups of formats (e.g., those
delivered over the phone) were found generally less desirable than other types of
notifications (such as those delivered via computer). In addition, there was again
a strong sense of individuality: the most useful user model was one that accounted
for differences among study participants, indicating that a successful notification
delivery system would customize itself to individuals in addition to context.
An additional component of my contributions attributed to Study 4 in particular
is the methodology I describe for taking individual steps toward conducting such
a naturalistic, and thus resource-intensive, study. Over the course of two chapters
in this document (Chapters VII and VIII), I describe in detail a framework for
conducting future studies of the like.
In the remainder of this dissertation, I will begin in Chapter II with a broad survey
of related research, describing a range of notification systems that consider a variety
of forms of context—including environmental setting- and content-based features in
particular—and have a variety of objectives, from assessing performance effects to
analyzing user preferences. Then, in Chapter III, I describe the preliminary user
study (Study 1) that I conducted to evaluate the intrusiveness and user acceptance
of a set of visual reminders. This includes an initial phase of the study focused
on assessing the perceived relative intrusiveness of a set of eight visual reminders
independent of context, followed by a piece-wise examination of user acceptance
of visual reminders in the presence of explicit context-based information related to
both the content of a notification and the user’s contextual setting. Chapter IV
8
then describes the laboratory study, Study 2, that I conducted to learn more about
preferences for multi-format notifications delivered in an actual, multi-task setting.
In Chapter V, I describe a pair of surveys I administered to build groundwork toward
understanding notification delivery preferences in the office environment in which
Study 4 would be conducted.
Chapter VI, then, begins the discussion of this fourth and final study, for which
experimentation was conducted in an office environment and sought to understand
people’s notification preferences in as natural a setting as possible. Chapters VII
and VIII present a methodological framework for collecting rich video data of par-
ticipants’ working environments in an unobtrusive fashion and analyzing that type
of data inclusive of the limitations inherent in collecting data in so natural a setting.
Results of this final study are described in Chapter IX, and the dissertation closes
with a discussion of the lessons learned on my path toward understanding in situ
notification preferences, a set of guidelines for conducting future research in this area,
and a detailed summary of the contributions of this work.
9
CHAPTER II
Background & Related Research
Notifications may be delivered in various ways by various applications, devices
and people. Some notification-delivering computer applications are freely available
or distributed with built-in computer software packages. Others are developed in
an academic or research setting and used as a proof-of-concept. In addition to
general research directions with respect to notifications, I will describe a variety of
notification systems that have been developed over the years, some of which have
been commercialized or are components of a commercial system, and others of which
have direct relevance to the research efforts that I am assuming for this dissertation.
Many notification systems are informed by some form of contextual information.
In discussing how context has been defined in the literature, I will reintroduce my
definition of context and describe how it relates to prior such definitions. Then I
will discuss prior work on notification delivery, including the study of both timing
and format of a notification and how each can be varied to become attuned to the
associated context.
2.1 Defining Context
There have been numerous efforts to define context and its relationship to in-
teractive systems. Dey, in a concise definition of context, defines it to be: “any
10
information that can be used to characterize the situation of an entity,” where an
entity is defined to be a particular person, place or object considered relevant to
user-application interaction, including both the user and the application [25].
In his oft-cited paper on the difficulty in defining context, Dourish asks, “How
can sensor technologies allow computational systems to be sensitive to the settings
in which they are used, so that, as we move from one physical or social setting to
another, our computational devices can be attuned to these variations?” [27]. His
argument is centered on the idea that there may be no general definition of context
but rather context should be defined by an individual user’s system interactions,
almost defining this in a Zen-like manner in which context defines itself on the fly.
Chalmers responds to Dourish’s claim that context is solely defined by the system
user in positing that the designer must predefine some version of context to have
a basis for understanding user interactions [16]. He further suggests that defining
context as such necessitates breaking it down, reductively, so that it becomes a
manageable entity. The question thus turns from whether to break context down into
its relevant parts respective to a given system to how best to objectively define it.
Further, addressing the question of how to define context requires the incorporation
of historical information related to system-user interactions [17].
The manner in which I define context with respect to notification systems is
informed by Chalmers’ argument coupled with various prior definitions of context
related to interactive systems in general. In particular, while Dourish suggests that
context and content cannot be separated without resulting in a loss of situational
understanding, Chalmers’ argument implies that breaking down context is often
necessary; I follow in defining context with respect to notifications in a manner that
breaks it down into one particularly manageable way that can be used to study
11

user notification preferences across situations (e.g., from reflective office settings to
game-playing environments to real-world work environments). While it is surely
not the only way that context, with respect to notification systems, can be defined,
it is a starting point for aligning different situations or scenarios for the sake of
comparison. I am also particularly interested in evaluating the interaction between
contextual features and users’ format-driven notification preferences.
Along the lines of Dey’s definition [25], my definition of context as seen in Fig-
ure 1.1 and respective to notifications represents a user’s situation as comprising
aspects of both a user’s setting (namely related to the task at hand and the out-
side environment) and also the content of the particular notification in question,
by way of its inherent importance and urgency. This will allow for comparison
between various systems and system structures, some of which, including the com-
mercial notification tools described below, do not incorporate contextual information
whatsoever, while others, described in subsequent sections of this chapter, consider
context in various configurations of its components.
2.2 Commercial Notification Tools
The current state-of-the-art in commercial notification technology is a set of sys-
tems that are configurable to various degrees. Two popular computerized calendar-
ing systems, the Google calendar [15] and Microsoft’s Outlook calendaring tool [65],
provide customizable notification support to their users. The Growl program [38]
for Macintosh computers allows users to configure notifications for various desktop
applications such as Skype [91], the eBay Watcher [51] and a variety of Yahoo! Wid-
gets [90]. Configuration options include enabling the system to deliver, or not deliver,
notifications from these applications; and a given notification can be delivered in a
12
particular user-selected format. FeedReader [30] is a customizable, aggregated RSS
reader that allows users to configure the delivery of the articles they receive, both by
the amount, or number of articles received over time, and also by delivery format.
While all of these systems are customizable, allowing a user to configure certain
aspects of their functionality to that user’s liking, they do not develop user models
that can, over time, inform the system on how to behave on its own in new situations.
For any new application, the Growl system, for example, will default to a particular
notification behavior until the user specifies otherwise. The Google Calendar is
similar, defaulting to a certain amount of time prior to an event (ten minutes),
and a certain format (pop-up window) for reminder delivery for that event. These
behaviors only change when a user manually modifies the associated values.
The next two sections of this chapter describe systems that attempt to understand
the best times and/or formats for notification delivery, rather than require a user to
inform the system single-handedly. More specifically, I will describe the manner in
which the timing of notifications has been studied, which I call the when component
to notification management, followed by a discussion of how notification format or
delivery style (the how), has itself been studied in the literature. My dissertation
research focuses on the latter, namely addressing the question of how to deliver a
particular notification in a particular context, but results from studying notification
timing will also inform the design of a successful multi-format notification system.
2.3 Context-Sensitive Notification: The “When”
Many of the studies and systems below refer to notifications that are delivered
in an office setting. Notification delivery has also been evaluated in a home envi-
ronment in which notifications refer to tasks around the house that have varying
13

levels of urgency and are delivered when people are in the process of performing
tasks that require varying levels of cognitive load and physical activity [84]. Here,
findings indicate that physical activity requirements do not affect users’ perceptions
of notification acceptability and that message urgency is the most important factor
influencing user perceptions of a given notification.
Cutrell, et al. [21] studied the effects of instant messaging on user performance
on a set of computerized tasks. Their primary result with respect to notification
timing indicates that when messages are delivered early on in the execution of a task,
people are more likely to forget the primary purpose of the task being performed. In
my research, through which I also received an indication of the effects of notification
timing, it was shown that different contexts lead to different behaviors in this regard:
in some cases, being interrupted early on in a task seems much less detrimental to
task progress than being interrupted later on.
2.3.1 Interruptibility
Other research efforts in context-sensitive notification attempt to discern a user’s
level of interruptibility at the time at which a notification is set to be delivered.
If the user is sufficiently busy (determined in a number of different ways), then a
notification may be deferred to a future point in time.
Adamczyk and Bailey [1] developed task models that predict the best and worst
times to deliver a notification. Their primarily quantitative results corroborate their
assessment of predictive power of their task models, namely that people are more
pleased with the notifications they receive when the system predicts a desirable time
for notification delivery, compared with those instances deemed less desirable by the
task models. And Iqbal and Bailey [50] determined that within certain types of
tasks, there are specific breakpoints (of different granularities) at which notifications
14
are most successfully delivered.
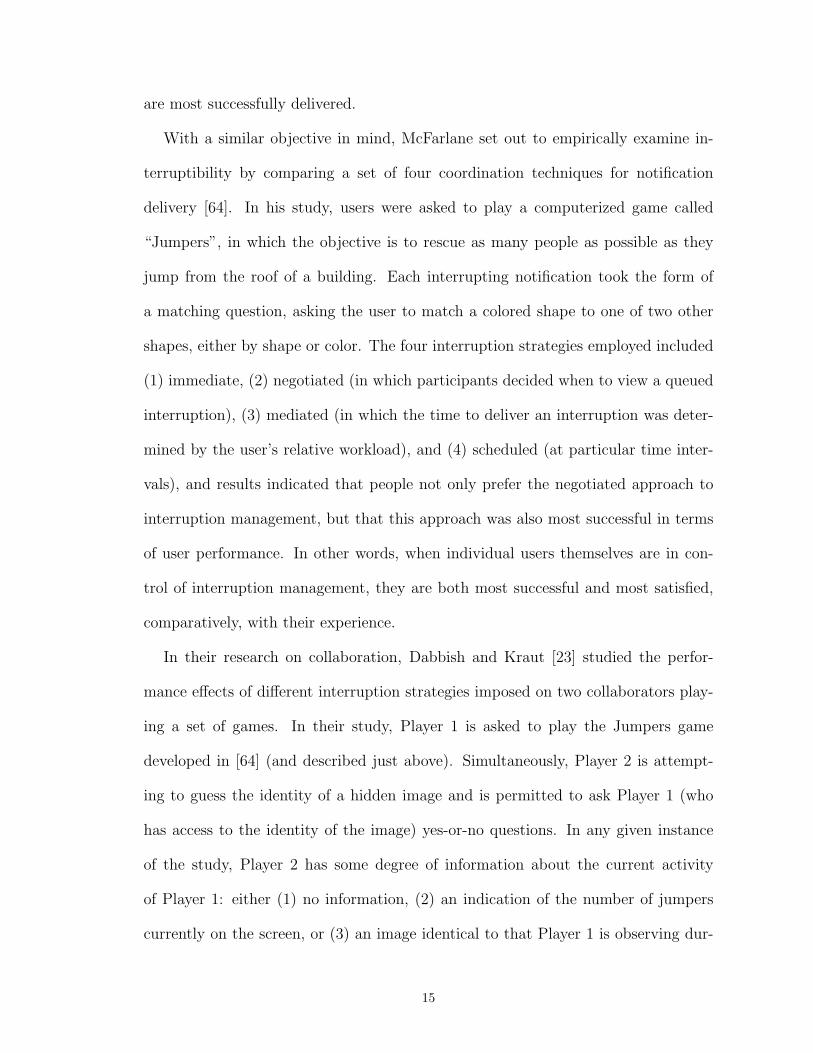
With a similar objective in mind, McFarlane set out to empirically examine in-
terruptibility by comparing a set of four coordination techniques for notification
delivery [64]. In his study, users were asked to play a computerized game called
“Jumpers”, in which the objective is to rescue as many people as possible as they
jump from the roof of a building. Each interrupting notification took the form of
a matching question, asking the user to match a colored shape to one of two other
shapes, either by shape or color. The four interruption strategies employed included
(1) immediate, (2) negotiated (in which participants decided when to view a queued
interruption), (3) mediated (in which the time to deliver an interruption was deter-
mined by the user’s relative workload), and (4) scheduled (at particular time inter-
vals), and results indicated that people not only prefer the negotiated approach to
interruption management, but that this approach was also most successful in terms
of user performance. In other words, when individual users themselves are in con-
trol of interruption management, they are both most successful and most satisfied,
comparatively, with their experience.
In their research on collaboration, Dabbish and Kraut [23] studied the perfor-
mance effects of different interruption strategies imposed on two collaborators play-
ing a set of games. In their study, Player 1 is asked to play the Jumpers game
developed in [64] (and described just above). Simultaneously, Player 2 is attempt-
ing to guess the identity of a hidden image and is permitted to ask Player 1 (who
has access to the identity of the image) yes-or-no questions. In any given instance
of the study, Player 2 has some degree of information about the current activity
of Player 1: either (1) no information, (2) an indication of the number of jumpers
currently on the screen, or (3) an image identical to that Player 1 is observing dur-
15

ing play. Results indicated that Player 2, when provided information regarding the
number of jumpers on the screen, was careful to interrupt only at those moments
at which it was likely not to interfere much with the performance of Player 1. This
strategy indeed resulted in better performance than when Player 2 was resigned to
interrupt haphazardly due to lack of contextual information. These results reflect
upon general notification strategies in that they provide an indication that contex-
tual task information, on a fine-grained level (not merely the task being performed
but the current state of that task), is useful for determining the best time to deliver
a notification. Their results further suggest that an abstract display indicating the
state of a remote user’s task (strategy (2) as described above), rather than a more
direct monitoring strategy, i.e., (3) above, is the best technique for indicating user
engagement or interruptibility with respect to distraction.
Through a Wizard-of-Oz study, Hudson and his colleagues [48] explored the man-
ner in which sensors can be used to predict a user’s interruptibility in the workplace.
By combining the predictions of a small set of easily-implementable sensors, includ-
ing an “anyone talking sensor,” a telephone, a keyboard, a mouse, and a time of day
sensor, the models developed were able to estimate user interruptibility with greater
than 75% accuracy.
2.3.2 System Deployments
The Gate Reminder [53] was an early attempt at a ubiquitous reminding system.
The system is located at the front door of a household and used to remind inhabitants
about objects or activities that they may otherwise forget at the time at which they
are leaving the house for the day. Context was determined by sensors inferring which
user is facing the door in preparation for leaving the house, at which point a reminder,
targeted at that particular user, would be issued. User evaluations indicated that
16
certain user-recognition sensors were more successful than others for determining
whose reminders to issue at a given time (i.e., when someone has approached the
door).
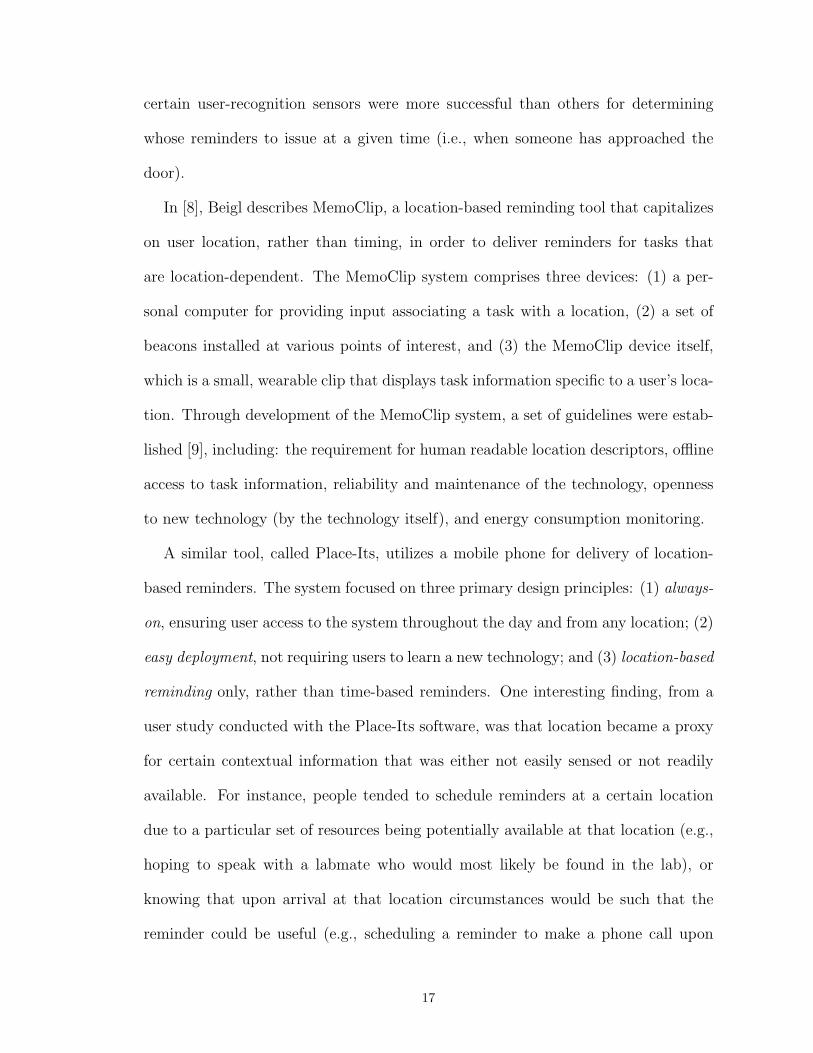
In [8], Beigl describes MemoClip, a location-based reminding tool that capitalizes
on user location, rather than timing, in order to deliver reminders for tasks that
are location-dependent. The MemoClip system comprises three devices: (1) a per-
sonal computer for providing input associating a task with a location, (2) a set of
beacons installed at various points of interest, and (3) the MemoClip device itself,
which is a small, wearable clip that displays task information specific to a user’s loca-
tion. Through development of the MemoClip system, a set of guidelines were estab-
lished [9], including: the requirement for human readable location descriptors, offline
access to task information, reliability and maintenance of the technology, openness
to new technology (by the technology itself), and energy consumption monitoring.
A similar tool, called Place-Its, utilizes a mobile phone for delivery of location-
based reminders. The system focused on three primary design principles: (1) always-
on, ensuring user access to the system throughout the day and from any location; (2)
easy deployment, not requiring users to learn a new technology; and (3) location-based
reminding only, rather than time-based reminders. One interesting finding, from a
user study conducted with the Place-Its software, was that location became a proxy
for certain contextual information that was either not easily sensed or not readily
available. For instance, people tended to schedule reminders at a certain location
due to a particular set of resources being potentially available at that location (e.g.,
hoping to speak with a labmate who would most likely be found in the lab), or
knowing that upon arrival at that location circumstances would be such that the
reminder could be useful (e.g., scheduling a reminder to make a phone call upon
17

arriving home).
The ComMotion system [62] is another device used to provide location-based re-
minders, here using GPS and audio cues, with the capacity for speech-based input.
A number of wearable systems have also been developed for location-based reminder
delivery, including the Reminder Bracelet [40], which was designed to be an unob-
trusive means for notifying a user using LEDs rather than an audio signal; Memory
Glasses [24], a head-mounted prototype system for face detection from memory re-
trieval cues; and the Remembrance Agent [77], which was an earlier version of a
head-mounted system that displayed contextually relevant suggestions to its user.
Fogarty expanded upon the study conducted in [48] and described in the preceding
section; he developed Subtle, a tool for discerning an individual’s interruptibility by
way of contextual indicators: a user’s location, computer-based event streams, and
environmental ambient noise. With respect to the ontology I developed for consider-
ing context, location and ambient noise information pertain to a user’s setting, and
particularly their environmental context; and event streams relate to a user’s current
task and potentially his or her attentional focus. Using information about a user’s
setting, Subtle develops an individualized, learned, and continually updated model
of the user’s interruptibility. This model can in turn be used in other applications,
e.g., to augment an instant messaging tool with user status updates [47].
Initial studies were conducted with the Castaway system [52] to learn about the
types of reminders most useful for a location-based system to deploy in terms of
characterization as time-based reminders or location-based reminders (or both, or
neither). Results showed that of 1,748 total tasks for a total of 35 people over a two-
week period, there were twice as many tasks that warranted a time-based reminder
as opposed to a location-based reminder (48% vs. 25% of all tasks). Studies also sug-
18
gested that mobile phones are a good modality for issuing notifications, with results
showing that people carry their mobile phones with them 95% of the time. This is a
useful statistic with particular relevance to Study 4 of this dissertation, which relies
on mobile phone-based notifications as one of many formats for notification delivery.
All of the work focused on interruptibility and notification timing is useful not
only toward better timing the delivery of notifications, but also with respect to
the delivery style of notifications. If and when it is the case that the timing of a
notification cannot be adjusted, an estimate of an individual’s interruptibility may
still be quite handy for determining the optimal manner in which a notification should
be presented. I will now turn to a discussion of how delivery style, or format, of a
notification has been studied in the literature.
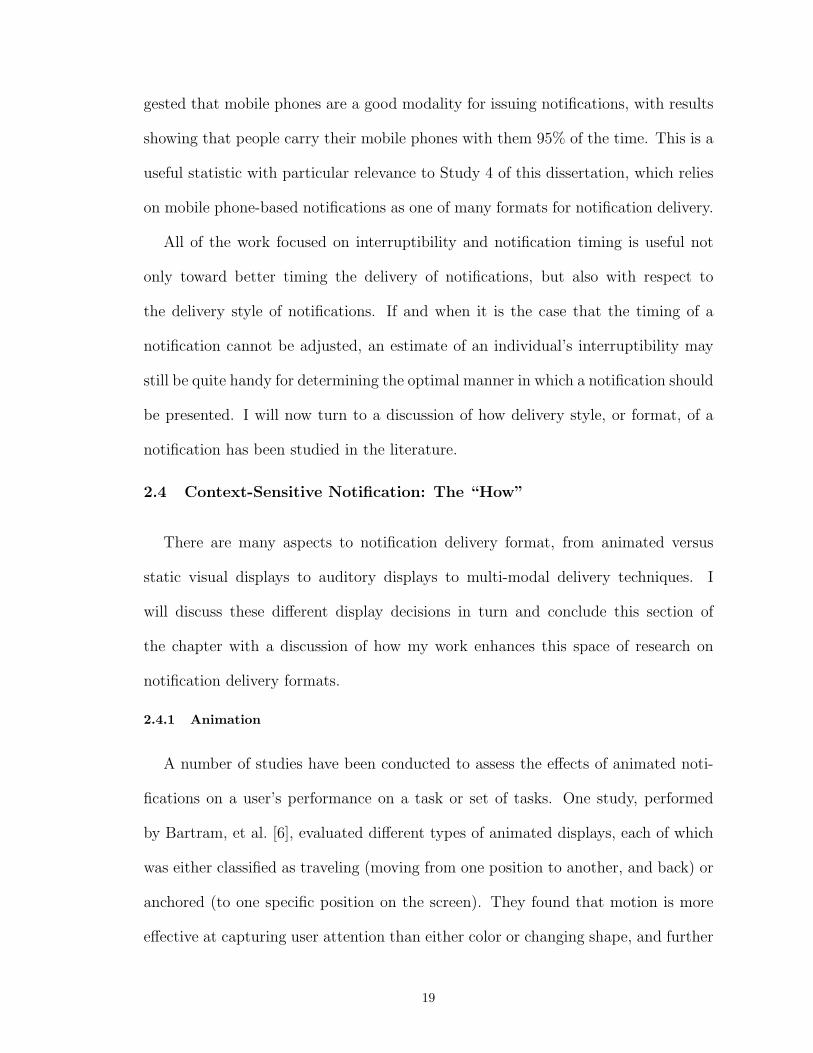
2.4 Context-Sensitive Notification: The “How”
There are many aspects to notification delivery format, from animated versus
static visual displays to auditory displays to multi-modal delivery techniques. I
will discuss these different display decisions in turn and conclude this section of
the chapter with a discussion of how my work enhances this space of research on
notification delivery formats.
2.4.1 Animation
A number of studies have been conducted to assess the effects of animated noti-
fications on a user’s performance on a task or set of tasks. One study, performed
by Bartram, et al. [6], evaluated different types of animated displays, each of which
was either classified as traveling (moving from one position to another, and back) or
anchored (to one specific position on the screen). They found that motion is more
effective at capturing user attention than either color or changing shape, and further
19

that traveling notifications are more distracting than anchored cues.
McCrickard, Catrambone & Stasko [63] examined the suitability of a particular
set of peripheral displays to lower-priority information awareness. The primary task
for each participant in their pair of studies was a set of browsing tasks, and the
secondary task was to monitor a peripheral display itself monitoring news, weather,
stock and sports information. The objective of the experiments was to compare
the performance and information access and retention effects of different animated
display types: blast, fade and ticker. The recommendations resulting from the data
acquired in their experiments are as follows: (1) certain animated displays cause only
slight negative impact on primary tasks similar to the browsing task in the study,
namely tasks that are not of especially high cognitive requirements (compared with
tasks examined in prior work within the literature, e.g., [60]); (2) for an objective
of rapid item identification, anchored displays (e.g., fade, blast) are more success-
ful than motion-based displays (e.g., ticker) in terms of efficient task completion;
(3) item identification is more successful with small displays; and (4) for long-term
comprehension and memorability, motion-based displays are more successful than
in-place displays.
Similar observations were made in [28] by Dutta, et al., which examined the
relative performance and disruption effects of ticker-based and fade-based peripheral
displays on tasks of higher attentional focus requirements than the browsing task
in [63]. Their work corroborates prior results, e.g., from [63, 60], showing that
animated displays are distracting to their users and decrease overall task performance
and also that static displays (their fade-based notifications) are better suited to
information awareness than animated displays (the ticker-based notifications) but
tend to be a worse choice for long-term information recall.
20

In her Masters thesis, Gluck [36] argues that “controlling the timing of inter-
ruption is not the only viable strategy for alleviating distraction and annoyance”
in notification systems. Instead, she explored a design guideline that suggests that
matching the attentional draw of an interruption to its suggested utility will increase
positive user perception of notifications. As one of the relatively few researchers in-
terested in exploring notification preferences (here in addition to performance), she
conducted a user study, described in [37], in which participants played a Memory
game and responded to interruptions of varying degrees of attentional draw. In one
experimental condition, notifications of high suggested utility (whose content was
especially useful for completing the task at hand) were matched with interruptions
that were previously deemed to be of high attentional draw. Another condition,
static, paired notification content to a single, medium-attentional draw signal; and
a control condition did not include any interruptions whatsoever. While there were
no noticeable differences between conditions in terms of user performance, there was
significantly less annoyance reported in the match condition. Perceived benefit of
the notification system was also higher in the match condition.
Another notification system that uses a single modality for notification delivery
is called Notiframe [11], and rather than visual notifications, it relies on the auditory
channel for notification delivery. Primary results from an experimental study of
Notiframe showed that voice similarity to a user’s own voice is the most successful
notification delivery method, in terms of speed of response, when compared with
both a familiar and unfamiliar voice as alternatives.
2.4.2 Multi-modality
Arroyo, et al. performed a study of the effects of notifications of multiple modal-
ities, including heat, smell, sound, vibration and light [4]. Their primary findings
21

indicate that, among the twelve study participants, there are no significant differ-
ences in the performance effects of the five notification modalities. Instead, the au-
thors suggest that individual differences related to people’s prior exposure to a given
modality are the primary indicator of the extent to which a particular notification
delivery modality is considered disruptive to a given user.
Another study of multi-modal notification delivery was tested using a system
called AROMA [12], which delivers olfactory notifications in the form of scents waft-
ing through the air. The disruptiveness and effectiveness of olfactory notifications
was compared with both auditory and visual notifications. Results indicate that
olfactory notifications, though shown to be less effective than the other two modali-
ties, is nonetheless least disruptive, and it is suggested that increased familiarity with
the olfactory modality for notification delivery will in turn increase its effectiveness
relative to the other modalities explored. Of particular interest to my dissertation
research is a result from post-study interviews with study participants, reflecting ”a
diversity of preferences” with respect to notification modality.
Mark, et al. [61] studied the effects of different types of interruptions on the per-
formance of a set of office tasks. They, like many of the others described above,
primarily considered the disruption costs (here relative to performance and emo-
tional effects, i.e., stress and frustration) of notifications rather than general user
desirability of, or preferences for, the format of interruption delivery.
With this in mind, my dissertation work explores the question of how best to de-
liver a notification not in terms of the effects on a user’s task performance, but rather
on that user’s preferences. While minimizing performance degradation is indeed im-
portant, it is not necessarily as important as ensuring that a user’s preferences are
met; for a system that does not behave in a satisfactory manner is a system that
22
may not be used, which in turn renders any performance factors moot.
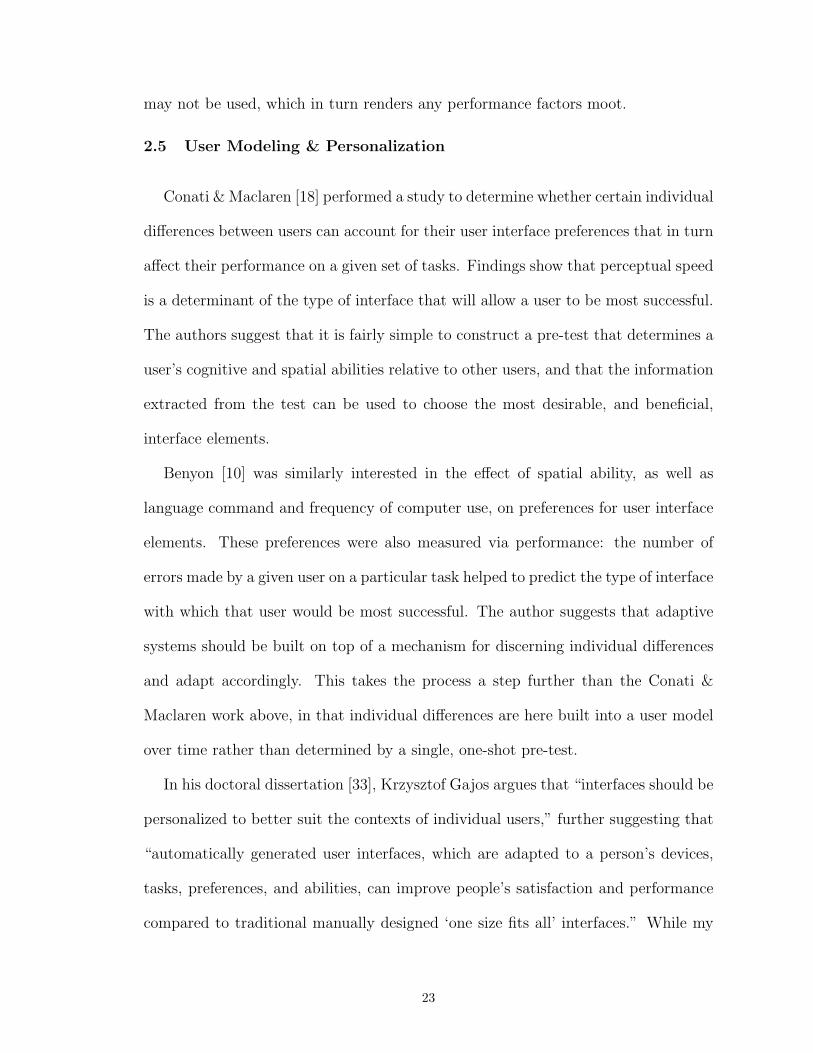
2.5 User Modeling & Personalization
Conati & Maclaren [18] performed a study to determine whether certain individual
differences between users can account for their user interface preferences that in turn
affect their performance on a given set of tasks. Findings show that perceptual speed
is a determinant of the type of interface that will allow a user to be most successful.
The authors suggest that it is fairly simple to construct a pre-test that determines a
user’s cognitive and spatial abilities relative to other users, and that the information
extracted from the test can be used to choose the most desirable, and beneficial,
interface elements.
Benyon [10] was similarly interested in the effect of spatial ability, as well as
language command and frequency of computer use, on preferences for user interface
elements. These preferences were also measured via performance: the number of
errors made by a given user on a particular task helped to predict the type of interface
with which that user would be most successful. The author suggests that adaptive
systems should be built on top of a mechanism for discerning individual differences
and adapt accordingly. This takes the process a step further than the Conati &
Maclaren work above, in that individual differences are here built into a user model
over time rather than determined by a single, one-shot pre-test.
In his doctoral dissertation [33], Krzysztof Gajos argues that “interfaces should be
personalized to better suit the contexts of individual users,” further suggesting that
“automatically generated user interfaces, which are adapted to a person’s devices,
tasks, preferences, and abilities, can improve people’s satisfaction and performance
compared to traditional manually designed ‘one size fits all’ interfaces.” While my
23
research does not propose to adapt an entire interface to suit a user’s context, I do
address the question of whether a single, generalized user model will suffice to predict
individual notification preferences or whether individualized models are required.
2.6 Notifications and Assistive Technology
Several systems have been developed to assist people with cognitive impairment
by providing them with reminders about their daily activities and/or the steps within
them [56, 89]. Some of these, such as Autominder [74] and COACH [13], use intel-
ligent reasoning techniques to ensure that the reminders are adapted to the specific
tasks that an individual must perform and the state of performance of those tasks.
However, they do not explicitly reason about the user’s preferences regarding the
form or timing of reminders.
Reminder systems for use in the workplace include CybreMinder [26], Forget-Me-
Not [55] and CALO [68]. CybreMinder uses contextual information to reason about
when to issue reminders, and the Forget-Me-Not system was designed to simulate its
user’s episodic memory with the objective of storing facts that the user may otherwise
forget. While CybreMinder focuses on when to remind, and Forget-Me-Not compiles
all of the information that could be required regarding what to remind, in neither case
do these systems tailor their reminders to individual users’ preferences, to specifically
answer the question of how to remind. CALO is a very large, complex system that
was designed to provide a broad range of services to its user. Calendar management
is one such service, and a portion of my dissertation work has been a part of the
CALO efforts and is a first step toward enabling CALO to tailor calendar-based
reminders to its users’ individual preferences.
24

CHAPTER III
Visual Notifications: Preliminary User Study
The research questions that I set out to answer in the preliminary phase of my
research, and that will be discussed in greater detail in this and the coming sections
of this dissertation, are the following:
(R1) What is the relationship between the visual presentation of a notification
and that notification’s perceived intrusiveness;
(R2) How is this relationship affected by consideration of the content of the re-
minder, the accompanying contextual setting, and the combination of reminder
content and contextual setting;
(R3) Are certain visual reminders generally preferred to others, with and with-
out the inclusion of peripheral information; and
(R4) What can be leveraged from the preference data acquired through these
preliminary preference evaluation measures?
To begin to address the above research questions, I performed an initial user
study that examined the relative intrusiveness and desirability of visual reminders.
In this section, I describe each of the four phases of the study. The first evaluated
the relationship between the visual representation of a reminder and its relative
level of annoyance, or intrusiveness. The other three phases examined the effects of
25

contextual information on the desirability of each of the visual reminders introduced
in the first phase of the study. In particular, Phase 2 of the study isolated contextual
task information and environmental context to evaluate the desirability of visual
reminders in various contextual setting conditions. Similarly, the third phase of the
study considered the content of a reminder in isolation and again evaluated each
visual reminder on its relative user acceptance level. Then, Phase 4 of the study
examined the effects of combining setting- and content-based information.
3.1 Phase 1: Intrusiveness
The objective of the first phase of this user study was to address the initial research
question R1 presented above, namely to examine the relationship between reminder
presentation style and perceived intrusiveness.
The primary hypothesis for this study was that:
(H1.1) When a visual reminder is examined completely independent of context,
different users will ascribe similar levels of perceived intrusiveness to the same
reminder presentation style, where presentation style is described in terms of
visual display features such as color and location on the screen (more below).
In this phase of the study, reminders were displayed with a single and specific form
of content-based information (each reminder included the phrase “Reminder: Group
meeting today at 12:30”), but participants were asked to disregard this information
to the extent possible and focus solely on the presentation style of each reminder.
26
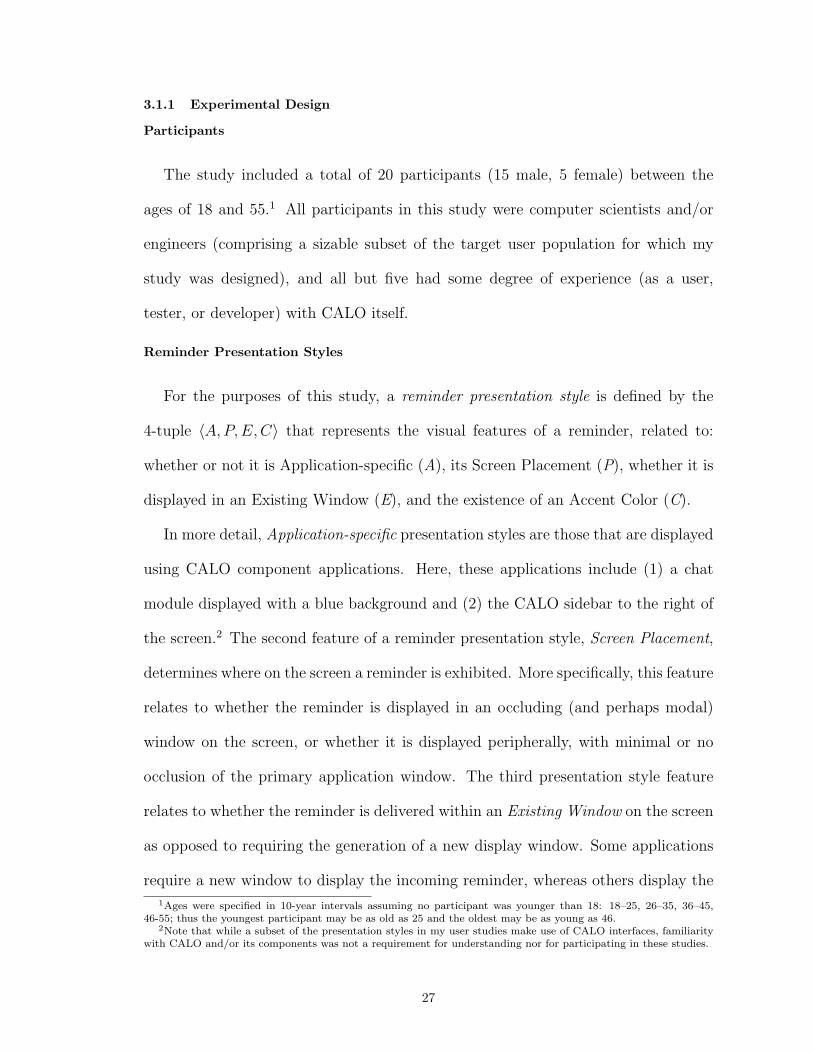
3.1.1 Experimental Design
Participants
The study included a total of 20 participants (15 male, 5 female) between the
ages of 18 and 55.1 All participants in this study were computer scientists and/or
engineers (comprising a sizable subset of the target user population for which my
study was designed), and all but five had some degree of experience (as a user,
tester, or developer) with CALO itself.
Reminder Presentation Styles
For the purposes of this study, a reminder presentation style is defined by the
4-tuple 〈A,P,E,C〉 that represents the visual features of a reminder, related to:
whether or not it is Application-specific (A), its Screen Placement (P), whether it is
displayed in an Existing Window (E), and the existence of an Accent Color (C).
In more detail, Application-specific presentation styles are those that are displayed
using CALO component applications. Here, these applications include (1) a chat
module displayed with a blue background and (2) the CALO sidebar to the right of
the screen.2 The second feature of a reminder presentation style, Screen Placement,
determines where on the screen a reminder is exhibited. More specifically, this feature
relates to whether the reminder is displayed in an occluding (and perhaps modal)
window on the screen, or whether it is displayed peripherally, with minimal or no
occlusion of the primary application window. The third presentation style feature
relates to whether the reminder is delivered within an Existing Window on the screen
as opposed to requiring the generation of a new display window. Some applications
require a new window to display the incoming reminder, whereas others display the
1Ages were specified in 10-year intervals assuming no participant was younger than 18: 18–25, 26–35, 36–45,46-55; thus the youngest participant may be as old as 25 and the oldest may be as young as 46.
2Note that while a subset of the presentation styles in my user studies make use of CALO interfaces, familiaritywith CALO and/or its components was not a requirement for understanding nor for participating in these studies.
27

Figure 3.1: Reminder presentation styles used in experimentation
28
reminder within a pre-existing application window. Finally, the fourth feature of a
reminder presentation style is its Color: it either includes or does not include an
accent color, or colors, for greater attentional draw.
In principle, these four (binary) features of a reminder presentation style suggest
that there are 24 = 16 possibilities for representing visual reminders on the computer
screen. This space of possibilities is easily condensed by considering, intuitively, that
a reminder that occludes the primary application window is required to be displayed
in a newly spawned window. This reduces the size of the set of potential presentation
styles to twelve. Furthermore, certain types of presentation styles lend themselves
more readily to certain types of visual representations. In other words, because each
reminder is issued through one of a variety of different applications, a reminder’s
appearance when represented by a given application is subject to that application’s
designs.
As part of this user study, I considered two CALO applications through which
reminders can be delivered, as well as two generic applications for on-screen reminder
display. One of the CALO applications is an interactive chat module that initializes a
new, occluding application window when it administers reminders through its inter-
face. In addition, the appearance of the chat window on the screen is subject to the
design of the application itself, so there was no simple means by which to incorporate
an accent color. The other CALO-specific application that was an element of the user
study is a persistent sidebar that maintains its position on the side of the screen and
issues reminders within the sidebar window itself. Of the two CALO-independent
display applications, one generates reminders similar to error messages, displaying
them modally and in the center of the screen. The other generates reminders that
pop up in the bottom right corner of the screen, similar to the functionality of the
29

Mozilla Thunderbird email service[66]. These reminders are required to maintain
their shape and size, so only the accent color could be adjusted.
Essentially, these constraints fix the first three (and in one case all four) fea-
tures of a reminder presentation style. As a result, there was: 1 option for display-
ing a reminder through the interactive chat window (with the properties 〈1100〉—
application-specific, occluding, new window & no accent color, labeled A in Fig-
ure 3.1); 2 options for displaying a reminder in the CALO sidebar (〈1011〉 and
〈1010〉—application-specific, peripheral & existing window, with or without an ac-
cent color, labeled B and H); 2 options for displaying a reminder in an error-message
mode (〈0101〉 and 〈0100〉—application-independent, occluding & new window, with
or without an accent color, labeled E in the figure); and 2 options for reminders
displayed in the bottom right corner of the screen (〈0001〉 and 〈0000〉—application-
independent, peripheral & new window, with or without an accent color, labeled D
and G).
Finally, the CALO chat module is more readily configurable than the sidebar
application. In particular, the size of the chat window can be both stretched and
moved around the screen. With this in mind, I created two visual representations of
the chat module, one with a small occluding window in the center of the computer
screen, and another with a larger window displayed in the screen’s top left corner.
This addition brought the total number of presentation styles to eight. However,
because notifications are becoming multi-modal [40, 81], and to adumbrate a future
study that incorporates additional modalities for notification display, I elected to in-
clude one visual reminder displayed on a mobile phone in addition to those displayed
on the computer screen. In order to keep the complete set of presentation styles at
eight, I removed the 〈0100〉 presentation style (application-independent, occluding,
30
new, no accent color), because the visual representation of these features as a com-
puterized reminder closely resembles the reminder displayed through the CALO chat
module, where the only difference is in the fact that one is exhibited through CALO
and the other is generic. The eight reminder presentation styles included in the user
studies are displayed in Figure 3.1 above.
3.1.2 Protocol & Evaluation Metrics
From initial informal interviews with potential system users, it was found that an-
noyance is the primary factor that determines whether or not the user of an intelligent
personal assistant actually continues to interact with (and accept the interactions of)
the system; this is consistent with the claims of [57]. Consequently, I make use of an
annoyance scale to evaluate alternative interaction patterns.
For this initial phase of Study 1, all of the participants were asked to consider
eight screen shots of reminder presentation styles (see Figure 3.1) and rate each
presentation style by the amount of disruptive annoyance that it would cause. Dis-
ruptive annoyance was explained to participants as the degree of disruption caused
in a user’s current task; this is in contrast to the annoyance that would be caused by
not noticing a reminder. The annoyance scale was presented to each participant as
a number line from 0 to 10 with integer values ticked, and ratings were permitted to
fall anywhere on the line. Lower values represented lower levels of annoyance. Par-
ticipants were given permission to examine all screen shots concurrently and evaluate
them in whatever order they desired.
3.1.3 Results
The mean annoyance values for each of the eight reminder presentation styles are
displayed in Figure 3.2. Upon detailed analysis of these results using a repeated mea-
31
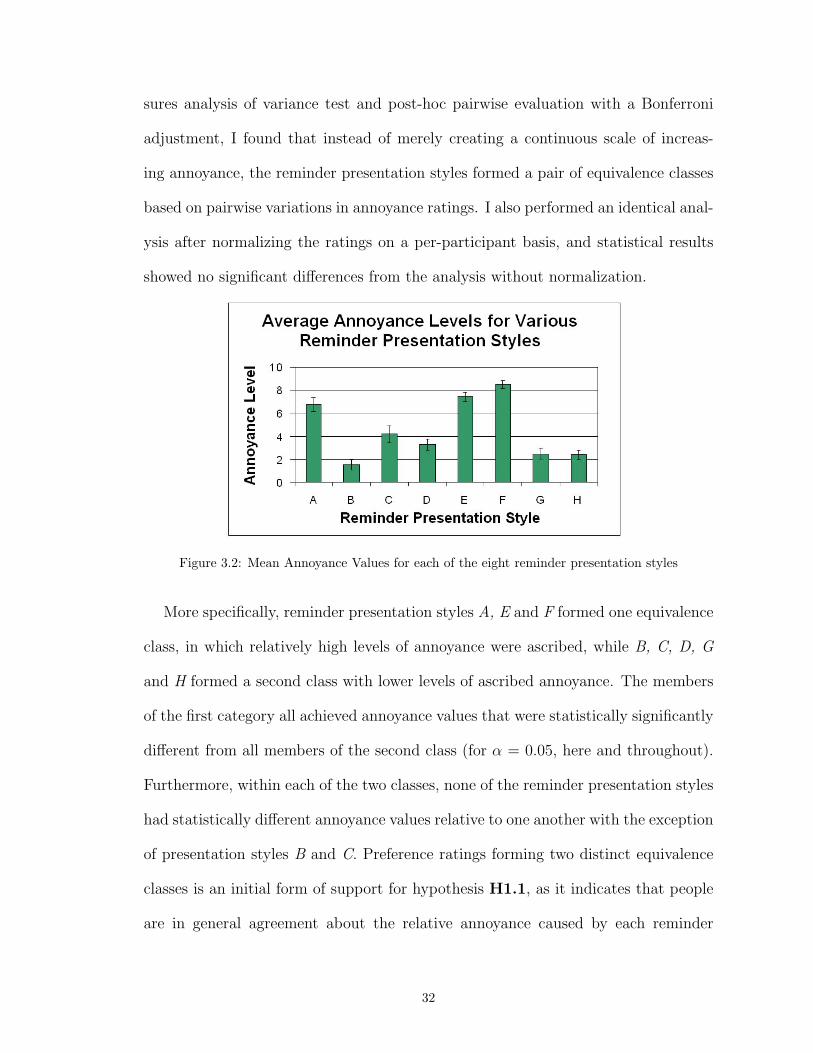
sures analysis of variance test and post-hoc pairwise evaluation with a Bonferroni
adjustment, I found that instead of merely creating a continuous scale of increas-
ing annoyance, the reminder presentation styles formed a pair of equivalence classes
based on pairwise variations in annoyance ratings. I also performed an identical anal-
ysis after normalizing the ratings on a per-participant basis, and statistical results
showed no significant differences from the analysis without normalization.
Figure 3.2: Mean Annoyance Values for each of the eight reminder presentation styles
More specifically, reminder presentation styles A, E and F formed one equivalence
class, in which relatively high levels of annoyance were ascribed, while B, C, D, G
and H formed a second class with lower levels of ascribed annoyance. The members
of the first category all achieved annoyance values that were statistically significantly
different from all members of the second class (for α = 0.05, here and throughout).
Furthermore, within each of the two classes, none of the reminder presentation styles
had statistically different annoyance values relative to one another with the exception
of presentation styles B and C. Preference ratings forming two distinct equivalence
classes is an initial form of support for hypothesis H1.1, as it indicates that people
are in general agreement about the relative annoyance caused by each reminder
32

presentation style.
The two categories that are formed by the reminder presentation styles are labeled
Highly and Moderately intrusive, respectively. An obvious question is why I subse-
quently adopt labels of intrusiveness rather than (perceived) annoyance. The answer
is that the second phase of this study, described below, showed that when informa-
tion about task context is included, participants frequently report a preference for
the very same reminder types that they previously categorized as highly annoying. I
therefore concluded that when a user reports a reminder presentation style as being
“annoying” in the absence of content-based or contextual background, he or she is
actually describing the degree to which the reminder intrudes on a current task.
3.2 Phases 2 and 3: Setting & Content
The second and third phases of the study aimed to learn whether people’s re-
minding preferences vary with either the contextual setting (Phase 2), or notification
content information (Phase 3). As described in the introduction to this proposal, I
define contextual setting to pertain to both the current task (being performed at the
time a reminder arrives) and the environmental context surrounding an interaction
(e.g., whether the user is at his or her desk, if there is ambient noise in the envi-
ronment, etc.). And content is defined to be measured by utility, comprising both a
measure of the urgency of the message and the importance of the associated calendar
event.
For the sake of length, I have omitted the detailed description of these two phases
of this study and instead summarize the results and point the reader toward Phase
4 of the study, which encompasses both contextual setting and notification content
simultaneously.
33

In these two phases of the study, participants were asked to respond to a series
of scenarios by indicating the relative desirability of each of the eight reminder pre-
sentation styles that were rated in Phase 1. The participants in these two phases of
the study are exactly those who participated in the previous phase, and the same
who participated in Phase 4 (which will be described in more detail below), as it
was important to maintain a stable set of participants in order to compare their
preferences between contexts.
In brief, the primary statistical findings from these two phases of the study are
as expected: Highly Intrusive presentation styles are deemed desirable much less
often than Moderately Intrusive reminders, aside from presentation style C, the text
message, which, in context, is considered less desirable than all other presentation
formats previously categorized as Moderately Intrusive.
I also learned that the contextual setting-based scenarios that I developed for
Phase 2 of the study did not significantly impact user ratings of the different presen-
tation styles, but that urgency and importance were indeed significant indicators of
people’s preferences for different types of reminder presentation styles (in Phase 3).
3.3 Phase 4: Combining Setting & Content
This fourth phase of the study measured the desirability of the same set of re-
minder presentation styles in the presence of contextual task-based information cou-
pled with a reminder’s suggested utility.
With this combination of contextual task and reminder content-based information,
I devised the following set of hypotheses:
(H1.2) Contextual features (i.e., relative task load and notification utility in-
formation) will be sufficient to determine the preferred level of intrusiveness of
34

a reminder.
(H1.3) Reminder presentation styles that are deemed “Highly Intrusive” when
considered independent of context will be acceptable by a majority of users in
contexts in which importance or urgency is high. Moreover, they will be yet
more popular in those contexts in which both importance and urgency are high.
(H1.4) A wider variety of “Moderately Intrusive” presentation styles will be
considered acceptable when attentional focus is low.
(H1.5) The acceptability of particular presentation styles within each intrusive-
ness category will vary among individuals, i.e., in the contexts in which Highly
(Moderately) Intrusive presentation styles are preferred by a majority of users,
those users will not be in agreement on the particular Highly (Moderately)
intrusive style(s) most preferred in the given context.
3.3.1 Experimental Design
The same set of eight screen shots used in Phases 1, 2 and 3 of the study and
depicting various reminder presentation styles was used again for this phase of the
study. Further, and as noted above, the same set of participants were used in this
phase of the study as were used in Phases 1–3. The conditions for this experiment
include the eight reminder presentation styles and a set of eight scenarios. Each
scenario describes a particular contextual setting and event for which the user is
being reminded. Contextual setting is divided into two concrete categories, one
representing tasks that require a high focus of attention (such as “an important
teleconference,” and another low focus (e.g., one scenario describes the process of
“sorting through old emails”). Content is described by its suggested two components
of utility: importance and urgency, each one taking on a high or low value similar to
35
the manner in which setting is represented.
3.3.2 Protocol & Evaluation Metrics
The scenarios were read aloud, one scenario at a time, to each participant. In
response to each scenario, the participants were asked to classify each of the 8 re-
minders as Best, Acceptable, or Unacceptable for that given situation.
Participants were instructed to place the identifying letter of each of the eight
reminder presentation styles into one of the three categories, so that every letter
from A to H appeared in the space accompanying every scenario. In other words,
each category could contain any number of entries, including zero. As a consequence,
it was not a requirement that the Best category include exactly one entry.
I elected to use a categorical (Best, Acceptable & Unacceptable) rating scheme for
this experiment, rather than the ordinal scale in Phase 1 of the study; this was done
to eliminate the problem of determining, for each participant, which rating values
correspond to acceptable reminder presentation styles.
Scenarios
The eight scenarios that were designed for this study are listed below. The con-
cept of attentional focus is included in this phase of the study, and it also adopts
either high or a low value, identical to importance and urgency. Similar to the clas-
sification of scenarios above but now with three variable aspects of context (task
focus, reminder urgency and reminder importance), the first four scenarios depict
reminders with high importance (and the last four reminders of low importance);
scenarios 1, 2, 5 and 6 depict reminders with high urgency (the respective others
depicting low-urgency reminders); and the odd-numbered scenarios (1, 3, 5 and 7)
depict tasks requiring high focus of attention (while even-numbered scenarios depict
36

tasks requiring low attentional focus). This exhausts all combinations of high and low
importance, urgency and focus. As before, when indicating the contextual features
of each scenario, I will abbreviate the words high, low, urgency, and importance, as
well as focus (“F”). Scenarios were read to the participants in random order.
The scenarios are as follows:
1. You are trying to get through the end of a very mathematically rigorous techni-
cal document when a reminder arrives for a meeting with the Director of [your
company] in five minutes. [This is the “H.I., H.U., H.F.” scenario; however,
this designation was not provided to participants—merely were they read the
scenario aloud.]
2. You are sorting through old emails in your inbox when you are reminded about
your meeting with the Director of [your company] in five minutes. [H.I., H.U.,
L.F.]
3. You are on an important teleconference in your office when you are reminded
about next week’s very relevant talk that you were hoping not to miss. [H.I.,
L.U., H.F.]
4. You are filling out what you find to be less than relevant paperwork when you’re
reminded about next Friday’s application due date for the very prestigious award
for which you’re planning to apply. [H.I., L.U., L.F.]
5. You are on a very important teleconference in your office when, because you
have not yet eaten lunch, you are reminded that the cafeteria will close in five
minutes. [L.I., H.U., H.F.]
6. You are packing up and heading to another building when you are reminded
that today is the last day to re-subscribe for your virus defense package before
37
prices increase by five dollars. [L.I., H.U., L.F.]
7. You are in your office, meeting with your boss, when a reminder arrives for a
meeting that you had no interest or intention of attending. [L.I., L.U., H.F.]
8. You are taking a break to stretch your legs when a reminder arrives for a talk
that you know has been canceled. [L.I., L.U., L.F.]
3.3.3 Results
To facilitate an intuitive analysis, I collapsed the ternary rating scheme into a
binary rating. To do this, I merged the Best and Acceptable categories so that the
ratings fall into either Acceptable or Unacceptable.3 As a result, from here forward,
when I refer to Acceptable reminder presentation styles, I am including those rated
Best as well.
The number presented in Table 3.3.3 as the mean rating representsPrit
, where
ri ∈ {Acceptable = 0, Unacceptable = 1} and t is the total number of ratings, i.e.,
where there are 8 ratings for each scenario per participant, amounting to 800 total
ratings in this phase of the study. Thus, with respect to the data in the table,
higher mean values indicate more Unacceptable ratings overall. As can be seen in
Table 3.3.3, the estimated marginal means over scenarios shows a distinct trend in
average user rating of reminder presentation styles between the first (high-utility, low-
focus) scenario and the last (low-utility, high-focus).4 These results provide strong
support for hypothesis H1.2: not only does context predict preferences, but it does
so in a systematic way: as utility increases and task focus decreases (read in the
table from bottom to top), people become more accepting of reminder presentation
3Because a presentation style deemed Best is presumably also Acceptable, i.e., the Acceptable category can beassumed to subsume Best, the merging of Best and Acceptable does not impact any of the users’ ratings.
4Interestingly, Scenario 3 bucks the trend; it describes the user on an important telephone call, and presentationstyles become less acceptable overall than the trend would otherwise dictate. Why this is the case, and whether it issignificant, has yet to be determined.
38
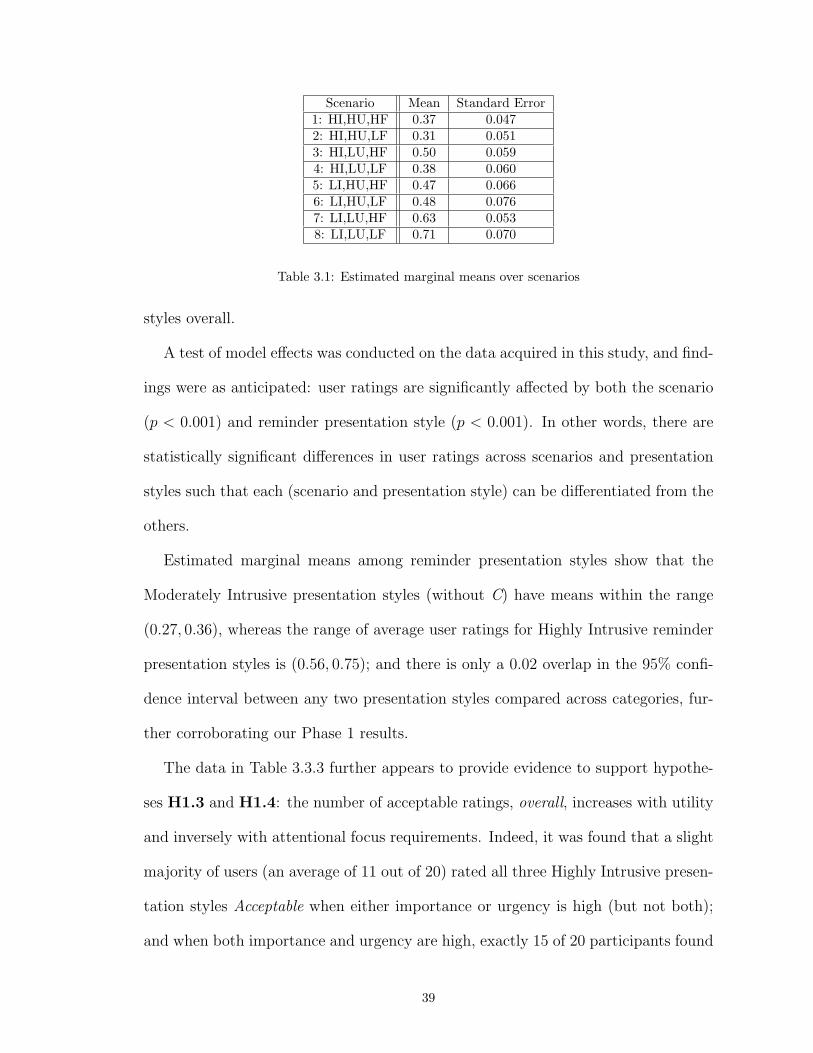
Scenario Mean Standard Error1: HI,HU,HF 0.37 0.0472: HI,HU,LF 0.31 0.0513: HI,LU,HF 0.50 0.0594: HI,LU,LF 0.38 0.0605: LI,HU,HF 0.47 0.0666: LI,HU,LF 0.48 0.0767: LI,LU,HF 0.63 0.0538: LI,LU,LF 0.71 0.070
Table 3.1: Estimated marginal means over scenarios
styles overall.
A test of model effects was conducted on the data acquired in this study, and find-
ings were as anticipated: user ratings are significantly affected by both the scenario
(p < 0.001) and reminder presentation style (p < 0.001). In other words, there are
statistically significant differences in user ratings across scenarios and presentation
styles such that each (scenario and presentation style) can be differentiated from the
others.
Estimated marginal means among reminder presentation styles show that the
Moderately Intrusive presentation styles (without C) have means within the range
(0.27, 0.36), whereas the range of average user ratings for Highly Intrusive reminder
presentation styles is (0.56, 0.75); and there is only a 0.02 overlap in the 95% confi-
dence interval between any two presentation styles compared across categories, fur-
ther corroborating our Phase 1 results.
The data in Table 3.3.3 further appears to provide evidence to support hypothe-
ses H1.3 and H1.4: the number of acceptable ratings, overall, increases with utility
and inversely with attentional focus requirements. Indeed, it was found that a slight
majority of users (an average of 11 out of 20) rated all three Highly Intrusive presen-
tation styles Acceptable when either importance or urgency is high (but not both);
and when both importance and urgency are high, exactly 15 of 20 participants found
39
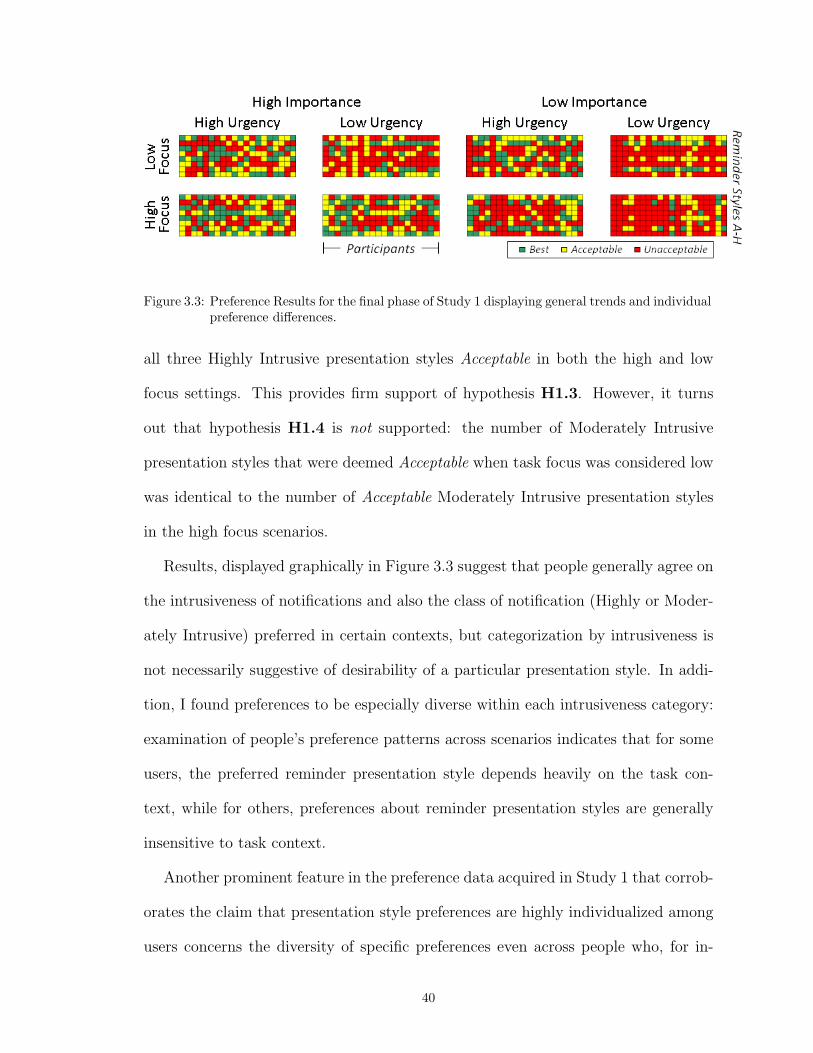
Figure 3.3: Preference Results for the final phase of Study 1 displaying general trends and individualpreference differences.
all three Highly Intrusive presentation styles Acceptable in both the high and low
focus settings. This provides firm support of hypothesis H1.3. However, it turns
out that hypothesis H1.4 is not supported: the number of Moderately Intrusive
presentation styles that were deemed Acceptable when task focus was considered low
was identical to the number of Acceptable Moderately Intrusive presentation styles
in the high focus scenarios.
Results, displayed graphically in Figure 3.3 suggest that people generally agree on
the intrusiveness of notifications and also the class of notification (Highly or Moder-
ately Intrusive) preferred in certain contexts, but categorization by intrusiveness is
not necessarily suggestive of desirability of a particular presentation style. In addi-
tion, I found preferences to be especially diverse within each intrusiveness category:
examination of people’s preference patterns across scenarios indicates that for some
users, the preferred reminder presentation style depends heavily on the task con-
text, while for others, preferences about reminder presentation styles are generally
insensitive to task context.
Another prominent feature in the preference data acquired in Study 1 that corrob-
orates the claim that presentation style preferences are highly individualized among
users concerns the diversity of specific preferences even across people who, for in-
40
stance, have preferences that are insensitive to task context. Even those users that
have fairly similar preference patterns across contexts (i.e., they prefer a particular,
stable subset of presentation styles regardless of context) remain fairly distinct in
those preferences. In other words, two participants may both have stable preferences
across scenarios, but those preferences are in most cases not similar to one another.
Consider Participant 4 and Participant 13 (counting across the participant columns
from 1 on far left): Participant 4 finds Highly Intrusive presentation styles to be
generally desirable unless utility is low, whereas Highly Intrusive presentation styles
are considered Unacceptable to Participant 13 across all contexts. And the data for
Participant 2 shows an inverse correlation between the desirability of Highly and
Moderately Intrusive presentation styles across contexts. These observation, among
others excluded from discussion here, provides support for hypothesis H1.5, which
suggested that preferences would be individualized across users.
All of these preliminary results together suggest that when there is a variety of
notification formats available from which to choose, people will likely not agree on
the most desirable notification for any given contextual scenario, motivating the
development of adaptive tools for notification management.
3.4 Discussion
A summary of the amount of support provided by my results toward my four
Study 1 hypotheses is as follows:
(H1.2) Supported: Context does indeed determine the relative acceptability
of the entire set of reminder presentation styles. It dictates in particular that
the higher the notification utility and lower the attentional focus requirements,
the higher the desirability of all reminder presentation styles.
41
(H1.3) Supported: Presentation styles considered Highly Intrusive are more
likely to be found desirable when either one of importance or urgency is high;
this likelihood increases even further when both importance and urgency (i.e.,
utility) is high.
(H1.4) Not supported: Regardless of suggested task load requirements, the
number of Moderately Intrusive reminder presentation styles considered accept-
able remains unchanged.
(H1.5) Supported: There is high variability in people’s preferences for the
specific reminder presentation styles deemed desirable in a given context.
The goal of this study was to explore the question of whether people have diverse
patterns of preferences regarding the manner in which they interact with reminding
systems. Our experimental results indicate that they do and hence motivate future
work on the development of adaptive interaction systems. In particular, I found that,
while most people agree on the perceived intrusiveness of various visual reminder
presentation styles in the absence of contextual information, there are both notable
trends in the overall desirability of reminder presentation styles as context varies, as
well as high variability in user assessment of the desirability of specific reminding
alternatives when task context and reminder utility information are provided.
42
CHAPTER IV
Multi-format Notifications in a Multi-task Environment
As the next step toward evaluating multi-format notification systems, I studied
people’s perception of and response to a set of visual and auditory notifications
issued in a multi-task environment. Study 1 suggested that visual notifications can
be characterized by their relative amounts of intrusiveness with respect to the current
task. I thus incorporated two types of visual notifications into this study (one of high
suggested intrusiveness and one of low), as well as an auditory notification for added
exploration of the space of notification formats.
The study involved two computer games. One game, which was always available
to the user to play, was the Memory game adapted from Gluck, et al. [37]; the
other was called the “Alien” game and was an adaptation of the popular computer
game “Space Invaders” [70].1 For ease of exposition, I will adopt the terminology
of Trafton, et al. [83] and refer to the Memory game as the “primary” task and the
Alien game as “secondary.”
There were two sessions of the primary task, during which notifications were
issued to alert participants to the availability of the secondary task. Upon receipt of
a notification, participants were at liberty to switch to the secondary task or maintain
focus on the primary task. Beforehand, I conducted an initial phase of the study to1In my version of Space Invaders, there were no obstacles and no shots being fired back by the aliens.
43
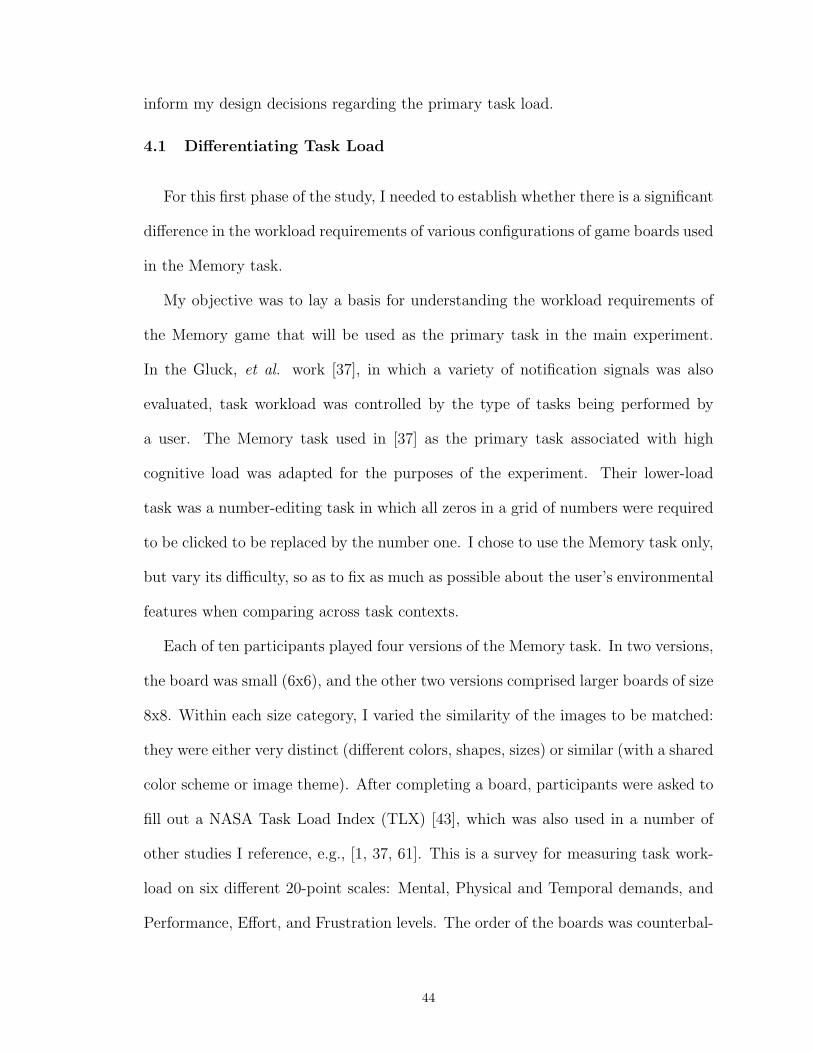
inform my design decisions regarding the primary task load.
4.1 Differentiating Task Load
For this first phase of the study, I needed to establish whether there is a significant
difference in the workload requirements of various configurations of game boards used
in the Memory task.
My objective was to lay a basis for understanding the workload requirements of
the Memory game that will be used as the primary task in the main experiment.
In the Gluck, et al. work [37], in which a variety of notification signals was also
evaluated, task workload was controlled by the type of tasks being performed by
a user. The Memory task used in [37] as the primary task associated with high
cognitive load was adapted for the purposes of the experiment. Their lower-load
task was a number-editing task in which all zeros in a grid of numbers were required
to be clicked to be replaced by the number one. I chose to use the Memory task only,
but vary its difficulty, so as to fix as much as possible about the user’s environmental
features when comparing across task contexts.
Each of ten participants played four versions of the Memory task. In two versions,
the board was small (6x6), and the other two versions comprised larger boards of size
8x8. Within each size category, I varied the similarity of the images to be matched:
they were either very distinct (different colors, shapes, sizes) or similar (with a shared
color scheme or image theme). After completing a board, participants were asked to
fill out a NASA Task Load Index (TLX) [43], which was also used in a number of
other studies I reference, e.g., [1, 37, 61]. This is a survey for measuring task work-
load on six different 20-point scales: Mental, Physical and Temporal demands, and
Performance, Effort, and Frustration levels. The order of the boards was counterbal-
44
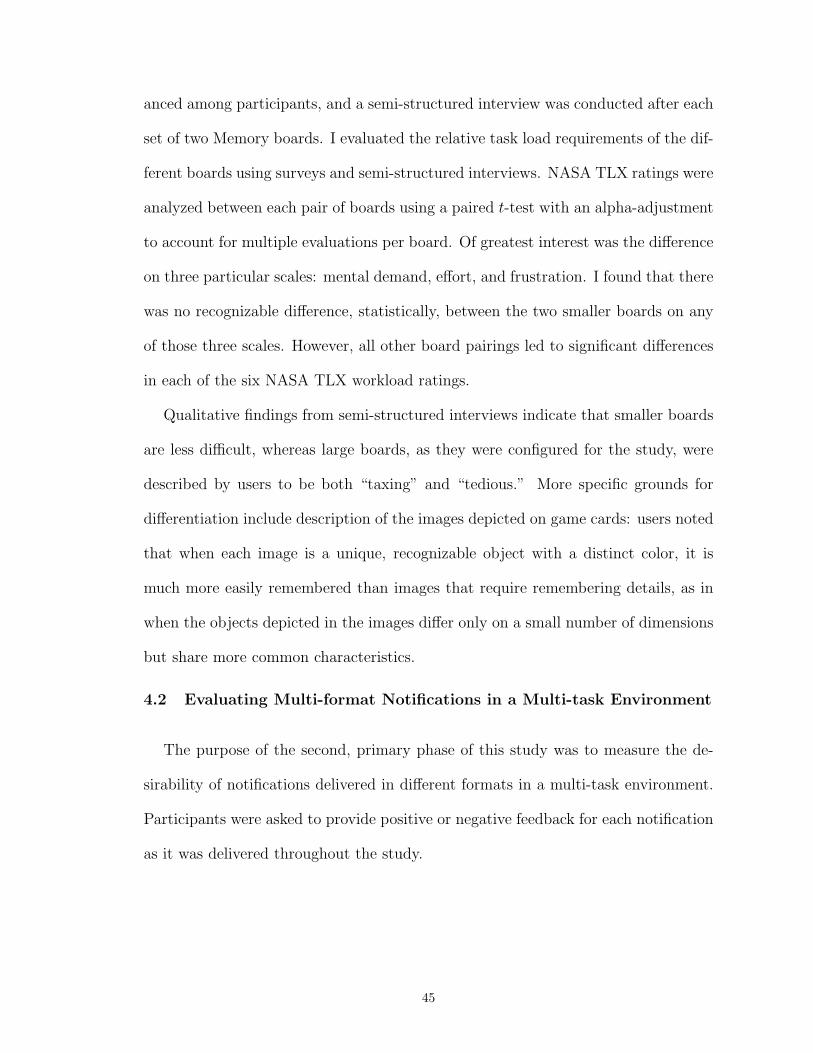
anced among participants, and a semi-structured interview was conducted after each
set of two Memory boards. I evaluated the relative task load requirements of the dif-
ferent boards using surveys and semi-structured interviews. NASA TLX ratings were
analyzed between each pair of boards using a paired t-test with an alpha-adjustment
to account for multiple evaluations per board. Of greatest interest was the difference
on three particular scales: mental demand, effort, and frustration. I found that there
was no recognizable difference, statistically, between the two smaller boards on any
of those three scales. However, all other board pairings led to significant differences
in each of the six NASA TLX workload ratings.
Qualitative findings from semi-structured interviews indicate that smaller boards
are less difficult, whereas large boards, as they were configured for the study, were
described by users to be both “taxing” and “tedious.” More specific grounds for
differentiation include description of the images depicted on game cards: users noted
that when each image is a unique, recognizable object with a distinct color, it is
much more easily remembered than images that require remembering details, as in
when the objects depicted in the images differ only on a small number of dimensions
but share more common characteristics.
4.2 Evaluating Multi-format Notifications in a Multi-task Environment
The purpose of the second, primary phase of this study was to measure the de-
sirability of notifications delivered in different formats in a multi-task environment.
Participants were asked to provide positive or negative feedback for each notification
as it was delivered throughout the study.
45

4.2.1 Participants
I recruited 28 participants (9 female) between the ages of 18 and 49, all of whom
reported that they use the computer for over an hour a day. Upon recruitment,
participants were informed that they would receive compensation of $5 per hour
of participation and a $10 bonus if they were more successful than two-thirds of
participants at playing a set of computerized games.
4.2.2 Tasks
Similar to the first phase of the study described above, the objective of the Memory
game was to find all pairs of matching images on each game board. Every match
was worth 10 points toward the user’s total score. Informed by findings from the
initial phase of this study above, I divided Memory game boards into two levels of
task load: one, the low-focus level, included twenty size 6x6 boards hiding 9 images
(such that there were four instances of each image hidden on any given board); and
another, the high-focus level, included five size 8x8 boards each hiding 32 image pairs
that were much more similar to one another, with each matching pair differing only
by a few minor visual characteristics from every other matching pair.
In the Alien game (see Figure 4.1), the user’s objective was to remove as many
aliens as possible from the screen during the time the game was active. There were
two versions of the Alien game: the basic Alien game, in which all aliens were white
in color and worth one point each, and the Bonus game, in which a handful of aliens
were colored blue or red. Participants were informed that blue aliens were worth 20
points each, and that red aliens were worth 100 points. I designed these two games
in such a way as to model two levels of importance, and depending on the amount
of time for which the game is available, they represent two levels of urgency as well.
46

Figure 4.1: The Bonus game.
4.2.3 Notifications
Notifications were used to alert a user to a secondary task becoming available.
A notification named the newly-available secondary task (either the Alien or Bonus
game) and the exact amount of time for which it was to be available (either thirty
seconds or three minutes). This was our method of representing the contextual fea-
tures related to a notification: importance is high when the Bonus game is available
(because it is worth far more points than can be attained in the Alien game) and low
when the notification specifies the availability of the Alien game; and urgency is high
when the game is available only for the next 30 seconds, whereas it is considered low
if the user need not attend to the secondary task immediately.
Notifications were issued in one of three formats: two visual and one auditory.
The choice of visual notifications was informed by the two categories of reminder
delivery formats from my initial experiment, Study 1. One visual notification was
a large, occluding window that popped up in the center of the screen in which the
user was playing the Memory game. The other visual notification was smaller and
appeared toward the bottom right-hand corner of the screen, without occluding any
of the Memory game pieces. The design of these notification formats was strongly
47

Figure 4.2: A small Memory board displaying an occluding notification.
influenced by our initial experiment (Study 1) in which notification formats were
grouped into two distinct equivalence classes (based on their relative levels of per-
ceived intrusiveness). A third, auditory notification was a woman’s voice dictating
the same information that is presented in the visual notifications. I included this
notification format to examine an alternative modality for information delivery. Fig-
ure 4.2 depicts a low-focus board and an occluding notification, and Figure 4.3 shows
a high-focus board and a peripheral notification.
Upon receipt of a notification, it was requested that participants rate the no-
tification using the a pair of positive and negative feedback buttons. A positive
(negative) rating indicated a desirable (undesirable) notification format for the given
setting and notification content. To capture the positive and negative feedback that
was requested of the participants upon receipt of each individual notification, the
feedback buttons (depicted in Figure 4.4) were placed to the left of the keyboard: a
blue smiling face was used for positive feedback, and a red frowning face was used
as negative feedback.
48

Figure 4.3: A large Memory board displaying a peripheral notification.
4.2.4 Experimental Design
This study comprised a 2 Task load (high- and low-focus Memory task) x 2 Im-
portance (high, low) x 2 Urgency (high, low) x 3 Notification format (occluding,
peripheral, auditory) mixed design. All of the treatments were within subjects, so
that user preference information could be compared across all users, scenarios and
notification types. I used a Williams design [89] to counterbalance all of the treat-
ment combinations.
Protocol & Evaluation Metrics
Procedure: Participants were first presented with a consent form, a pre-study
demographics questionnaire, and verbal and written instructions for participating in
the study. Then they were familiarized with each of the notification formats and
administered a practice session in which they had the opportunity to walk through
the process of playing the Memory game, receiving a notification, providing feedback,
and addressing the secondary task (the Alien or Bonus game). Participants were
encouraged to ask questions throughout this orientation process.
Each user participated in two 30-minute task sessions. One session involved the
49
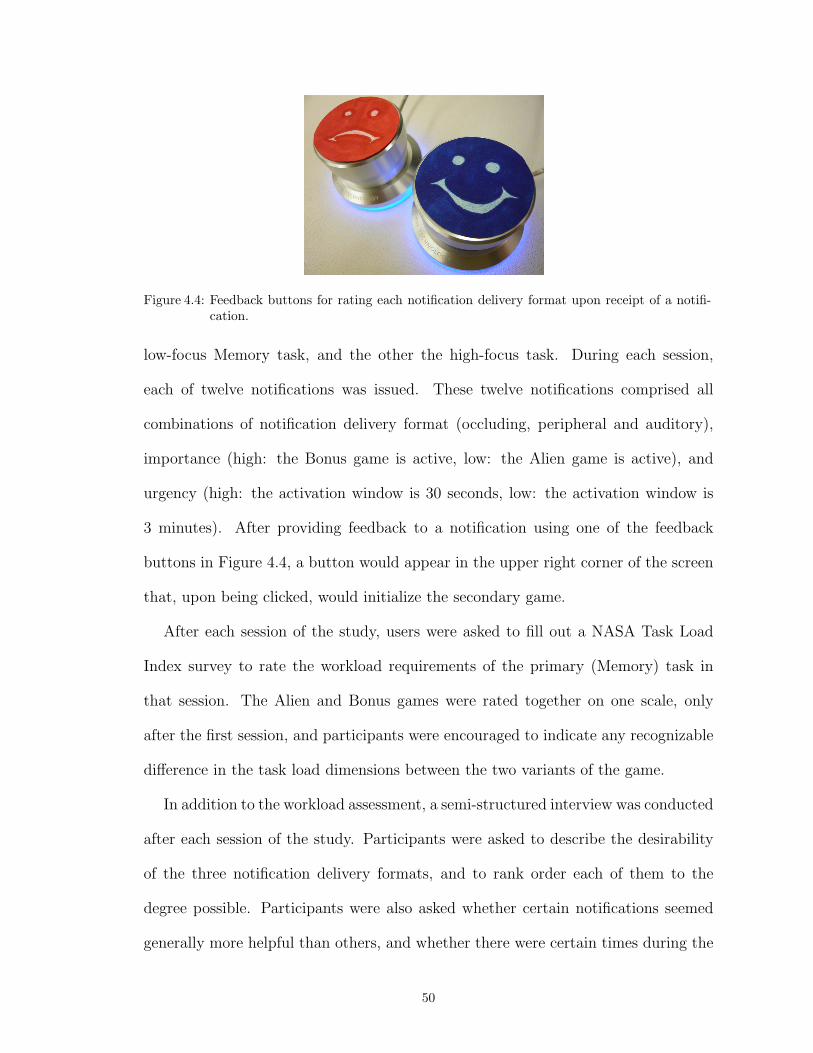
Figure 4.4: Feedback buttons for rating each notification delivery format upon receipt of a notifi-cation.
low-focus Memory task, and the other the high-focus task. During each session,
each of twelve notifications was issued. These twelve notifications comprised all
combinations of notification delivery format (occluding, peripheral and auditory),
importance (high: the Bonus game is active, low: the Alien game is active), and
urgency (high: the activation window is 30 seconds, low: the activation window is
3 minutes). After providing feedback to a notification using one of the feedback
buttons in Figure 4.4, a button would appear in the upper right corner of the screen
that, upon being clicked, would initialize the secondary game.
After each session of the study, users were asked to fill out a NASA Task Load
Index survey to rate the workload requirements of the primary (Memory) task in
that session. The Alien and Bonus games were rated together on one scale, only
after the first session, and participants were encouraged to indicate any recognizable
difference in the task load dimensions between the two variants of the game.
In addition to the workload assessment, a semi-structured interview was conducted
after each session of the study. Participants were asked to describe the desirability
of the three notification delivery formats, and to rank order each of them to the
degree possible. Participants were also asked whether certain notifications seemed
generally more helpful than others, and whether there were certain times during the
50
session in which notifications were more useful. I was also interested in participants’
perceptions of their attentiveness to notifications and whether there were occasions
on which they chose to defer attendance to a secondary task or ignore it altogether.
Objective Measures: The study’s objective measures included a user’s response
time to each type of notification format, as well as relative user performance on each
set of primary and secondary tasks. I also employed a galvanic skin response meter
to measure a user’s physiological response to stimuli throughout the study. These
aspects of the effectiveness and/or user perception of a notification system are not
the primary topic of this dissertation, and, as results were inconclusive, they will not
be discussed in detail.
Subjective Measures: As described above by way of the red and blue feedback
buttons, positive and negative (“reactive”) feedback ratings were provided upon
receipt of each notification. I also conducted an interview after each session of the
experiment, asking participants about their perceptions of each of the different types
of notifications delivered during the session, to which the term “reflective” ratings
refers. Reflective ratings were meant to indicate user preferences over the three
notification formats: participants were asked if there was a particular format that
was preferred to the others and whether they could articulate a specific ranking for
the notification formats during the prior session of the experiment. My subjective
measures also include users’ responses to the NASA Task Load Index survey, which
was completed in the first phase of the study as well as after each session of the
experiment, both for the primary and secondary tasks.
51

4.2.5 Hypotheses
My central hypotheses for this study (Study 2) postulate that notification display
formats will, in general across formats, be rated more positively when notification
utility is high and task focus is low, and that users can accurately articulate their
notification preferences both with and in the absence of contextual information.
(H2.1) Informed by the data supporting hypothesis H1.2, there will be a wider
range of positive (reactive) ratings over all three notification formats in contexts
in which utility (importance or urgency) is high, or when the primary task
requires low focus of attention.
(H2.2) Reactive ratings will correspond to reflective ratings; people who indi-
cate an overall preference for a certain delivery format will provide more positive
ratings to that format than to others. Furthermore, a delivery format that is
favored by users overall (reflectively) will be provided the most positive ratings
in a reactive setting.
4.3 Results
To address my first hypothesis, which suggests that certain features of user context
relative to a notification will predict the desirability of a notification delivery format,
I analyzed reactive ratings in each scenario. Findings are displayed in Figure 4.5,
which depicts the number of positive ratings (on the y-axis) for the three notification
formats in each of the eight contextual scenarios (depicted on the x-axis).
It can be noted that, contrary to the findings in the prior study, there is no
strict trend in relative desirability from the low-load, high-utility scenario toward
the high-load, low-utility scenario. The total number of positive ratings over all
three notification formats was fairly stable over all eight scenarios, falling between
52
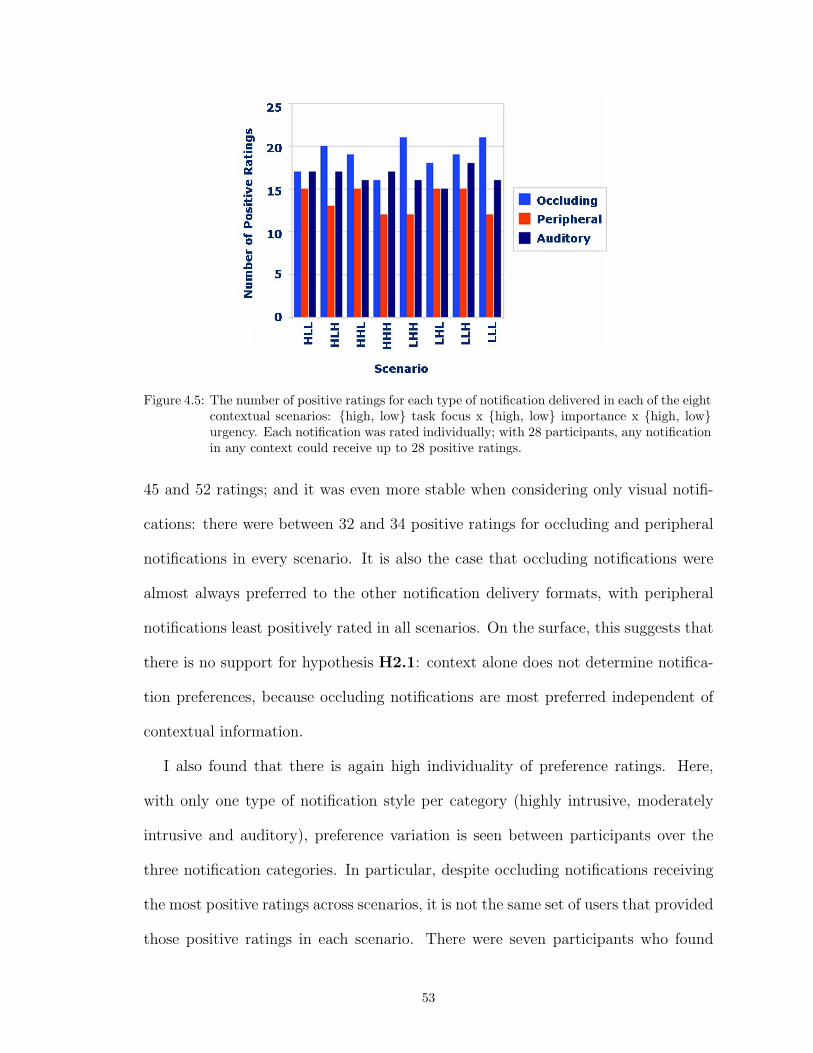
Figure 4.5: The number of positive ratings for each type of notification delivered in each of the eightcontextual scenarios: {high, low} task focus x {high, low} importance x {high, low}urgency. Each notification was rated individually; with 28 participants, any notificationin any context could receive up to 28 positive ratings.
45 and 52 ratings; and it was even more stable when considering only visual notifi-
cations: there were between 32 and 34 positive ratings for occluding and peripheral
notifications in every scenario. It is also the case that occluding notifications were
almost always preferred to the other notification delivery formats, with peripheral
notifications least positively rated in all scenarios. On the surface, this suggests that
there is no support for hypothesis H2.1: context alone does not determine notifica-
tion preferences, because occluding notifications are most preferred independent of
contextual information.
I also found that there is again high individuality of preference ratings. Here,
with only one type of notification style per category (highly intrusive, moderately
intrusive and auditory), preference variation is seen between participants over the
three notification categories. In particular, despite occluding notifications receiving
the most positive ratings across scenarios, it is not the same set of users that provided
those positive ratings in each scenario. There were seven participants who found
53
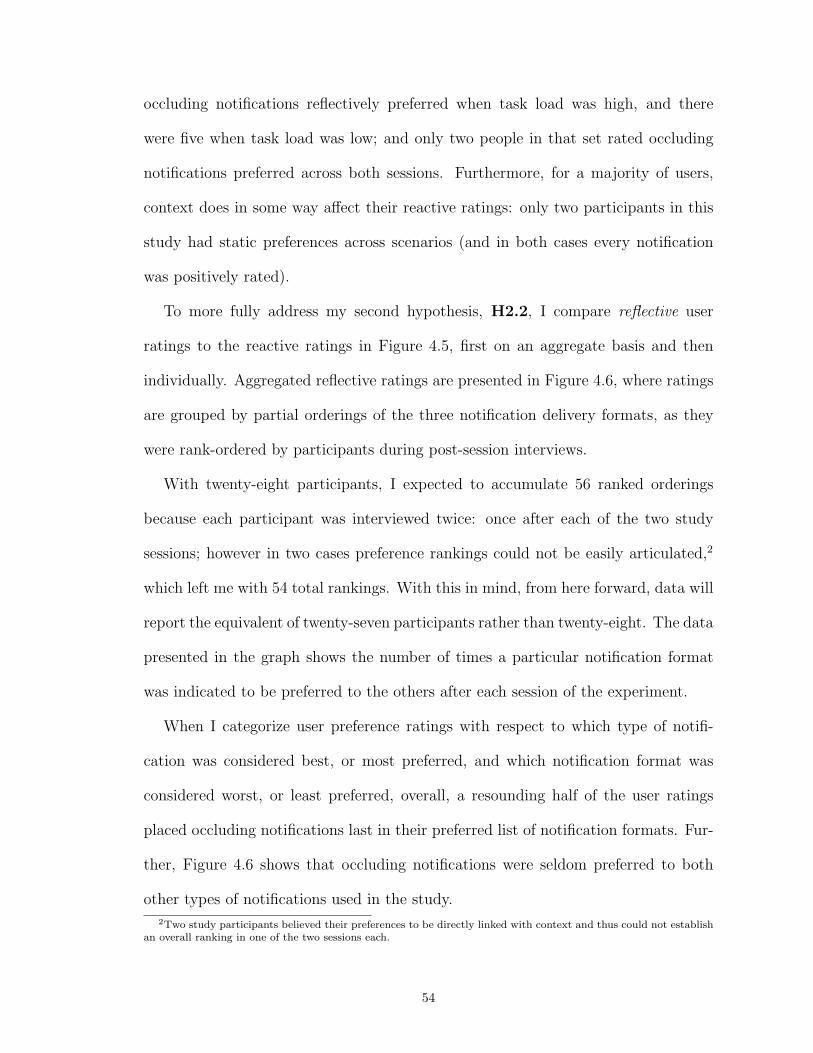
occluding notifications reflectively preferred when task load was high, and there
were five when task load was low; and only two people in that set rated occluding
notifications preferred across both sessions. Furthermore, for a majority of users,
context does in some way affect their reactive ratings: only two participants in this
study had static preferences across scenarios (and in both cases every notification
was positively rated).
To more fully address my second hypothesis, H2.2, I compare reflective user
ratings to the reactive ratings in Figure 4.5, first on an aggregate basis and then
individually. Aggregated reflective ratings are presented in Figure 4.6, where ratings
are grouped by partial orderings of the three notification delivery formats, as they
were rank-ordered by participants during post-session interviews.
With twenty-eight participants, I expected to accumulate 56 ranked orderings
because each participant was interviewed twice: once after each of the two study
sessions; however in two cases preference rankings could not be easily articulated,2
which left me with 54 total rankings. With this in mind, from here forward, data will
report the equivalent of twenty-seven participants rather than twenty-eight. The data
presented in the graph shows the number of times a particular notification format
was indicated to be preferred to the others after each session of the experiment.
When I categorize user preference ratings with respect to which type of notifi-
cation was considered best, or most preferred, and which notification format was
considered worst, or least preferred, overall, a resounding half of the user ratings
placed occluding notifications last in their preferred list of notification formats. Fur-
ther, Figure 4.6 shows that occluding notifications were seldom preferred to both
other types of notifications used in the study.
2Two study participants believed their preferences to be directly linked with context and thus could not establishan overall ranking in one of the two sessions each.
54

Figure 4.6: The number of times Occluding, Peripheral and Auditory notifications were rankedhighest in participants’ reflective ratings, in all contexts with the low focus task (left)and high focus task (right).
Individual user preferences—both reactive and reflective—are displayed in Fig-
ure 4.7. The figure shows two rectangular diagrams, one displaying preference in-
formation elicited during the high-focus task session (upper diagram), and the other
displaying preferences from the low-focus task session (lower diagram). Each column
in the diagrams describes one individual user: the first row of both diagrams depicts
each user’s reflective preference for that task session, and the four boxes below a
user’s reflective preference describe that user’s reactive ratings from each of the four
contexts associated with that task session (all combinations of high and low impor-
tance and urgency). Users are grouped by their reflective ratings: there are three
groups, representing a reflective preference for occluding (in light blue, and corre-
sponding to the first row of boxes), peripheral (in orange), and auditory (colored
dark blue). As an example of reading the top diagram (the high focus session), it
indicates by its last column of ratings that one user reflectively preferred auditory
notifications to occluding and peripheral during the post-session interview, but dur-
ing that particular task session the user only provided positive ratings to occluding
55

notifications.
Upon first glance at this pair of diagrams, there is very little correlation between
reflective and reactive user ratings. There are twenty-two cases in which people’s
reactive preferences correspond to their reflective preferences. Yet, this does not even
account for half of the 54 sets of preferences that were acquired, suggesting that there
is only a weak, if any, basis for supporting hypothesis H2.2. More notably, in fact, is
the number of people whose preferences differ between reactive and reflective ratings.
The number of participants whose reflective preference for a particular notification
format is not rated positively whatsoever in the reactive phase is seventeen, almost
as many as there were preference matches; and in total there were thirty cases (15
in each session, i.e., more than half) in which the reflectively-preferred notification
format was not the one to receive the greatest number of positive ratings in the
reactive stage.
4.4 Discussion
To summarize this study’s findings:
(H2.1) Not Supported: The number of notification formats rated positively
is not observed to be influenced by contextual scenarios.
(H2.2) Not Supported: People’s reactive ratings do not serve to fully de-
termine their reflective preferences, neither on an individual basis nor on the
aggregate level.
My results imply that the desirability of a notification delivery format cannot
be generalized across computer users or contextual settings. While feedback ratings
provided directly in response to each notification indicated that occluding notifica-
tions would satisfy more users than either of the other two delivery formats, more
56

Figure 4.7: Individual reflective preferences paired with reactive preference ratings, grouped by tasksession (high and low focus): each column represents a single user; the top row of boxesin each session displays individual users’ format preferences during that session (corre-sponding to the groupings indicated by the reflectively preferred notification format),and the four boxes beneath each user’s reflective preference present a visual descriptionof that user’s reactive preference ratings: light blue signifies a positive rating for theoccluding notification delivered in the given context, orange indicates a positive ratingfor the peripheral notification, and dark blue indicates a positive rating for the auditorynotification. If more than one notification was rated positively, multiple colors share thespace. Empty spaces indicate that no notification was rated positively in that context.
57
participants rated the peripheral and auditory notifications most desirable overall
(i.e., across contexts). And a number of participants provided contradictory pref-
erence information between the reactive and reflective settings. This suggests that
user preferences may not be easily articulated, at least in the absence of contextual
grounding.
Results also suggest that designers wishing to embed user preferences into in-
telligent software tools could potentially elicit that information by asking users to
provide reactive feedback to explicit contextual scenarios (similar to the second phase
of Study 1), but exhaustively enumerating all possible contexts would be a cumber-
some if not intractable undertaking. Furthermore, information acquired from one
user would not necessarily generalize to any other user, meaning that the process
would have to be replicated for each individual user. Instead, I propose that user
modeling techniques can perform this preference learning automatically, using some
of the information provided by the results obtained in this study.
It is encouraging to see that the results from both Study 1 and Study 2 support
prior work (e.g., [37]), which found that on certain occasions, even those notification
formats deemed more annoying, or intrusive, than others were found to be preferred
by a majority of users.
4.4.1 Participant Reactions to Notification Timing
When participants were asked whether there were certain times during the pri-
mary task at which notifications were more useful than at other times, there were
multiple responses. Surprisingly, almost as many users (8) suggested that they would
appreciate notifications to be delivered during the middle of the task as the end or
beginning (11 and 10 respectively), where not all participants considered a certain
time to be better than others (and preferring more than one time was counted as
58
a positive response to the times in both categories). This result indicates that tim-
ing of a notification, even when notification delivery format is adjusted, can affect
desirability in addition to performance [22]. It also suggests that task setting is an
important factor determining when interruptions will be most desirable.
Unlike [50], I did not control the timing of an interruption by matching interrup-
tions to known task breakpoints or otherwise. However, a number of participants
commented (independently of the interview question regarding timing) on timing as
a factor influencing their reactions to notifications. Interestingly, however, and in
line with my discussion just above, those comments pointed in different directions,
with some users indicating a preference to receive notifications at the beginning or
end of the primary task and others preferring notifications to arrive in the middle.
Of the users who preferred notifications to be delivered at the beginning of the
primary task, they seemed to suggest that they would not yet have had a chance to
store much information about the game board and thus would be less susceptible to
the notification interrupting their thought process as in other parts of the game as
they progressed through it. On the other hand, some users who preferred receiving
a notification at the end indicated that their preference hinged on the fact that,
because the board is mostly completed, there is much less to remember at that
point. And finally, those participants who indicated a preference for notifications
issued during the middle of the game were largely in agreement that their decision
was based on their frustration with the Memory game and the fact that they would
return to the game relaxed after a quick session of the Alien or Bonus game. All of
this seems to indicate that the tasks in which a user is engaged or has the opportunity
to be engaged may themselves be important factors influencing user preferences for
different notification delivery formats.
59

CHAPTER V
A Survey Study of Workplace Notifications
As a precursor to the full-blown notification-preference study to be conducted in
a naturalistic office setting, a pair of surveys were administered to elicit participants’
reflective notification preferences. In a similar manner to Study 1, notification deliv-
ery preferences were elicited first without recognition of the surrounding contextual
situation, and then moderated by a set of contextual scenarios describing the discrete
features of context that are of high interest throughout this dissertation: message
urgency, event importance, and task attention requirements.
I elected to incorporate reflective surveys at this stage primarily because reactive
elicitation, in which preferences are provided in direct response to environmental
stimuli (used as the primary mode of exploring preferences in the naturalistic Study
4), is a trusted technique but generally associated with high overhead—as was the
case for Study 4 as will be discussed in upcoming chapters. Reflective preferences,
comparatively, are commonly elicited and relatively easy to assess; but they have
been shown in some cases to be poorly correlated with reactive preferences—both
in this thesis and elsewhere [34, 85]. In the study described in this chapter, in
which two alternative methods for eliciting reflective user preferences are examined,
I show that the resultant trends exhibited in reflective preference data acquired
60
within these surveys not corroborate prior results within this dissertation, but may
also act as a successful surrogate for preferences obtained in the often much more
resource-intensive reactive setting. I will show, additionally, that the overarching
characteristics of people’s preferences found in this study, measured twice in the span
of three months’ time, are robust to people’s shifting and/or difficult-to-articulate
preferences. Further motivation for conducting the Study 4 surveys is described
below.
5.1 Motivation
Interestingly, satisfaction and success do not always correspond: people have been
shown to prefer notifications that are not most conducive to successful task perfor-
mance [35], and notifications that are successful in decreasing task completion times
have been shown to cause high levels of stress [61]. Furthermore, among preference
elicitation strategies themselves there are shown to be differences in the results of
elicitation. Specifically, and as has been shown, for example, in this dissertation,
reflective preferences have been shown to be discordant with reactive preferences,
indicating that people may not have the ability to accurately characterize their own
preferences, post-interaction [34, 85].
One suggestion for mitigating this discord is to ground reflective preferences in
the context associated with actual events, e.g., using video or still images of user
experiences [49]. Similar techniques have been advocated in the context of notifi-
cation evaluation as well[71]. However, again these techniques are accompanied by
significant overhead.
In addition to differences resulting from the type of preference elicitation tech-
nique employed, there are also conflicting claims about the situational features (e.g.,
61

of one’s environment or the notification itself) that affect an individual’s preferences.
As I noted early in this document, a number of researchers have suggested matching
the intrusiveness of a notification with its associated level of utility, where intrusive-
ness is defined with respect to the modality of interaction, and utility comprises some
combination of notification-event importance and message urgency [37, 84]. Explo-
ration of the influence of notification format on user preferences is a main component
of this dissertation and is the primary focus of the Study 3 surveys described here.
5.2 Overview
A pair of surveys was conducted to learn about how people report their prefer-
ences for notification formats delivered in different contexts. One survey, which is
considered abstract, asked respondents to indicate those notification formats that
would be regarded as most desirable in a set of hypothetical situations. The other,
grounded, survey asked about more concrete tasks and events experienced by re-
spondents within their workplace environment. This grounded survey was preceded
by a short questionnaire used to calibrate people’s perceptions of certain aspects of
context that have been shown to affect their notification preferences, namely those
three aspects that have been a theme of this thesis: notification urgency, event im-
portance, and task attention requirements.
I enlisted a number of employees in a technical support center in Bangalore, India
to participate in this study, and, as in Study 4 (see Chapter VI), the characteristics
of ordinary notification-receipt and work habits were taken into account. To briefly
summarize what will be described in more detail in the upcoming chapter, client
support provided by these engineers is primarily conducted via VOIP-based desk
telephones, though calls also arrive on support engineers’ mobile telephones (both
62
from clients and also from co-workers, family and friends), as well as via web-based
chat applications. Interactions between engineers are rampant and may proceed via
a variety of channels, including chat, email, face-to-face, mobile phone calls and text
messages.
5.2.1 Notification Formats
The same seven notification delivery formats that will be evaluated in Study 4 are
present in this study: three are computer-based notification formats (reminders, in-
stant messages, and email notifications), two are phone-based (notifications delivered
by mobile or desk phone), and one is an in-person, face-to-face notification. Informed
by prior work suggesting that visual notifications can be categorized as intrusive or
non-intrusive [84, 86], paired with the goal of using notification systems that were
already in place, I focused on two specific types of on-screen “intrusive” notifications:
Outlook event reminders and Microsoft Office Communicator instant messages, and
one type of on-screen non-intrusive notification: Outlook email alerts (also known as
“toast” pop-ups). For the purposes of this study, I refrain from classifying each of
the other notification formats by their intrusiveness because there is little precedent
for doing so.
5.2.2 Surveys
Both (abstract and grounded) surveys were completed in their entirety by seven-
teen employees, and administration of the surveys was separated by a period of three
months.
Abstract Survey
This survey included the following types of questions:
• Demographic information
63
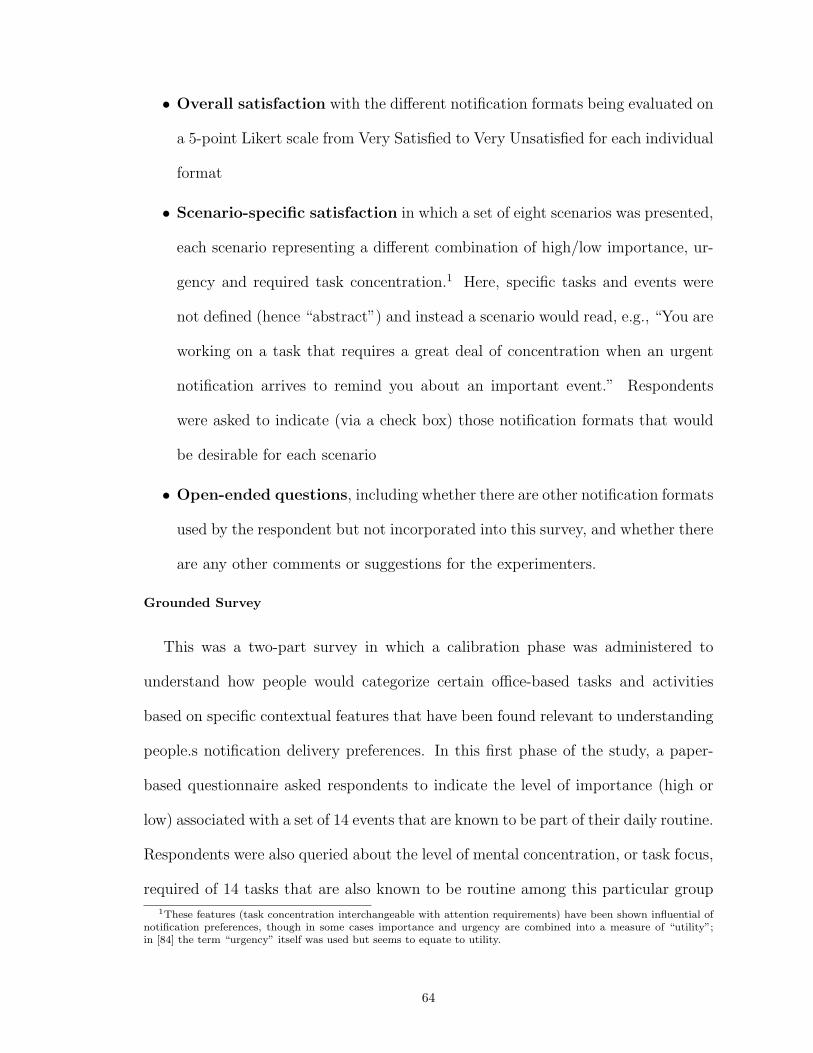
• Overall satisfaction with the different notification formats being evaluated on
a 5-point Likert scale from Very Satisfied to Very Unsatisfied for each individual
format
• Scenario-specific satisfaction in which a set of eight scenarios was presented,
each scenario representing a different combination of high/low importance, ur-
gency and required task concentration.1 Here, specific tasks and events were
not defined (hence “abstract”) and instead a scenario would read, e.g., “You are
working on a task that requires a great deal of concentration when an urgent
notification arrives to remind you about an important event.” Respondents
were asked to indicate (via a check box) those notification formats that would
be desirable for each scenario
• Open-ended questions, including whether there are other notification formats
used by the respondent but not incorporated into this survey, and whether there
are any other comments or suggestions for the experimenters.
Grounded Survey
This was a two-part survey in which a calibration phase was administered to
understand how people would categorize certain office-based tasks and activities
based on specific contextual features that have been found relevant to understanding
people.s notification delivery preferences. In this first phase of the study, a paper-
based questionnaire asked respondents to indicate the level of importance (high or
low) associated with a set of 14 events that are known to be part of their daily routine.
Respondents were also queried about the level of mental concentration, or task focus,
required of 14 tasks that are also known to be routine among this particular group
1These features (task concentration interchangeable with attention requirements) have been shown influential ofnotification preferences, though in some cases importance and urgency are combined into a measure of “utility”;in [84] the term “urgency” itself was used but seems to equate to utility.
64

of employees working in the technical support center.2
The sole difference between the grounded and abstract surveys lies within the
Scenario-specific Satisfaction section. Here, a set of sixteen scenarios was presented,
each scenario representing some combination of high or low importance, urgency
and required task concentration, this time determined not by the survey but by user
responses to the tasks and events in Part I. In this survey, the specific tasks and
events were defined (now warranting the term “grounded”); a scenario might read,
e.g., “You are working on an FRI document when a notification arrives to remind you
that your weekly group meeting is about to begin.” Again respondents were asked
to indicate (via a check box) those notification formats that would be considered
desirable according to each scenario.
5.3 Findings
Figures 5.1 & 5.2 display a summary of the desirability ratings that each noti-
fication delivery format received, aggregated according to the contextual features
that I studied. The fact that the importance associated with a notification event
influences desirability ratings is apparent in both the responses to the grounded and
ungrounded surveys: it is seen that, aside from the email alert, all notification formats
are found to be desirable in a greater number of scenarios when notification-based
importance is high. This was corroborated by a chi-square test for independence
(χ2=53.4, p<0.001; χ2=18.8, p<0.001) indicating correlation between importance
and desirability ratings for the grounded and ungrounded survey data, respectively.
Urgency is also a predictor of desirability, as is again apparent in Figures 1 & 2 as
well as per the chi-square statistic (χ2=163.3, p<0.001; χ2=5.34, p<0.05).
2The events and tasks chosen for the grounded survey were the result of a series of pointed discussions withsupport center employees with whom I had gained a good deal of rapport (and who did not themselves take part inStudy 3 or in responding to the surveys).
65
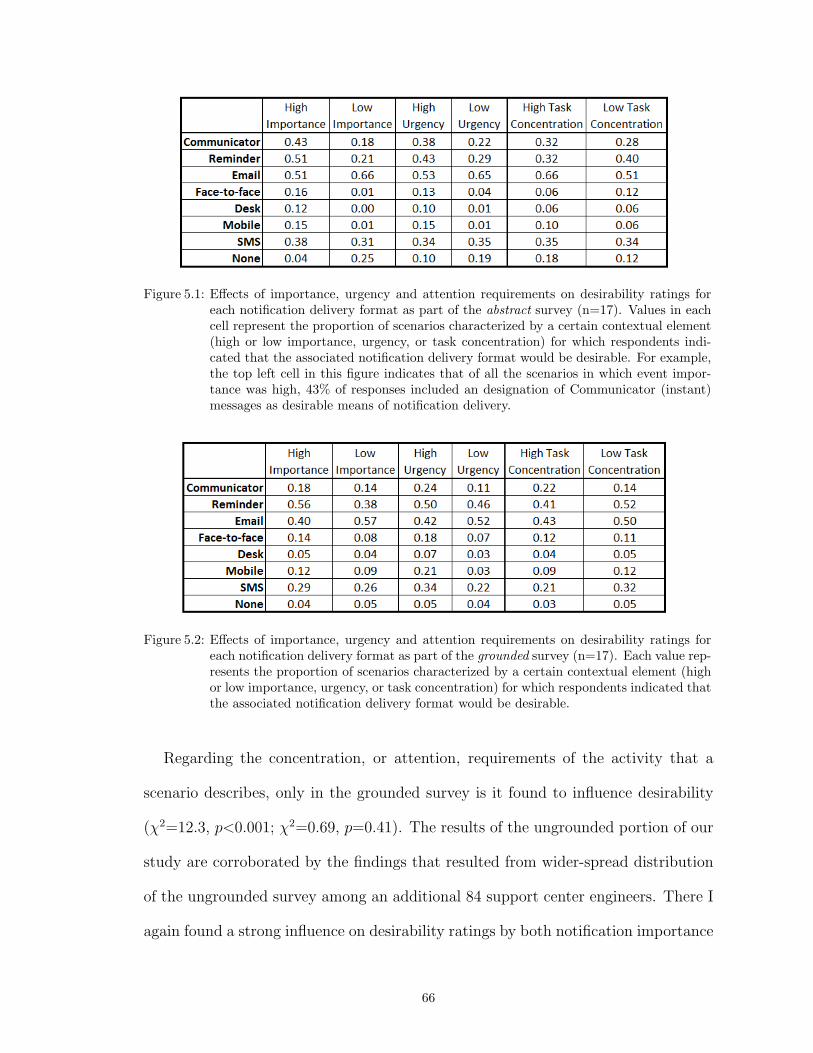
Figure 5.1: Effects of importance, urgency and attention requirements on desirability ratings foreach notification delivery format as part of the abstract survey (n=17). Values in eachcell represent the proportion of scenarios characterized by a certain contextual element(high or low importance, urgency, or task concentration) for which respondents indi-cated that the associated notification delivery format would be desirable. For example,the top left cell in this figure indicates that of all the scenarios in which event impor-tance was high, 43% of responses included an designation of Communicator (instant)messages as desirable means of notification delivery.
Figure 5.2: Effects of importance, urgency and attention requirements on desirability ratings foreach notification delivery format as part of the grounded survey (n=17). Each value rep-resents the proportion of scenarios characterized by a certain contextual element (highor low importance, urgency, or task concentration) for which respondents indicated thatthe associated notification delivery format would be desirable.
Regarding the concentration, or attention, requirements of the activity that a
scenario describes, only in the grounded survey is it found to influence desirability
(χ2=12.3, p<0.001; χ2=0.69, p=0.41). The results of the ungrounded portion of our
study are corroborated by the findings that resulted from wider-spread distribution
of the ungrounded survey among an additional 84 support center engineers. There I
again found a strong influence on desirability ratings by both notification importance
66
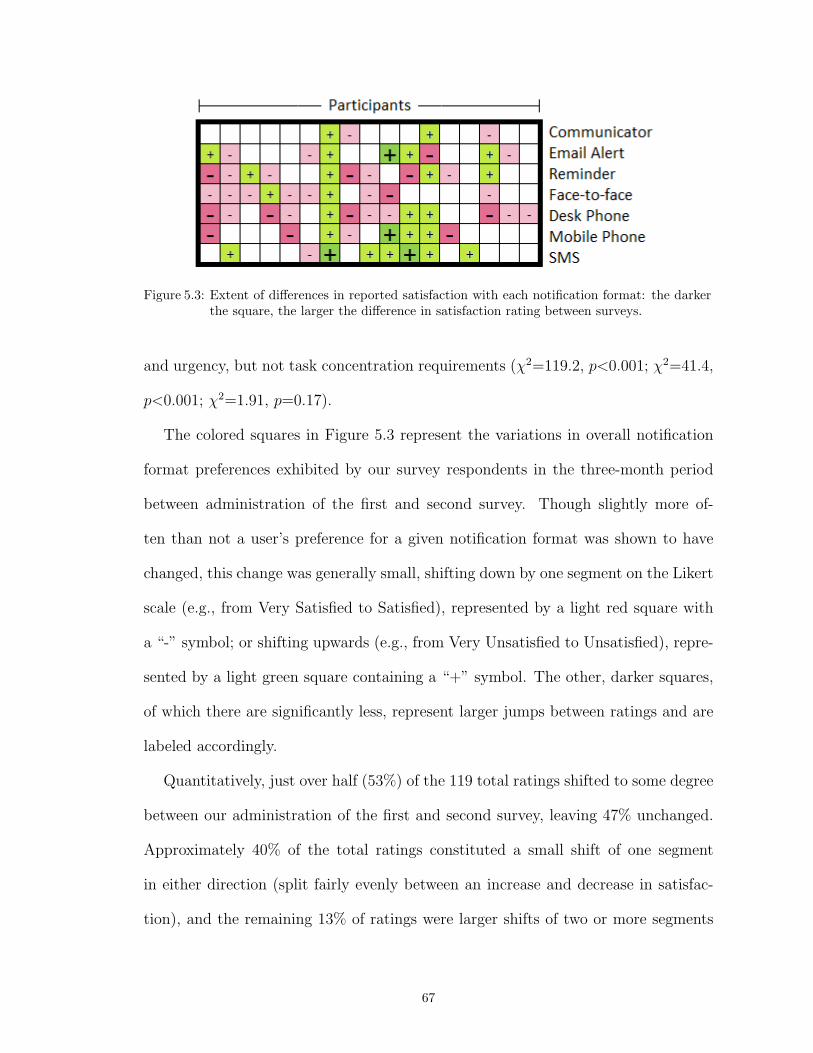
Figure 5.3: Extent of differences in reported satisfaction with each notification format: the darkerthe square, the larger the difference in satisfaction rating between surveys.
and urgency, but not task concentration requirements (χ2=119.2, p<0.001; χ2=41.4,
p<0.001; χ2=1.91, p=0.17).
The colored squares in Figure 5.3 represent the variations in overall notification
format preferences exhibited by our survey respondents in the three-month period
between administration of the first and second survey. Though slightly more of-
ten than not a user’s preference for a given notification format was shown to have
changed, this change was generally small, shifting down by one segment on the Likert
scale (e.g., from Very Satisfied to Satisfied), represented by a light red square with
a “-” symbol; or shifting upwards (e.g., from Very Unsatisfied to Unsatisfied), repre-
sented by a light green square containing a “+” symbol. The other, darker squares,
of which there are significantly less, represent larger jumps between ratings and are
labeled accordingly.
Quantitatively, just over half (53%) of the 119 total ratings shifted to some degree
between our administration of the first and second survey, leaving 47% unchanged.
Approximately 40% of the total ratings constituted a small shift of one segment
in either direction (split fairly evenly between an increase and decrease in satisfac-
tion), and the remaining 13% of ratings were larger shifts of two or more segments
67
(primarily in the negative direction).
5.4 Discussion
It can be expected that user preferences will change over time and may even
be subject to psychological state or recent positive or negative experiences with
particular types of notifications. However, the fact that scenario-based preference
trends were, in both the grounded and ungrounded cases, stable with respect to their
correspondence with prior results in the reactive setting [84] suggests that scenario-
based reflective preferences are robust to the moderate changes in general notification
delivery preferences (expected to be exhibited in any repetitive study).
Though seemingly an aberration in the desirability trends exhibited in Figures 5.1
& 5.2, the fact that email alerts were found more desirable in low-importance and
low-urgency scenarios (in both the grounded and ungrounded settings) is actually in
direct alignment with prior work that classified notification delivery formats based
on their level of intrusiveness [63, 84, 86]. More specifically, research has shown
that intrusive notifications are desirable in high-utility scenarios, and vice-versa, as
in this case of email alerts: namely, that non-intrusive notifications are found more
desirable when associated utility is low. Presumably, the primary explanation for
this phenomenon is that non-intrusive notifications can thus be ignored when their
content is not worthy of immediate action.
The primary results of this study are thus in alignment with Study 1, the other
purely reflective study that I conducted. General preference trends align with those
found in the second phase of Study 1, in which more notification delivery formats
were found desirable in high-utility or low-concentration scenarios. Among those no-
tification formats examined in Study 1, namely reminders, instant messages, mobile
68

phones, and email notifications, overall desirability within this set of notifications is
higher when either event importance is high (versus low) or message urgency is high
(versus low), and in the grounded survey the same holds for the contextual scenarios
in which task concentration requirements are low (versus high). These trends also
extend to the other notification formats examined specifically due to their use in the
office environment to which Study 3 was tailored.
Study 4, described next, will attempt to use contextual features directly observed
in a user’s environment to predict that user’s notification preferences. Here in Study
3, certain high-level contextual features could be easily captured or hypothesized,
whereas in a purely naturalistic setting, all bets are off: it will be a matter of access
to (and agreement on) whatever contextual features are accessible at the time a
notification arrives whether or not successful preference modeling can be achieved.
69
CHAPTER VI
Notifications in the Workplace
My primary motivation for conducting an additional study in a naturalistic setting
was to test the degree to which the hypotheses and findings from Study 1, Study
2, Study 3, and related literature also conducted in lab-based settings, hold up in
a real-world environment in which they have, to date, not been evaluated. I was
further interested in validating the context ontology I proposed, by way of actual
contextualized scenarios, and to learn about the potential of a customized notification
system to satisfy its users’ preferences.
The research questions, more formally, can be presented as follows:
(R5) What is the relationship between context (as defined in this thesis) and
notification preferences in a true office environment;
(R6) How successful is the best overall user model at preference prediction,
both on the whole (for all participants) and individually; and
(R7) Can the contextual features captured in a naturalistic setting influence the
(high-level) contextual features examined throughout this dissertation (namely:
Importance, Urgency, and Attentional Focus)?
The final study that I conducted and describe here, Study 4, took place over
a period of three months in a technical support center in Bangalore, India. As
70

my primary objective was to examine notification preferences in a truly naturalistic
environment, it was tantamount that preferences be elicited in the least intrusive
manner possible. To ensure that this could be the case, and that I understood the
functioning of the support center and its employees’ day-to-day routines, I spent
many of the initial weeks of the study in an observation and information gathering
stage. When I felt I had a strong understanding of daily protocol, I developed a
software application that would elicit and log notification feedback. The application
was then piloted with a few employees with whom I had built strong professional
relationships, and it was then deployed, with many more participants, for a period
of four weeks in total.1
6.1 Observation & Information Gathering
More than one month was spent becoming acquainted with the technical support
center in terms of its structure, functioning, personnel, and culture. I interviewed
employees in a variety of positions within the organization, including directors, man-
agers, various categories of support engineers, and language specialists.
I spent much of my time observing support engineers, of which there are many
categories. For one, certain engineers are assigned to one of three distinct areas of
the world: North America; Europe, the Middle East and Africa; and Asia Pacific.
Engineers are also divided into areas of specialization, e.g., different Microsoft prod-
ucts are assigned a team of support engineers who are each trained to be experts in
that one specific product technology.
1Though deployment lasted four full weeks, my software was running for some subset of those four weeks forany given participant, on an individual-by-individual basis, and due to a number of factors described in the comingsections.
71
6.1.1 A Day in the Life
In terms of a daily routine, some support engineers spend a majority of their
time in a computerized “queue” responding to incoming support calls. Others spend
time giving live, over-the-phone (and with shared desktops/viewing areas) workshops
and presentations to Microsoft partners and clients. Some support engineers provide
proactive support (as opposed to the general reactive nature of support calls) by
reaching out and calling clients to ask whether their Microsoft products are working
well and whether they have any questions or would like to take part in an upcoming
workshop. A good deal of time is also spent logging information about support calls
into a networked database that is shared among team members and periodically
checked by team leads and managers.
Despite the banners that hang from the ceiling above each section of cubicles to
declare an area a quiet zone, there is generally a lot of hubbub in the support center
(areas of which varies throughout the day, as clusters of each floor are often devoted
to different areas of the world and thus are on different time schedules within a 24-
hour period). People are often shouting back and forth to one another, either about
a case or a personal matter, or to organize cafeteria mealtimes or group meetings.
And engineers are constantly circulating their work areas on foot, especially team
leads who are frequently checking in with team members and consulting on difficult
cases.
From my interviews, I learned about the structure of Microsoft’s Global Techni-
cal Support Center, which comprises two large buildings in a technology park in a
southern section of Bangalore. Each building houses a gym and cafeteria facilities
(for which a month’s worth of meal tickets are doled to each employee on the first
of the month free of charge; as is the gym free for employees’ use). Engineers and
72

other non-managerial employees are each assigned a personal cubicle, and managers
are assigned to an enclosed office. I also learned about specific roles maintained by
individual engineers; together with my understanding of the office layout and day-to-
day activity levels, this ultimately allowed me to choose a representative population
of engineers to participate in my study.
6.1.2 Workplace Notifications
I further learned about the types and frequencies of workplace notifications that
are delivered on a daily basis at the support center. As I found through observation,
there was a high frequency of face-to-face notifications: from managers, team leads,
and colleagues making stops to each others’ desks. Also frequent were emails and
email notifications—employees seemed to receive dozens of emails per shift, and even
per hour. Emails were just as likely arriving from colleagues and work superiors
as from friends or colleagues about personal matters. Examples of work-related
email correspondence include case-related questions and support requests. Personal
emails often had to do with scheduling outings or helping friends in need of financial
support.2 Instant messages were also high on the list of frequently encountered
notifications: people were often in more than one instant message conversation at
any given time (frequently with work colleagues), and on certain occasions they might
be chatting with more than one person in a single message stream.
Less frequent were notifications in the form of text messages and mobile phone
calls, though this varied greatly among individuals. On-screen reminders were also
observed less often, likely because there were not many officially scheduled meetings
or events. The frequency of desk phone calls also varied among individuals depending
on their role in the support center as a reactive or proactive support team member.
2People often rally for help from friends when family members are in financial need due to high medical care costs.
73

Regardless of frequency and delivery patterns, I concluded that the following
types of notifications were likely to be received in large numbers by most if not
all of the support engineers that would be participating in my study: Mobile (cell)
phone calls (denoted C from here forward); Desk phone calls (D); Emails (as in,
the email message itself, having been opened in a participant’s inbox) denoted E
and not to be confused with Email Notifications (or EN) referring to the small
pop-up windows (sometimes called “toast”) that emerge from the bottom right-hand
corner of a computer screen; Face-to-face notifications (F), instant messages—IMs—
delivered via any of many instant messaging programs in use in the support center;
Reminders (R) for events scheduled in an employee’s Outlook calendar; and Text
messages on a mobile phone (denoted by the letter T).
6.2 Prototype Development & Testing
Observations and interviewing helped me to gain an understanding not only about
the inner workings of the technical support center, the role each individual plays, and
the types and patterns of notifications that employees experience; but also about how
best to capture contextual information, and preferences, in a non-intrusive fashion.
To access preference information, a simple pair of buttons, similar to the buttons
used in Study 2, could be programmed to appear on a participant’s computer screen
and with a quick click, log his or her preferences in response to notifications that
arrive.
Collecting contextual information was slightly more difficult, as I wanted to cap-
ture features related to both notification content and an individual’s environmental
setting. For on-screen content- and setting-based information, screen captures of a
participant’s complete computer screen would provide the most information possible
74
(aside from direct communication or follow-ups with participants, which were both
infeasible due to their disruptive nature). Off-screen context (e.g., the content of
a face-to-face or phone-based notification, or features pertaining to an individual’s
environmental setting) could only be fully captured with a voice-recording system,
ideally incorporating some sort of video capturing mechanism.
A number of different types of recording mechanisms were tested, including some
freely available software systems that could be used for capturing environmental
setting via video capture with a small, external web camera, paired with systems
that would capture screen shots or recordings of a computer screen. Pilot testing
of these programs took place over the course of two weeks, during which time three
Microsoft employees tested out various configurations of the software and camera
combination. Software that was too cumbersome for participants or did not meet
the requirements set out for the study (see Chapter VII, Section 7.1.2 for details) were
discarded, and pilot testing concluded after rigorous testing of the best candidate for
screen and environment capture.
The pilot testing period provided an understanding of how often engineers are
likely to be seated at their desks and how frequently they can be expected to respond
to notifications. This informed the final stages of design of the testing period of
Study 4: to collect as much data as possible, it would prove important to remind
participants to provide notification feedback and allow the testing phase to run for
enough days that a sufficient amount of feedback could be collected. Ideally, each
study participant would provide numerous feedback ratings for each of the eight
distinct notification types.
75
6.3 User Testing
The testing phase of Study 4 comprised three segments: first, participants were
recruited from the set of support engineers working in one of the support center’s
two buildings. When participants were selected, they were each provided a set of
instructions including links to the software packages that required installation on
their work machines.3 Finally, once the software and web camera were all installed
and configured, the primary segment, the actual experimentation stage, of this phase
of Study 4 could begin.
6.3.1 Participant Selection
The testing phase of Study 4 began with selection of participants. To attempt to
control as much as possible outside of the (highly uncontrollable) contextual scenarios
surrounding individual notifications, I wanted to work with employees in the same
role. This meant finding a large enough group of employees, with enough interest
among them, to select as participants. There was one very large team of employees
that worked on different aspects of a specific product and worked primarily on the
Asia Pacific and North America shifts. Many of the employees on this team were
agreeable to participating in the study,4 and one team member was gracious enough
to act as a research assistant to me; he helped me to organize groups of employees
to introduce them to the project and also helped with configuration and facilitating
participation.
3I received prior approval from Microsoft’s management and support teams to facilitate set-up of the tools requiredfor my study.
4Though participants were not offered compensation for participating in this study, the support center had hadpositive experiences with Microsoft researchers, and most employees were very happy to work with me. I also providedcustomized, commemorative t-shirts at the conclusion of the study.
76
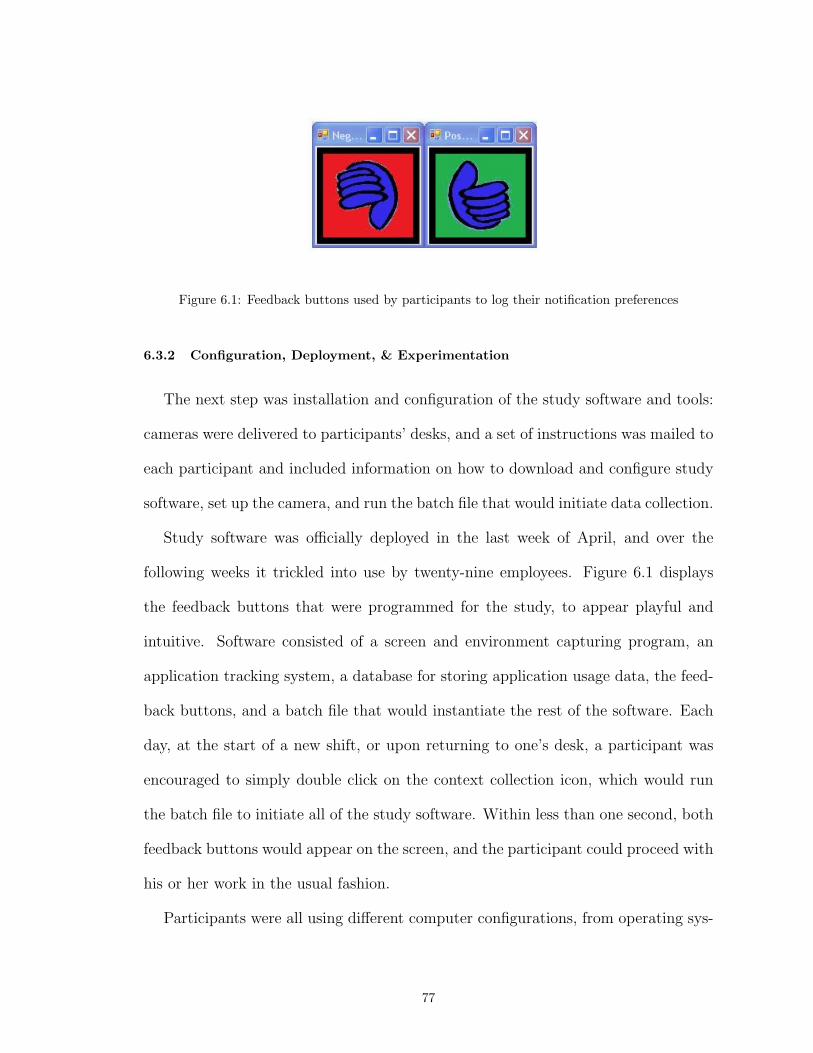
Figure 6.1: Feedback buttons used by participants to log their notification preferences
6.3.2 Configuration, Deployment, & Experimentation
The next step was installation and configuration of the study software and tools:
cameras were delivered to participants’ desks, and a set of instructions was mailed to
each participant and included information on how to download and configure study
software, set up the camera, and run the batch file that would initiate data collection.
Study software was officially deployed in the last week of April, and over the
following weeks it trickled into use by twenty-nine employees. Figure 6.1 displays
the feedback buttons that were programmed for the study, to appear playful and
intuitive. Software consisted of a screen and environment capturing program, an
application tracking system, a database for storing application usage data, the feed-
back buttons, and a batch file that would instantiate the rest of the software. Each
day, at the start of a new shift, or upon returning to one’s desk, a participant was
encouraged to simply double click on the context collection icon, which would run
the batch file to initiate all of the study software. Within less than one second, both
feedback buttons would appear on the screen, and the participant could proceed with
his or her work in the usual fashion.
Participants were all using different computer configurations, from operating sys-
77
tems (Windows 7, Windows XP, and Windows 2000 were all being used) to data
storage configurations (some drives were full or restricted for certain uses), so differ-
ent elements of my study software often needed tweaking. In addition, the duration
of experimentation with participants varied: some were on vacation during parts of
the study period; others had difficulty running the software or provided only sporadic
or infrequent notification feedback.
There were a few iterative improvements to the study software, particularly in-
volving the feedback buttons, as experimentation progressed. Initially, the feedback
buttons were about two inches in diameter and not enabled to remain in the fore-
ground of the computer screen. Observing button underuse (because as originally
designed, the buttons were often minimized, leading to participants forgetting about
their existence), I re-programmed them to maintain their position in the foreground
of any open application regardless of location (of the buttons or of the application).
This led to more routine feedback, but again the buttons were being minimized.
Through informal discussions, I realized that minimization was due to screen real
estate contention, so I again re-programmed the feedback buttons to be much smaller
in diameter, allowing them to remain in the foreground without significantly affecting
application visibility.
6.3.3 Obstacles & Limitations
As mentioned briefly at various points above, and due to the inherent nature of
the study, namely that it must be conducted in as naturalistic a setting as possible,
there were numerous obstacles that would not have necessitated consideration in a
laboratory environment. Some were solvable, with a bit of work from the researcher’s
side; others were limitations of the study design and requirements. Below is a list of
these obstacles and limitations; Chapter X provides further discussion and suggests
78

solutions to some of these issues.
1. Multiple computer screens per user (making it difficult to discern whether a
participant is looking at the notification or elsewhere)
2. Multiple computers being used (such that it was important to as that study
software be installed on the same system as the Outlook tool, so that Outlook
shares the screen with context-collection applications)
3. Audio was shaky at best (many computers did not have audio enabled; the
camera employed had a microphone attached and was not always enabled)
4. Video corruption/Collection software issues: People may run programs that
interfere with the capturing software and render the resulting videos corrupted
to certain degrees (often, perhaps, from too much CPU activity)
5. User compliance: people would minimize the buttons or forget to use them; there
wasn’t necessarily enough time to get them accustomed to using the buttons; it
wasn’t as easy to remember to use them with off-screen notifications like F2F
and phones.
6.3.4 Hypotheses
(H4.1) As suggested by Study 1, Study 3, and the reflective session in Study 2,
notification types that may be considered only moderately intrusive will receive
a larger proportion of positive ratings than notifications of the highly, or more
intrusive ilk.
(H4.2) In high-utility, low-attention situations, more notifications will receive
positive ratings than in low-utility, high-attention scenarios.
(H4.3) A generalized user model should be markedly less successful at predict-
ing notification preferences than a set of individual user models.
79

CHAPTER VII
Methodology: Collecting & Coding Rich Video Data
With care taken to limit the deviation from a participant’s daily routine, it was
crucial that contextual information be captured as unobtrusively as possible. Because
this entailed limiting experimenter interactions with participants, prohibiting, e.g.,
inquiries on details concerning any aspect of their minute-by-minute experiences,
context was required to be captured not only automatically but also as broadly and
completely as possible. This in turn would allow access to any information with
the potential to contribute to an understanding of context, in lieu of the fact that
obtaining information directly from participants was not an option.
To access the specific contextual information relevant to my research hypotheses,
I collected and coded videos of participants’ computer screens and general work en-
vironments. My goal was to extract information from the videos according to a list
of factors that combine ideas and techniques from related literature with my prior
work and recommendations about which specific elements of contextual information
may be expected to influence people’s notification delivery preferences. Once the
information in the videos was coded to reflect these features of interest, and dis-
ambiguated (to account for coder disagreement and missing values) to the extent
possible, I used the resultant data set to generate a model representative of people’s
80
overall preference patterns.
This chapter describes my collection, coding, and analysis processes; it includes
a discussion of the different techniques available at each step; and it highlights the
limitations of the techniques I chose to use. Chapter X expands on these limitations
and presents a set of recommendations that may be useful for conducting similar
research projects in the field.
7.1 Collecting Rich Video Data
Recall that I defined context to include specific aspects of an individual’s en-
vironmental setting and also elements of the content of notification messages that
he or she receives (cf. Figure 1.1). To access all of this information, a paired video
capturing scheme was employed in the experiment: a video was generated for (1) a
participant’s computer screen activity (from hence to be called ”Screen Capture” or
SC), and (2) the environment in which a participant is working (called ”Environment
Capture” or EC).
7.1.1 Protocol
The protocol, described in Section 6.3, explains the process of registering noti-
fication ratings and collecting contextual information. To summarize: participants
were asked to run a batch (.bat) file that would initialize a screen capturing video
stream, an environment capturing video stream, and two on-screen feedback buttons
(see Figure 6.1) that they were asked to use to log their preferences. Preferences,
in the form of positive and negative feedback ratings provided via the feedback but-
tons, were logged into a data file keyed on the date and time at which a feedback
button was pressed, so that when processing the data post-experiment, the timing
of a feedback instance could be easily discerned.
81
7.1.2 Data Collection Limitations
To collect as much contextual data as possible, it was important to have access to
both a participant’s on-screen activities and behavior, and also his or her off-screen
environment. An initial plan toward this end was to set up a small mirror to face the
computer screen, such that a video recording device could capture a participant at his
or her desk and also that participant’s screen activity. However, the lighting in the
technical support center was too dim, and the granularity of the image too coarse, to
achieve much success in this configuration. An alternate configuration of the mirror,
in which it faced away from the computer screen, would capture the participant’s
face but not enough of the environment to be considered useful. Instead, to replace
the mirror and recording device, a paired video recording scheme was considered the
best bet as a context-collection technique.
Choosing the most appropriate video capturing program was a surprisingly dif-
ficult process. I was initially faced with a decision to either use a program that
captures video streams, or a program that captures sequential (still) screen and/or
environment captures (that could be pieced together to provide the contextual infor-
mation needed). Here I had to account for: (1) the fact that I would be capturing,
and subsequently parsing through, two sets of contextual information; (2) people
would be using capturing software in real time, simultaneous to and in the back-
ground of their ordinary work activities (and thus it could not as a side effect slow
the functioning of their machines); (3) an audio stream was highly desirable, as it
would not only be required for understanding certain contextual situations but also
useful for aligning two sets of data; (4) the context-capturing system would need to
be as automated as possible, so that people could start and stop recordings with a
single click as needed; and (5) hard disk space limits may impede large data files
82
from being successfully created and stored, so the smaller the overall footprint the
better.
7.1.3 Selected Context-Capturing Method
As a result of these constraints limiting the possibilities for capturing contextual
information, I chose to use a video capture program that would succeed at both
the screen capture task and the environment capture (many such programs are only
designed for one or the other), and could be programmed to run, appropriately and
completely configured, automatically. The program I chose, called Windows Media
Encoder, or WME [19], could capture audio and video together, and two instances of
the software could be run on a single computer simultaneously without any noticeable
overhead, either in storage capacity or CPU slowdown (when pilot tested on three
distinct computer configurations).
A single batch file initiated both WME instances and set the name of each video
stream to incorporate the current date and time.1 For example, if a participant ran
the batch file on May 11th at 1:23pm, two WME files would be instantiated with
the names “SC 11 5 13 23 45.wme” and “EC 11 5 13 23 45.wme”—where SC and
EC stand for “Screen Capture” and “Environment Capture” respectively, and ‘45’
represents the number of seconds past the minute at which the batch file was run.2
Participants were asked to close out the WME programs at the end of each work-
day, and so many of the collected video files are up to 11 hours in length. Other files
are shorter, whether because they were not started up at the beginning of a work
shift (it was not required that participants be running these programs all the time),
1The time a file was written did not always correlate with the initiation of recording, nor did the time the file waslast updated correspond to the end of a recording. Thus, the only way to access the time at which a video beganrecording was to implement a file naming scheme that matched start-recording time with current system time.
2The Indian standard date format, in which the month follows the day rather than vice versa, was adopted foreach of the video files to avoid confusion on behalf of study participants.
83

they were stopped and restarted according to a participant’s time at his or her desk,
or due to software glitches or system restarts, causing multiple files to be written in
a single day.
7.2 Content Analysis: Video Coding
The term “content analysis” describes the process of inferring certain feature val-
ues from a corpus (of text, images, videos, etc.). Though there are many definitions,
Krippendorff’s [54] is both concise and descriptive:
Content analysis is a research technique for making replicable and valid
inferences from data to their context. (p21)
In the context of my fourth study, content analysis refers to the process of sending
videos through an observation and coding process to access the contextual features
relevant to each individual feedback instance. The features that were chosen to
be used in coding of the videos are listed in Appendix C. Appendix C comprises
the complete code book that was provided to coding assistants (to which I will
refer as “observers” from here forward, to maintain consistency with the literature,
e.g., [69]). Two additional documents were provided to the observers: a protocol
document (Appendix A) and a non-disclosure agreement (Appendix B).
Observers were provided a set of spreadsheets, each associated with a study par-
ticipant, including as column headings each of the contextual features of interest.
Feedback instance dates and times were included in the first few columns of each
worksheet, and the rest of the contextual features were left for observers to fill in
according to the videos watched. Observers were asked to follow the instructions and
refer to the codebook as they worked through the screen capture and environment
capture videos and added feature values to the spreadsheets.
84
Neuendorf provides a well-structured content analysis process rubric [69] for fa-
cilitating the video coding process, which I adopted for this study and summarize
here:
Step 1. Write codebook
Step 2. Train observers via discussion of coding process
Step 3. Revise codebook per observer feedback
Step 4. Train observers on revisions to codebook
Step 5. Pilot test the coding process
Step 6. Discuss results
Step 7. Revise codebook
Step 8. Train observers on revisions to codebook
Step 9. Conduct an initial reliability analysis
Step 10. Initiate full-blown coding process
Step 11. Post-coding activities:
• Reliability analysis
• Observer debriefing
• Data analysis
• Results reporting
First, after writing the codebook and preparing coding materials (including the
three main documents: the coding protocol, codebook and NDA; and the coding
spreadsheet and videos for each observer) [Neuendorf Step 1], observers were brought
together for a walk-through of the coding process and to ask any initial questions
[Neuendorf Step 2]. They were then provided with a soft copy of an updated
85

codebook, details on revisions (most of which were discussed in person with the
group) and a pilot set of videos (and associated feedback instances) to code [Steps
3, 4, & 5]. This piloting process provided observers with an understanding of the
coding process; it also allowed for additional feedback as to whether ambiguities in the
codebook or instructions were found to exist while going through the actual coding
process. After coded pilot spreadsheets were returned, individual meetings were
arranged with each observer to provide and elicit feedback: I had examined their work
and could provide suggestions to the observers regarding how their coding could be
improved, both individually and also on the whole, pointing out misconceptions and
acknowledging ambiguities in the instructions; simultaneously, the observers provided
me with feedback and any concerns that had arisen [Step 6].3 The codebook was
then, again, revised according to observer feedback and the information I had culled
regarding general observer misconceptions, and I emailed the observers to inform
them of the changes and answer any final questions. I also created a Frequently Asked
Questions website, attached to my university homepage, that could be updated with
any required clarifications to the coding instructions [Steps 7 & 8]. The initial
coding pilot also provided an indication of the intercoder reliability that was to be
expected in the full-blown video coding process [Step 9]. Finally, the official coding
process could begin: all ten observers participating in the coding process were each
provided an external hard drive loaded with a spreadsheet, videos, and soft copies of
all of the documents that they had seen and/or would need to reference in the coding
process. [Step 10]. Further details on how I followed Neuendorf’s content analysis
rubric, and more on the steps involved in the post-coding process (Step 11), are
described in detail in the coming pages and through the rest of this thesis.
3At this point ten of the twelve original observers were asked to continue through the remainder of the codingprocess.
86
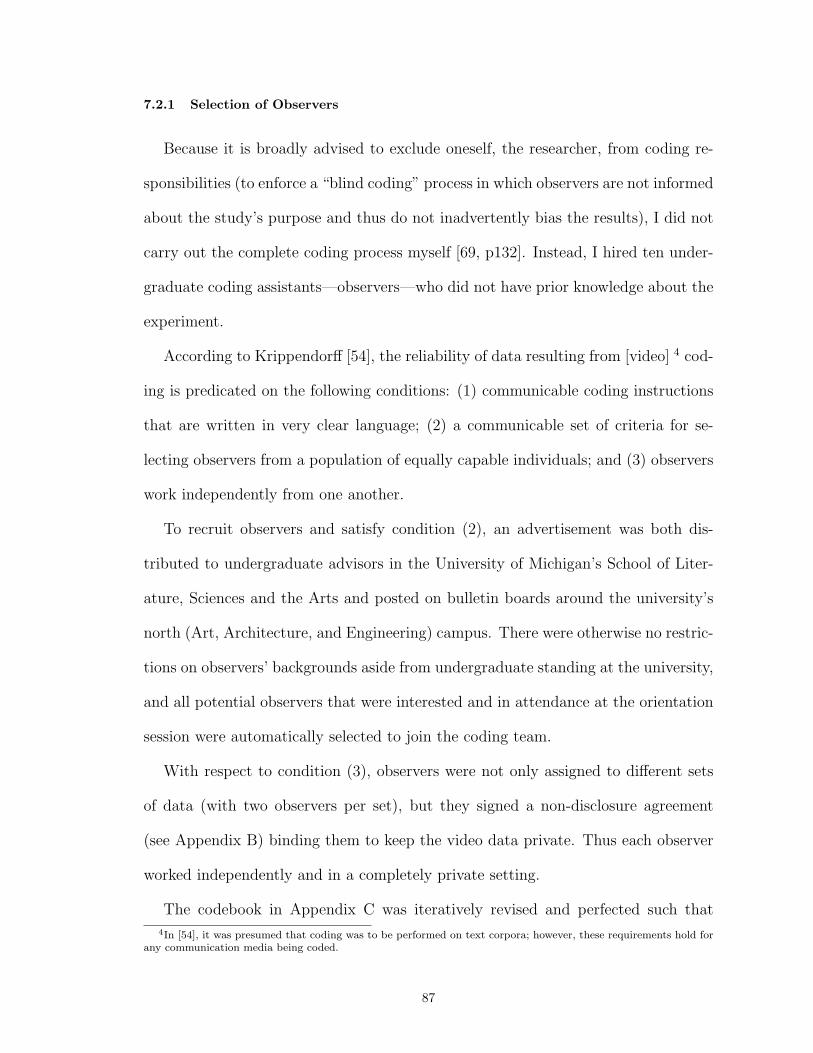
7.2.1 Selection of Observers
Because it is broadly advised to exclude oneself, the researcher, from coding re-
sponsibilities (to enforce a “blind coding” process in which observers are not informed
about the study’s purpose and thus do not inadvertently bias the results), I did not
carry out the complete coding process myself [69, p132]. Instead, I hired ten under-
graduate coding assistants—observers—who did not have prior knowledge about the
experiment.
According to Krippendorff [54], the reliability of data resulting from [video] 4 cod-
ing is predicated on the following conditions: (1) communicable coding instructions
that are written in very clear language; (2) a communicable set of criteria for se-
lecting observers from a population of equally capable individuals; and (3) observers
work independently from one another.
To recruit observers and satisfy condition (2), an advertisement was both dis-
tributed to undergraduate advisors in the University of Michigan’s School of Liter-
ature, Sciences and the Arts and posted on bulletin boards around the university’s
north (Art, Architecture, and Engineering) campus. There were otherwise no restric-
tions on observers’ backgrounds aside from undergraduate standing at the university,
and all potential observers that were interested and in attendance at the orientation
session were automatically selected to join the coding team.
With respect to condition (3), observers were not only assigned to different sets
of data (with two observers per set), but they signed a non-disclosure agreement
(see Appendix B) binding them to keep the video data private. Thus each observer
worked independently and in a completely private setting.
The codebook in Appendix C was iteratively revised and perfected such that
4In [54], it was presumed that coding was to be performed on text corpora; however, these requirements hold forany communication media being coded.
87

instructions were clear and standardized among observers, meeting condition (1)
and assuring that all conditions for ensuring the highest standards for reliable data
were met in the coding process.
7.2.2 Iterative Revisions to Coding Materials
In the process of preparing for the full-blown coding process, a number of alter-
ations to coding materials were enacted. Two fairly major changes to the codebook
involved the variables called “Topic” and “Desk Position.” The Topic variable was
originally meant to require coders to differentiate between work-based and personal
notifications. However, because in the data collection phase of Study 4, I myself as
the researcher had initiated notifications for the purpose of ensuring that (1) different
types of notifications were provided an adequate amount of feedback, and (2) partic-
ipants were reminded, every once in awhile, that they should be giving feedback to
their notifications—I was essentially attempting to increase user compliance. Thus,
because observers expressed difficulty deciding whether notifications initiated by me,
the researcher, were to be considered work-based or personal, I decided to add an
additional category to the Topic variable called “Experimenter-Initiated.”5
The second major change to the codebook affected the “Desk Position” variable.
Initially, in the first version of the codebook (that observers referenced in the pilot
coding session), this feature was divided into four binary variables called “Sit Fac,”
“Sit Away,” “Stand Fac,” and “Stand Away.” This seemed redundant, however,
because if a participant is not sitting, he or she is standing; and if that participant is
not facing the computer, he or she is facing away. Thus, the four position variables
were condensed into a single categorical variable that allowed observers to choose one
5While I could have asked that observers consider all of my interactions with participants to be work-related,some of those interactions were friendly in nature, and I did not want this to confound the other codes for the Topicvariable.
88

of the four positions as the value for the Desk Position feature. Observers seemed
much more satisfied with this modification, as they did with the inclusion of an
Experimenter-Initiated value for the Topic variable above.
Though the codebook itself wasn’t modified, I provided extensive (verbal and
written) clarification to help observers distinguish between Emails (E) and Email
Notifications (EN) as codes to describe the type of notification being delivered.
To summarize here, a notification is considered an Email (E) when feedback was
provided in response to reading a message in one’s inbox; i.e., a participant’s focus
was in his or her inbox at the time at which notification feedback was provided. An
Email Notification, instead, describes those notifications that elicit feedback without
control residing in an inbox; and more specifically, notification feedback in response
to a pop-up message in the bottom right corner of a participant’s computer screen
(sometimes known as a “toast” message).
Other guidelines that I issued once the pilot coding session was through include
the following:
1. That “Event Time” refers to the time of the event that is the subject of the
notification;
2. That “visible” (e.g., with respect to computer desktop applications) refers to
those instances in which some part of an application can be seen on the screen
(and that application is not minimized);
3. That the “Number of Chats” includes every (open or minimized) chat window,
even the window that houses the notification itself—this feature can help to
determine how crowded it is on the screen;
4. That the “Blink Chats” variable be expanded to include any blinking item in
89
the task bar;6 and
5. That “X-based Conversation” (where X is one of a cell phone, desk phone,
instant message, or face-to-face interaction) refers to those scenarios in which
the participant was already in a type-X conversation when a notification (of
that or a different type) arrived. (Noting that this does not refer to the means
by which a notification arrives.)
Finally, in addition to these modifications and guidelines, I also provided sugges-
tions to the observers for some “best practices” specifically related to the Study 4
video coding set-up:
• Synchronize video times at the onset:
– Use sound whenever available
– Check the first few seconds of each stream
– Look for the EC video to be encapsulated (visually) in the SC video before
both streams are minimized
– Look to match an off-screen notification to its on-screen feedback time
• Watch both videos simultaneously and in two different video players (because
many do not allow for multiple streams to be watched in tandem); I sent ob-
servers a pointer to a freely available media player to supplement whatever was
available on their personal machines
• Scroll to one minute before the notification to check for the “Multitasking”
feature (requiring that primary focus be shifted from one application to another
within the minute before feedback is provided)
6Note that Blink Chats was specified to be the number of blinking task bar panes, but some observers just usedTrue and False.
90
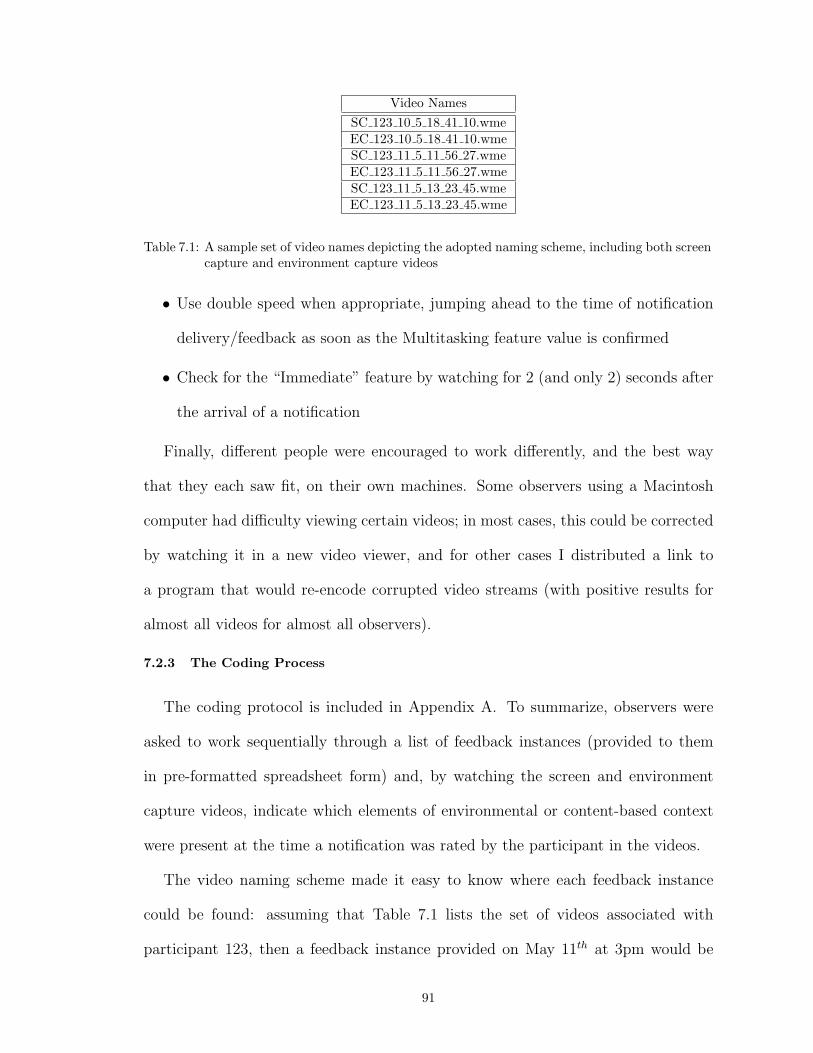
Video NamesSC 123 10 5 18 41 10.wmeEC 123 10 5 18 41 10.wmeSC 123 11 5 11 56 27.wmeEC 123 11 5 11 56 27.wmeSC 123 11 5 13 23 45.wmeEC 123 11 5 13 23 45.wme
Table 7.1: A sample set of video names depicting the adopted naming scheme, including both screencapture and environment capture videos
• Use double speed when appropriate, jumping ahead to the time of notification
delivery/feedback as soon as the Multitasking feature value is confirmed
• Check for the “Immediate” feature by watching for 2 (and only 2) seconds after
the arrival of a notification
Finally, different people were encouraged to work differently, and the best way
that they each saw fit, on their own machines. Some observers using a Macintosh
computer had difficulty viewing certain videos; in most cases, this could be corrected
by watching it in a new video viewer, and for other cases I distributed a link to
a program that would re-encode corrupted video streams (with positive results for
almost all videos for almost all observers).
7.2.3 The Coding Process
The coding protocol is included in Appendix A. To summarize, observers were
asked to work sequentially through a list of feedback instances (provided to them
in pre-formatted spreadsheet form) and, by watching the screen and environment
capture videos, indicate which elements of environmental or content-based context
were present at the time a notification was rated by the participant in the videos.
The video naming scheme made it easy to know where each feedback instance
could be found: assuming that Table 7.1 lists the set of videos associated with
participant 123, then a feedback instance provided on May 11th at 3pm would be
91
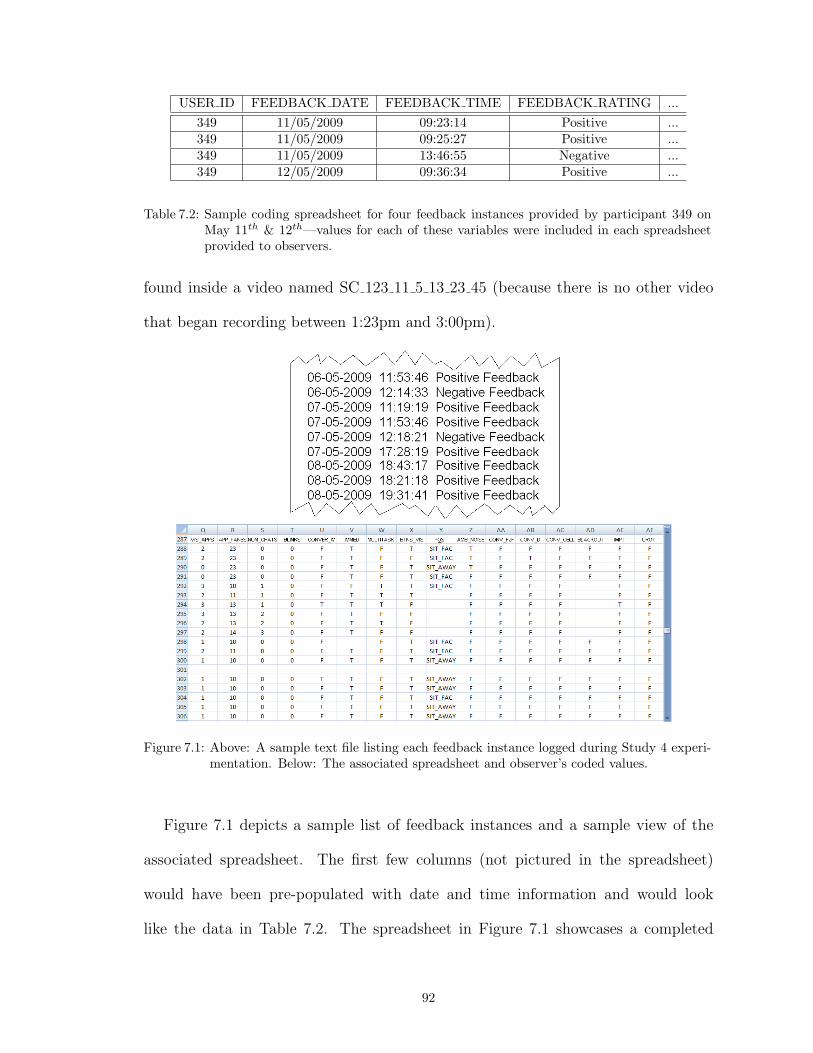
USER ID FEEDBACK DATE FEEDBACK TIME FEEDBACK RATING ...349 11/05/2009 09:23:14 Positive ...349 11/05/2009 09:25:27 Positive ...349 11/05/2009 13:46:55 Negative ...349 12/05/2009 09:36:34 Positive ...
Table 7.2: Sample coding spreadsheet for four feedback instances provided by participant 349 onMay 11th & 12th—values for each of these variables were included in each spreadsheetprovided to observers.
found inside a video named SC 123 11 5 13 23 45 (because there is no other video
that began recording between 1:23pm and 3:00pm).
Figure 7.1: Above: A sample text file listing each feedback instance logged during Study 4 experi-mentation. Below: The associated spreadsheet and observer’s coded values.
Figure 7.1 depicts a sample list of feedback instances and a sample view of the
associated spreadsheet. The first few columns (not pictured in the spreadsheet)
would have been pre-populated with date and time information and would look
like the data in Table 7.2. The spreadsheet in Figure 7.1 showcases a completed
92
spreadsheet; though certain values are missing (as is inevitably the case), values
have been incorporated into some number of features in each feedback instance in
the list.
Once the set of completed spreadsheets has been coded to observers’ best abilities,
data analysis can be conducted to determine whether certain contextual features are
particularly influential of people’s notification preferences in this naturalistic, reactive
setting. Studying the characteristics of the acquired data is the primary objective of
the upcoming Analysis chapter.
93
CHAPTER VIII
Methodology: Rich Video Data Analysis
Analyzing rich video data, like the contextual feedback rating data described in
the previous chapter, is a multi-stage process. Because the data does not come
straight from the source, i.e., observers report feature values upon observation, and
multiple observers provide these values for each instance, the observers’ values must
be assessed and their disagreements resolved (to the extent possible) before attempt-
ing to generate a model of people’s preferences. Then, in the model generation phase,
a number of decisions are required to be made: first, for a data set containing miss-
ing values, a technique for creating a complete data set for use in modeling will be
required; in addition, feature selection and/or data reduction will rely on the results
of the reliability assessment; and finally, the selection of model form (including the
model itself as well as the model features and interactions) is not a trivial one.
8.1 Reliability Assessment
The established method for assessing content analysis data, coded by more than
one observer, is by measuring its “reliability.” Data reliability may refer to one or
all of: the stability, reproducibility, and accuracy of a data set when feature values
are provided by more than one observer [87]. Measuring stability requires having
repeatedly observed (and coded) a single instance, and this is not feasible in a real-
94

world, real-time study (like Study 4) in which contextual dynamics are shifting by the
second. By the same token, accuracy requires knowledge of the true feature values
for a given coding unit, or instance, and this is not attainable in an experiment like
Study 4 either. However, reproducibility can be measured well: it is the degree to
which there is agreement among observers, i.e., it measures the strength of the claim
that the same values will be reproduced by different people.
Reliability must be reported separately for each individual variable; otherwise,
e.g., a single low-reliability variable may not be reflected in an overall reliability
score. There has been hot debate in the reliability literature on which measure or
measures are most appropriate (a) for a particular type of variable or data set, and (b)
for making comparisons amongst data sets [54, 59]. Lombard and Snyder-Duch [59]
contend that different metrics are suited to different types of data. Popular metrics
include but are certainly not limited to: general percent agreement, Scott’s pi [80],
and Fleiss’s K [31] (and numerous metrics—these and others—are assessed in detail
in various surveys, e.g., [75]).
Hayes and Krippendorff [44], however, argue that a single metric, Krippendorff’s
own alpha, is suited to calculate and represent reliability for any variable and, im-
portantly, can be used as a basis for comparing reliabilities across variables and data
sets, due to a number of features that set it apart from other metrics. I chose to
use Krippendorff’s alpha metric, for those reasons, to estimate the reliability of the
observers’ data from Study 4.
Krippendorff [54] states that for evaluating the reliability of data that meets the
content analysis criteria described in the preceding chapter (Section 7.2.1), a “good”
reliability metric should in turn meet the following criteria:
1. It should evaluate agreement among at least two observers who have worked
95

independently from one another (and for more than two observers take the
necessary precautions to avoid being biased by the number of observers or their
identities).
2. It should account only for those feature values that appear in the observers’
coded data sets (and not the complete, allowable set of values for any feature for
which not all values were found to have been present during experimentation).
3. Its scale should be numerical, with both intuitive endpoints (to allow a range
within which the degree to which data can be relied upon can be ascertained)
and an intuitive interpretation of a data set’s reliability. By convention, 100%
reliability describes perfect agreement and 0% the absence of agreement;1
4. It should reflect the data’s level of measurement and use all information available
with respect to a variable’s type and its categories.
5. It should be as transparent as possible, such that its exact functionality is either
fully known or computable.
Krippendorff’s alpha has been touted the only metric that satisfies each of these
five criteria for a trustworthy metric of reliability [5, 54]. When it comes to actually
implementing a reliability evaluation and assessing whether a reliability score for
a particular variable is sufficient, a generally agreed-upon rule of thumb is that
reliability be above 80%, or somewhere above 67% for the purpose of research-based
recommendations [54]. Because Krippendorff’s alpha satisfies all of the criteria above,
reliability can be easily calculated and assessed with respect to these thresholds
without the need for any additional normalization or comparison steps.
Krippendorff’s alpha has one additional quality that renders it especially desirable
for evaluating the reliability of Study 4 observers’ data sets, namely that it seamlessly1The reliability scale extends beyond 0, with negative agreement scores indicating an inverse relationship between
coders’ values.
96

handles data sets with missing values. Because it was expected that there would be
a large number of missing values in the data sets returned by Study 4 observers, this
was an important requirement of any reliability metric selected.
8.2 Tackling Missing Data
Video data, specifically when recorded for the purpose of contextual feature cap-
ture, is highly variable. Microphones may or may not be switched on, cameras may
not be facing the appropriate direction or may have been (inadvertently or intention-
ally) turned off or covered up, mobile phones are not usually visible when they are
being viewed below the desk (e.g., for text messaging or screening phone calls), appli-
cation panes often occlude one another on the computer screen, the number of open
applications is not always accessible (e.g., Windows 7 is missing XP’s convenient
numbering scheme for indicating exactly how many instances of each application are
open), and there are any number of other reasons for inaccessible contextual feature
values.
So, for any given instance of notification feedback captured in the videos, some
non-negligible number of contextual features may very well be missing. Rather than
exclude these feedback instances from the final data set (which would be analogous
to losing, potentially, a great deal of information [42, p43], especially with such a
large feature set), I consulted the literature on dealing with data instances containing
missing values.
8.2.1 What Leads to Missing Data?
Missing data may result from discrepancies in capturing the contextual elements
of a participant’s environment that in turn render the coding process difficult for
observers. Specific to this experiment, missing data was particularly a result of a
97
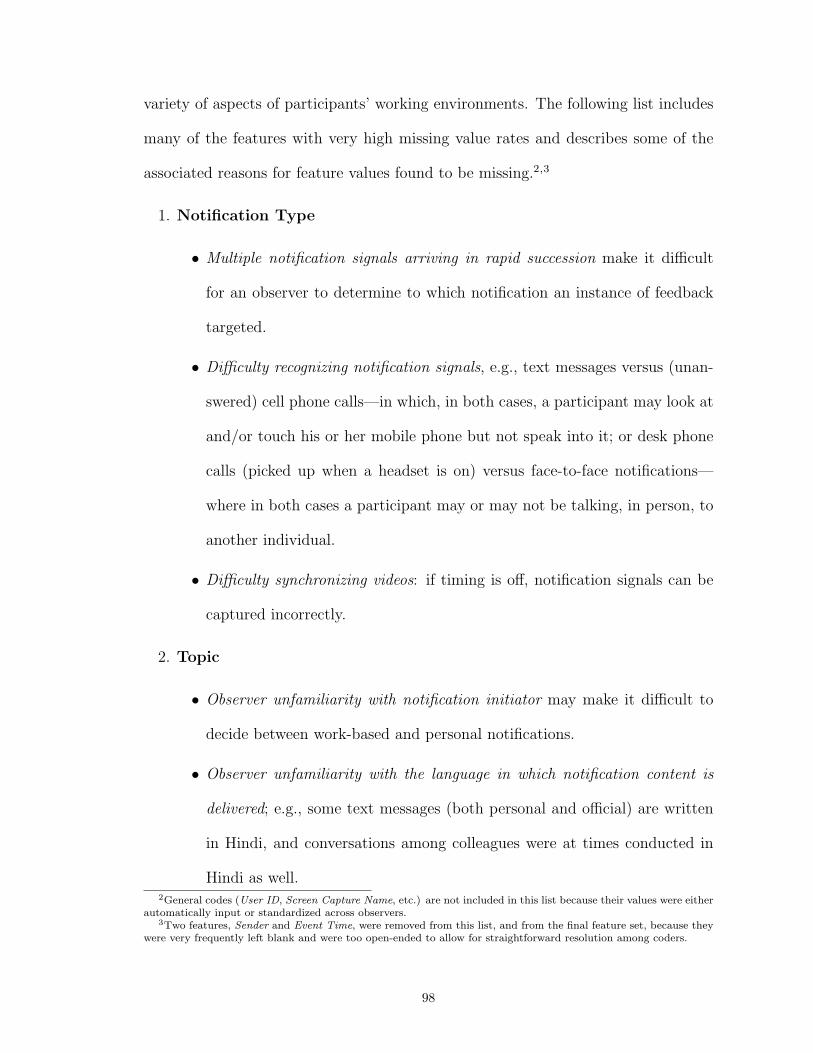
variety of aspects of participants’ working environments. The following list includes
many of the features with very high missing value rates and describes some of the
associated reasons for feature values found to be missing.2,3
1. Notification Type
• Multiple notification signals arriving in rapid succession make it difficult
for an observer to determine to which notification an instance of feedback
targeted.
• Difficulty recognizing notification signals, e.g., text messages versus (unan-
swered) cell phone calls—in which, in both cases, a participant may look at
and/or touch his or her mobile phone but not speak into it; or desk phone
calls (picked up when a headset is on) versus face-to-face notifications—
where in both cases a participant may or may not be talking, in person, to
another individual.
• Difficulty synchronizing videos: if timing is off, notification signals can be
captured incorrectly.
2. Topic
• Observer unfamiliarity with notification initiator may make it difficult to
decide between work-based and personal notifications.
• Observer unfamiliarity with the language in which notification content is
delivered; e.g., some text messages (both personal and official) are written
in Hindi, and conversations among colleagues were at times conducted in
Hindi as well.2General codes (User ID, Screen Capture Name, etc.) are not included in this list because their values were either
automatically input or standardized across observers.3Two features, Sender and Event Time, were removed from this list, and from the final feature set, because they
were very frequently left blank and were too open-ended to allow for straightforward resolution among coders.
98
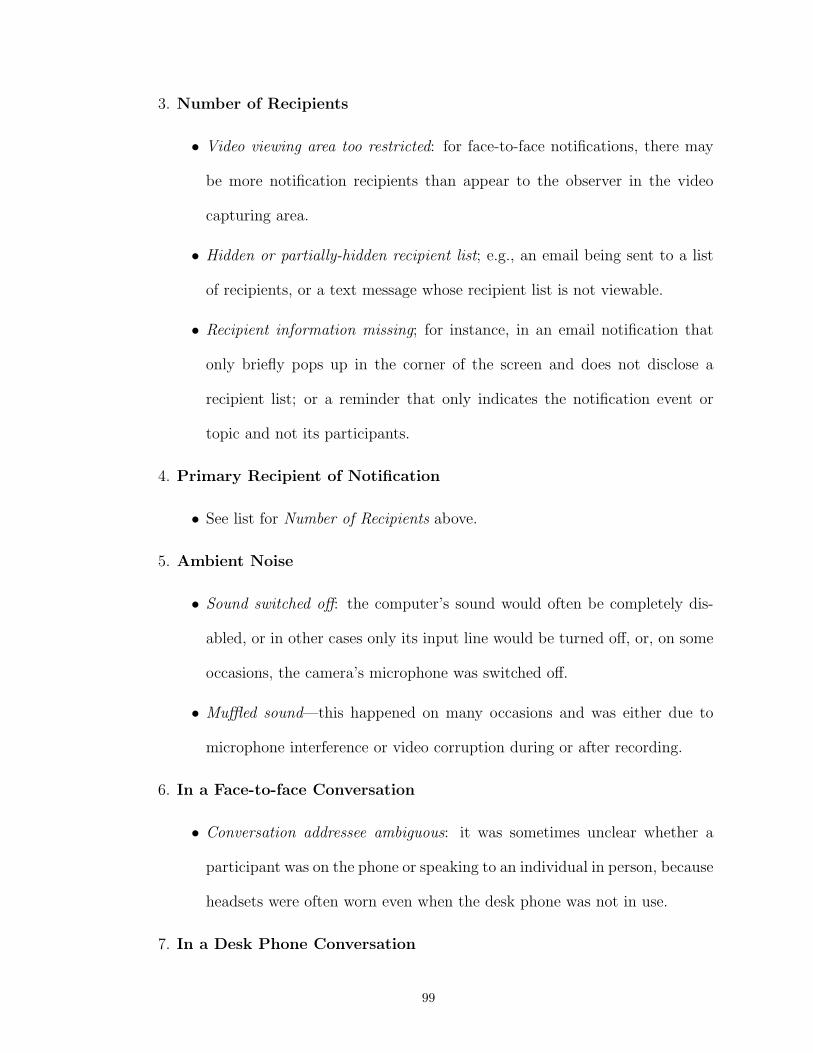
3. Number of Recipients
• Video viewing area too restricted: for face-to-face notifications, there may
be more notification recipients than appear to the observer in the video
capturing area.
• Hidden or partially-hidden recipient list; e.g., an email being sent to a list
of recipients, or a text message whose recipient list is not viewable.
• Recipient information missing; for instance, in an email notification that
only briefly pops up in the corner of the screen and does not disclose a
recipient list; or a reminder that only indicates the notification event or
topic and not its participants.
4. Primary Recipient of Notification
• See list for Number of Recipients above.
5. Ambient Noise
• Sound switched off: the computer’s sound would often be completely dis-
abled, or in other cases only its input line would be turned off, or, on some
occasions, the camera’s microphone was switched off.
• Muffled sound—this happened on many occasions and was either due to
microphone interference or video corruption during or after recording.
6. In a Face-to-face Conversation
• Conversation addressee ambiguous: it was sometimes unclear whether a
participant was on the phone or speaking to an individual in person, because
headsets were often worn even when the desk phone was not in use.
7. In a Desk Phone Conversation
99
• See response to Face-to-face Conversation above
8. Highly Important Notification
• This is a very subjective feature and depended on the observers’ understand-
ing of participants’ tasks, work requirements, etc.
9. Highly Urgent Notification
• This is also a very subjective feature and depended on the observers’ under-
standing of participants’ tasks, work requirements, etc.
10. High Attention Requirement of Current Task
• This is again a very subjective feature and depended on the observers’ un-
derstanding of participants’ office tasks.
In summary, missing values could arise for various reasons: from ambiguity re-
lated to the type of notification being delivered, to limitations resulting from the
experimental setup (e.g., the limited viewing space in an environment capture video,
or requirement for an audio line); and high-level features such as those regarding
notification importance and urgency are so subjective that they may lead observers
to question the integrity of their own assumptions as to the associated feature values.
The percentage of missing values per variable, for the complete set of coded feedback
instances, ranges from 14% (for a number of computer screen-based features) to 60%
for the Ambient Noise feature. Further details on missing values are presented in
Section 9.1.
8.2.2 Summary of Missing Data Resolution Techniques
Various techniques have been used to incorporate feature vectors containing miss-
ing values into a complete data set that can subsequently be used to develop pre-
100
dictive data models. Some techniques are more principled than others; [45] de-
scribe various techniques for dealing with missing data: unprincipled—or “conven-
tional” [3]—techniques, though widely used, are less statistically sound than their
counterparts and much more likely to add substantial bias to an incomplete data
set. These methods, e.g., list deletion and case deletion, are “seriously flawed” [3]:
they are prone to increasing biases and inaccuracies in the final, complete data set.
More principled methods like multiple imputation, maximum likelihood estimation,
and generalized estimating equations, while more complex (both conceptually and
mathematically) are supported by commonly used statistical programming packages
(e.g., R, Stata, SPSS) and are considered much more accurate and efficient than their
more conventional, but less principled, counterparts [45].
8.2.3 Multiple Imputation and Preference Data
I chose multiple imputation [78] as the solution to my missing data problem,
because it is a disciplined and robust technique for handling missing values as well
as observer disagreement. The term “imputation” is used to describe the process
of inferring missing values from relationships between a variable for which data is
missing and other variables within the data set, and incorporating those inferred
values into a final, complete data set that can in turn be used as a basis for developing
a model. When this process is conducted multiple times it is referred to as “multiple
imputation” and results in a set of distinct models. Multiple imputation is popular
in the statistics literature and is increasingly recognized elsewhere as a particularly
sound technique for handling missing data.
For data that has been coded by a pair of observers, not only must missing
values be inferred or imputed, but pairs of ratings must be resolved into a single
rating (to represent a single observation of a particular variable relative to a given
101

feedback instance) in the final data set. In other words, a final (i.e., complete) data
set contains only a single value per variable for a given feedback instance, yet at
the onset, two observers provide such values. In the easy case of resolving observer
ratings, both coded feature values are identical and do not require any intervention—
the value can be incorporated into the final data set as is. However, when observers
disagree, the disagreement must be mediated so that a single value can be carried
forward. Note that it is of particular importance to perform this disambiguation as
carefully as possible with the data in this study, due to the fact that only two coders
were responsible for each value. Because the Notification Type feature is especially
important with respect to the analysis to be conducted, it will be required that both
observers agree on its value for every instance included in the final data set. The
set of coded feedback instances for which both observers agree on the value of the
Notification Type variable will be referred to, from here forward, as the NTA (to
stand for Notification Type Agreement) set.
For the data acquired in Study 4, I use multiple imputation in two ways, as a
device to both infer missing values and also mediate observer disagreement. First, to
address missing observations, an imputation process can be run on a data set that
incorporates all observers’ labels: each variable is represented in k columns (where k
is the number of observers—two in Study 4), and every missing value (for any vari-
able) shares a single, recognizable and distinguishable label, e.g., “NA”. The multiple
imputation process is then instantiated, and missing values are inferred by serially
developing a model of an individual variable (dependent on all other variables) and
sampling values from the conditional distribution (with an appropriate amount of
noise, determined by the variability in the variable being modeled). This process is
repeated multiple times, to multiply replace each missing value. Subsequently, there
102

Step 1:/* Impute missing values in NTA data set m times (for 5 imputed data sets per coder) */bothCodersImputedSets ← m impute(NTA)
Step 2:/* Resolve mismatches */foreach bothCodersImputedSets[i]:
resolvedSets[i] ← ()foreach value of feature f:
if c1[f] == c2[f]:thisVarsVals ← c1[f]
else:thisVarsVals ← NA
resolvedSets[i].add(thisVarsVals)
/* Second imputation process: impute missing values in each of the 5 new data sets */foreach resolvedSets[i]:
foreach feature f:finalImpSets[i] ← impute(f)
Table 8.1: Pseudocode for the 2-step imputation process that was adopted for handling missingvalues and observer disagreement. In Step 1, five data sets with no missing values aregenerated for each coder through multiple imputation; in Step 2, disagreements betweencoders are resolved to create five complete data sets that do contain missing values, andthe values for this missing data are generated using single imputation to arrive at a finalfive complete data sets.
exist some m (ordinarily 5, and 3 at fewest [42]) complete data sets whose values
represent predictions based on correlations amongst variables in the data set fed as
input to the imputation process. Because multiple imputation samples with noise,
these data sets will not be identical.
To account for disagreements, both between observers and also between an original
value and an imputed value (i.e., whenever a missing value, now imputed, does
not match the other observer’s coded value), a second imputation step (as part of
the whole, overall imputation process) can then be initiated. This step is more
straightforward; first, a new data set is created for each of the m data sets created
by the first imputation step, but instead of accounting for both observers’ values
individually, each feature is assigned a single column. Values are carried over from
the original m data sets in the following fashion: if one observer’s value is identical to
103

the other observer’s value for a given variable, that value is transferred into the new
data set. If, instead, these values do not agree (either because one or both values
was missing and then imputed such that a disagreement arose, or because they were
coded differently in the first place), then a missing value, or NA, is added to the
appropriate cell in the associated data set. Then, a second imputation process is
initiated for each of the five new data sets, such that they become complete and
can thus be analyzed effectively. Pseudocode for the two-step imputation process I
adopted is found in Figure 8.1.4
It may also be necessary, in some cases (specifically for the numeric “count” vari-
ables in the Study 4 data set), to impute a variable’s missing values by sampling from
the distribution of non-missing values for that single variable (i.e., unconditional of
the values of any other variables.) [42, p45]. In all uses of imputation, the amount
of missing data, the potential reasons for data to be missing, and relationships be-
tween variables, all play a role in the decision about whether and which imputation
techniques will be useful and/or effective [42, 58, 78].
8.3 Preference Modeling
Ordinarily, data analysis is performed on a complete data set in which every
instance includes a value for each variable. In the case of data sets wrought with
missing values, the analysis phase is closely tied to the imputation process. Recall
that multiple imputation, the technique I chose for handing missing data, will result
in multiple complete data sets rather than just one. So, instead of the imputation
process passing off a complete data set to the analysis phase, analysis is instead
conducted on each of the individual data sets resulting from imputation, and then
4Raghunathan [76] also provides a nice, concise discussion of coupling multiple imputation with logistic regression;and he compares to two additional techniques for handling missing data.
104
model parameters are averaged over each data set [42, 58] to produce a single, final
model.
There are two primary types of data analysis that may be conducted on data
sets like the preference data collected in Study 4. The first is statistical inference,
in which the experimenter attempts to learn which features are most influential on
observed outcomes. This technique is useful, in the context of this third study,
for gauging the effect of any single contextual feature on the general desirability
of a notification. Prediction, on the other hand, is a technique used to generate
a complete, representative model of an entire data set and predict future expected
preferences. With respect to Study 4, this type of technique will aid in understanding
how a system might choose the most desirable notification delivery format in any
given contextual setting.
8.3.1 Preference Modeling
One goal of this dissertation is to explore the question of whether and which
contextual features affect an individual’s notification delivery preferences. The pro-
cess of learning a model based on the contextual features observed in video-based
context-capturing tools allows for initial answers to this question: depending on how
they are included in a model, the effects of individual features on people’s binary
notification preferences can be calculated and compared among contextual variables.
This is the inference process: from a learned set of parameters, the relationship be-
tween contextual features and people’s preference-based response to notifications can
be inferred.
I elected to use logistic regression as the modeling technique for the Study 4
data that I collected. Despite the binary nature of notification feedback ratings,
data classification techniques are not the most efficient way to model Study 4 data.
105

The logistic regression technique differs from binary classification in that instead
of modeling a binary (positive or negative) outcome, it models a measure of the
probability of a positive or negative feedback rating, conditioned on the associated
contextual feature values. This allows for a degree of confidence to be folded into
each prediction, and assessing the predictive ability of alternate data models is easy.
In addition, logistic regression allows for estimation of the effect of any single feature
on the odds of a positive (or negative) feedback rating, which can be calculated by
exponentiating each coefficient with respect to e (to remove the log in the log odds
effect). In other words, if the β coefficient represents the effect of a single variable
on the log odds of a positive rating, then eβ represents the effect on the odds—a
much more interpretable way to understand the manner in which contextual features
influence people’s preferences.
In the modeling technique chosen to be used for Study 4 data, namely logistic
regression (see Equation 8.1), a set of model parameters, or βs, represent the effect
that changes in the input values of contextual variables should have on participants’
preferences.
(8.1) log
[P (Y = 1)
P (Y = 0)
]= β0 + β1x1 + β2x2 + ...+ βNxN + ε
By isolating a single βi the direct effect of a one-unit change in the value of a given
variable on the log odds of positive feedback can be calculated, holding all other
variables constant. For groups of variables for which there is an expected interaction,
determining the direct effects on expected user feedback is more complicated; the
upcoming discussion of results (Chapter IX) will describe this process in more detail.
An important objective of the Study 4 in-office experiment is to assess the possi-
bility that people’s preferences can be learned: that a model of their preferences can
be used to choose the best, or most desirable, mode of delivery of future notifications.
106
With the limited amount of data that was collected, however, and because there is
no access to additional (as in, future) user preference data, we cannot assess the
“accuracy” of a model but instead it must suffice to measure its predictive ability.
Within the confines of Study 4, both with respect to the manner in which prefer-
ence data was required to be collected and the chosen technique by which preferences
are modeled, prediction, and/or the associated measurement of predictive ability, is a
two-step process. The first step is to generate a model, via logistic regression, to rep-
resent the relationship between certain key contextual features and the preferences
people reported through experimentation.
However, the ultimate goal is not only to have an idea about what someone
will think of a certain notification delivered in a certain context but rather how
to determine that notification type that will be most positively rated, or regarded
as most desirable, across contextual scenarios. Fortunately, this second step of the
prediction process, which facilitates the type of prediction required (i.e., were a
system trying to predict which notification type to issue in a certain context), merely
requires comparing the log odds of success, or a positive rating, for each of the
different types of notifications, in a given contextualized scenario.
In general, the predictive ability of a logistic regression model can be evaluated in
a number of different ways. The Akaike Information Criterion (AIC) is based on log-
likelihood analysis [2]; though the general R2 metric is not appropriate for evaluating
a logistic model, a number of variations have been proposed, such as the adjusted R2
(R2a) [29, p127], and generalized R2 (R2
N) [42, p247]. The probability of concordance
index, c, is another way to measure predictive ability, and it is identical to the A′
calculation of the area under a receiver operating characteristic (ROC) curve [41,
39]. In his dissertation on a similar topic, namely the automatic assessment of a
107
computer user’s interruptibility, Fogarty uses this A′ value to sequentially compare
potential models [32]. I will adopt a similar practice and use a surrogate for A′ called
Somers’ Dxy rank correlation coefficient [82], which measures the difference between
the probability of concordance and discordance and is merely a scaled value of c (and
thus A′) such that instead of falling within the interval [0.5,1], it extends from 0 to
1. (Probability of concordance refers to the proportion of positive-negative pairings
of feedback instances for which the positively-rated feedback instance is issued a
higher probability by the model than the other instance; discordance, similarly, is
the proportion of positive-negative feedback pairings for which the model predicts
a higher value for the negative instance as opposed to the positive instance.) A
Dxy value of 0 indicates completely random predictions, whereas Dxy = 1 indicates
perfect discrimination among values.
When searching for the model with greatest predictive ability, comparing Dxy
values (across, say, training and test sets) is one principled way to determine which
model would be most beneficial toward modeling notification preferences and pre-
dicting the most desirable notification delivery types.
8.4 Accounting for Individuality
The modeling technique described above will devise a single user model to predict
people’s notification preferences as accurately as possible. However, because results
from Chapters III, IV, and V, in addition to the upcoming findings from Study
4, provide evidence that people’s preferences are far from homogeneous (especially
when such a wide variety of notification formats are at the disposal of an interaction
monitor), individual preference prediction models may prove significantly more useful
than a single general user model.
108

One way to begin to explore this idea is by way of a mixed modeling technique,
in which the logistic regression model incorporates an additional, “random,” effect,
which accounts for the possibility that individual preference patterns are affecting
overall feedback ratings. Adding this additional effect entails incorporating one new
term, representing the variable associated with participants’ identification numbers,
into the model. A significant difference between the predictive ability of a model that
incorporates this new feature, and the model calculated to have highest predictive
ability without considering individualized preferences, will indicate a likelihood that
individual preferences require acknowledgment and that a single, overall model is
not sufficient to accurately predict people’s preferences. In other words, there is
strong evidence that the environment- and content-based contextual data acquired
in Study 4 cannot fully capture the underlying reasons behind participants’ reported
preferences; and though the specific individual differences that may be affecting
people’s preferences may not be ascertainable, with this technique they can be shown
to exist.
109
CHAPTER IX
Results
This section will present the reliability scores obtained for each variable in the
feature set for Study 4; it will describe the choice of features to be included in the
modeling process (partially determined by these reliability scores); and it will high-
light results pertaining to modeling user preference patterns in the context of Study
4 and as compared to results from prior studies described in Chapters III, IV, and
V. Before jumping into reliability calculations and further data analysis, however,
I will describe the state of the data collected by the study observers, specifically
highlighting the amount of missing values for each feature.
9.1 Data Summarization
Figure 9.1 depicts the amount of missing values attributed to each variable in the
complete feature set. Most readily notable is that the feature representing Ambient
Noise has an exceptionally high percentage of missing values. This is likely because
sound was often missing in one or both videos (primarily because microphones on
participants’ computers were turned down), or it was difficult to discern whether
any peripheral noise heard qualified as ambient noise, which was defined to be any
noise at the level of a speaking voice. Due to the fact that sound was so frequently
missing, observers may have ignored this variable more frequently than was actually
110
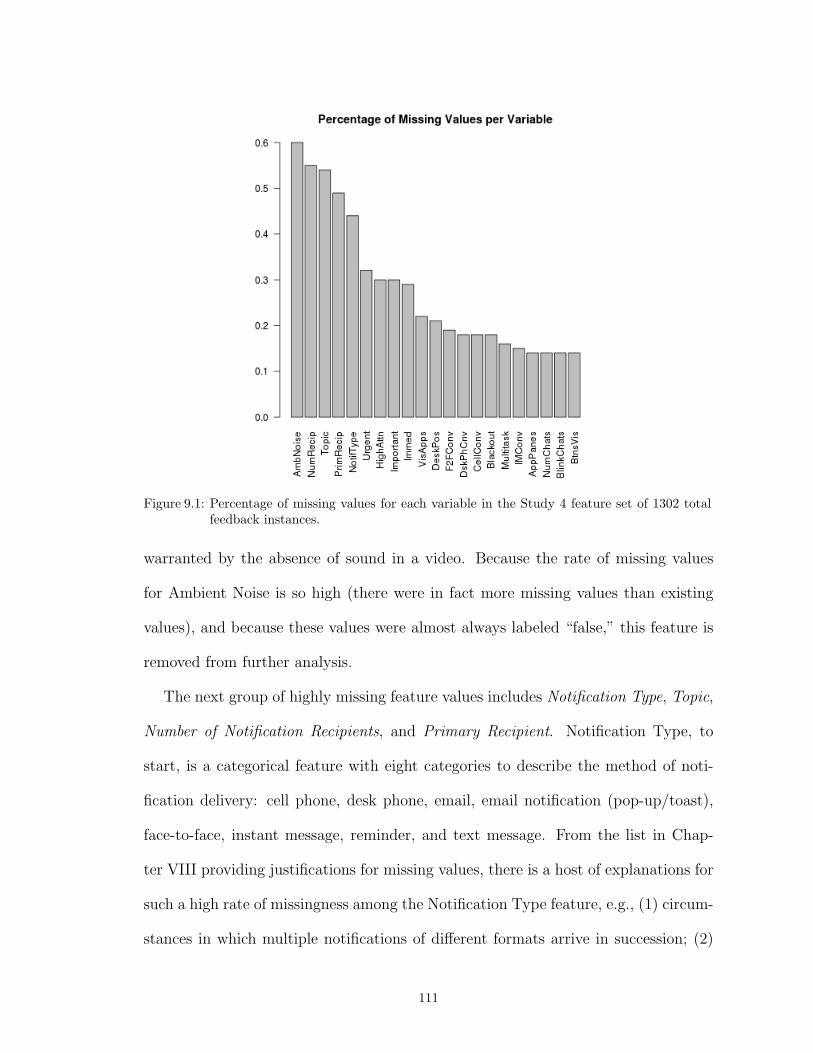
Figure 9.1: Percentage of missing values for each variable in the Study 4 feature set of 1302 totalfeedback instances.
warranted by the absence of sound in a video. Because the rate of missing values
for Ambient Noise is so high (there were in fact more missing values than existing
values), and because these values were almost always labeled “false,” this feature is
removed from further analysis.
The next group of highly missing feature values includes Notification Type, Topic,
Number of Notification Recipients, and Primary Recipient. Notification Type, to
start, is a categorical feature with eight categories to describe the method of noti-
fication delivery: cell phone, desk phone, email, email notification (pop-up/toast),
face-to-face, instant message, reminder, and text message. From the list in Chap-
ter VIII providing justifications for missing values, there is a host of explanations for
such a high rate of missingness among the Notification Type feature, e.g., (1) circum-
stances in which multiple notifications of different formats arrive in succession; (2)
111
difficulty (on behalf of observers) in distinguishing between notification formats such
as text messages versus screened mobile phone calls; and (3) video synchronization
issues that may be cause for uncertainty; all of which in turn may lead to missing
values.
The Topic feature is also categorical but instead with three possible values. This
is a more subjective feature than most of the others, primarily because observers
were not familiar with individual initiators of incoming notifications. Though I tried
to mitigate unfamiliarity by assigning all feedback instances from each participant
to one pair of observers (rather than split the instances up among observer pairs),
observers were not asked to return to review instances they had already coded. Thus,
regardless of whether an observer gained familiarity with notification initiators and
in turn topics over time, this does not make up for all of the prior instances that
could not be coded due to unfamiliarity.
The Number of Recipients, and also whether or not the participant was the Pri-
mary Recipient of a given notification were also difficult to determine, particularly
for certain types of notifications. For example, face-to-face notifications include dis-
cussions among engineers in adjacent office cubicles, but the camera is focused only
on the participant; it can therefore be unclear whether the participant him or herself
is being addressed directly or whether a group of people are being addressed all at
once.1 Observers were requested not to make blind guesses when this type of clear
uncertainty arose, which is a likely reason for the large number of missing values.
The high-level features (Important, Urgent, and High Attention) also have a high
missing rate compared with many of the other contextual features; this must be
assumed to be due primarily to their highly subjective nature and observers’ in-
1Again, for further discussion on the reasons for missing feature values, please consult 8.2.1.
112
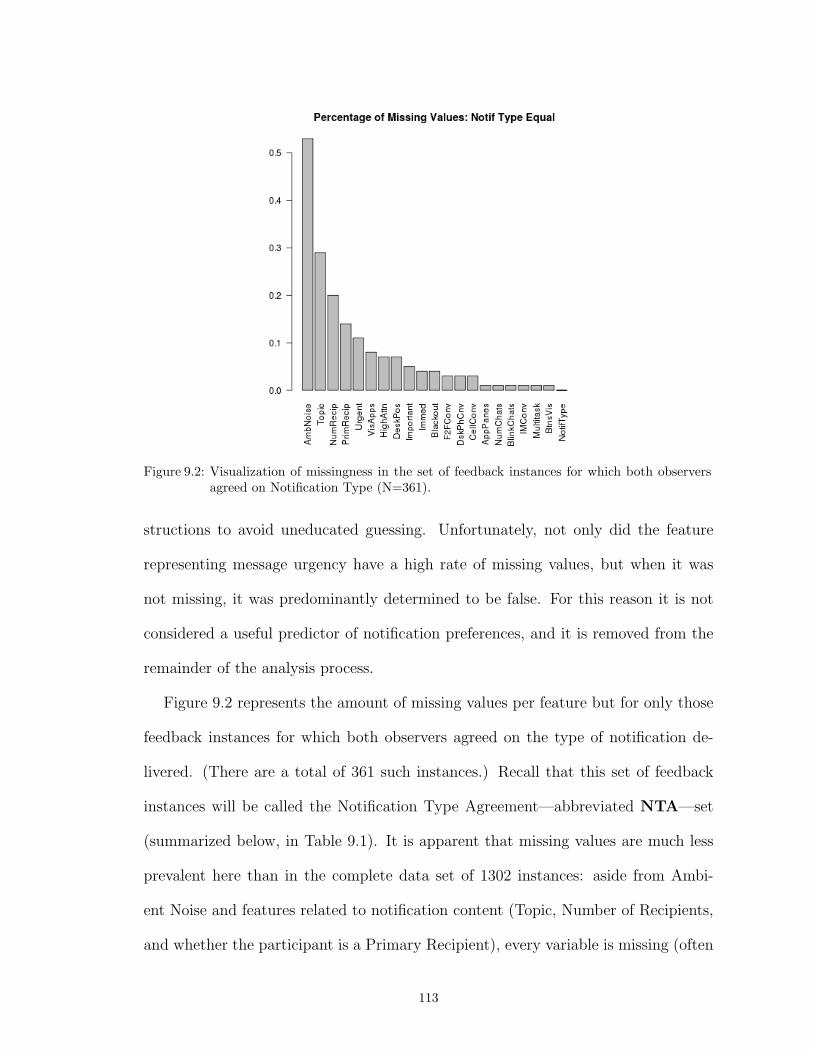
Figure 9.2: Visualization of missingness in the set of feedback instances for which both observersagreed on Notification Type (N=361).
structions to avoid uneducated guessing. Unfortunately, not only did the feature
representing message urgency have a high rate of missing values, but when it was
not missing, it was predominantly determined to be false. For this reason it is not
considered a useful predictor of notification preferences, and it is removed from the
remainder of the analysis process.
Figure 9.2 represents the amount of missing values per feature but for only those
feedback instances for which both observers agreed on the type of notification de-
livered. (There are a total of 361 such instances.) Recall that this set of feedback
instances will be called the Notification Type Agreement—abbreviated NTA—set
(summarized below, in Table 9.1). It is apparent that missing values are much less
prevalent here than in the complete data set of 1302 instances: aside from Ambi-
ent Noise and features related to notification content (Topic, Number of Recipients,
and whether the participant is a Primary Recipient), every variable is missing (often
113
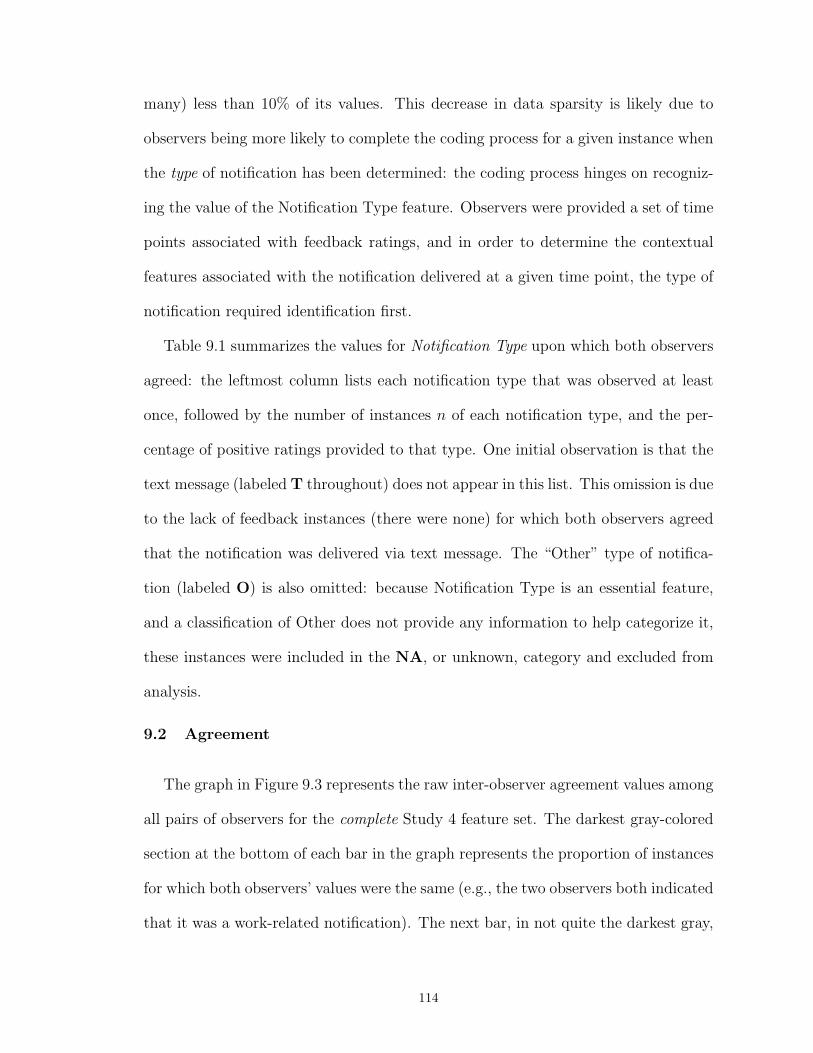
many) less than 10% of its values. This decrease in data sparsity is likely due to
observers being more likely to complete the coding process for a given instance when
the type of notification has been determined: the coding process hinges on recogniz-
ing the value of the Notification Type feature. Observers were provided a set of time
points associated with feedback ratings, and in order to determine the contextual
features associated with the notification delivered at a given time point, the type of
notification required identification first.
Table 9.1 summarizes the values for Notification Type upon which both observers
agreed: the leftmost column lists each notification type that was observed at least
once, followed by the number of instances n of each notification type, and the per-
centage of positive ratings provided to that type. One initial observation is that the
text message (labeled T throughout) does not appear in this list. This omission is due
to the lack of feedback instances (there were none) for which both observers agreed
that the notification was delivered via text message. The “Other” type of notifica-
tion (labeled O) is also omitted: because Notification Type is an essential feature,
and a classification of Other does not provide any information to help categorize it,
these instances were included in the NA, or unknown, category and excluded from
analysis.
9.2 Agreement
The graph in Figure 9.3 represents the raw inter-observer agreement values among
all pairs of observers for the complete Study 4 feature set. The darkest gray-colored
section at the bottom of each bar in the graph represents the proportion of instances
for which both observers’ values were the same (e.g., the two observers both indicated
that it was a work-related notification). The next bar, in not quite the darkest gray,
114

Figure 9.3: Raw inter-observer agreement across variables in the Study 4 feature set: the darkestsection at the bottom of each bar represents the number of instances on which ratersagree for a given variable; the second bar from the bottom in the next darkest grayrepresents two observers providing conflicting values for a variable; the third bar fromthe bottom represents the instances for which only one observer provided a value; andthe top segment of each bar in the lightest shade of gray represents instances for whichneither observer provided a value for that variable.
115
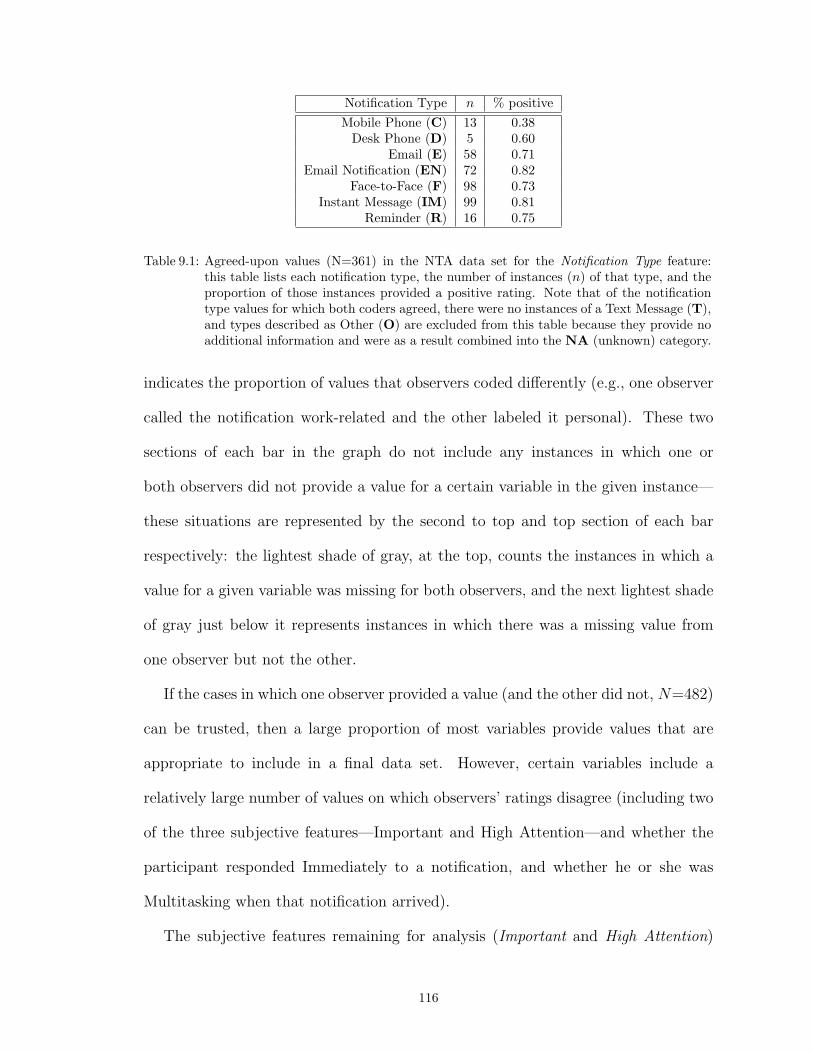
Notification Type n % positiveMobile Phone (C) 13 0.38
Desk Phone (D) 5 0.60Email (E) 58 0.71
Email Notification (EN) 72 0.82Face-to-Face (F) 98 0.73
Instant Message (IM) 99 0.81Reminder (R) 16 0.75
Table 9.1: Agreed-upon values (N=361) in the NTA data set for the Notification Type feature:this table lists each notification type, the number of instances (n) of that type, and theproportion of those instances provided a positive rating. Note that of the notificationtype values for which both coders agreed, there were no instances of a Text Message (T),and types described as Other (O) are excluded from this table because they provide noadditional information and were as a result combined into the NA (unknown) category.
indicates the proportion of values that observers coded differently (e.g., one observer
called the notification work-related and the other labeled it personal). These two
sections of each bar in the graph do not include any instances in which one or
both observers did not provide a value for a certain variable in the given instance—
these situations are represented by the second to top and top section of each bar
respectively: the lightest shade of gray, at the top, counts the instances in which a
value for a given variable was missing for both observers, and the next lightest shade
of gray just below it represents instances in which there was a missing value from
one observer but not the other.
If the cases in which one observer provided a value (and the other did not, N=482)
can be trusted, then a large proportion of most variables provide values that are
appropriate to include in a final data set. However, certain variables include a
relatively large number of values on which observers’ ratings disagree (including two
of the three subjective features—Important and High Attention—and whether the
participant responded Immediately to a notification, and whether he or she was
Multitasking when that notification arrived).
The subjective features remaining for analysis (Important and High Attention)
116
C D E EN F IM RC 13D 1 5E 4 5 58
EN 1 0 40 72F 0 1 19 6 98
IM 0 3 13 13 12 99R 0 1 1 4 2 1 16
Table 9.2: Confusion matrix for notification formats as coded by observers. Email and email notifi-cations (E/EN) were most frequently confused (k=40), followed by face-to-face notifica-tions and email (F/E, k=19); and confusion was also high between instant messages andemails (IM/E, k=13), email notifications (IM/E, k=13), and face-to-face notifications(IM/F, k=12).
were expected to elicit fairly high disagreement, again due to their nature. And it is
possible that the Immediate and Multitasking features reflected such high disagree-
ment (relative to other features) because they included a discrete timing element:
responding to a notification “immediately” meant clicking on a feedback button
within two seconds of the arrival of that notification; and “multitasking” referred
to switching application focus within the last minute before a notification arrived.
Though a machine would be expected to have perfect accuracy on features like these,
it is possible that observers either miscalculated or were too loose in their judgement
of the two seconds following a notification for categorizing an immediate response;
or they quite possibly did not watch the full minute of video prior to a notification,
required of the Multitasking feature.
Notification Type is also included in the set of variables for which there is relatively
high disagreement. Table 9.2 displays a confusion matrix characterizing notification
type disagreement. It is clear that the distinction between “Email” and “Email
Notification” was difficult for observers to assess. It may seem surprising for Face-
to-face notifications to have been confused with Emails (N=19) or Instant Messages
(N = 12), but when different types of notifications arrived in succession, and without
117

Figure 9.4: Raw inter-observer agreement across variables in the Study 4 NTA feature set: Muchhigher proportions of between-coder agreement can be observed, as well as a much lowerpercentage of instances for which neither observer provided a value.
a requirement that participants provide immediate notification feedback, there was
often ambiguity in the type of notification being rated.
Finally, three of the four numeric features (Visible Applications, # of Application
Panes, and # of Chat Windows) have a very high proportion of disagreements. Be-
cause these agreement summaries were calculated using raw Study 4 observer data,
agreement only encapsulates those instances for which observers provided exactly
the same numerical values. Krippendorff’s alpha metric for calculating reliability
between observers will account for matching trends in observers’ ratings (and these
three numerical variables in particular will be shown to be of particularly high reli-
ability, despite raw agreement numbers being low).
118
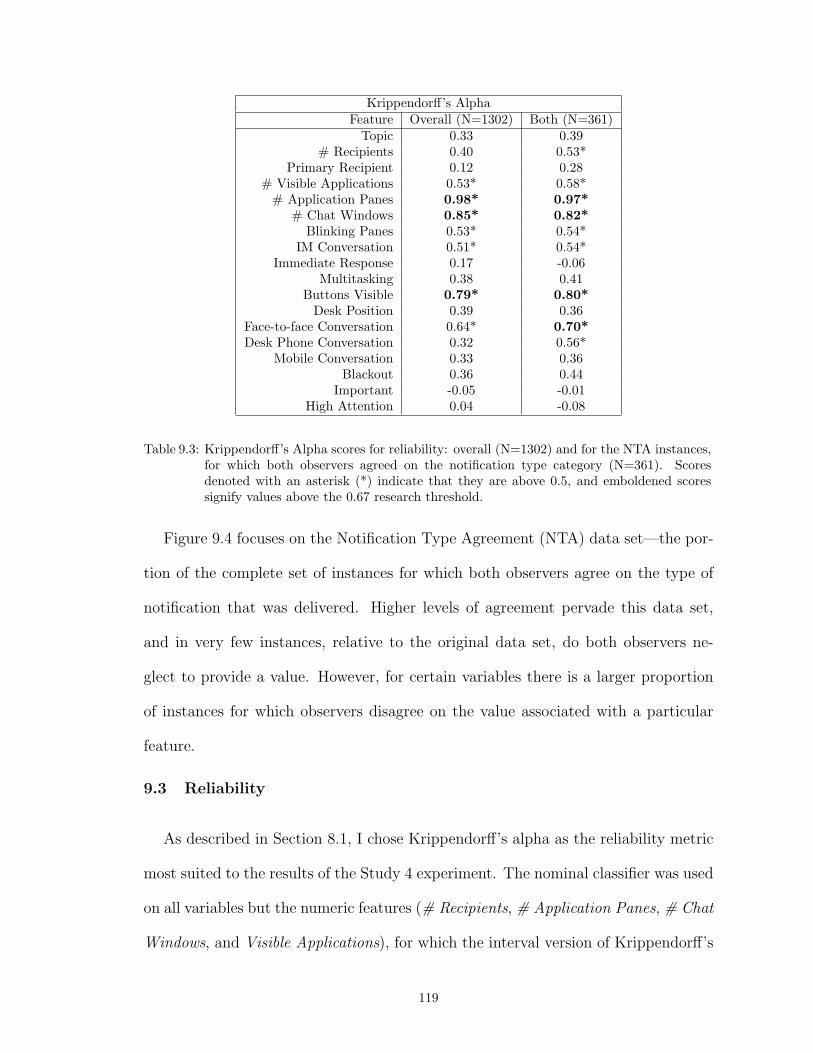
Krippendorff’s AlphaFeature Overall (N=1302) Both (N=361)
Topic 0.33 0.39# Recipients 0.40 0.53*
Primary Recipient 0.12 0.28# Visible Applications 0.53* 0.58*
# Application Panes 0.98* 0.97*# Chat Windows 0.85* 0.82*
Blinking Panes 0.53* 0.54*IM Conversation 0.51* 0.54*
Immediate Response 0.17 -0.06Multitasking 0.38 0.41
Buttons Visible 0.79* 0.80*Desk Position 0.39 0.36
Face-to-face Conversation 0.64* 0.70*Desk Phone Conversation 0.32 0.56*
Mobile Conversation 0.33 0.36Blackout 0.36 0.44
Important -0.05 -0.01High Attention 0.04 -0.08
Table 9.3: Krippendorff’s Alpha scores for reliability: overall (N=1302) and for the NTA instances,for which both observers agreed on the notification type category (N=361). Scoresdenoted with an asterisk (*) indicate that they are above 0.5, and emboldened scoressignify values above the 0.67 research threshold.
Figure 9.4 focuses on the Notification Type Agreement (NTA) data set—the por-
tion of the complete set of instances for which both observers agree on the type of
notification that was delivered. Higher levels of agreement pervade this data set,
and in very few instances, relative to the original data set, do both observers ne-
glect to provide a value. However, for certain variables there is a larger proportion
of instances for which observers disagree on the value associated with a particular
feature.
9.3 Reliability
As described in Section 8.1, I chose Krippendorff’s alpha as the reliability metric
most suited to the results of the Study 4 experiment. The nominal classifier was used
on all variables but the numeric features (# Recipients, # Application Panes, # Chat
Windows, and Visible Applications), for which the interval version of Krippendorff’s
119
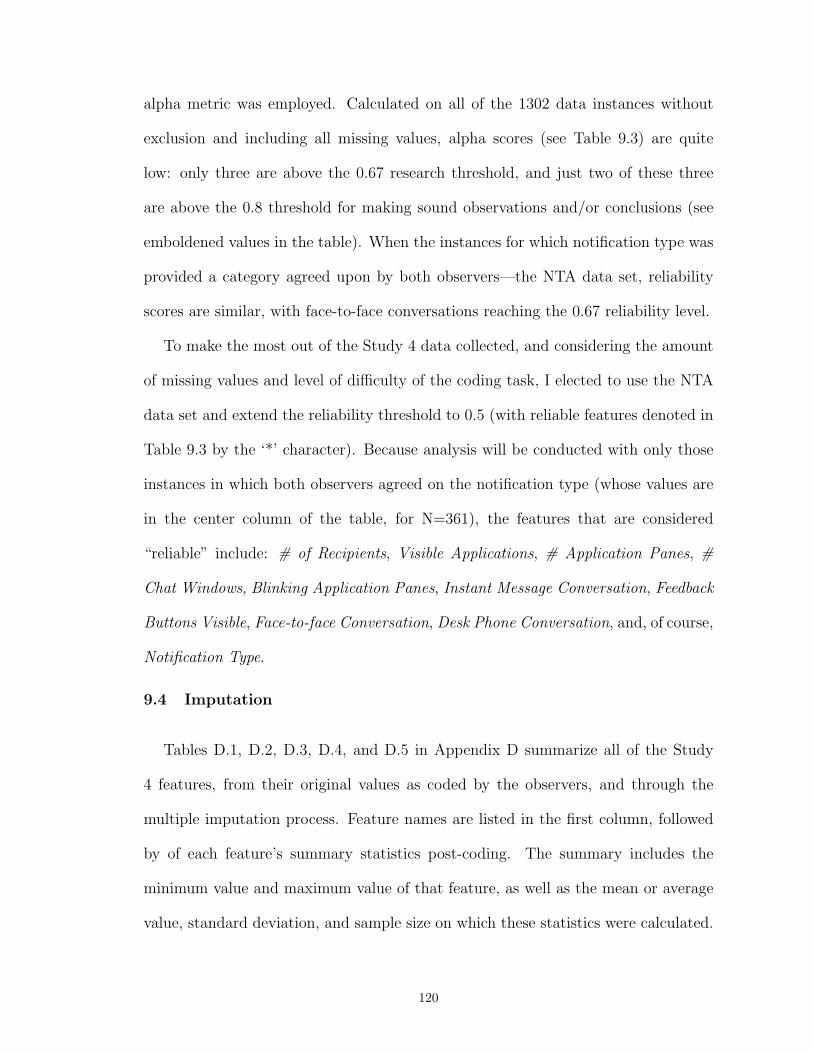
alpha metric was employed. Calculated on all of the 1302 data instances without
exclusion and including all missing values, alpha scores (see Table 9.3) are quite
low: only three are above the 0.67 research threshold, and just two of these three
are above the 0.8 threshold for making sound observations and/or conclusions (see
emboldened values in the table). When the instances for which notification type was
provided a category agreed upon by both observers—the NTA data set, reliability
scores are similar, with face-to-face conversations reaching the 0.67 reliability level.
To make the most out of the Study 4 data collected, and considering the amount
of missing values and level of difficulty of the coding task, I elected to use the NTA
data set and extend the reliability threshold to 0.5 (with reliable features denoted in
Table 9.3 by the ‘*’ character). Because analysis will be conducted with only those
instances in which both observers agreed on the notification type (whose values are
in the center column of the table, for N=361), the features that are considered
“reliable” include: # of Recipients, Visible Applications, # Application Panes, #
Chat Windows, Blinking Application Panes, Instant Message Conversation, Feedback
Buttons Visible, Face-to-face Conversation, Desk Phone Conversation, and, of course,
Notification Type.
9.4 Imputation
Tables D.1, D.2, D.3, D.4, and D.5 in Appendix D summarize all of the Study
4 features, from their original values as coded by the observers, and through the
multiple imputation process. Feature names are listed in the first column, followed
by of each feature’s summary statistics post-coding. The summary includes the
minimum value and maximum value of that feature, as well as the mean or average
value, standard deviation, and sample size on which these statistics were calculated.
120
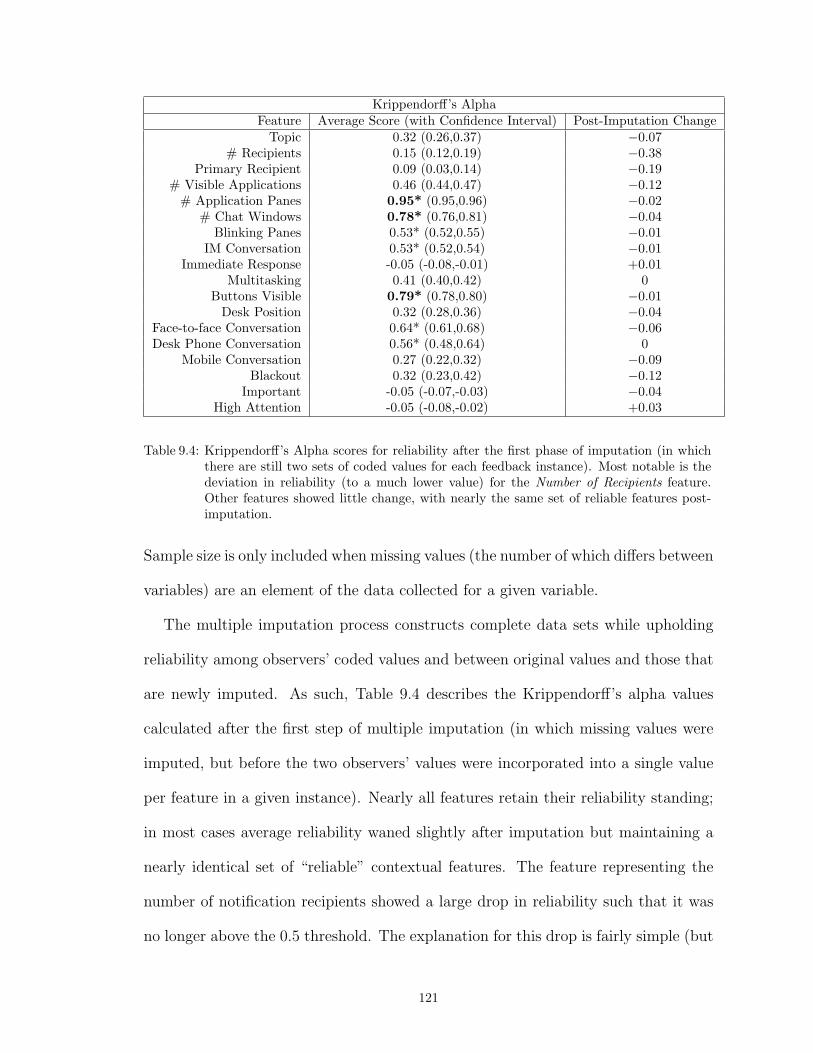
Krippendorff’s AlphaFeature Average Score (with Confidence Interval) Post-Imputation Change
Topic 0.32 (0.26,0.37) −0.07# Recipients 0.15 (0.12,0.19) −0.38
Primary Recipient 0.09 (0.03,0.14) −0.19# Visible Applications 0.46 (0.44,0.47) −0.12
# Application Panes 0.95* (0.95,0.96) −0.02# Chat Windows 0.78* (0.76,0.81) −0.04
Blinking Panes 0.53* (0.52,0.55) −0.01IM Conversation 0.53* (0.52,0.54) −0.01
Immediate Response -0.05 (-0.08,-0.01) +0.01Multitasking 0.41 (0.40,0.42) 0
Buttons Visible 0.79* (0.78,0.80) −0.01Desk Position 0.32 (0.28,0.36) −0.04
Face-to-face Conversation 0.64* (0.61,0.68) −0.06Desk Phone Conversation 0.56* (0.48,0.64) 0
Mobile Conversation 0.27 (0.22,0.32) −0.09Blackout 0.32 (0.23,0.42) −0.12
Important -0.05 (-0.07,-0.03) −0.04High Attention -0.05 (-0.08,-0.02) +0.03
Table 9.4: Krippendorff’s Alpha scores for reliability after the first phase of imputation (in whichthere are still two sets of coded values for each feedback instance). Most notable is thedeviation in reliability (to a much lower value) for the Number of Recipients feature.Other features showed little change, with nearly the same set of reliable features post-imputation.
Sample size is only included when missing values (the number of which differs between
variables) are an element of the data collected for a given variable.
The multiple imputation process constructs complete data sets while upholding
reliability among observers’ coded values and between original values and those that
are newly imputed. As such, Table 9.4 describes the Krippendorff’s alpha values
calculated after the first step of multiple imputation (in which missing values were
imputed, but before the two observers’ values were incorporated into a single value
per feature in a given instance). Nearly all features retain their reliability standing;
in most cases average reliability waned slightly after imputation but maintaining a
nearly identical set of “reliable” contextual features. The feature representing the
number of notification recipients showed a large drop in reliability such that it was
no longer above the 0.5 threshold. The explanation for this drop is fairly simple (but
121
has implications for future such studies that employ human observers and multiple
imputation—see Chapter X): prior to imputation, reliability was calculated for only
those values that were coded by observers, many of which were determined to be 1
(as in, a majority of notifications were found to have one single recipient). In one set
of coder values, of the instances in which the number of recipients was determined
to be greater than one, it was more than half the time two (and otherwise 3, 4, 5, or
15); whereas in the other set, in the instances of more than one notification recipient,
there was more than half the time 10 or greater recipients as opposed to any number
of recipients less than ten (2, 3, 4, 5, or 8). Because for numeric variables I adopted
an imputation process that merely samples from the set of existing values, the post-
imputation number-of-recipients values were likely to be in much greater disharmony
than they were prior to imputation being performed. Fortunately, this pattern of
coded values, which is due in combination to observers’ differing approximations and
the manner in which coding sets were generated, did not affect any other features in
the imputed data sets.
It can be concluded from the reliability assessment presented in this section that
a combination of observer inexperience and well- and aptly-recognized ambiguities
in human data collection likely played a role in such low measures of reliability.
However, all of the contextual features examined in the coding process were deemed
worthy of exploration, so moving forward with any subset of those features should
provide for an informative analysis.
9.5 Preference Modeling
Interestingly, with regard to the initial hypothesis H4.1 for Study 4, the data in
Table 9.1, presented earlier in this chapter, provide only slight preliminary evidence
122
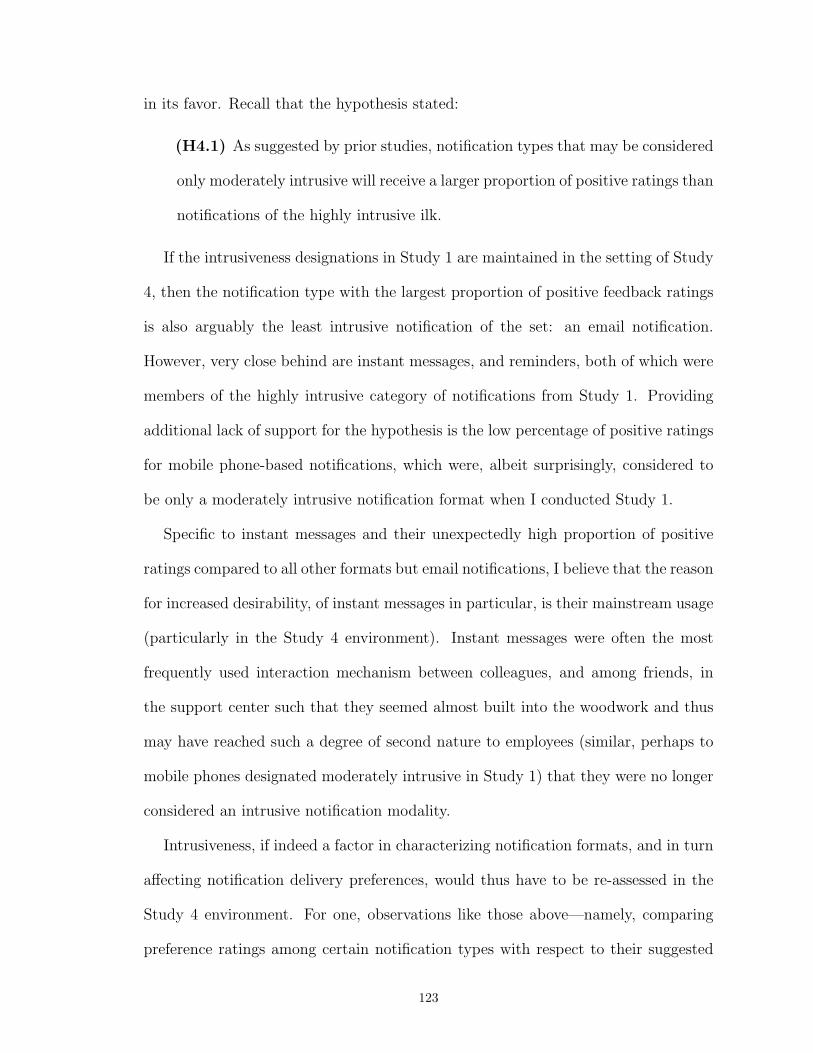
in its favor. Recall that the hypothesis stated:
(H4.1) As suggested by prior studies, notification types that may be considered
only moderately intrusive will receive a larger proportion of positive ratings than
notifications of the highly intrusive ilk.
If the intrusiveness designations in Study 1 are maintained in the setting of Study
4, then the notification type with the largest proportion of positive feedback ratings
is also arguably the least intrusive notification of the set: an email notification.
However, very close behind are instant messages, and reminders, both of which were
members of the highly intrusive category of notifications from Study 1. Providing
additional lack of support for the hypothesis is the low percentage of positive ratings
for mobile phone-based notifications, which were, albeit surprisingly, considered to
be only a moderately intrusive notification format when I conducted Study 1.
Specific to instant messages and their unexpectedly high proportion of positive
ratings compared to all other formats but email notifications, I believe that the reason
for increased desirability, of instant messages in particular, is their mainstream usage
(particularly in the Study 4 environment). Instant messages were often the most
frequently used interaction mechanism between colleagues, and among friends, in
the support center such that they seemed almost built into the woodwork and thus
may have reached such a degree of second nature to employees (similar, perhaps to
mobile phones designated moderately intrusive in Study 1) that they were no longer
considered an intrusive notification modality.
Intrusiveness, if indeed a factor in characterizing notification formats, and in turn
affecting notification delivery preferences, would thus have to be re-assessed in the
Study 4 environment. For one, observations like those above—namely, comparing
preference ratings among certain notification types with respect to their suggested
123
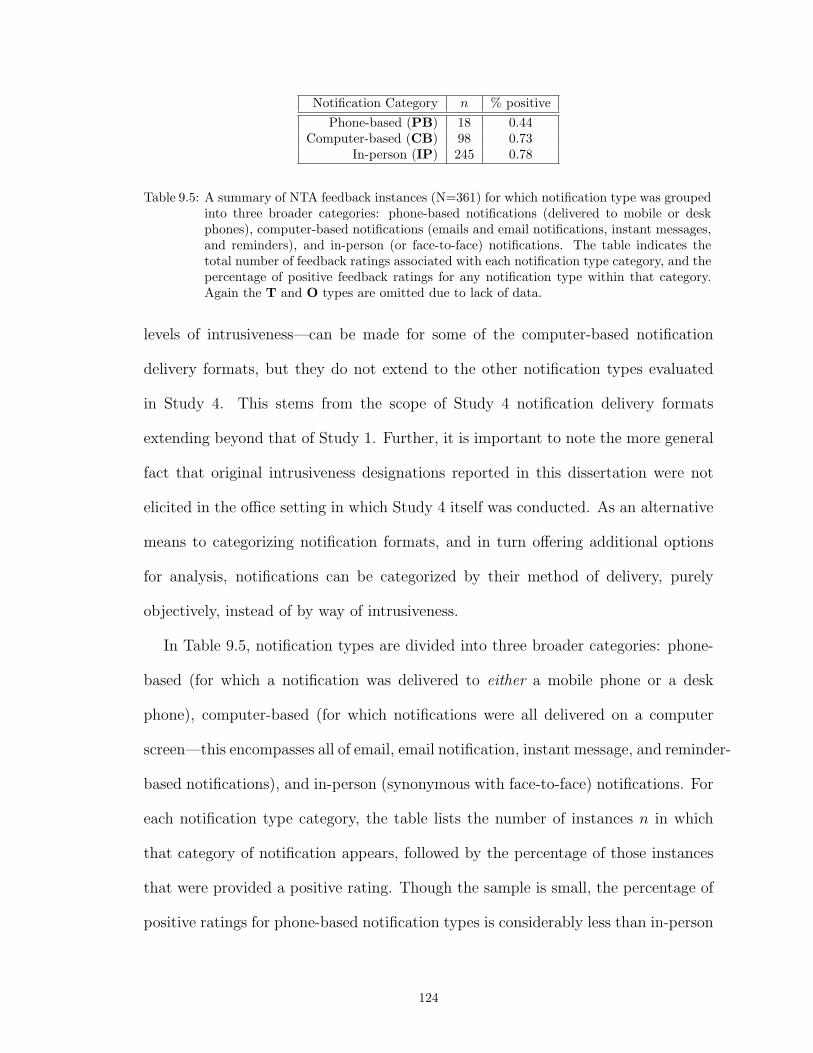
Notification Category n % positivePhone-based (PB) 18 0.44
Computer-based (CB) 98 0.73In-person (IP) 245 0.78
Table 9.5: A summary of NTA feedback instances (N=361) for which notification type was groupedinto three broader categories: phone-based notifications (delivered to mobile or deskphones), computer-based notifications (emails and email notifications, instant messages,and reminders), and in-person (or face-to-face) notifications. The table indicates thetotal number of feedback ratings associated with each notification type category, and thepercentage of positive feedback ratings for any notification type within that category.Again the T and O types are omitted due to lack of data.
levels of intrusiveness—can be made for some of the computer-based notification
delivery formats, but they do not extend to the other notification types evaluated
in Study 4. This stems from the scope of Study 4 notification delivery formats
extending beyond that of Study 1. Further, it is important to note the more general
fact that original intrusiveness designations reported in this dissertation were not
elicited in the office setting in which Study 4 itself was conducted. As an alternative
means to categorizing notification formats, and in turn offering additional options
for analysis, notifications can be categorized by their method of delivery, purely
objectively, instead of by way of intrusiveness.
In Table 9.5, notification types are divided into three broader categories: phone-
based (for which a notification was delivered to either a mobile phone or a desk
phone), computer-based (for which notifications were all delivered on a computer
screen—this encompasses all of email, email notification, instant message, and reminder-
based notifications), and in-person (synonymous with face-to-face) notifications. For
each notification type category, the table lists the number of instances n in which
that category of notification appears, followed by the percentage of those instances
that were provided a positive rating. Though the sample is small, the percentage of
positive ratings for phone-based notification types is considerably less than in-person
124

Instance set df N χ2 p
Both observers agreed: 6 361 14.30 0.026Three broad notification types: 2 361 10.64 0.005
Table 9.6: Chi-square tests for independence between notification type and feedback rating (positiveor negative), for the instances in which (1) both observers agreed on the notification type,and (2) notification type was grouped into three categories: in-person, phone-based, andcomputer-based. Results indicate that in both cases, notification type is indeed influ-ential on preference ratings (especially after categorizing notifications, which providesstrong evidence for rejecting the null hypothesis that feedback ratings are independentof notification type category.
and computer-based notification delivery formats.
To justify the assumption that notification types do indeed have an effect on
people’s preference ratings, a Chi-square test for independence was performed with
(1) only the instances in which both observers agreed on the notification type, i.e.,
the NTA data set, and (2) the same instances but with a ternary categorization of
notification type as described above. The results of these tests both conclude that
there is indeed an association between notification type and feedback rating, i.e.,
that notification type is indeed quite relevant when it comes to user preferences: in
both cases, p-values were significant, at p = 0.026 and p = 0.005 respectively. Details
on these tests are provided in Table 9.6. These significance tests, in rejecting the null
hypothesis that the delivery format of a notification does not affect user preferences,
indicates on the contrary that notification type matters. In particular (and according
to the values displayed in Table 9.5), computer-based and in-person notifications are
strongly preferred to the delivery of a notification over the phone.
Unfortunately, hypothesis H4.2 cannot be addressed by the data acquired in
Study 4, because the reliability ratings for high-level features Important, Urgent,
and High Attention were all much too low. As noted earlier, I hypothesize that
this is because these features were extremely subjective and difficult to analyze by
125

Correlation Coefficients (& Confidence Intervals) among Numerical VariablesVisible Applications Application Panes # Chat Windows
Visible Applications - 0.030 (-0.02, 0.08) 0.044 (0.01, 0.08)Application Panes 0.030 (-0.02, 0.08) - 0.406 (0.35, 0.47)# Chat Windows 0.044 (0.01, 0.08) 0.406 (0.35, 0.47) -
Table 9.7: Correlation coefficients between reliable numerical variables: there is only one moder-ately strong, positive correlation between Application Panes and # Chat Windows andno other pair of distinct numerical variables.
observers as unfamiliar as the coding assistants in this study were with the India-
based corporate support office setting.
9.5.1 Correlation
Before fitting a complete user preference model, it is important to test for associ-
ations, or correlations, among contextual variables and between those variables and
the type of notification delivered. Due to their inherent characteristics (as ordinal
versus categorical variables), associations among numerical features must be assessed
in a separate process from categorical features; in this paragraph, I will first describe
the associations between reliable numerical features and the following paragraph will
detail correlations between those categorical variables found to be reliable. Relation-
ships between numerical variables (Visible Applications, Application Panes, and #
of Chat Windows) can be computed using a simple test for correlations by way of
Pearson’s correlation coefficient (Equation 9.1), in which X and Y refer to the mean
of the two numerical features in the evaluation, Xi and Yi represent individual data
points from each set, and sX and sY are their respective standard deviations.
(9.1) r =
∑ni=1
[(Xi−XsX
)(Yi−YsY
)]n− 1
Data resulting from these correlation assessments is presented in Table 9.7. It
would be expected that the number of Visible Applications would not be correlated
126
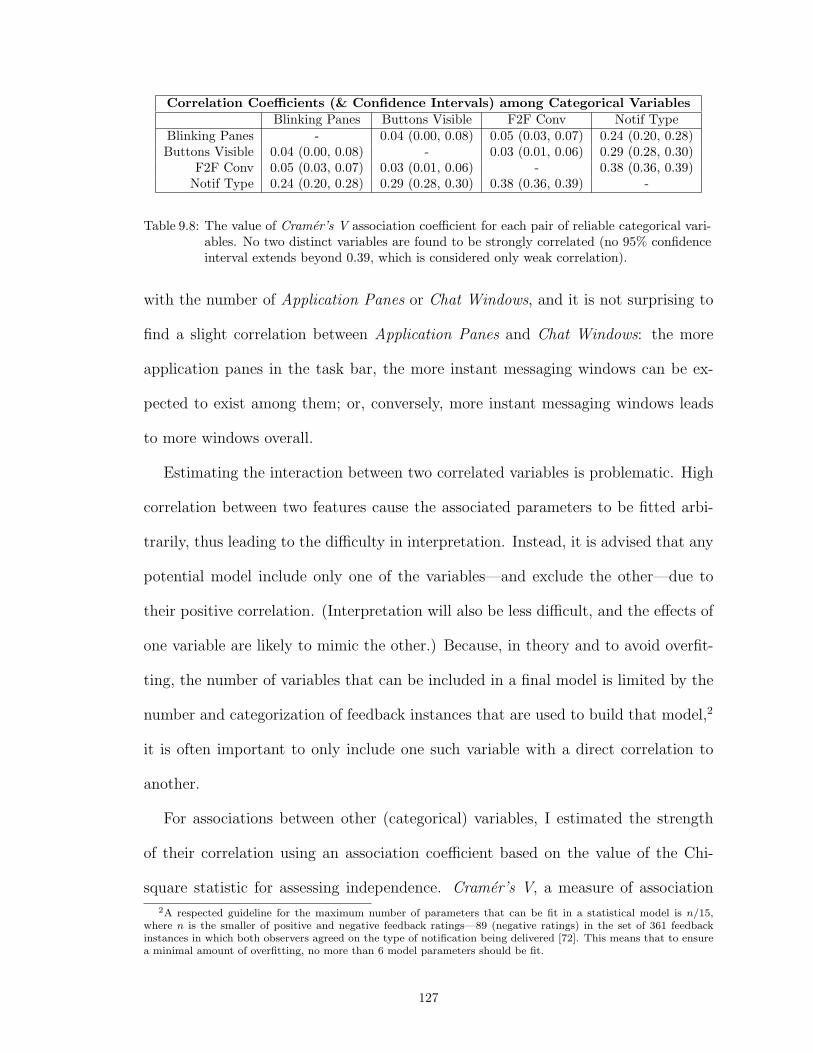
Correlation Coefficients (& Confidence Intervals) among Categorical VariablesBlinking Panes Buttons Visible F2F Conv Notif Type
Blinking Panes - 0.04 (0.00, 0.08) 0.05 (0.03, 0.07) 0.24 (0.20, 0.28)Buttons Visible 0.04 (0.00, 0.08) - 0.03 (0.01, 0.06) 0.29 (0.28, 0.30)
F2F Conv 0.05 (0.03, 0.07) 0.03 (0.01, 0.06) - 0.38 (0.36, 0.39)Notif Type 0.24 (0.20, 0.28) 0.29 (0.28, 0.30) 0.38 (0.36, 0.39) -
Table 9.8: The value of Cramer’s V association coefficient for each pair of reliable categorical vari-ables. No two distinct variables are found to be strongly correlated (no 95% confidenceinterval extends beyond 0.39, which is considered only weak correlation).
with the number of Application Panes or Chat Windows, and it is not surprising to
find a slight correlation between Application Panes and Chat Windows: the more
application panes in the task bar, the more instant messaging windows can be ex-
pected to exist among them; or, conversely, more instant messaging windows leads
to more windows overall.
Estimating the interaction between two correlated variables is problematic. High
correlation between two features cause the associated parameters to be fitted arbi-
trarily, thus leading to the difficulty in interpretation. Instead, it is advised that any
potential model include only one of the variables—and exclude the other—due to
their positive correlation. (Interpretation will also be less difficult, and the effects of
one variable are likely to mimic the other.) Because, in theory and to avoid overfit-
ting, the number of variables that can be included in a final model is limited by the
number and categorization of feedback instances that are used to build that model,2
it is often important to only include one such variable with a direct correlation to
another.
For associations between other (categorical) variables, I estimated the strength
of their correlation using an association coefficient based on the value of the Chi-
square statistic for assessing independence. Cramer’s V, a measure of association
2A respected guideline for the maximum number of parameters that can be fit in a statistical model is n/15,where n is the smaller of positive and negative feedback ratings—89 (negative ratings) in the set of 361 feedbackinstances in which both observers agreed on the type of notification being delivered [72]. This means that to ensurea minimal amount of overfitting, no more than 6 model parameters should be fit.
127
between categorical variables and presented in Equation 9.2, is a flexible technique
for measuring correlation strength; it was designed to handle variables with differing
numbers of categories, and its association values are scaled to lie between 0 and 1
for ease of interpretation.
(9.2) V =
√χ2
n(M − 1)(N − 1)
Table 9.8 contains all of the estimates of between-variable correlation (averaged
over all five imputed data sets and appearing with their associated confidence in-
tervals), and it is clear that there are no correlations that are especially strong—all
values in the table are less than 0.4, which is not considered particularly high in
correlation strength. Thus, there should be no confounds related to inter-variable
relationships when modeling interactions among these (and the majority of the nu-
merical) variables.
9.5.2 Multiple Regression
The next step is to learn, or fit, a user model that has the ability to, from the
values of reliable contextual features, accurately predict feedback ratings (or, more
specifically, predict some measure of the probability of a positive rating in a given
context) and in turn suggest the notification type likely to be most desirable in a
particular situation. A basic model, which accounts for the relationships between
variables as described in Section 9.5.1, would include the following features deter-
mined to be both reliable and not strongly correlated: Visible Applications, Appli-
cation Panes, Blinking Chat Windows, Buttons Visible, Face-to-face Conversation,
and the Notification Type variable.
However, there are also potential interaction effects to consider. For instance, if
128

someone receives a computer-based notification, say, an instant message, while there
are blinking panes in the task bar, he or she may be more likely to find the notification
undesirable; whereas an in-person or phone-based notification (not appearing on
the computer screen) could instead be more acceptable in such contexts. Testing
this theory would involve fitting a model that includes an interaction term between
Notification Type and Blinking Panes. Similarly, other potential interactions may
involve Visible Applications and Notification Type or even Buttons Visible and Face-
to-face Conversation (e.g., if a button is just a single click away, it may be more
likely to be used even after someone’s focus has moved away from the computer).
One way to consider potential interaction effects, in addition to the main effect of
individual variables, on people’s preferences is to generate one heavily-packed model
that contains all of the features that have potential to influence preference ratings.
Then, there are various techniques (i.e., bootstrapping, or basing significance on a
conservative cutoff value of, e.g., α=0.1) that can be used to select those variable
combinations whose effect may be significant in a final model [42]. An alternative
to this class of techniques would also begin by including in a model all potentially
relevant features. It would then run a step-wise model-update (i.e., variable selection)
process to consider all models that contain a subset of the total set of features and
choose the model that maximizes the degree to which a model fits the given data.
Both of the above techniques for testing for interaction effects indicated that, in
addition to the individual features representing (1) notification type and (2) whether
or not the feedback buttons are visible on the screen, an interaction between Visible
Applications and Application Panes may also affect participants’ feedback ratings.
(For instance, it may only be the case that a positive effect on feedback ratings arises
with very few Visible Applications and Application Panes, e.g, if the user has only
129
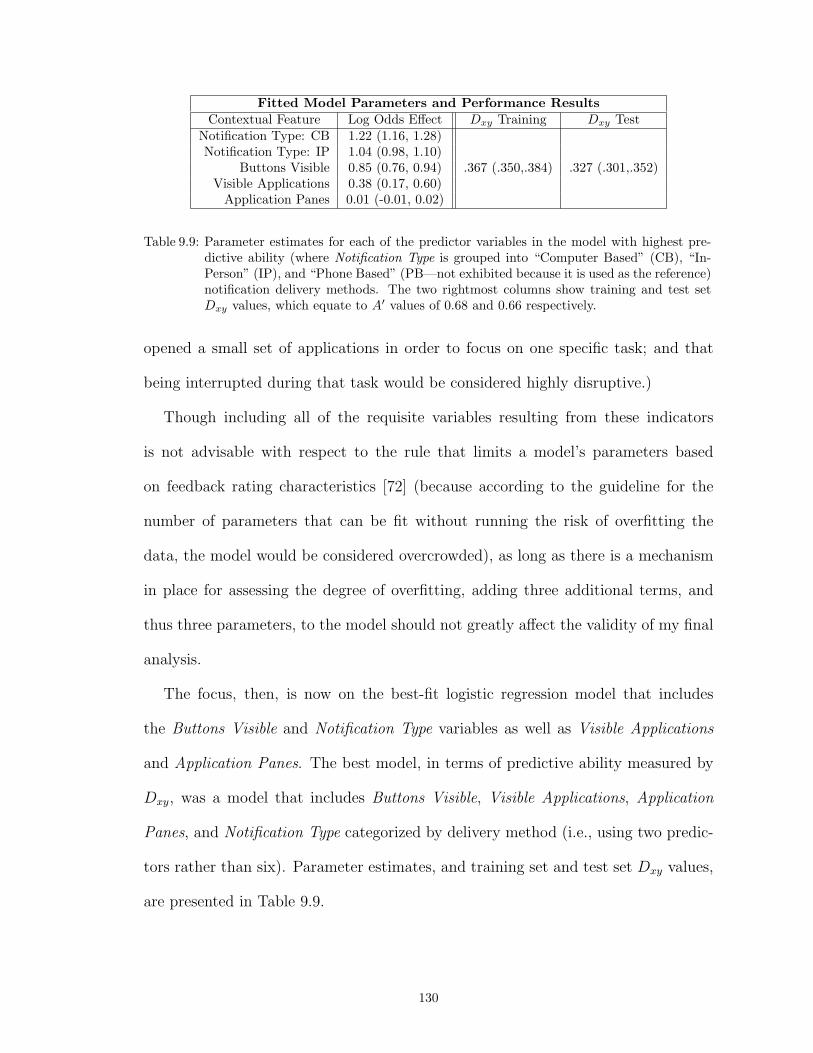
Fitted Model Parameters and Performance ResultsContextual Feature Log Odds Effect Dxy Training Dxy Test
Notification Type: CB 1.22 (1.16, 1.28)
.367 (.350,.384) .327 (.301,.352)Notification Type: IP 1.04 (0.98, 1.10)
Buttons Visible 0.85 (0.76, 0.94)Visible Applications 0.38 (0.17, 0.60)
Application Panes 0.01 (-0.01, 0.02)
Table 9.9: Parameter estimates for each of the predictor variables in the model with highest pre-dictive ability (where Notification Type is grouped into “Computer Based” (CB), “In-Person” (IP), and “Phone Based” (PB—not exhibited because it is used as the reference)notification delivery methods. The two rightmost columns show training and test setDxy values, which equate to A′ values of 0.68 and 0.66 respectively.
opened a small set of applications in order to focus on one specific task; and that
being interrupted during that task would be considered highly disruptive.)
Though including all of the requisite variables resulting from these indicators
is not advisable with respect to the rule that limits a model’s parameters based
on feedback rating characteristics [72] (because according to the guideline for the
number of parameters that can be fit without running the risk of overfitting the
data, the model would be considered overcrowded), as long as there is a mechanism
in place for assessing the degree of overfitting, adding three additional terms, and
thus three parameters, to the model should not greatly affect the validity of my final
analysis.
The focus, then, is now on the best-fit logistic regression model that includes
the Buttons Visible and Notification Type variables as well as Visible Applications
and Application Panes. The best model, in terms of predictive ability measured by
Dxy, was a model that includes Buttons Visible, Visible Applications, Application
Panes, and Notification Type categorized by delivery method (i.e., using two predic-
tors rather than six). Parameter estimates, and training set and test set Dxy values,
are presented in Table 9.9.
130
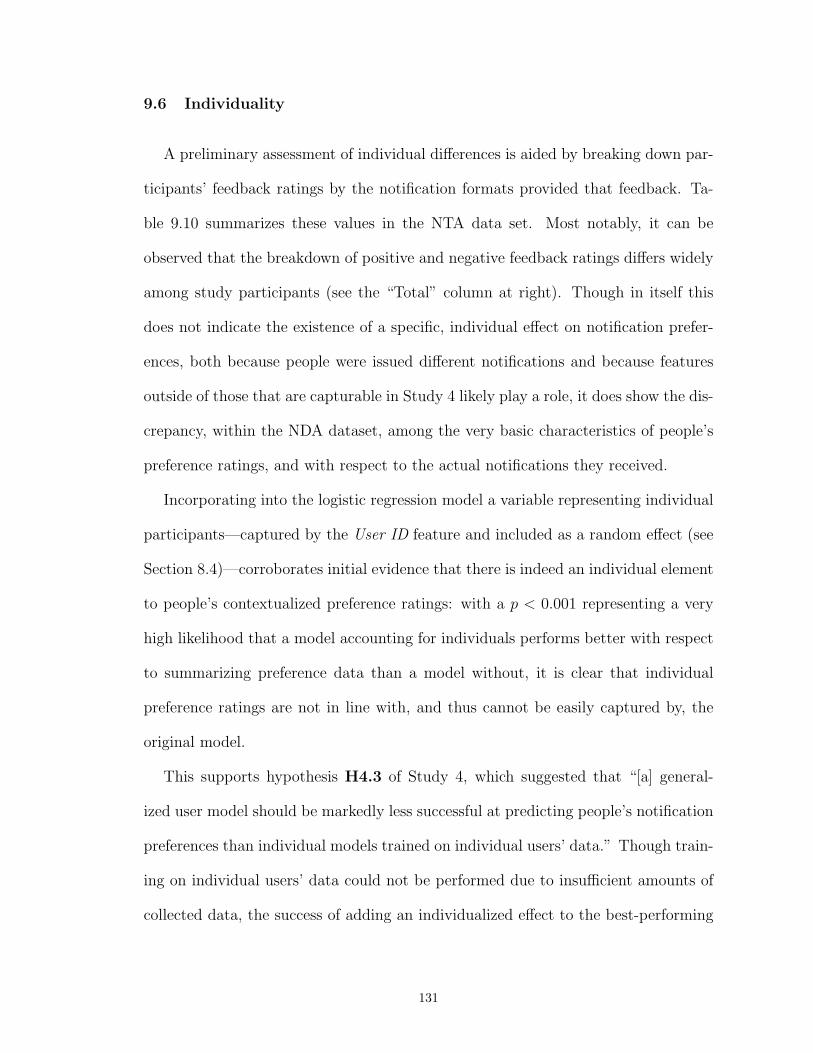
9.6 Individuality
A preliminary assessment of individual differences is aided by breaking down par-
ticipants’ feedback ratings by the notification formats provided that feedback. Ta-
ble 9.10 summarizes these values in the NTA data set. Most notably, it can be
observed that the breakdown of positive and negative feedback ratings differs widely
among study participants (see the “Total” column at right). Though in itself this
does not indicate the existence of a specific, individual effect on notification prefer-
ences, both because people were issued different notifications and because features
outside of those that are capturable in Study 4 likely play a role, it does show the dis-
crepancy, within the NDA dataset, among the very basic characteristics of people’s
preference ratings, and with respect to the actual notifications they received.
Incorporating into the logistic regression model a variable representing individual
participants—captured by the User ID feature and included as a random effect (see
Section 8.4)—corroborates initial evidence that there is indeed an individual element
to people’s contextualized preference ratings: with a p < 0.001 representing a very
high likelihood that a model accounting for individuals performs better with respect
to summarizing preference data than a model without, it is clear that individual
preference ratings are not in line with, and thus cannot be easily captured by, the
original model.
This supports hypothesis H4.3 of Study 4, which suggested that “[a] general-
ized user model should be markedly less successful at predicting people’s notification
preferences than individual models trained on individual users’ data.” Though train-
ing on individual users’ data could not be performed due to insufficient amounts of
collected data, the success of adding an individualized effect to the best-performing
131
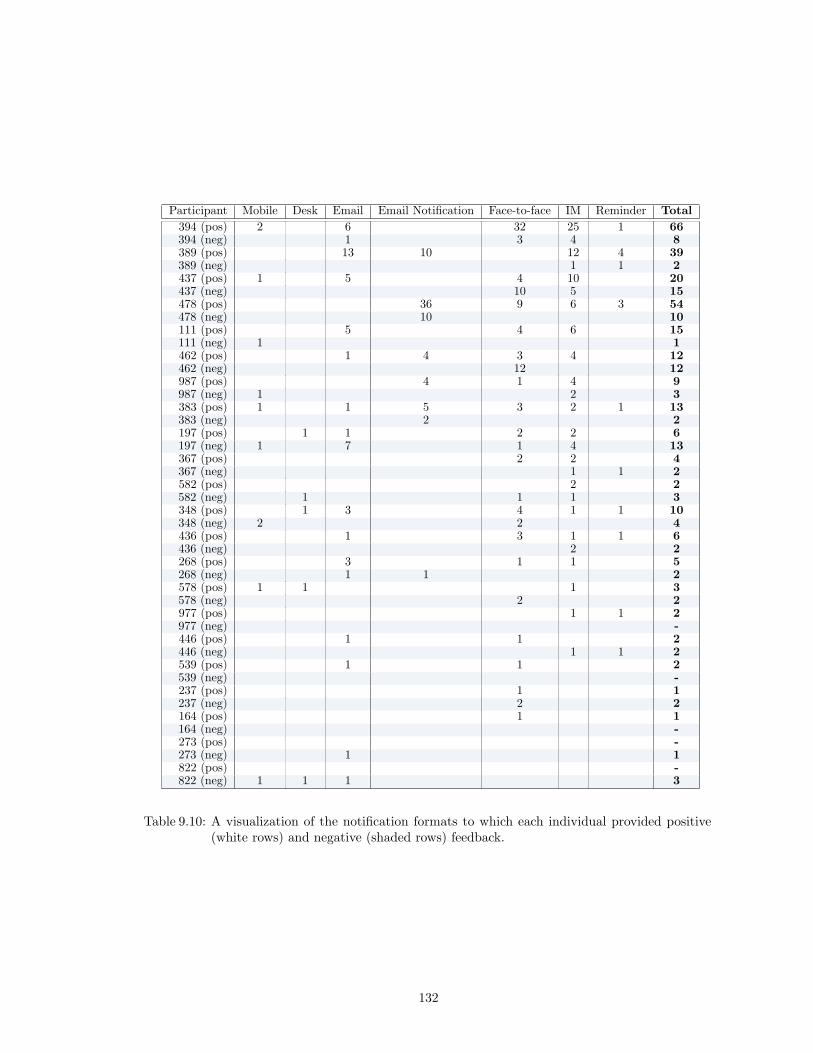
Participant Mobile Desk Email Email Notification Face-to-face IM Reminder Total394 (pos) 2 6 32 25 1 66394 (neg) 1 3 4 8389 (pos) 13 10 12 4 39389 (neg) 1 1 2437 (pos) 1 5 4 10 20437 (neg) 10 5 15478 (pos) 36 9 6 3 54478 (neg) 10 10111 (pos) 5 4 6 15111 (neg) 1 1462 (pos) 1 4 3 4 12462 (neg) 12 12987 (pos) 4 1 4 9987 (neg) 1 2 3383 (pos) 1 1 5 3 2 1 13383 (neg) 2 2197 (pos) 1 1 2 2 6197 (neg) 1 7 1 4 13367 (pos) 2 2 4367 (neg) 1 1 2582 (pos) 2 2582 (neg) 1 1 1 3348 (pos) 1 3 4 1 1 10348 (neg) 2 2 4436 (pos) 1 3 1 1 6436 (neg) 2 2268 (pos) 3 1 1 5268 (neg) 1 1 2578 (pos) 1 1 1 3578 (neg) 2 2977 (pos) 1 1 2977 (neg) -446 (pos) 1 1 2446 (neg) 1 1 2539 (pos) 1 1 2539 (neg) -237 (pos) 1 1237 (neg) 2 2164 (pos) 1 1164 (neg) -273 (pos) -273 (neg) 1 1822 (pos) -822 (neg) 1 1 1 3
Table 9.10: A visualization of the notification formats to which each individual provided positive(white rows) and negative (shaded rows) feedback.
132
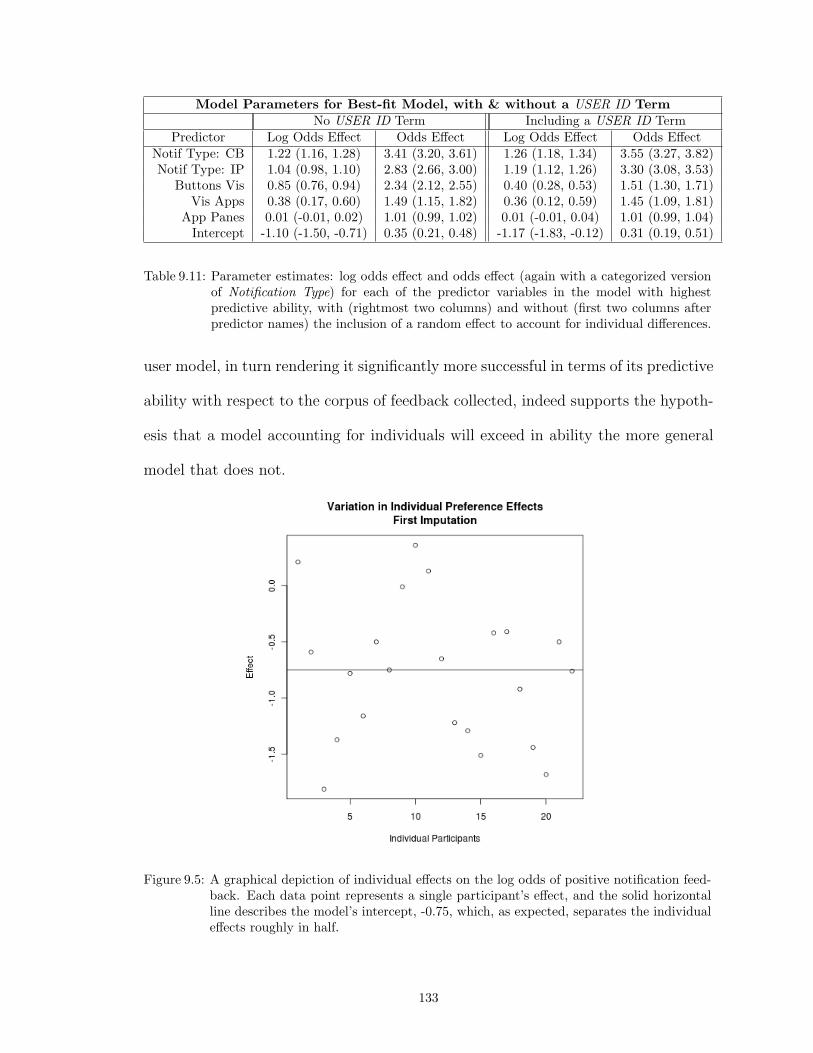
Model Parameters for Best-fit Model, with & without a USER ID TermNo USER ID Term Including a USER ID Term
Predictor Log Odds Effect Odds Effect Log Odds Effect Odds EffectNotif Type: CB 1.22 (1.16, 1.28) 3.41 (3.20, 3.61) 1.26 (1.18, 1.34) 3.55 (3.27, 3.82)Notif Type: IP 1.04 (0.98, 1.10) 2.83 (2.66, 3.00) 1.19 (1.12, 1.26) 3.30 (3.08, 3.53)
Buttons Vis 0.85 (0.76, 0.94) 2.34 (2.12, 2.55) 0.40 (0.28, 0.53) 1.51 (1.30, 1.71)Vis Apps 0.38 (0.17, 0.60) 1.49 (1.15, 1.82) 0.36 (0.12, 0.59) 1.45 (1.09, 1.81)
App Panes 0.01 (-0.01, 0.02) 1.01 (0.99, 1.02) 0.01 (-0.01, 0.04) 1.01 (0.99, 1.04)Intercept -1.10 (-1.50, -0.71) 0.35 (0.21, 0.48) -1.17 (-1.83, -0.12) 0.31 (0.19, 0.51)
Table 9.11: Parameter estimates: log odds effect and odds effect (again with a categorized versionof Notification Type) for each of the predictor variables in the model with highestpredictive ability, with (rightmost two columns) and without (first two columns afterpredictor names) the inclusion of a random effect to account for individual differences.
user model, in turn rendering it significantly more successful in terms of its predictive
ability with respect to the corpus of feedback collected, indeed supports the hypoth-
esis that a model accounting for individuals will exceed in ability the more general
model that does not.
Figure 9.5: A graphical depiction of individual effects on the log odds of positive notification feed-back. Each data point represents a single participant’s effect, and the solid horizontalline describes the model’s intercept, -0.75, which, as expected, separates the individualeffects roughly in half.
133
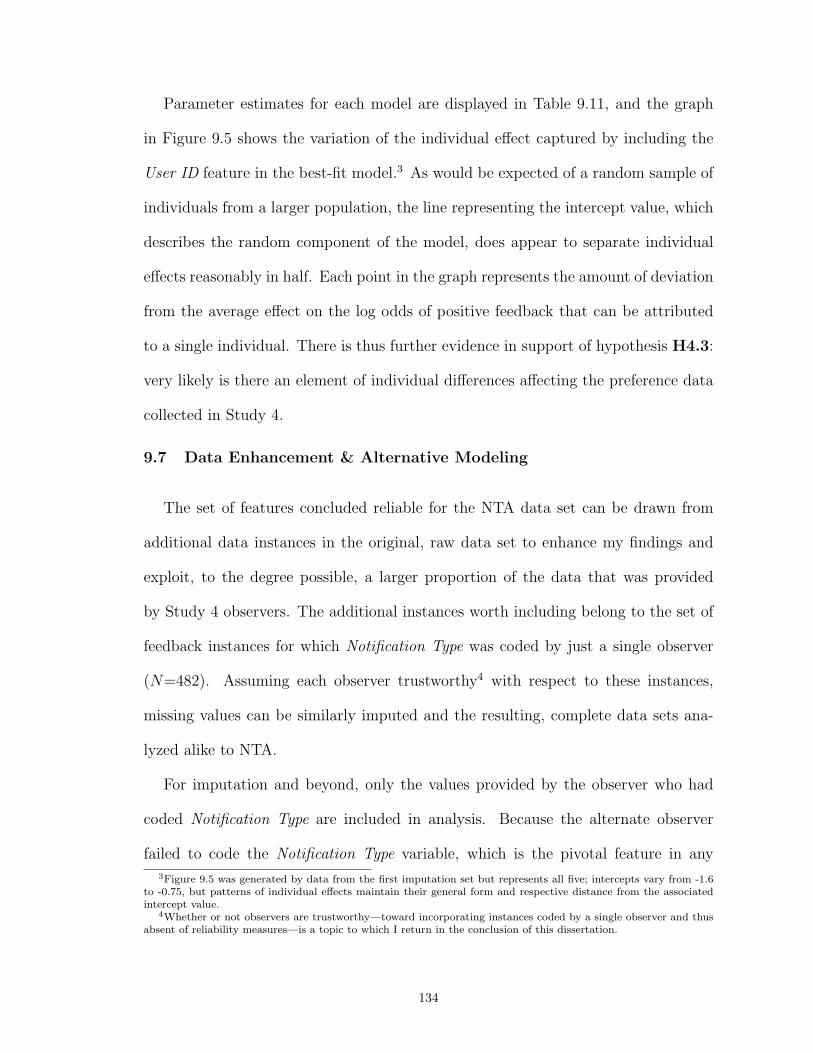
Parameter estimates for each model are displayed in Table 9.11, and the graph
in Figure 9.5 shows the variation of the individual effect captured by including the
User ID feature in the best-fit model.3 As would be expected of a random sample of
individuals from a larger population, the line representing the intercept value, which
describes the random component of the model, does appear to separate individual
effects reasonably in half. Each point in the graph represents the amount of deviation
from the average effect on the log odds of positive feedback that can be attributed
to a single individual. There is thus further evidence in support of hypothesis H4.3:
very likely is there an element of individual differences affecting the preference data
collected in Study 4.
9.7 Data Enhancement & Alternative Modeling
The set of features concluded reliable for the NTA data set can be drawn from
additional data instances in the original, raw data set to enhance my findings and
exploit, to the degree possible, a larger proportion of the data that was provided
by Study 4 observers. The additional instances worth including belong to the set of
feedback instances for which Notification Type was coded by just a single observer
(N=482). Assuming each observer trustworthy4 with respect to these instances,
missing values can be similarly imputed and the resulting, complete data sets ana-
lyzed alike to NTA.
For imputation and beyond, only the values provided by the observer who had
coded Notification Type are included in analysis. Because the alternate observer
failed to code the Notification Type variable, which is the pivotal feature in any
3Figure 9.5 was generated by data from the first imputation set but represents all five; intercepts vary from -1.6to -0.75, but patterns of individual effects maintain their general form and respective distance from the associatedintercept value.
4Whether or not observers are trustworthy—toward incorporating instances coded by a single observer and thusabsent of reliability measures—is a topic to which I return in the conclusion of this dissertation.
134

feedback instance (see 9.1 above), any other coded values within those instances are
arguably highly unreliable.
In the preference modeling phase of analysis, only the features considered “reli-
able” in the (doubly-coded) NTA set will qualify as model-worthy variables in the
new set of (coded-by-a-single-observer) instances. I make this provision primarily
on two accounts: first, for ease of comparing between models or combining the data
into a single set of 843 feedback instances (comprising nearly two-thirds of the total
number of coded feedback instances supplied by observers) and devising a model as
such, effective preference modeling relies on the sole use of reliable features. Sec-
ond, a feature is considered reliable on the basis that two human observers generally
agreed on its value across contexts, which in theory speaks to the ease of recognizing
that feature throughout the coding process. Put another way, in the form of the
converse: a feature not considered “reliable” upon examination by two observers is
likely no more (and quite possibly less) reliable when only examined by one.
9.7.1 The Singly-Coded Data Set
There are an additional 482 feedback instances, for which the Notification Type
feature was coded by only a single observer, that have thus far been excluded from
analysis. Rather than completely disregard these instances for lack of consensus,
they are combined, similar to the NTA set, into a data set to which I will refer as
SC or the Singly-Coded set.
For each feature examined in the NTA data set, the percentage of missing values
in the new SC data set is pictured in Figure 9.6. It must first be noted that the values
represented in the graph comprise only those coded values attributed to the observer
who provided a value for the Notification Type variable in a given instance; data
from the other observer of the pair assigned to code that (and any such) instance
135

Figure 9.6: Percentage of missing values for each variable in the SC feature set (N=482). Note thatonly one observer’s coded values are represented for each instance.
was completely removed from this assessment. It is apparent from the Figure 9.6
graph that there is very little missing data in this SC data set, a fortunate finding
with respect to missing value remediation. With such few missing values, multiple
imputation is again a fine candidate for synthesizing a set of complete data sets that
represent observers’ originally-coded values.
As such, multiple imputation was performed on the original SC data set, and due
to the fact that in this case no conflicts required resolution (because only a single
observer’s data was carried forward), a one-step imputation process was sufficient.
Here, five data sets were again generated, but no additional data manipulation or
processing was required.
9.7.2 Regularization
An alternative modeling technique to limiting the number of model parameters is
called “regularization” [79] and allows for the inclusion of a wider variety of variables
136
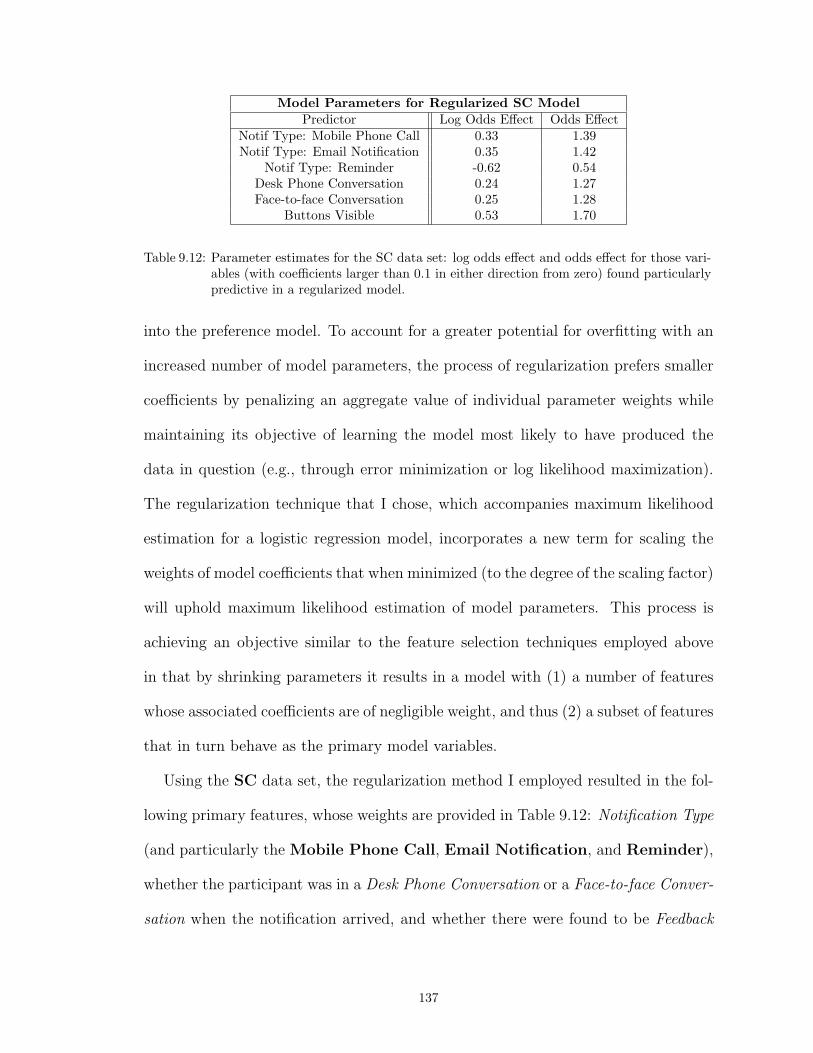
Model Parameters for Regularized SC ModelPredictor Log Odds Effect Odds Effect
Notif Type: Mobile Phone Call 0.33 1.39Notif Type: Email Notification 0.35 1.42
Notif Type: Reminder -0.62 0.54Desk Phone Conversation 0.24 1.27Face-to-face Conversation 0.25 1.28
Buttons Visible 0.53 1.70
Table 9.12: Parameter estimates for the SC data set: log odds effect and odds effect for those vari-ables (with coefficients larger than 0.1 in either direction from zero) found particularlypredictive in a regularized model.
into the preference model. To account for a greater potential for overfitting with an
increased number of model parameters, the process of regularization prefers smaller
coefficients by penalizing an aggregate value of individual parameter weights while
maintaining its objective of learning the model most likely to have produced the
data in question (e.g., through error minimization or log likelihood maximization).
The regularization technique that I chose, which accompanies maximum likelihood
estimation for a logistic regression model, incorporates a new term for scaling the
weights of model coefficients that when minimized (to the degree of the scaling factor)
will uphold maximum likelihood estimation of model parameters. This process is
achieving an objective similar to the feature selection techniques employed above
in that by shrinking parameters it results in a model with (1) a number of features
whose associated coefficients are of negligible weight, and thus (2) a subset of features
that in turn behave as the primary model variables.
Using the SC data set, the regularization method I employed resulted in the fol-
lowing primary features, whose weights are provided in Table 9.12: Notification Type
(and particularly the Mobile Phone Call, Email Notification, and Reminder),
whether the participant was in a Desk Phone Conversation or a Face-to-face Conver-
sation when the notification arrived, and whether there were found to be Feedback
137

Model Parameters for Regularized NTA ModelPredictor Log Odds Effect Odds Effect
Notif Type: Mobile Phone Call -0.31 0.73Notif Type: Email Notification 0.14 1.15Notif Type: Instant Message 0.20 1.22
Desk Phone Conversation 0.13 1.14Face-to-face Conversation -0.11 0.90
Buttons Visible 0.59 1.80Visible Applications 0.17 1.19
Table 9.13: Parameter estimates for the NTA data set: log odds effect and odds effect for those vari-ables (with coefficients larger than 0.1 in either direction from zero) found particularlypredictive in a regularized model.
Buttons Visible on a participant’s computer screen.
The same process of regularization was conducted on the NTA data set for the
sake of comparison, and results are displayed in Table 9.13. Particularly notable is
the similarity in selected features, both between the NTA and SC data set and also
with respect to those features considered influential of preferences by the modeling
technique described earlier in this chapter. More precisely, between the two regular-
ized models there is substantial overlap in highly predictive features: two types of
notification formats (of three total in each model), whether the feedback buttons are
visible on the screen, and two of the same types of conversations being conducted
when a notification arrived are all features represented in both models. The overlap
with the NTA model deemed highest in predictive ability, without regularization, is
not as wide but indeed includes notification types (albeit grouped differently) and
visible feedback buttons; and the feature representing the number of visible applica-
tions appears in both the original NTA model and also its regularized counterpart.
The Somers Dxy coefficient was calculated for each of the regularized models in
exactly the same fashion as was prescribed above. Initial predictor models, generated
prior to regularization but with all of the reliable features, were first assessed for their
predictive ability, and as should be expected, predictive ability was low. Overfitting
138

Model Evaluation in the Regularized SettingTest Set Dxy
Model SC Data Set NTA Data SetPre-regularization 0.161 0.193
Post-regularization 0.272 0.335Regularized - Alt data 0.153 0.122
Table 9.14: Predictive accuracy measures for (1) SC and NTA preference models prior to regulariza-tion, i.e., as a set of learned coefficients paired with every one of the reliable variables;(2) SC and NTA preference models after regularization has been performed to reducethe number of prominent model variables; and (3) the regularized SC model evaluatedon the NTA data set and the regularized NTA model evaluated on the SC data set.
was exceptionally high, with test set Dxy values for predictive ability well below
training values. When the predictive ability of the regularized models was assessed,
it was found to be much higher, with test values of Dxy = 0.272 and Dxy = 0.335 for
the SC and NTA data sets respectively.
Unfortunately, however, when the regularized model for the SC data set was tested
on the NTA data set, predictive ability was deemed much lower; and similarly for
the regularized NTA model evaluated with respect to the SC data set. The Dxy
values for these evaluations, as well as those described in the previous paragraph,
namely pre-regularization and regularized models examined via cross validation on
the data set for which they were designed, are presented above in Table 9.14. Because
the purpose of regularization is to find a more generalizable model to describe the
data that, with luck, would have similar predictive ability for any other set of data
acquired from the same source, these results make it clear that pooling the NTA and
SC sets is not warranted in the state in which they have each been coded.
The Dxy values attributed to the regularized NTA and SC models are equivalent
to A’ values (for assessing ROC curves) of approximately 0.64 and 0.67, which does
not represent an especially high degree of predictive ability. However, the following
observations suggest that the regularization technique I implemented retains promise:
139
(1) both Dxy values are on par with the value achieved by the best model learned in
the original logistic regression setting; (2) considering the high variability of human
participants, and human coders, in addition to other such caveats described in this
document, Dxy values were not expected to be particularly high; and (3) these values
represent significant deviation from the predictive ability of a random model. It can
thus be concluded that regularization provides an effective alternative to manual
exploration, and limitation, of model variables and parameters.
140
CHAPTER X
Discussion & Conclusion
Study 1, Study 2, Study 3, and Study 4 all examined people’s notification pref-
erences in different domains but with a standard objective: to determine whether
and to what measurable extent contextual information can be shown to influence
people’s preferences for notification delivery.
10.1 Summaries & Results
Study 1 began by differentiating notification delivery formats by their relative
levels of intrusiveness. This was only after staking a claim that in the process of
eliciting participants’ preferences among the different notification formats, the types
they indicated to be “annoying” and undesirable actually equated to (what was later
determined to be) intrusiveness. The intrusiveness label was adopted after finding
that notification delivery formats considered highly annoying in the first phase of
Study 1 were then preferred to other delivery types in certain scenarios. It was thus
concluded that rather than indicating a sense of annoyance, or irritation, brought
about by individual notification delivery formats (that would lead them to be spurned
from use in such settings), people were indicating suggested intrusiveness levels (that,
independent of context1, likely correspond heavily with annoyance).
1The phrase “independent of context,” while philosophically contentious, here simply refers to having presenteda set of notification screen shots to participants for evaluation, prior to associating these hypothetical notification
141

In the second part of Study 1, a very clear trend in notification format desirability
was exhibited in accordance with variations in contextual feature values: when the
utility of a notification (the urgency of the message and importance of the associ-
ated event) is high and attention requirements of the task at hand are low, people
are overwhelmingly accepting of most notification delivery formats, including those
that were considered annoying, or intrusive, in the first phase of Study 1. However,
despite general agreement that overall a larger number of notification delivery for-
mats are acceptable in certain (high-utility or low-task-focus) contexts, there was
still very high variability in people’s individual preferences, both in terms of their
preferences for certain types of notifications as well as in their preferences across
potential scenarios in which these notifications may be delivered.
Study 2 also encountered its own individuality findings: participants’ preference
ratings were nearly equally split among the three distinct notification types (occlud-
ing, peripheral, and auditory), and very infrequently did these overall (reflective)
preferences correspond to an individual’s reactive preference ratings issued in the
process of interacting with the Study 2 activities. Here, however, there was no ob-
servable trend in preference ratings among contextual scenarios; either context was
misrepresented, or it is overshadowed by circumstantial events in the simulated ac-
tivities such that it did not influence preferences to the degree expected. Though
reactive and reflective preferences are found to be in conflict in this setting, Study
2 findings mirror those of Study 1: even those notification formats categorized as
undesirably intrusive in Study 1 were appreciated in certain contexts; in Study 2,
occluding notifications were reflectively characterized as least desirable among noti-
fication types, but they were rated most positively among notifications delivered in
delivery formats with contextualized scenarios.
142

the reactive setting.
A possible corollary to these findings is that any artificial environment will not
necessarily reflect a user’s experience in his or her naturalistic setting. Study 1 and
Study 2 thus served as preliminary evidence to warrant the exploration of notification
preferences in a more realistic setting.
Prior to a final, in situ study conducted in a largely naturalistic setting, Study
3 attempted to characterize reflective notification preferences among office employ-
ees in the environment in which Study 4, the study that concludes this dissertation
work, would be conducted. Though reflective preferences do not always align with
preferences issued in a reactive setting (cf. Study 2), principal Study 3 results cor-
roborate findings from Study 1 and Study 2: preference trends were again exhibited
across contextualized scenarios, such that more notification types were considered
desirable when notification utility was high or attentional requirements of the cur-
rent task were low. In addition, individuality was measured in this context but by
way of shifts in preferences over time; I found initial evidence that although general
trends are maintained, people’s preferences tend to shift from different points and in
different directions and magnitudes when measured again.
In Study 4, in which people’s notification preferences were examined in as natu-
ral a setting as possible, the elements of context explored in Study 1, Study 2, and
Study 3 were captured with much difficulty. Nearly all notifications were considered
of relatively low urgency by the observers who were employed to code the individual
participant videos collected for this final study. And the reliability of their coded
observations pertaining to message importance and the attention requirements of
an individual’s current task were much lower than reliability values considered ac-
ceptable for analysis by the general research community. Reluctantly these features,
143

along with many others likewise meeting low levels of inter-observer agreement, were
excluded from the set of contextual elements that would be examined as potentially
influential of people’s in situ notification preferences. Of those remaining, the fea-
ture indicating whether or not the feedback buttons are visible on a participant’s
computer screen was found to be particularly relevant to determining whether or
not a positive rating will be issued to an incoming notification. The type of that
notification was also an important indicator of preference, as were the number of
Visible Applications and Application Panes. Though the data set is small, as was
the set of features considered reliable, it is particularly reassuring that Notification
Type is one of the features found influential on people’s preferences.
Upon examining the feedback characteristics of individual study participants, it
was found likely that a generic user model would not be sufficient to fully describe
people’s preferences. This hypothesis was borne out in the results of comparing the
predictive ability of two user models, one of which incorporated specific recognition
of individuality among feedback instances: the enhanced model was shown to have
a significantly greater ability to predict people’s preferences than a model that did
not account for the individuals behind the preference ratings. Similar studies of
longer duration would be useful not only for corroborating these findings, but also for
potentially establishing a wider variety of features that influence preference ratings,
and increasing the number of feedback instances evaluated (by improving, over time,
the reliability of observers’ coded data values, and by capturing additional feedback,
inherent in extending the duration of the study).
The original hypotheses of this thesis are each supported—to a degree. My first
hypothesis, H1, suggested that: “a system that customizes its notification delivery
formats to an individual’s context will be more desirable to its users than one that
144
does not provide such customization.” From all four of the studies I conducted, I
have indeed provided evidence for this to be the case: people indicated, in both
reactive and reflective settings, a preference for different types of notifications to be
delivered in different situations.
Hypothesis H2 was posed with regard to individual differences: that “people’s
[notification delivery preferences] will be highly individualized.” Again individual
differences were found in each study with respect to the specific notification delivery
formats deemed most desirable in each contextual scenario.
Finally, in hypothesis H3 I suggested that “with the adoption of certain user mod-
eling techniques, tools can be developed to facilitate the automatic customization of
notifications to individual preferences, increasing the desirability of today’s intelligent
notification systems,” and there is at least preliminary evidence to support this claim.
Despite the high rate of data attrition in Study 4 resulting in a limited amount of
data, the statistical modeling technique employed (namely logistic regression coupled
with multiple imputation) was successful in achieving positive results.
10.2 Lessons Learned & Guidelines for Future Research
Preparation for Study 4 was quite rigorous; planning for data collection in an
unknown environment is a difficult undertaking wrought with uncertainty. However,
planning for different and unexpected circumstances, and intentionally underesti-
mating the amount of data that may be available, were two very useful strategies for
preparing for data collection. A small set of additional lessons learned in the process
of conducting Study 4 in a naturalistic setting (in a foreign locale) include:
• Design & Deployment
– There is inherent difficulty (1) performing any sort of elicitation naturalistically—
145
preferences had to be acquired in one click (or less!), and (2) designing a
tool to which people could become accustomed (e.g., the size of feedback
buttons was found extremely important, as screen real estate is a highly-
valued commodity; aesthetic appearance is also important, considering the
desire for the visibility of buttons to potentially increase compliance).
– It would have been nice to have had access to a data collection system
that records two simultaneous video streams, either into a single video or a
paired set. This would have aided deployment as well as the coding process.
– User compliance was a major issue; an inside assistant proved priceless both
toward educating participants about the study itself, and for maintaining
a degree of compliance that may not otherwise have been reached.
• Coding
– In terms of observer preparation: it was useful to have assembled everyone
together in a room with a projector screen, to go over exactly how coding
should be performed. This allowed me to show observers exactly how they
would process the videos and navigate the spreadsheets (which was not as
straightforward as I had envisioned), and to answer questions directly by
walking through the process aloud and in vivo.
– Two observers per feedback instance was the very smallest number accept-
able when performing content analysis. Having found such a high rate of
unreliable data, and so high a missing data rate, three or more observers
would be much more highly recommended for future studies similar to Study
4. This would allow for the employment of a voting mechanism among other
benefits such as resistance to observer drop-out (which I experienced twice
146
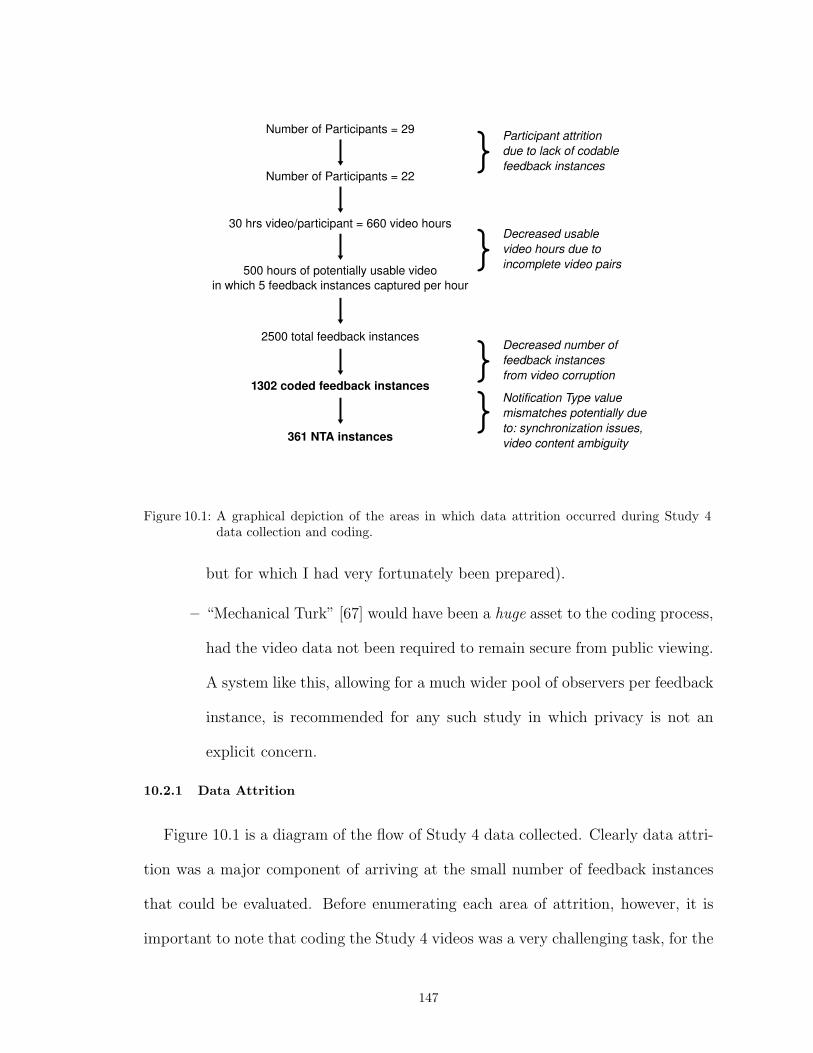
Number of Participants = 29
Number of Participants = 22
30 hrs video/participant = 660 video hours
500 hours of potentially usable videoin which 5 feedback instances captured per hour
2500 total feedback instances
1302 coded feedback instances
361 NTA instances
}Participant attrition due to lack of codable feedback instances
}Decreased usable video hours due to incomplete video pairs
}}
Decreased number of feedback instances from video corruption
Notification Type value mismatches potentially due to: synchronization issues, video content ambiguity
Figure 10.1: A graphical depiction of the areas in which data attrition occurred during Study 4data collection and coding.
but for which I had very fortunately been prepared).
– “Mechanical Turk” [67] would have been a huge asset to the coding process,
had the video data not been required to remain secure from public viewing.
A system like this, allowing for a much wider pool of observers per feedback
instance, is recommended for any such study in which privacy is not an
explicit concern.
10.2.1 Data Attrition
Figure 10.1 is a diagram of the flow of Study 4 data collected. Clearly data attri-
tion was a major component of arriving at the small number of feedback instances
that could be evaluated. Before enumerating each area of attrition, however, it is
important to note that coding the Study 4 videos was a very challenging task, for the
147
reasons described in this dissertation (including viewing limitations on observers, the
scope of the camera’s viewing area itself, screen capture jitter, et cetera) among many
others, such as cross-cultural differences in communication. That being said, there
are still numerous ways in which the attrition rate can potentially be minimized.
Originally included in the study were 29 participants, which eventually dropped
to 22 by the end of the coding process. On average, I collected approximately 30
hours of video per study participant, for a total of 660 video hours from the 22
participants whose data was sufficiently codable. Of those 660 video-hours, about
150 hours were forced to be discarded due to missing (environment or screen) capture
counterparts. (In other words, videos could only be effectively coded as pairs.)
Within the remaining 500 or so video-hours of data existed approximately 2500
instances of notification feedback, or 5 per hour (per participant) on average. And
of those 2500 feedback instances, 1302 were coded by observers in such a way as to
meet the criteria for designation as a “coded instance” to be included in the final
data set. Then, as I described earlier in this thesis, the data set that was considered
most robust for conducting an analysis was the NTA set, for which both observers
agreed on the value for the Notification Type variable.
Had attrition not occurred at any point in the flow diagram, the study would have
collected all 15 feedback instances per hour (on average and instead of only 5), and
the associated video pairs, for all 29 of the study’s original participants. This would
constitute 29 ∗ 30 = 870 hours of video and just over 13, 000 instances of notification
feedback, which is 36 times the amount of usable feedback that resulted.
In Figure 10.2, I focus on four specific areas of attrition and suggest likely solutions
to each one. To address the first area of attrition in the diagram (labeled 1: access
to stable, resource-light video capturing system will lead to limited video corruption
148

30 hrs video/participant = 660 video hours
500 hours of potentially usable videowith 5 feedback instances captured per hour
2500 total feedback instances
1302 coded feedback instances
361 NTA instances
Use of a more stable screen & environment capturing video tool
Potential Solutions
1
2
3
4
1
2
3 4
Capture of a larger proportion of incoming notifications
More advanced (for synchronization) video capture; better coder incentives
&
Are
as o
f Attr
ition
Figure 10.2: Specific areas of data attrition in Study 4 and some potential solutions to be adoptedin future studies.
and less of an effect on participants’ machines (some participants had to discontinue
recording due to system slowdown). Second (2 in the diagram), the ability to cap-
ture a larger proportion of feedback associated with incoming notifications would
likewise increase the amount of feedback ripe for coding. Capturing more feedback
may require more experimenter-initiated notifications and compliance oversight. By
enhancing the coding process in various ways (e.g., with more sophisticated video
capturing software to simplify content analysis and more desirable coder incentives),
the third and fourth areas of attrition in the diagram can be better optimized. The
third area is describing instances that were not coded effectively enough to use in the
final, coded data set; in most cases this was due to too little contextual information
having been coded (due to ambiguity in the videos or otherwise). The fourth area
of attrition accounts for observer disagreement and missing values.
One important aspect of attrition is data reliability. I have a number of ideas for
149
improving the reliability of observers’ data. First, with respect to personnel, none of
the observers I hired had any prior experience with content analysis. Hiring coders
with experience in text, video, or other prior coding projects could have allowed for
the potential of a deeper understanding of various aspects of the coding process.
Compliance may have also been an issue with observers. I scheduled periodic group
and individual meetings, so if someone had not met an agreed-upon milestone, it is
conceivable that he or she may have rushed to complete the required coding, leav-
ing missing values unnecessarily, or misinterpreting some aspect of the contextual
situation or notification message. It is possible that higher rates of payment, or
other incentivized measures, for observers may have motivated them to work more
diligently and in turn increased the reliability of their coded data. All of these po-
tential issues, however, are merely speculative, and it is possible (though I attempted
to avoid ambiguity by creating a highly objective set of coding criteria and guide-
lines for educated guessing) that ambiguity in the videos was the sole reason behind
inter-observer disagreement.
On the technical side, and as noted above, better video capturing software may
have led to a more stable set of videos having been captured (and thus more ex-
posure to participants’ individual environments on behalf of the observers). Many
of the files I had intended to include in the data set were found to be corrupted,
which was a severe limitation to observers’ access to participants’ daily routines. A
better scheme for video matching would also have been a major bonus; as it was,
observers were required to synchronize videos themselves, and it is conceivable that
two observers coding the same video pairs could have synchronized a pair of videos
discordantly. Finally, automation of some of the coding would have been useful; ob-
servers were coding a large number of variables, some of which could have potentially
150
been coded automatically (e.g., whether there were blinking task panes or a count of
the number of open applications). This would have spared the observers from having
to divide their concentration among so many variables, which may itself have played
a substantial role in observed coding disagreements.
10.2.2 Automated Notification Delivery
An original objective of Study 4 was to develop an end-to-end framework for
incorporating user feedback and contextual information into a predictive user model
that could determine the notification format most likely to elicit positive feedback
in future situations. With the limited data acquired in Study 4, and specifically the
small set of features that could be considered reliable and thus worthy of considering
for inclusion in a user model, I went so far as to describe the way that those features
would be included, and the subsequent results of their inclusion as such. Ideally
this analysis would be taken one step further, and not only could the ability to
estimate the effects of certain contextual situations on the probability of positive (or
negative) feedback be gained, but those values could in turn be used to predict the
best notification format to deliver in certain situations. This would either require
a more complex model that incorporates all of the notification formats available for
delivery, or that once the best format type (computer-based, in-person, or phone-
based) is selected (by choosing the type that maximizes the log odds of positive
feedback), there be a mechanism in place (i.e., an additional user model) to determine
which of those types is most appropriate to deliver. Note that in the simple model
that was learned for the Study 4 data that I collected, because there was shown to be
no interaction between Notification Type and any other model variable, the category
of notification estimated to be most desirable to a particular individual would not be
moderated by contextual information, and instead Notification Type would merely
151
be selected by way of the largest coefficient associated with the Notification Type
variable in a model that includes all types.
10.3 Future Research Directions
As I briefly noted above, I suspect that it would be quite useful to examine a
large set of in situ studies like Study 4, each one drilling down on a specific aspect of
context and studied over a longer period of time. One particularly interesting area
would be the assessment of feedback elicitation mechanisms themselves, especially
as a result of my finding that whether or not the feedback buttons were visible on
the computer screen was likely to have more of an effect on people’s preferences than
potentially any other aspect of context. This finding, of course, may have been an
artifact of data sparsity, but it would be a nice direction to explore nonetheless: if
people’s preferences are difficult to capture reflectively (because what people say is
not always, or even particularly strongly, correlated with what they actually do),
then understanding the best way to capture them reactively would be our only shot
as researchers interested in understanding the effects of context, and individuality,
on computer users’ notification delivery preferences.
Another potential direction for future research is the main result of the first phase
of Study 1, namely that notifications can be categorized by their relative levels of
annoyance, and/or intrusiveness. Studies can explore the potential bifurcation, or
continuum, of notification delivery formats, i.e., that notifications can be consid-
ered either highly intrusive or only moderately intrusive; or that there is a scale of
intrusiveness on which notification delivery formats reside. I began to study this
possibility by considering the categorization of notification delivery formats by their
method of delivery—over the phone, on the computer, or in person—and prelim-
152
inary results were positive: a user model considering notifications to fall into one
of these three categories was shown to have the highest predictive ability of any of
the models I considered. This type of categorization may better inform the devel-
opment of more sophisticated interactive tools that not only consider elements of
contextual information, and individuality, but also the combination of context and
notification intrusiveness level, in addition to individuality, in their decisions about
which notifications will be considered more desirable under which circumstances.
I must also return to a statement I made in the introduction to this dissertation
document, namely that
“[i]n this dissertation, in an attempt to model the ability of a machine
attempting to customize its interactions to the user input it receives, indi-
viduality is measured at the level of revealed preferences; I do not attempt
to understand the underlying individual differences that may also prove
themselves to be factors behind the stated notification preferences examined
here.”
I have essentially characterized “preferences” as a single, positive or negative response
to delivery of a notification. This process could admittedly be combining a number
of more nuanced preference measures into one. Among other notification studies,
in which performance was not the sole outcome under assessment, preferences were
measured in various ways, including as a combination of, among others, perceived
workload and perception of benefit [37]. In the context of my fourth study, however,
there was no simple way to elicit more than one aspect of “preference” without either
overwhelming participants or requiring that the study be run over a much longer
period of time. However, the idea that preferences are not as simply described as
with a single rating is another area worthy of future consideration.
153
I suggested above that automatic feature detection and assessment, and perhaps
even feature generation, would have been useful for mitigating the strain on observers
so that they could shrink their focus and concentrate more heavily on a smaller set
of contextual features. Complete automation may be even more desirable. However,
though for certain features automation is straightforward (e.g.,calculating numeric
features like the number of application panes, those that are blinking, a measure of
task switching, and more), it still seems very difficult to try and capture high-level
contextual features—like notification utility and task concentration requirements—
automatically.
Finally, I have always taken strong interest in the use of technology toward so-
cially responsible means. To date, researchers have been working to understand how
people with unique needs with respect to personal technology, e.g., individuals facing
cognitive or memory impairments, can be guided, unobtrusively, to go about their
daily routine successfully and independently. Understanding people’s preferences for
how this guidance would best be performed is an important component of this work,
especially considering the reasons posed for unimpaired individuals eschewing the
use of certain computerized tools as too cumbersome, or annoying. If people who do
not require the assistance are rejecting it, what would happen if people who needed
it did the same?
10.4 Contributions
A primary contribution of this research is the examination of context and its effects
on notification preferences across scenarios and domains. Reflective findings were
consistent in two regards: when people indicated, outside of experimentation, their
preferences for different types of notifications, certain notification formats considered
154

especially annoying or intrusive were actually reactively rated more positively than
other more reflectively-preferred types in some circumstances; and in the reflective
settings in which different contextual situations were examined, findings showed a
noticeable trend in the proportion of positive notification ratings from low-utility,
high attention-based settings to high-utility, low attention scenarios.
A corollary to this contribution is having sought to characterize and understand
the concept of context with respect to notifications in various settings; and having
conducted each study in a completely different manner from the others and with
results that may inform future studies involving preference elicitation with respect
to notifications. The idea that I believe is most provocative in this regard is that
while it may be exceedingly difficult to collect the large amounts of reliable contextual
data that I initially set out to acquire, the process of attempting to collect that data
has provided both a framework for moving forward with similar studies—including
having identified specific pitfalls and obstacles—and also an impetus to continue to
conduct such studies in the future.
The study framework I devised constitutes a second contribution, as a complete
methodology for studying notification preferences in a truly naturalistic setting.
Though some notifications were initiated by experimenters, and stricter compliance
was requested of participants at various points throughout deployment of the pri-
mary experiment (Study 4, described in Chapter VI), participants were most often
and on the whole in complete and sole control of what type of feedback they provided
to which types of incoming notifications. Unlike prior studies that either employed
artificial or Wizard-of-Oz techniques for notification delivery, e.g., [84] and [32], re-
spectively, or studied notifications in a less realistic laboratory setting, e.g., [37],
neither notification delivery nor participants’ setting was artificial in my full-blown
155
office study. My methodology, spanning Chapters VII and VIII and inclusive of
Chapter VI the study description, describes the protocol, software and hardware
that were employed for data collection, the requirements of study participants, the
process of turning raw video data into what all researchers hope will be a large and
reliable coded data set, and what I propose to be the best technique for analyzing
the acquired preference data.
An additional contribution is the recognition of a strong effect of individuality on
people’s preferences, across domains and contextual situations. Observations in the
initial three studies point to differences among individuals in their preferences both
across contexts and across notification delivery formats; and a statistical analysis of
the data acquired in the naturalistic setting of Study 4 further corroborated this claim
by showing that a model accounting for individuality among study participants (as
representative of a random sampling from the greater population of support center
engineers) was found to have significantly higher predictive ability than a model not
accounting for individuality.
The primary implications of my work are, first, that intrusiveness is not synony-
mous with undesirable or unacceptable but rather that while people may express
distaste for particular notification formats, this does not speak to their willingness—
and even desire—to receive such notifications on certain (e.g., urgent) occasions.
Second, people were found particularly consistent in their reflective preferences for
notification delivery, but those preferences were not always in line with preferences
elicited in a reactive setting. Whether the study of preferences in a reflective setting is
informative of in situ, reactive preferences thus remains open for further assessment.
A third implication is that there are a number of challenges associated with con-
ducting an exploratory study in a highly naturalistic setting. The methods em-
156
ployed in this dissertation, both for study design and data analysis, form the basis
of a methodological framework that will be useful to researchers conducting similar
studies in the future.
157

APPENDICES
158

APPENDIX A
Coding Protocol
159

Video Coding Instructions
Thank you for your interest in our study! Below is a description of the project and the data that has been collected. On the following page, instructions are laid out for working through the videos.
We are trying to understand what is occurring in someone’s environment when they respond to a notification. In our videos, in order to know when notifications are arriving, we created two on-screen feedback buttons (below) and asked our study participants – office workers in a technical support center – to use these buttons to provide positive or negative feedback ratings to each notification as it arrives.
The notification types we are interested in can be categorized as follows:
Face-to-face communication [F] – someone speaking aloud and/or approaching the participant’s desk
Mobile/cell phone call [C] – a call to the participant’s mobile phone
Desk phone call [D] – a call to the participant’s desk phone (note there may be more than one phone)
Instant message [IM] – any type of real-time, synchronous communication (e.g., via MSN, AOL, etc.)
On-screen Reminder [R] – a reminder for an event scheduled in the participant’s calendar
E-mail Notification [EN] – an email pop-up in the lower right-hand corner of the screen (AKA “toast”)
E-mail itself [E] – an email message in the participant’s inbox
Text Message [T] – a text message on the participant’s mobile phone
Other message [O] – any other message that may be rated using the feedback buttons provided
As part of the process of attaining user feedback, we captured videos of each participant’s computer screen as he or she worked, and we also captured a video of whatever was facing that individual’s computer screen (ordinarily the individual him or herself, and sometimes other colleagues). The screen-based videos are called “Screen Capture” videos, and the video of whatever is facing the computer is called “Video Capture” videos. Both types of videos are encoded in .wmv format.
Your goal, as a video coder, is to work through the videos in a systematic manner and indicate on a spreadsheet that will be provided which features of a participant’s on-screen and off-screen environment are present at the time a notification arrives. Please read the instructions on the following page and feel free to ask the study team member any questions you may have regarding this process.
Please remember that the information in these videos is highly confidential, so do not distribute or discuss their contents with anyone aside from the study team members.
Refer to the FAQs at www.eecs.umich.edu/~weberjs/videocoding.html, or send any questions to Julie at [email protected].
160
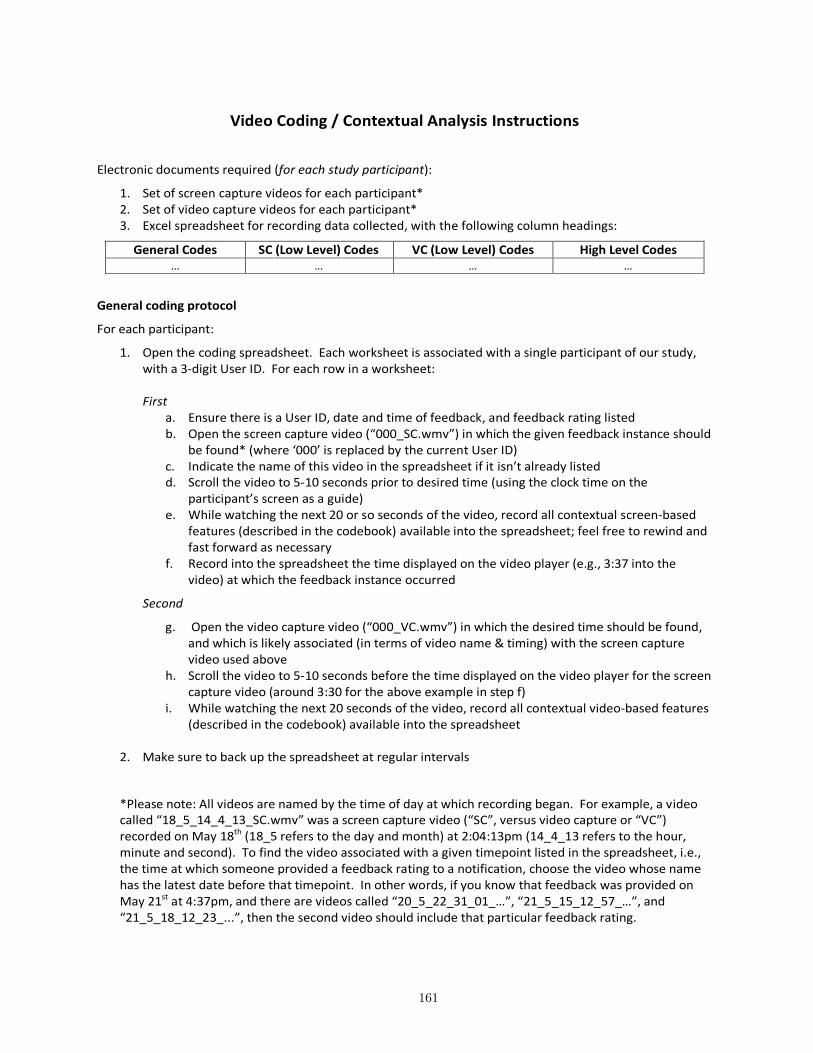
Video Coding / Contextual Analysis Instructions
Electronic documents required (for each study participant):
1. Set of screen capture videos for each participant* 2. Set of video capture videos for each participant* 3. Excel spreadsheet for recording data collected, with the following column headings:
General Codes SC (Low Level) Codes VC (Low Level) Codes High Level Codes … … … …
General coding protocol
For each participant:
1. Open the coding spreadsheet. Each worksheet is associated with a single participant of our study, with a 3-digit User ID. For each row in a worksheet: First
a. Ensure there is a User ID, date and time of feedback, and feedback rating listed b. Open the screen capture video (“000_SC.wmv”) in which the given feedback instance should
be found* (where ‘000’ is replaced by the current User ID) c. Indicate the name of this video in the spreadsheet if it isn’t already listed d. Scroll the video to 5-10 seconds prior to desired time (using the clock time on the
participant’s screen as a guide) e. While watching the next 20 or so seconds of the video, record all contextual screen-based
features (described in the codebook) available into the spreadsheet; feel free to rewind and fast forward as necessary
f. Record into the spreadsheet the time displayed on the video player (e.g., 3:37 into the video) at which the feedback instance occurred
Second
g. Open the video capture video (“000_VC.wmv”) in which the desired time should be found, and which is likely associated (in terms of video name & timing) with the screen capture video used above
h. Scroll the video to 5-10 seconds before the time displayed on the video player for the screen capture video (around 3:30 for the above example in step f)
i. While watching the next 20 seconds of the video, record all contextual video-based features (described in the codebook) available into the spreadsheet
2. Make sure to back up the spreadsheet at regular intervals
*Please note: All videos are named by the time of day at which recording began. For example, a video called “18_5_14_4_13_SC.wmv” was a screen capture video (“SC”, versus video capture or “VC”) recorded on May 18th (18_5 refers to the day and month) at 2:04:13pm (14_4_13 refers to the hour, minute and second). To find the video associated with a given timepoint listed in the spreadsheet, i.e., the time at which someone provided a feedback rating to a notification, choose the video whose name has the latest date before that timepoint. In other words, if you know that feedback was provided on May 21st at 4:37pm, and there are videos called “20_5_22_31_01_…”, “21_5_15_12_57_…”, and “21_5_18_12_23_...”, then the second video should include that particular feedback rating.
161

APPENDIX B
Non-Disclosure Agreement
162

Video Coder Non-Disclosure Agreement NOTIFICATIONS IN THE WORKPLACE
Principal Investigator: Julie S. Weber, M.S., Graduate Student, Department of Electrical
Engineering and Computer Science, University of Michigan
Faculty Advisor: Martha E. Pollack, Ph.D., School of Information, University of Michigan
You have agreed to participate in the video coding portion of a research study about computerized
notifications and the user environment.
As part of the video coding process, you will be watching videos and noting information regarding
certain elements of the videos, all of which will be explained in a separate document. To keep our
information safe, all of the videos, and your notes and analysis, must be stored on a password protected
hard drive to be kept in the possession of you, the analyst, at all times. Preliminary video data that is
provided on a flash drive must also be kept solely in your possession and returned to the principal
investigator no later than one week after you receive it.
You are also required to keep the information in all videos completely confidential, precluding you from
both watching the videos in public spaces and discussing any aspect of the material within the videos
with anyone but the researchers listed above. Once the study is complete, this video data must be
returned to the principal investigator of this study to be destroyed. We plan to keep the study data and
its analysis, but not the videos, indefinitely for future research.
You will be compensated monetarily, on an hourly basis, for your assistance. Compensation will be
based on training, experience, and accuracy of analysis and will amount to approximately $10 per hour.
If you have any questions about this research, you can contact Julie S. Weber, M.S., University of
Michigan, Department of Electrical Engineering and Computer Science, 2260 Hayward Rd, Ann Arbor,
MI 48109, 518 281-8253, [email protected].
By signing this document, you are agreeing to strictly adhere to the guidelines listed above, namely to
maintain sole possession of any study data you are provided and to keep that data safe and secure at all
times, including the avoidance of verbal or non-verbal discussion or distribution of any aspect of the
videos and data, even once your participation is completed. You will be provided a copy of this
document for your records, and one copy will be kept with the study records. Be sure that any questions
you have about the study and/or coding process have been answered and that you understand what you
are being asked to do. You may contact the researcher at any time if you think of any further questions.
I agree to adhere to all of the guidelines described in this document.
_____________________________________ ____________________
Signature Date
_____________________________________ ____________________
Signature of Principal Investigator Date
163
APPENDIX C
Code Book
164
This codebook provides a detailed description of each code that we plan to use in analysis of the information found within our videos. On the last page of this booklet, after the detailed definitions of our codes, there is a two-page table summarizing each individual code. This can be used as a companion manual to the coding spreadsheet. Codes, descriptions and examples The following list of codes introduces each code by name and associated abbreviation – for the sake of efficiency, the coding spreadsheet will list each code in its abbreviated form. General codes: USER ID [USER_ID] 3-digit number The 3-digit number assigned to each study participant. This can be found in the title of the feedback file (i.e., the 111 in “Feedback_111.txt”), or at the end of the video files, which include date and time information, followed by the 3-digit ID number, followed by the extension “.wmv” at the end. DATE OF FEEDBACK INSTANCE [DATE_OF_FEEDBACK] DD:MM:YYYY The month, day, and year of each positive or negative feedback instance – this can be directly copied from the “Feedback_111.txt” file (replacing “111” with the current user ID). TIME OF FEEDBACK INSTANCE [TIME_OF_FEEDBACK] HH:MM:SS AM/PM The hour, minute and second of each positive or negative feedback instance – this can be directly copied from the “Feedback_111.txt” file (replacing “111” with the current user ID). FEEDBACK_RATING Positive, Negative Whether the notification was provided a positive or negative feedback rating. SCREEN CAPTURE VIDEO NAME [SC_NAME] Name The name of the screen capture video file. The filename should begin with “SC” and end with the extension “.wmv” TIME OF FEEDBACK INSTANCE IN SCREEN CAPTURE VIDEO [SC_TIME] HH:MM:SS The time in the screen capture video file at which the current feedback instance occurs. [Note: This should be the amount of elapsed time in the video at which the participant is observed to provide feedback. This value should not be calculated based on the name of the video file and the time of feedback indicated in the “Feedback_111.txt” (e.g., the current participant’s) file, because certain numbers are approximate, so using elapsed time will most help to ensure synchronization with the video capture file. Furthermore, some videos skip such that the time on the participant’s screen no longer matches up with the supposed time of screen capture, according to the name of the video file.]
165

VIDEO CAPTURE VIDEO NAME [VC_NAME] Name The name of the video capture video file. The filename should begin with “VC” and end with the extension “.wmv” TIME OF FEEDBACK INSTANCE IN VIDEO CAPTURE VIDEO [VC_TIME] HH:MM:SS The time elapsed in the video capture video file at which point the current feedback instance occurs. This can be estimated based on the SC_TIME value, but this estimation should coincide with the participant’s face, or arm movements, indicating a click of the mouse on one of the feedback buttons on the screen. Alternatively, this value can be estimated by the SC_TIME value and then confirmed by coincident sounds between videos. Codes for Screen Capture videos: NOTIFICATION TYPE [NOTIF_TYPE] Face-to-face communication [F], Mobile/cell phone call [C], Desk phone call [D], Instant message [IM], on-screen Reminder [R], E-mail Notification [EN], E-mail itself [E], Text Message [T], or Other message [O]. The type of notification being delivered and to which the current feedback instance refers. If the type of notification is ever ambiguous, we will consider the most recent mode of communication to be the notification that is rated. Example: If the participant receives an email notification immediately followed by a tap on the shoulder, and he proceeds to chat with whoever tapped him, after which he issues positive feedback, we will consider this feedback a response to the face-to-face notification only. If, instead, in the situation above, the participant issues two feedback instances after his chat, the first instance of feedback should refer to the email notification and the second should be associated with the face-to-face notification. SENDER Name of the person initiating the current notification instance This should be known in the case of an email notification, an email message, an instant message, an event reminder, and perhaps a phone call or face-to-face notification (should the participant pronounce the caller’s or individual’s name aloud during the first 2 minutes of conversation). Even a first name, if that is all that is available, will be useful for this field. TOPIC Work-related (W), Personal (P), Experimenter-Initiated (E) The topic of the event that is the subject of the notification. Any activity that occurs within the workplace (including lunch in the cafeteria) is considered a work-related event, but an event outside of the workplace that is not directly a work-sponsored activity (even with other office colleagues) should be considered personal. If the notification was sent by the experimenter (Julie) herself, then this would fall into category “E” for experimenter-initiated. If the topic is difficult to categorize because names or places are unfamiliar, please use a “?” here; otherwise, if there seems to be no way to determine whether the topic is work-related or personal, please leave this field blank.
166

NUMBER OF NOTIFICATION RECIPIENTS [NUM_RECIP] 0, 1, …, ? The number of people that receive this notification, including the participant him-/herself. If it is unclear what this number is, because the notification is delivered to a list of unknown length, or because it is broadcast aloud to an unknown number of people, or if the notification is in text message form, please use a “?” in this field. PARTICIPANT IS ONE OF THE PRIMARY NOTIFICATION RECIPIENTS [PRIM_RECIP] True, False This value should be “True” only if it is clear that this notification was directed toward the participant him-/herself. In the case of an email, this requires the recipient to be in the primary list of recipients and not a carbon copy list. TIME OF NOTIFIED EVENT [EVENT_TIME] Month:Day:Hour:Minute The date and time information about the event that is the subject of the notification. If this is unknown, then the field can be left blank. NUMBER OF APPLICATION WINDOWS VISIBLE ON DESKTOP [VIS_APPS] 1, 2, 3… This field represents the number of application windows visible on the participant’s computer screen at the time at which a positive or negative feedback button is clicked to register the current feedback instance. Application windows that are completely occluded by others are not considered visible, because they cannot be seen. If the application window within which the participant is currently working is maximized, there should be only one (1) application considered visible. Otherwise, if other windows are also visible (including error windows, installation windows, confirmation dialogs, etc.), then the VIS_APPS value should represent the total number of these visible windows. NUMBER OF APPLICATION PANES ON THE TASKBAR [APP_PANES] 1, 2, 3… This field records the number of applications stored in the task bar (usually visible at the bottom of the screen and indicating all of the applications that are open, regardless of whether they are maximized, minimized, visible or occluded). The value should include blinking and non-blinking applications, as well as other windows that may represent an unknown type of application. This field is merely requesting a count of the number of panes in the taskbar. However, if there are multiple instances of a single application running, then the number of instances should be counted rather than just the application. For example, if someone is running two Internet Explorer browser windows, this would count as 2 application panes (even if they are pictured as one pane on the taskbar). When multiple instances of an application are running, this will be indicated, on Windows 7 machines, by layered application panes on the taskbar, and in older operating systems by way of a number. Please see diagrams below for examples.
In Windows XP, panes on the taskbar will indicate the number of applications of each type that are open, using a
number to the left of the application name. Above, we see that there are 12 open Notepad instances.
167

In Windows 7, panes on the taskbar will indicate the number of applications of each type that are open, by
showing multiple instances layered on top of one another. Above, we see that there are 2 open Excel instances.
NUMBER OF APPLCIATIONS THAT ARE CHATS [NUM_CHATS] 0, 1, 2… This field records the number of application panes in the taskbar that are associated with an instant messaging service, such as AOL, Microsoft Communicator, MSN Messenger, Google Chat, ICQ, and any others. Please be sure to check for different types of instant messaging services, because it is often the case that many services are used simultaneously. NUMBER OF CHAT WINDOWS BLINKING [BLINK_CHATS] 0, 1, 2… Similar to the number of chat applications above, this field is counting the number of active chat windows by considering those that are blinking, which represents a message waiting to be read. In order to be considered a “blinking chat,” a chat window must have changed color to indicate a message within the 2-second window surrounding the time the participant provided feedback. PARTICIPANT IS IN AN INSTANT MESSAGE CONVERSATION [CONVER_IM] True, False This field should be “True” if the participant moved directly from having his or her cursor inside a chat window to either acknowledging the notification or clicking on a positive or negative feedback button to register the current feedback instance. This field should not be “True” just because one or more chat windows are blinking. PARTICIPANT RESPONDED TO THE NOTIFICATION IMMEDIATELY [IMMED] True, False If the participant addressed a notification immediately upon its receipt (within 2 seconds), then he or she is considered interrupted by the notification. Addressing a notification consists of, for a phone call, picking up the phone within 2 seconds of it ringing; for an instant message, placing the cursor in the message field within 2 seconds of new message arrival; for an email notification, clicking on or closing it within 2 seconds of it arriving, etc. PARTICIPANT WAS MULTITASKING [MULTITASK] True, False This field should be “True” if, over the last minute, the participant used more than one single application window. Otherwise, if the same window has been open for a full minute or more prior to the notification being received, the value of this field should be “False”. FEEDBACK BUTTONS ARE VISIBLE ON THE COMPUTER SCREEN [BUTTONS_VIS] True, False If there is at least one of the two red and green (thumbs down/thumbs up, negative/positive) feedback buttons visible on the participant’s computer screen, then this field’s value should be “True”; otherwise, if neither button is visible but only available from the taskbar, then the field should be labeled “False”. In other words, if the participant had
168
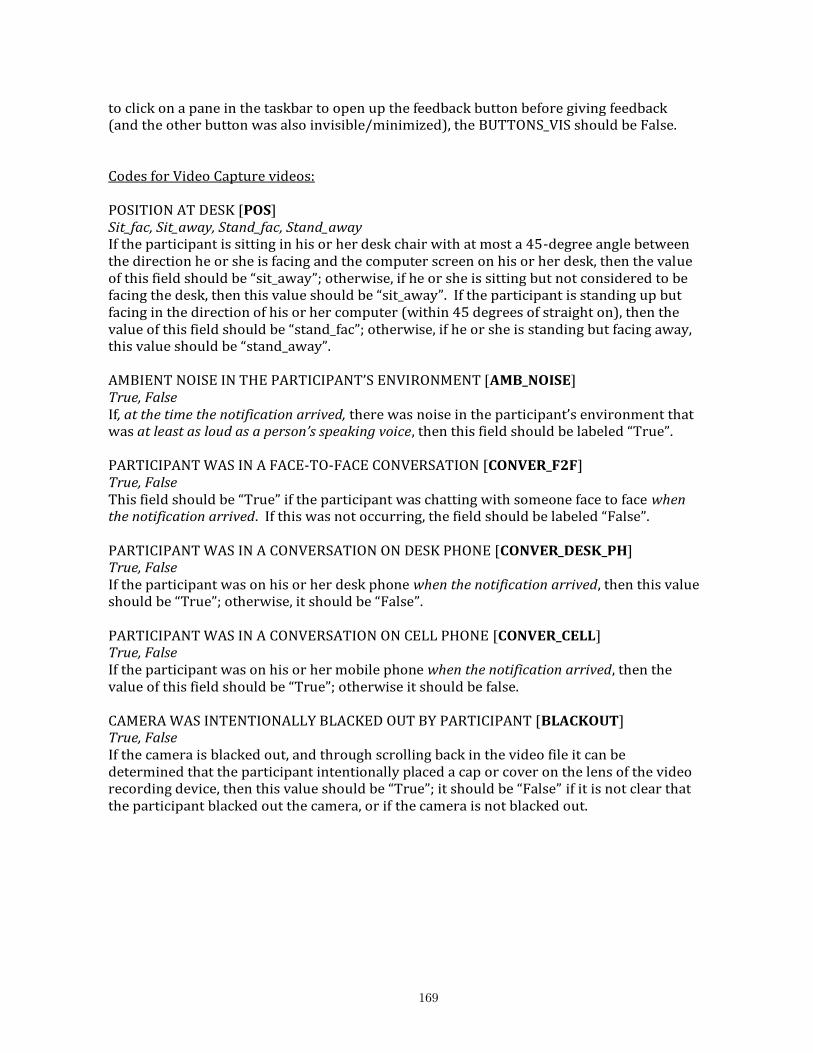
to click on a pane in the taskbar to open up the feedback button before giving feedback (and the other button was also invisible/minimized), the BUTTONS_VIS should be False. Codes for Video Capture videos: POSITION AT DESK [POS] Sit_fac, Sit_away, Stand_fac, Stand_away If the participant is sitting in his or her desk chair with at most a 45-degree angle between the direction he or she is facing and the computer screen on his or her desk, then the value of this field should be “sit_away”; otherwise, if he or she is sitting but not considered to be facing the desk, then this value should be “sit_away”. If the participant is standing up but facing in the direction of his or her computer (within 45 degrees of straight on), then the value of this field should be “stand_fac”; otherwise, if he or she is standing but facing away, this value should be “stand_away”. AMBIENT NOISE IN THE PARTICIPANT’S ENVIRONMENT [AMB_NOISE] True, False If, at the time the notification arrived, there was noise in the participant’s environment that was at least as loud as a person’s speaking voice, then this field should be labeled “True”. PARTICIPANT WAS IN A FACE-TO-FACE CONVERSATION [CONVER_F2F] True, False This field should be “True” if the participant was chatting with someone face to face when the notification arrived. If this was not occurring, the field should be labeled “False”. PARTICIPANT WAS IN A CONVERSATION ON DESK PHONE [CONVER_DESK_PH] True, False If the participant was on his or her desk phone when the notification arrived, then this value should be “True”; otherwise, it should be “False”. PARTICIPANT WAS IN A CONVERSATION ON CELL PHONE [CONVER_CELL] True, False If the participant was on his or her mobile phone when the notification arrived, then the value of this field should be “True”; otherwise it should be false. CAMERA WAS INTENTIONALLY BLACKED OUT BY PARTICIPANT [BLACKOUT] True, False If the camera is blacked out, and through scrolling back in the video file it can be determined that the participant intentionally placed a cap or cover on the lens of the video recording device, then this value should be “True”; it should be “False” if it is not clear that the participant blacked out the camera, or if the camera is not blacked out.
169

High-level features: In some cases, we are actually interested in knowing what you as the coder believe to be the values of certain features associated with notification delivery. We are particularly interested in whether you believe that a notification is important (or not very important) to a participant, and whether that notification is urgent (or not urgent). And we would also like to know whether you’d consider the task the participant is performing when the notification arrives to be a task that requires a lot of that individual’s attention. Because Importance and Urgency can easily be confused, please keep in mind the following notes:
An important notification may, for example, come from a superior, like a boss or manager
An urgent notification would be one that requires immediate response An important notification need not be urgent, e.g., your boss reschedules next week’s
meeting for three weeks from now – this is important but not urgent, as there are three weeks until the meeting
An urgent notification need not be important: your colleagues may remind you that the cafeteria is closing in a minute and you’ll all need to race there to make it in time – this is urgent but not important, especially if you packed your own lunch!
IMPORTANT True, False Do you believe that the participant would consider this an important notification? URGENT True, False Do you as the coder believe that the participant would consider this an urgent notification? HIGH_ATTENTION True, False Do you as the coder believe that the participant would consider him-/herself to be performing a task that requires his or her complete attention?
170
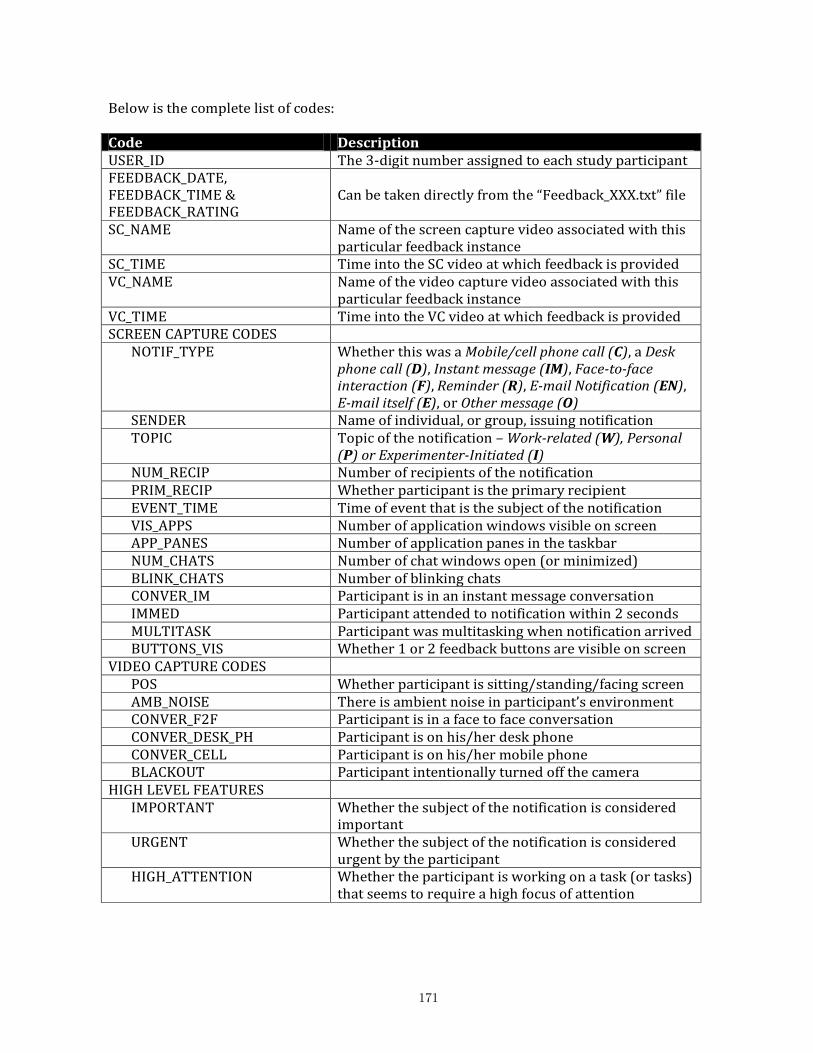
Below is the complete list of codes: Code Description USER_ID The 3-digit number assigned to each study participant FEEDBACK_DATE, FEEDBACK_TIME & FEEDBACK_RATING
Can be taken directly from the “Feedback_XXX.txt” file
SC_NAME Name of the screen capture video associated with this particular feedback instance
SC_TIME Time into the SC video at which feedback is provided VC_NAME Name of the video capture video associated with this
particular feedback instance VC_TIME Time into the VC video at which feedback is provided SCREEN CAPTURE CODES
NOTIF_TYPE Whether this was a Mobile/cell phone call (C), a Desk phone call (D), Instant message (IM), Face-to-face interaction (F), Reminder (R), E-mail Notification (EN), E-mail itself (E), or Other message (O)
SENDER Name of individual, or group, issuing notification TOPIC Topic of the notification – Work-related (W), Personal
(P) or Experimenter-Initiated (I) NUM_RECIP Number of recipients of the notification PRIM_RECIP Whether participant is the primary recipient EVENT_TIME Time of event that is the subject of the notification VIS_APPS Number of application windows visible on screen APP_PANES Number of application panes in the taskbar NUM_CHATS Number of chat windows open (or minimized) BLINK_CHATS Number of blinking chats CONVER_IM Participant is in an instant message conversation IMMED Participant attended to notification within 2 seconds MULTITASK Participant was multitasking when notification arrived BUTTONS_VIS Whether 1 or 2 feedback buttons are visible on screen
VIDEO CAPTURE CODES POS Whether participant is sitting/standing/facing screen AMB_NOISE There is ambient noise in participant’s environment CONVER_F2F Participant is in a face to face conversation CONVER_DESK_PH Participant is on his/her desk phone CONVER_CELL Participant is on his/her mobile phone BLACKOUT Participant intentionally turned off the camera
HIGH LEVEL FEATURES IMPORTANT Whether the subject of the notification is considered
important URGENT Whether the subject of the notification is considered
urgent by the participant HIGH_ATTENTION Whether the participant is working on a task (or tasks)
that seems to require a high focus of attention
171

Notes for coding:
Both videos can be watched simultaneously in different players or players that support
multiple instances (which, unfortunately, Windows Media Player does not).
When searching through a video, I’ve found it easiest to find the approximate notification
point and play the video on double speed from one to two minutes prior to the desired spot.
Then, to get any relevant information that may have been missed, use the rewind button
and play at regular speed.
172

APPENDIX D
Preference Data Evolution through Imputation
173
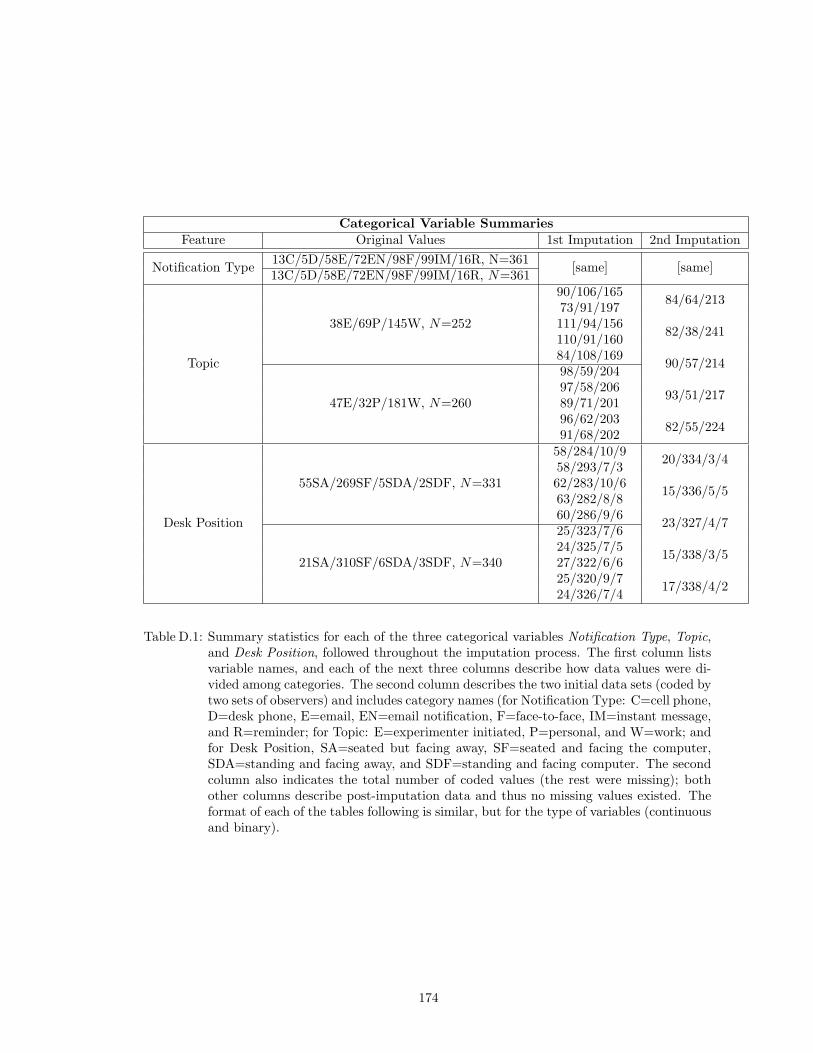
Categorical Variable SummariesFeature Original Values 1st Imputation 2nd Imputation
Notification Type 13C/5D/58E/72EN/98F/99IM/16R, N=361 [same] [same]13C/5D/58E/72EN/98F/99IM/16R, N=361
Topic
38E/69P/145W, N=252
90/106/165 84/64/21373/91/197111/94/156 82/38/241110/91/16084/108/169 90/57/214
47E/32P/181W, N=260
98/59/20497/58/206 93/51/21789/71/20196/62/203 82/55/22491/68/202
Desk Position
55SA/269SF/5SDA/2SDF, N=331
58/284/10/9 20/334/3/458/293/7/362/283/10/6 15/336/5/563/282/8/860/286/9/6 23/327/4/7
21SA/310SF/6SDA/3SDF, N=340
25/323/7/624/325/7/5 15/338/3/527/322/6/625/320/9/7 17/338/4/224/326/7/4
Table D.1: Summary statistics for each of the three categorical variables Notification Type, Topic,and Desk Position, followed throughout the imputation process. The first column listsvariable names, and each of the next three columns describe how data values were di-vided among categories. The second column describes the two initial data sets (coded bytwo sets of observers) and includes category names (for Notification Type: C=cell phone,D=desk phone, E=email, EN=email notification, F=face-to-face, IM=instant message,and R=reminder; for Topic: E=experimenter initiated, P=personal, and W=work; andfor Desk Position, SA=seated but facing away, SF=seated and facing the computer,SDA=standing and facing away, and SDF=standing and facing computer. The secondcolumn also indicates the total number of coded values (the rest were missing); bothother columns describe post-imputation data and thus no missing values existed. Theformat of each of the tables following is similar, but for the type of variables (continuousand binary).
174

Continuous Variable SummariesFeature Original Values 1st Imputation 2nd Imputation
# Recipients
{1,15}, 1.21 (1.28), N=267
{1,15}, 1.25 (1.51) {1,15}, 1.06 (0.77){1,15}, 1.22 (1.36){1,15}, 1.21 (1.15) {1,15}, 1.05 (0.77){1,15}, 1.17 (1.12){1,15}, 1.22 (1.34) {1,15}, 1.09 (1.06)
{1,20}, 1.88 (3.20), N=313
{1,20}, 1.86 (3.14){1,20}, 1.98 (3.41) {1,15}, 1.06 (0.77){1,20}, 1.88 (3.21){1,20}, 1.90 (3.26) {1,15}, 1.05 (0.77){1,20}, 1.88 (3.20)
# Visible Apps
{1,10}, 1.90 (1.13), N=332
{1,10}, 1.91 (1.14) {1,5}, 1.50 (0.90){1,10}, 1.89 (1.11){1,10}, 1.89 (1.12) {1,5}, 1.48 (0.86){1,10}, 1.91 (1.13){1,10}, 1.91 (1.13) {1,5}, 1.44 (0.84)
{1,5}, 1.52 (0.87), N=331
{1,5}, 1.52 (0.87){1,5}, 1.51 (0.86) {1,5}, 1.49 (0.87){1,5}, 1.51 (0.87){1,5}, 1.52 (0.87) {1,5}, 1.49 (0.86){1,5}, 1.52, (0.87)
# App Panes
{2,127}, 17.77 (11.7), N=358
{2,127}, 17.76 (11.6) {5,48}, 17.18 (9.11){2,127}, 17.81 (11.6){2,127}, 17.71 (11.6) {5,48}, 17.54 (9.04){2,127}, 17.73 (11.7){2,127}, 17.75 (11.7) {5,48}, 16.91 (8.92)
{2,118}, 17.99 (11.3), N=359
{2,118}, 17.97 (11.3){2,118}, 17.94 (11.3) {5,48}, 17.05 (8.82){2,118}, 17.95 (11.3){2,118}, 18.01 (11.3) {5,48}, 17.37 (9.12){2,118}, 18.09, (11.4)
# Chat Windows
{0,26}, 2.75 (4.15), N=359
{0,26}, 2.75, 4.15 {0,21}, 2.36 (3.81){0,26}, 2.76 (4.14){0,26}, 2.75 (4.15) {0,21}, 2.43 (3.99){0,26}, 2.75 (4.15){0,26}, 2.74 (4.15) {0,21}, 2.34 (3.71)
{0,21}, 2.23 (3.47) N=359
{0,21}, 2.25 (3.52){0,21}, 2.23 (3.47) {0,21}, 2.40 (3.85){0,21}, 2.22 (3.47){0,21}, 2.22 (3.47) {0,21}, 2.30 (3.69){0,21}, 2.22 (3.46)
Table D.2: Summary statistics for each continuous variable throughout the imputation process. Thetwo numbers in brackets describe low and high values (e.g., the lowest value coded forthe number of Application Panes was 2 and the highest was 127 for the first observer set,and 118 for the second). Bolded numbers represent the mean value, and in parenthesesthe standard deviation. Again “N” describes the number of coded values in the twooriginal coded data sets upon being turned in by observers, and N is missing in the lasttwo columns, because they both describe data after an imputation process has renderedeach data set complete.
175

Binary Variable SummariesFeature Original Values 1st Imputation 2nd Imputation
Primary Recipient
60/241, N=301
107/254 48/31395/266106/255 46/315107/254110/251 63/298
16/301, N=317
26/33530/331 59/30230/33127/334 60/30131/330
Blinking Panes
333/26, N=359
335/26 342/19335/26335/26 346/15335/26335/26 339/22
336/23, N=359
338/23338/23 346/15338/23338/23 344/17337/24
IM Conversation
298/61, N=359
300/61 311/50299/62299/62 318/43299/62300/61 322/39
320/39, N=359
321/40321/40 318/43320/41322/39 321/40322/39
Immed. Response
114/233, N=347
122/239 83/278120/241117/244 59/302119/242121/240 49/312
75/268, N=343
78/28378/283 71/29078/28378/283 59/30280/281
Table D.3: Summary statistics for each binary variable throughout the imputation process. Thefirst element of the two summary values describes the number of “False” occurrences,and the second number represents “True”—as an example, in the first data set, therewere thought to be Blinking Panes in the task bar upon receipt of 26 notifications, andin 333 instances nothing was blinking when the notification arrived.
176
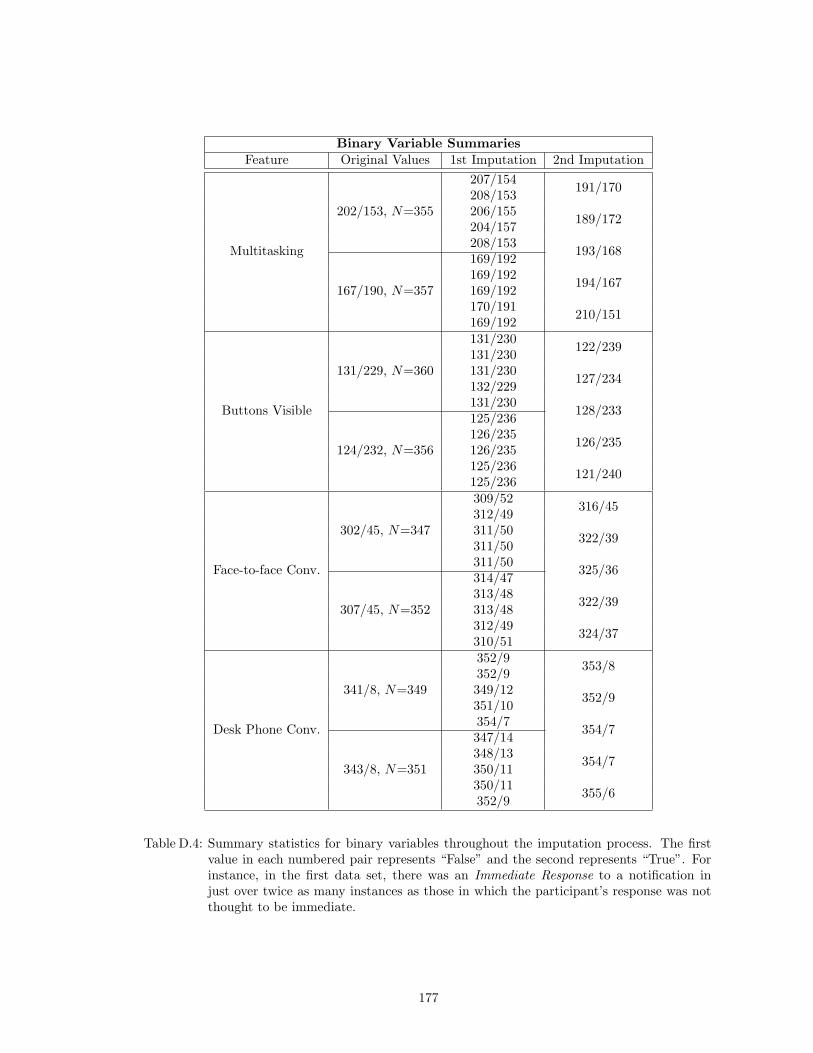
Binary Variable SummariesFeature Original Values 1st Imputation 2nd Imputation
Multitasking
202/153, N=355
207/154 191/170208/153206/155 189/172204/157208/153 193/168
167/190, N=357
169/192169/192 194/167169/192170/191 210/151169/192
Buttons Visible
131/229, N=360
131/230 122/239131/230131/230 127/234132/229131/230 128/233
124/232, N=356
125/236126/235 126/235126/235125/236 121/240125/236
Face-to-face Conv.
302/45, N=347
309/52 316/45312/49311/50 322/39311/50311/50 325/36
307/45, N=352
314/47313/48 322/39313/48312/49 324/37310/51
Desk Phone Conv.
341/8, N=349
352/9 353/8352/9349/12 352/9351/10354/7 354/7
343/8, N=351
347/14348/13 354/7350/11350/11 355/6352/9
Table D.4: Summary statistics for binary variables throughout the imputation process. The firstvalue in each numbered pair represents “False” and the second represents “True”. Forinstance, in the first data set, there was an Immediate Response to a notification injust over twice as many instances as those in which the participant’s response was notthought to be immediate.
177

Binary Variable SummariesFeature Original Values 1st Imputation 2nd Imputation
Mobile Conversation
343/6, N=349
354/7 355/6352/9349/12 355/6354/7354/7 356/5
339/10, N=349
348/13347/14 356/5348/13345/16 355/6347/14
Blackout
333/4, N=337
352/9 358/3348/13354/7 356/5349/12350/11 356/5
348/7, N=355
353/8353/8 354/7352/9352/9 357/4353/8
Important
194/142, N=336
198/163 213/148203/158196/165 229/132197/164200/161 213/148
188/159, N=347
191/170196/165 225/136192/169190/171 198/163194/167
High Attention
285/49, N=334
305/56 325/36308/53306/55 336/25305/56309/52 332/29
279/62, N=341
293/68291/70 341/20293/68293/68 343/18292/69
Table D.5: Summary statistics for binary variables throughout the imputation process. Like thetwo preceding tables, the first value in each summary-pair represents “False” (as in,in 4 cases there was no Blackout), and the second value indicates those instances thatobservers coded as “True”.
178

BIBLIOGRAPHY
179
BIBLIOGRAPHY
[1] Piotr D. Adamczyk and Brian P. Bailey. If not now, when?: the effects of interruption atdifferent moments within task execution. In CHI ’04: Proceedings of the SIGCHI conferenceon Human factors in computing systems, pages 271–278, New York, NY, USA, 2004. ACM.
[2] Hirotugu Akaike. A new look at the statistical model indentification. IEEE Transactions onAutomatic Control, 19(6):716–723, 1974.
[3] Paul D. Allison. Missing data. SAGE University Papers Series: Quantitative Applications inthe Social Sciences, 136, 2002.
[4] Ernesto Arroyo, Ted Selker, and Alexandre Stouffs. Interruptions as multimodal outputs:Which are the less disruptive? IEEE International Conference on Multimodal Interfaces,2002.
[5] R. Artstein and M. Poesio. Inter-coder agreement for computational linguistics. ComputationalLinguistics, 34(4):555–596, 2008.
[6] Lyn Bartram, Colin Ware, and Tom Calvert. Moving icons: detection & distraction. InInteract, 2001.
[7] Vincent Bazinette, Norman H. Cohen, Maria R. Ebling, Guerney D. H. Hunt, Hui Lei, ApratimPurakayastha, Gregory Stewart, Luke Wong, and Danny L. Yeh. An intelligent notificationsystem. Technical report, IBM Research, June 2001.
[8] Michael Beigl. Memoclip: A location-based remembrance appliance. Personal & UbiquitousComputing, 2000.
[9] Michael Beigl, Tobias Zimmer, and Christian Decker. A location model for communicatingand processing of context. Personal & Ubiquitous Computing, 6:341–357, 2002.
[10] D. R. Benyon. Accomodating individual differences through an adaptive user interface. Adap-tive User Interfaces—Results and Prospects, 1993.
[11] Saurabh Bhatia and Scott McCrickard. Listening to your inner voices: investigating means forvoice notifications. In CHI ’06: Proceedings of the SIGCHI conference on Human Factors incomputing systems, pages 1173–1176, New York, NY, USA, 2006. ACM.
[12] Adam Bodnar, Richard Corbett, and Dmitry Nekrasovski. Aroma: ambient awareness througholfaction in a messaging application. In ICMI ’04: Proceedings of the 6th international con-ference on Multimodal interfaces, pages 183–190, New York, NY, USA, 2004. ACM.
[13] Jennifer Boger, Pascal Poupart, Jesse Hoey, Craig Boutilier, Geff Fernie, and Alex Mihailidis.A decision-theoretic approach to task assistance for persons with dementia. In Proceedings ofIJCAI, 2005.
[14] Andrea Bunt, Cristina Conati, and Joanna McGrenere. Supporting interface customizationusing a mixed-initiative approach. In Proceedings of the International Conference on IntelligentUser Interfaces, 2007.
180

[15] Google Calendar. http://calendar.google.com, 2006.
[16] Matthew Chalmers. Informatics, Architecture & Language, in Designing Information Spaces:The Social Navigation Approach, chapter 13. Springer, 2003.
[17] Matthew Chalmers. A historical view of context. Computer Supported Cooperative Work,13:223–247, 2004.
[18] Cristina Conati and Heather Maclaren. Exploring the role of individual differences in infor-mation visualization. In AVI ’08: Proceedings of the working conference on Advanced visualinterfaces, pages 199–206, New York, NY, USA, 2008. ACM.
[19] Microsoft Corporation. Windows media encoder. www.microsoft.com/windows/windowsmedia.
[20] Microsoft Corporation. Microsoft word. [Copyrighted software], 2010.
[21] Edward; Mary Czerwinski Cutrell and Eric Horvitz. Notification, disruption, and memory:Effects of messaging interruptions on memory and performance. In Interact, 2001.
[22] M. Czerwinski, E. Cutrell, and E. Horvitz. Instant messaging: Effects of relevance and time.People and Computers XIV: Proceedings of HCI 2000, 2:71–76, 2000.
[23] Laura Dabbish and Robert E. Kraut. Controlling interruptions: awareness displays and socialmotivation for coordination. In CSCW ’04: Proceedings of the 2004 ACM conference onComputer supported cooperative work, pages 182–191, New York, NY, USA, 2004. ACM.
[24] Richard W. DeVaul, Alex ”Sandy” Pentland, and Vicka R. Corey. The memory glasses: Sub-liminal vs. overt memory support with imperfect information. In ISWC ’03: Proceedings ofthe 7th IEEE International Symposium on Wearable Computers, page 146, Washington, DC,USA, 2003. IEEE Computer Society.
[25] Anind K. Dey. Understanding and using context. Personal & Ubiquitous Computing, 5(1):4–7,2001.
[26] Anind K. Dey and Gregory D. Abowd. Cybreminder: A context-aware system for support-ing reminders. Second International Symposium on Handheld and Ubiquitous Computing,1927:172–226, 2000.
[27] Paul Dourish. What we talk about when we talk about context, volume 8. Springer-Verlag,London, UK, 2004.
[28] Satadip Dutta, D. Scott McCrickard, Swapneil Deshmukh, and Vincent Jouenne. Evaluatingbenefits and distractions of animated secondary displays for attention-centric primary tasks.In 2002 International Conference on Imaging Science, Systems, and Technology (CISST ’02),Las Vegas, NV, June 2002.
[29] Julian J. Faraway. Linear Models with R. Chapman & Hall/CRC, 2005.
[30] Feedreader. http://www.feedreader.com.
[31] Joseph L. Fleiss. Measuring nominal scale agreement among many raters. Psychological Bul-letin, 76:378–382, 1971.
[32] James Fogarty. Constructing and Evaluating Sensor-Based Statistical Models of Human Inter-ruptibility. PhD thesis, Carnegie Mellon University, January 2006.
[33] Krzysztof Gajos. Automatically Generating Personalized User Interfaces. PhD thesis, Univer-sity of Washington, 2008.
181
[34] Stavros Garzonis, Simon Jones, Tim Jay, and Eamonn O’Neill. Auditory icon and earconmobile service notifications: Intuitiveness, learnability, memorability and preference. In Pro-ceedings of CHI, pages 1513–1522, 2009.
[35] Sonja Gievska and John Sibert. Using task context variables for selecting the best timing forinterrupting users. In sOc-EUSAI ’05, pages 171–176, 2005.
[36] Jennifer Gluck. An investigation of the effects of matching attentional draw with utility incomputer-based interruption. Master’s thesis, University of British Columbia, 2006.
[37] Jennifer Gluck, Andrea Bunt, and Joanna McGrenere. Matching attentional draw with utilityin interruption. In Proceedings of CHI 2007, pages 41–50, 2007.
[38] Growl. http://growl.info, 2007.
[39] James A. Hanley and Barbara J. McNeil. The meaning and use of the area under a receiveroperating characteristic (roc) curve. Radiology, 143:29–36, 1982.
[40] Rebecca Hansson and Peter Ljungstrand. The reminder bracelet: subtle notification cues formobile devices. In CHI ’00 extended abstracts on Human factors in computing systems, pages323–324, New York, NY, USA, 2000. ACM.
[41] F. E. Harrell, R. M. Califf, D. B. Pryor, K. L. Lee, and R. A. Rosati. Evaluating the yield ofmedical tests. Journal of the American Medical Association, 247:2543–2546, 1982.
[42] Frank E. Harrell. Regression Modeling Strategies with Applications to Linear Models, LogisticRegression and Survival Analysis. Springer, 2001.
[43] S. G. Hart and L. E. Staveland. Development of NASA-TLX (Task Load Index): Results ofEmpirical and Theoretical Research. Elsevier Science, 1988. P. Hancock and N. Meshkati. eds.
[44] Andrew F. Hayes and Klaus Krippendorff. Answering the call for a standard reliability measurefor coding data. Communication Methods and Measures, 1(1):77–89, April 2007.
[45] Andrew F. Hayes, Michael D. Slater, and Leslie B. Snyer, editors. Advanced Data AnalysisMethods for Communication Research. SAGE Publications, 2008.
[46] Eric Horvitz, Paul Koch, and Johnson Apacible. Busybody: creating and fielding personalizedmodels of the cost of interruption. In CSCW ’04: Proceedings of the 2004 ACM conference onComputer supported cooperative work, pages 507–510, New York, NY, USA, 2004. ACM.
[47] Gary Hsieh, Karen P. Tang, Wai Yong Low, and Jason I. Hong. Field deployment of imbuddy:A study of privacy control and feedback mechanisms for contextual im. Ubiquitous Computing,4717:91–108, 2007.
[48] S. E. Hudson, J. Fogarty, C. G. Atkeson, D. Avrahami, J. Forlizzi, S. Kiesler, J.C. Lee, andJ. Yang. Predicting human interruptability with sensors: A wizard of oz feasibility study. InACM CHI, 2003.
[49] Stephen S. Intille, Emmanuel M. Tapia, John Rondoni, Jennifer Beaudin, Chuck Kukla, SitijAgarwal, Ling Bao, and Kent Larson. Tools for studying behavior and technology in naturalsettings. In UbiComp: Ubiquitous Computing, 2003.
[50] Shamsi T. Iqbal and Brian P. Bailey. Effects of intelligent notification management on usersand their tasks. In Proceedings of the ACM Conference on Human Factors in ComputingSystems (CHI 2008), Florence, Italy, 2008.
[51] Richard Jordan and HawkInnovations. The ebay watcher.
182
[52] Angela Kessell and Christopher Chan. Castaway: a context-aware task management system.In CHI ’06: CHI ’06 extended abstracts on Human factors in computing systems, pages 941–946, New York, NY, USA, 2006. ACM.
[53] Sung Woo Kim, Min Chul Kim, Sang Hyun Park, Young Kyu Jin, and Woo Sik Choi. Gatereminder: a design case of a smart reminder. In DIS ’04: Proceedings of the 5th conference onDesigning interactive systems, pages 81–90, New York, NY, USA, 2004. ACM.
[54] Klaus Krippendorff. Content Analysis: An Introduction to Its Methodology. SAGE Publica-tions, second edition edition, 2004.
[55] M. Lamming and M. Flynn. Forget-me-not: Intimate computing in support of human memory.In Proceedings of UIST, 2005.
[56] R. Levinson. Peat—the planing and execution assistant and trainer. Journal of Head TraumaRehabilitation, 1997.
[57] J. Levitt. Internet zone: Good help is hard to find. Information Week: Listening Post, 2001.http://www.informationweek.com/835/35uwjl.htm.
[58] Roderick J. A. Little and Donald B. Rubin. Statistical Analysis with Missing Data. Wiley,New York, 1987.
[59] Matthew; Lombard, Jennifer; Snyder-Duch, and Cheryl Campanella Bracken. Content analysisin mass communication: Assessment and reporting of intercoder reliability. Human Commu-nication Research, 28(4):587–604, October 2002.
[60] Paul P. Maglio and Christopher S. Campbell. Tradeoffs in displaying peripheral information.In CHI ’00: Proceedings of the SIGCHI conference on Human factors in computing systems,pages 241–248, New York, NY, USA, 2000. ACM.
[61] Gloria Mark, Daniela Gudith, and Ulrich Klocke. The cost of interrupted work: more speedand stress. In CHI ’08: Proceeding of the twenty-sixth annual SIGCHI conference on Humanfactors in computing systems, pages 107–110, New York, NY, USA, 2008. ACM.
[62] Natalia Marmasse and Chris Schmandt. Location-aware information delivery with commotion.In HUC ’00: Proceedings of the 2nd international symposium on Handheld and UbiquitousComputing, pages 157–171, London, UK, 2000. Springer-Verlag.
[63] D. Scott McCrickard, Richard Catrambone, and John T. Stasko. Evaluating animation in theperiphery as a mechanism for maintaining awareness. In IFIP TC.13 Conference on Human-Computer Interaction (INTERACT 2001), pages 148–156, 2001.
[64] D. C. McFarlane. Comparison of four primary methods for coordinating the interruption ofpeople in human-computer interaction. HCI, 17:63–139, 2002.
[65] Microsoft outlook. http://office.microsoft.com/en-us/outlook/default.aspx.
[66] Mozilla thunderbird. http://www.mozilla.com/en-US/thunderbird/.
[67] Mechanical turk. www.mturk.com.
[68] Karen Myers, Pauline Berry, Jim Blythe, Ken Conley, Melinda Gervasio, Deborah McGuinness,David Morley, Avi Pfeffer, Martha Pollack, and Milind Tambe. An intelligent personal assistantfor task and time management. AI Magazine, 28(2):47–61, Summer 2007.
[69] Kimberly A. Neuendorf. The Content Analysis Guidebook. Sage Publications, 2002.
[70] Tomohiro Nishikado. Space invaders, 1978.
183
[71] Brid O’Conaill and David Frohlich. Timespace in the workplace: Dealing with interruptions.In CHI, 1995.
[72] Peter Peduzzi, John Concato, Elizabeth Kemper, Theodore R. Holford, and Alvan R. Feinstein.A simulation study of the number of events per variable in logistic regression analysis. Journalof Clinical Epidemiology, 49:1373–1379, 1996.
[73] Martha E. Pollack. Intelligent technology for an aging population: The use of ai to assistelders with cognitive impairment. AI Magazine, 26(2):9–24, 2005.
[74] Martha E. Pollack, Laura Brown, Dirk Colbry, Colleen E. McCarthy, Cheryl Orosz, BartPeintner, Sailesh Ramakrishnan, and Ioannis Tsamardinos. Autominder: An intelligent cogni-tive orthotic system for people with memory impairment. Robotics and Autonomous Systems,44:273–282, 2003.
[75] Roel Popping. On agreement indices for nominal data. In William E. Saris; Irmtraud N.Gallhofer, editor, Sociometric Research, volume 1, Data Collection and Scaling, pages 90–105.St. Martin’s Press, New York, 1988.
[76] Trivellore E. Raghunathan. What do we do with missing data? some options for analysis ofincomplete data. Annual Review of Public Health, 25:99–117, 2004.
[77] Bradley J. Rhodes. The wearable remembrance agent: a system for augmented memory. InISWC ’97: Proceedings of the 1st IEEE International Symposium on Wearable Computers,page 123, Washington, DC, USA, 1997. IEEE Computer Society.
[78] Donald B. Rubin. Multiple Imputation for Nonresponse in Surveys. Wiley, New York, secondedition edition, 2004.
[79] B. Schlkopf and A. J. Smola. Learning with Kernels: Support Vector Machines, Regulariza-tion, Optimization, and Beyond. Adaptive Computation and Machine Learning. MIT Press,Cambridge, MA, USA, 12 2002.
[80] W. A. Scott. Reliability of content analysis: The case of nominal scale coding. Public OpinionQuarterly, 19:321–325, 1955.
[81] Timothy Sohn, Kevin A. Li, Gunny Lee, Ian E. Smith, James Scott, and William G. Griswold.Place-its: A study of location-based reminders on mobile phones. In Ubicomp, pages 232–250,2005.
[82] J. Somervell, C. M. Chewar, and D. S. McCrickard. Evaluating graphical vs. textual displaysin dual-task environments. In ACM Southeast Conference, 2002.
[83] J. Gregory Trafton, Erik M. Altmann, Derek P. Brock, and Farilee E. Mintz. Preparing toresume an interrupted task: effects of prospective goal encoding and retrospective rehearsal.Int. J. Hum.-Comput. Stud., 58(5):583–603, 2003.
[84] M. H. Vastenburg, D. V. Keyson, and H. de Ridder. Considerate home notification systems: Afield study of acceptability of notifications in the home. Personal and Ubiquitous Computing,2007.
[85] Julie S. Weber, Mark W. Newman, and Martha E. Pollack. Multi-format notifications formulti-tasking. In Proceedings of Interact, 2009.
[86] Julie S. Weber and Martha E. Pollack. Evaluating user preferences for adaptive reminding.In CHI ’08 extended abstracts on Human factors in computing systems, pages 2949–2954, NewYork, NY, USA, 2008. ACM.
[87] Robert Philip Weber. Basic Content Analysis. SAGE Publications, 1985.
184

[88] Brian Whitworth. Polite computing. Behaviour & Information Technology, 24:353–363, 2005.
[89] B. A. Wilson, J. J. Evans, H. Emslie, and V. Malinek. Evaluation of neuropage: A new memoryaid. Journal of Neurology, Neurosurgery and Psychiatry, 63:113–115, 1997.
[90] Yahoo, inc. Yahoo! Widgets. http://widgets.yahoo.com.
[91] Niklas Zennstrm and Janus Friis. Skype. Skype Technologies S.A., 2003.
185