Granulocyte chemotactic protein 2 (gcp-2/cxcl6) complements interleukin-8 in periodontal disease
Krishnamoorthy. P* et al. /International Journal Of Pharmacy & Technology
IJPT | Jan-2013 | Vol. 4 | Issue No.4 | 5063-5068 Page 5063
ISSN: 0975-766X CODEN: IJPTFI
Available Online through Research Article www.ijptonline.com
DATA ANALYSIS TECHNIQUES TO DETERMINE THE EFFICACY OF AN ACTIVE DRUG ON TREATING THE PERIODONTAL DISEASE
Krishnamoorthy. P1*, Praveen Kumar2, P K, Jayalakshmi, T1 and Kiran, B V V1 1School of Bio-Engineering, Dept. of Bioinformatics, Bharath University, Chennai, Tamil Nadu, India.
2Assistant Professor, S.V.C.E College, Sriperumbudur, Chennai, Tamil Nadu, India. Email: [email protected]
Received on 13-12-2012 Accepted on 27-12-2012
Abstract
The objective of this project is to apply data analysis techniques to analyze data on periodontal disease and discover the
factors that were most related to periodontal disease. In This Project a12-month, double-blind, randomized, placebo-
controlled clinical study was conducted to determine the efficacy of an active drug on treating periodontal disease.
The statistical analysis were based on data from 45 patients who complete the study. The data used for the analysis is
from HCUP (Healthcare Cost and Utilization Project), the NIS (Nationwide Inpatient Sample) data. In This Project we
are using a powerful statistical analysis tool called SAS, was used to perform various data analysis tasks.
Data analysis, a stream of data mining, is the process of looking at and summarizing data with the intent to extract
useful information and develop conclusions. Data mining is the process of sorting through large amounts of data and
picking out relevant information.
Key words: Data analysis, SAS, drug, data mining.
Introduction
Clinical trials are conducted to allow safety and efficacy. Clinical trials are research studies in which people help
doctors find ways to improve health and disease care. Each study tries to answer scientific questions and to find better
ways to prevent, diagnose, or treat disease. A clinical trial is one of the final stages of a long and careful disease
research process. Studies are done with disease patients to find out whether promising approaches to disease
prevention, diagnosis, and treatment are safe and effective. Clinical trials are conducted in a series of steps, called

Krishnamoorthy. P* et al. /International Journal Of Pharmacy & Technology
IJPT | Jan-2013 | Vol. 4 | Issue No.4 | 5063-5068 Page 5064
phases - each phase is designed to answer a separate research question.
Phase I: Researchers test a new drug or treatment in a small group of people for the first time to evaluate its safety,
determine a safe dosage range, and identify side effects.
Phase II: The drug or treatment is given to a larger group of people to see if it is effective and to further evaluate its
safety.
Phase III: The drug or treatment is given to large groups of people to confirm its effectiveness, monitor side effects,
compare it to commonly used treatments, and collect information that will allow the drug or treatment to be used
safely.
Phase IV: Studies are done after the drug or treatment has been marketed to gather information on the drug's effect in
various populations and any side effects associated with long-term use.
PATIENTS TEETH AFFECTED WITH PERIODONTAL DISEASE
-Aa +Aa
Materials & Methods
SAS is a powerful Statistical Analysis tool and SAS Enterprise Guide is a powerful client application that provides a
guided mechanism to exploit the power of SAS and publish dynamic results. Hence for the purpose of Data Analysis,
sas was used.
Here Data Analysis is done by Following Steps:
● Data Step: Using the DATA step is the primary method for creating a SAS data set with Base SAS software. A DATA
step is a group of SAS language statements that begin with a DATA statement and contains other programming
Krishnamoorthy. P* et al. /International Journal Of Pharmacy & Technology
IJPT | Jan-2013 | Vol. 4 | Issue No.4 | 5063-5068 Page 5065
statements that manipulate existing SAS data sets or create SAS data sets from raw data files. It is the process of sorting
through large amounts of data and discovering relevant information. It is described as "the nontrivial extraction of
implicit, previously unknown, and potentially useful information from data".
♦ The PROC step: It consists of a group of SAS statements that call and execute a procedure, usually with a SAS
data set as input. Use PROCs to analyze the data in a SAS data set, produce formatted reports or other results, or
provide ways to manage SAS files. You can modify PROCs with minimal effort to generate the output you need.
PROCs can also perform functions such as displaying information about a SAS data set
● Statistical Inference: Once the basic information about data is known, statistical significance of various attributes is
established and tested using various models such as mean, median, mode, stdev.
DATA CONTENTS OF THE PROJECT
The data consists of three parts:
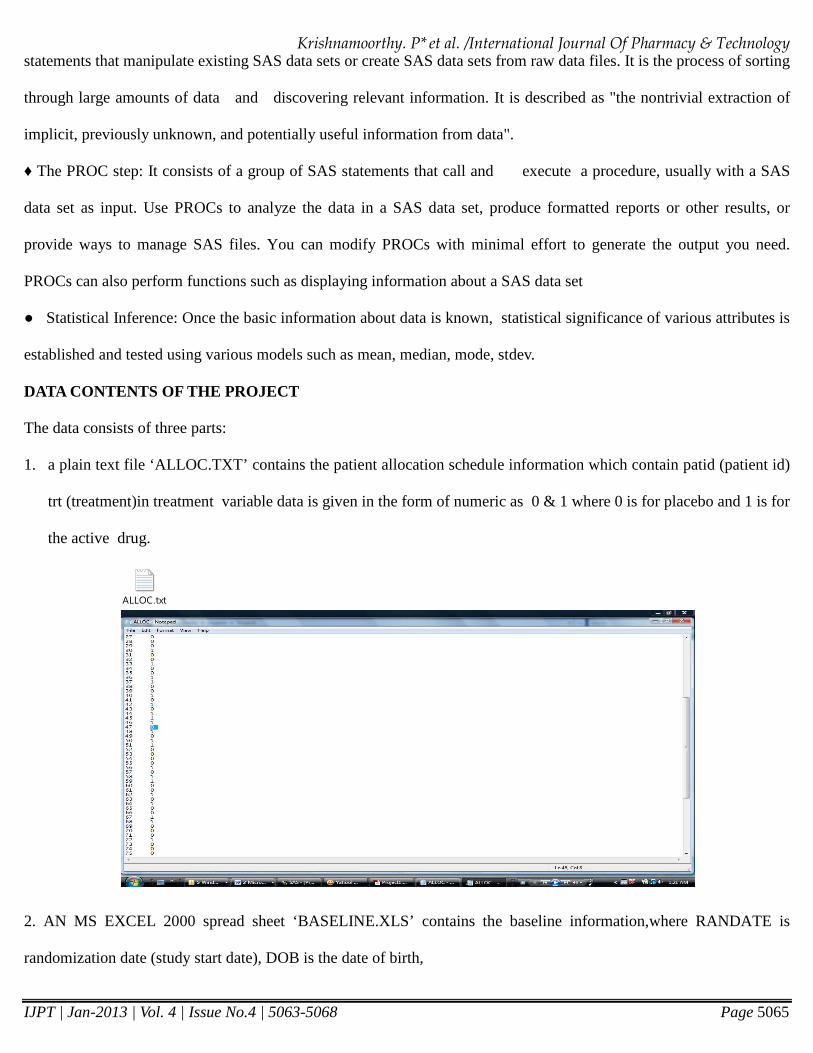
1. a plain text file ‘ALLOC.TXT’ contains the patient allocation schedule information which contain patid (patient id)
trt (treatment)in treatment variable data is given in the form of numeric as 0 & 1 where 0 is for placebo and 1 is for
the active drug.
2. AN MS EXCEL 2000 spread sheet ‘BASELINE.XLS’ contains the baseline information,where RANDATE is
randomization date (study start date), DOB is the date of birth,
ALLOC.txt

Krishnamoorthy. P* et al. /International Journal Of Pharmacy & Technology
IJPT | Jan-2013 | Vol. 4 | Issue No.4 | 5063-5068 Page 5066
PATID is patient ID, TOOTH is tooth number, and WEIGHT is patient’s weight in pound at the beginning of the trial,
BONE_HT is Alveolar bone height in millimeter, and PD is probing pocket depth in millimeter.
3. A permanent SAS data set ‘CLINEFF.SAS7BDAT’, where variable names are the same as in the EXCEL spread
sheet, except that the VDATE is for the visit date.
Results and Discussion
The merged data set was named as bsnl1 and the output of the merged dataset will be as in the following diagram.
Bsln1
By the use of merge statement the trt variable was merged in the bsln data set The obtained data set is named as Bsln2 and the output of the data set will be as following. Bsln2

Krishnamoorthy. P
IJPT | Jan-2013 | Vol. 4 | Issue No.4 | 5063-
After obtaining the Bsln2 data set, The following procedure is done to merge this data set with another one.A
The Bsln_alloc is to be created by deleting the dob and ran date ,here we are deleting the dob and ran date because the
age of the patients was found in the Bsln2 data set.
The output view of the data set CHANGE is as in the following diagram
Here the variable CHANGE gives the valves of change in the bone height of the last visit of the patients. Statistical analysis for the change in bone height from last visit of the patient
Krishnamoorthy. P* et al. /International Journal Of
-5068
, The following procedure is done to merge this data set with another one.A
The Bsln_alloc is to be created by deleting the dob and ran date ,here we are deleting the dob and ran date because the
age of the patients was found in the Bsln2 data set.
set CHANGE is as in the following diagram.
Here the variable CHANGE gives the valves of change in the bone height of the last visit of the patients.
tatistical analysis for the change in bone height from last visit of the patient:
et al. /International Journal Of Pharmacy & Technology
Page 5067
, The following procedure is done to merge this data set with another one.A data set
The Bsln_alloc is to be created by deleting the dob and ran date ,here we are deleting the dob and ran date because the
Here the variable CHANGE gives the valves of change in the bone height of the last visit of the patients.

Krishnamoorthy. P* et al. /International Journal Of Pharmacy & Technology
IJPT | Jan-2013 | Vol. 4 | Issue No.4 | 5063-5068 Page 5068
These are the minimum, maximum, mean and standard deviation values for the change in the bone height of the
patients.
Summary & Conclusion
By notifying the change in the bone height of the tooth of the patients, it declared as; the given drug is active in
treating the periodontal disease thus the efficacy of drug was found by the result of change in bone height of the tooth
of patients. Thus, the science of data analysis provides variety of techniques to analyze data. It proved to be very
effective in exploring data. All the data visualization techniques provided crisp basic knowledge about data, making it
easy to understand.SAS proved to be a perfect platform for performing various data analysis tasks by providing a
variety of options in a user-friendly interface. It proved to be very powerful in generating statistical analysis generated
easily using SAS. Even Kernel Density Estimation was performed with almost minimal coding.
References
1. Silverstein FE, Faich G, Goldstein JL, et al. (September 2000).
2. Bombardier C, Laine L, Reicin A, et al. (November 2000).
3. Chow LW, Loo WT, Toi M (October 2005).
4. Farooqui M, Li Y, Rogers T, et al. (December 2007).
5. Schönthal AH (December 2007).
6. Chuang HC, Kardosh A, Gaffney KJ, Petasis NA, Schönthal AH (2008).
7. Zhu J, Song X, Lin HP, et al. (December 2002).
8. Schönthal AH,Chen TC,Hofman FM,Louie SG,Petasis NA(February 2008).
9. Schönthal AH (2006).
10. Kardosh A. et al. (2005).
11. Pyrko P. et al. (2007).
12. Kardosh A. et al. (2005).
Corresponding Author: Krishnamoorthy, P1 Email: [email protected]
Copyright © 2022 FDOKUMEN