2013 Falsaperla et al 2013
19
1 23 International Journal of Earth Sciences GR Geologische Rundschau ISSN 1437-3254 Int J Earth Sci (Geol Rundsch) DOI 10.1007/s00531-013-0964-7 “Failed” eruptions revealed by pattern classification analysis of gas emission and volcanic tremor data at Mt. Etna, Italy S. Falsaperla, B. Behncke, H. Langer, M. Neri, G. G. Salerno, S. Giammanco, E. Pecora & E. Biale
Transcript of 2013 Falsaperla et al 2013

1 23
International Journal of EarthSciencesGR Geologische Rundschau ISSN 1437-3254 Int J Earth Sci (Geol Rundsch)DOI 10.1007/s00531-013-0964-7
“Failed” eruptions revealed by patternclassification analysis of gas emission andvolcanic tremor data at Mt. Etna, Italy
S. Falsaperla, B. Behncke, H. Langer,M. Neri, G. G. Salerno, S. Giammanco,E. Pecora & E. Biale

1 23
Your article is protected by copyright and
all rights are held exclusively by Springer-
Verlag Berlin Heidelberg. This e-offprint is
for personal use only and shall not be self-
archived in electronic repositories. If you wish
to self-archive your article, please use the
accepted manuscript version for posting on
your own website. You may further deposit
the accepted manuscript version in any
repository, provided it is only made publicly
available 12 months after official publication
or later and provided acknowledgement is
given to the original source of publication
and a link is inserted to the published article
on Springer's website. The link must be
accompanied by the following text: "The final
publication is available at link.springer.com”.

ORIGINAL PAPER
‘‘Failed’’ eruptions revealed by pattern classification analysisof gas emission and volcanic tremor data at Mt. Etna, Italy
S. Falsaperla • B. Behncke • H. Langer •
M. Neri • G. G. Salerno • S. Giammanco •
E. Pecora • E. Biale
Received: 7 February 2013 / Accepted: 21 September 2013
� Springer-Verlag Berlin Heidelberg 2013
Abstract During the spring of 2007, paroxysmal activity
occurred at the Southeast Crater of Mt. Etna, always
associated with sharp rises in the amplitude of the volcanic
tremor. Activity ranged from strong Strombolian explo-
sions to lava fountains coupled with copious emission of
lava flows and tephra. During inter-eruptive periods,
recurrent seismic unrest episodes were observed in the
form of temporary enhancements of the volcanic tremor
amplitude, but they did not culminate in eruptive activity.
Here, we present the results of an analysis of these inter-
eruptive periods by integrating seismic volcanic tremor, in-
soil radon, plume SO2 flux, and thermal data. SO2 flux and
thermal radiation are envisaged as the ‘‘smoking gun,’’ and
certifying that changes in seismic or radon data can be
considered as volcanogenic. Short-term changes were
investigated by pattern classification based on Kohonen
maps and fuzzy clustering on volcanic tremor, radon, and
ambient parameters (pressure and temperature). Our results
unveil ‘‘failed’’ eruptions between February and April 2007
that are explained as ascending magma batches, which
triggered repeated episodes of gas pulses and rock frac-
turing, but that failed to reach the surface.
Keywords Volcano monitoring � Failed eruption �Mt. Etna � Volcanic tremor � Plume SO2 flux � In-soil
radon � Thermal data
Introduction
False alarms of imminent volcanic eruptions can lead to
significant economic losses and social hardship and
severely undermine the credibility of both scientists and
authorities. The evacuation of about 73,000 people from
the surroundings of La Soufriere volcano on the French
West Indies island of Guadeloupe in 1976, without the
volcano producing the announced catastrophic eruption, is
widely considered an emblematic failure in correctly
assessing the risk posed by the volcano (Fiske 1984). Even
though in hindsight, it might be oversimplified to state that
the 1976 La Soufriere evacuation was totally unnecessary,
as the volcano indeed seems to have been close to pro-
ducing a major magmatic eruption (Feuillard et al. 1983).
That crisis points to a dilemma that represents a continuing
challenge to modern volcanology: the phenomenon of
‘‘failed’’ (or ‘‘still-born’’) eruptions (Moran et al. 2011).
Trapped between the task of giving timely warning of an
imminent and potentially dangerous eruption and that of
avoiding false alarms, scientists have to tread a rather
narrow path that is expected to become safer with ever
increasing technological effort invested in volcano moni-
toring. But how much uncertainty is due to the possibility
that signals of volcanic unrest fail to be recorded and
recognized? How much is due to a simple lack of signals?
Mt. Etna in Sicily (Fig. 1) is among the most intensely
monitored and studied volcanoes on Earth (e.g., Bonac-
corso et al. 2004; D’Agostino et al. 2013), due to its very
frequent and highly varied activity, its location in a densely
populated area, and its easy accessibility. Through a
sophisticated monitoring system run by the Istituto Naz-
ionale di Geofisica e Vulcanologia-Osservatorio Etneo
(INGV-OE) (see http://www.ct.ingv.it), scientists are
gaining a real-time picture of the state of volcanic activity
Electronic supplementary material The online version of thisarticle (doi:10.1007/s00531-013-0964-7) contains supplementarymaterial, which is available to authorized users.
S. Falsaperla (&) � B. Behncke � H. Langer � M. Neri �G. G. Salerno � S. Giammanco � E. Pecora � E. Biale
Istituto Nazionale di Geofisica e Vulcanologia, Osservatorio
Etneo, Sezione di Catania, Piazza Roma 2, 95125 Catania, Italy
e-mail: [email protected]
123
Int J Earth Sci (Geol Rundsch)
DOI 10.1007/s00531-013-0964-7
Author's personal copy

of Etna that is also useful to evaluate potential risks posed
to the *800,000 people living in its surroundings. In
recent decades, Etna displayed a rapid switch from one
eruptive style to another as well as changes in its dynamics
(Allard et al. 2006; Neri et al. 2009). In the spring of 2007,
the Southeast Crater (SEC, Fig. 1)—the most recent of the
four summit craters of Etna (formed in 1971)—reawakened
to produce paroxysmal episodes characterized by intense
Strombolian activity, lava fountaining, tephra emission,
and lava flow effusion (Andronico et al. 2008; Neri et al.
2011a). Like other similar eruptive episodes at the SEC
(Alparone et al. 2005; Behncke et al. 2006; Merucci et al.
2011; Vicari et al. 2011), these events were short-lived,
with durations from *30 min to 10 h. The first of these
eruptive episodes occurred on March 29, 2007; during the
following 3 weeks, there were almost daily increments in
volcanic tremor amplitude, but only in one case (on 11
April) they were followed by a new paroxysmal eruption at
the SEC. The repeated episodes of increased volcanic tre-
mor during April 2007 often triggered the automatic alert
systems in the control room of the INGV-OE, leading the
staff on duty to notify the pertinent authorities, including
those at the International Airport of Catania, of possible
explosive eruptions with production of ash clouds.
Seismic data, in particular volcanic tremor, are contin-
uously recorded 24 h a day/7 days a week and have proven
to be a valuable tool for volcanic monitoring and early-
warning purposes. This signal can have different sources,
which entails the necessity to verify its significance as a
forerunner to enhanced volcano dynamics by reviewing
other parameters. The emission of radon is often claimed as
evidence for the opening of fissures in the ground, which
allow the ascent of this noble gas from the shallowest
levels of the crust toward the surface. Direct evidence of
enhanced volcano dynamics can be obtained by measuring
the SO2 flux and thermal radiation. Unfortunately, these
signals are not always available: measurement of SO2
during nighttime is not possible, and unfavorable meteo-
rological conditions can prevent the measurement of both
SO2 and thermal radiation.
Fig. 1 Shaded view of Mt. Etna
and location of the reference
sensors for the monitoring of:
thermal and visual images
(square), SO2 flux (circle),
radon and ambient parameters
(triangle), seismic signal (star)
used in this study. The top left
inset is a zoom of the summit
craters area and indicates the
location of NE Crater,
Voragine, Bocca Nuova, and SE
Crater. TdF, Torre del Filosofo;
ESPC, Monte Serra Pizzuta
Calvarina; ENT, Nicolosi
(thermal camera); ENV,
Nicolosi (visual camera)
Int J Earth Sci (Geol Rundsch)
123
Author's personal copy

Here, we present the results of a detailed analysis of
thermal, geochemical (SO2 and radon), and volcanic tre-
mor data during the period from February to April 2007.
We investigate how continuously monitored seismic data
and radon emission can be linked to SO2 flux and thermal
radiation. We consider the latter two as ‘‘smoking guns,’’
supporting the link of observed anomalies to changes in the
volcano dynamics.
Fig. 2 a Thermal and b visual
images of the explosion
recorded at the Bocca Nuova
crater by INGV-OE video
cameras on March 19, 2007.
c Relative temperature
measured by NewSaraterm
software from March 14 to 20,
2007; the values are calculated
from the difference between the
maximum temperature in
window a (large rectangle in
Fig. 2a) minus the maximum
temperature in window b (small
rectangle). d Daily SO2 flux
values from 14 to 28 March
2007. The strong 1-min thermal
anomaly caused by the 19
March explosion and the
beginning of the increase in the
SO2 flux are marked by red
arrows
Int J Earth Sci (Geol Rundsch)
123
Author's personal copy

Chronology of the eruptive events
The year 2007 started with a period of relative quiescence in
the eruptive activity of Etna, interrupted at 17:24 (all times
are UT) on 19 March by a short-lived episode of explosive
activity at the Bocca Nuova (BN, Figs. 1, 2), one of the four
summit craters of the volcano. The event produced a thick
ash plume (Fig. 2b) (Pecora and Biale 2007). Following this
episode, on the morning of 29 March, the SEC awakened
after 3.5 months of inactivity. Violent Strombolian activity
started and soon evolved to sustained lava fountaining with
voluminous tephra production and emission of lava flows
toward the south (1.2 km long) and southeast (2.3 km long).
The paroxysm lasted *30 min and produced approxi-
mately 0.7 9 106 m3 of lava and about 0.5 9 106 m3 of
tephra. Due to clouds covering most of the volcano, thermal
observation of this event was precluded. Paroxysmal
activity from the SEC resumed again around midnight of 10
April and continued during the early morning of the fol-
lowing day, with lava fountaining and emission of a huge
tephra plume, and a lava flow advancing 3.5 km to the
southeast. Furthermore, an eruptive fissure opened during
the climax of the activity between 01:00 and 02:00 on the
southern flank of SEC with the emission of a small lava flow
0.9 km long. The activity was over *6 h after its onset
(Table 1 in Online Resource), about 1 9 106 m3 of lava
and 0.3 9 106 m3 of tephra were erupted.
Data acquisition
Several parameters are monitored at Etna every day with
sampling frequencies depending both on the technological
features of the sensors and on the range of interest for each
parameter. Collected data are either transmitted in real time
to the INGV-OE or downloaded periodically on-site. Data
investigated in this study were thermal images, SO2 flux,
in-soil radon, and volcanic tremor. In the following, we
describe the data acquired from February 21 to April 20,
2007.
Thermal data
Thermal data were recorded in the long-wave infrared
(LWIR) by a FLIR Thermavision A40 M infrared camera
located in Nicolosi, 15 km south of the summit craters
(Fig. 1). The camera is provided with a detector of
320 9 240 pixel uncooled microbolometer with a spectral
range from 7.5 to 13 lm. This device measures and images
the emitted infrared radiation from an object by using the
power of incident electromagnetic radiation through the
heating of a material with a temperature-dependent elec-
trical resistance. The measured radiation depends not only
upon the surface temperature of the object, but also on
emissivity, which is a measure of how much radiation is
emitted from the object compared to a perfect blackbody at
the same temperature. Thermal images were processed by
the NewSaraterm software (Ando and Pecora 2005, 2006)
to detect ash-rich eruptive columns, and explosive and
effusive activity (Calvari et al. 2011). The software cal-
culated the difference between maximum temperatures
measured in two different windows (a and b in Fig. 2a) in
the thermal images, the first centered on the summit craters,
the second centered on an area not affected by volcanic
activity. The temperatures recorded were much lower than
the true temperatures of the target because of: (1) the dis-
tance between the location of the thermal camera and the
target; (2) environmental factors such as humidity, baro-
metric pressure, and air temperature; (3) the presence of an
additional protective lens on the camera housing (e.g., Ball
and Pinkerton 2006; Spampinato et al. 2011). The tem-
perature values discussed here are thus relative, not abso-
lute, as they were not corrected for the aforementioned
factors. The chosen temperature range was from -40 to
120 �C.
SO2 flux
Volcanic plume SO2 flux was measured by means of the
FLAME (FLux Automatic MEasurements) ultraviolet
scanning spectrometer network (e.g., Salerno et al. 2009a;
Bonaccorso et al. 2011a). The network consists of 9
autonomous stations placed on the flanks of Etna at an
altitude of *900 m a.s.l. and a distance of *14 km from
the volcano’s summit (white circles in Fig. 1). Each
instrument scanned the sky over 156� from horizon to
horizon every *5 min during daylight. Open-path ultra-
violet spectra are reduced in real time and on-site applying
the differential optical absorption spectroscopy method
(e.g., Platt and Stutz 2007), using a modeled rather than a
measured background spectrum (Salerno et al. 2009b;
Campion et al. 2010; Merucci et al. 2011). SO2 volcanic
plume-profiles are then sent via GSM modem to INGV-
OE, where SO2 flux is calculated and in real time available
for surveillance purposes. SO2 flux time series might be not
stationary throughout the day and/or week due to the vol-
canic plume drifting toward a sector of the volcano not
covered by the FLAME network. Uncertainty for computed
emission rates ranged between -22 and ?36 % (Salerno
et al. 2009a; Patane et al. 2013). SO2 flux in this work is
shown as averaged daily flux (Fig. 3b).
Radon data
The dense 222Rn gas is a short-lived decay product derived
from 238U, with a half-life of only 3.8 days. By 2007,
Int J Earth Sci (Geol Rundsch)
123
Author's personal copy
INGV-OE was acquiring continuous soil radon data from
an array of 4 detectors installed both in areas of active
faulting and close to the summit craters of Etna. Here, we
present the data collected from a station setup at Torre del
Filosofo (TdF) at an altitude of *2,950 m (Fig. 1),
*1 km south of the SEC. Radon data were collected
simultaneously with ambient parameters (soil temperature
and borehole barometric pressure) in the same borehole
Fig. 3 Temporal evolution of:
a thermal data, b daily SO2 flux,
c barometric pressure, d soil
temperature, e in-soil radon, and
f amplitude of volcanic tremor
from February 21 to April 20,
2007. Pink and light blue
vertical bands mark periods
when parametric changes were
associated with gas pulses or
with rock fracturing,
respectively (see ‘‘Stage I: 21
February–28 March’’ section for
more details). The white vertical
bands mark periods when
parametric patterns could not be
attributed clearly to gas pulses
or to rock-fracturing episodes.
The yellow arrow marks the 19
March explosion. The two
eruptive paroxysms (red
arrows) occurred on 29 March
and on 10–11 April
Int J Earth Sci (Geol Rundsch)
123
Author's personal copy

every 20 min, and then downloaded onto a laptop about
every month. Given the characteristics of the borehole (see
Appendix 1), the barometric pressure measured at the
borehole bottom is assumed to be the same as the surface
atmospheric pressure; it is used as a parameter indicator of
possible environmental influences on the radon values and
of ‘‘false’’ (namely, not related to volcanic activity) vari-
ations. The radon station is located at the western margin of
a N–S trending, 50-m-wide thermal anomaly associated
with a fracture field characterized by fumarolic activity
(maximum outlet temperature in the area of about 83 �C)
(Aubert and Baubron 1988; Alparone et al. 2004). The
fumarole is due to boiling of a shallow water table and
intense diffuse degassing related to active gas release from
the central magma feeding system of the volcano, as pre-
viously reported by Aubert and Baubron (1988), Alparone
et al. (2005), Pecoraino and Giammanco (2005).
Volcanic tremor data
Continuous seismic monitoring was conducted with a
permanent network of sensors equipped with 40 s Nano-
metrics TrilliumTM seismometers. The signals were recor-
ded at a rate of 100 samples per second and transmitted to
the data acquisition center of INGV-OE in Catania. In the
time span of our case study, tectonic seismicity was low in
terms of both number of earthquakes and strain release; the
maximum magnitude (ML 2.7) was reached on April 19,
for an earthquake with origin 8 km below the sea level
under the WNW flank of the volcano (Gruppo Analisi Dati
Sismici 2013; http://www.ct.ingv.it/ufs/analisti/catalogolist.
php). Conversely, the background seismic radiation known
as volcanic tremor was characterized by repeated incre-
ments in amplitude and changes in its frequency content.
Volcanic tremor data analyzed in this study were recorded
by the Monte Serra Pizzuta Calvarina station (ESPC)
located at an altitude of 1,660 m, about 6 km S of the
summit craters (Fig. 1). ESPC provided high reliability and
continuity of data acquisition, as well as good signal
quality over the studied period. The amplitude of volcanic
tremor was calculated as root mean square (RMS) value of
the seismic signal over consecutive 20 min time spans
(Fig. 3f). The scheme of data processing followed the
method described in Langer et al. (2011), allowing to
exclude transient signals, such as spikes, wind gusts, and
also earthquakes, which are undesired in the context of
volcanic tremor analysis.
Synopsis of geochemical and volcanic tremor data
A synoptic view of thermal data, daily SO2 flux, borehole
barometric pressure and temperature, in-soil radon activity,
and amplitude of volcanic tremor is provided in Fig. 3.
Over the 59 days of observation, the SO2 emission rate was
characterized by a gradual declining trend. The mean
emission rate was 2,300 Megagram per day (Mg day-1,
standard deviation 1 r = 1,500), encompassed between the
minimum value of 700 Mg day-1 (1 April 2007) and the
maximum of 7,300 Mg day-1 (February 26, 2007). A clear
transition in the behavior of geochemical and volcanic
tremor data was observed soon after 29 March, namely
when the first paroxysmal event of 2007 occurred. The
transition marked the onset of a new cycle of eruptive
activity that lasted about 2 years. In our case study, the
period prior to the paroxysm (Stage I, from 21 February to
28 March) was characterized by substantial changes in SO2
flux and soil radon emission (Fig. 3b, e), while the fol-
lowing period (Stage II, from 29 March to 20 April)
showed a further increase in SO2 flux, and frequent
increments in the volcanic tremor amplitude and thermal
data, but no changes in the soil radon trend (Fig. 3f, b, a).
Stage I: 21 February–28 March
During this stage, the SO2 flux displayed three waxing and
waning phases between 24 February and 5 March, from 6
to 12 March, and from 19 to 27 March (Fig. 3b). The last
phase followed the brief episode of explosive activity at the
BN on 19 March. This explosion was recorded by visual
and thermal video cameras, which documented a 1-min-
long thermal anomaly (Fig. 2a–c) (Pecora and Biale 2007).
After the explosion, the SO2 flux continued to increase,
peaking at 6,200 Mg day-1 on 23 March (Fig. 3b). After-
ward, the emission rate declined till 29 March, when the
first episode of paroxysmal eruptive activity in 2007
occurred.
In this stage, many conspicuous (positive or negative)
variations of the radon activity (Fig. 3e) were associated
with soil temperature changes (Fig. 3d). Their occurrence
(highlighted by pink bands in Fig. 3) alternated with
periods of increased radon emission with no change in soil
temperature (highlighted by light blue bands in Fig. 3). The
apparent relation between changes in radon emission and in
soil temperature is as intriguing as the absolute values of
radon variations themselves. The role of soil temperature as
a proxy of steam/heat flux and more generally of the bulk
gas flux is critical in identifying the source responsible for
the variations observed in radon emission. This source can
be ascribed to gas pulses, when increased flux of deep and
hot magmatic gas produces increases in soil temperature
associated with changes in radon emission, as earlier
described in the same area by Pinault and Baubron (1996).
Alternatively, it can result from rock-fracturing episodes,
shallow processes that produce an increase in radon
emission from newly formed rock surface in contact with
Int J Earth Sci (Geol Rundsch)
123
Author's personal copy

the carrier gases (Thomas 1988), without an increase of
deeper gases that carry heat, and hence without associated
temperature changes. Before the 29 March paroxysm, we
identify three time spans with an increase in radon and no
significant change in soil temperature and three time spans
characterized by high soil temperature associated with
either a concurrent increase or with a decrease in radon
(Fig. 3c–e). Increases both of temperature and of radon in
soil are due to a carrier effect of increased flux of water
vapor, as mentioned above for gas pulses. However,
increases in temperature associated with radon decreases
could be the result of a radon dilution effect, when the flux
of water vapor/bulk gas is so high as to overwhelm the
shallow source of radon isotopes, similar to the effect
produced by high CO2 fluxes (Giammanco et al. 2007). An
alternative explanation would take into account a physical
mechanism that removes soil radon while causing an
increase in ground temperature at the same time. A pos-
sible explanation for this would be near-surface conden-
sation in the ground of an upward moving gas phase, of
which water vapor is a major constituent and CO2 (or
another non-condensable gas) makes the remaining part
(see also Appendix 1).
Only two short (\2-day long) time intervals in February
and March had no change in temperature or in radon (white
bands in Fig. 3), highlighting temporary low values of the
radon activity. Overall in Stage I, both volcanic tremor and
thermal data remained relatively steady and no apparent
direct link was observed with SO2 flux and radon emission.
The only exception was a short-lived, moderate increase in
amplitude of volcanic tremor and thermal measurements on
19 March.
Stage II: 29 March–20 April
After 29 March until 20 April, the SO2 emission rate lev-
eled out at mean value of *1,800 Mg day-1 with the
exception of the period between 8 and 11 April in which
the geochemical signal peaked at 4,700 Mg day-1. This
degassing phase, likely associated with the 10–11 April
paroxysmal episode, displayed a maximum value about a
half of that measured between 24 February and 5 March in
Stage I (Fig. 3b). Unlike the SO2 flux, radon was rather
insensitive to the occurrence of both the 29 March and
the 10–11 April paroxysms, having values below
5,000 Bq m-3 on average throughout the whole Stage II
(Fig. 3). Conversely, after the relatively low values of
volcanic tremor and thermal data until 29 March, both
parameters showed major changes. Volcanic tremor peaked
at *2.3 9 104 nm s-1 during the paroxysmal activity of
29 March (Fig. 3f). With the cessation of the eruptive
activity, the amplitude dropped again reaching values of
*0.08 9 104 nm s-1. However, the next day, RMS values
rose very much in the same manner as on the previous day,
but they were not associated with any visible eruptive
activity at the surface. Similar temporary increases in the
volcanic tremor amplitude not associated with any volcanic
activity were observed at almost regular daily intervals
over the next 12 days. By late 10 April, a new increase of
the volcanic tremor amplitude to *1.6 9 104 nm s-1
finally culminated in the second episode of lava fountain-
ing (red arrow in Fig. 3). Again, during the following days,
temporary increments in the RMS volcanic tremor ampli-
tude triggered the automatic alert systems in the control
room of the INGV-OE. However, none of these was
accompanied by any eruptive phenomena. On average, the
20 major peaks (paroxysms excluded) of volcanic tremor in
Stage II had RMS amplitudes of 0.47 9 104 nm s-1,
namely *5 times smaller than the maximum value
achieved on 29 March (Fig. 3f).
Thermal data had a few gaps in the time series due to
cloudy skies, which hindered the visibility of the summit
craters. Such problems unfortunately occurred also during
the two aforementioned paroxysms. Nevertheless, thermal
measures highlighted numerous peaks, the largest of which
followed the end of the 10–11 April paroxysm (Fig. 3a). To
accomplish a comparative seismic record and video image
analysis, we examined the footage recorded during the 20
episodes in which volcanic tremor peaked. The analysis of
these visual records disclosed three cases in which the
visibility was poor due to clouds or to bad weather con-
ditions. Only in one case (on 19 April) out of the remaining
17 episodes, fair visibility conditions revealed an appre-
ciably warmer degassing than usual from the SEC (Table 1
in Online Resource).
KKAnalysis for pattern classification
Multidisciplinary analyses have pros and cons. An
appealing pro is that a multiparametric approach may
unveil subtle, interconnected changes in a huge amount of
information, enhancing the potential detection of signifi-
cant links between parameters and variations related to the
monitored natural phenomena. On the other hand, multi-
disciplinary studies come along with puzzling data sets,
thus making the application of specific analytical tools
necessary. For these reasons, we took advantage of a free
software package named KKAnalysis (Messina and Langer
2011), which proved to be quite versatile in the multipa-
rameter analysis of both geochemical (Corsaro et al. 2013)
and geophysical (Langer et al. 2011) data. KKAnalysis
exploits unsupervised pattern classification techniques,
combining the application of Kohonen maps (Kohonen
1984, 2001) or self-organizing maps (SOM) and cluster
analysis, in particular fuzzy clustering (Zadeh 1965).
Int J Earth Sci (Geol Rundsch)
123
Author's personal copy

Langer et al. (2011) applied KKAnalysis to volcanic tremor
data recorded on Etna during eight eruptive events in 2007
and 2008. In the multivariate problem they dealt with,
Langer et al. (2011) applied KKAnalysis to patterns con-
taining the spectral content of the seismic signal. The
feature vectors that formed each pattern were made up of
spectral amplitudes measured in specific frequency bins.
Based on the results of KKAnalysis, the authors were able
to identify significant changes in the characteristics of
volcanic tremor data immediately preceding (from 1 h to
tens of hours) episodes of lava fountaining at the SEC in
2007–2008, and the onset of the flank effusive activity in
May 2008. In 2010, the implementation at the control room
of INGV-OE of a real-time pattern classification tool based
on KKAnalysis for the analysis of volcanic tremor fol-
lowed in the wake of these results. In the on-line pattern
classification now routinely running at INGV-OE, the most
recent patterns (that is the ones related to the last 24 h) are
pooled together with a reference data set, which encom-
passes past eruptive episodes, in particular the lava foun-
tains in 2007–2008 and the flank eruption initiated on May
13, 2008. The use of the reference data set allows us to
directly compare the signal characteristics of the new data
to those found during eruptive events, providing efficient
automatic warning when a critical status of the volcano is
recognized.
In the present study, we applied KKAnalysis following a
multiparametric strategy of analysis similar to that of
Langer et al. (2011). In particular, we focused on volcanic
tremor, radon, and ambient parameters as: (1) they pro-
vided information around-the-clock, and (2) the data con-
tain no gaps during the study period. Conversely, we
discarded from this application the SO2 flux data, for the
lack of nighttime measurements that precludes a round-the-
clock coverage, and thermal data, for their discontinuity
due to repeated technical failures and frequent presence of
weather clouds. In the Appendix 2, we briefly outline basic
concepts on SOM and fuzzy clustering. More details can be
found in Messina and Langer (2011), Langer et al. (2011),
and in the ‘‘Extended Documentation,’’ which can be freely
downloaded together with KKAnalysis from http://earthref.
org/ERDA/erda, searching for ‘‘KKAnalysis.’’
Results from pattern classification
We applied a day-by-day pattern classification based on the
spectral characteristics of volcanic tremor (see Appendix
3), pooling the aforementioned 2007–2008 reference data
set together with each of the 59 days from 21 February to
20 April, following the same scheme as in the real-time
implementation mentioned above. The results of the clas-
sification were depicted in the form of colored triangles,
which combine the output of SOM and fuzzy clustering
(Figs. 4, 5). The color code offers a convenient represen-
tation, as it highlights the temporal development of the
different clusters of signal during the study period. SOM
colors have deep blue tones during stages of relative vol-
canic quiescence. As volcanic unrest starts, red tones
become visible and grow progressively more intense. For
instance, in Fig. 4a, we notice deep purple and red triangles
with cluster #2 and #3 during the paroxysm on 29 March.
The spectrograms representing the original feature vectors
for the time span 29–31 March allow us to get an in-depth
view of the spectral characteristics during the paroxysmal
episode (the lava fountain) and three episodes of seismic
unrest immediately following that paroxysm (see also
Fig. 3f). Blue SOM colors on the early morning of 29
March correspond to rather low levels of all spectral
amplitudes of the seismic radiation. Red tones increase
together with the spectral amplitude (volcanic activity
reached a climax at 05:25, see Table 1 in Online
Resource), at the same time as the spectral content
becomes narrower and peaked at *1.5 Hz (Fig. 4a). Note
that by 29 March, the prevailing cluster switches progres-
sively from #1 to #2 and to #3, and then back again to #1 at
the end of the eruptive episode. However, the return to
background conditions was far from being completed. The
spectrograms of 30 and 31 March are again characterized
by increasing amplitudes and narrow spectral content
(Fig. 4b, c). These changes are also mirrored in the clas-
sifier (FC), where we find patterns marked by increasing
red tones and prevailing cluster #2 and #3 (Fig. 4b, c).
Similar variations were repetitively observed in the output
of the classifier until 20 April and are described in Table 1
(Online Resource), which lists all the episodes where the
same cluster #3 appeared. These episodes temporally cor-
respond to the major peaks in the diagram in Fig. 3f, which
were defined as ‘‘failed paroxysms’’ by Langer et al.
(2011), who were the first to observe their missing link to
any eruptive activity.
With the aim of comparing the output of KKAnalysis for
volcanic tremor with radon and ambient parameters (soil
temperature and barometric pressure), we repeated the
application of the software defining the patterns in various
configurations. The reference data set containing the clas-
sification of 2007–2008 episodes for volcanic tremor was
not considered in these new applications, as no similar a
priori knowledge, namely previous pattern classification,
was available for radon and ambient parameters. In Fig. 5,
we present the results of pattern classification during the
week from 14 to 20 March. This time interval was chosen
for two reasons. Firstly, it allows us a comparison among
the outputs of the various configurations of patterns; sec-
ondly, it highlights an internal change shortly preceding the
episode of explosive activity at the BN on 19 March
(Fig. 2a, b). Figure 5c shows the application of pattern
Int J Earth Sci (Geol Rundsch)
123
Author's personal copy

Fig. 4 Results of KKAnalysis and spectrograms of volcanic tremor
from March 29 to 31, 2007 [the part pertaining 29 March was partially
presented in (Langer et al. 2011)]. Colored triangles combine the
results of SOM and fuzzy clustering; the results of fuzzy clustering
(FC) with the partition in three clusters (distinguished by red, green,
and blue color) are shown below each diagram. The vertical position
of the colored triangles in the upper panels depends on the cluster to
which a pattern prevalently belongs. The fuzziness can be immedi-
ately inferred from the dark gray bars, which cover the underlying
light gray area according to the value of the prevalent cluster
membership. In the spectrograms, frequency changes in warm colors
are associated with the paroxysmal activity on March 29, 2007, but
also with temporarily unstable internal conditions of the volcano-
feeding system (see spectrograms of 30 and 31 March 2007). The
arrow marks the climax of volcanic activity at 05:25 during the lava
fountain on 29 March; thick black bars mark the climax of the three
following episodes of seismic unrest (SU), which did not lead to any
eruptive event. PSD stands for power spectral density
Int J Earth Sci (Geol Rundsch)
123
Author's personal copy

Int J Earth Sci (Geol Rundsch)
123
Author's personal copy
classification to tremor data only. Cluster #1 and green
triangles prevail during nighttime. During daytime, some
patterns belonging to cluster #2 and #3 show up, and the
colors of the triangles turn to violet. These short-lived
daytime changes are often noticed at the station ESPC and
can be attributed to manmade noise (see Langer et al. 2011,
in particular their Fig. 13c). Between 19 and 20 March,
however, violet triangles belonging to cluster #3 form a
temporary stable regime.
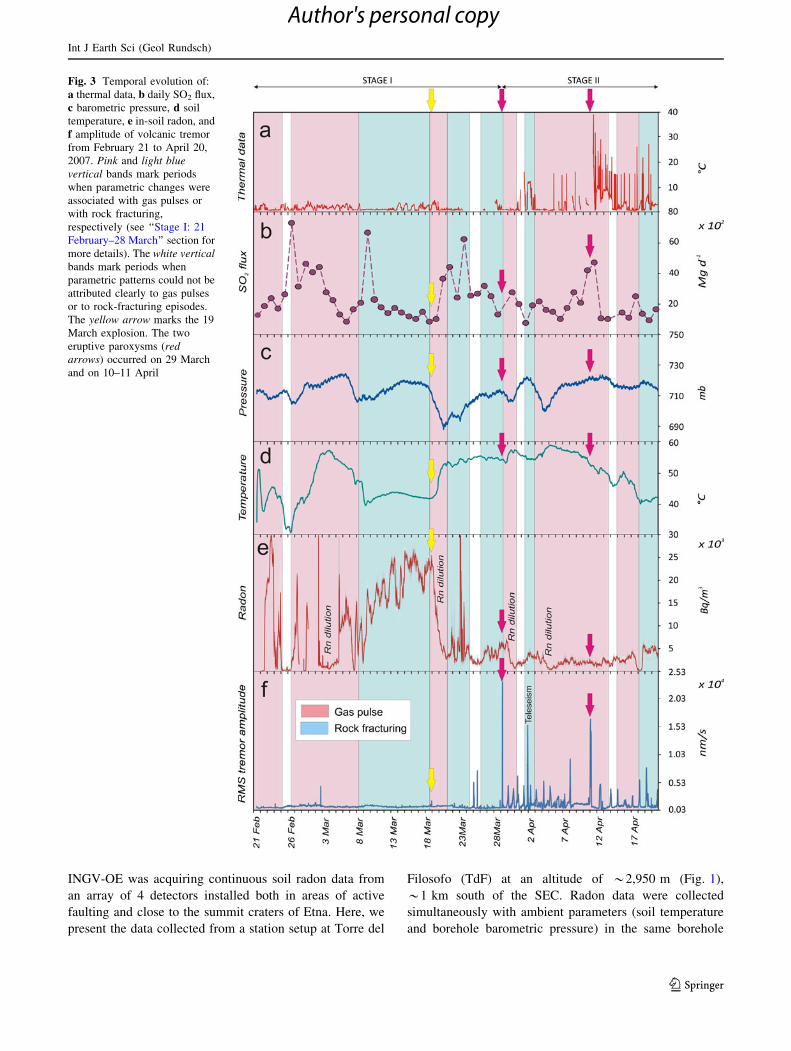
The results of the application to radon and ambient
parameters are depicted in Fig. 5f. Violet to purple trian-
gles and cluster #3 characterize the first 5 days (14–18
March). From Figs. 3e and 5e, it is evident that in these
days, the rate of radon emission was high. Between 19 and
20 March, the radon emission sharply decreased (Fig. 5e);
accordingly, the corresponding patterns were assigned to
green colors and the cluster became #1 (Fig. 5f). Overall,
in the time span examined, we observe a neat negative
correlation between the patterns of volcanic tremor and
those made up of radon, pressure, and temperature (Fig. 5c,
f).
The results obtained considering volcanic tremor—here
with 62 spectral components—radon, and ambient param-
eters depict triangles mainly from pink to violet during the
first 5 days (Fig. 5g). Green colors with cluster #3 prevail
in the last 2 days. Despite these variations, the results
remain similar to those shown in Fig. 5c. Having 62
spectral components related to volcanic tremor and only
three related to radon and ambient parameters, there was
the risk of overweighting the tremor components. For this
reason, a feature reduction was obtained carrying out the
principal component analysis on the 62 original spectral
components of tremor data and then extracting the largest
three principal components. In the fourth configuration
(Fig. 5h), using the feature reduction (from 62 to 3) of
volcanic tremor data and merging the patterns with radon
and ambient parameters, the change from cluster #1 to #3
becomes sharper and more anticipated (start at about 07:00
on 19 March) than in Fig. 5c, f, g (start at 17:00). In
addition, all the small fluctuations visible in Fig. 5c, g fade
away. As the onset of explosive activity at the BN was at
17:24 on 19 March (Fig. 2a, b), the change unveiled by
pattern classification in Fig. 5h occurred 10 h in advance.
Discussion
Earthquakes and high gas emission rates usually herald and
accompany volcanic unrest under the action of tectonic
stresses (e.g., Daag et al. 1996; Werner et al. 2011). In the
case of the eruptive activity at Etna, however, summit
eruptions are associated with strong changes in volcanic
tremor without any tectonic seismicity (e.g., Cardaci et al.
1993; Patane et al. 2004; Behncke et al. 2009). A new
phase of paroxysmal summit activity started in spring 2007
with a lava fountaining episode on 29 March. This event
had no tectonic precursors, similar to the numerous erup-
tive episodes reported by Alparone et al. (2003) at the SEC
in early 2000. Accordingly, the main engine in the trigger
of this kind of activity has to be found in the dynamics of
magma, of magmatic fluids, or in their combined action.
Distance variations along GPS baselines lengthened almost
continuously during our study period, thus revealing a mild
inflation of the volcano (Aiuppa et al. 2010). However, this
evidence offered no clues on the type of source producing
the inflation, this being the result of the ascent of magma,
of gas, or both toward the surface. Corsaro and Miraglia
(2009) carried out petrological analyses of the 2007–2008
volcanic products from erupted pyroclasts and lavas. Their
results show a clear chemical evolution of the magma,
from a more primitive composition during the first parox-
ysm on 29 March toward increasingly differentiated com-
positions in the products of the following eruptive events.
This chemical evolution is indicative of different fluid
contents (i.e., differential loss of volatiles from an
ascending magma batch which caused accumulation of the
most soluble gas species in the residual melt) and depths of
the magmas erupted. Petrological indication of a primitive
and volatile-rich magma erupted in spring 2007 supports
our interpretation that the high values of SO2 flux and
radon emission highlighted in Fig. 3 throughout Stage I
(between 21 February and 28 March) are related to a new
recharging phase of the volcanic system after the 14 July–
14 December 2006 eruption, mostly promoted by gas
overpressure. As radon measurements are strongly con-
trolled by the local state of stress within relatively shallow
rocks, the remarkably high radon concentrations observed
in Fig. 3e during Stage I are likely the results of micro-
fracturing processes acting in the summit of the volcano.
The TdF station is indeed sensitive to the pressure induced
by fluid/magma dynamics, as documented by the compa-
rably high emission values measured about 10 h before the
paroxysmal activity on July 20, 2006 (Neri et al. 2006). It
Fig. 5 Data, spectrograms, and results of KKAnalysis from March 14
to 20, 2007. a Amplitude of volcanic tremor, b spectrograms of
volcanic tremor, d ambient parameters (pressure and soil tempera-
ture), e radon. Results of the application of KKAnalysis refer to:
c volcanic tremor, f radon and ambient parameters, g volcanic tremor
(62 features), radon, and ambient parameters, h volcanic tremor (with
feature reduction from 62 to 3), radon and ambient parameters.
Colored triangles combine the results of SOM and fuzzy clustering;
the results of fuzzy clustering (FC) with the partition in three clusters
(distinguished by red, green, and blue color) are shown below each
diagram. The brown and orange arrows in (h) mark, respectively: the
change from cluster #1 to #3 at *07:00 on 19 March, highlighting a
strong modification in FC, and the start of explosive activity at the BN
at 17:24 on the same day. PSD stands for power spectral density
b
Int J Earth Sci (Geol Rundsch)
123
Author's personal copy

is noteworthy that the radon emission started to decrease
abruptly 34 h before the explosive activity on March 19,
2007 (see Fig. 5e) and that afterward, apart from a new
intense relative maximum on 23 March (Fig. 3e), radon
activity remained at low levels until the end of the study
period.
Mt. Etna is well known for having a continuous
degassing regime from its summit craters, which makes
this volcano one of the largest contributors of magmatic
gases and in particular of SO2 worldwide (e.g., Allard
1997; Allard et al. 2006; Caltabiano et al. 2004; Aiuppa
et al. 2008). This is a sign of persistent and lively dynamics
of magmatic fluids inside Etna’s feeding conduits. Inde-
pendent evidence of the persistent internal dynamics of
magmatic fluids is also given by volcanic tremor, as doc-
umented from the pioneering study by Caloi et al. (1948).
The common link with the magmatic source makes both
volcanic fluids and tremor key parameters in case of vol-
cano unrest (e.g., Leonardi et al. 2000; Watson et al. 2000;
Young et al. 2003; Palma et al. 2008). This is the reason
why their temporal relationship at Etna between 2007 and
2008 was investigated in various multidisciplinary studies
aimed at combining the high-quality data acquired by
means of the permanent monitoring system run by INGV-
OE (Bonaccorso et al. 2011a, b; Aiuppa et al. 2010).
Imaging of magma conduits using tremor sources and long-
period events highlighted a shallow plumbing system
active from October 2006 to December 2007. It consisted
of two connected NNW–SSE- and NW–SE-oriented dike-
like bodies, extending from the sea level to an elevation of
*3,000 m a.s.l. almost exactly below the SEC (Patane
et al. 2008). We surmise that this part of the plumbing
system played a fundamental role in the upward transport
of gas-rich magma without earthquake seismicity. This
hypothesis is compatible with: (1) the relative quietness of
volcanic tremor during Stage I (tremor sources located
between sea level and an absolute altitude of 2.5 km above
sea level, according to Patane et al. 2008); (2) the occur-
rence of peaks in the RMS values of volcanic tremor during
Stage II (Fig. 3f), due to activation of the shallowest por-
tion of this plumbing system (absolute altitude of tremor
sources between 2.5 and 3 km above sea level, that is less
than a few hundred meters below the summit, with tremor
sources closer to ESPC). In their medium–long-term ana-
lysis of crater plume CO2/SO2 ratios during 2007–2008,
Aiuppa et al. (2010) found decreasing values concurrent
with the March 29, 2007 paroxysm and the following
eruptive episodes, and they concluded that pressurization
of magma within the central conduit below the summit
craters might be a trigger for the eruptive episodes at the
SEC. Our investigation provides further support to this
hypothesis, shedding light on the subtle changes in gas and
volcanic tremor data observed in the short term during the
study period. Pulses of SO2 flux unveil degassing cycles
with sustained gas segregation, which along with the radon
measurements document vigorous dynamics of the vol-
cano-feeding system despite the absence of surface activity
(Fig. 3b, e). An emblematic example of such intense
internal dynamics in a period of apparent quiescence is
given by the results of pattern classification from 14 to 20
March (Fig. 5). The separate classification of the parame-
ters reveals different time scales of evolution (Fig. 5c, f).
However, looking for changes heralding or accompanying
the explosive episode on 19 March, we found that not only
patterns of volcanic tremor and combined radon/ambient
parameters had anti-correlated variations (Figs. 5c, f), but
also the SO2 flux underwent a concurrent increasing trend
starting from 19 March (Fig. 2d). Therefore, following the
above discussions, it is reasonable to infer that the anti-
correlated variations—as highlighted from the results from
pattern classification—and the SO2 trend reflect a common
source process.
Application of pattern classification to volcanic tremor
data confirms that its spectral characteristics during epi-
sodes of RMS peaks in Stage II were similar to those
observed during paroxysms, even though energetically
minor (see spectrograms in Fig. 4). In seismic records, the
sequence of RMS peaks of volcanic tremor takes the form
of the so-called banded tremor, that is repeated temporary
increments in the energy of seismic radiation typical of
dynamic geothermal systems, such as geysers (e.g., Kieffer
1984). We surmise that the vigorous gas exsolution
recorded in Stage I recharged the system and led to the
accumulation of gas bubbles in a foam layer that periodi-
cally collapsed. The rather periodical behavior might be
regulated by the size of the roof in a shallow reservoir as
for the model proposed by Vergniolle and Jaupart (1990),
or by the geometry of the plumbing system articulated in
dikes as proposed by Menand and Phillips (2007). Seismic
unrest occurred almost daily (see insert in Fig. 3) and with
rather comparable energy. This can be explained as the
result of a cyclic pressure build up and release within a
non-destructive source, which eventually overcame the
overpressure threshold only with the arrival of new gas-rich
magma, thus producing the paroxysms on 29 March and
10–11 April.
Conclusions
After the end of the July–December 2006 eruption, periods
of non-eruptive seismic unrest were recorded at Mt. Etna in
the form of enhancements in volcanic tremor amplitude.
We found that they were particularly numerous from the
end of the paroxysmal activity of March 29, 2007. Based
on a multidisciplinary data set, which integrated the long-
Int J Earth Sci (Geol Rundsch)
123
Author's personal copy

term temporal evolution of gas measurements, thermal
data, and seismic radiation, we conclude that between
February 21 and April 20, 2007 there were repeated epi-
sodes of gas pulses and rock fracturing induced by fluid
pressure build up, which led to aborted eruptions.
Analyses on geochemical and seismic data by the
application of pattern classification revealed intriguing
aspects, such as the possibility of detecting forerunning
signals of explosive activity, as observed 10 h before the
19 March event at the Bocca Nuova crater. The outcomes
from the merging of data from various parameters pro-
vide indeed more robust information than the analysis of
a single parameter (Fig. 5). On the other hand, changes
similar to those observed in the volcano feeding system
in early 2007 would additionally require a separate
classification, not only for the different time scales of
the processes involved, but also for the complex rela-
tionship between some parameters (e.g., radon and soil
temperature).
We consider the application of unsupervised classifica-
tion techniques to volcanic tremor and radon data a
promising tool for monitoring purposes and specifically for
the surveillance of active volcanoes.
Acknowledgments T. Caltabiano and F. Mure are acknowledged
for their technical assistance in the FLAME Network. We gratefully
thank D. Tomas for his comments on radon measurements and C.
Corazzato for her careful reading of the manuscript and constructive
criticism.
Appendix 1: Notes on in-soil radon measurements
Radon is a radioactive, noble gas emitted from soil and
soluble in water. Especially in volcanic/geothermal areas
with vigorous circulation of magmatic or hydrothermal
fluids at shallow depth, in-soil radon emissions are the
surface expression of convective flow of gases along
fractures. Convection facilitates the transport of radon
from depth to the surface, and the abundance of the radon
transported depends also on the abundance of uranium-
bearing rocks. In recent years, promising results were
obtained by applying soil gas radon prospecting to the
detection of hidden (but seismically active) and outcrop-
ping faults (Burton et al. 2004; Cigolini et al. 2007; Neri
et al. 2007, 2011b; Giammanco et al. 2009; Siniscalchi
et al. 2010). In active volcanic environments, increments
in in-soil radon emission that are not related to environ-
mental influences (mostly earth tides and/or changes in
atmospheric parameters, such as rainfall, barometric
pressure and air temperature) can be the expression of
changes in the mass flux within hydrothermal systems
(Durrance and Gregory 1990). These changes can be
related to increased output of magmatic gas and/or to
increased permeability of the rock due to newly formed
stress-induced fractures. On Mt. Etna, continuous soil
radon monitoring was also used to recognize precursory
signals to paroxysmal eruptive events (e.g., Cox et al.
1980; Alparone et al. 2005; Cigolini et al. 2005; Neri
et al. 2006; Giammanco et al. 2007).
Our station TdF was equipped with a BarasolTM probe
(Algade, France) placed into a borehole at a depth of 1.6 m
in pyroclastic deposits produced by the 2002–2003 erup-
tion (e.g., Allard et al. 2006). According to the specifics
given by the manufacturer, the borehole where the Bara-
solTM probe was installed was not isolated from the surface
(the borehole is capped with a small semipermeable
Mylar� sheet in order to make gas flow out of the hole
while preventing rain or snow from entering it). The probe
is held some 40 cm above the borehole bottom, as in a
fumarolic environment with a lot of water vapor, this setup
lets the gas flow freely up along the borehole (and thence
out of it through the semipermeable cap), preventing water
vapor from condensing on the sensor. The probe at the TdF
site was also modified by adding a robust filter close to the
sensor, in order to prevent any condensation of water vapor
on its surface.
Under steady flow conditions, water condensation would
cause both an increase in soil temperature due to heat loss
and an apparent increase in radon activity in the condens-
ing zone, due to the lower proportion of residual water
vapor and the higher proportion of non-condensable gases
(particularly CO2) after water condensation. However, as
already proposed by Aubert and Baubron (1988), conden-
sation of CO2-rich hydrothermal fluids rising just south of
TdF through a N–S-trending fault (namely, very close to
the location of our radon probe) produces a soil tempera-
ture anomaly right on the fault plane and an eastward lat-
eral flow of condensed water. This process, favored by the
high soil permeability in the area, was traced at the surface
by Aubert and Baubron (1988), measuring a concurrent and
decreasing anomalous emission of CO2 and radon along the
presumed direction of water flow. Both CO2 and radon
were evidently released by the flowing water after being
trapped in it, and hence were removed by water from the
residual soil gas after condensation. If the latter mechanism
is true, then the increased condensation of water vapor at
shallow depth, coupled with increased soil temperature and
decreased soil radon activity, would be caused by a
decrease in the input of high-enthalpy magmatic fluids due
to changes in volcanic activity. However, this would be in
contrast with the overall increase in volcanic activity
observed after the onset of the 2007 sequence of parox-
ysmal events. Therefore, we would be inclined toward the
mechanism of radon dilution to explain the observed
variations in temperature and radon activity. Further stud-
ies that will include monitoring of soil CO2 will possibly
Int J Earth Sci (Geol Rundsch)
123
Author's personal copy
clarify the interaction of temperature, condensation pro-
cess, and radon activity.
Appendix 2: SOM and fuzzy clustering in KKAnalysis
Kohonen maps or SOM are unsupervised pattern classifi-
ers, which ‘‘learn’’ from data of whatever nature provided
in numerical format. SOM are made up of a number of
nodes, each one representing a feature vector, and being
prototypes of a number of patterns. During the so-called
training phase, the node weights (feature vector elements)
are adjusted minimizing the differences between the nodes
and the original pattern. A pattern is assigned to the node
for which the smallest difference is encountered; this node
is referred to as the Best Matching Unit (BMU) for that
pattern. Once KKAnalysis concludes the training phase of
the SOM, the nodes are mapped into a 2D representation
space applying the principal component analysis (Fig. 6a).
KKAnalysis exploits an appealing property of SOM, often
referred to as topological fidelity, which means that pat-
terns represented by neighboring nodes in the SOM are
close to each other also in the original data space.
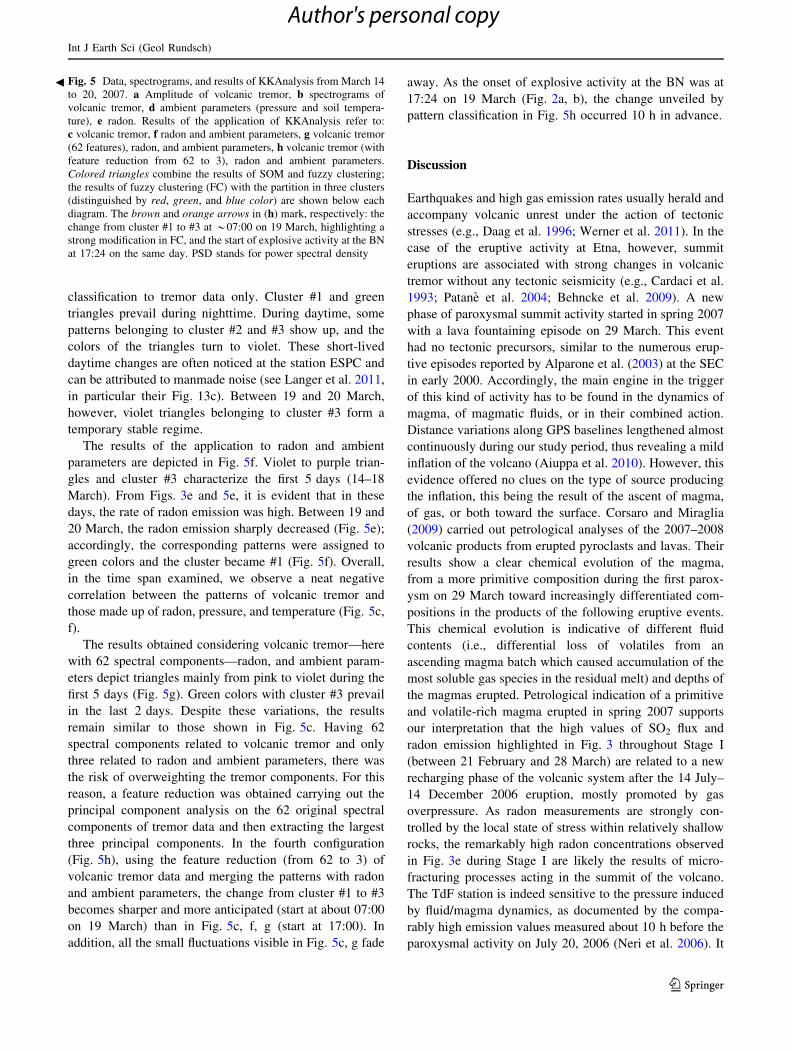
KKAnalysis applies a color coding to the nodes depending
on their position on the map and assigns to each pattern the
color of the BMU to which it belongs. Given the topo-
logical fidelity, similar patterns show similar colors.
Accordingly, changes of pattern characteristics in time are
visualized as output of KKAnalysis by creating a sequence
of colored symbols.
Along with SOM, KKAnalysis exploits the so called
fuzzy clustering algorithm. This algorithm allows the
potential allocation of a pattern into several clusters (or
classes) according to a vector, which identifies its mem-
bership (Fig. 6b). A pattern with membership 1 belongs
exclusively to one cluster. In case of membership \1, the
vector components indicate to which degree a pattern
belongs to various clusters. A membership \0.5 means
rather fuzzy. Combined with the colors of the nodes of the
SOM, fuzzy clustering allows the identification of transi-
tional regimes between clusters, highlighting the develop-
ment of the characteristics of a multidimensional feature
vector.
Appendix 3: Application of KKAnalysis to seismic
and radon data
Before using KKAnalysis, we preprocessed our seismic
data recorded at ESPC (Fig. 1), calculating the spectral
content of volcanic tremor from February 21 to April 20,
2007. The spectral analysis was carried out applying the
Short Time Fourier Transform. We followed Langer et al.
(2011), preparing feature vectors with 62 components, each
of which corresponded to power spectral densities in fre-
quency bins of *0.29 Hz. The total frequency range
covered was from 0.15 to 18 Hz. Each pattern represented
5 min of tremor data, with a total of 288 patterns per day.
The whole amount of patterns obtained was 16,992, rep-
resentative of 59 consecutive days. For the setting of
KKAnalysis, we fixed the size of the SOM at 40 9 9
nodes, the same size chosen by Langer et al. (2011), and
similarly we considered three clusters for the fuzzy clus-
tering. Patterns representative for the 2007–2008 eruptive
episodes analyzed by Langer et al. (2011) were considered
as a reference data set, as they represented spectral char-
acteristics of volcanic tremor shortly before, during, and
immediately after climactic volcanic activity.
Exploiting our experience on volcanic tremor classifi-
cation, we applied KKAnalysis to radon data along with
barometric pressure and soil temperature measurements
acquired at the same site with the same sampling rate, as
the latter two parameters affect radon emission (e.g., Au-
bert and Baubron 1988). Also in this case, we preprocessed
the data set for numerical purposes, applying a logistic
normalization function to the raw data. Overall, we
Fig. 6 Principles of functioning of KKAnalysis: a Kohonen maps,
b fuzzy clustering. The input data in a can be of whatever nature
though expressed in a numerical form. In our application, data were
given by the spectral content of volcanic tremor, radon values,
temperature, and pressure. The vector components (red, green, and
blue color) in b indicate to which degree, expressed by the results of
fuzzy clustering (FC, ranging 0–1), a pattern belongs to various
clusters (three in the example)
Int J Earth Sci (Geol Rundsch)
123
Author's personal copy

obtained some 16,000 patterns sampled with a time interval
of 5 min, covering a total of 59 days.
References
Aiuppa A, Giudice G, Gurrieri S, Liuzzo M, Burton M, Caltabiano T,
McGonigle AJS, Salerno G, Shinohara H, Valenza M (2008)
Total volatile flux from Mount Etna. Geophys Res Lett
35:L24302. doi:10.1029/2008GL035871
Aiuppa A et al (2010) Patterns in the recent 2007–2008 activity of
Mount Etna volcano investigated by integrated geophysical and
geochemical observations. Geochem Geophys Geosyst
11:Q09008. doi:10.1029/2010GC003168
Allard P (1997) Endogenous magma degassing and storage at Mount
Etna. Geophys Res Lett 24:2219–2222
Allard P, Behncke B, D’Amico S, Neri M, Gambino S (2006) Mount
Etna 1993–2005: anatomy of an evolving eruptive cycle. Earth
Sci Rev 78:85–114. doi:10.1016/j.earscirev.2006.04.002
Alparone S, Andronico D, Lodato L, Sgroi T (2003) Relationship
between tremor and volcanic activity during the Southeast Crater
eruption on Mount Etna in early 2000. J Geophys Res
108(B5):2241. doi:10.1029/2002JB001866
Alparone S, Andronico D, Giammanco S, Lodato L (2004) A
multidisciplinary approach to detect active pathways for magma
migration and eruption in a basaltic volcano: the upper southern
flank of Mt. Etna (Sicily, Italy) before the 2001 eruption.
J Volcanol Geotherm Res 136:121–140
Alparone S, Behncke B, Giammanco S, Neri M, Privitera E (2005)
Paroxysmal summit activity at Mt. Etna monitored through
continuous soil radon measurements. Geophys Res Lett
32:L16307. doi:10.1029/2005GL023352
Ando B, Pecora E (2005) A measurement tool for investigating the
volcanic activity. In: IEEE IMTC 2005, Ottawa, Canada, IMTC
Proceedings 3, 2039–2043
Ando B, Pecora E (2006) An advanced video-based system for
monitoring active volcanoes. Comput Geosci 32:85–91
Andronico D, Cristaldi A, Scollo S (2008) The 4–5 September 2007
lava fountain at South-East Crater of Mt Etna, Italy. J Volcanol
Geotherm Res 173:325–328
Aubert M, Baubron JC (1988) Identification of a hidden thermal
fissure in a volcanic terrain using a combination of hydrothermal
convection indicators and soil-atmosphere analysis. J Volcanol
Geotherm Res 35:217–225
Ball M, Pinkerton H (2006) Factors affecting the accuracy of thermal
imaging cameras in volcanology. J Geophys Res 111:B11203.
doi:10.1029/2005JB003829
Behncke B, Neri M, Pecora E, Zanon V (2006) The exceptional
activity and growth of the Southeast Crater, Mount Etna (Italy),
between 1996 and 2001. Bull Volcanol 69:149–173. doi:10.
1007/s00445-006-0061-x
Behncke B, Falsaperla S, Pecora E (2009) Complex magma dynamics
at Mount Etna revealed by seismic, thermal and volcanological
data. J Geophys Res 114:B03211. doi:10.1029/2008JB005882
Bonaccorso A, Calvari S, Coltelli M, Del Negro C, Falsaperla S (2004)
Mt. Etna: volcano laboratory. AGU Monograph vol. 143, Wash-
ington DC, ISBN: 0-87590-408-4, pp 1–369. doi:10.1029/GM143
Bonaccorso A, Caltabiano T, Currenti G, Del Negro C, Gambino S,
Ganci T, Giammanco S, Greco F, Pistorio A, Salerno G,
Spampinato S, Boschi E (2011a) Dynamics of a lava fountain
revealed by geophysical, geochemical and thermal satellite
measurements: the case of 10 April 2011 Mt. Etna eruption.
Geophys Res Lett 38:L24307. doi:10.1029/2011GL049637
Bonaccorso A, Bonforte A, Calvari S, Del Negro C, Di Grazia G,
Ganci G, Neri M, Vicari A, Boschi E (2011b) The initial phases
of the 2008–2009 Mount Etna eruption: a multidisciplinary
approach for hazard assessment. J Geophys Res 116:B03203.
doi:10.1029/2010JB007906
Burton M, Neri M, Condarelli D (2004) High spatial resolution radon
measurements reveal hidden active faults on Mt. Etna. Geophys
Res Lett 31(7):L07618. doi:10.1029/2003GL019181
Caloi P, Losurdo A, Ponte G (1948) Agitazioni micro-sismiche
originate da attivita vulcanica. Ann Geofis 1:5–9
Caltabiano T, Burton M, Giammanco S, Allard P, Bruno N, Mure F,
Romano R (2004) Volcanic gas emission from the summit
craters and flanks of Mt. Etna, 1987–2000. In: Calvari S,
Bonaccorso A, Coltelli M, Del Negro C, Falsaperla S (eds) Mt.
Etna: volcano laboratory, Geophysical Monograph Series 143:
369, AGU, Washington, DC. doi:10.1029/GM143
Calvari S, Salerno GG, Spampinato L, Gouhier M, La Spina A,
Pecora E, Harris AJL, Labazuy P, Biale E, Boschi E (2011) An
unloading foam model to constrain Etna’s 11–13 January 2011
lava fountaining episode. J Geophys Res 116:B11207.
doi:2011JB008407
Campion R, Salerno GG, Coheur PF, Hurtmans D, Clarisse L,
Kazahaya K, Burton M, Caltabiano T, Clerbaux C, Bernard A
(2010) Measuring volcanic degassing of SO2 in the lower
troposphere with ASTER band ratios. J Volcanol Geoth Res
194(1–3):42–54
Cardaci C, Falsaperla S, Gasperini P, Lombardo G, Marzocchi W,
Mulargia F (1993) Cross-correlation analysis of seismic and
volcanic data at Mt. Etna volcano, Italy. Bull Volcanol
55:596–603. doi:101007/BF00301812
Cigolini C, Gervino G, Bonetti R, Conte F, Laiolo M, Coppola D,
Manzoni A (2005) Tracking precursors and degassing by radon
monitoring during major eruptions at Stromboli Volcano (Aeo-
lian Islands, Italy). Geophys Res Lett 32:L12308. doi:10.1029/
2005GL022606
Cigolini C, Laiolo M, Coppola D (2007) Earthquake–volcano
interactions detected from radon degassing at Stromboli (Italy).
Earth Planet Sci Lett 257:511–525. doi:10.1016/j.epsl.2007.03.
022
Corsaro RA, Miraglia L (2009) Dynamics of magma in the plumbing
system of Mt Etna volcano, Sicily, Italy: a contribution from
petrologic data of volcanics erupted from 2007 to 2009. Eos
Trans AGU, 90(52) Fall Meet Suppl, abstract V51C1690
Corsaro RA, Falsaperla S, Langer H (2013) Geochemical pattern
classification of recent volcanic products from Mt. Etna, Italy,
based on Kohonen maps and fuzzy clustering. Int J Earth Sci.
doi:10.1007/s00531-012-0851-7
Cox ME, Cuff KE, Thomas DM (1980) Variations of ground radon
concentrations with activity of Kilauea Volcano, Hawaii. Nature
288:74–76
D’Agostino M, Di Grazia G, Ferrari F, Langer H, Messina A, Reitano
D, Spampinato S (2013) Volcano monitoring and early warning
on Mt Etna based on Volcanic Tremor—methods and technical
aspects. In: Zobin V (ed) Complex monitoring of volcanic
activity: methods and results. Nova Science Publishers Inc.,
Hauppage, NY
Daag AS, Dolan MT, Laguerta EP, Meeker GP, Newhall CG, Pallister
JS, Solidum RU (1996) Monitoring sulphur dioxide emissions at
Mount Pinatubo, Philippines. In: Newhall CG, Punongbayan RS
(eds) Fire and mud: eruptions and lahars of Mount Pinatubo.
Philippine Institute of Volcanology and Seismology, Quezon
City, PH, pp 647–664
Durrance EM, Gregory RG (1990) Helium and radon transport
mechanisms in hydrothermal circulation systems of southwest
England. In: Durrance EM, Galimov EM, Hinckle ME, Reimer
Int J Earth Sci (Geol Rundsch)
123
Author's personal copy

GM, Sugisaki R, Autustithis SS (eds) Geochemistry of gaseous
elements and compounds. Theophrastus, Athens, pp 337–352
Feuillard M, Allegre CJ, Brandeis G, Gaulon R, Le Mouel JL,
Mercier JC, Pozzi JP, Semet MP (1983) The 1975–1977 crisis of
la Soufriere de Guadeloupe (FWI): a still-born magmatic
eruption. J Volcanol Geotherm Res 16(3–4):317–334
Fiske RS (1984) Volcanologists, journalists, and the concerned local
public: a tale of two crises in the eastern Caribbean. In: Studies
in geophysics explosive volcanism: inception, evolution and
hazards. National Academy Press, Washington, pp 170–176
Giammanco S, Sims KWW, Neri M (2007) Measurements of 220Rn
and 222Rn and CO2 emissions in soil and fumarole gases on Mt
Etna volcano (Italy): implications for gas transport and shallow
ground fracture. Geochem Geophys Geosyst 8:Q10001. doi:10.
1029/2007GC001644
Giammanco S, Imme G, Mangano G, Morelli D, Neri M (2009)
Comparison between different methodologies for detecting
radon in soil along an active fault: the case of the Pernicana
fault system, Mt. Etna. Appl Radiat Isot 67(1):178–185. doi:10.
1016/j.apradiso.2008.09.007
Gruppo Analisi Dati Sismici (2013) Catalogo dei terremoti della
Sicilia Orientale —Calabria Meridionale (1999–2011). INGV,
Catania. http://www.ct.ingv.it/ufs/analisti/catalogolist.php
Kieffer S (1984) Seismicity at old faithful geyser: an isolated source
of geothermal noise and possible analogue of volcanic seismic-
ity. J Volcanol Geotherm Res 22:59–95
Kohonen T (1984) Self-organization and associative memory.
Springer series in information sciences, vol 8, 1st edn. Springer,
New York
Kohonen T (2001) Self organizing maps, 3rd edn. Springer, Berlin
Langer H, Falsaperla S, Messina A, Spampinato S, Behncke B (2011)
Detecting imminent eruptive activity at Mt Etna, Italy, in
2007–2008 through pattern classification of volcanic tremor
data. J Volcanol Geoth Res. doi:10.1016/j.jvolgeores.2010.11.
019
Leonardi S, Gresta S, Mulargia F (2000) Searching for a significant
correlation between volcanic tremor amplitude and SO2 emis-
sions at Mount Etna volcano, Sicily. Geophys J Int 141:832–834
Menand T, Phillips JC (2007) Gas segregation in dykes and sills.
J Volcanol Geotherm Res 159:393–408
Merucci L, Burton M, Corradini S, Salerno GG (2011) Reconstruction
of SO2 flux emission chronology from space-based measure-
ments. J Volcanol Geoth Res 206:80–87
Messina A, Langer H (2011) Pattern recognition of volcanic tremor
data on Mt Etna (Italy) with KKAnalysis—a software for
unsupervised classification. Comput Geosci. doi:10.1016/j.
cageo.2011.03.015
Moran SC, Newhall C, Roman DC (2011) Failed magmatic eruptions:
late-stage cessation of magma ascent. Bull Volcanol
73(2):115–122
Neri M, Behncke B, Burton M, Giammanco S, Pecora E, Privitera E,
Reitano D (2006) Continuous soil radon monitoring during the
July 2006 Etna eruption. Geophys Res Lett 33:L24316. doi:10.
1029/2006GL028394
Neri M, Guglielmino F, Rust D (2007) Flank instability on Mount
Etna: radon, radar interferometry, and geodetic data from the
southern boundary of the unstable sector. J Geophys Res 112.
doi:10.1029/2006JB004756
Neri M, Casu F, Acocella V, Solaro G, Pepe S, Berardino P, Sansosti
E, Caltabiano T, Lundgren P, Lanari R (2009) Deformation and
eruptions at Mt. Etna (Italy): a lesson from 15 years of
observations. Geophys Res Lett 36:L02309. doi:10.1029/
2008GL036151
Neri M, Acocella V, Behncke B, Giammanco S, Mazzarini F, Rust D
(2011a) Structural analysis of the eruptive fissures at Mount Etna
(Italy). Ann Geophys 54(5):464–479. doi:10.4401/ag-5332
Neri M, Giammanco S, Ferrera E, Patane G, Zanon V (2011b) Spatial
distribution of soil radon as a tool to recognize active faulting on
an active volcano: the example of Mt. Etna (Italy). J Environ
Radioact 102:863–870. doi:10.1016/j.jenvrad.2011.05.002
Palma JL, Calder ES, Basualto D, Blake S, Rothery DA (2008)
Correlations between SO2 flux, seismicity, and outgassing
activity at the open vent of Villarrica volcano, Chile. J Geophys
Res 113:B10201. doi:10.1029/2008JB005577
Patane D, Cocina O, Falsaperla S, Privitera E, Spampinato S (2004)
Mt Etna volcano: a seismological framework. In: Bonaccorso A,
Calvari S, Coltelli M, Del Negro C, Falsaperla S (eds) Mt. Etna:
Volcano Laboratory, AGU Monograph vol 143, Washington DC,
AGU, ISBN/ISSN: 0-87590-408-4, pp 147–165. doi:10.1029/
GM143
Patane D, Di Grazia G, Cannata A, Montalto P, Boschi E (2008) Shallow
magma pathway geometry at Mt. Etna volcano. Geochem Geophys
Geosyst 9:Q12021. doi:10.1029/2008GC002131
Patane D, Aiuppa A, Aloisi M, Behncke B, Cannata A, Coltelli M, Di
Grazia G, Gambino S, Gurrieri S, Mattia M, Salerno G (2013)
Insights into magma and fluid transfer at Mount Etna by a
multiparametric approach: a model of the events leading to the
2011 eruptive cycle. J Geophys Res Solid Earth 118. doi:10.
1002/jgrb.50248
Pecora E, Biale E (2007) Rapporto sull’attivita esplosiva dell’Etna del
19/03/2007. INGV Internal Report, Prot int no UFSO 2007/001,
pp. 3, (earth-prints repository, http://hdl.handle.net/2122/8727
Pecoraino G, Giammanco S (2005) Geochemical characterization and
temporal changes in parietal gas emissions at Mt. Etna (Italy)
during the period July 2000–July 2003. Terr Atmosph Ocean Sci
16(4):805–841
Pinault JL, Baubron JC (1996) Signal processing of soil gas radon,
atmospheric pressure, moisture, and soil temperature data: a new
approach for radon concentration modelling. J Geophys Res
101(B2):3157–3172
Platt U, Stutz J (2008) Differential optical absorption spectroscopy:
principles and applications. Physics of earth and space environ-
ments. Springer Verlag, Heidelberg. ISBN 978-3540211938
Salerno GG, Burton MR, Oppenheimer C, Caltabiano T, Randazzo D,
Bruno N, Longo V (2009a) Three-years of SO2 flux measure-
ments of Mt. Etna using an automated UV scanner array:
comparison with conventional traverses and uncertainties in flux
retrieval. J Volcanol Geotherm Res 183:76–83
Salerno GG, Burton MR, Oppenheimer C, Caltabiano T, Tsanev VI,
Bruno N (2009b) Novel retrieval of volcanic SO2 abundance
from ultraviolet spectra. J Volcanol Geotherm Res
181(141–153):395
Siniscalchi A, Tripaldi S, Neri M, Giammanco S, Piscitelli S, Balasco
M, Behncke B, Magrı C, Naudet V, Rizzo E (2010) Insights into
fluid circulation across the Pernicana Fault (Mt Etna, Italy) and
implications for flank instability. J Volcanol Geotherm Res
193:137–142. doi:10.1016/j.jvolgeores.2010.03.013
Spampinato L, Calvari S, Oppenheimer C, Boschi E (2011) Volcano
surveillance using infrared cameras. Earth-Sci Rev 106:63–91
Thomas DM (1988) Geochemical precursors to seismic activity. Pure
Appl Geophys 126(2–4):241–265
Vergniolle S, Jaupart C (1990) Dynamics of degassing at Kilauea
Volcano, Hawaii. J Geophys Res 95:2793–2809
Vicari A, Ganci G, Behncke B, Cappello A, Neri M, Del Negro C
(2011) Near-real-time forecasting of lava flow hazards during the
12–13 January 2011 Etna eruption. Geophys Res Lett
38:L13317. doi:10.1029/2011GL047545
Watson IM, Oppenheimer C, Voight B, Francis PW, Clarke A, Stix J,
Miller A, Pyle DM, Burton MR, Young SR, Norton G, Loughlin
S, Darroux B, Staff MVO (2000) The relationship between
degassing and ground deformation at Soufriere Hills Volcano,
Montserrat. J Volcanol Geoth Res 98:117–126
Int J Earth Sci (Geol Rundsch)
123
Author's personal copy

Werner CA, Doukas MP, Kelly P (2011) Gas emissions from failed
and actual eruptions from Cook Inlet Volcanoes, Alaska,
1989–2006. In: Moran SC, Newhall CG, Roman DC (eds)
Failed eruptions: late stage cessation of magma ascent. Bull
Volcanol 73(2):155–173
Young SR, Voight B, Duffel HJ (2003) Magma extrusion dynamics
revealed by high-frequency gas monitoring at Soufriere Hills
volcano, Montserrat. In: Oppenheimer C, Pyle DM, Barclay J
(eds) Volcanic degassing, The Geological Society of London
213:219–230
Zadeh LA (1965) Fuzzy sets. Inf Control 8:338–353
Int J Earth Sci (Geol Rundsch)
123
Author's personal copy