James et al. Epigenetics 2013
19
www.landesbioscience.com Epigenetics 849 Epigenetics 8:8, 849–863; August 2013; © 2013 Landes Bioscience RESEARCH PAPER RESEARCH PAPER *Correspondence to: Adam R. Karpf; Email: [email protected] Submitted: 05/26/13; Revised: 06/18/13; Accepted: 06/21/13 http://dx.doi.org/10.4161/epi.25500 Introduction Cancer testis or germline (CG) antigen genes are expressed in germ cells and human tumors and encode immunogenic tumor antigens. 1,2 Vaccines targeting CG antigens are undergoing clini- cal testing in a variety of human malignancies that include mela- noma, lung, and ovarian cancers. 2 In addition to their significance as immunotherapy targets, CG gene products may contribute to oncogenesis. In particular, the MAGE gene family contains a MAGE homology domain (MHD), which in some instances can MAGEA11 is a cancer germline (CG) antigen and androgen receptor co-activator. Its expression in cancers other than prostate, and its mechanism of activation, has not been reported. In silico analyses reveal that MAGEA11 is frequently expressed in human cancers, is increased during tumor progression, and correlates with poor prognosis and survival. In prostate and epithelial ovarian cancers (EOC), MAGEA11 expression was associated with promoter and global DNA hypomethylation, and with activation of other CG genes. Pharmacological or genetic inhibition of DNA methyltransferases (DNMTs) and/or histone deacetylases (HDACs) activated MAGEA11 in a cell line specific manner. MAGEA11 promoter activity was directly repressed by DNA methylation, and partially depended on Sp1, as pharmacological or genetic targeting of Sp1 reduced MAGEA11 promoter activity and endogenous gene expression. Importantly, DNA methylation regulated nucleosome occupancy specifically at the -1 positioned nucleosome of MAGEA11. Methylation of a single Ets site near the transcriptional start site (TSS) correlated with -1 nucleosome occupancy and, by itself, strongly repressed MAGEA11 promoter activity. Thus, DNA methylation regulates nucleosome occupancy at MAGEA11 , and this appears to function cooperatively with sequence-specific transcription factors to regulate gene expression. MAGEA11 regulation is highly instructive for understanding mechanisms regulating CG antigen genes in human cancer. DNA methylation and nucleosome occupancy regulate the cancer germline antigen gene MAGEA11 Smitha R. James, 1,†,‡ Carlos D. Cedeno, 1,† Ashok Sharma, 2 Wa Zhang, 1,2 James L. Mohler, 3 Kunle Odunsi, 4 Elizabeth M. Wilson 5 and Adam R. Karpf 1,2, * 1 Department of Pharmacology and Therapeutics; Roswell Park Cancer Institute; Buffalo, NY USA; 2 Eppley Institute for Research in Cancer; University of Nebraska Medical Center; Omaha, NE USA; 3 Department of Urology; Roswell Park Cancer Institute; Buffalo, NY USA; 4 Departments of Immunology, Gynecologic Oncology, and Center for Immunotherapy; Roswell Park Cancer Institute; Buffalo, NY USA; 5 Department of Pediatrics, Biochemistry and Biophysics; Lineberger Comprehensive Cancer Center; University of North Carolina; Chapel Hill, NC USA † These authors contributed equally to this work. ‡ Current affiliation: Center of Excellence in Bioinformatics and Life Sciences; University at Buffalo; Buffalo, NY USA Keywords: DNA methylation, epigenetics, nucleosome occupancy, cancer germline genes, cancer testis genes, MAGEA11 Abbreviations: AS, androgen-sensitive prostate cancer; BP, benign prostatic hyperplasia; CG, cancer-germline; ChIP, chromatin immunoprecipitation; CR, castration-recurrent prostate cancer; DAC, 5-aza-2'-deoxycytidine; DKO cells, HCT116 DNMT1 −/− , 3b −/− double knockout cells; DNMT, cytosine DNA methyltransferase; EOC, epithelial ovarian cancer; HDAC, histone deacetylase; MAGEA11, melanoma antigen a11; MAPit, methyltransferase accessibility protocol for individual templates; MitA, mithromycin A; NO, normal ovary; RT-qPCR, reverse transcriptase quantitative PCR; TIC, transcriptional initiation complex; TSA, Trichostatin A; TSS, transcriptional start site serve as a binding module for the RING family of ubiquitin E3 ligases to promote degradation of the tumor suppressor protein p53. 3 MAGEA11 facilitates co-activator recruitment to the andro- gen receptor (AR) in the absence and presence of ligand, leading to activation of AR target genes in prostate cancer. 4 Other CG genes make distinct contributions to oncogenesis. 5-9 These stud- ies suggest that CG antigen proteins have potential as therapeutic targets, beyond their current role in cancer immunotherapy. We previously reported that the MAGEA11 promoter CpG island is hypermethylated in benign prostatic intraepithelial ©2013 Landes Bioscience. Do not distribute.
Transcript of James et al. Epigenetics 2013

www.landesbioscience.com Epigenetics 849
Epigenetics 8:8, 849–863; August 2013; © 2013 Landes Bioscience
REsEARch pApER REsEARch pApER
*Correspondence to: Adam R. Karpf; Email: [email protected]: 05/26/13; Revised: 06/18/13; Accepted: 06/21/13http://dx.doi.org/10.4161/epi.25500
Introduction
Cancer testis or germline (CG) antigen genes are expressed in germ cells and human tumors and encode immunogenic tumor antigens.1,2 Vaccines targeting CG antigens are undergoing clini-cal testing in a variety of human malignancies that include mela-noma, lung, and ovarian cancers.2 In addition to their significance as immunotherapy targets, CG gene products may contribute to oncogenesis. In particular, the MAGE gene family contains a MAGE homology domain (MHD), which in some instances can
MAGEA11 is a cancer germline (cG) antigen and androgen receptor co-activator. Its expression in cancers other than prostate, and its mechanism of activation, has not been reported. In silico analyses reveal that MAGEA11 is frequently expressed in human cancers, is increased during tumor progression, and correlates with poor prognosis and survival. In prostate and epithelial ovarian cancers (EOc), MAGEA11 expression was associated with promoter and global DNA hypomethylation, and with activation of other cG genes. pharmacological or genetic inhibition of DNA methyltransferases (DNMTs) and/or histone deacetylases (hDAcs) activated MAGEA11 in a cell line specific manner. MAGEA11 promoter activity was directly repressed by DNA methylation, and partially depended on sp1, as pharmacological or genetic targeting of sp1 reduced MAGEA11 promoter activity and endogenous gene expression. Importantly, DNA methylation regulated nucleosome occupancy specifically at the -1 positioned nucleosome of MAGEA11. Methylation of a single Ets site near the transcriptional start site (Tss) correlated with -1 nucleosome occupancy and, by itself, strongly repressed MAGEA11 promoter activity. Thus, DNA methylation regulates nucleosome occupancy at MAGEA11, and this appears to function cooperatively with sequence-specific transcription factors to regulate gene expression. MAGEA11 regulation is highly instructive for understanding mechanisms regulating cG antigen genes in human cancer.
DNA methylation and nucleosome occupancy regulate
the cancer germline antigen gene MAGEA11smitha R. James,1,†,‡ carlos D. cedeno,1,† Ashok sharma,2 Wa Zhang,1,2 James L. Mohler,3 Kunle Odunsi,4 Elizabeth M. Wilson5
and Adam R. Karpf1,2,*
1Department of pharmacology and Therapeutics; Roswell park cancer Institute; Buffalo, NY UsA; 2Eppley Institute for Research in cancer; University of Nebraska Medical center; Omaha, NE UsA; 3Department of Urology; Roswell park cancer Institute; Buffalo, NY UsA; 4Departments of Immunology, Gynecologic Oncology, and center for
Immunotherapy; Roswell park cancer Institute; Buffalo, NY UsA; 5Department of pediatrics, Biochemistry and Biophysics; Lineberger comprehensive cancer center; University of North carolina; chapel hill, Nc UsA
†These authors contributed equally to this work.
‡current affiliation: center of Excellence in Bioinformatics and Life sciences; University at Buffalo; Buffalo, NY UsA
Keywords: DNA methylation, epigenetics, nucleosome occupancy, cancer germline genes, cancer testis genes, MAGEA11
Abbreviations: AS, androgen-sensitive prostate cancer; BP, benign prostatic hyperplasia; CG, cancer-germline; ChIP, chromatin immunoprecipitation; CR, castration-recurrent prostate cancer; DAC, 5-aza-2'-deoxycytidine; DKO cells, HCT116 DNMT1−/−,
3b−/− double knockout cells; DNMT, cytosine DNA methyltransferase; EOC, epithelial ovarian cancer; HDAC, histone deacetylase; MAGEA11, melanoma antigen a11; MAPit, methyltransferase accessibility protocol for individual templates; MitA, mithromycin A; NO, normal ovary; RT-qPCR, reverse transcriptase quantitative PCR; TIC, transcriptional initiation complex;
TSA, Trichostatin A; TSS, transcriptional start site
serve as a binding module for the RING family of ubiquitin E3 ligases to promote degradation of the tumor suppressor protein p53.3 MAGEA11 facilitates co-activator recruitment to the andro-gen receptor (AR) in the absence and presence of ligand, leading to activation of AR target genes in prostate cancer.4 Other CG genes make distinct contributions to oncogenesis.5-9 These stud-ies suggest that CG antigen proteins have potential as therapeutic targets, beyond their current role in cancer immunotherapy.
We previously reported that the MAGEA11 promoter CpG island is hypermethylated in benign prostatic intraepithelial
©20
13 L
ande
s B
iosc
ienc
e. D
o no
t dis
tribu
te.

850 Epigenetics Volume 8 Issue 8
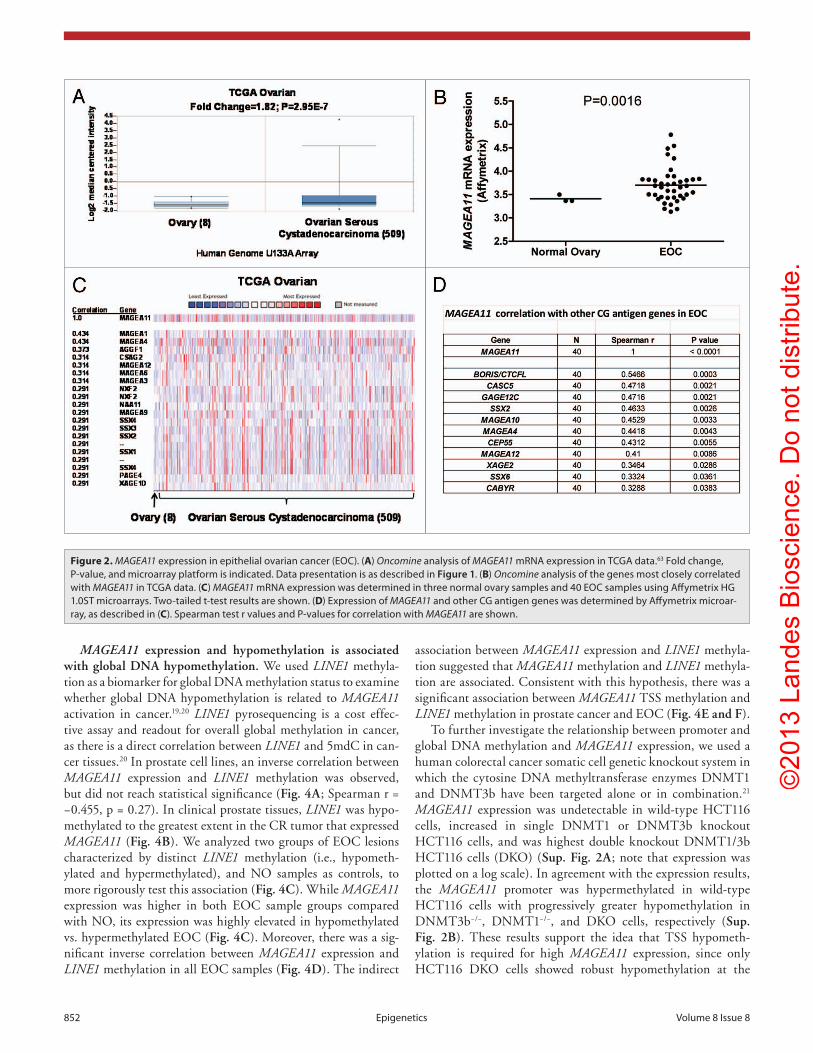
prostate cancer is associated with activation of other CG anti-gen genes, we measured MAGEA11 and three representative CG genes, MAGEA1, NY-ESO1 and XAGE1, in benign or malignant human prostate cells. Each of the CG genes was not significantly expressed in benign prostate cell lines, but was heterogeneously expressed in prostate cancer cell lines (Fig. 1D). MAGEA11 was low to moderately expressed in benign prostate and most can-cer cell lines, and elevated in LAPC-4 cells (Fig. 2A). LAPC-4 also displayed the highest expression of other CG genes (Fig. 1D). To further assess the correlation between MAGEA11 and other CG gene expression, we analyzed primary prostate tis-sue samples, which included benign prostatic hyperplasia (BP), androgen-stimulated prostate cancer (AS), and castration-recur-rent prostate cancer (CR). MAGEA11 was highly expressed in a CR sample (CR1), that also was the only sample with significant expression of other CG genes (Fig. 1E). The data suggest that MAGEA11 is expressed concordantly with other CG genes in prostate cancer. Next, Oncomine was used to determine whether MAGEA11 is expressed in human cancers other than prostate. We found that MAGEA11 expression is elevated in a number of different human cancers, including esophageal and kidney (renal cell) tumors (Fig. S1A and C). MAGEA11 was expressed in 20–40% of these lesions, and its expression correlated with that of other MAGEA genes (data not shown). Furthermore, in both tumor types, MAGEA11 expression was associated with poor prognosis, similar to prostate cancer (Fig. S1B and D). We also analyzed MAGEA11 expression in human EOC, which has proven a useful disease model to study CG antigen gene regulation.18-20 Oncomine analysis of the Cancer Genome Atlas (TCGA) high-grade serous ovarian cancer data revealed significant elevation of MAGEA11 expression in EOC as com-pared with normal ovary (Fig. 2A). MAGEA11 was expressed in ~20% of EOC lesions in the TCGA (i.e., above the Oncomine median expression value and significantly elevated compared with normal ovary). Spurred by these data, we directly examined MAGEA11 expression in a set of primary EOC tissues. We used Affymetrix HG 1.0 ST microarrays to analyze the expression of MAGEA11 and other CG antigens in three NO and 40 EOC tissues described earlier.19 In agreement with the TCGA data, we observed significant elevation of MAGEA11 in EOC compared with NO (Fig. 2B). The TCGA data was explored further to determine whether MAGEA11 expression correlates with other CG genes. Genes with the highest correlation to MAGEA11 were known CG antigen genes, including other MAGEA family mem-bers (Fig. 2C). In agreement with the TCGA, MAGEA11 expres-sion correlated with other CG antigen genes in our EOC sample set (Fig. 2D).
MAGEA11 expression is associated with DNA hypomethyl-ation at its TSS. In our previous analysis of prostate cancer cell lines, we observed DNA methylation proximal to the predicted MAGEA11 TSS, rather than at the 5' end of the promoter CpG island.10 Bisulfite clonal sequencing was performed in the normal PWR-1E prostate epithelial cell line, which has low MAGEA11 expression, to determine whether proximal promoter methyla-tion is critical for MAGE-A11 expression (Fig. 3A). PWR-1E cells displayed partial DNA methylation throughout most of the 5'
neoplasia, but can become hypomethylated in prostate cancer, particularly in castration-recurrent disease, and that this occurs in conjunction with gene activation.10 MAGEA11 appears to make a specific contribution to prostate cancer via its myriad of effects on AR signaling.4 However, two fundamental questions remain. First, is MAGEA11 activation a specifically selected event, or is it associated with activation of other CG genes, as a result of a global epigenetic alteration, e.g., global DNA hypo-methylation?11 Second, is MAGEA11 activated in human cancers other than prostate and, if so, does this result from epigenetic alterations?
DNA methylation is intertwined with other epigenetic mech-anisms that include histone acetylation, histone methylation, and nucleosome occupancy.12 Studies aimed to discern the rela-tionship among these interdependent mechanisms at genes epi-genetically activated in cancer, which include CG antigens, are limited. Recent work has explored the role of DNA methylation and histone modifications in CG antigen gene regulation,13-16 but information is lacking about the role of nucleosome occupancy in CG antigen gene regulation, or how this relates to other epigen-etic marks. Also, epigenetic remodeling alone appears insufficient for CG gene activation, which additionally requires the action of sequence-specific transcription factors.1,17 How diverse epigenetic mechanisms and transcription factors are integrated to promote CG gene expression in cancer is unresolved.
An in silico analysis of MAGEA11 gene expression was con-ducted in human cancer to begin to address these questions. Cell lines and primary tissues from prostate and epithelial ovar-ian cancers (EOC) were analyzed to determine the relationship among MAGEA11 expression, promoter DNA hypomethylation, and global DNA hypomethylation. Genetic and pharmacologi-cal approaches were applied to cancer cell lines to determine the relationship among DNA methylation, histone acetylation, and MAGEA11 gene expression. Promoter luciferase approaches addressed the impact of DNA methylation on MAGEA11 pro-moter activity, and investigated the role of Sp1 in MAGEA11 gene regulation. The novel Methyltransferase Accessibility Protocol for individual templates (MAPit) sequencing method was used to assess the role of nucleosome occupancy in MAGEA11 gene regulation, and to determine how it is influenced by DNA methylation.
Results
MAGEA11 expression is elevated in multiple human cancers and is coordinately expressed with other CG antigen genes. We reported previously that MAGEA11 expression increases in cas-tration-recurrent prostate cancer in a relatively small number of clinical specimens.10 To expand this analysis, we used Oncomine to analyze publically available microarray data sets for MAGEA11 expression in prostate cancer and to determine the possible rela-tionship to clinicopathology. This analysis confirmed MAGEA11 expression in prostate cancer, and revealed significantly increased expression with increased Gleason grade (Fig. 1A), progression to metastasis (Fig. 1B), and in patients with early disease recur-rence (Fig. 1C). To determine whether MAGEA11 expression in
©20
13 L
ande
s B
iosc
ienc
e. D
o no
t dis
tribu
te.

www.landesbioscience.com Epigenetics 851
addition to prostate cancer, we investigated DNA methylation relative to MAGEA11 gene regulation in EOC. Initially, bisul-fite clonal sequencing was performed on NO and EOC samples. The MAGEA11 5' CpG island and TSS region were moderately to highly methylated in both NO and EOC samples that had low lev-els of MAGEA11 expression, but were hypomethylated in an EOC sample (EOC38) expressing high levels of MAGEA11 (Fig. 3C). We developed a bisulfite pyrosequencing assay for MAGEA11 TSS methylation, to enable analysis of a larger number of biological samples and statistical testing of this association. Pyrosequencing established a significant indirect association between MAGEA11 expression and TSS methylation in EOC (Fig. 3D).
CpG island, but the CpGs located adjacent to the predicted TSS were hypermethylated. Previously obtained methylation data for prostate cancer cell lines are shown for comparison10 (Fig. 3A, TSS adjacent CpGs in red boxes), and MAGEA11 expres-sion and methylation in the four prostate cell lines analyzed are summarized in Figure 3B. MAGEA11 was expressed at the high-est level in LAPC-4 cells, the only cell type in which the TSS region is hypomethylated. RLM-RACE was used to map the TSS of MAGEA11 in LAPC-4 cells, to confirm the relevance of our findings. The data confirmed that the TSS is located adjacent to the CpG sites showing differential methylation in the prostate cell lines (Fig. 3A, TSS indicated with right broken arrows). In
Figure 1. MAGEA11 expression in human prostate cancer. (A–C) Oncomine analysis of MAGEA11 expression. Fold change, p-value, and microarray platform is indicated, and the title shows the first author of the referenced studies.61,62 Data are presented as a box and whiskers plot, with the box indicating the 25th to 75th percentiles, whiskers indicating the 10th and 90th percentiles, top and bottom points indicating the range, and center line indicating the median. (A) MAGEA11 expression as a function of prostate cancer Gleason grade. (B) MAGEA11 expression in primary and metastatic prostate cancer. (C) MAGEA11 expression as a function of prostate cancer recurrence at one year. (D) Expression of MAGEA11 and three representative cG antigen genes, MAGEA1, NY-ESO-1 and XAGE1 in prostate cell lines was measured using RT-qpcR. pWR-1E and RWpE-2 are cell lines derived from benign prostate epithelium, while the other cell lines were derived from prostate cancers. (E) Gene expression was measured as described in (D), using primary tissues derived from benign prostatic hyperplasia (Bp), androgen-stimulated prostate cancer (As), and castration-recurrent prostate cancer (cR). Absence of a bar indicates that no expression was detected.
©20
13 L
ande
s B
iosc
ienc
e. D
o no
t dis
tribu
te.
852 Epigenetics Volume 8 Issue 8
association between MAGEA11 expression and LINE1 methyla-tion suggested that MAGEA11 methylation and LINE1 methyla-tion are associated. Consistent with this hypothesis, there was a significant association between MAGEA11 TSS methylation and LINE1 methylation in prostate cancer and EOC (Fig. 4E and F).
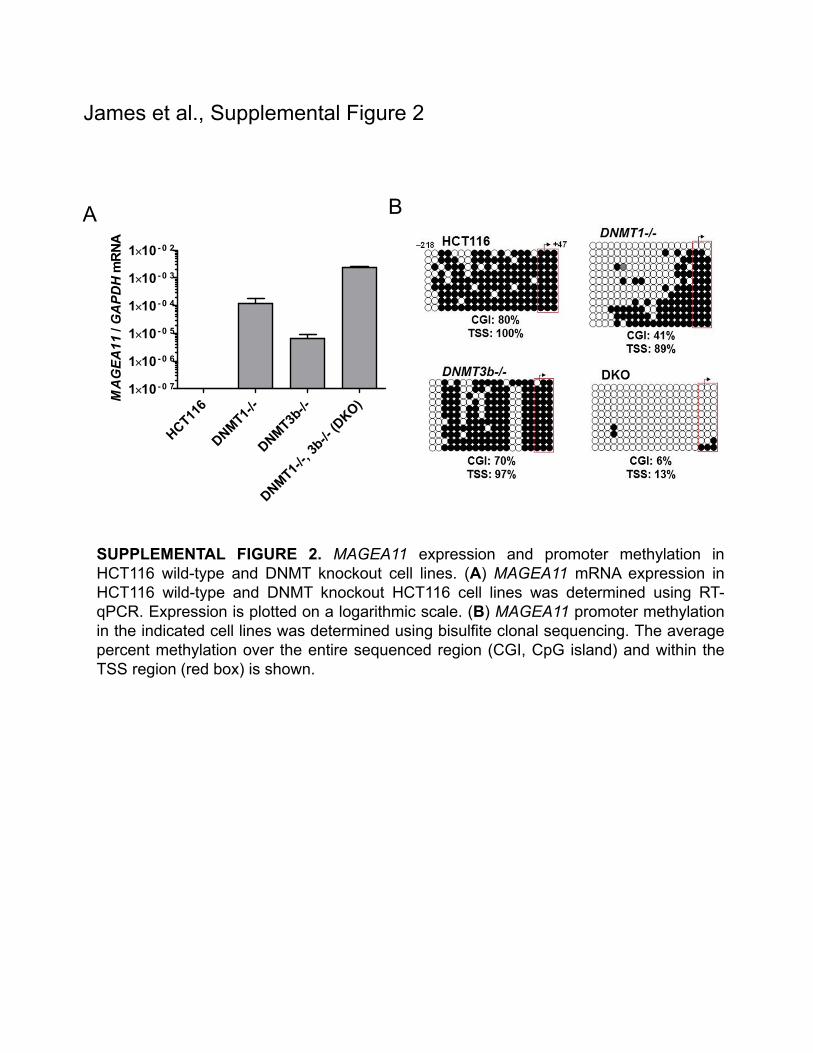
To further investigate the relationship between promoter and global DNA methylation and MAGEA11 expression, we used a human colorectal cancer somatic cell genetic knockout system in which the cytosine DNA methyltransferase enzymes DNMT1 and DNMT3b have been targeted alone or in combination.21 MAGEA11 expression was undetectable in wild-type HCT116 cells, increased in single DNMT1 or DNMT3b knockout HCT116 cells, and was highest double knockout DNMT1/3b HCT116 cells (DKO) (Sup. Fig. 2A; note that expression was plotted on a log scale). In agreement with the expression results, the MAGEA11 promoter was hypermethylated in wild-type HCT116 cells with progressively greater hypomethylation in DNMT3b−/−, DNMT1−/−, and DKO cells, respectively (Sup. Fig. 2B). These results support the idea that TSS hypometh-ylation is required for high MAGEA11 expression, since only HCT116 DKO cells showed robust hypomethylation at the
MAGEA11 expression and hypomethylation is associated with global DNA hypomethylation. We used LINE1 methyla-tion as a biomarker for global DNA methylation status to examine whether global DNA hypomethylation is related to MAGEA11 activation in cancer.19,20 LINE1 pyrosequencing is a cost effec-tive assay and readout for overall global methylation in cancer, as there is a direct correlation between LINE1 and 5mdC in can-cer tissues.20 In prostate cell lines, an inverse correlation between MAGEA11 expression and LINE1 methylation was observed, but did not reach statistical significance (Fig. 4A; Spearman r = −0.455, p = 0.27). In clinical prostate tissues, LINE1 was hypo-methylated to the greatest extent in the CR tumor that expressed MAGEA11 (Fig. 4B). We analyzed two groups of EOC lesions characterized by distinct LINE1 methylation (i.e., hypometh-ylated and hypermethylated), and NO samples as controls, to more rigorously test this association (Fig. 4C). While MAGEA11 expression was higher in both EOC sample groups compared with NO, its expression was highly elevated in hypomethylated vs. hypermethylated EOC (Fig. 4C). Moreover, there was a sig-nificant inverse correlation between MAGEA11 expression and LINE1 methylation in all EOC samples (Fig. 4D). The indirect
Figure 2. MAGEA11 expression in epithelial ovarian cancer (EOc). (A) Oncomine analysis of MAGEA11 mRNA expression in TcGA data.63 Fold change, p-value, and microarray platform is indicated. Data presentation is as described in Figure 1. (B) Oncomine analysis of the genes most closely correlated with MAGEA11 in TcGA data. (C) MAGEA11 mRNA expression was determined in three normal ovary samples and 40 EOc samples using Affymetrix hG 1.0sT microarrays. Two-tailed t-test results are shown. (D) Expression of MAGEA11 and other cG antigen genes was determined by Affymetrix microar-ray, as described in (C). spearman test r values and p-values for correlation with MAGEA11 are shown.
©20
13 L
ande
s B
iosc
ienc
e. D
o no
t dis
tribu
te.

www.landesbioscience.com Epigenetics 853
hypermethylated, MAGEA11 was induced by decitabine but not by TSA, with the highest level of induction following combina-tion treatment (Fig. 5A and B). These findings suggest that DNA methylation plays a primary role in MAGEA11 gene repression, and histone deacetylation plays an accessory role, in cells with TSS-hypermethylated MAGEA11. In LAPC-4 cells, in which the MAGEA11 TSS is hypomethylated, TSA caused substantial induction of MAGEA11 while decitabine did not, although the combination treatment still showed the greatest effect (Fig. 5C). These findings suggest that HDACs can still repress MAGEA11, when TSS DNA methylation levels are lower. In agreement, ChIP analysis showed that TSA treatment increased histone acetylation at lysine 9 (H3K9-Ac) at the MAGEA11 promoter in LAPC-4 cells (Fig. S3A). In contrast to DU145 and PC-3 cells, TSA treatment did not influence MAGEA11 expression in benign PWR-1E prostate cells (Fig. 5D). This is suggestive of cancer-specific alterations in HDACs, as has been reported.26
MAGEA11 TSS. The effect of DNMT loss on MAGEA11 pro-moter methylation paralleled the effect on global DNA methyla-tion in these cell lines,14,21,22 which provides additional evidence for a link between global DNA hypomethylation and MAGEA11 expression.
DNMT and histone deacetylase (HDAC) inhibitors induce MAGEA11 expression in a cell type specific manner. In addition to DNA methylation, histone modification can play an important role in CG gene regulation.14-16,23 A pharmacological approach was used in prostate cell lines to investigate the relative roles of DNA methylation and histone deacetylation on MAGEA11 repression. Prostate cell lines were treated with the pan-DNMT inhibitor decitabine (DAC) and the pan-class I/II HDAC inhibi-tor Trichostatin A (TSA),24,25 individually or in combination. Decitabine treatment was confirmed to reduce MAGEA11 pro-moter DNA methylation levels (data not shown). In DU145 and PC-3 prostate cancer cells in which the MAGEA11 TSS region is
Figure 3. MAGEA11 promoter methylation and expression in prostate cancer and EOc. (A) sodium bisulfite clonal sequencing of the MAGEA11 promoter region was performed on the indicated cell lines. The transcriptional start site (Tss), as determined by RLM-RAcE, is indicated by the right broken arrow, and the coordinates of the analyzed region are shown in the upper left panel. Filled and open circles indicate methylated and unmeth-ylated cpG sites, respectively, and each row represents one sequenced allele. The red box indicates three Tss-adjacent cpG sites. (B) summary of MAGEA11 bisulfite sequencing and mRNA expression data in prostate cell lines. Methylation percentages for the entire MAGEA11 5' cpG island (cGI) or for the three Tss-resident cpGs were calculated from (A), and MAGEA11 expression was determined by RT-qpcR. (C) MAGEA11 promoter methylation and mRNA expression in one normal ovary (NO) and four EOc samples were determined using bisulfite clonal sequencing (> 10 alleles), and Affymetrix microarray, respectively. (D) MAGEA11 mRNA expression indirectly correlates with MAGEA11 Tss methylation in EOc. MAGEA11 expression and methyla-tion of three Tss-resident cpG sites in 16 EOc samples was determined by RT-qpcR and bisulfite pyrosequencing, respectively. Five samples that did not express measurable MAGEA11 are plotted on the x-axis. spearman test results are shown.
©20
13 L
ande
s B
iosc
ienc
e. D
o no
t dis
tribu
te.

854 Epigenetics Volume 8 Issue 8
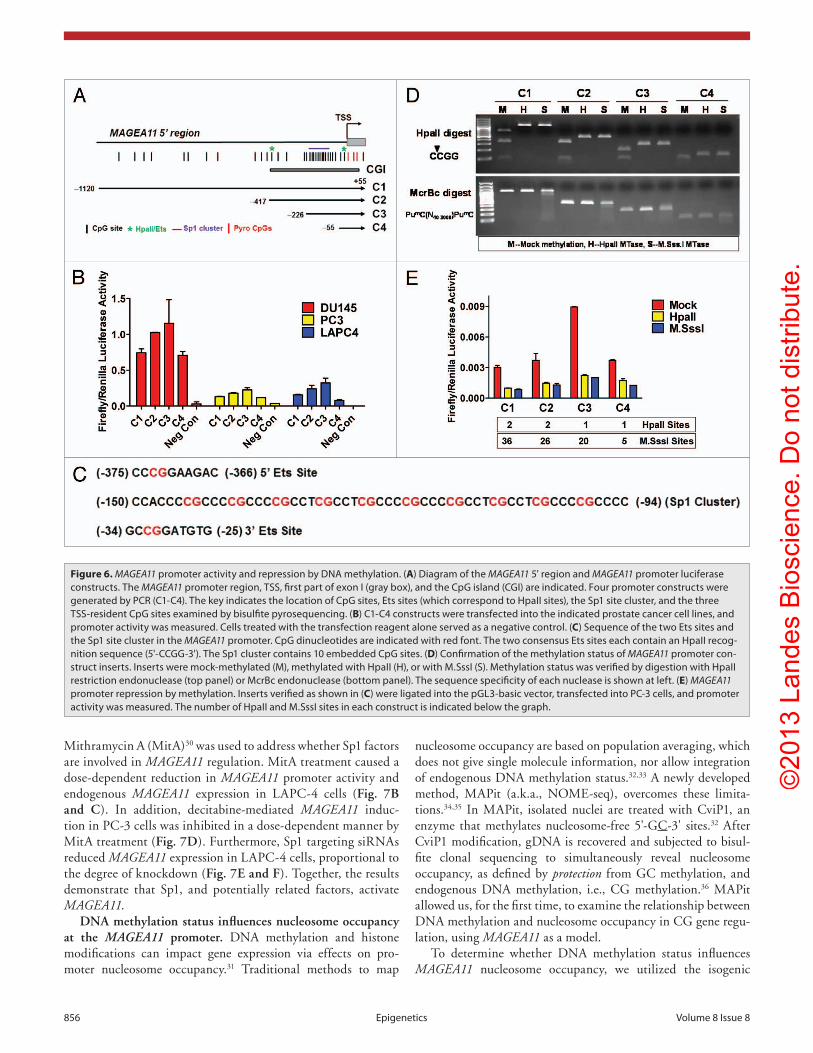
(Fig. 6A). Each construct was active in prostate cell lines, in the order, C3 > C2 > C1 > C4, in all 3 cell lines (Fig. 6B). Notably, C3, which contains a cluster of 10 CpG sites embedded within 10 consensus Sp1 binding sites, had the highest activity, while C4, which was identical to C3 but did not contain the Sp1 region, had the lowest activity (Fig. 6A–C). This suggested
MAGEA11 is directly repressed by DNA methylation, and activated by Sp1. A luciferase reporter gene assay was used to determine the impact of DNA methylation on MAGEA11 promoter activity in prostate cancer cells. Four constructs, C1 through C4, were prepared that terminate 55 bp downstream of the MAGEA11 TSS and span different lengths upstream
Figure 4. MAGEA11 expression and methylation and global DNA methylation. (A) MAGEA11 expression and LINE1 methylation in human prostate cell lines. MAGEA11 expression was determined by RT-qpcR and LINE1 methylation was determined by pyrosequencing. pWR-1E and RWpE-2 are derived from normal prostate epithelium, while other cell lines are derived from prostate cancer. spearman test showed an inverse association between MA-GEA11 expression and LINE1 methylation, which did not reach statistical significance (R = −0.455, p = 0.267). (B) MAGEA11 expression and LINE1 methyl-ation in primary prostate tissues. Measurements were determined as described in (A). (C) MAGEA11 expression and LINE1 methylation in normal ovary and EOc with divergent LINE1 methylation. MAGEA11 expression and LINE1 methylation were determined as described in (A). MAGEA11 expression is plotted on a log axis and note that five samples in the hypermethylated EOc group did not express measurable MAGEA11. The mean LINE1 methylation level in three sample groups is shown below the x-axis. Two-tailed t-test results are shown. (D) MAGEA11 expression and LINE1 methylation are indi-rectly associated in EOc. MAGEA11 expression was plotted vs. LINE1 methylation in EOc samples from both EOc groups shown in (C). spearman test results are shown. (E) MAGEA11 Tss methylation and LINE1 methylation are directly associated in prostate cancer. Methylation was determined using bisulfite sequencing (MAGEA11) and pyrosequencing (LINE-1). spearman test results are shown. (F) MAGEA11 Tss methylation and LINE1 methylation are directly associated in EOc. Methylation was determined using pyrosequencing. spearman test results are shown.
©20
13 L
ande
s B
iosc
ienc
e. D
o no
t dis
tribu
te.

www.landesbioscience.com Epigenetics 855
constructs, with the C3 construct showing highest activity. Unexpectedly, HpaII, which methylates only 1–2 CpGs in the C1-C4 constructs, strongly repressed MAGEA11 promoter activ-ity, similar to M.SssI, which methylates all CpG sites in these constructs (Fig. 6E). Similar results were obtained in other pros-tate cell lines (data not shown). The two HpaII sites within the MAGEA11 promoter region are found within consensus Ets tran-scription factor binding sites (Fig. 6C). Thus, the data suggest that methylation at one or both of these sites impairs MAGEA11 promoter activity. Consistent with this notion, previous studies have implicated Ets sites in methylation-dependent promoter activity of other MAGEA gene family members.1,17,27,28
Elevated activity of the C3 construct relative to C4 sug-gested that Sp1 site binding factors regulate MAGEA11. Sp1, the prototype member of the Sp1 family, is expressed widely in benign and malignant tissues, and contributes to oncogen-esis.29 Western blot analysis demonstrated that prostate cell lines express nuclear Sp1 protein (Fig. 7A). The Sp1 inhibitor
that Sp1 factors may contribute to MAGEA11 gene activity. In addition, the data suggested the presence of repressive motifs in the 5' region of MAGEA11, based on the lower activity levels of C1 and C2, relative to the C3 construct. It was also notable that DU145 cells showed highest levels of MAGEA11 promoter activity, while the endogenous MAGEA11 gene is silenced by DNA methylation in this cell type (Fig. 6B; Fig. 3B). Thus, DU145 cells may express factors necessary to drive MAGEA11 expression, but these factors may be restricted at the endogenous gene locus by DNA methylation.
We methylated the C1 through C4 inserts, but not the vector sequences, using HpaII or M.SssI, which methylate 5'-CCGG-3' or 5'-CG-3' sites, respectively, to directly determine the impact of DNA methylation on MAGEA11 promoter activity. Digestion of the plasmid inserts with HpaII and McrBc restriction enzymes confirmed their expected methylation status (Fig. 6D). The results in PC-3 cells are shown in Figure 6E. Mock methylated constructs showed a similar pattern of activity as unmethylated
Figure 5. Epigenetic modulatory drugs induce MAGEA11 expression. MAGEA11 expression was measured by RT-qpcR following treatment of benign prostate or prostate cancer cell lines with vehicle (pBs/DMsO), Trichostatin A (TsA), and/or decitabine (DAc), as described in Materials and Methods. (A) DU145 cells. (B) pc-3 cells. (C) LApc-4 cells. (D) pWR-1E cells. We noted that the MAGEA11/GAPDH copy number in control LApc-4 cells appeared substantially lower than observed in other experiments, likely due to repression by DMsO. This effect was also observed in Figure 7C.
©20
13 L
ande
s B
iosc
ienc
e. D
o no
t dis
tribu
te.
856 Epigenetics Volume 8 Issue 8
nucleosome occupancy are based on population averaging, which does not give single molecule information, nor allow integration of endogenous DNA methylation status.32,33 A newly developed method, MAPit (a.k.a., NOME-seq), overcomes these limita-tions.34,35 In MAPit, isolated nuclei are treated with CviP1, an enzyme that methylates nucleosome-free 5'-GC-3' sites.32 After CviP1 modification, gDNA is recovered and subjected to bisul-fite clonal sequencing to simultaneously reveal nucleosome occupancy, as defined by protection from GC methylation, and endogenous DNA methylation, i.e., CG methylation.36 MAPit allowed us, for the first time, to examine the relationship between DNA methylation and nucleosome occupancy in CG gene regu-lation, using MAGEA11 as a model.
To determine whether DNA methylation status influences MAGEA11 nucleosome occupancy, we utilized the isogenic
Mithramycin A (MitA)30 was used to address whether Sp1 factors are involved in MAGEA11 regulation. MitA treatment caused a dose-dependent reduction in MAGEA11 promoter activity and endogenous MAGEA11 expression in LAPC-4 cells (Fig. 7B and C). In addition, decitabine-mediated MAGEA11 induc-tion in PC-3 cells was inhibited in a dose-dependent manner by MitA treatment (Fig. 7D). Furthermore, Sp1 targeting siRNAs reduced MAGEA11 expression in LAPC-4 cells, proportional to the degree of knockdown (Fig. 7E and F). Together, the results demonstrate that Sp1, and potentially related factors, activate MAGEA11.
DNA methylation status influences nucleosome occupancy at the MAGEA11 promoter. DNA methylation and histone modifications can impact gene expression via effects on pro-moter nucleosome occupancy.31 Traditional methods to map
Figure 6. MAGEA11 promoter activity and repression by DNA methylation. (A) Diagram of the MAGEA11 5' region and MAGEA11 promoter luciferase constructs. The MAGEA11 promoter region, Tss, first part of exon I (gray box), and the cpG island (cGI) are indicated. Four promoter constructs were generated by pcR (c1-c4). The key indicates the location of cpG sites, Ets sites (which correspond to hpaII sites), the sp1 site cluster, and the three Tss-resident cpG sites examined by bisulfite pyrosequencing. (B) c1-c4 constructs were transfected into the indicated prostate cancer cell lines, and promoter activity was measured. cells treated with the transfection reagent alone served as a negative control. (C) sequence of the two Ets sites and the sp1 site cluster in the MAGEA11 promoter. cpG dinucleotides are indicated with red font. The two consensus Ets sites each contain an hpaII recog-nition sequence (5'-ccGG-3'). The sp1 cluster contains 10 embedded cpG sites. (D) confirmation of the methylation status of MAGEA11 promoter con-struct inserts. Inserts were mock-methylated (M), methylated with hpaII (h), or with M.sssI (s). Methylation status was verified by digestion with hpaII restriction endonuclease (top panel) or McrBc endonuclease (bottom panel). The sequence specificity of each nuclease is shown at left. (E) MAGEA11 promoter repression by methylation. Inserts verified as shown in (C) were ligated into the pGL3-basic vector, transfected into pc-3 cells, and promoter activity was measured. The number of hpaII and M.sssI sites in each construct is indicated below the graph.
©20
13 L
ande
s B
iosc
ienc
e. D
o no
t dis
tribu
te.

www.landesbioscience.com Epigenetics 857
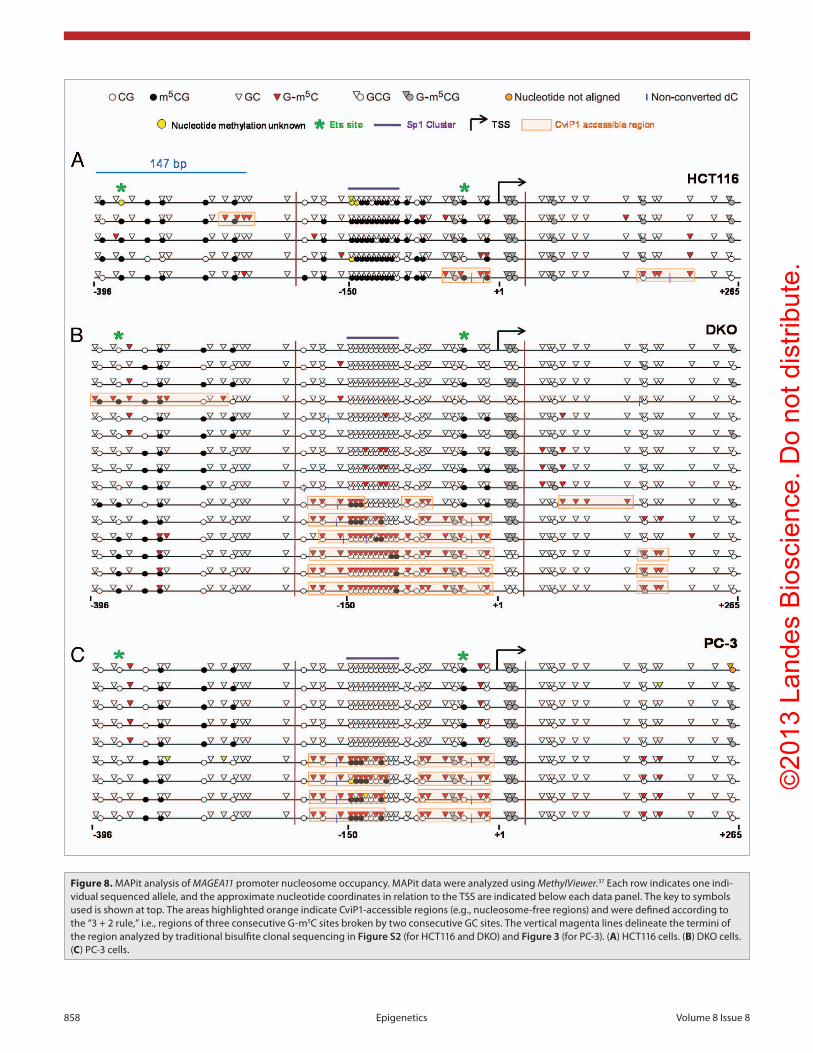
noted that the region of the MAGEA11 promoter with signifi-cant variation in GC methylation between HCT116 and DKO cells was localized to the area upstream of the TSS, and spanning approximately 200 bp. This distance is greater than the length of one nucleosome (147 bp), and includes what has been referred to as the -1 nucleosome.38 In contrast, the areas upstream and downstream showed low GC methylation in both HCT116 and DKO cells, which suggests continued nucleosome occupancy at these locations. Occupancy at the -1 nucleosome position may be critical for MAGEA11 expression, potentially by impact-ing RNA Polymerase II (RNAP II) binding.38 In agreement, ChIP revealed increased RNAP II binding to the MAGEA11
HCT116/DKO cell model system described earlier.21 MAPit was conducted on HCT116 wild type and DNMT1/3b knockout (DKO) cells, and the results were analyzed using MethylViewer.37 In agreement with our standard bisulfite clonal sequencing results, MAGEA11 was hypermethylated at CG sites in HCT116 cells relative to DKO cells (Fig. 8A and B). In contrast, GC methylation increased in DKO cells relative to HCT116 wild-type cells, consistent with nucleosome depletion at the MAGEA11 promoter (Fig. 8A and B). Approximately half of the sequenced alleles in DKO cells showed increased CviP1 methylase accessibility. Decitabine-treated HCT116 cells dis-played MAPit results similar to DKO cells (data not shown). We
Figure 7. sp1 contributes to MAGEA11 promoter activity and gene expression. (A) sp1 protein expression was determined by western blot analysis of the indicated cell lines. c and N refer to cytosolic and nuclear extracts, respectively. (B) Mithramycin A (MitA) treatment reduces MAGEA11 promoter activity. LApc-4 cells were simultaneously transfected with the c3 construct and treated with DMsO (vehicle) or the indicated concentrations of MitA. cell extracts were harvested 24 h post-treatment and used for luciferase assay. (C) MitA treatment represses MAGEA11 mRNA expression. LApc-4 cells were treated with DMsO or MitA for 24 h, and RNA extracts were used to measure MAGEA11 expression by RT-qpcR. (D) MitA treatment sup-presses decitabine-mediated MAGEA11 induction. pc-3 cells were treated with decitabine (DAc) and/or MitA alone or in combination. RNA extracts were harvested five days after initiation of treatment, and were used to measure MAGEA11 expression by RT-qpcR. (E) sp1 knockdown in LApc-4 cells. LApc-4 cells were transfected with two different sp1 targeting siRNAs, or with a control non-targeting siRNA, once daily for 48 h. 48 h post-treatment, whole cell extracts were prepared and used for western blot analysis. (F) sp1 knockdown reduces MAGEA11 expression. LApc-4 cells were treated as described in (E), and RNA extracts were prepared 48 h post treatment and used for RT-qpcR analysis of MAGEA11.
©20
13 L
ande
s B
iosc
ienc
e. D
o no
t dis
tribu
te.
858 Epigenetics Volume 8 Issue 8
Figure 8. MApit analysis of MAGEA11 promoter nucleosome occupancy. MApit data were analyzed using MethylViewer.37 Each row indicates one indi-vidual sequenced allele, and the approximate nucleotide coordinates in relation to the Tss are indicated below each data panel. The key to symbols used is shown at top. The areas highlighted orange indicate cvip1-accessible regions (e.g., nucleosome-free regions) and were defined according to the “3 + 2 rule,” i.e., regions of three consecutive G-m5c sites broken by two consecutive Gc sites. The vertical magenta lines delineate the termini of the region analyzed by traditional bisulfite clonal sequencing in Figure S2 (for hcT116 and DKO) and Figure 3 (for pc-3). (A) hcT116 cells. (B) DKO cells. (C) pc-3 cells.
©20
13 L
ande
s B
iosc
ienc
e. D
o no
t dis
tribu
te.
www.landesbioscience.com Epigenetics 859
DNA hypomethylation at TSS-resident CpG sites. In addi-tion, MAGEA11 expression and hypomethylation are associated with global DNA hypomethylation, as evidenced both by pri-mary human tumor data from prostate and ovarian cancers, and by data from a genetic DNMT knockout cell system. DNMT and HDAC inhibitors can both activate MAGEA11 expres-sion, in some cases in a synergistic fashion. Also, we showed that MAGEA11 promoter activity was repressed directly by DNA methylation and that Sp1, or related factors, contributes to MAGEA11 promoter activity and endogenous gene expres-sion. For the first time, we have reported the role of nucleosome occupancy in CG antigen gene regulation, using MAGEA11 as a model. Our MAPit data provide evidence that: (i) DNA methyla-tion specifically regulates nucleosome occupancy at the -1 posi-tioned nucleosome at the MAGEA11 promoter, (ii) methylation of an Ets consensus binding site positioned near the TSS closely correlates with MAGEA11 -1 nucleosome occupancy, (iii) partial methylation at the 5' end of the Sp1 site cluster in the MAGEA11 promoter CpG island correlates with -1 nucleosome depletion, and (iv) a region overlapping the 3' end of the Sp1 site cluster is protected from CviP1 methylation, potentially by binding of the TIC, or by a transcription factor.
Based on the current study, we outline a schematic of events leading to MAGEA11 gene expression in human cancer (Fig. 9A). The initiating event driving MAGEA11 gene expression in cancer is likely to be global DNA hypomethylation. While the underlying cause of global DNA hypomethylation in cancer is yet to be demonstrated,11 it could reflect alterations of higher-order chromatin structure in the cancer cell nucleus.44,45 MAGEA11 TSS hypomethylation is a target of global DNA hypomethyl-ation, and this event provides a chromatin template permissive for gene activation by members of the Ets and Sp1 transcrip-tion factor families. Our results also indicate that HDACs con-tribute to MAGEA11 gene repression, either as an accessory to DNA methylation or as a primary repressive mechanism in some cancer cells. Full removal of epigenetic repression in certain tumors may allow high level MAGEA11 expression and down-stream oncogenic effects (e.g., AR activation in prostate cancer). Conversely, high expression of MAGEA11 may render tumor cells susceptible to immunotherapeutic approaches targeting this antigen.46 A model for the MAGEA11 gene configuration in the fully repressed and fully activated state is shown in Figure 9B. As indicated, a central aspect of the model is -1 nucleosome occu-pancy, which is based on the MAPit data. Preliminary analysis of additional cell types, including LAPC-4, also support the impor-tance of -1 nucleosome occupancy in MAGEA11 regulation (data not shown). The observation that DNA hypomethylation leads to nucleosome depletion at the MAGEA11 TSS has increased importance when put in the context of a recent report. Pandiyan et al. showed that only a small subset (< 2%) of genes under-going hypomethylation in DKO cells, or following decitabine treatment, show changes in promoter nucleosome occupancy.47 The authors proposed that these target genes may be the most important for regulating tumorigenesis in the context of DNA hypomethylation. Experimental validation of MAGEA11 as one of these targets further suggests an oncogenic role for this
-1 nucleosome region in DKO cells, relative to HCT116 cells (Fig. S3B). In HCT and DKO cells, we additionally noted that the endogenous methylation status of specific CpG sites accu-rately predicted -1 nucleosome occupancy. Notably, these sites included the 3' HpaII/Ets site mentioned earlier, in the context of luciferase assays (Fig. 8A and B).
As shown earlier, the prostate cancer cell line PC-3 displayed low to moderate levels of MAGEA11 expression along with heterogeneous methylation of the MAGEA11 5' CpG island (Fig. 3A and B). MAPit analysis of this cell line allowed us to further examine the relationship between MAGEA11 DNA methylation, gene expression, and nucleosome occupancy. PC-3 cells showed a heterogeneous pattern of nucleosome occupancy, with nucleosome depletion at the -1 nucleosome region in some alleles (Fig. 8C). In addition, 3' Ets site methylation was closely associated with nucleosome occupancy in PC-3 cells, as was methylation of two other 5' CpG sites (Fig. 8C). Unexpectedly, nucleosome depletion in PC-3 cells correlated with partial methylation at the 5' end of the Sp1 cluster region, while com-plete hypomethylation of this region correlated with nucleo-some occupancy (Fig. 8C). This trend was also readily apparent in DKO cells (Fig. 8B). Finally, we noted that the region of CviP1 accessibility in the -1 nucleosome region was interrupted by a short stretch of DNA that overlapped the 3' end of the Sp1 cluster region (Fig. 8C). This pattern was also observed in some of the sequenced alleles of DKO cells (Fig. 8B). The small CviP1-protected region within the larger nucleosome-free -1 region may correspond to a region bound by the transcriptional initiation complex (TIC) and/or a transcription factor. Taken together, our results indicate strong interdependence among DNA methylation, -1 nucleosome occupancy, and MAGEA11 gene expression.
Discussion
MAGEA11 is a nuclear protein identified in a yeast two-hybrid screen for proteins that bind the human androgen receptor (AR).39,40 In addition to AR, MAGEA11 is now known to acti-vate human progesterone receptor-B, and its capacity as a steroid receptor activator is in part mediated through interactions with the p300 histone acetyltransferase.41,42 In addition, MAGEA11 can activate AR signaling by forming a molecular bridge between transcriptionally active AR dimers, and also contributes to pros-tate cancer cell growth.4 Most recently, MAGEA11 has been found to promote oncogenesis by targeting the retinoblastoma (RB) pathway.43 This latter activity may provide the selective pressure for MAGEA11 expression in a variety of human can-cers, as reported here. Because of its apparent role in tumori-genesis, MAGEA11 is an important potential target of cancer vaccines and therapeutics. MAGEA11 expression could also serve as a biomarker of cancer prognosis, based on our data showing that MAGEA11 is expressed in a variety of human cancers, in a manner that correlates both with tumor progression and reduced survival.
MAGEA11 activation in cancer occurs in conjunction with the activation of other CG genes, and in association with
©20
13 L
ande
s B
iosc
ienc
e. D
o no
t dis
tribu
te.

860 Epigenetics Volume 8 Issue 8
protein. More generally, and also in agree-ment with the data reported here, a recent report indicated that DNA methylation dic-tates nucleosome occupancy at numerous genomic loci in human cancer cells.48
In addition to revealing a general asso-ciation between DNA methylation den-sity and nucleosome occupancy at the MAGEA11 promoter, MAPit also revealed strong correlation between methylation of a specific Ets site and nucleosome occupancy at MAGEA11. This finding is particularly striking when considered in the context of our promoter activity data, which demon-strated that methylation at this site alone fully repressed the transcriptional activity of the MAGEA11 C3 and C4 promoter con-structs. In agreement with our observations on MAGEA11, other recent work has impli-cated Ets site hypomethylation in driving the activation of specific genes in cancer.49 Additional studies are required to define which Ets family member(s) are respon-sible for MAGEA11 regulation at this site. While the large size and overlapping target sequences of this protein family will make this task challenging,50 the question may be amenable to a focused RNAi screening approach.
An additional key finding from MAPit relates to the relationship between methyla-tion of the Sp1 site cluster and nucleosome occupancy. Surprisingly, the MAGEA11 promoter showed nucleosome depletion only when the Sp1 site cluster was partially (but not fully) methylated. How Sp1 bind-ing is impacted by DNA methylation is con-troversial, and it appears likely to be based on the specific promoter and cell type.51-55 Although our preliminary data indicate that Sp1 can directly bind at the MAGEA11 promoter in prostate cancer cells (data not shown), additional detailed studies are required to determine the epigenetic con-text in which this binding occurs. Finally, MAPit showed a small CviP1 footprint over-lapping the 3' end of the MAGEA11 Sp1 site cluster, in cells in which the flanking regions were CviP1 accessible (i.e., nucleosome-depleted). This footprint is likely to indicate binding of the TIC, which can occur at Sp1 sites in CpG island promoters that lack a consensus TATA box,56 as is the case for the MAGEA11 promoter. Highly similar foot-prints, potentially related to binding of the TIC, have been observed by others.57-59 This
Figure 9. MAGEA11 gene regulation in human cancer. (A) Flowchart of events involved in the activation of MAGEA11 expression in cancer. (B) schematic of MAGEA11 promoter configuration in the fully repressed (top) and fully activated states (bottom). Open and filled lollipops indicate unmethylated and methylated cpG sites, respectively. The red outlined lollipop corresponds to the 3' Ets site. Ovals indicate nucleosomes, with numbers below each indicating the nucleo-some position relative to the MAGEA11 Tss. Right bent arrow indicates Tss. purple lines indicate histone h3 tails. Ac indicates acetylation.
©20
13 L
ande
s B
iosc
ienc
e. D
o no
t dis
tribu
te.
www.landesbioscience.com Epigenetics 861
PCR: 5'-gtgctcacct ggagtccaaa-3', Inner PCR: 5'-ttcttcctct tgatgctggc-3'. Primers were obtained from Integrated DNA Technologies.
DNA methylation analyses. One microgram gDNA was bisulfite converted using the EZ DNA Methylation Kit (Zymo Research). Bisulfite clonal sequencing of the MAGEA11 promoter region was performed as described.10 Bisulfite pyrosequencing was performed to measure methylation of three CpG sites adja-cent to the MAGEA11 TSS. Primers were (forward) 5'-ttttgtt-gta aatttaggga agtt-3', (reverse) 5'-biotin-aaccccaccc tttataaaac tacc-3', and (sequencing) 5'-ggatgtgatt tttattggtt-3'. Primers were obtained from Integrated DNA Technologies. PCR condi-tions were 10 min × 95°C, followed by 48 cycles of (95°C for 30 sec, 57°C for 30 sec, and 72°C for one min). Pyrosequencing of the LINE-1 repetitive element was performed as described.19 Pyrosequencing was performed using the PSQ HS96 system (Qiagen). Unmethylated and methylated genomic DNA were run as controls. Samples were analyzed in duplicate from sepa-rate PCR reactions.
Drug treatments. Various prostate cell lines were treated with 5-aza-2'-deoxycytidine (decitabine, DAC) and/or Trichostatin A (TSA). Decitabine and TSA (Sigma) were solubilized in phos-phate buffered saline (PBS) and dimethyl sulfoxide (DMSO), respectively. For decitabine, cells were treated twice, on day 0 and day 2, and harvested on day 4. For TSA, cells were treated on day 0 and harvested on day 1. For combination treatments, cells were treated with decitabine on days 0 and 2, with TSA on day 3, and harvested on day 4. Mithramycin A (MitA) (Sigma) was solubi-lized in DMSO and added to LAPC-4 cells at 75, 125, or 200 nM. Cell extracts were harvested one day post-treatment, and used for RT-qPCR or luciferase assays as described in Results. PC-3 cells were treated with PBS (vehicle) or decitabine on days 0 and 3, and DMSO (vehicle) or MitA on days 2 and 4, and harvested for RT-qPCR analysis of MAGEA11 on day 5. As con-trols for single drug treatments, PC-3 cells were harvested 5 d post-treatment with decitabine or four days post-treatment with MitA.
Chromatin immunoprecipitation (ChIP). ChIP was per-formed as described.14 ChIP products were analyzed using end-point PCR and agarose gel electrophoresis, or alternatively using qPCR. qPCR reactions were performed in triplicate using an Applied Biosystems 7300 System and qPCR MasterMix Plus for SYBR® with ROX master mix (AnaSpec). The region flank-ing the MAGEA11 TSS was amplified using forward primer 5'-cctgctgtaa atccagggaa-3', and reverse primer 5'-ccctctgcca ctctcaagac-3'. Primers were from Integrated DNA Technologies. ChIP antibodies were H3K9ac (Upstate, Cat#06-599) and RNA Polymerase II (Abcam, Cat #ab5408).
Promoter luciferase assays. Four regions of the MAGEA11 promoter (C1 through C4) were cloned into pGL3-Basic (Promega) using PCR. Methylation of promoter inserts and re-ligation into pGL3-Basic were as described,18 except that KpnI and XhoI (Fermentas) were used for digestion. Methylation reactions utilized M.SssI or HpaII methylases (New England Biolabs). The methylation status of promoter inserts was veri-fied using HpaII or McrBc endonuclease (New England Biolabs)
footprint could also indicate binding of a Sp1 family member. Resolution of these possibilities is of interest in future studies.
Materials and Methods
In silico gene expression analysis. Oncomine (Compendia Bioscience) was used for analysis of MAGEA11 expression in publically available human microarray data sets. Additional details and references are presented in the Results.
Human cell lines and clinical research tissues. Prostate cell lines and culture conditions were as described.10 HCT116 wild type and DNMT1/3b single or double knockout (DKO) HCT116 cells and their culture conditions also were as described.21 Human benign prostatic hyperplasia (BP), andro-gen-stimulated prostate cancer (AS), castration-recurrent pros-tate cancer (CR), normal ovary (NO), and epithelial ovarian cancer (EOC) clinical samples were as described.10,18,19 All EOC tissues contained greater than 90% neoplastic cells. All human tissues were obtained under IRB-approved protocols at the University of North Carolina (prostate) or Roswell Park Cancer Institute (ovarian).
RNA and genomic DNA (gDNA) extractions. RNA was extracted using TRIzol (Invitrogen) according to the manufac-turer’s instructions. Tissue homogenization was performed as described.18 RNAs were quantified using Nanodrop (Thermo Scientific) and RNA integrity was assessed using denaturing agarose gel electrophoresis. gDNAs were prepared using the Puregene kit (Qiagen).
Reverse transcriptase quantitative PCR (RT-qPCR). RT-qPCR was used to measure the expression of MAGEA1, NY-ESO-1, XAGE-1, and GAPDH as described.14,19 For MAGEA11, the following primers were used: F: 5'-ggagactcag ttc-cgcagag-3', R: 5'-tgggaccact gtagttgtgg-3'. Primers were obtained from Integrated DNA Technologies. Briefly, one μg of RNA was DNase-treated using the DNA-free kit (Ambion). cDNA was generated using the iScript cDNA synthesis kit (BioRad). Two μl of 1:5 cDNA sample dilutions were used for qPCR reactions. Standard curves were prepared using gel-purified end-point RT-PCR products amplified from testis RNA. All PCR reactions were performed in triplicate using an Applied Biosystems 7300 System and qPCR MasterMix Plus for SYBR® with ROX master mix (AnaSpec).
Microarray analysis of MAGEA11 and CG gene expression. Affymetrix HG 1.0ST arrays were used to determine the expres-sion of MAGEA11 and other CG genes in NO and EOC. Probe generation, array hybridization, and expression analyses were performed by the Next Generation Sequencing and Expression Analysis Core Facility at the University at Buffalo Center for Excellence in Bioinformatics. Samples included three NO and 40 EOC. Correlation between MAGEA11 expression and other CG genes was determined using the Spearman’s test. Full expres-sion data from the microarray analysis will be reported elsewhere.
Determination of the MAGEA11 transcriptional start site (TSS). RLM-RACE was used to map the MAGEA11 TSS in LAPC-4 cells, using the First Choice RLM-RACE kit (Ambion, Life Technologies). The following primers were used: Outer
©20
13 L
ande
s B
iosc
ienc
e. D
o no
t dis
tribu
te.
862 Epigenetics Volume 8 Issue 8
methylase CviP1 (New England Biolabs), or mock methylated without enzyme. gDNA was recovered using phenol-chloroform extraction and bisulfite converted using the EZ DNA methyla-tion kit (Zymo). The resulting DNA served as template for PCR of the MAGEA11 promoter region, using unbiased primers to determine methylation status (forward primer 5'-taagaggagg atttttttga gtgag-3', reverse primer 5'-aaataaaacc tctccataat ttct-caa-3'), or using a combination of reverse primers selective for amplification of unmethylated (reverse primer 5'-cctctaccca aat-cacacca ta-3') and methylated (reverse primer 5'-cctctacccg aat-cacacca-3') DNA sequences. PCR products were recovered using gel purification (Qiagen), cloned into pTOPO 4.1 (Invitrogen), and subjected to Sanger sequencing. MethylViewer was used to analyze MAPit data.37
Disclosure of Potential Conflicts of Interest
No potential conflicts of interest were disclosed.
Acknowledgments
We thank Dr Jennifer Black for critical reading of the manu-script, and Leena Forti and Chinaza Egbuta for excellent tech-nical assistance. We thank Dr Michael Kladde and Dr Peter Jones’ laboratory for helpful discussions regarding nucleosome occupancy mapping This work was supported by the National Institutes of Health [RO1CA116674 to ARK, P01CA77739 to JLM and EMW], the Ovarian Cancer Research Fund (to ARK and KO), and a State University of New York STEM Doctoral Diversity Fellowship [to C.C.].
Supplemental Materials
Supplemental materials may be found here: http ://www.landesbioscience.com/journals /epigenetics /article/25500
digestions. Transfections utilized Lipofectamine 2000 (Life Technologies). Cell extracts were harvested one day post-trans-fection. The Dual-Luciferase Reporter Assay System (Promega) was used to determine promoter activity.
Sp1 siRNA knockdown. Pre-designed siRNAs targeting human Sp1 [s13319 (siSp1 #1) and s13320 (siSp1 #2)] were obtained from Ambion (Life Technologies), and siRNA Control Non-Targeting siRNA was obtained from Dharmacon. LAPC-4 cells were transfected with siRNAs using the Lipofectamine 2000 (Life Technologies) reverse transfection method. Cells were transfected with 25 nM siRNA at 0 and 24 h. Cell extracts were collected at 48 h and analyzed using western blot for Sp1, or RT-qPCR for MAGEA11.
Western blotting. Proteins were extracted using radioim-munoprecipitation assay (RIPA) buffer, and quantified using the Lowry assay (BioRad). Equal amounts of protein samples per lane were separated using NuPage SDS-PAGE gels (Life Technologies). Alternatively, cytosolic and nuclear protein extracts were prepared using the NE-PER kit (Pierce). Sp1 was detected using Sp1 antibody (Santa Cruz, sc-14027) at 1:200 dilution. β-actin was detected using anti-actin antibody (Santa Cruz, sc-4778) at 1:1000 dilution. Donkey anti-rabbit IgG-HRP secondary antibody (Santa Cruz, sc-2313) was used at 1:5000 dilution. Rabbit anti-mouse IgG-HRP (Santa Cruz, sc-358917) was used at 1:5000 dilution. The Novex ECL HRP Chemiluminescence kit (Life Technologies) was used for protein detection.
Nucleosome occupancy at the MAGEA11 pro-moter. Nucleosome occupancy was determined using the Methyltransferase Accessibility Protocol for individual templates (MAPit), also known as Nucleosome Occupancy and Methylome Sequencing (NOME-seq).33,36,60 Briefly, cell nuclei were iso-lated and methylated in vitro using 200 units of the 5'-GC-3'
References1. Akers SN, Odunsi K, Karpf AR. Regulation of cancer
germline antigen gene expression: implications for cancer immunotherapy. Future Oncol 2010; 6:717-32; PMID:20465387
2. Simpson AJ, Caballero OL, Jungbluth A, Chen YT, Old LJ. Cancer/testis antigens, gametogenesis and can-cer. Nat Rev Cancer 2005; 5:615-25; PMID:16034368
3. Meek DW, Marcar L. MAGE-A antigens as targets in tumour therapy. Cancer Lett 2012; 324:126-32; PMID:22634429
4. Minges JT, Su S, Grossman G, Blackwelder AJ, Pop EA, Mohler JL, et al. Melanoma antigen-A11 (MAGE-A11) enhances transcriptional activity by link-ing androgen receptor dimers. J Biol Chem 2013; 288:1939-52; PMID:23172223
5. Liu W, Cheng S, Asa SL, Ezzat S. The melanoma-associated antigen A3 mediates fibronectin-controlled cancer progression and metastasis. Cancer Res 2008; 68:8104-12; PMID:18829569
6. Cappell KM, Sinnott R, Taus P, Maxfield K, Scarbrough M, Whitehurst AW. Multiple cancer testis antigens function to support tumor cell mitotic fidelity. Mol Cell Biol 2012; 32:4131-40; PMID:22869527
7. Whitehurst AW, Xie Y, Purinton SC, Cappell KM, Swanik JT, Larson B, et al. Tumor antigen acrosin binding protein normalizes mitotic spindle function to promote cancer cell proliferation. Cancer Res 2010; 70:7652-61; PMID:20876808
8. Whitehurst AW, Bodemann BO, Cardenas J, Ferguson D, Girard L, Peyton M, et al. Synthetic lethal screen identification of chemosensitizer loci in cancer cells. Nature 2007; 446:815-9; PMID:17429401
9. Renaud S, Loukinov D, Alberti L, Vostrov A, Kwon YW, Bosman FT, et al. BORIS/CTCFL-mediated tran-scriptional regulation of the hTERT telomerase gene in testicular and ovarian tumor cells. Nucleic Acids Res 2011; 39:862-73; PMID:20876690
10. Karpf AR, Bai S, James SR, Mohler JL, Wilson EM. Increased expression of androgen receptor coregulator MAGE-11 in prostate cancer by DNA hypomethyl-ation and cyclic AMP. Mol Cancer Res 2009; 7:523-35; PMID:19372581
11. Ehrlich M. DNA hypomethylation in cancer cells. Epigenomics 2009; 1:239-59; PMID:20495664
12. Karpf AR. Epigenetic alterations in oncogen-esis. Preface. Adv Exp Med Biol 2013; 754:v-vii; PMID:23189391
13. Cannuyer J, Loriot A, Parvizi GK, De Smet C. Epigenetic hierarchy within the MAGEA1 cancer-germline gene: promoter DNA methylation dic-tates local histone modifications. PLoS One 2013; 8:e58743; PMID:23472218
14. James SR, Link PA, Karpf AR. Epigenetic regula-tion of X-linked cancer/germline antigen genes by DNMT1 and DNMT3b. Oncogene 2006; 25:6975-85; PMID:16715135
15. Link PA, Gangisetty O, James SR, Woloszynska-Read A, Tachibana M, Shinkai Y, et al. Distinct roles for histone methyltransferases G9a and GLP in cancer germ-line antigen gene regulation in human cancer cells and murine embryonic stem cells. Mol Cancer Res 2009; 7:851-62; PMID:19531572
16. Wischnewski F, Pantel K, Schwarzenbach H. Promoter demethylation and histone acetylation mediate gene expression of MAGE-A1, -A2, -A3, and -A12 in human cancer cells. Mol Cancer Res 2006; 4:339-49; PMID:16687489
17. Karpf AR, Lasek AW, Ririe TO, Hanks AN, Grossman D, Jones DA. Limited gene activation in tumor and normal epithelial cells treated with the DNA meth-yltransferase inhibitor 5-aza-2'-deoxycytidine. Mol Pharmacol 2004; 65:18-27; PMID:14722233
18. Woloszynska-Read A, James SR, Link PA, Yu J, Odunsi K, Karpf AR. DNA methylation-dependent regula-tion of BORIS/CTCFL expression in ovarian cancer. Cancer Immun 2007; 7:21; PMID:18095639
19. Woloszynska-Read A, Mhawech-Fauceglia P, Yu J, Odunsi K, Karpf AR. Intertumor and intratumor NY-ESO-1 expression heterogeneity is associated with promoter-specific and global DNA methylation status in ovarian cancer. Clin Cancer Res 2008; 14:3283-90; PMID:18519754
20. Woloszynska-Read A, Zhang W, Yu J, Link PA, Mhawech-Fauceglia P, Collamat G, et al. Coordinated cancer germline antigen promoter and global DNA hypomethylation in ovarian cancer: association with the BORIS/CTCF expression ratio and advanced stage. Clin Cancer Res 2011; 17:2170-80; PMID:21296871
©20
13 L
ande
s B
iosc
ienc
e. D
o no
t dis
tribu
te.
www.landesbioscience.com Epigenetics 863
55. Mulero-Navarro S, Carvajal-Gonzalez JM, Herranz M, Ballestar E, Fraga MF, Ropero S, et al. The dioxin receptor is silenced by promoter hypermethylation in human acute lymphoblastic leukemia through inhibi-tion of Sp1 binding. Carcinogenesis 2006; 27:1099-104; PMID:16410262
56. Butler JE, Kadonaga JT. The RNA polymerase II core promoter: a key component in the regulation of gene expression. Genes Dev 2002; 16:2583-92; PMID:12381658
57. Darst RP, Pardo CE, Pondugula S, Gangaraju VK, Nabilsi NH, Bartholomew B, et al. Simultaneous single-molecule detection of endogenous C-5 DNA methyla-tion and chromatin accessibility using MAPit. Methods Mol Biol 2012; 833:125-41; PMID:22183592
58. Lin JC, Jeong S, Liang G, Takai D, Fatemi M, Tsai YC, et al. Role of nucleosomal occupancy in the epigenetic silencing of the MLH1 CpG island. Cancer Cell 2007; 12:432-44; PMID:17996647
59. Delmas AL, Riggs BM, Pardo CE, Dyer LM, Darst RP, Izumchenko EG, et al. WIF1 is a frequent target for epigenetic silencing in squamous cell carcino-ma of the cervix. Carcinogenesis 2011; 32:1625-33; PMID:21873353
60. Kilgore JA, Hoose SA, Gustafson TL, Porter W, Kladde MP. Single-molecule and population probing of chromatin structure using DNA methyltransferases. Methods 2007; 41:320-32; PMID:17309843
61. Chandran UR, Ma C, Dhir R, Bisceglia M, Lyons-Weiler M, Liang W, et al. Gene expression profiles of prostate cancer reveal involvement of multiple molecu-lar pathways in the metastatic process. BMC Cancer 2007; 7:64; PMID:17430594
62. Nanni S, Priolo C, Grasselli A, D’Eletto M, Merola R, Moretti F, et al. Epithelial-restricted gene profile of primary cultures from human prostate tumors: a molecular approach to predict clinical behavior of prostate cancer. Mol Cancer Res 2006; 4:79-92; PMID:16513839
63. Cancer Genome Atlas Research Network. Integrated genomic analyses of ovarian carcinoma. Nature 2011; 474:609-15; PMID:21720365
64. Hu N, Clifford RJ, Yang HH, Wang C, Goldstein AM, Ding T, et al. Genome wide analysis of DNA copy number neutral loss of heterozygosity (CNNLOH) and its relation to gene expression in esophageal squa-mous cell carcinoma. BMC Genomics 2010; 11:576; PMID:20955586
65. Aoyagi K, Minashi K, Igaki H, Tachimori Y, Nishimura T, Hokamura N, et al. Artificially induced epithelial-mesenchymal transition in surgical subjects: its impli-cations in clinical and basic cancer research. PLoS One 2011; 6:e18196; PMID:21533028
66. Cutcliffe C, Kersey D, Huang CC, Zeng Y, Walterhouse D, Perlman EJ; Renal Tumor Committee of the Children’s Oncology Group. Clear cell sarcoma of the kidney: up-regulation of neural markers with activation of the sonic hedgehog and Akt pathways. Clin Cancer Res 2005; 11:7986-94; PMID:16299227
67. Zhao H, Ljungberg B, Grankvist K, Rasmuson T, Tibshirani R, Brooks JD. Gene expression profiling predicts survival in conventional renal cell carcinoma. PLoS Med 2006; 3:e13; PMID:16318415
38. Bai L, Morozov AV. Gene regulation by nucleo-some positioning. Trends Genet 2010; 26:476-83; PMID:20832136
39. Bai S, He B, Wilson EM. Melanoma antigen gene pro-tein MAGE-11 regulates androgen receptor function by modulating the interdomain interaction. Mol Cell Biol 2005; 25:1238-57; PMID:15684378
40. Jurk M, Kremmer E, Schwarz U, Förster R, Winnacker EL. MAGE-11 protein is highly conserved in higher organisms and located predominantly in the nucleus. Int J Cancer 1998; 75:762-6; PMID:9495246
41. Su S, Blackwelder AJ, Grossman G, Minges JT, Yuan L, Young SL, et al. Primate-specific melanoma antigen-A11 regulates isoform-specific human proges-terone receptor-B transactivation. J Biol Chem 2012; 287:34809-24; PMID:22891251
42. Askew EB, Bai S, Blackwelder AJ, Wilson EM. Transcriptional synergy between melanoma antigen gene protein-A11 (MAGE-11) and p300 in androgen receptor signaling. J Biol Chem 2010; 285:21824-36; PMID:20448036
43. Su S, Minges JT, Grossman G, Blackwelder AJ, Mohler JL, Wilson EM. Proto-oncogene activity of Melanoma antigen-A11 (MAGE-A11) regulates Retinoblastoma-related p107 and E2F1. J Biol Chem 2013; In press.
44. Berman BP, Weisenberger DJ, Aman JF, Hinoue T, Ramjan Z, Liu Y, et al. Regions of focal DNA hypermethylation and long-range hypomethylation in colorectal cancer coincide with nuclear lamina-associated domains. Nat Genet 2012; 44:40-6; PMID:22120008
45. Reddy KL, Feinberg AP. Higher order chromatin orga-nization in cancer. Semin Cancer Biol 2013; 23:109-15; PMID:23266653
46. Karpf AR. A potential role for epigenetic modula-tory drugs in the enhancement of cancer/germ-line antigen vaccine efficacy. Epigenetics 2006; 1:116-20; PMID:17786175
47. Pandiyan K, You JS, Yang X, Dai C, Zhou XJ, Baylin SB, et al. Functional DNA demethylation is accom-panied by chromatin accessibility. Nucleic Acids Res 2013; 41:3973-85; PMID:23408854
48. Portela A, Liz J, Nogales V, Setién F, Villanueva A, Esteller M. DNA methylation determines nucleosome occupancy in the 5'-CpG islands of tumor suppressor genes. Oncogene 2013; PMID:23686312
49. Bi FF, Li D, Yang Q. Hypomethylation of ETS Transcription Factor Binding Sites and Upregulation of PARP1 Expression in Endometrial Cancer. Biomed Res Int 2013; 2013:946268; PMID:23762867
50. Hollenhorst PC, McIntosh LP, Graves BJ. Genomic and biochemical insights into the specificity of ETS transcription factors. Annu Rev Biochem 2011; 80:437-71; PMID:21548782
51. Harrington MA, Jones PA, Imagawa M, Karin M. Cytosine methylation does not affect binding of tran-scription factor Sp1. Proc Natl Acad Sci U S A 1988; 85:2066-70; PMID:3281160
52. Höller M, Westin G, Jiricny J, Schaffner W. Sp1 tran-scription factor binds DNA and activates transcription even when the binding site is CpG methylated. Genes Dev 1988; 2:1127-35; PMID:3056778
53. Clark SJ, Harrison J, Molloy PL. Sp1 binding is inhibited by (m)Cp(m)CpG methylation. Gene 1997; 195:67-71; PMID:9300822
54. Mancini DN, Singh SM, Archer TK, Rodenhiser DI. Site-specific DNA methylation in the neurofibro-matosis (NF1) promoter interferes with binding of CREB and SP1 transcription factors. Oncogene 1999; 18:4108-19; PMID:10435592
21. Rhee I, Bachman KE, Park BH, Jair KW, Yen RW, Schuebel KE, et al. DNMT1 and DNMT3b cooperate to silence genes in human cancer cells. Nature 2002; 416:552-6; PMID:11932749
22. Song L, James SR, Kazim L, Karpf AR. Specific method for the determination of genomic DNA methylation by liquid chromatography-electrospray ionization tandem mass spectrometry. Anal Chem 2005; 77:504-10; PMID:15649046
23. Rao M, Chinnasamy N, Hong JA, Zhang Y, Zhang M, Xi S, et al. Inhibition of histone lysine methylation enhances cancer-testis antigen expression in lung cancer cells: implications for adoptive immunotherapy of can-cer. Cancer Res 2011; 71:4192-204; PMID:21546573
24. Yoshida M, Kijima M, Akita M, Beppu T. Potent and specific inhibition of mammalian histone deacetylase both in vivo and in vitro by trichostatin A. J Biol Chem 1990; 265:17174-9; PMID:2211619
25. Egger G, Liang G, Aparicio A, Jones PA. Epigenetics in human disease and prospects for epigenetic therapy. Nature 2004; 429:457-63; PMID:15164071
26. Campbell MJ, Turner BM. Altered histone modifica-tions in cancer. Adv Exp Med Biol 2013; 754:81-107; PMID:22956497
27. De Plaen E, Naerhuyzen B, De Smet C, Szikora JP, Boon T. Alternative promoters of gene MAGE4a. Genomics 1997; 40:305-13; PMID:9119398
28. De Smet C, De Backer O, Faraoni I, Lurquin C, Brasseur F, Boon T. The activation of human gene MAGE-1 in tumor cells is correlated with genome-wide demethylation. Proc Natl Acad Sci U S A 1996; 93:7149-53; PMID:8692960
29. Li L, Davie JR. The role of Sp1 and Sp3 in normal and cancer cell biology. Ann Anat 2010; 192:275-83; PMID:20810260
30. Blume SW, Snyder RC, Ray R, Thomas S, Koller CA, Miller DM. Mithramycin inhibits SP1 binding and selectively inhibits transcriptional activity of the dihydrofolate reductase gene in vitro and in vivo. J Clin Invest 1991; 88:1613-21; PMID:1834700
31. Henikoff S. Nucleosomes at active promoters: unforgettable loss. Cancer Cell 2007; 12:407-9; PMID:17996642
32. Pondugula S, Kladde MP. Single-molecule analysis of chromatin: changing the view of genomes one molecule at a time. J Cell Biochem 2008; 105:330-7; PMID:18615586
33. Miranda TB, Kelly TK, Bouazoune K, Jones PA. Methylation-sensitive single-molecule analysis of chro-matin structure. Current protocols in molecular biol-ogy/edited by Frederick M Ausubel [et al.] 2010; Chapter 21:Unit 21 17 1-6.
34. You JS, Kelly TK, De Carvalho DD, Taberlay PC, Liang G, Jones PA. OCT4 establishes and maintains nucleosome-depleted regions that provide additional layers of epigenetic regulation of its target genes. Proc Natl Acad Sci U S A 2011; 108:14497-502; PMID:21844352
35. Jessen WJ, Dhasarathy A, Hoose SA, Carvin CD, Risinger AL, Kladde MP. Mapping chromatin structure in vivo using DNA methyltransferases. Methods 2004; 33:68-80; PMID:15039089
36. Pardo CE, Darst RP, Nabilsi NH, Delmas AL, Kladde MP. Simultaneous single-molecule mapping of protein-DNA interactions and DNA methylation by MAPit. Current protocols in molecular biology/edited by Frederick M Ausubel [et al.] 2011; Chapter 21:Unit 21 2.
37. Pardo CE, Carr IM, Hoffman CJ, Darst RP, Markham AF, Bonthron DT, et al. MethylViewer: computa-tional analysis and editing for bisulfite sequencing and methyltransferase accessibility protocol for individual templates (MAPit) projects. Nucleic Acids Res 2011; 39:e5; PMID:20959287
©20
13 L
ande
s B
iosc
ienc
e. D
o no
t dis
tribu
te.
Landes Bioscience www.landesbioscience.com
Supplemental Material to:
Smitha R. James, Carlos D Cedeno, Ashok Sharma, Wa Zhang, James L Mohler, Kunle Odunsi, Elizabeth M Wilson,
and Adam R Karpf
DNA methylation and nucleosome occupancy regulate the cancer germline antigen gene MAGEA11
Epigenetics 2013; 8(8)http://dx.doi.org/10.4161/epi.25500
http://www.landesbioscience.com/journals/epigenetics/
article/25500

A
C
B
D
James et al., Supplemental Figure1
SUPPLEMENTAL FIGURE 1. Oncomine analysis of MAGEA11 expression inesophageal and renal cancer. In each panel, fold change of MAGEA11 expression, p-value, and microarray platform are indicated, with the first author of the referencedstudies (top) (References 64-67). (A) MAGEA11 expression in normal esophagus andesophageal squamous cell carcinoma. (B) MAGEA11 expression in esophageal canceras a function of survival at one year. (C) MAGEA11 expression in human fetal kidney(normal control) and Wilms’ tumor. (D) MAGEA11 expression in renal cancer as afunction of survival at one year. Data are presented in box and whiskers plots, asdescribed in Figure 1.
James et al., Supplemental Figure 2
A B
MA
GE
A1
1 /
GA
PD
H m
RN
A
HCT116
DNMT1-
/-
DNMT3b
-/-
DNMT1-
/-, 3
b-/- (D
KO)110- 0 7
110- 0 6
110- 0 5
110- 0 4
110- 0 3
110- 0 2
SUPPLEMENTAL FIGURE 2. MAGEA11 expression and promoter methylation inHCT116 wild-type and DNMT knockout cell lines. (A) MAGEA11 mRNA expression inHCT116 wild-type and DNMT knockout HCT116 cell lines was determined using RT-qPCR. Expression is plotted on a logarithmic scale. (B) MAGEA11 promoter methylationin the indicated cell lines was determined using bisulfite clonal sequencing. The averagepercent methylation over the entire sequenced region (CGI, CpG island) and within theTSS region (red box) is shown.

James et al., Supplemental Figure 3
H3
K9
ac
Ch
IP(M
AG
EA
11
Co
py
#)
5% In
put
No Ab
LAPC4
LAPC4 +
DMSO
LAPC4 +
TSA
0
5100 3
1100 4
2100 4
A B
No antibody RNA Pol II0.00
0.01
0.02
0.03
0.04HCT116DKO
RN
A P
ol I
I C
hIP
(MA
GE
A1
1 co
py
# / 5
% in
pu
t)
SUPPLEMENTAL FIGURE 3. Chromatin Immunoprecipitation analyses (ChIP). (A)ChIP-qPCR was used to measure H3K9ac at the MAGEA11 promoter region in LAPC-4 cells before (LAPC-4) or after treatment with vehicle control (LAPC-4 + DMSO) or600 nM TSA (LAPC-4 + TSA). PCR results for 5% input DNA or no antibody served aspositive and negative controls, respectively. (B) RNA Polymerase II (Pol II) ChIP at theMAGEA11 promoter region in HCT116 and DNMT1/3b double knockout HCT116 cells(DKO). Top: end point ChIP-PCR analysis. Bottom: ChIP-qPCR analysis. Amplificationof 5% input DNA, or of ChIP performed with no antibody, served as positive andnegative controls, respectively.