
James RA Skipworth - UCL Discovery
223
1 James Skipworth Hepatic Mitochondrial Renin-Angiotensin Systems PhD Thesis James R A Skipworth MBBS, BSC(Hons), MRCS Department of Surgery & Interventional Science, University College London, London, UK
-
Upload
khangminh22 -
Category
Documents
-
view
3 -
download
0
Transcript of James RA Skipworth - UCL Discovery

1 James Skipworth
Hepatic Mitochondrial Renin-Angiotensin Systems
PhD Thesis
James R A Skipworth MBBS, BSC(Hons), MRCS
Department of Surgery & Interventional Science,
University College London,
London, UK

Hepatic Mitochondrial Renin-Angiotensin Systems
James R A Skipworth 2
Initial Statement I, James R A Skipworth, confirm that the work presented in this thesis is my own. Where
information has been derived from other sources, I confirm that this has been indicated in
the thesis. All methods and results have been reproduced and reported here faithfully and
accurately, and in as much detail as possible. All experimentation was individually and
personally performed by James R A Skipworth, except for electron microscopy imaging,
which was performed by experienced electron microscopy technical staff at the Royal Free
Hospital, UCL, London; and mass spectrometry, which was performed by experienced mass
spectrometry staff at the Institute for Child Health (University College London, London)
and the Taplin Mass Spectrometry unit (Harvard Medical School, USA).
Signed:…………………………………………………………………………………………
Date:
……………………………………………………………………………………………

Hepatic Mitochondrial Renin-Angiotensin Systems
James R A Skipworth 3
Acknowledgements I would like to express huge thanks to my supervisors: Professor Hugh Montgomery, Dr
Gyorgy Szabadkai and Mr Steven Oldedamink for their seemingly endless font of advice
and enthusiasm; and also Dr Jay Acharya, Dr Jutta Palmen, Dr Julie Sanders, Professor
Michael Duchen, Professor Massimo Malago’ and Professor Steve Humphries for their
significant contributions, both practical and theoretical.
I remain indebted to the No Surrender Charitable Trust for their friendship and kind
provision of funds, without which this project would not have been possible.
My friends and family were a constant source of encouragement and support, as they always
have been, and for this I will always remain extremely thankful. My parents, in particular,
have always provided a reference point to aspire to and have shaped me into the person I am
today.
Finally, I would like to thank my wife, Bryony, and children, Jacob and Lucy, for their
patience and forbearance during this long project, as well as their tolerance of my regular
absence.

Hepatic Mitochondrial Renin-Angiotensin Systems
James R A Skipworth 4
Abbreviations
ACE- Angiotensin converting enzyme; ACE-I- ACE inhibition; ADP- Adenosine
diphosphate; AGT- Angiotensinogen; Ang- Angiotensin; ANT- ADP/ATP translocator;
ARB- Angiotensin receptor blocker; ATP- Adenosine triphosphate; ATR- Angiotensin
receptor; AU- Arbitrary units
BCA- Bicinchoninic acid; BK- Bradykinin; BSA- Bovine serum albumin
C- Cytoplasm; cAMP- Cyclic adenosine monophosphate; CHF- Congestive heart failure;
CM- Crude mitochondria; COX-2- Cyclooxygenase-2; CRP- C-reactive protein
dCn- Delta correlation score; DMEM- Dulbecco’s modified eagle’s medium; DNA-
Deoxyribonucleic acid; DSS- Disuccinmidyl suberate
ECM- extracellular matrix; EM- Electron microscope; ER- endoplasmic reticulum; ESI-
Electrospray ionization; ETC- Electron transport chain
FAD- Flavin adenine dinucleotide; FBS- Foetal bovine serum; FCCP- Carbonilcyanide p-
triflouromethoxyphenylhydrazone
GLUT- Glucose transporter; grp75- Glucose-regulated protein 75
H- Homogenate; HSC- Hepatic stellate cell; HGF- Hepatocyte growth factor
IP- Immunoprecipitation; IP2- inositol 4,5-bisphosphate; IP3- Inositol 1,4,5-trisphosphate
kDa- Kilodaltons
L- Lysosomes; L-NAME- N-nitro-L-arginine methyl ester
ΔΨm- Mitochondrial membrane potential; MALDI – TOF- Matrix-assisted laser
desorption ionisation – Time of flight; MAM- Mitochondrial associated membranes;
MAPK- Mitogen-activated protein kinase; MMP-2- Matrix metalloproteinase 2; mRAS-
Mitochondrial renin-angiotensin system; mRNA- Messenger RNA; MS- Microsomes;
MIF- Macrophage migration inhibitory factor; mW- Molecular Weight
NAD- Nicotinamide adenine dinucleotide; NADPH- Nicotinamide adenine dinucleotide
phosphate; N- Nucleus

Hepatic Mitochondrial Renin-Angiotensin Systems
James R A Skipworth 5
O2C- Change in Oxygen consumption; OXA- Oxidase assembly machinery
PBS- Phosphate buffered saline; PLGS- Protein Lynx Global Server; PM- Pure
mitochondria; PNGase-F- Peptide N-glycosidase F; PRR- Prorenin receptor; PVDF-
Polyvinylidene difluoride
RAS- Renin-angiotensin systems; RAS-I- RAS inhibition; RNA- Ribonucleic acid; ROS-
Reactive oxygen species
SERCA- Sarco/endoplasmic reticulum Ca2+ ATPase; SiRNA- Small interfering RNA; SS-
Size standards
TBS- Tris-buffered saline; TGF- Transforming Growth Factor; TMRM-
Tetramethylrhodamine methyl ester; tRNA- Transfer RNA
UCP- Uncoupling protein
VDAC- Voltage-dependent anion-channel protein
XCorr- Cross correlation score

Hepatic Mitochondrial Renin-Angiotensin Systems
James R A Skipworth 6
Abstract Introduction: The circulating renin-angiotensin system (RAS) was originally described as a
key endocrine regulator of intravascular homeostasis; however, the existence of a local
(tissue) RAS has become increasingly reported in a variety of tissues including liver. RAS
components have now also been detected in rat heart, brain and smooth muscle cell
mitochondria as well as within intramitochondrial dense bodies of rat adrenal tissue.
Further, reduced RAS levels have been associated with improved endurance performance
and fatigue resistance in human skeletal muscle, suggesting that low RAS activity is
associated with metabolic efficiency, potentially via RAS action upon, or within,
mitochondria. However, such investigation has often relied heavily upon qualitative
techniques (e.g. Western blotting, immunofluorescence and electron microscopy), which
contain inherent limitations in that they completely rely upon the limited specificity of
antibodies to demonstrate the existence of intra-mitochondrial RAS components.
Methods: The presence of RAS components within the mitochondria of rat hepatic tissue
and liver cell-lines was investigated via sub-fractionation of rat liver tissue and cell-lines,
followed by Western blotting, as well as via immunofluorescence and confocal microscopy,
and electron microscopy. The mitochondrial effects of stimulating or antagonizing hepatic
RAS were assessed via functional fluorescence microscopy (for assessment of NADH,
calcium and mitochondrial membrane potential) and measurement of oxygen consumption
within live cells of a liver cell-line.
Results: Western blotting, immunofluorescence and electron microscopy suggested the
presence of RAS components within mitochondria; however, there was a lack of results
consistency between techniques and the staining patterns were largely non-specific. Western
blotting further demonstrated the presence of a prominent 55 kDa band, when
immunostaining a mitochondrial fraction with (angiotensin-converting enzyme) ACE C-
terminal antibody (usual size 180 kDa). This was further explored via isolation of the 55
kDa molecule and mass spectrometry to yield results consistent with non-specific staining
only. Addition of RAS agonists or antagonists to live liver cell-lines demonstrated no
consistent results, except at supra-physiological levels, where RAS antagonists improved
oxygen consumption.
Conclusions: Such data suggest that the previous descriptions of RAS components within

Hepatic Mitochondrial Renin-Angiotensin Systems
James R A Skipworth 7
mitochondria are likely to be secondary to methodological flaws, particularly the reliance
upon single antibodies, which have subsequently been shown to have poor specificity. Thus,
the effect of ang II on liver mitochondria is unlikely to be direct and any such action is
likely to occur via one of several intracellular pathways, regulation of gene expression or
mitochondrial biogenesis.
Hepatic Mitochondrial Renin-Angiotensin Systems
James R A Skipworth 8
Contents
Introduction 10
I1. Renin-Angiotensin Systems ........................................................................................................................... 11 I2. A Metabolic Role for RAS ............................................................................................................................. 27
I3. RAS & Mitochondria ..................................................................................................................................... 30
I4. Summary & Rationale ................................................................................................................................... 54
Aims & Study Plan 56
Methods 60 M1. Materials ....................................................................................................................................................... 61 M2. Cell-Lines & Tissues .................................................................................................................................... 65
M3. Cellular Sub-Fractionation & Mitochondrial Isolation............................................................................ 68
M4. Western Blotting ........................................................................................................................................... 73
M5. Immunofluorescence .................................................................................................................................... 76 M6. Functional Fluorescence Microscopy ......................................................................................................... 79
M7. Immunogold Labeling & Electron Microscopy ......................................................................................... 81
M8. Immunoprecipitation ................................................................................................................................... 83
M9. Mass Spectrometry ....................................................................................................................................... 85 M10. Oxygen Consumption ................................................................................................................................ 90
Results 1: Presence of RAS Components In Hepatic Mitochondria 91
R1.1 Introduction ................................................................................................................................................. 93
R1.2 Methods ........................................................................................................................................................ 94
R1.3 Results .......................................................................................................................................................... 96
R1.6 Discussion ................................................................................................................................................... 122

Hepatic Mitochondrial Renin-Angiotensin Systems
James R A Skipworth 9
Results 2: Is There A Mitochondrial Specific Form Of ACE? 124
R2.1 Introduction ............................................................................................................................................... 127
R2.2 Methods ...................................................................................................................................................... 129
R2.3 Results ........................................................................................................................................................ 130
R2.5 Discussion ................................................................................................................................................... 134
Results 3: Functional analysis Of A Hepatic Mitochondrial RAS 135
R3.1 Introduction ............................................................................................................................................... 138 R3.2 Methods ...................................................................................................................................................... 140
R3.3 Results ........................................................................................................................................................ 144
R3.4 Discussion ................................................................................................................................................... 160
Discussion 164
D1. Conclusions .................................................................................................................................................. 165
D2. Hepatocellular RAS .................................................................................................................................... 170
References 172
Appendices 212

Hepatic Mitochondrial Renin-Angiotensin Systems
James R A Skipworth 10
INTRODUCTION
Hepatic Mitochondrial Renin-Angiotensin Systems
James R A Skipworth 11
I1. Renin-Angiotensin Systems
I1. a. Circulating Renin-Angiotensin Systems
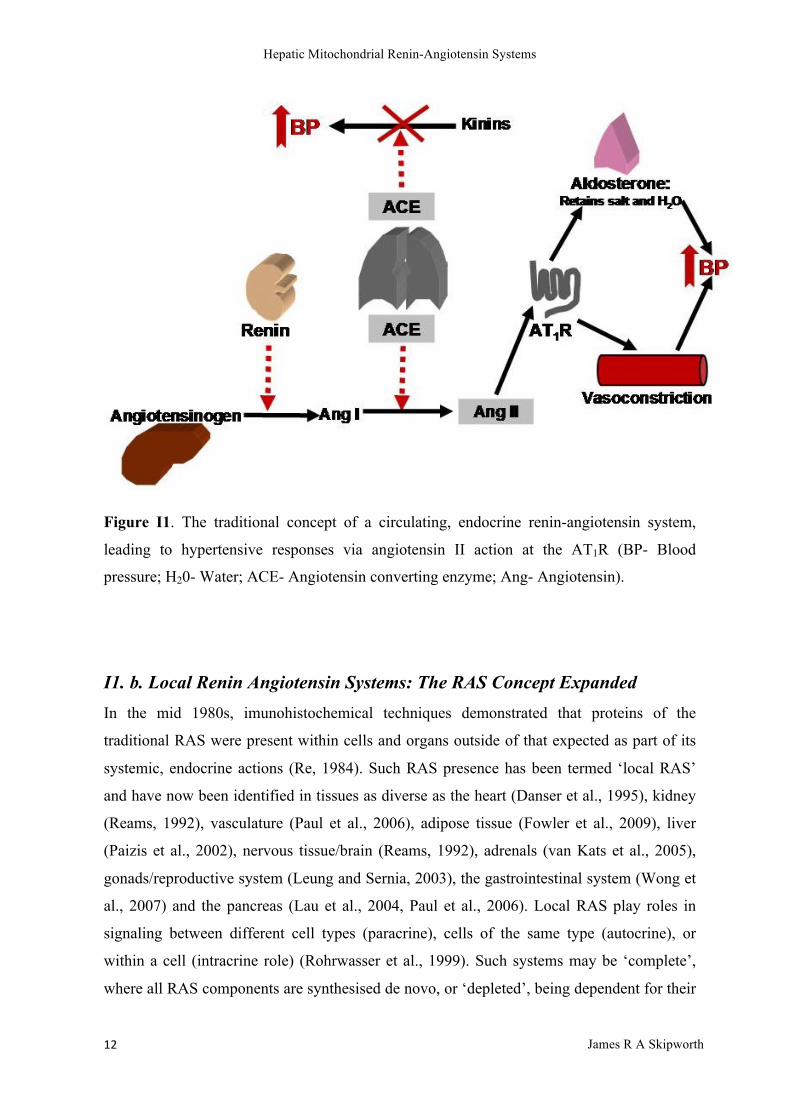
The circulating (endocrine or systemic) renin-angiotensin system (RAS) was originally
described as a key regulator of intravascular homeostasis, controlling extracellular fluid
volume, blood pressure and absorption of electrolytes (Peach, 1977, Reid et al., 1978) (see
Figure I1). In response to decreased afferent arteriolar pressure, decreased filtered sodium
load in the nephron ultra-filtrate (from low plasma sodium concentrations or decreased
glomerular filtration) or sympathetic nervous stimulation, the renal juxtaglomerular
apparatus releases renin (Hackenthal et al., 1990). This aspartyl protease cleaves a leucine-
leucine peptide bond in the hepatically-derived α2 globulin angiotensinogen to yield the
non-pressor decapaptide angiotensin I (ang I) (Menard, 1993). Angiotensin-converting-
enzyme (ACE) is a peptidyl dipeptidase which hydrolyses ang I to yield the pressor
octapeptide angiotensin II (ang II) (Caldwell et al., 1976), whose effects are mediated
through 2 specific human receptors (AT1R and AT2R) (Timmermans and Smith, 1994). The
endocrine roles of the AT2 receptor are less well defined (de Gasparo et al., 2000,
Matsusaka and Ichikawa, 1997) than that of the AT1R which, stimulated by ang II, mediates
a hypertensive response through primary vasoconstriction and the release of aldosterone, the
latter promoting sodium and water resorption from the distal convoluted tubule and
collecting ducts (Matsusaka and Ichikawa, 1997). ACE is also a potent kininase, reducing
the activity of bradykinin at its BK1 and BK2 receptors, capable of stimulating a variety of
inflammatory and vascular responses, and ACE may also have similar regulatory actions
upon other RAS components (Leeb-Lundberg et al., 2005, Campbell et al., 1994, Brown et
al., 1998, Murphey et al., 2000, Margolius, 1996). Increasing circulating ACE activity
therefore drives hypertensive responses (increased AT1R receptor activation) and diminishes
hypotensive responses (reduced vasodilation via BK2 receptor activation). In these ways,
circulating RAS plays a crucial role in the regulation of human blood pressure and salt and
water balance (Kem and Brown, 1990).
Hepatic Mitochondrial Renin-Angiotensin Systems
James R A Skipworth 12
Figure I1. The traditional concept of a circulating, endocrine renin-angiotensin system,
leading to hypertensive responses via angiotensin II action at the AT1R (BP- Blood
pressure; H20- Water; ACE- Angiotensin converting enzyme; Ang- Angiotensin).
I1. b. Local Renin Angiotensin Systems: The RAS Concept Expanded In the mid 1980s, imunohistochemical techniques demonstrated that proteins of the
traditional RAS were present within cells and organs outside of that expected as part of its
systemic, endocrine actions (Re, 1984). Such RAS presence has been termed ‘local RAS’
and have now been identified in tissues as diverse as the heart (Danser et al., 1995), kidney
(Reams, 1992), vasculature (Paul et al., 2006), adipose tissue (Fowler et al., 2009), liver
(Paizis et al., 2002), nervous tissue/brain (Reams, 1992), adrenals (van Kats et al., 2005),
gonads/reproductive system (Leung and Sernia, 2003), the gastrointestinal system (Wong et
al., 2007) and the pancreas (Lau et al., 2004, Paul et al., 2006). Local RAS play roles in
signaling between different cell types (paracrine), cells of the same type (autocrine), or
within a cell (intracrine role) (Rohrwasser et al., 1999). Such systems may be ‘complete’,
where all RAS components are synthesised de novo, or ‘depleted’, being dependent for their

Hepatic Mitochondrial Renin-Angiotensin Systems
James R A Skipworth 13
function on the uptake of some critical RAS components from the circulation (Campbell and
Habener, 1986, Deschepper et al., 1986, Dzau, 1989). Such tissue RAS play myriad roles,
including the regulation of cell growth, differentiation, apoptosis, and proliferation;
metabolism and generation of reactive oxygen species and free radicals; tissue inflammation
and fibrosis; local haemodynamics; and hormonal secretion (Leung and Ip, 2006, Ganong,
1995, Leung et al., 1999, Speth et al., 1999, Regulska et al., Paul et al., 2006, Hitomi et al.,
2007, Touyz, 2005).
Local RAS demonstrate significantly more complexity than the traditional, circulating
system, and include an alternative RAS pathway (ACE2-Ang(1-7)-Mas axis) for the
cleavage of ang I (see Figure I2). ACE2, the principal processing enzyme of the alternative
RAS pathway, is capable of cleaving the terminal leucine from ang I to generate ang II (1-9)
(Donoghue et al., 2000), but it has 400-fold greater affinity for ang II itself (Vickers et al.,
2002), from which it cleaves the terminal phenylalanine residue to synthesise ang (1-7), an
angiotensin I heptapeptide (Tipnis et al., 2000, Turner et al., 2002). ACE2 has been
identified in diverse rodent tissues including lung, adipose tissue (Gembardt et al., 2005),
liver (Paizis et al., 2002), brain (Xia and Lazartigues, 2008) and pancreas (Tikellis et al.,
2008), with confirmation in human heart, kidney, testis and small and large intestine
(Donoghue et al., 2000, Tipnis et al., 2000), suggesting ubiquitous expression. Ang (1-7),
the primary product of ACE2 action on ang II acts through the Mas receptor (Santos et al.,
2003) and therefore has separate effects to the vasoconstrictor, pro-inflammatory and pro-
oxidant effects mediated via ang II action on the AT1 receptor. Mas receptor activation, by
contrast, produces vasodilation via activation of bradykinin and nitric oxide (possibly via
the Akt pathway (Sampaio et al., 2007, Toblli et al., 2008), prostaglandin release (Almeida
et al., 2000), norepinephrine inhibition (Gironacci et al., 2004) and attenuation of
inflammation and fibrosis via TGF and MIF (macrophage migration inhibitory factor)
inhibition (Zhong et al., 2008, Grobe et al., 2007). ACE2 therefore negatively regulates the
RAS and acts as an endogenous ACE inhibitor through alterations in formation of
angiotensin II and angiotensin (1-7), thereby counter-balancing ACE action (see Figure I3).
The alternative RAS pathway may act independently or in conjunction with ACE in the
regulation of the local RAS, and may therefore be important in novel pathways of
angiotensin metabolism and multiple pathogenic processes.

Hepatic Mitochondrial Renin-Angiotensin Systems
James R A Skipworth 14
Within local RAS, a variety of ang I-processing enzymes exist in addition to ACE and
ACE2, including chymase, chymotrypsin, tonin, aminopeptidase A, B and N,
prolylendopeptidase, and neutral endopeptidase. Their actions yield a range of other
biologically-active compounds. However, some of these enzymes will only become
biologically active in pathological or abnormal conditions and the physiological relevance
of such alternate ang-processing enzymes therefore requires further elucidation (Fyhrquist
and Saijonmaa, 2008). Angiotensin II is degraded to ang III (heptapeptide angiotensin 2-8)
by vascular and erythrocyte angiotensinases, and subsequently to hexapeptide ang IV
(hexapeptide angiotensin 3-8), both of which have qualitatively similar circulatory effects to
that of ang II, with ang III also acting via the AT1R and ang IV having its own specific
functional receptor (Fyhrquist and Saijonmaa, 2008).
Figure I2. Local renin angiotensin systems: an expanded concept involving an alternative
RAS processing pathway, via action of ACE2 (Ang- Angiotensin; AT1R- Angiotensin II
type 1 Receptor; AT2R- Angiotensin II type 2 Receptor; MasR- Mas Receptor; ACE-
Angiotensin converting Enzyme; ACE2- Angiotensin Converting Enzyme 2).
Angiotensinogen
Ang (1-‐12) Ang I
Ang IIIAng IV
AT1R
Ang II
AT2R
Ang (1-‐7)
MasR
Ang (1-‐9)
ACE2Renin
ACE2
?
?ACE?ACE
ACEChymaseEndo-‐Peptidases
ACE
?

Hepatic Mitochondrial Renin-Angiotensin Systems
James R A Skipworth 15
...
Figure I3. The various roles of the classical (endocrine) and alternative (novel) local renin-
angiotensin systems are largely antagonistic (Ang- Angiotensin; AT1R- Angiotensin II type
1 Receptor; MasR- Mas Receptor; ACE- Angiotensin converting Enzyme; ACE2-
Angiotensin Converting Enzyme 2).
I1. c. RAS Components
I1. c. i. Renin
Renin is a highly-specific endopeptidase, secreted by granular cells of the renal
juxtagomerular apparatus, whose primary endocrine function is to increase blood pressure
and to this end renin hydrolyzes angiotensinogen to ang I. It is synthesized from renin
precursor, a 406-amino acid peptide, which undergoes sequential proteolytic cleavage
within the Golgi apparatus to an active, mature 340 amino acid (37 kDa) form (Imai et al.,
1983, Pratt et al., 1983). Prorenin is glycosylated to various degrees, with higher levels of
glycosylation affecting its cellular secretion and internalisation, via the mannose-6-
phosphate receptor (Kumar et al., 2007). As part of the local RAS, renin can be synthesized
intracellularly or taken up from the circulation, or both (e.g. cardiac myocytes) (Kumar et
‘Classical’ RAS
‘Alternative’ RAS
Mas Receptor
Ang 1-‐7
ACE2
AT1 Receptor
Ang II
ACE
VasoconstrictionPro-‐FibroticPro-‐Trophic
Pro-‐InflammatoryPro-‐ThromboticNa Reabsorption
VasodilatationAnti-‐FibroticAnti-‐Trophic
Anti-‐InflammatoryAnti-‐Thrombotic
Natriuresis

Hepatic Mitochondrial Renin-Angiotensin Systems
James R A Skipworth 16
al., 2007) and internalisation of non-glycosylated prorenin, via as yet unidentified receptors,
is accompanied by similar increases in ang I and ang II, suggesting intracellular RAS
synthesis (Kumar et al., 2007).
During condensation and packaging of the renin granules, a dipeptide near the carboxyl
terminus is excised, converting renin into a two chain molecule combined by a disulphide
bridge, which has less enzymatic activity than the single chain form (Pratt et al., 1983).
Minor differences in amino acid composition, via variations in cleavage positions during
processing, mean that multiple isoelectric forms of prorenin, one- and two-chain renin have
been observed, with both one- and two-chain renin being secreted; whereas, prorenin is
usually not (Pratt et al., 1983). The renin gene comprises 12 kb of DNA and contains 8
introns, producing multiple forms of mRNA to encode different renin isoforms (Hobart et
al., 1984).
I1. c. ii. ACE
Angiotensin-converting enzyme (ACE) is a zinc-dependent dipeptidyl carboxypeptidase that
belongs to the M2 family of zinc metallopeptidases and catalyses the hydrolysis of
dipeptides from the carboxyl terminus of a wide variety of oligopeptides. The most
celebrated physiological substrate for ACE is angiotensin I, which is converted into the
potent vasopressor angiotensin II by removal of the C-terminal His-Leu; and the vasodilator
bradykinin, which is inactivated by cleavage of the penultimate Pro-Phe bond. Other
substrates of ACE include gonadotropin-releasing hormone (GnRH) or luteinising hormone-
releasing hormone (LH-RH); substance P; b-neoendorphin1–9; and neurotensin, but the
significance of these reactions in vivo remains uncertain.
An assessment of ACE’s three-dimensional structure demonstrates that it is largely
composed of alpha-helices, but also incorporates a zinc ion and two chloride ions. Thus, it
bears little resemblance to carboxypeptidase A except in the presence of an active zinc-
binding motif. This similarity extends to the active site, which consists of a deep, narrow
channel that divides the molecule into two subdomains. At the superior aspect of the

Hepatic Mitochondrial Renin-Angiotensin Systems
James R A Skipworth 17
molecule is an amino-terminal, which allows only small peptide substrates (2530 amino
acids) access to the active site cleft, thus accounting for the inability of ACE to hydrolyse
large, folded substrates.
ACE is expressed in two main forms derived from a single gene by alternative splicing.
Both forms are type-1 membrane proteins (i.e. N-terminal regions are located extra-
cellularly) but differ in their tissue expression and structure. The larger somatic ACE
(sACE; 195kDa) is a ubiquitous, membrane-bound protein with two metalloproteinase
domains (N- and C-terminal), each containing a canonical zinc-binding sequence motif
(HExxH; His-Glu-x-x-His); and although both domains have protease activity (both are
blocked by ACE-inhibitors) and are capable of converting ang I to ang II, the C-terminal
domain is more important for blood pressure regulation. The smaller, secreted, testis-
specific form of ACE (tACE; 90kDa) is composed of 27 helices (20 alpha-helices and seven
310-helices) and contains only the C-terminal metalloproteinase domain, together with the
hydrophobic membrane-anchoring domain and a small N-terminal region that has multiple
O-linked oligosaccharides; all of which packages into an ellipsoid shape with a central core
channel (Sturrock et al., 2004). Both sACE and tACE are expressed on the cell surface,
from where the biologically-active domains are released into the circulation by a cleavage-
secretion process regulated by a small region in the C-terminal domain; and both forms
convert inactive ang I to active ang II, as well as inactivating bradykinin (Chattopadhyay et
al., 2008, Pang et al., 2001).
However, further, novel isoforms of ACE are also known to exist, with largely unknown
functions and uncharacterized structures and synthetic pathways. Both 60 kDa and 130 kDa
secretory isoforms exists, and an N-domain form also exists within urine in both 65 kDa and
90 kDa isoforms (Fernandes et al., 2008, Ronchi et al., 2005, Ronchi et al., 2007, Camargo
de Andrade et al., 2006). Further, although ACE exists primarily as a membrane-bound
form, a soluble form is present in plasma, amniotic fluid and other bodily fluids and is
derived from the membrane-bound form by a post-translational proteolytic
cleavage/shedding mechanism (Kumar et al., 2007).

Hepatic Mitochondrial Renin-Angiotensin Systems
James R A Skipworth 18
I1. c. iii. ACE2
ACE2 (or ACE H) is an 805-amino acid protein initially isolated from a failing human heart
ventricle and lymphoma cDNA libraries (Donoghue et al., 2000, Tipnis et al., 2000) and
later confirmed as the receptor for the SARS coronavirus (Li et al., 2003), which shares 42%
sequence homology with ACE (Donoghue et al., 2000), and which retains its catalytic
domains (Donoghue et al., 2000, Tipnis et al., 2000). However, unlike ACE, and unique
among mammalian carboxypeptidases, ACE2 contains a single HEXXH zinc-binding
domain resulting in monocarboxypeptidase activity, although it does conserve other critical
residues typical of ACE (Tipnis et al., 2000). ACE2 functions as a carboxypeptidase when
acting upon ang I and II (Turner et al., 2002) and exists in both membrane-bound and
soluble (generated by proteolytic cleavage of the ectodomain by tumour necrosis factor
convertase, ADAM17 (Lambert et al., 2005)) forms (Donoghue et al., 2000), but neither
hydrolyses or is inhibited by bradykinin, and is not sensitive to ACE-inhibitors despite
sharing ACE’s catalytic domain (Tipnis et al., 2000).
I1. c. iv. Angiotensins
Angiotensinogen (AGT) is a 452 amino acid α-2-globulin, of the serine protease inhibitor
family (serpins), which is synthesised locally and then secreted extracellularly under the
control of a signal sequence and the presence of glycosylation (Kumar et al., 2007).
Multiple forms of angiotensinogen with varying degrees of glycosylation have been
identified, suggesting complex intracellular distribution mechanisms (Kumar et al., 2007).
AGT exists within the circulation as a reduced, unbridged form and an oxidised sulphydryl-
bridged form (40:60), which preferentially interacts with renin (Zhou et al., 2010), cleaving
the leu-val peptide bond and creating the decapeptide (des-Asp) ang I. AGT appears to have
no independent function, existing solely as a precursor to biologically active ang II.
Ang II is formed by ACE-mediated removal of two C-terminal residues from ang I and its
action via the AT1R stimulates smooth muscle Gq proteins, activating vascular cell smooth
muscle contraction by an IP3-dependent mechanism. Whilst circulating ang II has a half-life
of approximately 30 seconds, its intracellular half-life may be as long as 15–30 minutes.
Ang II can be further processed to fragments of its original size, including ang III
(angiotensin heptapeptide 2-8) and ang IV (angiotensin hexapeptide 3-8), both of which

Hepatic Mitochondrial Renin-Angiotensin Systems
James R A Skipworth 19
have significantly less pressor activity than ang II, although ang III has 100 % of the
aldosterone-producing activity.
Ang III acts on the AT1R to produce similar effects to ang II, including vasoconstriction and
aldosterone release, and is generated from ang II predominantly by the action of
aminopeptidase A; however, it is metabolically cleared five times faster than ang II
(Fyhrquist and Saijonmaa, 2008).
Biologically active ang IV is generated from ang III by aminopeptidase M (predominantly),
its receptor (AT4R) being an insulin-regulated amino peptidase receptor (IRAP) found
within a broad range of tissues, with particularly high expression in the brain (Kumar et al.,
2007, Zhuo et al., 1998). The AT4 receptor was originally described as a high-affinity
binding site for ang IV, although the peptide LVV-hemorphin 7 has now also been
demonstrated to be a biologically active AT4R ligand (Chai et al., 2004). Agonist action of
ang IV at the AT4R causes improvements in memory and cognition, increased renal cortical
blood flow and decreased Na+ transport in renal proximal tubules, and may counteract
AT1R-mediated cardiovascular events such as injury in response to ischaemia and
reperfusion, cardiac cell apoptosis and cardiomyocyte hypertrophy (Yang et al., Chai et al.,
2004, Kerins et al., 1995).
Ang (1-7; angiotensin heptapeptide), the primary product of ACE2 action on ang II, acts
through the Mas receptor (Santos et al., 2003) to produce antagonistic effects to ang II, and
can also be generated by the action of other peptidases on ang II (Sampaio et al., 2007,
Toblli et al., 2008, Almeida et al., 2000, Gironacci et al., 2004, Zhong et al., 2008, Grobe et
al., 2007).
I1. c. v. RAS Receptors
AT1R, AT2R and the Mas Receptor are pharmacologically-distinct rhodopsin-like G-Protein
Coupled Receptors (GPCR), integral membrane proteins with an extracellular amino

Hepatic Mitochondrial Renin-Angiotensin Systems
James R A Skipworth 20
terminus, seven trans-membrane alpha-helical spanning regions with alternating
intracellular and extracellular loops, and a cytosolic Carboxyl terminus. They activate a
single or multiple G-proteins, each of which has 3 subunits (alpha, beta and gamma), of
which the alpha subunit dissociates upon activation, rendering it active to affect intracellular
signalling peptides or target functional proteins directly. Upon binding to ang II, the AT1R
translocates to the nucleus to affect transcription directly and resulting in reduced plasma
membrane receptor density (Cook et al., 2006, Cook et al., 2004, Lee et al., 2004, Bkaily et
al., 2003); however, significantly less is known of the function of the AT2R, although its
levels appear to be significantly higher in the foetus than in the adult.
Multiple specific antagonists have been identified for most RAS receptors including
Losartan and PD123319, which are specific, competitive antagonists of the AT1R and
AT2R, respectively.
I1. d. Specific Tissue RAS I1. d. i. Hepatic RAS
All the components of the classical RAS (renin, angiotensinogen, ACE, ang II, AT1R and
AT2R) have been identified in rat and human liver, where they have been implicated in the
pathophysiology of various hepatic conditions, including chronic liver disease and fibrosis
(Paizis et al., 2002, Paizis et al., 2005). Hepatic RAS activation and upregulation has been
demonstrated following liver injury (from a number of various pathological insults), and
RAS components have been shown to subsequently localize to areas of active fibrosis
formation, where they can be identified in activated, but not quiescent, hepatic stellate cells
(HSCs- crucial in the formation of liver fibrosis) (Bataller et al., 2003b, Bataller and
Brenner, 2005, Friedman, 2008). Within healthy liver, quiescent HSCs express very low
levels of RAS components and are unable to secrete ang II (Bataller et al., 2003b); however,
following injury to hepatic tissue, HSCs become activated, increasing their expression of
RAS components and acquiring the ability to synthesise ang II, which further stimulates
activation and proliferation of HSCs via the AT1R (Bataller et al., 2003b, Bataller et al.,
2000), possibly through an oxidative stress and ROS generation-related mechanism (via
Hepatic Mitochondrial Renin-Angiotensin Systems
James R A Skipworth 21
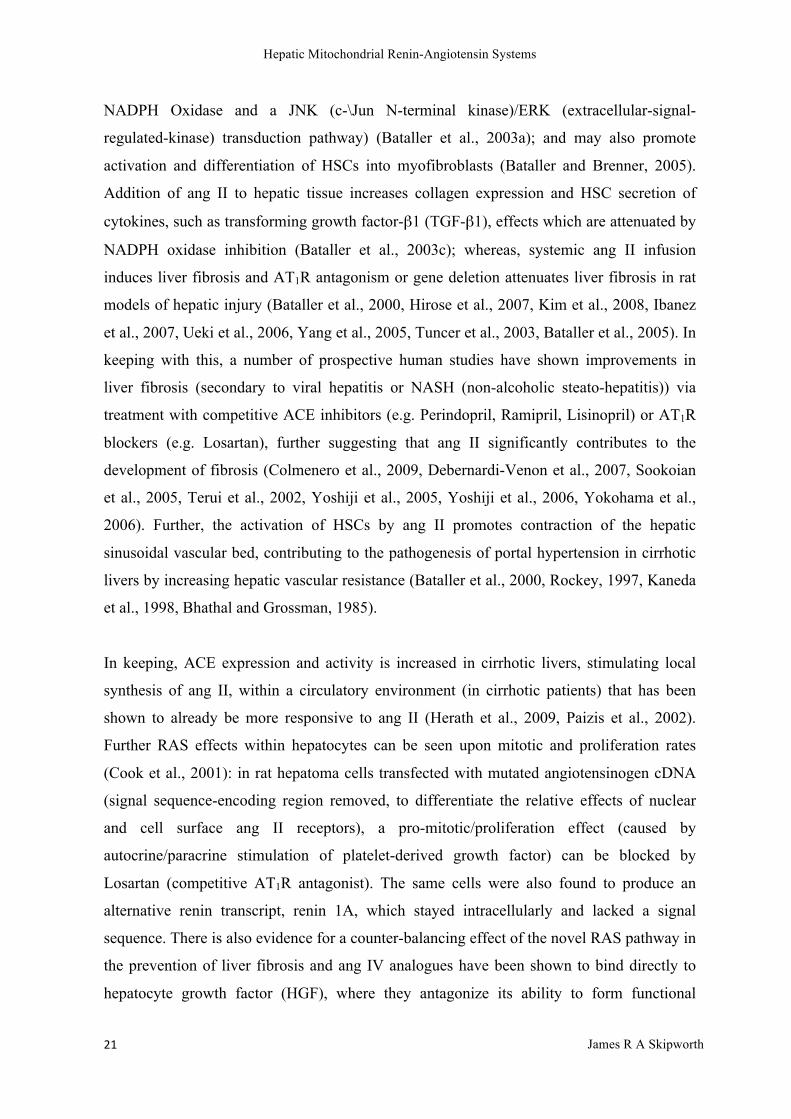
NADPH Oxidase and a JNK (c-\Jun N-terminal kinase)/ERK (extracellular-signal-
regulated-kinase) transduction pathway) (Bataller et al., 2003a); and may also promote
activation and differentiation of HSCs into myofibroblasts (Bataller and Brenner, 2005).
Addition of ang II to hepatic tissue increases collagen expression and HSC secretion of
cytokines, such as transforming growth factor-β1 (TGF-β1), effects which are attenuated by
NADPH oxidase inhibition (Bataller et al., 2003c); whereas, systemic ang II infusion
induces liver fibrosis and AT1R antagonism or gene deletion attenuates liver fibrosis in rat
models of hepatic injury (Bataller et al., 2000, Hirose et al., 2007, Kim et al., 2008, Ibanez
et al., 2007, Ueki et al., 2006, Yang et al., 2005, Tuncer et al., 2003, Bataller et al., 2005). In
keeping with this, a number of prospective human studies have shown improvements in
liver fibrosis (secondary to viral hepatitis or NASH (non-alcoholic steato-hepatitis)) via
treatment with competitive ACE inhibitors (e.g. Perindopril, Ramipril, Lisinopril) or AT1R
blockers (e.g. Losartan), further suggesting that ang II significantly contributes to the
development of fibrosis (Colmenero et al., 2009, Debernardi-Venon et al., 2007, Sookoian
et al., 2005, Terui et al., 2002, Yoshiji et al., 2005, Yoshiji et al., 2006, Yokohama et al.,
2006). Further, the activation of HSCs by ang II promotes contraction of the hepatic
sinusoidal vascular bed, contributing to the pathogenesis of portal hypertension in cirrhotic
livers by increasing hepatic vascular resistance (Bataller et al., 2000, Rockey, 1997, Kaneda
et al., 1998, Bhathal and Grossman, 1985).
In keeping, ACE expression and activity is increased in cirrhotic livers, stimulating local
synthesis of ang II, within a circulatory environment (in cirrhotic patients) that has been
shown to already be more responsive to ang II (Herath et al., 2009, Paizis et al., 2002).
Further RAS effects within hepatocytes can be seen upon mitotic and proliferation rates
(Cook et al., 2001): in rat hepatoma cells transfected with mutated angiotensinogen cDNA
(signal sequence-encoding region removed, to differentiate the relative effects of nuclear
and cell surface ang II receptors), a pro-mitotic/proliferation effect (caused by
autocrine/paracrine stimulation of platelet-derived growth factor) can be blocked by
Losartan (competitive AT1R antagonist). The same cells were also found to produce an
alternative renin transcript, renin 1A, which stayed intracellularly and lacked a signal
sequence. There is also evidence for a counter-balancing effect of the novel RAS pathway in
the prevention of liver fibrosis and ang IV analogues have been shown to bind directly to
hepatocyte growth factor (HGF), where they antagonize its ability to form functional

Hepatic Mitochondrial Renin-Angiotensin Systems
James R A Skipworth 22
dimers, thus impairing HGF-dependent signaling, proliferation and scattering in multiple
cell-types (Kawas et al., 2012).
I1. d. ii. RAS in other tissues
RAS expression has also been discovered in other tissues such as heart (Pieruzzi et al.,
1995), kidney (Pieruzzi et al., 1995, Neubauer et al., 2009), vasculature (Neubauer et al.,
2009), lung (Pieruzzi et al., 1995), brain (Lenkei et al., 1997), pancreas (Leung et al., 1997,
Leung et al., 1999, Leung, 2007, Leung and Carlsson, 2001), small bowel and colon (Paul et
al., 2006), and adrenal tissue (Nostramo et al., 2012). Thus, local tissue RAS are expressed
in a variety of tissues and organ systems, where they play a role in multiple physiological
and pathophysiological processes. The dual role of RAS, in that both its endocrine and
paracrine systems act simultaneously, means that the system is extremely complex and its
underlying mechanisms difficult to clearly elucidate. One of the major difficulties stems
from the limitations of pharmacology in differentiating between RAS products synthesised
locally and those generated systemically; however, it remains clear that tissue RAS play a
crucial role in the functional regulation of the organ system in which they are produced.
Thus, drugs including ACE-inhibitors, AT1 antagonists and renin inhibitors offer
extraordinary therapeutic potential.
I1.d. iii. Intracellular RAS expression
Extracellular (endocrine and paracrine) RAS executes the classical functions of ang II via
activation of cell surface G-protein coupled angiotensin receptors, AT1R and AT2R
(Campbell, 1987, Carey and Siragy, 2003, de Gasparo et al., 2000, Mehta and Griendling,
2007, Touyz and Schiffrin, 2000, Timmermans et al., 1993). However, such actions of ang
II cannot explain the myriad roles of the RAS, or its antagonism, in both physiology and
pathophysiology, leading various researchers to further investigate a putative intracellular
RAS. In particular, ang II addition results in longer-term (hours, days, weeks) effects upon
growth, mitogenesis and cellular proliferation, which are independent from the classical
systemic effects (mediated via cell-surface receptors) occurring within seconds or minutes;
and the lipophilicity of some RAS antagonists renders them less capable of crossing the cell
membrane, resulting in differential effects due to preferential actions at extracellular or
intracellular RAS receptors. Some antagonists are therefore less effective at preventing the
cardiac and renal complications for which they have been prescribed, suggesting that the
pathogenesis of such disease derives from intracellular RAS, and further highlighting the

Hepatic Mitochondrial Renin-Angiotensin Systems
James R A Skipworth 23
necessity of intracrine RAS investigation. For such investigation, experimentation has
focused predominantly upon renal and adrenal tissue as these tissues not only contain all
RAS components but their presence has been measured at high tissue concentrations (Ingert
et al., 2002).
The classical form of renin is a 339 to 343 secretory amino acid peptide formed by
proteolytic cleavage of the prorenin N-terminus. The kidney is the main site of secreted
active renin and prorenin, although other tissues also secrete prorenin into the circulation
(Sealey et al., 1986), where it acts as the circulatory precursor for active renin but can also
be taken up into various tissues in its precursor form. Intracellularly, renin appears to be
targeted to lysosomes, the regulated secretory pathway or alternate intracellular sites, with
specific sorting being determined by the cell type and the precise expression and structure of
the renin transcript in question. Within renal tissue, renin and prorenin are primarily located
within cells of the juxtaglomerular apparatus, afferent arterioles of smooth muscle and
interlobular arterioles (Darby et al., 1985, Song et al., 1992, Taugner et al., 1981, Zhuo et
al., 1996), where renin is a secretory protein that increases vascular tone, glomerular
filtration pressure and sodium reabsorption via a negative feedback mechanism (Hackenthal
et al., 1990). Here, renin is located in storage granules that demonstrate calcium-induced
exocytosis, and are thought to be modified lysosomes as they contain lysosomal enzymes
and phagocytic properties (Hackenthal et al., 1990, Mullins et al., 1982, Panthier et al.,
1982, Sharp et al., 1996, Clark et al., 1997, Mullins et al., 1990, Peters et al., 1993). A
prorenin receptor (PRR; a 350 amino acid peptide with a single transmembrane domain) has
also been discovered within glomerular mesangial cells, distal nephrons and collecting ducts
(Advani et al., 2009, Nguyen et al., 1996, Sihn et al., 2010) (as well as being expressed in
widely different tissues) to which both renin and prorenin are capable of binding. The PRR
induces multiple physiological and pathophysiological effects such as activating ERK 1/2
MAP (extracellular signal regulated kinase 1/2 mitogen-activated-protein) kinase
intracellular signaling pathways, p38 MAP kinase, COX-2 (cyclooxygenase-2) and
fibronectin (Nguyen, 2010, Nguyen, 2011, Sihn et al., 2010, Nguyen and Contrepas, 2008).
However, it remains unclear what the overall physiological role of the PRR is and whether it
is preferentially physiologically activated by renin or prorenin (Nabi et al., 2006, Nguyen et
al., 2002). There is some evidence that prorenin is taken up by various tissues where it may
aid in generation of intracellular ang II either via an intracellular route (Nguyen et al., 1996,

Hepatic Mitochondrial Renin-Angiotensin Systems
James R A Skipworth 24
Prescott et al., 2002) or via prorenin activation at the cell surface, as well as potentially
mediating intracellular actions of renin and prorenin (Danser, 2009, Sihn et al., Advani et
al., 2009, Nguyen et al., 2002, Saris et al., 2006).
However, within the adrenal gland, alternative renin transcripts have been identified which
encode for a non-secretory form of renin and adrenocortical cells are capable of storing
renin in its active form without requiring glycosylation prior to storage, as in renal tissue
(Clausmeyer et al., 1999, Lee-Kirsch et al., 1999). Here, circulating ang II induces both
adrenal aldosterone and local renin synthesis; thus, producing a positive feedback loop to
further increase local ang II generation. Adrenal tissue is therefore not reliant upon the
uptake of ang II from the circulation for the production of aldosterone and the non-desirable
systemic results of increased ang II, such as the promotion of fibrosis, hypertrophy and
proliferation are contained (Hollenberg et al., 1974, Williams and Hollenberg, 1991, Peters
and Ganten, 1998).
In the heart however, renin is not produced intracellularly under normal conditions (or is
produced in extremely low amounts) and cardiomyocytes therefore predominantly rely upon
mannose-6-phosphate receptor mediated endocytosis for uptake of renin from the circulation
to lysosomal-like storage granules (reliant upon glycosylation, similar to renal tissue) (Ekker
et al., 1989, Danser et al., 1994, van Kesteren et al., 1997, Saris et al., 2001). An
independent pathway also internalises prorenin (following which it is subsequently cleaved
to active renin), with unglycosylated (but not glycosylated) uptake leading to increased
intracellular ang II (presumably due to intracellular ang II generation) (Peters et al., 2002).
Thus, rats expressing high circulating prorenin result in high intracellular ang II and cardiac
damage, suggesting that prorenin uptake may be more important than active renin uptake in
cardiac tissue (Peters et al., 2002).
Most circulating angiotensinogen is synthesized and secreted by the liver but some is also
generated within the kidneys (Kobori et al., 2006, Darby and Sernia, 1995).
Angiotensinogen has also been located in perinuclear regions of glial cells (Sherrod et al.,
2005); although whether it is synthesized locally at extra-hepatic and extra-renal sites, or
taken up from the circulation, remains unknown. Agt produced locally in proximal tubule

Hepatic Mitochondrial Renin-Angiotensin Systems
James R A Skipworth 25
cells is both secreted (into the tubular lumen) and contained intracellularly, where it leads to
ang II formation (Lantelme et al., 2002, Navar et al., 2001, Rohrwasser et al., 1999).
ACE has been localized within multiple tissues including kidney, although intracellular
expression levels in humans appear to be much lower than that of many experimental
animals, including rats and dogs (Metzger et al., 1999). This may explain the significantly
lower rates of ang I to ang II conversion in human renal tissue (approx. 10 % of arterially
delivered ang I is converted to ang II) (Danser et al., 1998, Rosivall and Navar, 1983) and
may imply that alternate (non-ACE) angiotensin processing enzymes are more important for
the formation of intracellular ang II. In keeping, cathepsin D catalyzes the formation of
AGT to ang I in rat vascular smooth muscle cells (Lavrentyev et al., 2007, Lavrentyev and
Malik, 2009); and the content of intracellular ang II increases in diabetic rats with greater
oxidative stress, via a non-ACE-dependent pathway (Singh et al., 2007, Singh et al., 2008).
However, ACE activity remains important in renal tissue, where it is crucial in the
maintenance of steady state ang II levels (Modrall et al., Ingelfinger et al., 1999, Kobori et
al., 2001a, Kobori et al., 2001b, Kobori et al., 2002).
In proximal tubule cells, high-density, high-affinity AT1 receptors are localised on both
basal and apical membranes, where binding of circulating and paracrine ang II leads to
internalization of the ligand-receptor complex (Brown et al., 2009, Hunyady, 1999, Li and
Zhuo, 2008a, Thekkumkara and Linas, 2002, Brown and Douglas, 1982, Douglas, 1987,
Dulin et al., 1994, Cogan, 1990, Harris and Navar, 1985, Houillier et al., 1996, Von Thun et
al., 1994, Wang and Chan, 1991, Zhuo et al., 1992, Imig et al., 1999, Shao et al., 2009, van
Kats et al., 2001, Zhuo et al., 2002, Zhuo and Li, 2007, Zou et al., 1998). It has been
postulated that this internalization process helped to desensitise the cell to ongoing ang II
stimulation by removing an activated receptor from the cell surface and translocating it to
the cell interior where it is subsequently recycled, whilst ang II is delivered either to the
endosomal or lysosomal pathway (Ferguson, 2001, Gonzalez-Gaitan, 2003, Hunyady et al.,
2000, Zhang et al., 1997, Hein et al., 1997). In keeping, AT1R blockade or deletion
significantly reduces intra-renal ang II content, which is restored by ang II administration,
suggesting that, in renal tissue at least, ang II is taken up from outside the cell or leads to
stimulation of intracellular generation, and internalisation of the receptor-ligand complex

Hepatic Mitochondrial Renin-Angiotensin Systems
James R A Skipworth 26
may aid in the regulation of this pathway (Campbell, 1996, Cervenka et al., 2008, Li et al.,
2007, Li and Zhuo, 2007, Sadjadi et al., 2005). Once within the cell, it is not clear how ang
II escapes the lysosomal or endosomal pathway to bind intracellular receptors; although
endosomal sorting may provide a delayed intracellular release mechanism to protect from
immediate ang II metabolism (Imig et al., 1999) or a pathway to aid in regulation of
continuous ang II signaling (Murphy et al., 2009).
The precise mechanisms underlying ang II-receptor complex endocytosis have not been
clearly elucidated and in non-renal cell types, such as vascular smooth muscle cells, a
clathrin-coated pit-dependent pathway would appear to be the crucial mechanism for ang II-
receptor uptake (Anborgh et al., 2000, Ferguson, 2001, Rajagopal et al., 2006, Thomas et
al., 1996) and in other cell types non-canonical, alternate pathways may also be important
(Hunyady et al., 2000, Rajagopal et al., 2006, Li et al., 2006, Zhuo and Li, 2007, Zhuo et al.,
2006a, Li et al., 2009). Following internalization, ang II pathways and trafficking
mechanisms remain largely unknown. Internalised ang II could have a number of functions,
including recycling and secretion for extracellular action, migrating to the nucleus to exert
transcriptional effects or undergoing processing to enable it to act intracellularly, potentially
via stimulation of the inositol 1,4,5 triphosphate pathway (Chen et al., 2000). A nuclear
targeting and activation sequence was recently discovered in the AT1R (Morinelli et al.,
2007) and AT1 receptors have been discovered in peri-nuclear and nuclear regions of HEK
293 (human embryonic kidney) cells, cardiomyocytes, vascular smooth muscle cells and
hepatocytes; although, whether these represent typical or internalized cell-surface receptors
remains unknown (Chen et al., 2000, 2007, Licea et al., 2002, Cook et al., 2006, Cook et al.,
2007). Ang II action, via nuclear AT1 receptors, results in increased transcription of TGF-1
(tumour growth factor-1) and MCP-1 (monocyte chemoattractant protein-1), as well as
increased nitric oxide and superoxide production, in isolated rat renal cortical cells
(Gwathmey et al., 2009, Gwathmey et al., Li and Zhuo, 2008b); whereas, micro-injection of
ang II (one method of directly investigating intracellular effects) leads to intracellular and
nuclear calcium increases in a variety of cell-types including proximal tubule and vascular
smooth muscle cells (Haller et al., 1996, Haller et al., 1999, De Mello, 1998, De Mello,
2006, Zhuo, 200). In keeping, micro-injection of Losartan prevents calcium responses
secondary to micro-injected ang II, but not those secondary to extracellular ang II,
suggesting that direct intracellular effects are occurring (Zhuo et al., 2006b).

Hepatic Mitochondrial Renin-Angiotensin Systems
James R A Skipworth 27
I2. A Metabolic Role for RAS
I2. a. RAS and Performance
The powerful benefits of ACE inhibition (ACE-I) in the treatment of heart failure have yet
to be fully explained. Similarly, the mechanisms by which ACE inhibition reduces long-
term cardiovascular risk are incompletely understood. In both cases, a role for altered
cellular metabolism has been postulated. Renin-angiotensin system activity is associated
with variations in human physical performance: the presence (Insertion, I allele) rather than
the absence (Deletion, D allele) of a 287 base pair fragment in the ACE gene is associated
with lower circulating (Rigat et al., 1990) and tissue (Danser et al., 1995, Costerousse et al.,
1993) ACE activity, which in turn is associated with fatigue resistance (Montgomery et al.,
1998) and endurance performance (Myerson et al., 1999, Tsianos et al., 2005). Amongst
British Olympic-standard runners, I allele frequency increases with distance run (I allele
proportion 0.35, 0.53 and 0.62 amongst those running ≤ 200 m, 400-3000 m and ≥ 5000 m
respectively (p = 0.009)) (Myerson et al., 1999). Amongst young male army recruits
undergoing 12 weeks of military physical training, duration of standardised repetitive loaded
(15 kg) elbow flexion improved by 79.4 (+25.2), 24.7 (+8.8), and 7.1 (+14.9) seconds for
those of II, ID and DD genotype respectively (p<0.001 for II vs. DD) (Montgomery et al.,
1998). Such improvements in endurance performance/fatigue-resistance are thought to
represent improved muscle metabolic efficiency, suggesting that low ACE activity (marked
by the I allele) is associated with enhanced muscle metabolic efficiency.
Such associations may in part be mediated through altered cellular metabolism: low ACE
genotypes are associated with a relative conservation of fat stores during high-intensity
exercise training (Montgomery et al., 1998), greater training-related gains in ‘delta
efficiency’ (the ratio of the change in muscle work performed/min to the change in energy
expended/min (measured in a regression equation via assessment of rate of oxygen uptake
and respiratory exchange ratio, while performing on a cycle ergometer) (Williams et al.,
2004)) and reductions in oxygen consumption per unit of external work (Woods et al.,
2002), and especially with successful performance in hypoxic environments (Montgomery
et al., 1998, Tsianos et al., 2005). The I allele has been associated with increased maximum

Hepatic Mitochondrial Renin-Angiotensin Systems
James R A Skipworth 28
altitude achieved (a form of extreme hypoxic endurance exercise) during ascent among elite
high altitude mountaineers (8559 +/- 565 m for IIs, 8107 +/- 653 m for IDs and 8079 +/- 947
m for DDs (p = 0.007)) (Thompson et al., 2007); and similarly amongst ascent to the
summit of Mont Blanc (100% of II, 94.9% of ID, 87.7% of DD individuals; P=0.048)
(Tsianos et al., 2005), effects which may in part depend upon regulation of BK2 receptor
activity (Williams et al., 2004). The I-allele has similarly been associated with successful
performance in ascents to 4800 m and beyond 8000 m (Thompson et al., 2007, Tsianos et
al., 2006, Tsianos et al., 2005).
In keeping, pharmacological ACE inhibition protects the heart from subsequent ischaemic
injury (Marktanner et al., 2006), whilst genetic elevation of ACE activity negates such
preconditioning effects (Messadi et al., 2010). Combined ACE inhibition and AT1R
antagonism reduce renal oxygen consumption related to sodium transport (Deng et al.,
2009). Meanwhile, ang II infusion increases oxygen consumption in the isolated perfused
hindlimb (Colquhoun et al., 1988) and in liver (Matsumura et al., 1992), effects which may
contribute (Cassis et al., 2002) to the (pressor-independent) muscle wasting seen with
systemic ang II infusion (Brink et al., 2001).
These data support a role for lower ACE activity interacting with physical training in the
regulation of metabolic efficiency. They suggest increased RAS activity to be associated
with reduced metabolic efficiency. Conversely, the benefits of ACE inhibition in patients
with CHF (congestive heart failure) seem mediated though peripheral (skeletal muscle)
metabolic effects rather than through central (cardio-respiratory) effects (Jondeau et al.,
1997). Forearm blood flow (measured via plethysmograph) is lower in CHF than control
subjects (whilst performing the same load during dynamic handgrip exercise), both during
rest and exercise, and is compensated for by increased oxygen extraction (thus maintaining
forearm oxygen consumption); however, captopril (ACE-I) use increased forearm oxygen
extraction and blood flow, thus increasing efficiency of oxygen utilization (Imaizumi et al.,
1990). In rats with CHF, muscle ATP and creatine phosphate levels decline more quickly
with exercise than in controls, and lactate levels rise faster. Six weeks of ACE inhibition
reverses these effects, suggesting that ACE inhibition may restore skeletal muscle metabolic
efficiency (Yamaguchi et al., 1999); similarly, 10 weeks of ACE inhibition in rats leads to

Hepatic Mitochondrial Renin-Angiotensin Systems
James R A Skipworth 29
an increase in functional response to endurance training (Habouzit et al., 2009). Such effects
on metabolic efficiency may account for the dramatic beneficial effects of treatment with
ACE inhibitors in patients with CHF (Jondeau et al., 1997).
I2. b. RAS and Cachexia
The mechanisms underlying the development of cachexia remain unclear, although ang II
levels appear to be associated in a causal fashion, acting via anorexigenic and catabolic
effects (Brink et al., 2001). While ang II infusions in rats led to transient initial decreases in
oxygen consumption; significant reductions in weight and food intake at 28 days were
associated with a rebound increase in oxygen consumption, potentially contributing to
sustained reductions in body weight (Cassis et al., 2002). Ang II addition has been shown to
result in decreased protein synthesis and increased protein degradation via stimulation of the
ubiquitin-proteosome pathway (a pathway of cytosolic protein degradation involving
ubiquitin, a 7.5kDa, 76-amino acid ATP-dependent protease that is found ubiquitously
throughout the cell and proteosomes, specific protein-degrading organelles) and ang II-
mediated activation of protein kinase C (Sanders et al., 2005). Further, gastrointestinal and
lung cancer patients with an ACE D allele exhibit lower total fat mass, percent body fat and
lean body mass when compared to an II genotype patient group (Vigano et al., 2009).

Hepatic Mitochondrial Renin-Angiotensin Systems
James R A Skipworth 30
I3. RAS & Mitochondria
I3. a. Mitochondrial Structure & Function
Mitochondria are membrane-enclosed organelles found within the cells of most eukaryotes,
and which are responsible for the production of adenosine triphosphate (ATP), the high-
energy molecule utilized as energy in most cellular processes. Mitochondria range in size
from 0.5-10 µm in diameter and the number of mitochondria in a cell varies widely by
organism and tissue type: many cells have only a single mitochondrion, whereas others can
contain several thousand. Hepatocytes, in particular, contain 1000-2000 mitochondria per
cell, comprising up to 20 % of cell volume. Mitochondria are usually located between
myofibrils, often forming a branched network with the cytoskeleton, which aids in
maintenance of mitochondrial shape and can affect mitochondrial function.
I3. a. i. Outer Mitochondrial Membrane
The outer membrane encloses the entire organelle, which is separated by an intermembrane
space from an inner mitochondrial membrane, which, in turn, bounds the mitochondrial
matrix. Both outer and inner membranes are composed of phospholipid bilayers and
proteins, although the outer membrane has a protein-to-phospholipid ratio similar to
eukaryotic plasma membrane (approximately 1 : 1 by weight). The outer membrane also
contains large numbers of integral proteins (porins) forming channels that allow small
molecules to freely diffuse across the membrane. Larger proteins can only actively enter the
mitochondrion via the binding of an N-terminus signalling sequence to a translocase within
the outer membrane. The outer membrane is also capable of associating with the membrane
of the endoplasmic reticulum, forming a structure called MAM (mitochondria-associated-
membranes) that is crucial in ER-mitochondria calcium signalling. Outer membrane
disruption allows proteins within the intermembrane space to leak into the cytosol,
subsequently resulting in cell death.

Hepatic Mitochondrial Renin-Angiotensin Systems
James R A Skipworth 31
I3. a. ii. Inner Mitochondrial Membrane
The inner membrane contains over 100 different polypeptides and has a high protein-to-
phospholipid ratio (over 3:1 by weight), and therefore contains approximately 20% of all
mitochondrial protein. Despite this, it contains no porins and is rich in cardiolipin, rendering
it highly impermeable. Thus, almost all ions and molecules require specific membrane
transporters to enter or exit the matrix. The inner mitochondrial membrane contains
numerous invaginations, called cristae, which expand the surface area of the inner
mitochondrial membrane to up to five times greater than that of the outer membrane in
hepatic cells and even more in skeletal muscle cells, thus enhancing its ability to produce
ATP. The inner membrane contains the four complexes of the electron transport chain
(ETC; complex I-IV) and the cristae are studded with oxysomes (F1 or elementary
particles), which contain ATP synthase for ATP production. The inner membrane also has
an electrochemical gradient across it formed by the action of the ETC enzymes.
I3. a. iii. Intermembrane Space
The intermembrane space is bound by the outer and inner membranes and has similar
concentrations of small molecules to cytoplasm (due to the free permeability of the outer
membrane), although concentrations of large molecules remain different (due to the fact that
specific membrane transporter proteins are required for larger molecules to cross the outer
membrane). Cytochrome c, a small haem protein crucial to mitochondrial function, is
specifically located to the intermembrane space, via its anchoring with cardiolipin, where it
carries electrons from complex III to IV, as well as playing a role in initiation of apoptosis.
I3. a. iv. Mitochondrial Matrix
The matrix contains a highly concentrated mixture of enzymes responsible for oxidation of
pyruvate and fatty acids, and the Krebs cycle (Citric Acid/ Tricarboxylic Acid), and contains
approximately two thirds of mitochondrial protein, as well as ribosomes, RNA, and several
copies of the mitochondrial genome.

Hepatic Mitochondrial Renin-Angiotensin Systems
James R A Skipworth 32
I3. a. v. Mitochondrial Genome & Proteome
Mitochondria have an independent genome, although the precise nature of mitochondrial
proteins varies depending upon the tissue and species that the mitochondrion is derived
from. In humans, the mitochondrial genome is a circular DNA molecule of approximately
16 kilobases, encoding 615 distinct protein types, derived from 37 total genes (13 peptide
genes). Thirteen genes encode for the subunits of respiratory complexes I, III, IV and V, 22
for mitochondrial transfer RNA (tRNA) and 2 for ribosomal RNA. The genes are highly
conserved but may vary in location and each mitochondrion can contain up to ten copies of
its DNA, which has a high proportion of coding DNA and an absence of introns and repeats.
Mitochondrial genes are transcribed as multigenic transcripts, which are cleaved and
polyadenylated to yield mature mRNAs.
Proteins not encoded by the mitochondrial genome must therefore enter from the cytoplasm,
with small molecules entering by diffusion via porins, whilst others are actively transported.
Human mitochondria are also capable of importing both messenger RNA (mRNA) (Ahmed
and Fisher, 2009) and tRNA (Rubio et al., 2008). Diverse proteins (beyond those needed
for the metabolic pathways described above) are also imported after binding to translocase
of the outer mitochondrial membrane, and thence to distinct translocases of the inner
mitochondrial membrane (Rehling et al., 2001). A few proteins are synthesized on matrix
ribosomes and exported into the inner membrane by the oxidase assembly (OXA)
machinery (Schmidt et al., 2010). As a result, whilst the mitochondrial genome encodes
only 13 proteins, upwards of 1450 are identified in the human mitochondrial proteome
(Human mitochondrial protein database, 2010), whose folding and assembly are maintained
by a complex machinery which includes dedicated proteases and chaperones (Haynes and
Ron, 2010).
I3. a. vi. Mitochondrial Function
Mitochondria are responsible for energy production via respiration (see Figure I4). Through
glycolysis within the cytosol, glucose is converted to two pyruvate molecules, which are
transported across the inner mitochondrial membrane and are subsequently oxidized and
combined with coenzyme A to form carbon dioxide, acetyl-CoA and NADH by the pyruvate

Hepatic Mitochondrial Renin-Angiotensin Systems
James R A Skipworth 33
dehydrogenase complex within the mitochondrial matrix. Acetyl-CoA is the primary
substrate of the Krebs cycle, which acts largely within the mitochondrial matrix (apart from
succinate dehydrogenase, which is bound to the inner mitochondrial membrane as part of
complex II), each cycle yielding three reduced nicotinamide adenine dinucleotide molecules
(NADH) and one reduced flavin adenine dinucleotide molecule (FADH2), which act as a
source of electrons for the electron transport chain (ETC), thus driving ATP synthesis via
oxidative phosphorylation.
The ETC comprises four separate protein complexes within the inner membrane, complex I
(NADH reductase), II (succinate dehydrogenase), III (cytochrome c reductase) and IV
(cytochrome a). Redox energy from NADH and FADH2 is transferred to oxygen via the
passage of electrons down the chain from one complex to the next, each of which has a
greater reduction potential than the last. At each step, the incremental release of energy is
utilized to pump hydrogen ions across the inner mitochondrial membrane into the
intermembrane space, creating a strong, electrical, chemi-osmotic gradient across the inner
membrane as the proton concentration in the intermembrane space increases. The
subsequent return of these hydrogen ions across the membrane and into the matrix drives the
synthesis of ATP, by ATP synthase, from ADP and inorganic phosphate (oxidative
phosphorylation), with hydrogen ions, electrons and oxygen yielding water. Similar reduced
molecules can be imported from the cytosol via the malate-aspartate system or feed into the
ETC via glycerol phosphate shuttles. When oxygen is limited, glycolytic products are
metabolized by anaerobic respiration, a process that is independent of the mitochondria.
However, the production of ATP from glucose has an approximately 13-fold higher yield
during aerobic respiration, as compared to anaerobic respiration.

Hepatic Mitochondrial Renin-Angiotensin Systems
James R A Skipworth 34
Figure I4. The mitochondrial electron transport chain (UCP- Uncoupling protein; GLUT- Glucose
transporter; ATP- Adenosine triphosphate; ADP- Adenosine diphosphate; ANT- ADP/ATP translocator; FAD-
Flavin adenine dinucleotide; NAD- Nicotinamide adenine dinucleotide).
The process of respiration is highly efficient; however, under certain conditions, a proton
leak uncoupled from ATP synthesis (uncoupling) may reduce the generation of reactive
oxygen species (ROS), such as superoxide. Such ROS are natural by-products of cellular
metabolism, occurring in up to 2% of electrons passing through the ETC and have important
roles in redox signaling (Lee and Griendling, 2008). However, when ROS levels are left
unchecked, they can result in severe impairment of cellular function and ultimately lead to
cell death. Uncoupling proteins (UCPs) are mitochondrial anion carriers found in the inner
mitochondrial membrane and are one of the cellular mechanisms responsible for the
regulation of cellular ROS levels (Rousset et al., 2004, Mailloux and Harper, 2011). UCPs
are capable of uncoupling generation of ATP from the action of the ETC, by altering the
potential difference across the mitochondrial membrane, resulting in the production of heat
only from the consumption of oxygen. The mechanism of mitochondrial membrane
potential alteration has been demonstrated to vary, but can occur via proton translocation or
via cycling of protonated fatty acids across the mitochondrial membrane (Garlid et al., 1998,
Jaburek et al., 1999). UCP 2 is a ubiquitous molecule, whereas UCP 3 is mainly expressed
in skeletal muscle; however, both are activated by the presence of ROS, which modulate the
!µ"+
"+ "+ "+ "+
I II
III IV F0
NADH NAD H2O O2 F1
ADP ATP
UCP
"+
Pi
ANT ATP
ADP Contractile work NADH
#-oxidation
Glycolysis
Acetyl CoA
ATP ADP
Glucose Pyruvate
Pyruvate
Pyruvate carrier
Lactate
Krebs Cycle
CO2
Free fatty acids
Triglyceride
INNER MEMBRANE
Ketone bodies
GLUT Glucose
Fumarate
CYTOSOL
MITOCHONDRION
e- Q C
e-
SARCOLEMMA
RESPIRATORY CHAIN ATP
synthase
Lactate carrier
Mono-carboxylate transporter
Ion transport
FADH2
Succinate
Hepatic Mitochondrial Renin-Angiotensin Systems
James R A Skipworth 35
UCP molecule via covalent modification by glutathione, to provide a negative feedback
loop for mitochondrial ROS production (Mailloux and Harper, 2011, Rousset et al., 2004,
Negre-Salvayre et al., 1997).
Further mitochondrial functions include crucial roles in the reception and transmission of
cellular signals; the regulation of membrane potential, cell differentiation, cycling, growth
and apoptosis; haem and steroid synthesis, and ammonia detoxification within hepatic cells;
and the regulation of reactive oxygen species’ synthesis and tissue oxygen gradients.
Mitochondria are also important regulators of local intracellular calcium ([Ca2+]i) and there
is significant calcium interchange between mitochondria and ER (Szabadkai and Rizzuto,
2004), and the ability of mitochondria to rapidly accumulate and release [Ca2+]i makes them
effective calcium buffers for various cellular microdomains. Calcium is transported into the
mitochondrial matrix by a calcium uniporter on the inner mitochondrial membrane (which is
driven by the electrochemical gradient of the mitochondrial membrane potential), where it
causes a transient depolarization in the mitochondrial membrane potential and directly or
indirectly regulates both mitochondrial and cytoplasmic metabolic processes (Miller, 1998).
Within the mitochondrion, calcium is crucial for the functioning of citric acid cycle
dehydrogenase enzymes and has a role in mitochondrial respiration, dynamics and levels of
oxidative stress (Saotome et al., 2008, Pandya et al., 2013). Calcium release from the
mitochondria is triggered via the action of a sodium-calcium exchanger and a calcium-
induced-calcium-release mechanism and subsequent alterations in intracellular calcium
levels remain necessary for effecting various second messenger systems (Hajnoczky et al.,
2002). Larger [Ca2+]i surges, however, can result in significant alterations in mitochondrial
membrane potential, potentially triggering apoptotic mechanisms, via collapse of the
mitochondrial membrane potential, when a certain calcium threshold is surpassed (Rizzuto
et al., 2009). Thus, fine regulation of calcium signaling is required and dysregulated
mitochondrial calcium regulation has been implicated in multiple disease states (Decuypere
et al., 2011).
I3. b. RAS Components Within Mitochondria
Mizuno et al (1988) performed bilateral nephrectomy on male Sprague-Dawley rats, a

Hepatic Mitochondrial Renin-Angiotensin Systems
James R A Skipworth 36
technique which has been shown to completely eliminate circulating renin, whilst increasing
renin and aldosterone synthesis (Doi et al., 1984), although the rise in aldosterone can be
inhibited by administration of Losartan (Doi et al., 1984, Peters et al., 1999). The authors
performed subcellular fractionation and percoll density gradient separation of the adrenal
glands in combination with radioimmunoassay for protein and enzyme content.
Immunohistochemical analysis revealed the presence of dense granules within zona
glomerulosa cells, which increased in number following bilateral nephrectomy, and which
stained for the presence of renin (see Figure I5). Similarly, following percoll density
gradient centrifugation of adrenal capsules and immunogold staining, renin was found
mainly in dense granules of mitochondrial fractions, where radioimmunoassay for renin
activity was 15 times greater in nephrectomised rats than intact rats. The authors argued that
these results provide evidence that cells of the adrenal gland synthesize renin and store it
within specific secretory granules that can be located within mitochondria. However, their
study methodology excluded organelles of high density (5600 g), which may have contained
mitochondria and dense bodies; and no direct immunocytochemistry was performed.
Figure I5. Electron micrographs of sections from Percoll density gradient fractions. (A)
Electron-dense granules and a condensed mitochondrion (*) from high density fraction of
nephrectomized rat adrenal fixed in glutaraldehyde osmium (x 72,000 magnification). (B)
Mitochondria from low density fraction stained with anti-renin demonstrated no specific
localization (x 49,000 magnification). (C) Granules in high density fraction stained with
anti-renin demonstrate numerous particles overlying the granules (x 135,000 magnification)
(Mizuno et al., 1988).
fi
A
,:,'"'~~~~~~A,. .w. saws.~~~~~~~~~~~3
.0
Figure 3. Electron micrographs of sections from Percoll density gra-client fractions. (A) Electron-dense granules and a condensed mito-chondrion (*) from high density fraction of nephrectomized rat adre-nal fixed in glutaraldehyde-osmium. X< 72,000. (B) Mfitochondria inorthodox conformation from low density fraction reacted with a1:1I00 dilution of rabbit anti-renin and goat anti-rabbit IgG-colloidal
gold. A scattering of gold particles is seen over the section, but thereis no specific localization. X 49,000. (C) Granules in high densityfraction reacted as in B. Numerous gold particles overlie the gran-ules. X 135,000. The diameter of the granules was between 0.2 and0.7 um, which is somewhat smaller than that of the renin secretorygranules of rat kidney cortex (28).
1012 K Mizuno, L. H. Hoffman, J. C. McKenzie, and T. Inagami
I P,

Hepatic Mitochondrial Renin-Angiotensin Systems
James R A Skipworth 37
Peters et al (Peters et al., 1996) attempted to circumvent these drawbacks during their
investigation of Sprague-Dawley rats undergoing bilateral nephrectomy and haemodialysis,
with subsequent surgical excision and chemical post-fixing of adrenal glands. They exposed
ultra-thin sections to antibodies against renin (recognising renin and prorenin), ACE and
angiotensinogen, as well as performing differential centrifugation and separation of cellular
organelles and determining prorenin, renin and angiotensinogen concentrations by
radioimmunoassay. Following bilateral nephrectomy, plasma renin concentration decreased
rapidly within ten hours, followed by a further decrease to undetectable levels within the
next 20 hours. In contrast, plasma active renin in haemodialysed control rats increased. The
levels of plasma prorenin increased in both control and nephrectomized rats; however, the
addition of a specific rat renin inhibitor (CH-732) inhibited ang I generation in plasma of
dialyzed control rats only (by 65%) and not in nephrectomized rats; the authors concluding
that true active renin and prorenin were eliminated from the circulation and that any renin
detectable in adrenal glands can therefore be attributed to local synthesis only as the animals
were without circulating renin for at least 20 hours. Plasma angiotensinogen was strongly
elevated by nephrectomy and remained elevated for the duration of the study period.
Utilising anti-renin antibodies (anti-mouse & anti-rat) and immuno-gold labeling, renin
immunoreactivity was found over membrane-bound structures of moderate electron density
within zona glomerulosa cells, the authors concluding that these most likely resembled
immature renin vesicles of juxtaglomerular cells within the kidney and were therefore likely
to represent storage or transport; and within mitochondria where gold staining was restricted
to high density, rounded inclusion bodies (see Figure I6). These structures were further
characterised and imaged by epon-embedding to improve morphology preservation (see
Figure I7). In control rats, ACE was located within mitochondria particularly concentrated
over intramitochondrial dense bodes; whereas angiotensinogen and cathepsin D (as a
lysosomal marker) were only found within cytoplasmic vesicles. Bilateral nephrectomy led
to an increase in renin particles within cytoplasmic vesicles and mitochondria, and the
immunogold staining technique was believed to be specific as signals within both
mitochondria and cytoplasmic vesicles were absent following preadsorption of anti-renin
antiserum with purified renin.

Hepatic Mitochondrial Renin-Angiotensin Systems
James R A Skipworth 38
Intracellular organelles of zona glomerulosa of both control and nephrectomised rats were
separated by differential centrifugation, and their renin content was determined. Peak
mitochondrial fractions were at 400-1000 g (as indicated by malate dehydrogenase
concentration); whereas, peak lysosomal fractions were 3,000-15,000 g (as indicated by acid
phosphatase concentration). The intracellular concentration of active renin was increased 10
x in anephric rats and two peaks of active renin were observed, one overlapping with the
lysosomal fraction (the authors concluding that this probably represented cytoplasmic
vesicles) and the other with a 600 g mitochondrial fraction (see Figure I8). Similar results
were observed in control rats although renin concentrations were much lower and the
mitochondrial peak, in particular, was barely detectable. Aliquots of the subcellular fractions
were subsequently utilized for immunocytochemistry and renin immunoreactivity was again
confirmed within mitochondrial fractions. Further investigation demonstrated ACE within
mitochondria and mitochondrial dense bodies and angiotensinogen within cytoplasmatic
vesicles of rat adrenal cortex of untreated Sprague-Dawley rats demonstrate. The authors
thus concluded that the study provides evidence for the existence of an intracellular RAS in
the adrenal cortex and further, that mitochondria here may be independently capable of
synthesising RAS components, specifically renin (Peters et al., 1996). Although the study
did not pursue the investigation of other RAS components, elimination of renin from the rat
circulation prior to adrenal gland analysis provides good support for intra-mitochondrial
RAS synthesis in adrenal cortex.

Hepatic Mitochondrial Renin-Angiotensin Systems
James R A Skipworth 39
Figure I6. Electron microscopy and immunocytochemical localization within rat
adrenal zona glomerulosa of Sprague-Dawley rats demonstrate cytoplasmic vesicles
with immunogold signals (a; white arrow; magnification x 23,000); mitochondrial
dense bodies containing renin (b; arrows; magnification x 23,000); intramitochondrial
dense bodies (c; arrowheads; magnification x 4700); cathepsin D within cytoplasmic
vesicles (d; arrowhead; magnification x 23,000) (Peters et al., 1996).
Figure I7. Electron microscopy and immunocytochemical localization within rat
adrenal cortex of Sprague-Dawley rats demonstrate ACE within mitochondria and

Hepatic Mitochondrial Renin-Angiotensin Systems
James R A Skipworth 40
mitochondrial dense bodies (e; arrowhead; magnification x 23,000); angiotensinogen
within cytoplasmatic vesicles (f; arrows; magnification x 23,000); Epon-embedded
adrenal section demonstrating dense body within mitochondria (g; arrowhead;
magnification x 30,000); Tannin-prestained Epon-embedded adrenal section showing
two dense bodies within the same mitochondrion (h; arrowheads; magnification x
23,000) (Peters et al., 1996).
Figure I8. Immunocytochemistry of zona glomerulosa subcellular fractions (Peters et al.,
1996).
a) Absence of vesicles and extramitochondrial dense bodies in 600 g mitochondrial fraction,
thus demonstrating no contamination of the fraction. Multiple mitochondria are present, one
containing an intramitochondrial dense body (Arrowhead; magnification x 10, 000). b)
Immunocytochemistry of 660 g mitochondrial fraction demonstrating renin
immunoreactivity (arrow; magnification x 23, 000). c) 9000 g fraction containing vesicles,
one of which has renin immunoreactivity (magnification not supplied).
E448 RENIN WITHIN ADRENOCORTICAL MITOCHONDRIA
Fig. 5. Immunocytochemistry of the same subcellular fractions as analyzed in Fig. 4. a: absence of vesicles and extramitochondrial dense bodies in “600-g” fraction. Many mitochondria are seen; one of them contains an intramitochondrial dense body (arrowhead); magni- fication: X 10,000. b: intramitochondrial dense bodies of 600-g frac- tion with renin IR (arrow); anti-renin (MSR), l:l,OOO; magnification: ~23,000. c: “9,000-g” fraction contains vesicles, one of which has renin-specific signals.
to be of interest according to our data, were excluded from analysis. Thus our study is not in contradiction but complementary and additive to previous work.
As shown in Fig. 2, mitochondria of the zona glomeru- losa cell contain ACE IR. These immunocytologic data, as well as those for angiotensinogen, still need to be confirmed by biochemical methods. Previous reports on the presence of ACE in the adrenal gland are inconsis- tent. Strittmatter et al. (301, observed 13Hlcaptopril binding to bovine but not to rat glomerulosa cells by autoradiography on tissue slices. Oda et al. (241, on the other hand, have provided indirect evidence for the presence ofACE in rat glomerulosa cells by demonstrat- ing that zona glomerulosa cells in serum-free primary culture can convert ANG I to ANG II and that this conversion is inhibited by a converting-enzyme inhibi- tor. Furthermore, Oda et al. (24) and Yamaguchi et al. (36) demonstrated, in isolated glomerulosa cell cul- tures, that aldosterone synthesis is dependent on local ACE activity.
The presence of components of the RAS within mitochondria was a surprising finding. The intramito- chondrial dense bodies have previously been investi- gated by Kai et al. (14) and Hatano et al. (13) in bovine adrenocortical cells. These inclusion bodies were shown to be rich in protein (14). Furthermore, they have been shown to contain adrenodoxin IR (131, an essential redox component for the transfer of electrons to cyto- chrome P-450 enzymes. The authors have speculated that this particular topography may be relevant for the synthesis of aldosterone. It is almost certain that the dense bodies observed in bovine adrenocortical cells correspond to the renin-containing intramitochondrial dense bodies of the rat described here. Intramitochon- drial deposits of high electron density have also been described by Giacomelli et al. (9). These deposits are upregulated by a low-sodium diet, a condition that stimulates both aldosterone synthesis and intra- adrenal renin expression (6). The authors suggested that the deposits may contain aldosterone. Although steroids, according to the general opinion, diffuse freely, Laird et al. (17) have shown that, in the rat zona glomerulosa, a considerable portion of M-hydroxyster- oids is sequestered intracellularly, even against a large concentration gradient. This pool of stored steroids can be released by trypsin digestion, indicating the pres- ence of tight intracellular steroid-protein complexes. Coincidentally, trypsin digestion has been shown to decrease the density of intramitochondrial bodies sig- nificantly (14). It is therefore tempting to propose that the intramitochondrial dense bodies represent such a steroid-retaining pool and that the intracellular adre- nal RAS is involved in generation, storage, or secretion of this material.
Although our data suggest that an intracellular RAS exists in rat glomerulosa cells, they do not complete a picture of how this system operates. One of the major unanswered questions is how the components of the RAS enter mitochondria and are sequestered into electron-dense bodies. Because the mitochondrial ge- nome does not include the genes for renin, angiotensino-
at University C
ollege London on July 15, 2013http://ajpendo.physiology.org/
Dow
nloaded from
Hepatic Mitochondrial Renin-Angiotensin Systems
James R A Skipworth 41
The rat cerebellum contains all components of the renin-angiotensin system (Lippoldt et al.,
1994) and ang II has been shown to act as both a neurotransmitter and neurohormone (Fuxe
et al., 1976, Lind et al., 1985). Further, titrated ang II, when administered to rodents, traffics
to AT1Rs on the outer mitochondrial membrane of the rat sensory vagal complex (Robertson
and Khairallah, 1971b, Re, 2003, Huang et al., 2003). Erdmann et al (1996) therefore
extended these previous findings to investigate the presence of RAS components in rat
cerebellar neurons. The authors excised and fixed the brains of 15 male Sprague-Dawley
rats followed by processing for conventional cryostat or cryoultramicrotomy and staining
for ang II (monoclonal and polyclonal antibodies). Different fixatives led to different
appearances of ang II: formaldehyde and picric acid led to a patchy yellow-brownish
staining in different layers of the cerebellar cortex, especially the granular layer; whereas,
the addition of glutaraldehyde to the fixative revealed a nuclear localization of ang II mainly
in Purkinje cells (see Figure I9). However, when semi-thin cryosections were utilized rather
than conventional cryostat techniques, improved structural preservation allowed clear
identification of ang II immunoreactivity in the nuclei of Purkinje, granule, basket, and
stellate cells. Ang II immunoreactivity was also sporadically identified in the cytoplasm of
different cell types, in vesicle-like structures of the cytoplasm and in mitochondria.
Preadsorption of the primary antibody abolished the ang II immunolabeling in nuclei and
cytoplasm of all cell types but within mitochondria approximately one third of the labeling
remained unchanged even after preadsorption. The authors concluded that when taken in
the context of previous studies that have demonstrated other RAS components, such as renin
and ACE (Fuxe et al., 1980, Chai et al., 1987), the findings provide good evidence for the
presence of intraneuronal generation and processing of ang II, particularly in Purkinje cells.
However, immunohistochemical identification of small molecular weight antigens relies
upon the fixative inducing a coupling reaction with tissue proteins, leading to
immobilization of the substance studied (Soinila et al., 1992); but within the brain, the
presence of the blood-brain barrier means that all areas are not directly accessible to the
bloodstream and that fixation may therefore be incomplete. Significant redistribution of the
antigen under investigation may therefore occur during fixation and subsequent processing,
meaning that results are not necessarily representative of true locations (Slot et al., 1989).
Further, previous studies also demonstrate that angiotensinogen immunoreactivity within the
rat brain is highly dependent upon the tissue treatment and sectioning techniques employed
and the methods employed within the study may have therefore similarly affected study

Hepatic Mitochondrial Renin-Angiotensin Systems
James R A Skipworth 42
results (Campbell et al., 1991). In keeping with this is the fact that mitochondrial labeling in
this study could not be abolished after preadsorption of the primary antibody with the
peptide and therefore may contain a significant amount of nonspecific binding.
Figure I9. Electron Microscopy and immunocytochemical localization (monoclonal
antibody) of ang II in: nucleus of purkinje cell and vesicle-like structures within
cytoplasm (A); control image with no staining (B); ang II labelling of endothelial cell
nucleus, preferentially of euchromatin, and in mitochondria abutting neuropil (C)
(magnification x 70,000; N-nuclei; c- Cytoplasm; m- Mitochondria; ec- Euchromatin)
(Erdmann et al., 1996).
The mitochondrial genome contains no genes for RAS components and the discovery of
renin and other RAS components within mitochondria therefore raised the question of
how the proteins enter the mitochondria. Clausmeyer et al (1999 and 2000)
hypothesized that mitochondrial forms of RAS components must be derived from the
nuclear genome, synthesized within the cytosol and imported following post-

Hepatic Mitochondrial Renin-Angiotensin Systems
James R A Skipworth 43
translational modifications. The authors further suggested that the differential targeting
of renin to mitochondria, rather than to a secretory pathway, might occur via an
additional downstream initiation of translation, resulting in the lack of an ER signal
sequence and escape from the secretory pathway. They therefore constructed amino-
terminal deletion mutants of prorenin, active renin and several intermediate forms, by
PCR, and analysed them in conjunction with isolated mitochondria of the rat adrenal
gland, as well as characterizing several transcripts of the renin gene. Of the six renin
variants, only two were transported with considerable efficiency into mitochondria
(D26 and D36), both of which lacked the complete ER-targeting sequence of
preprorenin and they concluded that a form of renin lacking 36 amino acids, namely the
complete ER signal sequence, and 10 amino acids of the profragment, meets the
requirements for mitochondrial import. There was no observed processing of the
imported renin variants, indicating that the common proteolytic cleavage of an amino-
terminal targeting sequence upon import into the mitochondrial matrix, did not occur
and that these proteins may have contained an internal targeting signal instead, which
may lie between amino acids 36 and 50; although this region differed from
mitochondrial targeting sequences in that it contained some negatively charged amino
acids, alongside three arginine residues. However, a number of mitochondrial proteins
contain an internal targeting sequence that is not cleaved (e.g. cytochrome c (Folsch et
al., 1996, Nicholson et al., 1988, Lill et al., 1992)) and are usually located within the
inner membrane or inter-membrane space. However, renin has been located within
dense bodies, which are most likely to be located within the mitochondrial matrix,
requiring transport across the inner membrane and further investigations are required to
demonstrate activity of such renin proteins in vivo. Analysis of renin mRNA also
identified two transcripts with different 5’- regions: besides the full-length transcript,
an additional mRNA lacking exon 1, but containing an 80-nucleotide region having its
origin in intron 1, was discovered. The authors concluded that this represented an
alternative spliced transcript, in which exon 1 appears to be replaced by another,
previously undescribed exon (exon 1A). However, besides a possible role in the
regulation of mitochondrial aldosterone production, further functions of this novel renin
remain unknown.

Hepatic Mitochondrial Renin-Angiotensin Systems
James R A Skipworth 44
The same group went on to extend their observations of this novel non-secretory, cytosolic
renin transcript (exon(1A-9) renin), which is translated into a truncated prorenin
commencing at the first-in-frame ATG (translation start site) in exon 2, resulting in a protein
that lacks the prefragment of secretory renin as well as the first 10 amino acids of the
conventional protein. In the rat most tissues have been found to express both transcripts, the
kidney exon(1-9) only and the heart expresses the exon(1A-9) transcript exclusively, where
its levels increase after myocardial infarction (Clausmeyer et al., 2000; Wanka et al., 2009).
The authors therefore over-expressed both conventional ‘secretory’ renin (exon(1-9) renin)
and novel ‘cytosolic’ renin (exon(2-9) renin) in H9c2 cells (a rat embryonal cardiac muscle-
derived cell line) and subsequently performed confocal microscopy after double-staining for
renin and mitochondrial markers, as well as performing subcellular fractionation and
assessing ang I concentration by radioimmunoassay as a measure of renin’s ability to
generate ang I. In H9c2 cells expressing exon(1A-9) renin, renin immunoreactivity was
found exclusively within mitochondria (see Figure I10). Following subcellular fractionation,
inactive renin was enriched in a 200 g mitochondrial fraction (as confirmed by the presence
of the mitochondrial marker malate dehydrogenase) in non-transfected H9c2 cells. Over-
expression of exon(2-9) renin protein led to increased inactive and active renin
concentrations in the 200 g mitochondrial fraction; whereas, in a second light mitochondrial
fraction (3000 g), inactive, but not active, renin was also increased. Following over-
expression of exon(1-9) renin, inactive renin was enriched in a 15,000 g light vesicular
fraction only. Inactive and active renin concentrations were also increased in the medium of
exon(1-9) cells, but not in exon(2-9) transfected cells supporting the hypothesis that exon(1-
9) renin is secretory, but exon(2-9) is cytosolic. Cellular proliferation rate was reduced by
secretory and cytosolic renin, necrosis was increased by secretory renin but decreased by
cytosolic renin, and mitochondrial apoptosis, as indicated by phosphatidylserin translocation
to the outer membrane, was unaffected by secretory renin but increased by cytosolic renin.
The authors concluded that renin is sorted to different intracellular compartments within
H9c2 cells dependent upon the presence of exon 1 or 1A and the truncated exon(2-9) renin
protein encoded by the exon(1A-9) transcript lacks 10 out of 43 amino acids of the
profragment of secretory prorenin. Further, the authors report that, since cytosolic renin is
up-regulated following myocardial infarction, it may play a protective role in ischemia-
related processes by reducing the rate of necrosis and increasing apoptosis, thereby

Hepatic Mitochondrial Renin-Angiotensin Systems
James R A Skipworth 45
preventing unfavourable fibrosis and cardiac remodeling.
Figure I10. Immunohistochemical localization of renin in H9c2 cells. Anti-renin antibody
(upper left panel, green); Mitotracker Red for mitochondrial staining (upper right panel,
red). Merged confocal images demonstrated that renin co-localizes to mitochondria (lower
left panel; colocalization: yellow). Merged confocal image of non-specific rabbit antiserum
and Mitotracker Red as negative control (lower right panel) (Wanka et al., 2009).
Abadir et al (2011) investigated the role of the RAS in intra-mitochondrial nitric oxide (NO)
production by performing immunoelectron microscopy for various RAS components in
sections from human skeletal muscle, cardiac myocytes, renal tubular cells, neuronal cells,
vascular endothelial cells and hepatocytes, as well as transfecting human fibroblasts with an
AT2R construct, performing subcellular fractionation, and measuring mitochondrial NO
production and respiration. Electron microscopy demonstrated that AT1R immunoreactivity
was present on monocyte cell membranes, but was not regularly present in mitochondria
from young monocytes or tubular renal cells; whereas AT2R immunoreactivity was present
in human monocyte cell membranes and mouse tissues (see Figures I11-14). Mouse heart
2930 © 2008 The AuthorsJournal compilation © 2009 Foundation for Cellular and Molecular Medicine/Blackwell Publishing Ltd
concentrations were increased only in the medium ofexon(1–9)renin cells, when compared with control cells, butnot in exon(2–9)renin-transfected cells (inactive renin: H9c2-pIRES: 1.0 ! 0.8 ng AngI/hr/106 cells; H9c2-exon(1–9)renin:5981.2 ! 931.7 ng AngI/hr/106 cells; H9c2-exon(2–9)renin:1.0 ! 0.5 ng AngI/hr/106 cells; active renin: H9c2-pIRES: 1.1! 0.5 ng AngI/hr/106 cells; H9c2-exon(1–9)renin: 32.6 ! 5.4ng AngI/hr/106 cells; H9c2-exon(2–9)renin: 1.6 ! 0.9 ngAngI/hr/106 cells; Fig. 4).
Functional differences between cytosolicrenin and prorenin
After having established that cytosolic and secretory prorenin aredifferently sorted intracellularly, we next examined the effects ofthe different transcripts on cell functions.
Protein content, growth rate and proliferation
First, exon(1–9)renin and exon(2–9)renin-transfected cells exhibitedmarked differences in cell growth. The transfection withexon(1–9)renin but not with exon(2–9)renin induced cellular hyper-trophy. Cellular protein content was also increased exclusively in
exon(1–9)renin transfected cells (H9c2 cells: 2.16 ! 0.26 mg/106
cells, H9c2-pIRES cells: 2.21 ! 0.18 mg/106 cells; H9c2-exon(1–9)renin: 3.71 ! 0.54 mg/106 cells; P " 0.01; H9c2-exon(2–9)renin cells: 2.81 ! 0.40 mg/106 cells; n.s.; Fig. 5A).Furthermore, exon(1–9)renin-transfected cells were considerablylarger than control-transfected or exon(2–9)renin-transfected cells, asvisualized by using the fluorescent dyes acridine orange and ethidiumbromide (5 B-E). Additionally, an increased number of apparentlydead cells was found in both exon(1–9)- and exon(2–9)renin-trans-fected cells, as indicated by ethidium bromide staining.
Second, growth rates were reduced in both renin transfected celllines (H9c2: 7.1 ! 0.6; H9c2-pIRES cells: 5.7 ! 0.5; n.s.; H9c2-exon(1–9)renin cells: 2.9 ! 0.3; P " 0.05; H9c2-exon(2–9)renin:4.0 ! 0.3 mg/106 cells; P " 0.05; Fig. 5F). Also, proliferation ratewas significantly decreased in the renin-transfected cell lines, whencompared with pIRES-transfected control cells (H9c2-pIRES: 0.33! 0.06; H9c2-exon(1–9)renin: 0.12 ! 0.02; P " 0.05; H9c2-exon(2–9)renin: 0.15 ! 0.03; P " 0.05) (Fig. 5G).
Exon(1–9)renin increases the rate ofnecrosis in H9c2 cells
A major difference with functional consequences betweenexon(1–9)renin- and exon(2–9)renin-transfected cells was the
Fig. 2 Immunhistochemical localization ofrenin in H9c2 cells. Renin was detected withanti-renin antibody (upper left panel, green)and mitochondria were stained withMitotracker Red CMXRos (upper right panel,red). Merged confocal image demonstratesthat renin localizes to the mitochondria (lower-left panel, colocalization: yellow). Negativecontrol: Merged confocal image of non-spe-cific rabbit antiserum and Mitotracker RedCMXRos (lower-right panel). Bar # 15 $m.

Hepatic Mitochondrial Renin-Angiotensin Systems
James R A Skipworth 46
homogenates were subsequently fractionated by differential centrifugation and density
gradient separation to demonstrate that AT2R immunoreactivity increased with progressive
mitochondrial purification as indicated by cytochrome c oxidase activity. Double-labeling
also demonstrated co-localisation of AT2R and Ang within mouse hepatocytes, kidney
tubular cells, brain neurons, and heart myocytes. The authors report that further inspection
of the immunoelectron images suggested that mitochondrial AT2R is present on the inner
mitochondrial membrane so proceeded with isolating inner mitochondrial membrane-
enriched preparations from mouse liver to demonstrate that AT2R immunoreactivity co-
purified with ATP synthase, a marker of the inner mitochondrial membrane. Further,
following transfection of human fibroblasts with a GFP-AT2R construct and subsequent
counterstaining with Mitotracker Red to indicate mitochondria, significant overlap was
found with a high spatial correlation (R2=0.72). NO production was also dose-dependently
activated by the AT2R agonist CGP421140 in isolated mitochondria, and this effect was
prevented by AT2R blocker PD-123319 and the fact that mitochondrial respiration and
membrane potential were unaffected means that observed effects were unlikely to be
attributable to non-specific toxic effects of any of the added substrates upon mitochondrial
energetics. However, the use of a single antibody for the assessment of AT2R renders the
study potentially open to methodological limitations and the mitochondrial immunogold and
immunofluorescence labeling results reported by Abadir et al (2011) should thus be
interpreted with significant caution. Moreover, the study applied only CGP 42112, an AT2R
agonist, which has been reported to antagonise the AT1R as well (Brechler et al., 1993), and
functional impacts of natural AT receptor ligands were not demonstrated. Further, different
experiments were performed in different cell types and tissues and therefore the consistency
of such results in one cell type cannot be proven.

Hepatic Mitochondrial Renin-Angiotensin Systems
James R A Skipworth 47
Figure I11. Immunoelectron microscopic localization of AT1Rs in sections of human
monocyte (A and B) and mouse kidney tubular cells (C and D) using gold bead labeling
(arrows). (A) AT1Rs are present on human monocyte cell membrane; (B) AT1Rs are present
in the cytoplasm; (C) AT1R labeling is present in close proximity to mitochondria; (D)
AT1Rs are rarely present within mitochondria (Abadir et al., 2011).
Figure I12. Immunoelectron microscopic localization of AT2Rs in sections of human
monocyte (A and B) and mouse renal tubular cells (C and D) using gold bead labeling
(arrows).
(A) demonstrates AT2Rs on human monocyte cell membrane; (B–D) demonstrate heavy
AT2R staining within mitochondria (Abadir et al., 2011).
sequently by density gradient centrifugation. The density-puri!edmitochondria were probed with speci!c antibodies. AT2R im-munoreactivity increased with progressive puri!cation of mito-chondria, for which cytochrome c oxidase (CoxIV) was used as amarker. Importantly, the immunoreactivity of Na+/K+ ATPase,a plasma membrane marker, declined with progressive enrich-ment of mitochondria. This is consistent with mitochondrialenrichment of AT2Rs (Fig. S1 A and B). In contrast, AT1Rs didnot enrich with mitochondrial fractions.
We quanti!ed through EM the relative expression of AT2Rsper mitochondria in cells obtained from different human andmouse tissues (Fig. S1C).
Colocalization of Ang and AT2Rs. Given that a functional MASwould require the presence of local Ang to activate the receptor,we next sought evidence for mitochondrial Ang by immunoe-lectron microscopy. Using a gold-conjugated secondary antibodyto anti-Ang antibody (6 nm gold), we demonstrated the presenceof mitochondrial Ang in mouse hepatocytes (Fig. 3A), kidneytubular cells (Fig. 3B), brain neurons (Fig. 3C), and heart myo-cytes (Fig. 3D). Moreover, Ang was not randomly distributedwithin mitochondria; rather, it colocalized with mtAT2R, detec-ted with a gold-conjugated secondary antibody to anti-AT2Rantibody (12 nm gold). The abundant distribution of mtAT2R inthe young animals, observed in electron microscope images, wascorrelated with a scarcity of mtAT1R. Despite the observationof many Ang immunolabeled particles in electron microscopeimages, Ang was not detected inWestern blots of isolated, density-puri!ed mitochondria, indicating that Ang is loosely bound and islost upon washing the isolated mitochondria.
AT2R Transfection of Fibroblast Cells. To ensure that the resultsdescribed above were not attributable to nonspeci!c or off-targetbinding of antibody to mitochondrial targets, we con!rmed mi-tochondrial localization of AT2Rs by using a GFP-AT2R fusionconstruct. Brie"y, human !broblasts were transfected withpcDNA-Cycle 3 GFP-AT2R or positive control using pcDNA-EGFP-C1 before counterstaining with the mitochondrial "uo-
rescence marker MitoTracker Red. GFP-AT2R "uorescence wascon!ned to discrete intracellular puncta (Fig. 4B), mirroring thedistribution of MitoTracker Red (Fig. 4A). Spatial overlap of thetwo signals, denoting subcellular colocalization, is shown in Fig.4C. The extent of colocalization was assessed quantitatively overa series of confocal Z sections (0.37 !m); spatial signal correla-tion between the two "uorophores was high (R2 = 0.72). Thus,the high density of AT2Rs observed in the mitochondria inelectron microscope images was corroborated by tracking theCycle 3 GFP-AT2R fusion protein in live human !broblasts,where it was predominantly colocalized with the mitochondrialmarker MitoTracker Red.
AT2R Localization Within Mitochondria. Having con!rmed thepresence of mtAT2Rs by two independent methods, we sought todetermine the precise location of these receptors within the mi-tochondria. Further inspection of the immunoelectron micro-graphs in Figs. 2 and 3 suggested that the mtAT2R is resident inthe inner, rather than the outer, mitochondrial membranes. Tocon!rm this observation by a different method, we isolatedinnermitochondrial membrane-enrichedmembranes frommouseliver according to previously published methods (19). We de-termined the speci!c immunoreactivity of AT2R in the innermitochondrial membrane as described in the previous section.AT2R immunoreactivity copuri!ed with that of ATP synthase ",an inner mitochondrial membrane marker. In contrast, markersof the plasma membrane (Na+/K+ ATPase) and the outer mito-chondrial membrane [voltage-dependent anion channel (VDAC)]were progressively removed by inner mitochondrial membranepuri!cation (Fig. 5A). These results buttress the results of theimmunoelectron microscopy studies and are consistent with lo-calization of AT2R in the inner mitochondrial membrane.
AT2Rs Modulate Mitochondrial NO Production. To determinewhether mtAT2R activation might modulate mitochondrial NOproduction in a manner analogous to the actions of non-mtAT2Rson other NO isoforms, we examined the direct effects of AT2Ragonists and antagonists on isolated kidney mitochondria. Trans-
Fig. 1. Immuno-electron microscopic localization of AT1Rs in sections ofhuman monocyte (A and B) and mouse kidney tubular cells (C and D) usinggold bead labeling (arrows) for AT1Rs. A shows AT1Rs on human monocytecell membrane and in the cytoplasm (B). C shows labeling in close proximityto mitochondria and rarely in the mitochondria (D).
Fig. 2. Immuno-electron microscopic localization of AT2Rs in sections of hu-man monocyte (A and B) and mouse renal tubular cells (C and D) using goldbeads labeling (arrows) for AT2Rs. A shows AT2Rs on human monocyte cellmembrane, and B–D reveal heavy labeling for AT2Rs within mitochondria.
14850 | www.pnas.org/cgi/doi/10.1073/pnas.1101507108 Abadir et al.

Hepatic Mitochondrial Renin-Angiotensin Systems
James R A Skipworth 48
Figure I13. Immunoelectron microscopic localization of AT2R binding to Angiotensin
within mitochondria utilising a gold-labeled anti-AT2R antibody (12 nm gold) and a gold-
labeled anti-Ang antibody (6 nm gold). Shown is colocalization of AT2Rs with Ang in
sections of (A) mouse hepatocytes; (B) kidney tubular cells; (C) neurons; (D) cardiac
myocytes (Abadir et al., 2011).
Figure I14. Transfected AT2Rs colocalize with mitochondria in human fibroblasts.
(B) Human fibroblast cells were transfected with GFP-AT2R construct or positive control
(F) and counterstained with MitoTracker Red (A & E). The merged images show yellow
fluorescence (C & G). Fluoro-graphic analysis (D & H) reveals a high correlation
coefficient (R2 = 0.72) (Abadir et al., 2011).
mission electron microscopy and Western blot analyses were usedto con!rm minimal contamination of the isolated mitochondriawith other cell fractions and a typical morphology ofmitochondria.The NO "uorescent molecular detection probe kit (Enzo LifeSciences) was used according to the manufacturer’s instructions(20). Isolated mitochondria were treated for 30 min with the NOscavenger 2-(4-carboxyphenyl)-4,4,5,5-tetramethylimidazoline-1-oxyl-3-oxide (c-PTIO) followed by a 15-min incubation with theAT2R agonist CGP421140 and/or the antagonist PD-123319.Positive control samples were treated with the NOS substrate L-arginine, andnegative control sampleswere generatedby treatmentwith NO scavenger (c-PTIO). Isolated mitochondria were treatedand then incubated with a speci!c "uorescent probe for real-timemeasurement of NO. Fluorescence signal was measured by usinga multimode microplate reader equipped with Cyanine 5 (650/670nm). Treatment of mitochondria with CGP421140 caused a con-centration-dependent increase in mitochondrial NO production(Fig. 6A); speci!cally, 10 nM was suf!cient to stimulate NO pro-duction [from 0.52 ± 0.0009 "uorescence arbitrary units (AU) atbaseline control to 0.6 + 0.01 AU, P < 0.001]. Moreover,CGP421140-stimulated NO production was mitigated by pre-treatment with PD-123319 (1 !!; 0.55 ± 0.006 AU, P < 0.01;Fig. 6A).
AT2Rs Modulate Mitochondrial Respiration. To determine howmtAT2R stimulation might in"uence global mitochondrial func-tion, we examined effects on respiration in rat heart mitochon-dria. Glutamate/malate-supported respiration (state 2) (21) wasinitially 17.8 ± 1.06 pmol/min per !g, Addition of ADP increasedrespiration (state 3) to 84.12 ± 1.24 pmol/min per !g (P <0.0005). We subsequently found that the addition of 100 nMCGP421140 caused a signi!cant decrease in state 3 respiration(Fig. 6C; 39.47 ± 4.37 pmol/min per !g, P < 0.005). The dose of100 nM CGP421140 was selected based on a series of experi-ments used to determine the dose of CGP421140 needed to in-"uence mitochondrial respiration (Fig. 6B). The effects ofCGP421140 were not likely attributable to nonspeci!c uncouplingbecause control experiments showed that 100 nM CGP421140had little effect on mitochondrial membrane potential ("#m) orNADH level (Fig. 6D). Importantly, CGP421140-mediated in-hibition of respiration was prevented by blocking the AT2R;PD-123319 (1 !M) restored CGP421140-inhibited state 3 respi-ration (Fig. 6C; 66.83 ± 2.1 pmol/min per !g, P < 0.01). The ad-dition of L-NG-nitroarginine methyl ester (L-NAME; 1 !M),an arginine analog that inhibits NO production, reversed theCGP421140 effect on mitochondrial respiration (Fig. 6C; 67.4 ±4.3 pmol/min per !g, P < 0.05), indicating that the functionaleffects of mtAT2R activation on mitochondrial respiration are viaan NO-dependent mechanism.To further validate this effect of MAS on mitochondrial respi-
ration, we studied liver mitochondria with different mitochondrialsubstrates. Liver mitochondria respiring with glutamate/malateas the substrate gave results similar to those obtained in isolatedcardiac mitochondria. The AT2R agonist inhibited state 3 respi-rations in the nanomolar range for both glutamate/malate- andsuccinate-supported respiration. In succinate-supported respira-tion, the inhibitory response was slightly more pronounced at 1 nMthan for glutamate/malate-supported respiration (Fig. S2).
Age-Related Changes in the MAS. Although still controversial,substantial evidence documents a decline in the canonical Angsystem with age (22–24), and mtNOS activity is reportedly re-duced with aging (18). We examined the effect of aging on theMAS. Kidney tubular cell sections from 20- or 70-wk-old C57BL/6 mice and aged (70-wk-old) mice treated with losartan at a doseof 40–60 mg/kg per day for 20 wk were labeled with antibodiesand visualized with immunoelectron microscopy. Representativemitochondria, labeled for AT1R (Fig. 7 A–C) and AT2R (Fig. 7D–F) are shown. Younger mice (Fig. 7 A and D) and older micetreated with losartan (Fig. 7 C and F) had similar densities oflabeled AT2R, whereas older untreated mice (Fig. 7 B and E)had a lower AT2R density. Our results demonstrate a signi!cantdecrease in the expression of mtAT2R with aging (from 25.5 +
Fig. 4. Transfected AT2Rs colocalizewith mitochondria in human !broblasts.Human !broblast cells were transfectedwith pcDNA-Cycle 3 GFP-AT2R construct(B) or positive control using pcDNA-EGFP-C1 (F) and counterstained withMitoTracker Red (A and E) (100! oilimmersion). The merged images showyellow "uorescence (C and G). Fluoro-graphic analysis (D and H) reveals a highcorrelation coef!cient (R2 = 0.72), sug-gesting a strong colocalization betweenAT2Rs and MitoTracker within the mi-tochondria.
Fig. 3. Immunoelectron microscopic localization of AT2R binding to Ang inthe mitochondria by using a gold-labeled anti-AT2R antibody (12 nm gold)and a gold-labeled anti-Ang antibody (6 nm gold). Shown is colocalization ofAT2Rs with Ang in sections of mouse hepatocytes (A), kidney tubular cells (B),neurons (C), and cardiac myocytes (D).
Abadir et al. PNAS | September 6, 2011 | vol. 108 | no. 36 | 14851
CELLBIOLO
GY
mission electron microscopy and Western blot analyses were usedto con!rm minimal contamination of the isolated mitochondriawith other cell fractions and a typical morphology ofmitochondria.The NO "uorescent molecular detection probe kit (Enzo LifeSciences) was used according to the manufacturer’s instructions(20). Isolated mitochondria were treated for 30 min with the NOscavenger 2-(4-carboxyphenyl)-4,4,5,5-tetramethylimidazoline-1-oxyl-3-oxide (c-PTIO) followed by a 15-min incubation with theAT2R agonist CGP421140 and/or the antagonist PD-123319.Positive control samples were treated with the NOS substrate L-arginine, andnegative control sampleswere generatedby treatmentwith NO scavenger (c-PTIO). Isolated mitochondria were treatedand then incubated with a speci!c "uorescent probe for real-timemeasurement of NO. Fluorescence signal was measured by usinga multimode microplate reader equipped with Cyanine 5 (650/670nm). Treatment of mitochondria with CGP421140 caused a con-centration-dependent increase in mitochondrial NO production(Fig. 6A); speci!cally, 10 nM was suf!cient to stimulate NO pro-duction [from 0.52 ± 0.0009 "uorescence arbitrary units (AU) atbaseline control to 0.6 + 0.01 AU, P < 0.001]. Moreover,CGP421140-stimulated NO production was mitigated by pre-treatment with PD-123319 (1 !!; 0.55 ± 0.006 AU, P < 0.01;Fig. 6A).
AT2Rs Modulate Mitochondrial Respiration. To determine howmtAT2R stimulation might in"uence global mitochondrial func-tion, we examined effects on respiration in rat heart mitochon-dria. Glutamate/malate-supported respiration (state 2) (21) wasinitially 17.8 ± 1.06 pmol/min per !g, Addition of ADP increasedrespiration (state 3) to 84.12 ± 1.24 pmol/min per !g (P <0.0005). We subsequently found that the addition of 100 nMCGP421140 caused a signi!cant decrease in state 3 respiration(Fig. 6C; 39.47 ± 4.37 pmol/min per !g, P < 0.005). The dose of100 nM CGP421140 was selected based on a series of experi-ments used to determine the dose of CGP421140 needed to in-"uence mitochondrial respiration (Fig. 6B). The effects ofCGP421140 were not likely attributable to nonspeci!c uncouplingbecause control experiments showed that 100 nM CGP421140had little effect on mitochondrial membrane potential ("#m) orNADH level (Fig. 6D). Importantly, CGP421140-mediated in-hibition of respiration was prevented by blocking the AT2R;PD-123319 (1 !M) restored CGP421140-inhibited state 3 respi-ration (Fig. 6C; 66.83 ± 2.1 pmol/min per !g, P < 0.01). The ad-dition of L-NG-nitroarginine methyl ester (L-NAME; 1 !M),an arginine analog that inhibits NO production, reversed theCGP421140 effect on mitochondrial respiration (Fig. 6C; 67.4 ±4.3 pmol/min per !g, P < 0.05), indicating that the functionaleffects of mtAT2R activation on mitochondrial respiration are viaan NO-dependent mechanism.To further validate this effect of MAS on mitochondrial respi-
ration, we studied liver mitochondria with different mitochondrialsubstrates. Liver mitochondria respiring with glutamate/malateas the substrate gave results similar to those obtained in isolatedcardiac mitochondria. The AT2R agonist inhibited state 3 respi-rations in the nanomolar range for both glutamate/malate- andsuccinate-supported respiration. In succinate-supported respira-tion, the inhibitory response was slightly more pronounced at 1 nMthan for glutamate/malate-supported respiration (Fig. S2).
Age-Related Changes in the MAS. Although still controversial,substantial evidence documents a decline in the canonical Angsystem with age (22–24), and mtNOS activity is reportedly re-duced with aging (18). We examined the effect of aging on theMAS. Kidney tubular cell sections from 20- or 70-wk-old C57BL/6 mice and aged (70-wk-old) mice treated with losartan at a doseof 40–60 mg/kg per day for 20 wk were labeled with antibodiesand visualized with immunoelectron microscopy. Representativemitochondria, labeled for AT1R (Fig. 7 A–C) and AT2R (Fig. 7D–F) are shown. Younger mice (Fig. 7 A and D) and older micetreated with losartan (Fig. 7 C and F) had similar densities oflabeled AT2R, whereas older untreated mice (Fig. 7 B and E)had a lower AT2R density. Our results demonstrate a signi!cantdecrease in the expression of mtAT2R with aging (from 25.5 +
Fig. 4. Transfected AT2Rs colocalizewith mitochondria in human !broblasts.Human !broblast cells were transfectedwith pcDNA-Cycle 3 GFP-AT2R construct(B) or positive control using pcDNA-EGFP-C1 (F) and counterstained withMitoTracker Red (A and E) (100! oilimmersion). The merged images showyellow "uorescence (C and G). Fluoro-graphic analysis (D and H) reveals a highcorrelation coef!cient (R2 = 0.72), sug-gesting a strong colocalization betweenAT2Rs and MitoTracker within the mi-tochondria.
Fig. 3. Immunoelectron microscopic localization of AT2R binding to Ang inthe mitochondria by using a gold-labeled anti-AT2R antibody (12 nm gold)and a gold-labeled anti-Ang antibody (6 nm gold). Shown is colocalization ofAT2Rs with Ang in sections of mouse hepatocytes (A), kidney tubular cells (B),neurons (C), and cardiac myocytes (D).
Abadir et al. PNAS | September 6, 2011 | vol. 108 | no. 36 | 14851
CELL
BIOLO
GY

Hepatic Mitochondrial Renin-Angiotensin Systems
James R A Skipworth 49
I3. c. RAS Effects Upon Mitochondria
I3. c. i. Mitochondrial Morphology & Number
Long-term administration of ang II to rats leads to significant decreases in
mitochondrial number (de Cavanagh et al., 2007, Basso et al., 2007) and reduced
expression of mitochondrial metabolism genes such as those involved in the Krebs
cycle (Larkin et al., 2004). It also mediates age-related structural changes (e.g. loss of
cristae, mitochondrial swelling and decreased overall number of mitochondria) within
mitochondria (de Cavanagh et al., 2007, Basso et al., 2007). RAS-inhibition (via AT1R
blockers or ACE-I), however, is capable of reversing these effects (Chen et al., 2004, de
Cavanagh et al., 2003, De Cavanagh et al., 2005, de Cavanagh et al., 2006, de
Cavanagh et al., 2008a), preserving mitochondrial number and morphology, and
reversing age-related structural changes (Basso et al., 2007). This also upregulates
expression of energy production genes (mitochondrial ETC and krebs cycle genes) in
diabetic mice (Chen et al., 2004). Further genes downregulated by ang II action at the
AT2R include those involved in mitochondrial biogenesis, leading to reduced
mitochondrial content and mitochondrial membrane potential in C2C12 (mouse
myoblast cell-line) cells and reduced mitochondrial content in mouse skeletal muscle
(Mitsuishi et al., 2009).
Ang II may also induce integrin signaling, resulting in the release of transforming
growth factor-1 (TGF-1), modification of extracellular matrix (ECM) composition and
structure, and cytoskeleton reorganisation (de Cavanagh et al., 2009). Mitochondria rely
upon cytoskeletal dynamics for physiological motility, morphology and localization,
and may therefore have secondary effects upon mitochondrial function, potentially
contributing to pathological conditions, such as cardiovascular and renal fibrosis (de
Cavanagh et al., 2009).
I3. c. ii. Age-Related Changes & Life-Span
Ang II may act as a mediator of the aging process by augmenting mitochondrial oxidant
damage. The administration of AT1R blockers or of ACE-I reduces oxidant production,

Hepatic Mitochondrial Renin-Angiotensin Systems
James R A Skipworth 50
preserves mitochondrial number and morphology, and prevents the reduction in
mitochondrial DNA content associated with aging. AT1R deficient mice demonstrate a
25% longer life-span than mice with AT1 receptors (mean life span 31.20±2.31 vs.
24.81±3.10 months) (Cassis et al., 2010). The aging process is frequently associated
with a reduction in mitochondrial number and changes in mitochondrial structure, such
as swelling, shortening of the cristae, and matrix vacuolization, and therefore lowering
RAS levels may prolong life by preventing such changes. Such AT1R knockout mice
also have increased numbers of mitochondria; upregulation of pro-survival genes sirtuin
3 (NAD-dependant deacetylase important in ageing, stress resistance and regulation of
metabolism) and Nampt (nicotinamide phosphoribosyltransferase, a glycosyltransferase
involved in nicotinamide metabolism); decreased end-organ damage, cardiovascular
injury and atherosclerosis; and decreased ROS and peroxynitrite despite normal body-
weight, physical activity and food intake (Benigni et al., 2009, Cassis et al., 2010).
I3. c. iii. RAS and Reactive Oxygen Species
Ang II increases mitochondrial ROS production and may contribute to oxidative stress
damage by uncoupling endothelial nitric oxide synthase, switching generation of nitric oxide
(NO) to superoxide production (via NF-kappaβ) (Dikalova et al., Kimura et al., 2005). Ang
II also binds to the AT1R, leading to generation of ROS within the cytosol, through PKC-
dependent (protein kinase c) activation of NAD(P)H Oxidase (Doughan and Dikalov, 2005).
Subsequent interaction between NO and superoxide generates peroxynitrite, a cytotoxic
anion that inhibits mitochondrial electron transport, as well as destroying DNA and cellular
proteins. Such highly reactive oxygen species can create a positive feedback loop by further
activation of cellular NADPH oxidase (see Figure I15) and can also directly inactivate
mitochondrial complexes, possibly via tyrosine nitration, and result in uncoupling of
oxidative phosphorylation (Vatassery et al., 2004). Ang II similarly increases mitochondrial
ROS and superoxide production in neurons, which mediates ang II-induced activation of
calmodulin kinase II and inhibition of neuronal potassium current (Yin et al., 2010).
Thus, ang II stimulates both cytosolic and mitochondrial reactive oxygen species (ROS)
generation, as well as altering O2 consumption and contributing to cachexia (Brink et al.,

Hepatic Mitochondrial Renin-Angiotensin Systems
James R A Skipworth 51
1996, Cassis et al., 2002). Selective blockade of NADPH oxidase (by apocynin) or PKC (by
chelerythrine) dramatically attenuates mitochondrial ROS generation in response to ang II
within isolated mitochondria or intact bovine aortic endothelial cells (Doughan et al., 2008).
Meanwhile, SiRNA (small interfering RNA) depletion of p22phox, an essential component
of NADPH Oxidase, leads to further significant decreases in mitochondrial ROS production
in mitochondria isolated from ang II-treated cells (Doughan et al., 2008). Ang II
administration also results in reductions in mitochondrial glutathione, the major endogenous
antioxidant (which can be prevented with RAS antagonists) (Vatassery et al., 2004,
Pompella et al., 2003, Doughan et al., 2008), potentially sensitizing mitochondria to further
ROS damage, as well as diminishing mitochondrial respiratory control ratio (Doughan et al.,
2008).
Thus, under normal physiological conditions, the capacity of ang II to promote oxidative
stress is tightly regulated. By contrast, in conditions associated with RAS overactivation,
such as hypertension, diabetes and ageing, dysregulation of ang II-dependent ROS
generation may become a significant contributor to cell oxidation and tissue damage, as well
as reduction of bioenergetic synthesis and derangement of mitochondrial ROS-mediated
signals. In keeping with this, ang II administration to Ren2 rats (which over-express renin,
and exhibit elevated endogenous ang II levels) causes ultrastructural abnormalities,
decreased mitochondrial content, decreased palmitate oxidation, decreased enzymatic
activity and decreased levels of cytochrome c, cytochrome c oxidase subunit I, and
mitochondrial transcription factor A (Wei et al., 2009). These effects are ameliorated by
ARB administration, substantially attenuating mitochondrial lipid peroxidation in hepatic
tissue and preventing hepatic steatosis (Wei et al., 2009).
I3. c. iv. RAS and Mitochondrial Function (see Figure I15)
Isolated mitochondria from rats treated with the ACE inhibitor enalapril exhibit significantly
lower energy transfer through complexes I to III (measured as the ratio of
NADH/cytochrome c oxidoreductase activity), as well as lower cytochrome oxidase activity
and higher UCP-2 content (Piotrkowski et al., 2007), with the authors suggesting that these

Hepatic Mitochondrial Renin-Angiotensin Systems
James R A Skipworth 52
data demonstrate a direct effect of ACE inhibition upon mitochondria; however, no
mechanism for such action, and no further discussion of why a reduction in energy transfer
at the ETC would be beneficial, was postulated.
In treated heart failure patients, cardiac oxidative capacity was found to be 25 % lower than
in patients without heart failure; however, ACE-I was capable of partially protecting cardiac
mitochondrial function (oxygen consumption measured in fresh saponin-skinned fibers from
rat left ventricle) and transcription cascade (downregulation of expression of multiple
mitochondrial genes encoded by both nuclear and mitochondrial genomes, including
mitochondrial transcription factor A and COX) in a rat model of myocardial infarction
(Garnier et al., 2009). Rats treated with a low (no effects upon blood pressure) dose of
enalapril demonstrated lower MMP-2 (Matrix Metalloproteinase 2) activity, but higher
levels of cytochrome c oxidoreductase activity, eNOS protein and activity and mtNOS
activity (Piotrkowski et al., 2009).
Ang II also depolarises mitochondrial membrane potential in islated mitochondria from
bovine aortic endothelial cells (Dikalova et al., 2010); whereas, Losartan treatment results in
an increased rate of ATP production and in elevated concentrations of coenzyme Q9 and
Q10 (Sumbalova et al., 2010). Recent novel findings also suggest that ang II stimulates
opening of mitochondrial K+ATP channels, depolarizes mitochondrial membrane potential
and increases mitochondrial ROS production, resulting in activation of redox-sensitive
MAPK (mitogen-activated protein kinase) (Zhang et al., 2007).

Hepatic Mitochondrial Renin-Angiotensin Systems
James R A Skipworth 53
Figure I15. Ang II induces endothelial Nitric Oxide Synthase uncoupling, switching from
Nitric Oxide to Superoxide production, as well as potentially having direct action upon
mitochondrial reactive oxygen species production; a pathway that occurs even under normal
physiological conditions (pathway in black), but when the RAS pathway is increasingly
activated to above physiological levels (pathway in red), it may lead to various pathological
states.

Hepatic Mitochondrial Renin-Angiotensin Systems
James R A Skipworth 54
I4. Summary & Rationale
I4a. Summary of Published Literature
Ang II has been detected in rat heart, brain and smooth muscle cell mitochondria, utilising
125-I labeled ang II (Robertson and Khairallah, 1971a, Sirett et al., 1977), and ang II
immunoreactivity has also been observed in rat cerebellar cortex mitochondria via
immunogold staining techniques (Erdmann et al., 1996). Further, in rat adrenal zona
glomerulosa, renin, angiotensinogen and ACE have been detected within intramitochondrial
dense bodies (Peters et al., 1996). Such data suggest the intramitochondrial generation of
ang II, which might have direct effects on mitochondrial function. In support, ang II can
stimulate production of mitochondrial reactive oxygen species in vascular smooth muscle
cells and in rat aorta in vivo (Kimura et al., 2005), via NAD(P)H oxidase activation
(Doughan and Dikalov, 2005). Recent observations also reveal that ang II administration
leads to a decrease in mitochondrial membrane potential, possibly as a result of ROS
generation (Kimura et al., 2005). RAS antagonists are capable of preventing or reversing
many of these effects: ACE-inhibitors prevent age-related changes in mitochondrial number
and form in murine renal cells, myocardiocytes and hepatocytes (Ferder et al., 1993, de
Cavanagh et al., 2007, de Cavanagh et al., 2003). Furthermore, the expression of genes
related to mitochondrial energy production is up-regulated in captopril-treated diabetic rats
(Chen et al., 2004).
Therefore, studies to date appear to indirectly suggest that a mitochondrial RAS exists, and
that it may contribute to physiological mitochondrial function and pathophysiological
mitochondrial dysfunction. Ang II antagonism, meanwhile, is not only capable of preventing
these effects, but also improves mitochondrial function. However, the precise mechanisms
underlying such mitochondrial effects require further elucidation and might be mediated
through diverse cellular signaling pathways, or alternatively via direct effects upon
mitochondria, as suggested by the presence of RAS components in/on mitochondria.
Hepatic Mitochondrial Renin-Angiotensin Systems
James R A Skipworth 55
I4b. A Mitochondrial RAS: Unanswered Questions
The mitochondrial genome does not contain DNA for any RAS components and therefore it
must be inferred that RAS components located within mitochondria have been nuclear-
encoded and imported from the cytoplasm (Neupert, 1997). Indeed, many mitochondrial
proteins are nuclear-generated, containing an amino-terminal mitochondrial localization
sequence that allows mitochondrial delivery via cytosolic chaperones, where receptor-
mediated ATP-dependent uptake occurs (Roise and Schatz, 1988). However, no RAS
components have been shown to be synthesized with such a targeting sequence, although the
identification of a number of nuclear-encoded mitochondrial transmembrane proteins
without such a targeting sequence (such as adenine nucleotide translocase) and some that
contain an altered targeting sequence (e.g. CYP11B1 and P450SCC) does not completely
exclude the mitochondrial import of RAS components (Pfanner et al., 1987, von Heijne et
al., 1989).
Renin is the most investigated putative mitochondrial RAS component to date and
traditionally was considered to be a secretory protein targeted to the secretory pathway via
the ER and golgi apparatus, a pathway that does not allow segregation of renin or its
precursors to the mitochondria. However, multiple renin transcripts are now known to exist,
one of which has been shown to contain an amphiphilic structure that may be capable of
acting as a mitochondrial import sequence for receptor-mediated mitochondrial uptake.
Further, some renin transcripts are now known to contain alternative start sites that may
contain an extended amino-terminal with high hydrophobicity that could be used for
mitochondrial import (Dzau et al., 1988). Another possibility is the existence of an internal
targeting signal, such as that found in cytochrome c, which is not cleaved (Folsch et al.,
1996, Nicholson et al., 1988, Lill et al., 1992). However, renin has been identified in
mitochondrial dense bodies (Peters et al., 1996), which are likely to be located within the
mitochondrial matrix, requiring transport across both the mitochondrial inner and outer
membrane; whereas, proteins with an internal targeting sequence are usually located on the
inner membrane or in the inter-membrane space (Clausmeyer et al., 1999).
Similarly, Abadir et al (2011) reported the presence of the AT2R on mitochondrial inner
membranes; however, the mechanism required for the transport of a seven transmembrane
domain G-coupled receptor across the outer mitochondrial membrane remains unknown.

Hepatic Mitochondrial Renin-Angiotensin Systems
James R A Skipworth 56
AIMS & PLAN OF STUDY

Hepatic Mitochondrial Renin-Angiotensin Systems
James R A Skipworth 57
A1. Aims The identification of a functioning mitochondrial RAS (mRAS) may aid in understanding
the mechanism of interaction between mitochondria and various disease states, and existing
data suggest the association of individual RAS components with mitochondria, where they
may influence mitochondrial function. However, such studies are few and contain inherent
and multiple limitations at a basic level: they address a limited range of cells only, have
often relied upon immunocytochemistry/immunohistochemistry alone to demonstrate RAS
components, have rarely sought to identify the co-existence of multiple RAS components,
and have failed to seek the presence of some entirely. Thus, the existence of a putative
mitochondrial RAS remains in doubt and further exploration, utilizing alternate techniques,
is required.
These issues were addressed by determining the presence of all major RAS components in
the mitochondria of liver cells (from rat liver tissue and liver cell-line, rather than just cell-
line alone; contain high density of mitochondria) utilizing a number of antibodies (rather
than relying on a single antibody) and techniques (rather than immunocytochemistry/
immunohistochemistry alone).
A2. Hypotheses
The hypotheses tested were: 1. RAS components can be found within mitochondria derived from rat liver tissue and
a liver cell-line, utilizing Western blotting, confocal microscopy and electron
microscopy techniques.
2. Addition of RAS components to liver cells adversely affects a variety of hepatic
mitochondrial functions (as assessed via measurement of oxygen consumption,
mitochondrial membrane potential, NADH concentration and calcium
concentration); whereas, RAS antagonism leads to improvements in hepatic
mitochondrial function.
Hepatic Mitochondrial Renin-Angiotensin Systems
James R A Skipworth 58
A3. Experimental Plan
A3.i. Investigation of the Presence of RAS Components within Hepatic
Mitochondria Initially, a plan was devised to investigate the presence of RAS components within rat liver
tissue and a liver cell-line utilizing the following techniques and chronology.
A3.i. a. Western Blotting: Western blotting was performed upon subcellular fractions
(produced via differential centrifugation), including mitochondrial fractions, isolated from
both rat liver tissue and a liver cell-line. The purity of each subcellular fraction was assessed
by staining for proteins known to be located within each specific sub-fraction. The presence
of all RAS components was subsequently assessed in each sub-cellular fraction. Multiple
antibodies (from multiple manufacturers) to each RAS component were sourced and utilized
to assess the specificity and sensitivity of such antibodies and to avoid the problems
associated with the use of single antibodies. The optimal antibodies for each RAS
component were subsequently utilized for confocal and electron microscopy.
A3.i. b. Immunofluorescence & Confocal Microcopy: Immunofluorescence and confocal
microscopy was performed upon whole cells from a liver cell-line and the presence of all
RAS components was assessed. The intra-cellular and intra-mitochondrial location of RAS
components was subsequently investigated and co-staining for known nuclear (DNA) and
mitochondrial (ATP Synthase) constituents was performed to act as positive controls.
Further negative control images were taken by performing staining with primary and
secondary antibody alone.
A3.i. c. Immunogold Staining and Electron Microscopy: Immunogold staining and
electron microscopy was performed upon rat liver tissue and a liver cell-line and the
presence of all RAS components were assessed. Negative control images were taken by
performing staining with primary and secondary antibody alone.

Hepatic Mitochondrial Renin-Angiotensin Systems
James R A Skipworth 59
A3.ii. Investigation of the Effects of RAS Agonism/Antagonism upon
Mitochondrial Function Subsequently, I planned to investigate the result of adding RAS agonists and antagonists to
live cells from a liver cell-line, utilizing the following techniques and chronology.
A3.ii. a. Functional Fluorescence Microscopy: The effect of adding angiotensin II,
losartan and PD123319 upon cellular NADH and calcium concentration, and mitochondrial
membrane potential, was assessed.
A3.ii. b. Oxygen Consumption: The effect of adding angiotensin II, losartan and
PD123319 upon oxygen consumption was assessed.

Hepatic Mitochondrial Renin-Angiotensin Systems
James R A Skipworth 60
METHODS

Hepatic Mitochondrial Renin-Angiotensin Systems
James R A Skipworth 61
M1: Materials
M1. a. Dyes & Probes
M1. a. i. Tetramethylrhodamine, methyl ester (TMRM) (Invitrogen Molecular Probes,
Carlsbad, CA, USA)
TMRM is a cationic, mitochondrial-selective probe that is utilised for labeling and
measuring mitochondrial membrane potential within intact, living cells via confocal
microscopy, flow cytometry or fluorometric measurements (Floryk and Houstek, 1999) .
Due to its optical and chemical properties, alterations in mitochondrial membrane potential
are observed as variations in fluorescence intensity but not in emission spectra (Loew et al.,
1993), thus distinguishing between signals from probe located within mitochondria, and
signals from probe situated within other cellular compartments. Such changes in
fluorescence intensity are usually expressed relative to control measurements rather than as
exact values, which can be difficult to accurately determine. It is added in low
concentrations (see discussion of specific experiments for exact concentrations used) to
avoid aggregation and fluorescence quenching and is subsequently excited at 500 nm. This
approach allows sensitive measurements of changes in mitochondrial membrane potential
and TMRM can be utilised in conjunction with confocal microscopy to perform analyses
over time, or to assess the effects of adding or inhibiting certain molecules.
M1. a. ii. Acetoxymethyl ester Fluo-4 AM (Invitrogen Molecular Probes, Carlsbad,
CA, USA)
Fluo-4 is a green-fluorescent probe that binds to calcium and is utilised for measurement of
calcium concentration within living cells. It is commonly administered as the non-
fluorescent Fluo-4 AM, which is subsequently cleaved within the cell to produce free,
fluorescent Fluo-4, which has high cell permeability, undergoes 40-100 x increase in
fluorescence intensity upon calcium binding and is excited at wavelengths of 488 nm (Gee
et al., 2000). It can similarly be observed with confocal microscopy in analyses of calcium
concentration alterations over time.

Hepatic Mitochondrial Renin-Angiotensin Systems
James R A Skipworth 62
M1. a. iii. Hoescht 33258 (Sigma-Aldrich, St. Louis, MO, USA)
Hoescht 33258 is a water-soluble, cell-permeable, Bis-benzimide dye, which binds to the
minor groove of double-stranded deoxyribonucleic acid (DNA), particularly those
sequences rich in adenine and thymine (Portugal and Waring, 1988). It can be utilised to
stain DNA in live or fixed cells (Latt et al., 1975, Latt and Stetten, 1976) and is excited by
ultraviolet light at 350 nm, emitting a blue fluorescent light at an emission maximum of 461
nm.
M1. b. Reagents
M1. b. i. Rotenone (Sigma-Aldrich, St. Louis, MO, USA)
Rotenone is a water-insoluble, respiratory chain inhibitor that blocks respiration in the
presence of ADP by inhibiting the transfer of electrons from iron-sulphur centres in
complexes I and II of the electron transport chain to Coenzyme Q10 (ubiquinone)
(Kuznetsov et al., 2008). Coenzyme Q10 is fat-soluble and acts as a mobile electron carrier
in the mitochondrial membrane, delivering electrons to complex III and acting as a crucial
cog in the electron transport chain machinery.
Coenzyme Q10 and the electron transport chain are ubiquitous within eukaryotic cells and
rotenone is therefore a potent poison, being historically used as an insecticide, pesticide and
piscicide.
M1. b. ii. Oligomycin (Sigma-Aldrich, St. Louis, MO, USA)
Oligomycin is a macrolide isolated from Streptomyces diastatochromogenes that acts as an
electron transport chain inhibitor by inhibiting phosphorylation and abolishing ADP-
stimulated respiration in intact mitochondria. Oligomycin binds to oligomycin sensitivity
conferring protein in the F0 polypeptide (subunits 6 and 9) of ATP synthase, a proton pore
located within the mitochondrial membrane; thereby blocking proton conductance and
synthesis of mitochondrial ATP (Hundal et al., 1984).

Hepatic Mitochondrial Renin-Angiotensin Systems
James R A Skipworth 63
M1. b. iii. Carbonilcyanide p-triflouromethoxyphenylhydrazone (FCCP) (Sigma-
Aldrich, St. Louis, MO, USA)
FCCP is a small, amphipathic molecule that acts as a proton ionophore, forming a shield
around transported protons and allowing the formation of a polar environment for the
contained ion with a hydrophobic outer surface; and it is therefore capable of depolarizing
both plasma membranes and mitochondrial membranes (To et al., 2010). Such activity is
capable of resulting in uncoupling the link between the respiratory chain and
phosphorylation systems within intact mitochondria, dissipating the proton gradient before it
can be used for oxidative phosphorylation.
M1. b. iv. Angiotensin II (Alexis Biochemicals (Enzo Life Sciences), Exeter, UK; Cat. No.
ALX-151-039-M005)
The biological characteristics of Angiotensin II are described earlier (see Introduction page
18 for more information).
M1. b. v. Losartan Potassium (Tocris Bioscience, Bristol, UK; Cat. No. 3798)
Losartan is a selective, competitive antagonist of the AT1R. Systemically it antagonises
vasoconstriction and release of aldosterone, thereby resulting in reduction in blood pressure
through decreases in both total peripheral resistance and venous return. It has similar
antagonistic effects at a paracrine and autocrine level. It is well absorbed orally and
therefore commonly utilised for the treatment of hypertension (as with other RAS
antagonists e.g. ACE-inhibitors) and renal disease secondary to diabetes and hypertension.
M1. b. vi. PD123319 ditrifluoroacetate ((6S)-1-[[4-(dimethylamino)-3-
methylphenyl]methyl]-5-(2,2-diphenylacetyl)-6,7-dihydro-4H-imidazo[4,5-c]pyridine-
6-carboxylic acid (Tocris Bioscience, Bristol, UK; Cat. No. 1361)
PD123319 is a potent, selective, non-peptide AT2R antagonist. It may also have some
antagonistic effects upon the action of Ang 1-7 (Walters et al., 2005, Bosnyak et al., 2011).

Hepatic Mitochondrial Renin-Angiotensin Systems
James R A Skipworth 64
M1. b. vii. Histamine (Sigma-Aldrich, St. Louis, MO, USA)
Histamine is an organic, nitrogen-based compound with multiple functions, including a
crucial role in immune responses. Its actions occur via binding with one of four histamine
receptors (H1-4), all of which are G-protein coupled receptors, leading to an increase in
intracellular calcium.
M1. b. viii. Antibodies
Primary and secondary antibodies to both RAS components and standard cellular
components were sourced from a variety of manufacturers and utilized at manufacturers
recommended concentrations (see Appendix Tables App2. a. and App2. b., pages 216-220
for further details).
Hepatic Mitochondrial Renin-Angiotensin Systems
James R A Skipworth 65
M2. Cell-lines & Tissues
M2. a. HeLa Cells
A cell-line derived from cervical cancer cells, which contain a chromosome number of 82,
with four copies of chromosome 12 and three copies of chromosomes 6, 8, and 17. The cells
proliferate rapidly and contain a version of telomerase, which prevents the incremental
shortening of telomeres during cell division, allowing them to circumvent the Hayflick
Limit and achieve immortality (Ivankovic et al., 2007). HeLa cells contain no functioning
angiotensin receptors [personal communication: Peter Varnai (Semmelweis Medical School,
Budapest, Hungary)]. HeLa cells were kept in an incubator at 38 °C inside a 75 cm2 flask
containing Dulbecco’s modified eagle’s medium (DMEM (Cat. No.41966052); Invitrogen,
Carlsbad, CA, USA), foetal bovine serum (FBS) and streptomycin.
M2. b. HepG2 Cells
An immortal cell-line derived from well-differentiated hepatocellular carcinoma cells,
which contain 55 chromosomes. HepG2 cells display robust morphological and functional
differentiation, rendering them a good model for the in vitro study of human hepatocytes.
HepG2 cells were kept in an incubator at 38 °C inside a 75 cm2 flask containing Dulbecco’s
modified eagle’s medium (DMEM (Cat. No.41966052); Invitrogen, Carlsbad, CA, USA),
FBS and streptomycin.
M2. c. Rat Liver Tissue
Rat livers were surgically removed from Sprague-Dawley rats held at University College
London (London, UK), where all Home Office regulations and codes regarding the housing
and maintenance of the animals are strictly adhered to. Rats were humanely euthanised by
placing them in a chamber within which the concentration of CO2 was gradually increased.

Hepatic Mitochondrial Renin-Angiotensin Systems
James R A Skipworth 66
The rats were subsequently dissected and the liver removed by surgical division of its
anatomical attachments.
M2. d. Cell Culture
M2. d. i. Cell Passage
Cells were viewed under a light microscope to ensure 90–100 % cellular confluence within
a flask. Spent medium was subsequently removed from the flask and the cells washed with
phosphate buffered saline (PBS) and 1 ml of dilute trypsin (serine protease) solution added
to the flask to hydrolyse and break attachments between the cells and the flask. The flask
was then incubated at 38 °C for 3-5 minutes and the flask imaged again to ensure the cells
have separated from the flask and are now suspended in solution. DMEM (6ml containing
FBS and streptomycin) was added to the flask and rinsed over the separated cells. The
subsequent mixture of DMEM containing cells in solution was collected by pipette and a
third (2.3 ml of total 7 ml) of the solution added to three new 75cm2 flasks, which were
supplemented with a further 12 ml of medium before being labeled and placed back in an
incubator at 38 °C.
M2. d. ii. Freezing Cells
A 2.3 ml solution of cells/medium was centrifuged at 250 g for four minutes at 4 °C and
spent medium separated from the cellular pellet. The pellet was then resuspended in 500 µl
of FBS:Dimethyl Sulfoxide (DMSO) (90 % : 10 %) solution in a cryotube wrapped in
paraffin-coated film. The cryotube was labeled, placed in ice for half an hour and then
transferred to a freezer at -20 °C.
M2. d. iii. Coverslips
Cell/medium solution (7 ml) from cell passage was further diluted with 5 ml of DMEM. The
subsequent 12 ml of solution was gently agitated and 2 ml of solution added to each well of
a 6-well plate, within which a 22 mm cover-slip had already been placed. The 6-well plate

Hepatic Mitochondrial Renin-Angiotensin Systems
James R A Skipworth 67
was labeled and returned to an incubator at 38 °C to allow the cells to grow on the coverslip.
Cover-slips were subsequently removed following adequate growth by removing spent
medium with a pipette and extracting the cover-slip from the well utilising forceps.

Hepatic Mitochondrial Renin-Angiotensin Systems
James R A Skipworth 68
M3. Cellular Sub-Fractionation & Mitochondrial
Isolation
M3. a. Principle
Differential centrifugation and percoll density gradient separation is a method of separating
cellular compartments (cellular sub-fractionation) based upon their density (low density
components being cell membrane, mitochondrial associated membranes and endoplasmic
reticulum; high density being mitochondria and nucleus), and was performed based upon
standard methodologies (Sims and Anderson, 2008). Typically, sub-cellular fractionation
performed on cells grown in flasks will yield smaller fractions than large pieces of tissues,
rendering some of the sub-fractions isolated unsuitable for further experimentation because
of the low protein concentration and volume.
M3. b. Sample Homogenisation
Freshly harvested livers from Sprague-Dawley rats or cells gathered from flasks
immediately following trypsin isolation were stored in cold PBS, on ice, and kept on ice
throughout the mitochondrial isolation process (minimum 4° C). Rat liver samples were
initially homogenized by cutting into small pieces/mincing with scissors, while repeatedly
washing with PBS until the supernatant was clear and blood-free (to prevent sample
contamination by blood cells). The cell or tissue samples were mixed with Solution A (1 ml
per gram of tissue) and Protease Inhibitor (Protease Inhibitor cocktail P8340; Sigma-
Aldrich, St. Louis, MI, USA) added (1 µl per gram of tissue). Samples were further
homogenised utilising a Dounse homogeniser (at least 40 runs total: 20 runs with loose-
fitting Teflon pestle and 20 runs with tight-fitting Teflon pestle) and a drill-powered Potter-
Elvehjem homogeniser (at least ten runs). The resultant homogenate (H) was aliquoted into
2 ml samples and was either stored at -20 oC in cryotubes or immediately underwent
differential centrifugation.

Hepatic Mitochondrial Renin-Angiotensin Systems
James R A Skipworth 69
M3. c. Differential Centrifugation (See Figure M1)
The homogenate (H) was centrifuged at 800 times gravity (g) at 4 °C for ten minutes in a
Beckman J2-MC centrifuge (with JA-20 rotor) to yield a nuclear pellet (N) and a
postnuclear supernatant (PNS). N was subsequently resuspended in solution A.
PNS was spun at 10,300 g for ten minutes at 4 °C in a Beckman J2-MC centrifuge (with a
JA-20 rotor) to yield a crude mitochondrial pellet (CM) and a postmitochondrial supernatant
(PMS).
PMS was centrifuged at 25,000 g for 30 minutes at 4 °C in a Beckman J2-MC centrifuge
(with a JA20 rotor) to yield an enriched lysosomal pellet (L) and a postlysosomal
supernatant (PLS).
PLS was centrifuged at 100,000 g for one hour at 4 °C in a Beckman 70 Ti rotor centrifuge
to yield a microsomal pellet (MS) and a supernatant enriched with cytosolic proteins (C).
MS was resuspended in Solution A. All samples under investigation (H, C, N, L, MS, CM,
PM, MAM) were subsequently aliquoted and stored at -20 C.
M3. d. Percoll Density Gradient Separation
CM was gently layered on top of Solution B and 30 % Percoll (by volume) in a 10 ml
polycarbonate ultracentrifuge tube and centrifuged at 95,000 g for 30 minutes at 4 °C in a
Beckman L-70 Ultra-Centrifuge (with SW41 T rotor) to yield two fractions: an upper
diffuse white band (mitochondria associated membranes; MAM) and a lower, denser band
containing purified mitochondria (PM) (see Figure M2).
PM was removed carefully, diluted with Solution A and washed twice by centrifuging at
6300 g for ten minutes to remove the Percoll, and then resuspended in Solution A and stored
at -20 °C.

Hepatic Mitochondrial Renin-Angiotensin Systems
James R A Skipworth 70
The MAM fraction was carefully removed and washed by centrifuging in Solution A at
6300 g for ten minutes at 4 °C. The supernatant was further centrifuged at 100,000 g for one
hour at 4 °C in a Beckman 70 Ti rotor and the pellet resuspended in Solution A.
The various pellets subsequently underwent protein quantification.
Figure M1. Summary of mitochondrial isolation by differential centrifugation and percoll
density gradient separation.
!"#"$%&'(%)!!"#
*+,-%'.)/%--%()0*1)
/"2(3*+,-%'.)4+5%.&'('&()
0/*41)
67(",8"&9.7'):22",7'(%9)6%#;.'&%2)
06:61)
/+.%)67(",8"&9.7')
0/61)
/"2(367(",8"&9.7'-)4+5%.&'('&()
0/641)
67,."2"#%2)0641)
<=2"2"#%2)!<"#
>=("2"-)!>"#
?@@)$A)B@)#7&))
B@AC@@)$A)B@)#7&))
/"2(3<=2"2"#'-)4+5%.&'('&()
0/<41)
DEA@@@)$A)C@)#7&))
B@@A@@@)$A)F@)#7&))
C@G)/%.,"--)HEA@@@)$A)C@)#7&))
>.+9%)67(",8"&9.7')
0>61)
FAC@@)$A)B@)#7&))
4*I)B@@A@@@)$A)F@)#7&))6:6B)
5%--%(I)6:6D)
FAC@@)$A)B@)#7&))5%--%(I)/6)
67(",8"&9.7'-)J2"-'K"&)!"#$%&'&()*+",&(-'$./0*)1(""
!"2&'31++"#&(4$-5"6'*7$&(-"8&9*'*)1("!

Hepatic Mitochondrial Renin-Angiotensin Systems
James R A Skipworth 71
Figure M2. Schematic diagram of mitochondria-associated membranes (MAM) and pure
mitochondria (PM) layers isolated following cellular sub-fractionation by differential
centrifugation and percoll density gradient separation.
M3. e. Protein Quantification
The following process, utilizing a BCA (Bicinchoninic acid) protein assay kit, allowed
colourimetric detection and quantification of total protein concentrations by relying on the
chelation of copper with peptides/proteins containing three or more amino acid residues,
within an alkaline environment (containing sodium potassium tartrate), to form a light blue
complex through the production of reduced Cu1+ from Cu2+ (Biuret reaction). Cu1+ is
subsequently detected by chelation of two BCA molecules with one Cu1+ ion, in a highly
sensitive and selective fashion, producing a water-soluble, purple solution, which exhibited
a strong linear absorbance at 562 nm with increasing protein concentrations. The absorbance
was then compared to samples containing standard concentrations of common proteins, such
as BSA, which have been prepared alongside the sample under analysis. Protein
quantification was performed utilising a BCA protein assay kit (Thermo Scientific (Cat. No.
#23225); Waltham, MA, USA) and standard methodology (for full protocol see
http://www.piercenet.com/instructions/2161296.pdf).
MAM
Lipid
Sol B
PM
Percoll

Hepatic Mitochondrial Renin-Angiotensin Systems
James R A Skipworth 72
A set of protein solutions containing set concentrations were created, utilising the BSA
ampoules contained within the protein assay kit, to produce a range of diluted protein
standards within a working range of 20-2000 µg/ml protein concentration. The working
reagent containing Cu2+ ions and an alkaline environment was also made up in preparation
for the reaction. The samples under investigation were also pipetted into 25 µl aliquots,
ready for analysis. Each standard or sample (25 ul) was subsequently placed into a well in a
32-well microplate. Working reagent (200 ul) was added to each well and the solution
placed on a shaker for 30 seconds, before incubation at 37 °C for 30 minutes. Absorbance
was subsequently measured at 562 nm on a plate reader. The average 562 nm absorbance of
the blank standards prepared (containing no protein) was subtracted from all other standards
and samples. A standard curve was subsequently plotted of the corrected 562 nm
measurement of each BSA standard (y axis) against its concentration in µg/ml (x axis). This
standardised curve was subsequently utilised to determine the protein concentrations of all
unknown samples.
Hepatic Mitochondrial Renin-Angiotensin Systems
James R A Skipworth 73
M4. Western Blotting
M4. a. Principle
Western blotting is a process by which proteins are separated by polyacrylamide gel
electrophoresis, before being transferred to a nitrocellulose or polyvinylidene difluoride
(PVDF) membrane. The membrane is subsequently imaged by applying a secondary
antibody linked to a reporter enzyme, usually horseradish peroxidase, which
chemiluminesces when exposed to light revealing protein ‘bands’ on the surface of the
membrane. Optical density analysis is subsequently utilised to determine the relative amount
of protein present in each band and band size approximations are made by comparing the
stained bands to the marker loaded at the time of electrophoresis.
M4. b. Polyacrylamide Gel Electrophoresis
Samples derived from cellular sub-fractionation were separated by polyacrylamide gel
electrophoresis utilising standard techniques, following protein quantification (See
http://tools.invitrogen.com/content/sfs/manuals/blotmod_pro.pdf and
http://tools.invitrogen.com/content/sfs/manuals/surelock_man.pdf for full protocol).
Samples were initially diluted into 30 µl aliquots containing 30 µg of protein under
investigation per sample (as per protein quantification results). The separate sample aliquots
were subsequently pipetted into wells in a Bis-Tris gel (NuPAGE® Novex 4-12% Bis-Tris
gel (1.5 mm, 10 well) (Invitrogen (Cat. No. NP0335BOX); Carlsbad, CA, USA)), with 6-8
µl of protein size standards (Precision Plus protein standards (Bio Rad Laboratories (Cat.
No. 161-0374); Hercules, CA, USA)) pipetted into the final 10th well. The gel was placed
into an XCell II™ SureLock Mini Cell apparatus (Invitrogen (Cat. No. E19051); Carlsbad,
CA, USA) containing running buffer (MOPS SDS running buffer (20x) (Invitrogen (Cat.
No. NP0001); Carlsbad, CA, USA)) diluted with distilled water and 200 V applied for 45-60
minutes (see Figure M3).

Hepatic Mitochondrial Renin-Angiotensin Systems
James R A Skipworth 74
Figure M3. Image of polyacrylamide gel electrophoresis utilising protein samples in a 4-12
% Bis-Tris gel. Blue wells contain 30 µl of solution containing 30 µg of protein sample;
whereas, purple wells contain 6-8 µl of protein size standards.
M4. c. Transfer to PVDF Membrane
Once electrophoresis was complete, the gel was removed from its cassette utilising a palette
knife and placed in a sandwich setup within an electro-transfer apparatus (XCell II™ Blot
Module apparatus, Invitrogen (Cat. No. E19051); Carlsbad, CA, USA) for transfer to a
PVDF membrane (Immobilon-P transfer membrane, Millipore (Cat. No. IPVH00010);
Billerica, MA, USA). The chamber was filled with transfer buffer (50 ml of NuPage transfer
buffer (Invitrogen (Cat. No. SKU#NP0006)), methanol (100 ml) and distilled water (850
ml) and 10 V applied continuously overnight at 4 °C.

Hepatic Mitochondrial Renin-Angiotensin Systems
James R A Skipworth 75
M4. d. PVDF Membrane Antibody Staining
The PVDF membrane was removed from the sandwich setup and placed in a glass jar. Non-
specific membrane-binding was prevented (‘blocking’) by soaking the membrane in PBS
containing 5 % bovine serum albumin (BSA; Albumin from bovine serum (pH 5.4), Sigma-
Aldrich (Cat. No. A8022); St. Louis, MI, USA) solution containing a low percentage of
Tween20 detergent for two hours at room temperature, while gently agitating on a rocker.
Following blocking, a dilute PBS solution of primary antibody, BSA (2.5 %) and Tween20
(0.1 %) was incubated with the membrane under gentle agitation for one hour at room
temperature (specific antibody concentrations varied depending upon antibody utilised- see
Appendix Table APP2. a. and APP2. b.). Unbound primary antibody was removed by
subsequently rinsing the membrane in a low concentration of PBS/Tween20 (0.1 %)
solution twice for 30 minutes each, and the membrane then exposed to a a dilute PBS
solution containing secondary antibody and BSA (2.5 %)/Tween20 (0.1 %) solution linked
to a reporter enzyme (usually horseradish peroxidase) for one hour at room temperature,
while gently agitating. The membrane was again rinsed in low concentration Tween20
solution twice for 30 minutes at room temperature to remove all excess antibody.
M4. e. Membrane Imaging
Immunoreactive bands were detected by placing the membrane on an acetate sheet and
chemiluminescent detection reagents added (ECL Plus Western Blotting Detection Reagents
(Cat. No. RPN2132), GE Healthcare/Amersham, Little Chalfont, UK). Excess solution was
removed utilising absorbent filter paper and the membrane placed in a chamber (Chemidoc
MP system, BioRad, Hercules, CA, USA) for antibody detection by chemiluminescence.

Hepatic Mitochondrial Renin-Angiotensin Systems
James R A Skipworth 76
M5. Immunofluorescence
M5. a. Principle
The basic principle of immunofluorescence depends upon selectively exciting fluorescent
molecules applied to cells or tissue sections, in such a way that each fluorescent molecule
exists as a separate light source. When a molecule of fluorescent dye absorbs a quantum of
light of sufficient energy, an electron is elevated to a higher energy level thus forming an
excited state. This electron will eventually return to its previous ‘ground’ state, and when it
does it may emit a quantum of light. In general less energy is emitted than was adsorbed
and therefore the wavelength of fluorescent light emitted is no longer the same as that of the
initial light adsorbed. Thus fluorescence microscopy is useful in that not only is it
extremely sensitive, but it is also highly specific. Fluorescence microscopy can also allow
the analysis of the molecular properties and environment of the fluorescent molecules.
Confocal microscopy is a technique that allows the analysis of light focused at an extremely
narrow band within a specimen. Thus it allows the user to gather depth-selective
information on the three-dimensional structure of a microscopic object, without mechanical
sectioning and without confusion that can be caused by images derived from the areas above
and below the section. The confocal microscope employs an illuminating laser light system
that is very strongly convergent, producing a very shallow scanning spot in the object plane.
The light or fluorescence reflected back from this spot is in turn directed to a
photomultiplier through a detector pinhole. The light is analysed here and displayed by a
computer as a pixel on a screen. In order to gain a complete image of the object, a system
of mirrors is used to move the light point over the specimen, illuminating a single spot at a
time. The information from each individual spot is recorded and stored in the computer, and
the image is simultaneously displayed on a high-resolution video monitor to create a visual
image. The conjugation of the detector pinhole to the illumination pinhole ensures that it is
only information from the focal plane that reaches the detector. This accounts for the
confocal microscope’s unique ability to create images of sections through a sample, and the
user can literally dissect layer by layer through the entire thickness of the specimen. The
out-of-focus regions are also subtracted from the image by the computer programme, thus
enhancing its sharpness.

Hepatic Mitochondrial Renin-Angiotensin Systems
James R A Skipworth 77
M5. b. Cell Fixation & Permeabilisation
Cells were grown on cover-slips, within a 6-well plate, in an incubator at 38 °C. When
cover-slips were approximately two-thirds covered in confluent cells, spent medium was
removed and the cover-slips were twice washed briefly with PBS (2 ml per well) at room
temperature. The cells were subsequently fixed by incubating the cover-slips with 4 %
paraformaldehyde for five minutes at room temperature (1 ml per well), and then twice
washed at room temperature in PBS (2 ml per well), while gently agitating on a rocker. For
further fixation, pre-cooled acetone (-20 °C; 1 ml per well) was added to the cover slips,
which were left for ten minutes at -20 °C and then twice washed at room temperature in
PBS (2 ml per well), while gently agitating on a rocker. The cells were subsequently
permeabilised by incubating cover-slips twice with 0.025 % Triton X-100 for five minutes
at room temperature (1 ml per well), before washing twice with PBS (2 ml per well). To
prevent non-specific antibody binding, the cover-slips were rested in blocking solution (10
% donkey serum in PBS; Donkey Serum, Sigma-Aldrich (Cat. No. D9663); St Louis MI,
USA) for 30 minutes at 4 °C, and then washed in 1 % donkey serum in PBS for five
minutes.
M5. c. Antibody Staining
Following fixation and permeabilisation, the cover-slips were incubated for 18 hours (or
overnight) at 4 °C with the primary antibody solution (primary antibody in 1 % donkey
serum/PBS solution) in a sandwich setup (see Figure M4). The concentration of primary
antibody varied according to the specific antibody utilised (for further information see
Appendix Tables App2. a. and APP2. b., pages 216-220).
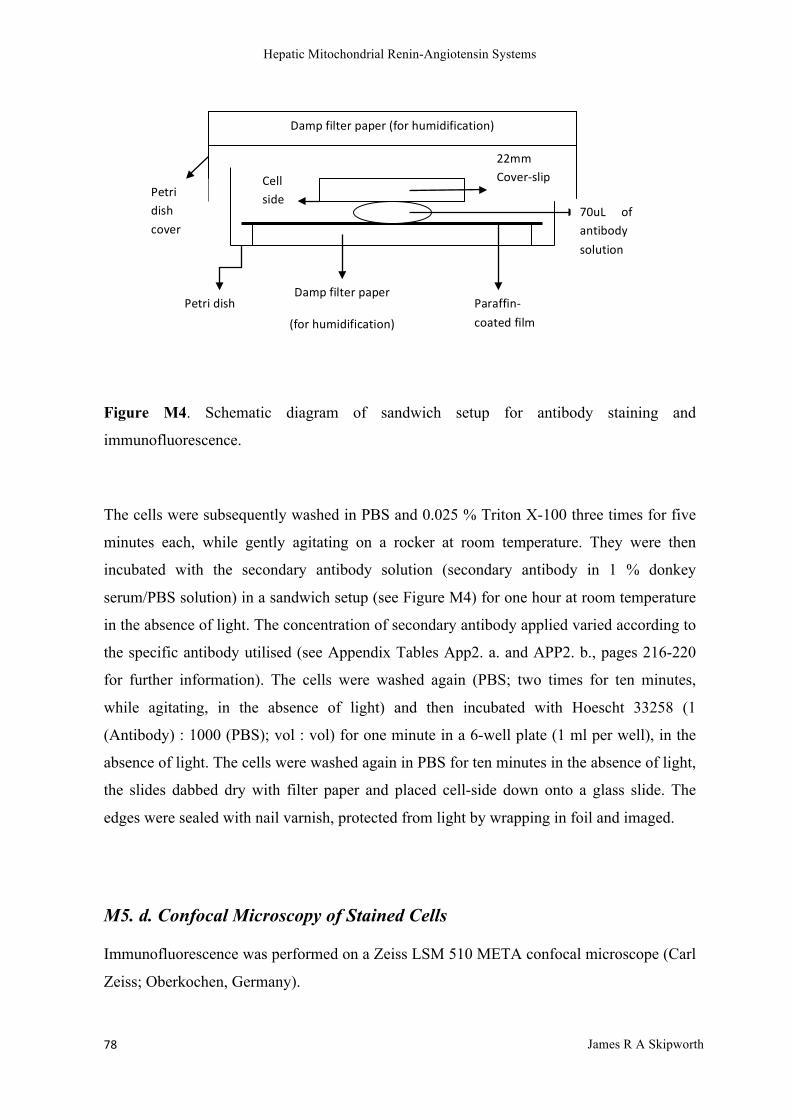
Hepatic Mitochondrial Renin-Angiotensin Systems
James R A Skipworth 78
Figure M4. Schematic diagram of sandwich setup for antibody staining and
immunofluorescence.
The cells were subsequently washed in PBS and 0.025 % Triton X-100 three times for five
minutes each, while gently agitating on a rocker at room temperature. They were then
incubated with the secondary antibody solution (secondary antibody in 1 % donkey
serum/PBS solution) in a sandwich setup (see Figure M4) for one hour at room temperature
in the absence of light. The concentration of secondary antibody applied varied according to
the specific antibody utilised (see Appendix Tables App2. a. and APP2. b., pages 216-220
for further information). The cells were washed again (PBS; two times for ten minutes,
while agitating, in the absence of light) and then incubated with Hoescht 33258 (1
(Antibody) : 1000 (PBS); vol : vol) for one minute in a 6-well plate (1 ml per well), in the
absence of light. The cells were washed again in PBS for ten minutes in the absence of light,
the slides dabbed dry with filter paper and placed cell-side down onto a glass slide. The
edges were sealed with nail varnish, protected from light by wrapping in foil and imaged.
M5. d. Confocal Microscopy of Stained Cells
Immunofluorescence was performed on a Zeiss LSM 510 META confocal microscope (Carl
Zeiss; Oberkochen, Germany).
Petri dish Damp filter paper
(for humidification) Paraffin-‐coated film
22mm Cover-‐slip Cell
side
Damp filter paper (for humidification)
Petri dish cover
70uL of antibody solution

Hepatic Mitochondrial Renin-Angiotensin Systems
James R A Skipworth 79
M6. Functional Fluorescence Microscopy
M6. a. Principle
Functional fluorescence microscopy refers to the process of imaging live cells on a confocal
microscope to assess how the addition of certain substrates alters cellular processes in real-
time. It relies upon the initial addition of various fluorescent molecules to the live cell,
which are detected at specific wavelengths, the intensity of which alter as the metabolic
process under examination changes; thus allowing quantitative study of molecular
interactions within live cells (for further information see ‘M1. Materials’; page 61). Utilising
this technique it is possible to measure real-time changes in cellular calcium and NADH
concentration, and mitochondrial membrane potential, as well as various other cellular
processes.
M6. b. Preparation of Cover-Slips
Live cells (HeLa or HepG2) were grown on 22 mm cover-slips in an incubator at 38 °C (for
further information see ‘M2. Cell Culture’; page 66). When the cells reached 50-60 %
confluent growth on the cover-slip, 25 µl TMRM and 1 µl Fluo-4 were added to the medium
solution and the cover-slips again left at 38 °C in an incubator for 30 minutes. Finally, the
cover-slips were washed with PBS three times to remove all excess dye.
M6. c. Functional Microscopy
The cover-slips were placed on a heated stage at 38 °C in a confocal microscope with UV
laser capabilities (Zeiss LSM 510 META confocal microscope (Carl Zeiss; Oberkochen,
Germany)) and left to equilibrate for 10 minutes prior to further assessment. A UV laser at
543 nm was applied to the live cells to measure mitochondrial membrane potential, as
extrapolated from TMRM fluorescence; cytosolic calcium was measured via excitation of
Fluo-4 at 488 nm; and NADH concentration detected via autofluorescence at 364 nm.
Hepatic Mitochondrial Renin-Angiotensin Systems
James R A Skipworth 80
A baseline measurement was taken for five minutes and various solutions added to the
cover-slip with a pipette, to assess effects upon excitation at the various wavelengths under
investigation. Solutions were added at 1 µM concentration and included angiotensin II,
histamine, FCCP and rotenone (for further information see ‘M1. Materials’; page 61).
M6. d. Results Analysis
Intensity of fluorescence at the various wavelengths was assessed utilising pre-installed
optical density software. Alterations in fluorescence between baseline and post-reagent
addition, within a whole field under investigation, were subsequently quantified and
calculated.

Hepatic Mitochondrial Renin-Angiotensin Systems
James R A Skipworth 81
M7. Immunogold Labeling & Electron Microscopy
M7. a. Principle
Transmission electron microscopes (EM) employ an electron beam emitted from an electron
source, usually a tungsten filament cathode, which is controlled and focused by electrostatic
and electromagnetic lenses, to illuminate a specimen and produce a magnified image;
whereas, scanning EM produces images by scanning over a sample with a high energy
focused beam of electrons, which interact with electrons within the sample, producing
secondary electrons, transmitted electrons and back-scattered electrons, as well as X-rays,
light and current. Electrons have wavelengths 100,000 x shorter than visible light (photons)
and electron microscopes therefore achieve much greater resolution than light-powered
optical microscopes, potentially achieving magnifications of up to 10,000,000 x. Biological
specimens for EM analysis are fixed, dehydrated and embedded within polymer resin, to
allow thin sections to be prepared for analysis.
M7. b. LR White processing
Rat liver samples were dissected into small pieces with scissors/scalpel and fixed for 8-12
hours (or overnight) in 4 % paraformaldehyde / 0.5 % glutaraldehyde (in 0.1 M cocadylate
buffer at pH 7.4). Samples were subsequently washed in 4 % sucrose (in 0.1 M cocadylate
(pH 7.4)) three times and stored at 4 ºC before being dehydrated in graded concentrations of
ethanol (50 %; 70 %; 80 %; 85 %; and 95 %) for 60 minutes each, followed by three
separate 30 minute exposures to 100 % ethanol.
Samples were then infiltrated at room temperature with LR White low viscosity acrylic
embedding medium (a polyhydroxy-aromatic, hydrophilic acrylic resin with low toxicity,
ultra-low viscosity and low miscibility with water and gently shaken on a rotor for three
separate four hour periods in graded solutions of LR White : 100 % ethanol solution (ratios
of 1 : 1, 2 : 1 and 3 : 1) before being left in pure LR White for two 12-hour periods. Samples
were then embedded and polymerized at 60 ºC for 20-24 hours.

Hepatic Mitochondrial Renin-Angiotensin Systems
James R A Skipworth 82
M7. c. Immunogold Labeling
Embedded tissue was subsequently cut into ultra-thin sections and mounted on formvar-
coated grids and allowed to dry. Once dried, the grids were washed with 0.05 M Tris-
buffered saline (TBS) containing 1 % bovine serum albumin (BSA; Albumin from bovine
serum (pH 5.4; Sigma-Aldrich, St Louis, MI, USA)) for 10 minutes at room temperature and
sections were then incubated overnight with the primary antibody of choice (in 0.05 M TBS
with 1 % BSA at 4º C).
The grids were then washed in 0.05 M TBS with 0.05 % Tween-20 three times and
incubated for 1 hour at room temperature with the secondary antibody of choice (in 0.05 M
TBS with 1 % BSA at 4 ºC).
Finally, the grids were washed in 0.05 M TBS with 0.05 % Tween-20 three times (each 5
min length), and again in double-distilled water, before being allowed to dry. Sections were
then counterstained with 4 % uranyl acetate for 20 min, followed by lead citrate for 5
minutes, both at room temperature.
M7. d. Electron Microscopy
Fresh rat liver samples were delivered on ice to the electron microscopy unit at the Royal
Free Hospital (Electron Microscopy Unit, UCL Medical School, Royal Free Campus,
Rowland Hill Street, Hampstead, London NW3 2PF), where sample preparation by
dehydration, fixation and embedding, as well as all electron microscopy, was performed by
experienced EM operators.

Hepatic Mitochondrial Renin-Angiotensin Systems
James R A Skipworth 83
M8. Immunoprecipitation
M8. a. Principle
Crosslink immunoprecipitation refers to the process of antigen purification utilising a
specific antibody. The principle involves crosslinking to covalently attach a specific
antibody to a protein A/G agarose resin (recombinant protein combining antibody-binding
domains from protein A and G), which is then incubated with a protein mixture containing
the antigen, allowing the antibody : antigen complex to form. After washing to remove
unbound, undesired sample components, the antibody : antigen complex, immobilised by
crosslinking with disuccinmidyl suberate (DSS) on beaded agarose resin, is eluted and
separated by centrifugation (see Figure M5).
Samples under investigation were immunoprecipitated utilising a Pierce Crosslink IP kit
(Thermo Scientific (Cat. No.#26147); Waltham, MA, USA), with all steps carried out at 4
°C (unless otherwise stated) and all centrifugations at low speed (1000-3000 g) for 30-60
seconds (see http://www.piercenet.com/instructions/2162134.pdf for full protocol).
Figure M5. A schematic diagram demonstrating crosslink immunoprecipitation. Figure
taken from Piercenet (see http://www.piercenet.com/browse.cfm?fldID=FE0FBC6F-61BB-
41DF-AD2E-008247C95177).

Hepatic Mitochondrial Renin-Angiotensin Systems
James R A Skipworth 84
M8. b. Binding of antibody with Protein A/G Agarose Resin
A solution containing 10 µg of antibody was prepared through dilution of the antibody with
coupling buffer and ultrapure water and then added to 20 µl of Pierce Protein A/G Plus
Agarose resin and mixed on a rotor for 30-60 minutes; followed by washing via
centrifugation with coupling buffer.
M8. c. Crosslinking of bound antibody
The prepared antibody : resin complex was incubated with DSS, ultrapure water and
coupling buffer and placed on a mixer for 30-60 minutes at room temperature. The solution
was washed in Elution buffer and IP / Lysis Wash buffer via centrifugation, prior to
proceeding to immunoprecipitation.
M8. d. Immunoprecipitation
The sample under investigation was diluted with IP / Lysis Wash buffer to create a volume
of 300-600 µl containing 500-1000 µg of total protein. This was added to the prepared
antibody : resin complex and incubated overnight on a rotor at 4 °C.
M8. e. Antigen Elution
The mixture was washed via centrifugation with IP / Lysis Wash buffer and Conditioning
buffer and 5 ul of 1 M Tris (pH 9.5) added to neutralise the low pH and allow functional
assays. The sample was incubated and centrifuged with elution buffer and the eluate
collected for further analysis or stored at -20 °C.

Hepatic Mitochondrial Renin-Angiotensin Systems
James R A Skipworth 85
M9. Mass Spectrometry
M9. a. Principle
Mass spectrometers are analytical tools that measure the molecular mass of samples applied
to them with an exceedingly high degree of accuracy that allows both quantitative and
qualitative uses. Mass spectrometry can be used to quantify the amount of a compound or
molecule in a sample, detect even minor changes in mass (such as the alteration of one
amino acid), the molecular formula of organic compounds, or a compound’s structural
information, by observing its fragmentation.
Mass spectrometers contain three fundamental parts: an ion source, which can convert gas
phase sample molecules into ions or move ions in solution into the gas phase; a mass
analyser, which is capable of sorting ions by their mass via the application of
electromagnetic fields; and a detector, which assesses the abundance of each ion present. All
three parts are maintained within a vacuum to allow the ionised molecules to travel from
one end of the machinery to the other without the hindrance of air molecules and the whole
system is controlled by computer software. Heavier ions travel more slowly across the
machinery and the subsequent mass : charge ratio (m / z spectrum) is compared to a
database. Often a sequence tag of only 4-5 amino acids can be utilised to identify a protein
or peptide from a database.
The sample under investigation is introduced into the ionisation source, where its molecules
become ionised. The ions are subsequently separated by the analyser according to their mass
to charge ratio and the separated ions are subsequently detected in the detector and their
frequency also assessed for subsequent presentation in the form of an m/z spectrum.
MALDI–TOF (Matrix-Assisted Laser Desorption Ionisation–Time Of Flight) (Hillenkamp
et al., 1991) is a type of mass spectrometer that is particularly useful in the assessment of
thermolabile, non-volatile organic compounds of high molecular mass such as proteins,
peptides and glycoproteins. MALDI involves pre-mixing the sample with a highly-
absorbent matrix compound in a volatile solvent, which is capable of converting laser light
into excitation energy, with subsequent sample bombardment by laser light (usually pulsed

Hepatic Mitochondrial Renin-Angiotensin Systems
James R A Skipworth 86
nitrogen laser of 337 nm wavelength) to produce ionisation. Proteomic analysis can be
performed utilising this technique by excising bands or spots from a gel, enzymatically
digesting the peptides or proteins within each band or spot and then analysing the resultant
mixture via MALDI-TOF. The result can be compared to a database of known
peptides/proteins, where it is either identified as a known protein, or not identified because it
is previously uncharacterised, or the result does not provide enough information to
distinguish it between a few potential results and further information is required, either
through increasing the concentration of the molecule or cleaning of the sample.
M9. b. Sample Preparation for Mass Spectrometry
Samples under investigation underwent gel electrophoresis on a 4-12 % Bis-Tris gel, prior
to silver staining and subsequent excision of protein bands of interest. The bands
subsequently underwent reduction and alkylation, prior to deglycosylation and trypsin
digestion prior to proteomic analysis via mass spectrometry.
M9. b. i. Silver Staining
(see http://tools.invitrogen.com/content/sfs/manuals/silverquest_man.pdf for full protocol)
Silver staining was performed utilising the SilverQuestTM Silver Staining Kit For Mass
Spectrometry (Compatible Silver Staining of Proteins in Polyacrylamide Gels by Invitrogen,
Carlsbad, CA, USA; Catalogue Number LC6070). Silver staining is based upon the
chemical reduction of silver ions to metallic silver on a protein band and is a sensitive
method of detecting most proteins, capable of picking up protein concentrations at sub-
nanogram levels and is 30-fold more sensitive than coomassie staining (Rabilloud et al.,
1994). Ultrapure water was used throughout and all incubations were performed on a rotary
shaker at a speed of 1 revolution/second at room temperature.
After gel electrophoresis, the gel was removed from the cassette and placed in a glass jar,
where it was rinsed with ultrapure water. The gel was subsequently fixed in 100 ml of
fixative for 20 minutes. The fixative was subsequently removed and the gel washed in 30 %
ethanol before that was also removed and 100 ml of sensitizing solution added for 10

Hepatic Mitochondrial Renin-Angiotensin Systems
James R A Skipworth 87
minutes. The sensitizing solution was removed and the gel washed again in 30 % ethanol for
10 minutes and then in 100 ml of ultrapure water for 10 minutes before being incubated in
100 ml of staining solution for 15 minutes. The staining solution was subsequently removed
and the gel washed with ultrapure water for one minute before being incubated in 100 ml of
developing solution for 4-8 minutes until the desired band intensity was achieved, at which
point 10 ml of stopper was added to the gel still immersed in developing solution and the
reaction incubated for 10 minutes. When the solution colour changed from pink to
colourless (indicating that the development reaction has ceased) all solution was removed
from the container and the gel washed in ultrapure water for 10 minutes.
M9. b. ii. Deglycosylation (For full protocol see:
http://www.sigmaaldrich.com/etc/medialib/docs/Sigma/Bulletin/pp0201bul.Par.0001.File.tm
p/pp0201bul.pdf)
Deglycosylation was performed using the Glycoprofile II Enzymatic In-Solution N-
Deglycosylation Kit (Sigma Aldrich, St. Louis, MI, USA; Cat No. PPO201). Glycosylation
is a common post-translational modification of proteins in eukaryotic cells, where such
glycoproteins are crucial for a number of biological functions. Human glycoproteins contain
one of three major types of oligosaccharide or glycan: N-linked, O-linked or
glycosylphosphatidylinositol lipid anchors, although variations in glycan structure and
degree of saturation of available glycosylation sites often results in considerable
heterogeneity in the mass and charge of glycoproteins. Removing a class of glycan aids in
the study of glycoproteins and removal of N-linked glycans in particular reduces the
heterogeneity of both mass and charge to assist in analysis by mass spectrometry. N-linked
glycans link to the protein backbone via amide bonds to asparagine residues (whereas, O-
linked attach to the hydroxyl group of serine or threonine), which can be broken by
enzymatic degradation utilizing peptide N-glycosidase F (PNGase F). The ensuing peptide
is left intact apart from the deamination of asparagine to aspartic acid at the site of the
attachment.
The RNase B Standard (90 µl of 1.1 mg / ml) was added to a siliconised Eppendorf tube and
5 µl of the denaturant Solution (2 % octyl β-D-glucopyranoside with 100 mM 2-

Hepatic Mitochondrial Renin-Angiotensin Systems
James R A Skipworth 88
mercaptoethanol) added and mixed briefly before incubation at 100 °C for 10 minutes. The
solution was allowed to cool to room temperature and gently spun briefly before 5 µl of (1
X) Reaction Buffer was added and the solution was mixed and spun again briefly
(glycoprotein concentration now 1 mg / ml). The solution was separated into two 50 µl
aliquots, one to act as a control and the other as the working mixture. Then 5 µl of PNGase
F Enzyme Solution (500 units / ml; 2.5 units of enzyme) was added to the working solution
and 5 µl of ultrapure water to the control sample, and the solutions spun briefly before
incubating at 37 °C overnight with 1000 µg of protein sample. The reaction was stopped by
heating the solution at 100 °C for 10 minutes, before the solution was allowed to cool to
room temperature and spun briefly in preparation for analysis.
M9. b. iii. Trypsin Digestion
(for full protocol see
http://www.sigmaaldrich.com/etc/medialib/docs/Sigma/Bulletin/pp0100bul.Par.0001.File.tm
p/pp0100bul.pdf)
Protein bands of interest were digested by the serine protease, trypsin, which hydrolyses
peptide bonds at the carboxyl side of arginine and lysine residues, resulting in a solution
containing highly specific cleavage sites and peptide fragments. Trypsin digestion was
performed using the Trypsin Profile IGD Kit (Sigma Aldrich, St. Louis, MI, USA; Cat No.
PPO100) and standard methodologies (Speicher et al., 2000, Sechi and Chait, 1998).
The band of interest was excised from a gel, using a razor blade, and placed in a siliconised
eppendorf tube using tweezers. The gel piece underwent destaining through twice adding
200 µl of Destaining Solution and incubating at 37 °C for 30 minutes. Each time, the
resulting solution was removed and discarded. The gel piece was subsequently dried in a
centrifugal evaporator (Savant Speed Vac; Thermoscientific, Waltham, MA, USA) for 30
minutes. 20 µl of trypsin solution (containing 0.4 ug of trypsin) and 50 µl of the Trypsin
Reaction Buffer was subsequently added to the gel piece and the solution incubated
overnight at 37 °C. The resultant solution, containing the extracted peptides was removed
from the eppendorf tube and transferred to a new siliconised eppendorf tube and delivered
for mass spectrometry as soon as possible.

Hepatic Mitochondrial Renin-Angiotensin Systems
James R A Skipworth 89
M9. c. Mass Spectrometry
Mass spectrometry was performed on a dual-source (MALDI and ESI (Electrospray
Ionisation)) time-of-flight mass spectrometer, by experienced technical staff, at one of two
centres: Institute of Child Health, University College London, London, UK or Taplin Mass
Spectrometry Facility, Harvard Medical School, Boston, USA.

Hepatic Mitochondrial Renin-Angiotensin Systems
James R A Skipworth 90
M10. Oxygen Consumption
M10. a. Principle
Clark electrodes measure oxygen on a catalytic platinum surface. The electrode is isolated
from the reaction chamber (containing cells or isolated mitochondria) by a thin membrane
permeable to molecular oxygen and allows oxygen to reach the cathode, where it is
electrolytically reduced. This electrolytic reduction allows a current to flow, which is
proportional to the O2 in the solution, provided that the solution is constantly stirred/mixed.
M10. b. Sample Preparation
Live cells (HeLa or HepG2) were grown in culture flasks in medium at 38 °C. A dilute
trypsin solution was added to the cells in the flask to separate them and the cells in
suspension placed in a plastic culture tube in ice. Cells in 50 µl of the solution were
subsequently manually counted under a light microscope to provide a representative number
for the whole solution and, following appropriate calculation, 2 million cells were added to
200 µl KRB and the solution gently mixed to provide an even suspension.
M10. c. Measurement of Mitochondrial Oxygen Consumption
The solution containing KRB and 2 million cells was placed within the chamber with a
magnetic stirrer and allowed to equilibrate at 38 °C for five minutes. The rate of oxygen
consumption was then set to 100 %, representing the baseline rate of oxygen consumption
utilizing endogenous substrates and ADP. The baseline rate was subsequently measured for
two minutes. Various reagent solutions (1 µM solutions) were subsequently added by
pipette, via a hole in the chamber lid, including angiotensin II, histamine, oligomycin and
FCCP, and the rate of oxygen consumption again measured for two minutes after addition of
each reagent. The average rate of oxygen consumption was subsequently calculated by pre-
installed computer software (LabChart 7 Reader; Dunedin, New Zealand) and expressed as
a change in oxygen consumption per minute, compared to a basal level of 100 % (therefore
0.02 equals decrease in oxygen consumption of 2 % per minute from basal rate).

Hepatic Mitochondrial Renin-Angiotensin Systems
James R A Skipworth 91
RESULTS 1:
PRESENCE OF RAS
COMPONENTS IN
HEPATIC
MITOCHONDRIA
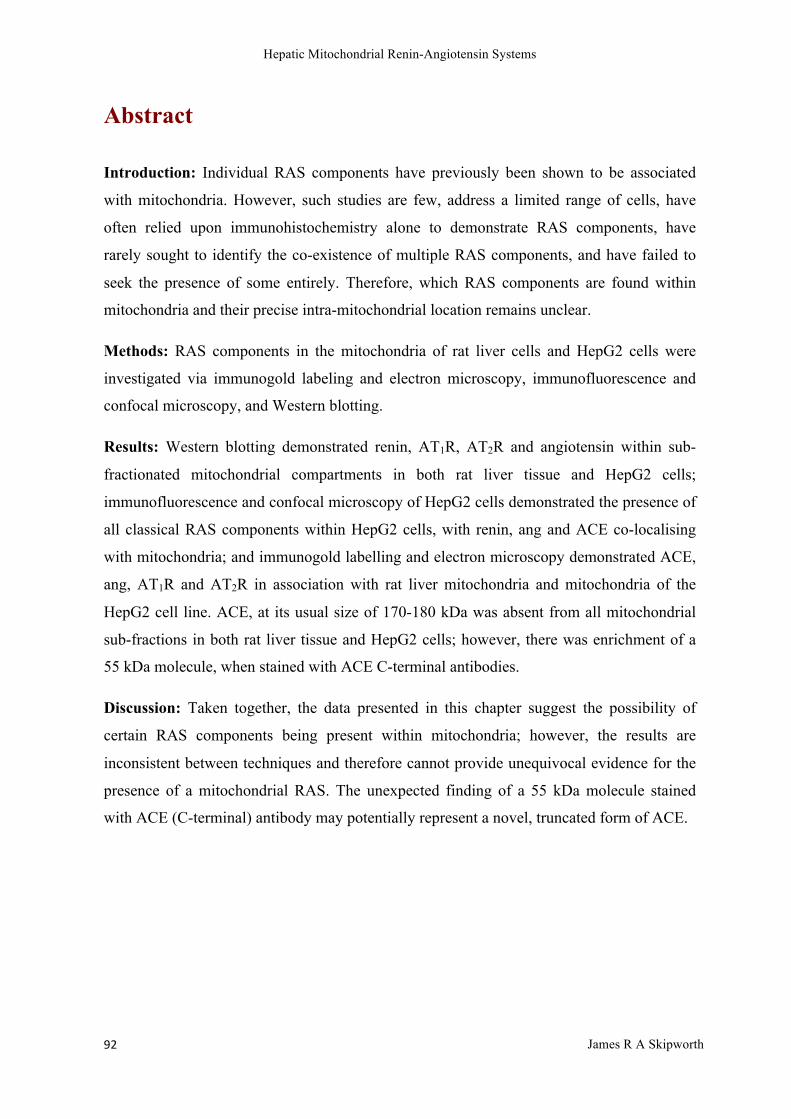
Hepatic Mitochondrial Renin-Angiotensin Systems
James R A Skipworth 92
Abstract
Introduction: Individual RAS components have previously been shown to be associated
with mitochondria. However, such studies are few, address a limited range of cells, have
often relied upon immunohistochemistry alone to demonstrate RAS components, have
rarely sought to identify the co-existence of multiple RAS components, and have failed to
seek the presence of some entirely. Therefore, which RAS components are found within
mitochondria and their precise intra-mitochondrial location remains unclear.
Methods: RAS components in the mitochondria of rat liver cells and HepG2 cells were
investigated via immunogold labeling and electron microscopy, immunofluorescence and
confocal microscopy, and Western blotting.
Results: Western blotting demonstrated renin, AT1R, AT2R and angiotensin within sub-
fractionated mitochondrial compartments in both rat liver tissue and HepG2 cells;
immunofluorescence and confocal microscopy of HepG2 cells demonstrated the presence of
all classical RAS components within HepG2 cells, with renin, ang and ACE co-localising
with mitochondria; and immunogold labelling and electron microscopy demonstrated ACE,
ang, AT1R and AT2R in association with rat liver mitochondria and mitochondria of the
HepG2 cell line. ACE, at its usual size of 170-180 kDa was absent from all mitochondrial
sub-fractions in both rat liver tissue and HepG2 cells; however, there was enrichment of a
55 kDa molecule, when stained with ACE C-terminal antibodies.
Discussion: Taken together, the data presented in this chapter suggest the possibility of
certain RAS components being present within mitochondria; however, the results are
inconsistent between techniques and therefore cannot provide unequivocal evidence for the
presence of a mitochondrial RAS. The unexpected finding of a 55 kDa molecule stained
with ACE (C-terminal) antibody may potentially represent a novel, truncated form of ACE.

Hepatic Mitochondrial Renin-Angiotensin Systems
James R A Skipworth 93
R1.1 Introduction
Individual RAS components have been shown to be associated with mitochondria (for full
discussion see ‘I3: RAS & Mitochondria’; page 30). However, such studies are few, address
a limited range of cells, have often relied upon immunohistochemistry alone to demonstrate
RAS components, have rarely sought to identify the co-existence of multiple RAS
components, and have failed to seek the presence of some entirely. Indeed, the reliance on
one antibody in each of the above studies renders the authors interpretations open to
significant criticism. Further, results may be explained by non-specific binding (e.g.
Erdmann et al., 1996) and criticised for the lack of consistency in the authors’ choice of
cells and tissues (e.g. Abadir et al., 2011). Therefore, which RAS components are found
within mitochondria and their precise intra-mitochondrial location requires further
elucidation.
In an attempt to circumvent the above issues, the presence of all major RAS components
were sought in the mitochondria of rat liver cells and HepG2 cells using immunogold
labeling and electron microscopy, immunofluorescence and confocal microscopy, and
Western blotting. Thus, a variety of techniques, as well as tissues and cell-lines, were
utilised to provide an overall, robust assessment of whether RAS components were actually
present within hepatic mitochondria. Both tissues and cell-lines were utilised to overcome
the drawbacks of using one or other alone. Liver cell lines and tissue were utilised (as
opposed to tissue or cell-lines derived from other body areas) due to the high density of
mitochondria within hepatocytes and the subsequent high mitochondrial yield on subcellular
fractionation.

Hepatic Mitochondrial Renin-Angiotensin Systems
James R A Skipworth 94
R1.2 Methods
R1.2.a. Western Blotting
Western blotting was performed following subcellular fractionation and percoll density
gradient separation of subcellular components (including ‘pure’ mitochondria) of whole
tissues (rat liver) and cell cultures (HepG2 cells). Lower volumes and protein concentrations
were generally achieved following fractionation of cell-lines (as opposed to tissue), typically
yielding poorer quality results. The purity of each subcellular compartment was confirmed
following subcellular fractionation and percoll density gradient separation utilising
antibodies to various known cellular components. Antibodies from various well-known
manufacturers were utilised to allow comparison of staining accuracy during assessment of
RAS components (for further information see Appendix Tables APP2. a. and APP2. b.,
pages 216-220). Each experiment was performed at least three times to ensure consistency
of results.
R1.2.b. Imunofluorescence & Confocal Microscopy
HepG2 cells underwent processing and fixation, prior to antibody staining for
immunofluorescence, utilising techniques already described (for further information see
‘M5. Immunofluorescence’; page 76). Whole cells were incubated with primary antibodies
to RAS components and known mitochondrial proteins, prior to incubating with fluorescent
secondary antibodies and imaging on a confocal microscope.
Mitochondria were labelled using primary antibodies to ATP5b (the beta subunit of the F1
catalytic core located within the mitochondrial matrix), and Alexa Fluor (fluorescent green)
secondary antibodies. Nuclei were labelled with Hoechst 33258, which emits a blue
fluorescent light once excited by ultraviolet light. RAS components were similarly stained
with secondary antibodies labelled with Alexa Fluor (for further information see Appendix
Tables APP2. a. and APP2. b., pages 216-220).

Hepatic Mitochondrial Renin-Angiotensin Systems
James R A Skipworth 95
R1.2.c. Immunogold Labelling & Electron Microscopy
Rat liver samples were processed utilising the LR white protocol and immunogold labelled
by incubation with primary antibodies to RAS components and their requisite secondary
antibodies (for further information see Appendix Tables APP2. a. and APP2. b., pages 216-
220) before imaging via electron microscopy. High-quality electron microscopy was
performed at the Electron Microscopy unit of the Royal Free Hospital (UCL Medical
School, London), utilising freshly dissected rat liver tissue or trypsinised HepG2 cells.
Santa Cruz Biotechnology (Dallas, Texas, USA) primary antibodies were again utilised for
ease of comparison with other experimental techniques and were used at manufacturer’s
recommended concentrations (see Appendix Tables APP2. a. and APP2. b., pages 216-220).
Each experiment was performed at least three times to ensure consistency of results.

Hepatic Mitochondrial Renin-Angiotensin Systems
James R A Skipworth 96
R1.3 Results
R1.3. a. Western Blotting
R1.3. a.i. Controls: Confirmation of purity of sub-cellular isolates
Mitochondrial isolation was performed utilising standardised and recognised techniques (for
further information see ‘M3. Cellular Sub-Fractionation & Mitochondrial Isolation’; page
68). Following each individual sub-fractionation, success of the process was confirmed
using Western blotting and clear demonstration of well-established mitochondrial markers
such as VDAC (voltage-dependent anion channel), a 280 amino acid porin ion channel
located on the outer mitochondrial membrane (Shoshan-Barmatz et al., 2010); grp75
(glucose-regulated protein 75; mortalin), a member of the hsp70 family of chaperone/stress
proteins located within the mitochondrial matrix (Lindquist, 1986); and COX-4, a crucial
component of the last enzyme in the electron transport chain (cytochrome c oxidase,
complex IV), located within the inner mitochondrial membrane (Bottinger et al., 2013).
Primary antibodies were sourced from a variety of different manufacturers and utilized at
manufacturers’ recommended concentrations (see Appendix Tables APP2. a. and APP2. b.,
pages 216-220). Antibodies to multiple cellular comppnents were utilized as a positive
control to ensure the accuracy of subcellular fractionation and as the results below
illustrated, mitochondrial markers were enriched in mitochondrial sub-fractions,
demonstrating that the purity and accuracy of mitochondrial isolation was satisfactory (see
Figure R1.1).
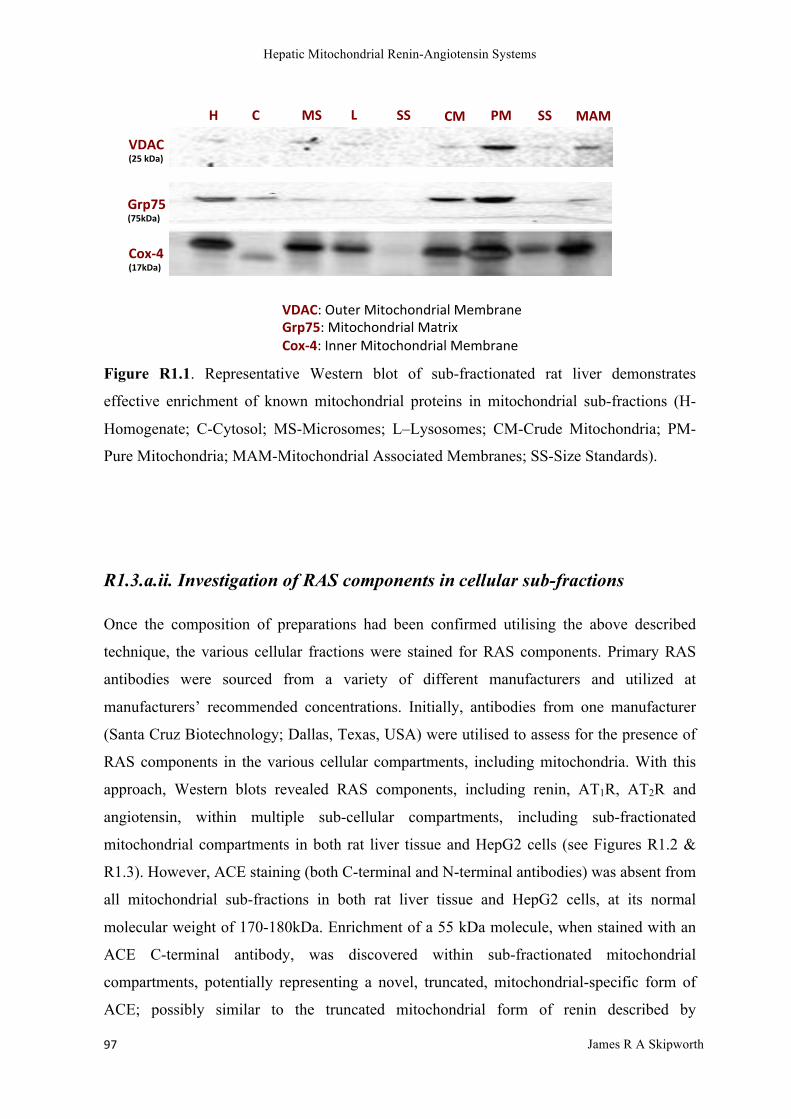
Hepatic Mitochondrial Renin-Angiotensin Systems
James R A Skipworth 97
Figure R1.1. Representative Western blot of sub-fractionated rat liver demonstrates
effective enrichment of known mitochondrial proteins in mitochondrial sub-fractions (H-
Homogenate; C-Cytosol; MS-Microsomes; L–Lysosomes; CM-Crude Mitochondria; PM-
Pure Mitochondria; MAM-Mitochondrial Associated Membranes; SS-Size Standards).
R1.3.a.ii. Investigation of RAS components in cellular sub-fractions
Once the composition of preparations had been confirmed utilising the above described
technique, the various cellular fractions were stained for RAS components. Primary RAS
antibodies were sourced from a variety of different manufacturers and utilized at
manufacturers’ recommended concentrations. Initially, antibodies from one manufacturer
(Santa Cruz Biotechnology; Dallas, Texas, USA) were utilised to assess for the presence of
RAS components in the various cellular compartments, including mitochondria. With this
approach, Western blots revealed RAS components, including renin, AT1R, AT2R and
angiotensin, within multiple sub-cellular compartments, including sub-fractionated
mitochondrial compartments in both rat liver tissue and HepG2 cells (see Figures R1.2 &
R1.3). However, ACE staining (both C-terminal and N-terminal antibodies) was absent from
all mitochondrial sub-fractions in both rat liver tissue and HepG2 cells, at its normal
molecular weight of 170-180kDa. Enrichment of a 55 kDa molecule, when stained with an
ACE C-terminal antibody, was discovered within sub-fractionated mitochondrial
compartments, potentially representing a novel, truncated, mitochondrial-specific form of
ACE; possibly similar to the truncated mitochondrial form of renin described by
!"#$%&&'$%()*+&
,)-.&'/%&()*+&
0& .& 12& 3& .1& 41& 1-1&
,)-.!"#$%&'"()%*+,*-.')/0"(&12'/-&"!"#$%!"()%*+,*-.')/0"(/%')3&.5678!"4--&'"()%*+,*-.')/0"(&12'/-&"
!!
.5678&'9$()*+&
22& 22&

Hepatic Mitochondrial Renin-Angiotensin Systems
James R A Skipworth 98
Clausmeyer et al (1999 and 2000). All findings were confirmed in at least three independent
preparations.
Figure R1.2. Representative Western blot of sub-fractionated rat liver tissue demonstrates
staining for renin, angiotensin and AT1R (rabbit polyclonal antibody) in a pure
mitochondrial sub-fraction, renin, AT1R and AT2R staining in a crude mitochondrial
fraction and AT1R in a mitochondrial-associated membranes sub-fraction when Santa Cruz
Biotechnology (Dallas, Texas, USA) antibodies are utilised. No consistent staining was seen
for ACE (C-terminal) in either crude or pure mitochondrial fractions at its usual size of 180
kDa (H-Homogenate; N-Nucleus; C-Cytosol; MS-Microsomes; L–Lysosomes; CM-Crude
Mitochondria; PM-Pure Mitochondria; MAM-Mitochondrial Associated Membranes).
!" #$" $%$"&$"'" ("&" $)"
%&*"+,-./012!
34565"+7./012"
%8,3"+7./012"!
%596:;45<65"+=./012!
%8>3"+77/012!

Hepatic Mitochondrial Renin-Angiotensin Systems
James R A Skipworth 99
Figure R1.3. Representative Western blot of sub-fractionated HepG2 cells demonstrates
renin, angiotensin, AT1R (rabbit polyclonal) and AT2R staining in crude and pure
mitochondrial sub-fractions, when Santa Cruz Biotechnology (Dallas, Texas, USA)
antibodies are utilised. No consistent staining was seen for ACE (C-terminal) in either crude
or pure mitochondrial fractions (H-Homogenate; N-Nucleus; CM-Crude Mitochondria; PM-
Pure Mitochondria).
R1.3. a.iii. Controls: Comparison of antibodies from different manufacturers
To assess the validity of an approach that utilises only one antibody, two antibodies were
employed on a single, whole PVDF membrane (to assess non-specific bands, rather than just
focussing on the molecular weight of interest) to compare results for each RAS component.
As demonstrated below, inconsistent results were found following comparison (see Figures
R1.4-R1.12).
Renin Western blots yielded very different results between the two antibodies utilised, with
one preparation suggesting renin within a pure mitochondrial fraction, and one
demonstrating a lack of mitochondrial renin. Similarly, AT1R blots demonstrated
contrasting results when two preparations from the same manufacturer were utilised, with
!"#$%&'()*+,%
!-./012-3/-%&4()*+,%
$2-/-%&'()*+,%
!56%%()*+,%%
!"8$%%&'')*+,%
9:%5:%%;% %<%

Hepatic Mitochondrial Renin-Angiotensin Systems
James R A Skipworth 100
one antibody demonstrating AT1R staining in CM, PM and MAM fractions, and another
showing weak CM staining and no staining in PM or MAM fractions. However, AT2R
antibody use demonstrated the most consistent results, with both preparations demonstrating
a CM band but no staining in PM or MAM fractions.
Ang antibodies from different manufacturers also demonstrated inconsistent results when
applied to the same preparation; however, due to close molecular similarities between
angiotensins and angiotensinogen, both antibodies are described by the manufacturers as
binding to multiple angiotensin proteins including angiotensinogen, angiotensinogen
precursor, ang I, ang II and ang III, potentially explaining the presence of multiple bands at
various molecular weights.
As with the other RAS components, two initial ACE antibodies from the same manufacturer
(one to the C-terminal and one to the N-terminal of the ACE molecule) were utilised to
compare their similarity. Both antibodies demonstrated consistent staining at 170-195 kDa
(usual ACE molecular weight) in homogenate and nuclear fractions. However, the C-
terminal antibody also demonstrated an enriched 55 kDa band in crude and pure
mitochondria, and mitochondrial-associated membrane sub-fractions. Two further ACE
antibodies were therefore employed to further investigate this finding, with a C-terminal
antibody from an alternate manufacturer delivering similar results with a 170 kDa molecule
stained in the homogenate and nuclear fractions and a 55 kDa band in the CM fraction;
whereas, an N-terminal antibody from an alternate manufacturer demonstrated multiple non-
specific bands only.
Thus, most antibodies demonstrated multiple non-specific bands, casting doubt as to
whether the bands representative of the sought molecular sizes actually represented the
target molecule. Similarly, antibodies from different manufacturers, or of different
preparations from the same manufacturer, tended to yield different results, and such lack of
antibody specificity casts doubt on the validity of previously published findings and
demonstrates the limitations of such molecular techniques.

Hepatic Mitochondrial Renin-Angiotensin Systems
James R A Skipworth 101
Renin Preparations
Figure R1.4. Representative whole Western blots of sub-fractionated rat liver tissue
demonstrate inconsistent results when the same preparation was stained with renin antibody
from different manufacturers (Santa Cruz Biotechnology (38-46 kDa) (Dallas, Texas, USA)
and Atlas Antibodies (40 kDa) (Stockholm, Sweden)). The Santa Cruz antibodies suggest
the presence of renin within a pure mitochondrial fraction, whereas the Atlas Antibodies
preparation demonstrates a lack of renin staining within mitochondrial fractions and a large
amount of non-specific bands at multiple molecular weights (H-Homogenate; N-Nucleus;
C-Cytosol; MS-Microsomes; L–Lysosomes; CM-Crude Mitochondria; PM-Pure
Mitochondria; MAM-Mitochondrial Associated Membranes).
Santa Cruz Biotechnology Atlas Antibodies
25
37
50
75
100
150
25
37
50
75
100
150
H N C L MS CM PM MAM H N C L MS CM PM MAM
38-46 40
Molecular Weight (kDa!"
Molecular Weight (kDa!"

Hepatic Mitochondrial Renin-Angiotensin Systems
James R A Skipworth 102
ACE Preparations
Figure R1.5. Representative Western blot of sub-fractionated rat liver tissue demonstrates
consistent ACE staining at 180 kDa in the homogenate and nuclear fractions when an ACE
(C-terminal) Santa Cruz Biotechnology (Dallas, Texas, USA) antibody was utilised. An
enriched 55 kDa band in crude and pure mitochondria, and mitochondrial-associated
membrane sub-fractions is also identified (H-Homogenate; N-Nucleus; C-Cytosol; MS-
Microsomes; L–Lysosomes; CM-Crude Mitochondria; PM-Pure Mitochondria; MAM-
Mitochondrial Associated Membranes).
Figure R1.6. Repeat Western blot, utilising the same preparations and technique, but an
enriched sub-fraction of rat liver tissue, again demonstrates ACE staining at both 180 kDa
and 55 kDa in a crude mitochondrial sub-fraction when an ACE (C-terminal) Santa Cruz
Biotechnology Dallas, Texas, USA) antibody was employed (H-Homogenate; CM-Crude
Mitochondria).
!!"#$%
&!'%"#$%
(!'%"#$%
&''%"#$%
)!%"#$%
!'%"#$%
('%"#$%
&'%"#$%&!%"#$%*+,-.%
%%//%%%%%%0%%%%%%1%%%%%*%%%%%%%2%%%%%3/%%*3%%%43%353%%353%
5*6%
&7'"#$%
H CM
!"#$%&'$
(($%&'$
)*+$
,&)*$ -($%&'$

Hepatic Mitochondrial Renin-Angiotensin Systems
James R A Skipworth 103
Figure R1.7. Representative Western blot of sub-cellular fractions from HepG2 cells
demonstrates ACE staining in the homogenate at 180 kDa and at 55 kDa in both crude and
pure mitochondrial sub-fractions when an ACE (C-terminal) Santa Cruz Biotechnology
(Dallas, Texas, USA) antibody was used (H-Homogenate; N-Nucleus; CM-Crude
Mitochondria; PM-Pure Mitochondria).
Figure R1.8. Representative whole Western blot of sub-cellular fractions of rat liver tissue
demonstrates consistent ACE staining at 195 kDa in the homogenate and nuclear fractions,
but a less convincing 55 kDa band in mitochondrial sub-fractions when an ACE (N-
terminal) Santa Cruz Biotechnology (Dallas, Texas, USA) antibody was utilised (H-
Homogenate; N-Nucleus; C-Cytosol; MS-Microsomes; L–Lysosomes; CM-Crude
Mitochondria; PM-Pure Mitochondria; MAM-Mitochondrial Associated Membranes).
H N CM PM
!"#$!%&&'()*!
"#$!%+,-'()*!!
!!"#$%
&!'%"#$%
(!'%"#$%
&''%"#$%
)!%"#$%
!'%"#$%
%%%%*%%%%%%%%%%%+%%%%%%%%%,%%%%%%%%%%%%-%%%%%%%%%./%%%%%%,.%%%%0.%%%%%%.1.%
1,2%%3+456789:$;<%3&=!"#$<%
&=!"#$%

Hepatic Mitochondrial Renin-Angiotensin Systems
James R A Skipworth 104
Figure R1.9. Representative whole Western blots of sub-fractionated rat liver tissue
demonstrate inconsistent results when the same preparation was stained with ACE antibody
from different manufacturers (Millipore (170-180 kDa) (Billerica, MA, USA) and Abcam
(170 kDa) (Cambridge, UK)). The C-terminal Abcam antibody delivers similar results to the
Santa Cruz C-terminal antibody, with staining for 170 kDa ACE in the homogenate and
nuclear sub-fraction and 55 kDa staining in a crude mitochondrial fraction. The Millipore
9B9 clone antibody is directed to the N-terminal and provides a result with multiple non-
specific bands at various molecular weights (H-Homogenate; N-Nucleus; C-Cytosol; MS-
Microsomes; L–Lysosomes; CM-Crude Mitochondria; PM-Pure Mitochondria; MAM-
Mitochondrial Associated Membranes).
Abcam Millipore
25
37 50
75
100
150
25
37 50
75 100 150
H N C L MS CM PM MAM H N C L MS CM PM MAM
Molecular Weight (kDa!"
170-180 170
Molecular Weight (kDa!"
55
55

Hepatic Mitochondrial Renin-Angiotensin Systems
James R A Skipworth 105
Angiotensin Preparations
Figure R1.10. Representative whole Western blots of sub-fractionated rat liver tissue
demonstrate inconsistent results when the same preparation was stained with angiotensin
antibody from different manufacturers (Santa Cruz Biotechnology (Dallas, Texas, USA) and
LS Bio (Seattle, WA, USA)). Due to the nature of the close molecular structure of
angiotensins and angiotensinogen, both antibodies are described by the manufacturers as
binding to multiple angiotensin proteins including angiotensinogen, angiotensinogen
precursor, ang I, ang II and ang III; it may therefore be in keeping that multiple bands at
various molecular weights are identified. The Santa Cruz antibody datasheet
(http://datasheets.scbt.com/sc-7419.pdf)) describes an angiotensin of 60 kDa molecular
weight stained with their antibody; whereas, the LSBio data sheet is less specific, describing
instead that multiple molecular weights may be identified with the use of their antibody
(http://www.lsbio.com/Documents/PDF/Antibodies/51294) (H-Homogenate; N-Nucleus; C-
Cytosol; MS-Microsomes; L–Lysosomes; CM-Crude Mitochondria; PM-Pure
Mitochondria; MAM-Mitochondrial Associated Membranes).
LSBio Santa Cruz Biotechnology
25
37
50
75
100
150
25
37
50
75
100
150
H N C L MS CM PM MAM H N C L MS CM PM MAM
Molecular Weight (kDa!"
60 60
Molecular Weight (kDa!"
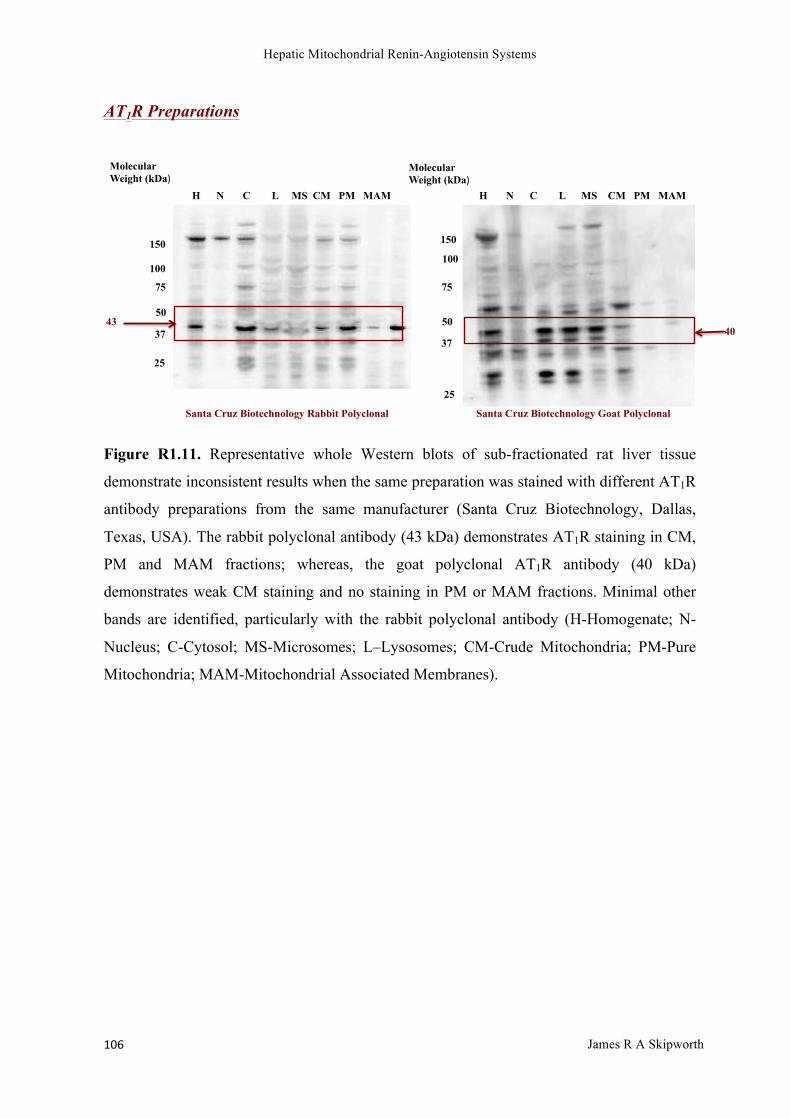
Hepatic Mitochondrial Renin-Angiotensin Systems
James R A Skipworth 106
AT1R Preparations
Figure R1.11. Representative whole Western blots of sub-fractionated rat liver tissue
demonstrate inconsistent results when the same preparation was stained with different AT1R
antibody preparations from the same manufacturer (Santa Cruz Biotechnology, Dallas,
Texas, USA). The rabbit polyclonal antibody (43 kDa) demonstrates AT1R staining in CM,
PM and MAM fractions; whereas, the goat polyclonal AT1R antibody (40 kDa)
demonstrates weak CM staining and no staining in PM or MAM fractions. Minimal other
bands are identified, particularly with the rabbit polyclonal antibody (H-Homogenate; N-
Nucleus; C-Cytosol; MS-Microsomes; L–Lysosomes; CM-Crude Mitochondria; PM-Pure
Mitochondria; MAM-Mitochondrial Associated Membranes).
Santa Cruz Biotechnology Goat Polyclonal Santa Cruz Biotechnology Rabbit Polyclonal
25
37
50
75
100
150
25
37
50
75
100
150
H N C L MS CM PM MAM H N C L MS CM PM MAM
Molecular Weight (kDa!""""
43 40
Molecular Weight (kDa!"

Hepatic Mitochondrial Renin-Angiotensin Systems
James R A Skipworth 107
AT2R Preparations
Figure R1.12. Representative whole Western blots of sub-fractionated rat liver tissue
demonstrate consistent results when the same preparation was stained with AT2R antibody
from different manufacturers (Abcam (44 kDa) (Cambridge, UK) and Santa Cruz
Biotechnology (44 kDa) (Dallas, Texas, USA)). Both antibodies demonstrate a weak CM
band but no staining in PM or MAM fractions (H-Homogenate; N-Nucleus; C-Cytosol; MS-
Microsomes; L–Lysosomes; CM-Crude Mitochondria; PM-Pure Mitochondria; MAM-
Mitochondrial Associated Membranes).
Abcam Santa Cruz Biotechnology 25
37
50
75
100
150
25
37
50
75
100
150
H N C L MS CM PM MAM H N C L MS CM PM MAM
Molecular Weight (kDa!"
44 44
Molecular Weight (kDa!"

Hepatic Mitochondrial Renin-Angiotensin Systems
James R A Skipworth 108
R1.3. b. Immunofluorecence & Confocal Microscopy
R1.3. b.i. Controls: Immunofluorescence of known cellular proteins Clear, specific immunofluorescence of both mitochondria and nuclei was observed utilising
antibodies to ATP5b and Hoechst 33258 respectively, demonstrating that cellular fixation
and processing was sufficient to allow immunofluorescence without destroying intracellular
proteins (see Figure R1.13).
Santa Cruz Biotechnology primary RAS antibodies were utilised to provide consistency
with Western blot results. Primary and secondary antibodies were utilized at manufacturers
recommended concentrations (see Appendix Tables APP2.a. and APP2.b., pages 216-220).
Figure R1.13. The use of Hoechst 33258 antibody (blue immunofluorescence) and ATP5b
primary antibody with Cy2 green secondary antibody demonstrates clear blue nuclear
immunofluorescence and clear green mitochondrial immunofluorescence within HepG2
cells, thus demonstrating the maintenance of structural integrity of mitochondrial proteins,
with this processing and fixation technique.
Blue fluorescent staining secondary to Hoescht 33258 binding to DNA
Green, fibrillar mitochondrial staining secondary to ATP5b and secondary antibody binding
ATP5b/Cy2 Green (10µm)
Cy2 Green (50µm) Hoescht (50µm)
Overlay (50µm)

Hepatic Mitochondrial Renin-Angiotensin Systems
James R A Skipworth 109
R1.3. b.ii. Immunofluorescence of intra-cellular RAS components
Immunofluorescence of RAS components was performed in conjunction with ATP5b and
Hoechst 33258 to observe for the presence of RAS components and any co-localisation with
mitochondrial (ATP5b) or nuclear (DNA) contents. A fluorescent signal following labelling
was present for all classical RAS components (e.g. renin, ACE, ang, AT1R and AT2R)
within HepG2 cells (see Figures R1.14-R1.18). Further, renin, ang and ACE appeared to co-
localise with mitochondria, although there was no obvious co-localisation within
mitochondria when antibodies to AT1R and AT2R were utilised. The presence of minimal
non-specific immunofluorescence was confirmed by performing negative controls with
primary antibody and secondary antibody alone (see Figures R1.19-R1.20).
However, the staining identified with these antibodies and this technique could be described
as relatively non-specific, having no particular pattern of staining. This may suggest that
significant non-specific primary antibody binding is present, a hypothesis that concurs with
the fact that multiple non-specific bands were seen when these antibodies were utilised for
Western blotting of sub-fractionated rat liver tissue. Alternatively, these findings may
simply reflect the fact that many of the RAS components under investigation are ubiquitous
throughout multiple cellular compartments.

Hepatic Mitochondrial Renin-Angiotensin Systems
James R A Skipworth 110
Figure R1.14. Image of representative staining with renin primary antibody and
AlexaFluor® secondary antibody (red immunofluorescence), in conjunction with ATP5b
(green immunofluorescence) and Hoechst 33258 (blue immunofluorescence) demonstrates
renin within HepG2 cells, where it co-localises with both nuclei and mitochondria.
Figure R1.15. Image of representative staining with ACE primary antibody and
AlexaFluor® secondary antibody (red immunofluorescence), in conjunction with ATP5b
(green immunofluorescence) and Hoechst 33258 (blue immunofluorescence) staining,
demonstrates ubiquitous ACE immunofluorescence within nuclei and some co-localisation
with mitochondria. ACE is also demonstrated at the periphery of the cell.
Mitochondria (Green)
Nucleus (Blue) Renin (Red)
25µm
Mitochondria (Green)
Nucleus (Blue) ACE (Red)
30µm

Hepatic Mitochondrial Renin-Angiotensin Systems
James R A Skipworth 111
Figure R1.16. Image of representative staining with angiotensin primary antibody and
AlexaFluor® secondary antibody (red immunofluorescence), in conjunction with ATP5b
(green immunofluorescence) and Hoechst 33258 (blue immunofluorescence) staining,
demonstrates ubiquitous angiotensin immunofluorescence within HepG2 cells, with co-
localisation in both nuclei and mitochondria.
Figure R1.17. Image of representative staining with AT1R primary antibody and
AlexaFluor® secondary antibody (red immunofluorescence), in conjunction with ATP5b
(green immunofluorescence) and Hoechst 33258 (blue immunofluorescence) staining,
demonstrates AT1R immunofluorescence largely within the nuclei of HepG2 cells, with
minimal co-localisation within the mitochondria.
Mitochondria (Green)
Nucleus (Blue)
Ang (Red)
50µm
Mitochondria (Green)
Nucleus (Blue)
AT1R (Red)
50µm

Hepatic Mitochondrial Renin-Angiotensin Systems
James R A Skipworth 112
Figure R1.18. Image of representative staining with AT2R primary antibody and
AlexaFluor® secondary antibody (red immunofluorescence), in conjunction with ATP5b
(green immunofluorescence) and Hoechst 33258 (blue immunofluorescence) staining, again
demonstrates AT2R immunofluorescence within the nuclei of HepG2 cells, with minimal
co-localisation with mitochondria.
Figure R1.19. Representative negative control image utilising ACE primary antibody alone
and Hoechst 33258 (blue immunofluorescence) demonstrates minimal non-specific red
immunofluorescence. Similar results were demonstrated when other RAS component
primary antibodies were utilised.
Mitochondria (Green)
Nucleus (Blue)
AT2R (Red)
50µm
Nucleus (Blue)
Non-specific red immunofluorescence
50µm
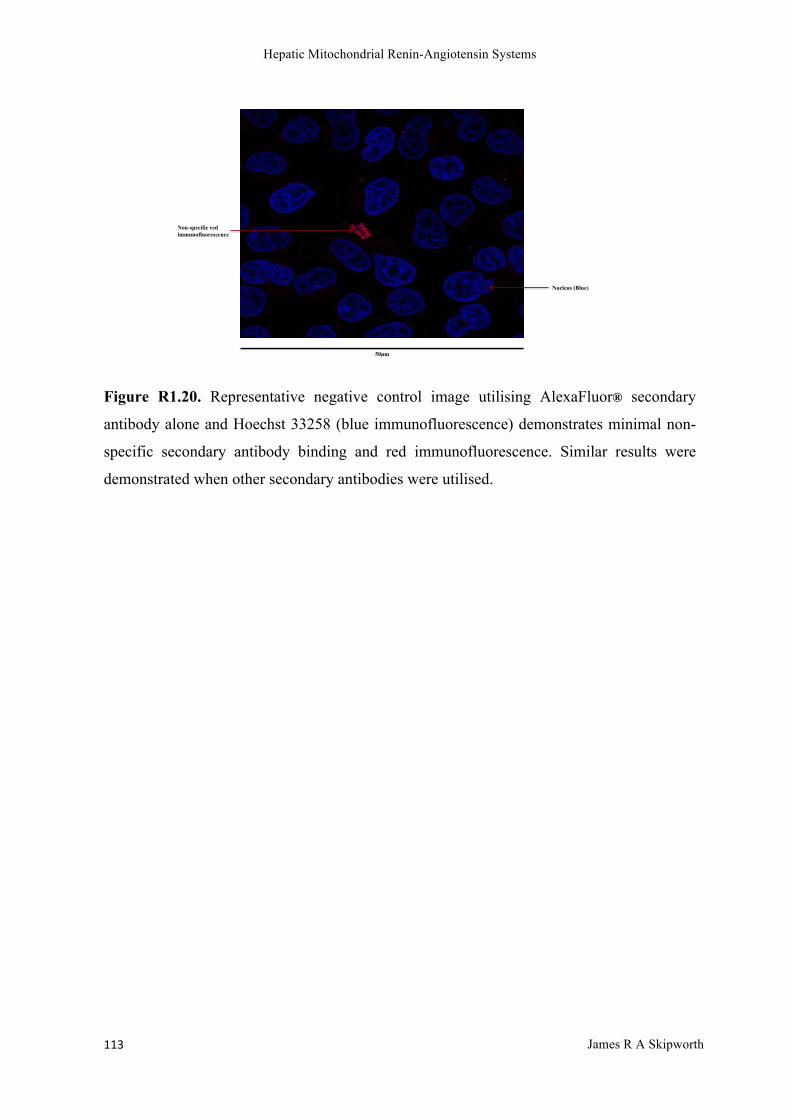
Hepatic Mitochondrial Renin-Angiotensin Systems
James R A Skipworth 113
Figure R1.20. Representative negative control image utilising AlexaFluor® secondary
antibody alone and Hoechst 33258 (blue immunofluorescence) demonstrates minimal non-
specific secondary antibody binding and red immunofluorescence. Similar results were
demonstrated when other secondary antibodies were utilised.
Nucleus (Blue)
Non-specific red immunofluorescence
50µm

Hepatic Mitochondrial Renin-Angiotensin Systems
James R A Skipworth 114
R1.3. c. Immunogold Labelling & Electron Microscopy
R1.3. c.i. Electron microscopy of RAS components in HepG2 cells Using immunogold labeling and electron microscop1, ACE was shown to be associated with
the mitochondria of HepG2 cells (see Figures R1.21-R1.27). Staining also visible elsewhere
within the cell might be non-specific, or might simply reflect a ubiquitous distribution for
ACE.
Figure R1.21. Representative control images of HepG2 cells with primary or secondary
antibody only, demonstrate little or no non-specific staining following electron
microscopy (5600-40,000 x magnification). Upper Left Image: overall view of
hepatocyte; Upper Right Image: close up of hepatocyte, demonstrating large vacuole
and multiple mitochondria; Bottom Images: closer inspection of mitochondria,
demonstrating multiple cristae.
Mitochondria
Cytoplasm
Cell Membrane
Mitochondria
Mitochondria
Vacuole

Hepatic Mitochondrial Renin-Angiotensin Systems
James R A Skipworth 115
Figure R1.22. Renin immunogold labelling of HepG2 cells with renin antibody and
appropriate secondary antibody demonstrates minimal renin presence (black dots) in
association with mitochondria (both images 31,000 x magnification). In fact, only one
immunogold particle is identified within mitochondria and very little staining is identified
throughout the cell.
Figure R1.23. ACE immunogold labelling of HepG2 cells with ACE (C-terminal) antibody
and appropriate secondary antibody demonstrates the presence of ACE (black dots) in
association with mitochondria (3400-53,000 x magnification). Further staining can also be
identified throughout the cell, as might be expected from a ubiquitous molecule. Upper Left
Image: overall view of hepatocytes; Upper Right Image: close up of cell membrane; Bottom
Images: closer inspection of mitochondria.
Mitochondria Cytoplasm
Mitochondria Renin
Mitochondria
Cytoplasm
Cell Membrane
Mitochondria
Mitochondria
Blebbing occurring at the cell membrane

Hepatic Mitochondrial Renin-Angiotensin Systems
James R A Skipworth 116
Figure R1.24. ACE immunogold labelling of HepG2 cells with ACE (C-terminal) antibody
and appropriate secondary antibody demonstrates the presence of ACE (black dots) in
association with mitochondria (53,000 x magnification). Further staining can be identified
throughout the cell, as might be expected from a ubiquitous molecule.
Figure R1.25. Ang immunogold labelling of HepG2 cells with ang antibody and
appropriate secondary antibody demonstrates the presence of ang (black dots) in association
with mitochondria (31,000 x magnification). Further staining can be identified throughout
the cell, as might be expected from a ubiquitous molecule.
Mitochondria
Cristae
ACE outside mitochondria
ACE within mitochondria
Mitochondria Ang
Mitochondria

Hepatic Mitochondrial Renin-Angiotensin Systems
James R A Skipworth 117
Figure R1.26. AT1R immunogold labelling of HepG2 cells with AT1R antibody and
appropriate secondary antibody demonstrates the presence of AT1R (black dots) in
association with mitochondria (31,000 x magnification). Further staining can be identified
throughout the cell, as might be expected from a ubiquitous molecule.
Figure R1.27. AT2R immunogold labeling of HepG2 cells with AT2R antibody and
appropriate secondary antibody demonstrates the presence of AT2R (black dots) in
association with mitochondria (31,000 x magnification). Further staining can be identified
throughout the cell, as might be expected from a ubiquitous molecule.
Mitochondria
Mitochondria AT1R
Mitochondria Cytoplasm
Mitochondria AT2R

Hepatic Mitochondrial Renin-Angiotensin Systems
James R A Skipworth 118
R1.3.c.ii. Electron microscopy of RAS components in rat liver tissue Using immunogold labeling and electron microscopy, ACE was shown to be associated with
the mitochondria of rat liver tissue (see Figures R1.28-R1.33). Staining also visible
elsewhere within the cell might be non-specific, or might simply reflect a ubiquitous
distribution of ACE.
Figure R1.28. Representative control images of rat liver tissue sections with primary or
secondary antibody only demonstrate little or no non-specific staining following electron
microscopy (3400-31,000 x magnification). Upper Left Image: overall view of hepatocyte;
Upper Right Image: close up of nucleus; Bottom Images: closer inspection of mitochondria.
Mitochondria
Nucleus
Cell Membrane
Mitochondria
Nucleolus
Cytoplasm containing multiple vacuoles
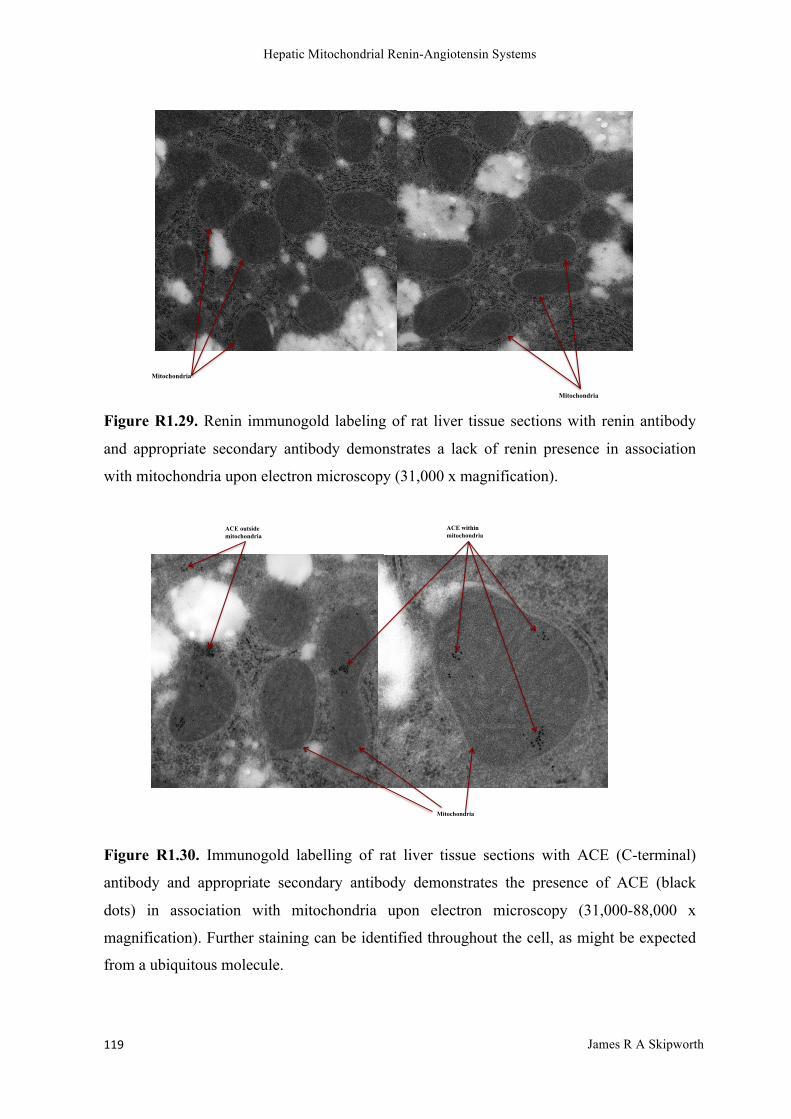
Hepatic Mitochondrial Renin-Angiotensin Systems
James R A Skipworth 119
Figure R1.29. Renin immunogold labeling of rat liver tissue sections with renin antibody
and appropriate secondary antibody demonstrates a lack of renin presence in association
with mitochondria upon electron microscopy (31,000 x magnification).
Figure R1.30. Immunogold labelling of rat liver tissue sections with ACE (C-terminal)
antibody and appropriate secondary antibody demonstrates the presence of ACE (black
dots) in association with mitochondria upon electron microscopy (31,000-88,000 x
magnification). Further staining can be identified throughout the cell, as might be expected
from a ubiquitous molecule.
Mitochondria
Mitochondria
ACE outside mitochondria
ACE within mitochondria
Mitochondria

Hepatic Mitochondrial Renin-Angiotensin Systems
James R A Skipworth 120
Figure R1.31. Immunogold labeling of rat liver tissue sections with ang antibody and
appropriate secondary antibody demonstrates the presence of ang (seen here as black dots)
in association with mitochondria upon electron microscopy (31,000 x magnification).
However, further staining can also be identified throughout the cell, as might be expected
from a ubiquitous molecule.
Figure R1.32. Immunogold labeling of rat liver tissue sections with AT1R antibody and
appropriate secondary antibody demonstrates the presence of AT1R (seen here as black dots)
in association with mitochondria upon electron microscopy (31,000 x magnification).
Further staining can also be identified throughout the cell.
Mitochondria Ang
Mitochondria
Mitochondria AT1R
Mitochondria

Hepatic Mitochondrial Renin-Angiotensin Systems
James R A Skipworth 121
Figure R1.33. Immunogold labelling of rat liver tissue sections with AT2R antibody and
appropriate secondary antibody demonstrates the presence of AT2R (seen here as black dots)
in association with mitochondria upon electron microscopy (31,000 x magnification).
Further staining can also be identified throughout the cell.
R1.3.d. Summary of Immmunohistochemical techniques for the
mitochondrial localization of RAS
WB IF EM
Renin Y Y N
ACE N Y Y
Ang Y Y Y
AT1R Y N Y
AT2R Y N Y
Table R1.6. The presence of RAS components within hepatic mitochondria was
inconsistent, utilising these techniques, with different strategies suggesting different results
(WB- Western Blotting; IF- Immunofluorescence; EM- Electron Microscopy).
Mitochondria AT2R
Mitochondria

Hepatic Mitochondrial Renin-Angiotensin Systems
James R A Skipworth 122
R1.4 Discussion
Taken together, the data presented in this chapter suggest the possibility of certain RAS
components being present within mitochondria; however, the results are inconsistent
between techniques and therefore cannot provide unequivocal evidence for a full
mitochondrial RAS, due to the inherent limitations of the antibodies and methods. Western
blotting demonstrated renin, AT1R, AT2R and angiotensin within sub-fractionated
mitochondrial compartments in both rat liver tissue and HepG2 cells; whilst ACE, at its
usual size of 170-180 kDa was absent from all mitochondrial sub-fractions in both rat liver
tissue and HepG2 cells. However, further analysis demonstrated an enrichment of a 55 kDa
molecule, when stained with ACE C-terminal antibodies, from two different manufacturers,
within sub-fractionated crude mitochondrial compartments; potentially representing a novel,
mitochondrial-specific form of ACE. Immunofluorescence and confocal microscopy of
HepG2 cells demonstrated the presence of all classical RAS components (e.g. renin, ACE,
ang, AT1R and AT2R) within HepG2 cells, with renin, ang and ACE co-localising with
mitochondria. Immunogold labelling and electron microscopy demonstrated ACE, ang,
AT1R and AT2R in association with rat liver mitochondria and mitochondria of the HepG2
cell line.
The immunohistochemical techniques utilised are reliant upon the accuracy of cell/tissue
processing, to allow the structural integrity of the molecules under investigation (RAS
components) to be maintained. They also rely upon the specificity of the antibodies
employed, to eradicate non-specific background staining, thought to result from attraction of
primary and secondary antibodies to endogenous Fc receptors (Buchwalow et al., 2011).
The strategies followed here (and within the previous studies describing RAS components
within mitochondria) incorporated a blocking step (goat serum or bovine serum albumin),
thought to prevent the hydrophobic interactions between proteins and ionic or electrostatic
interactions (Buchwalow et al., 2011). However, recent studies suggest that such widely-
utilised protocols are based upon conflicting and outdated reports and may therefore be
ineffective (Buchwalow et al., 2011). The antibodies employed here demonstrated
inconsistent findings between Western blotting, immunofluorescence and electron
microscopy. However, electron microscopy results between cell-lines and tissue were

Hepatic Mitochondrial Renin-Angiotensin Systems
James R A Skipworth 123
consistent both with each other and the findings of other authors, such as Abadir et al (2011)
and Peters et al (1996). In contrast with the consistency of EM was the presence of multiple
bands when the same antibodies are utilised for Western blotting and relatively non-specific
patterns of staining when utilised for immunofluorescence, both of which reinforce the idea
that non-specific, background staining may be a particular limitation of this technique and
these antibodies. Further, antibodies from different manufacturers yielded different results
when utilised for Western blotting, calling into question the conclusions from past studies,
which relied only upon one antibody. These results therefore cannot confirm the findings of
Abadir et al (2011), who suggested that the AT2R might be located upon the inner
mitochondrial membrane. Similarly, without a demonstration of their exact site, hypotheses
regarding the potential functional role of postulated intra-mitochondrial RAS proteins
become redundant. Alternative techniques will therefore be necessary to provide irrefutable
proof that RAS components are present within mitochondria, given such limitations of
immunohistochemical techniques.
One consistent finding was the detection of a 55 kDa band when CM preparations were
stained with an ACE C-terminal, but not an ACE N-terminal antibody; suggesting that if
this band did represent a mitochondrial form of ACE, it may be proceesed or cleaved to
remove the N-terminal. Previous studies have suggested that RAS components may require
significant processing to enter the mitochondria and a novel, truncated form of non-
secretory renin lacking 36 amino acids (including the complete ER signal) has been reported
to be present within the mitochondria of the rat adrenal gland (Clausmeyer et al., 2000,
Clausmeyer et al., 1999, Wanka et al., 2009). This 55 kDa molecule may potentially
represent a novel, truncated form of ACE; however, this molecular weight is significantly
below the usual size of ACE (170-195 kDa) and would necessitate significant cleavage and
processing of the ACE molecule prior to mitochondrial import, potentially rendering its
enzymatic activity non-functional and raising the question of what its function may
subsequently be. Further investigation of the nature of this 55 kDa molecule was performed,
via isolation and characterisation of the molecule of interest (see Results 2: Is there a
mitochondrial-specific form of ACE).

Hepatic Mitochondrial Renin-Angiotensin Systems
James R A Skipworth 124
RESULTS 2:
IS THERE A
MITOCHONDRIAL-
SPECIFIC FORM OF ACE?

Hepatic Mitochondrial Renin-Angiotensin Systems
James R A Skipworth 125
Abstract
Introduction: Mitochondrial RAS proteins were inconsistently identified in initial
experiments, results appearing dependent upon the investigative strategy used and the
antibody employed. Whilst the normal molecular weight of ACE is 180-195 kDa, Western
blots consistently identified a 55 kDa molecule which stained with an ACE (C-terminal)
antibody in mitochondrial (particularly CM) fractions, potentially representing a novel,
specific, truncated, intra-mitochondrial form of ACE. For further investigation the 55 kDa
band was isolated, purified and concentrated to allow proteomic analysis by mass
spectrometry.
Methods: Immunoprecipitation was performed on rat liver crude mitochondrial sub-
fractions to isolate and concentrate the 55 kDa form of ACE. Deglycosylation of the band of
interest was also performed to reduce heterogeneity of mass and charge in the sample and
facilitate subsequent mass spectrometry via MALDI-TOF.
Results: Immunoprecipitation of rat liver tissue and ACE (C-terminal) antibody
demonstrated consistent concentration of a 50 kDa band, whereas deglycosylation of
this immunoprecipitation eluate demonstrated a subsequent consistent reduction in mass
to 30 kDa. Database searches following mass spectrometry of 55 kDa, 50 kDa and 30 kDa
bands demonstrated no results consistent with ACE protein.
Discussion: Smaller ACE isoforms than the usual size of 170-195 kDa have been
previously described, as has a truncated intra-mitochondrial renin protein. Negative mass
spectrometry results, as presented here, indicate that that the 55 kDa band is most likely to
represent non-specific binding by the ACE (C-terminal) antibody and although these results
do not completely exclude the presence of ACE in low abundance, they do render the
presence of ACE in the mitochondria unlikely.

Hepatic Mitochondrial Renin-Angiotensin Systems
James R A Skipworth 126
R2.1 Introduction
Mitochondrial RAS proteins were inconsistently identified in previous experiments, results
appearing dependent upon the investigative strategy used and the antibody employed (see
Results 1: Presence of RAS components in hepatic mitochondria, pages 94-125). If a
functional, self-sufficient RAS were to exist within mitochondria, it should contain enzymes
generating ang II, a role mostly fulfilled by ACE, the enzyme directly responsible for the
generation of ang II from ang I throughout the body. Whilst the normal molecular weight of
ACE is 180-195 kDa, initial Western blots consistently identified a 55kDa molecule which
stained with an ACE (C-terminal) antibody in mitochondrial (particularly CM) fractions.
This might represent a finding of genuine biological significance, since shorter natural
human and rat ACE isoforms exist [ACE-T, Uniprot P47820], and a novel, specific,
truncated intra-mitochondrial form of renin has previously been described (Clausmeyer et
al., 2000, Clausmeyer et al., 1999, Wanka et al., 2009). To confirm the identity of the 55
kDa mitochondrial band, a series of experiments were performed to isolate, purify and
concentrate the 55 kDa protein and allow proteomic analysis by mass spectrometry.

Hepatic Mitochondrial Renin-Angiotensin Systems
James R A Skipworth 127
R2.2 Methods
Immunoprecipitation (IP) was performed on rat liver crude mitochondrial sub-fractions to
isolate and concentrate the 55 kDa form of ACE for proteomic analysis by mass
spectrometry (for further information see ‘M9. Mass Spectrometry’; page 87). Each
immunoprecipitation experiment was performed utilising ACE (C-terminal) antibody (Santa
Cruz Biotechnology; Dallas, Texas, USA) and the results of immunoprecipitation were
assessed by Western blotting or direct silver staining of a Bis-Tris gel following
electrophoresis. Each experiment was performed at least three times to ensure consistency
of results and representative images are presented below.
R2.2.a. Western blotting & Silver Staining
Western blotting and silver staining utilising the end product (eluate) from
immunoprecipitation of a CM fraction with the ACE (C-terminal) antibody demonstrated
consistent enrichment of a 50 kDa band, as demonstrated by dense staining and reduced
non-specific staining around the band of interest (see Figure R2.1). This represented a
consistent 5 kDa reduction in mass, as compared to staining of the CM fraction with ACE
C-terminal antibody, which consistently revealed a 55 kDa band, potentially consistent with
concentration and removal of contaminants (purification). Multiple copies of the 50 kDa
band (containing the protein of interest bound to antibody) were excised from gels to
undergo further processing and proteomic analysis by mass spectrometry (see Figure R2.2).

Hepatic Mitochondrial Renin-Angiotensin Systems
James R A Skipworth 128
Figure R2.1. Western blot image demonstrating concentration of a 50 kDa band following
immunoprecipitation of a crude mitochondrial fraction from rat liver tissue utilising ACE
(C-terminal) antibody (IP eluate). When compared to the 55 kDa band seen after
electrophoresis of a CM fraction alone, the concentrated band has reduced mass (50 kDa)
and reduced non-specific staining (PM- Pure mitochondria; CM- Crude mitochondria; GRP-
Control utilising antibody to GRP75; Resin- Control utilising resin only and no antibody; IP
Eluate- Eluate from immunoprecipitation of CM with ACE (C-terminal) antibody).
Figure R2.2. Silver stain images again demonstrate concentration of a 50 kDa band (IP
Eluate) following immunoprecipitation of a crude mitochondrial fraction from rat liver
tissue, utilising ACE (C-terminal) antibody (upper gel). The band is subsequently excised
for trypsin digestion and proteomic analysis by mass spectrometry (middle gel). Ultimately
multiple bands were processed and excised to increase the volume of protein for mass
spectrometry (lower gel) (CM- Crude mitochondria; SS-Size standards; IP Eluate- Eluate
from immunoprecipitation of CM fraction with ACE (C-terminal) antibody).
!"# $"#%!#&'()*+#,+-./# ,+-./#0,!#
1234)#
2534)#
5634)#
76634)#
0,!#
5534)#
$8/9+/*:)*+;#56<4)#=)/;#
!!" #$"%&'()*"
+,-.("
/0-.("
12"
/0-.("
+,-.("
+,-.("
#$"%&'()*" #$"%&'()*" #$"%&'()*"!!" 12" !!"

Hepatic Mitochondrial Renin-Angiotensin Systems
James R A Skipworth 129
R2.2.b Deglycosylation Deglycosylation of the IP eluate (of a CM fraction and ACE (C-terminal) antibody) was also
performed to remove N-linked glycans from the IP eluate under investigation to compare to
the results following IP alone. This technique reduced the heterogeneity of both mass and
charge within the sample, thus assisting analysis by mass spectrometry. Western blotting
and silver staining were again subsequently performed to assess the effect of
deglycosylation and compare to IP alone. Each experiment was performed at least three
times to ensure consistency of results and representative images are presented below.
R2.2.c Mass Spectrometry Following electrophoresis, deglycosylation and excision of the bands of interest, gel-pieces
were delivered for mass spectrometry to be performed by experienced technical staff at one
of two centres (University College London, UK or Harvard Medical School, Boston, USA
(see Methods, page 87 for further information on methodology). Resultant mass
spectrometry data were compared against a database of known proteins including
UniProtKB/Swiss-Prot, a non-redundant protein sequence database maintained by the
UniProt consortium (www.uniprot.org/).

Hepatic Mitochondrial Renin-Angiotensin Systems
James R A Skipworth 130
R2.3 Results
R2.3.a. Western Blotting & Silver Staining
Western blotting and silver staining, utilising the deglycosylated IP eluate (from
immunoprecipitation of a rat liver CM fraction with ACE (C-terminal) antibody)
demonstrated a consistent reduction in mass from 50 kDa to 30 kDa (see Figures R2.3-2.4).
Such a finding may be consistent with deglycosylation of a heavily glycosylated
glycoprotein, such as ACE.
Figure R2.3. Silver stain images again demonstrated concentration of the 50 kDa band in an
IP eluate (IP) following immunoprecipitation of a crude mitochondrial fraction from rat
liver tissue, utilising ACE (C-terminal) antibody. A crude mitochondrial sub-fraction (CM;
also shown for comparison) demonstrated the previously identified 55 kDa band. When the
IP eluate underwent deglycosylation (IP Degly), a further 30 kDa band was also seen in
addition to the 50 kDa band; however, when the crude mitochondrial sub-fraction
underwent deglycosylation, only the 50 kDa band was seen (SS- Size standards; CM-Crude
mitochondria; IgG- IgG control (immunoprecipitation of ACE (C-terminal) antibody alone);
IP- Eluate from immunoprecipitation of CM fraction with ACE (C-terminal) antibody; CM
Degly-Deglycosylation of crude mitochondrial sub-fraction; IP Degly- Deglycosylation of
IP eluate).
MW
Inpu
tOu
tput
IgG
Cont
rol (
diffe
rent
Ab)
Empt
yGl
ycos
ylat
ed
De-G
lycos
ylat
edEm
pty
Empt
yNe
w IP
(De-
Glyc
osyl
ated
)
IgG Heavy chainACE mito glycosylated
ACE mito de-glycosylated
Mass specroscopy samples from Gyorgy Szabadkai, University College London. Coomassie staining on 10% invitrogen bis-tris PAGE in Mops buffer.
250150100
50
37
25
75
(kDa)
250150100
50
37
75
(kDa)
MW
Inpu
t
Outp
ut G
lyosy
late
d
IgG
Cont
rol (
sam
e Ab
)
IP A
CE G
lycos
ylat
ed
Cros
s-lin
ked
ACE
De-G
lycos
ylat
ed
Outp
ut D
e-Gl
ycos
ylat
ed
IP A
CE D
e-Gl
ycos
ylat
ed p
re-IP
IP A
CE D
e-Gl
ycos
ylat
ed p
ost-I
P
Cros
s-lin
ked
ACE
Glyc
osyl
ated
IgG Heavy chain
ACE mito de-glycosilated
Gel # 2
Gel # 1
Gel 1, 50 kDa band
Gel 2, 180 kDa band
Gel 2, 50 kDa band
Gel 2, 37 kDa band
SAMPLE ID
ACE = Angiotensin converting enzymeIP = Immunoprecipitation
Cutted Gel # 1
Cutted Gel # 2
!!!!!!!!!!!!!"#!!!!!!!!!!!"#!!!!!!!!!!! $%&'!!!!!!!!!!!$(!!!!!!!!!!!$(')*%+,'''''''''''
"#')*&+,'''''''''''
-./)0'
12/)0'
2-/)0'
1./)0'
--/)"!

Hepatic Mitochondrial Renin-Angiotensin Systems
James R A Skipworth 131
Figure R2.4. Silver stain images again demonstrated concentration of a 30 kDa band (IP
Degly) when the IP eluate was deglycosylated and the 50 kDa band (IP) following
immunoprecipitation alone (upper gel). Both band sizes (50 kDa and 30 kDa) were carefully
excised for proteomic analysis by mass spectrometry (lower gel) (IP-Eluate from
immunoprecipitation with ACE (C-terminal antibody); IP Degly-Deglycosylation of eluate
from immunoprecipitation).
R2.3.b Mass Spectrometry
Results are presented depending upon the site of analysis. UCL results were analysed
via the Protein Lynx Global Server (PLGS) (Waters; Milford, MA, USA) and a ‘PLGS
score’ assigned based upon a computer software algorithm that utilised filtering and
scoring routines to analyse all available mass spectrometry data and statistically
measure peptide assignment accuracy as well as minimising the occurrence of false
positive results (scores greater than 78 are significant (p<0.05)). Harvard results were
analysed by Seaquest (Thermo Scientific; Waltham, MA, USA), a mass spectrometry
data analysis programme that assigns scores such as ‘XCorr’, a cross-correlation score
derived from the database search, which is used to produce the final ranking of
candidate peptides in the search (values above 2 represent a good correlation); ‘Delta
correlation score’ (dCn), a score computed by the Seaquest algorithm, which represents
an assessment of the distance between the best database search hit and the second best
(the closer to 1, the more positive the result); and ‘Ions’, which is an assessment of how
many experimental ions matched with theoretical ions for the peptide under analysis
(>70 % represents a positive result).
!"#$%&'(#!"#!"#
!"#$%&'(#
)*+$,#
-.+$,#
).+$,#
-.+$,#

Hepatic Mitochondrial Renin-Angiotensin Systems
James R A Skipworth 132
Samples sent for mass spectrometry analysis include:
i) a 55 kDa band following electrophoresis of a rat liver crude mitochondrial sub-
fraction (CM) stained with ACE (C-terminal antibody);
ii) a 50 kDa band following immunoprecipitation of a CM sub-fraction with ACE
(C-terminal antibody) (IP); and
iii) a 30 kDa band following deglycosylation of a 50 kDa IP eluate (IP Degly).
i. Rat liver crude mitochondrial sub-fraction (CM 55 kDa band)
Database searches following mass spectrometry of the 55 kDa band derived from crude
mitochondrial sub-fraction incubation with ACE (C-terminal) antibody demonstrated no
results consistent with ACE protein (see Figure R2.5 and Appendix 3, page 221 for full
results). Proteins identified included keratin and dermicidin (likely human contaminants), as
well as reagents used during experimentation, such as trypsin (for in-gel protein digestion)
and enolase (protein used to standardise mass spectrometry performance). Actual rat liver
mitochondrial proteins with similar molecular weight, which could give rise to the non-
specific binding of the antibody might include the pyruvate kinase isozymes M1 and M2,
and tubulin alpha 8 chain, which has previously been shown to be associated with
mitochondria.
Figure R2.5. Representative mass spectra results, following analysis of a gel piece
containing a 55 kDa band derived from a crude mitochondrial sub-fraction of rat liver tissue,
demonstrate no findings consistent with ACE.

Hepatic Mitochondrial Renin-Angiotensin Systems
James R A Skipworth 133
ii. Immunoprecipitation eluate (IP 50 kDa band)
Database searches following mass spectrometry of the 50 kDa band derived from the
immunoprecipitation eluate (of crude mitochondrial sub-fraction incubation with ACE (C-
terminal) antibody) similarly demonstrated contaminants and experimental reagents but no
results consistent with ACE protein (see Figure R2.6 and Appendix 3, page 221). Two gel-
pieces analysed at University College London identified a weak correlation (PLGS scores
76 and 63) of the 50 kDa band with an unknown rat protein of molecular weight
approximately 46 kDa.
Figure R2.6. Representative mass spectra results after analysis of a gel piece containing a
50 kDa band derived from an immunoprecipitation eluate of a rat liver crude mitochondrial
sub-fraction demonstrated no findings consistent with ACE.
iii. Deglycosylated immunoprecipitation eluate (IP Degly 30kDa band) Database searches following mass spectrometry of the 30 kDa band derived from
deglycosylation of the immunoprecipitation eluate of a crude mitochondrial sub-fraction
incubated with ACE (C-terminal) antibody demonstrated contaminants (enolase) but no
results consistent with ACE protein (see Appendix 3, page 221, for full results).

Hepatic Mitochondrial Renin-Angiotensin Systems
James R A Skipworth 134
R2.4 Discussion Immunoprecipitation of rat liver tissue and ACE (C-terminal) antibody demonstrated
consistent concentration of a 50 kDa band, whereas deglycosylation of this
immunoprecipitation eluate demonstrated a consistent reduction in mass from 50 kDa to
30 kDa. Database searches following mass spectrometry of 55 kDa (from CM sub-fraction),
50 kDa (from IP eluate) and 30 kDa (from deglycosylated IP eluate) bands demonstrated no
results consistent with ACE protein. Proteins consistently identified included contaminants
(e.g. keratin and dermicidin), and experimental reagents (e.g. enolase). The results therefore
indicate that the 55 kDa band is most likely to represent non-specific binding by the ACE
(C-terminal) antibody and although these results do not completely exclude the presence of
ACE in low abundance, they do render the presence of ACE in the mitochondria unlikely.
Smaller ACE molecules than the usual size of 170-195 kDa have been previously described
with at least four isoforms identified in rats (intracellular 130 and 68 kDa forms and
secretory 130 and 60 kDa (Camargo de Andrade et al., 2006). Truncated intra-mitochondrial
renin proteins have also been previously described (Wanka et al., 2009, Clausmeyer et al.,
2000, Clausmeyer et al., 1999), reinforcing the idea that a truncated mitochondrial ACE
protein is possible. However, the truncated renin described lacks a small portion of its
overall structure (representing its ER targeting sequence); whereas, a molecular weight of
30-55 kDa is significantly below the usual size of ACE and would necessitate considerable
cleavage and processing of the ACE molecule prior to mitochondrial import, potentially
rendering its enzymatic activity non-functional and raising the question of what its function
may subsequently be. Positive mass spectrometry results here would have suggested a role
for a truncated intra-mitochondrial ACE and would therefore imply the existence of a
mitochondrial RAS where nuclear genome-derived RAS components are formed within the
cytoplasm, subsequently undergoing significant post-translational processing and cleavage
prior to mitochondrial import, where intra-mitochondrial conversion of ang I to ang II may
take place. Negative mass spectrometry results, as presented here, do not completely
exclude the presence of a mitochondrial RAS, but would suggest that if such a system
existed, intra-mitochondrial ang I to II conversion would occur via the enzymatic action of
non-ACE, alternate, previously undescribed enzymes.

Hepatic Mitochondrial Renin-Angiotensin Systems
James R A Skipworth 135
RESULTS 3:
FUNCTIONAL ANALYSIS
OF A HEPATIC
MITOCHONDRIAL RAS
Hepatic Mitochondrial Renin-Angiotensin Systems
James R A Skipworth 136
Abstract
Introduction: Earlier results suggest that mitochondria may contain classical RAS
components, although a mitochondrial-specific form of ACE is unlikely to exist. If such a
hepatic intra-mitochondrial RAS were to exist, its function remains unknown. To further
investigate the potential functions of a mitochondrial RAS, a series of experiments were
performed to assess the effects of stimulating or antagonising the renin-angiotensin system.
Methods: Functional fluorescence microscopy was used to measure real-time, dynamic,
live-cell (HeLa and HepG2) alterations in multiple, crucial intracellular processes (including
mitochondrial membrane potential, intracellular calcium concentration and NADH
concentration) following addition of various stimulatory (ang II) and inhibitory factors
(Losartan (AT1R antagonist), PD123319 (AT2R antagonist) (at both 1 mM and 1 µM), as
well as substrates known to alter mitochondrial metabolism in a predictable fashion
(including rotenone (inhibitor of complex I & II), FCCP (uncoupling agent) and oligomycin
(inhibitor of ATP synthase)). Real-time, dynamic alterations in oxygen consumption were
also assessed via a Clark electrode in response to angiotensin II and its receptor antagonists,
as well as established mitochondrial substrates.
Results: Functional fluorescence microscopy data demonstrated accurate use of positive
controls with FCCP decreasing mitochondrial membrane potential, intracellular calcium and
intracellular NADH; and rotenone resulting in significant decreases in mitochondrial
membrane potential and intracellular calcium, associated with an increase in NADH
concentration. However, ang II, losartan and PD123319 addition led to inconsistent results
without biological plausibility in both HeLa and HepG2 cells.
The addition of reagents to live HepG2 cells demonstrated consistent oxygen consumption
results: ang II had no significant effect upon cellular oxygen consumption at 1 µM or 1 mM;
whereas, both Losartan and PD123319 had no effect at 1 µM concentration but led to a
significant increase in cellular oxygen consumption at 1 mM concentration. When added to
live HeLa cells, ang II led to a significant decrease in cellular oxygen consumption at 1 µM
concentration; whereas, both Losartan and PD123319 had no significant effect at a
concentration of 1 µM, but led to a significant increase in cellular oxygen consumption at 1
mM concentration.
Hepatic Mitochondrial Renin-Angiotensin Systems
James R A Skipworth 137
Discussion: It can be hypothesized that the HepG2 results presented may be inconsistent
due to the dual presence of cell membrane and mitochondrial membrane receptors; however,
results derived from HeLa cells should represent effects at the mitochondrial membrane
only (as HeLa cells contain no plasma membrane ang receptors). Thus, addition of ang II
may lead to a decrease in cellular oxygen consumption, a result that would be consistent
with previously described studies but this effect is likely to be non-specific in that it can be
prevented by both AT1 and AT2 receptor inhibitors. Further, the physiological intracellular
concentration of ang II is likely to be in the picomolar range, in accordance with the sub-
nanomolar affinity of angiotensin receptors on the cell surface, and the supra-physiological
reagent concentrations utilised here may therefore result in non-endogenous effects.

Hepatic Mitochondrial Renin-Angiotensin Systems
James R A Skipworth 138
R3.1 Introduction
Previous Western blot, immunohistochemistry and electron microscopy results suggested
that mitochondria may contain classical RAS components, although a mitochondrial-
specific form of ACE is unlikely to exist. Specifically, Western blotting demonstrated renin,
AT1R, AT2R and angiotensin within sub-fractionated mitochondrial compartments in both
rat liver tissue and HepG2 cells; whilst ACE was absent from all mitochondrial sub-
fractions in both rat liver tissue and HepG2 cells at its usual size of 170-180 kDa.
Immunofluorescence and confocal microscopy of HepG2 cells demonstrated the presence of
renin, ang and ACE within mitochondria, whilst immunogold labeling and electron
microscopy demonstrated ACE in association with rat liver mitochondria and mitochondria
of the HepG2 cell line. However, mass spectrometry results indicated that a truncated ACE
of 55 kDa molecular weight was not present within mitochondria.
If a hepatic intra-mitochondrial RAS were to exist, its function remains unknown. Abadir et
al (2011) suggest that activation of a mitochondrial RAS is coupled to mitochondrial nitric
oxide production and can modulate cellular respiration, whilst intracrine hepatic RAS
activation may be pro-inflammatory and pro-fibrotic, contributing to the pathogenesis of
chronic liver disease and liver fibrosis/cirrhosis (Grace et al., 2012). To further investigate
the potential functions of a mitochondrial RAS, a series of experiments were performed to
assess the mitochondrial effects of stimulating or antagonising the renin-angiotensin system.
A variety of crucial mitochondrial functions were therefore assessed, including:
i. NADH concentration: NADH is an energy-rich molecule produced within the
mitochondrial matrix via the Krebs cycle. The redox energy from such molecules
is transferred to oxygen in several steps via the electron transport chain within
the inner mitochondrial membrane.
ii. Mitochondrial membrane potential (ΔΨm; for further information see ‘M1.
Materials’; page 61): The redox action of NADH allows the generation of energy
utilised to pump protons into the mitochondrial intermembrane space, forming an
electrochemical proton gradient or mitochondrial membrane potential. Protons
can only subsequently re-enter the mitochondrial matrix via the ATP synthase
complex, where their potential energy is employed to drive the generation of

Hepatic Mitochondrial Renin-Angiotensin Systems
James R A Skipworth 139
chemical energy in the form of ATP. Thus the maintenance and stability of this
membrane potential remains crucial for fundamental mitochondrial function and
a significant loss of ΔΨm renders the cell depleted of energy with subsequent
cell death.
iii. Oxygen consumption: Mitochondria utilise oxygen to produce ATP and the rate
of oxygen consumption is therefore a valuable tool in the assessment of
mitochondrial function as it directly reflects the efficiency of oxidative
phosphorylation.
iv. Intracellular calcium concentration (for further information see ‘M1. Materials’;
page 61): Free intracellular calcium concentrations are vital for the regulation of
an array of cellular reactions and signal transduction; and mitochondria can have
significant effects on calcium levels via interaction with endoplasmic reticulum
(ER), the most significant site of intracellular calcium storage.
As in previous experiments, the HepG2 cell line and rat liver tissue were utilised. HeLa
cells, which lack plasma membrane angiotensin receptors [personal communication: Peter
Varnai (Semmelweis Medical School, Budapest, Hungary)] were also used, as any cellular
metabolic alteration identified following the introduction of RAS components must occur
secondary to direct mitochondrial or non-specific action only, and not via plasma membrane
angiotensin receptors.

Hepatic Mitochondrial Renin-Angiotensin Systems
James R A Skipworth 140
R3.2 Methods
R3.2.a. Functional Fluorescence Microscopy
Functional fluorescence microscopy refers to the process of imaging live cells on a confocal
microscope, following the addition of fluorescent molecules. It is used to measure real-time,
dynamic alterations in multiple intracellular processes, in response to various stimulatory or
inhibitory factors. The intensity of fluorescence dynamically alters as the metabolic process
under examination changes, allowing quantitative study of cellular pathways within live
cells.
The actual mitochondrial membrane potential of hepatocytes has been estimated as -154.3
mV in young Fischer rats (Hagen et al., 1997); however, functional fluorescence
microscopy allows quantitative assessment of changes in mitochondrial membrane potential
(as well as other parameters), in response to various internal and external factors, in a
consistent and reproducible manner (see Figures R3.1-R3.2 and ‘M1. Materials’; page 61).
Here, changes in mitochondrial membrane potential (TMRM; excitation at 500 nm),
intracellular calcium concentration (Fluo 4; excitation at 488 nm) and NADH concentration
(auto-fluorescence; excitation at 364 nm) were assessed in response to ang II agonism and
antagonism (Losartan, AT1R antagonist and PD123319, AT2R antagonist), and to well-
established substrates that alter mitochondrial metabolism in a predictable fashion, including
rotenone (inhibitor of electron transport chain complex I & II) and FCCP (uncoupling
agent). Histamine was also added as a positive control, as binding to Histamine receptors on
the plasma membrane should cause a cytosolic, and subsequent, mitochondrial Ca2+ signal.
Live cells were allowed to equilibrate for at least five minutes within the microscope, on a
heated stage at 38 °C. Cellular fluorescence was constantly measured during the experiment,
utilsiing statistical software pre-installed on the microscope, and the initial fluorescence at
the commencement of the experiment was arbitrarily set to a relative fluorescence value of
1. Relative changes in fluorescence were subsequently assessed as reagents were added to
the live cells (with relative fluorescence increasing >1 for brighter fluorescence and
decreasing <1 for a reduction in fluorescence, as compared to the original fluorescence at
the commencement of the experiment). Relative fluorescence was measured for at least two

Hepatic Mitochondrial Renin-Angiotensin Systems
James R A Skipworth 141
minutes before and after addition of each of the various reagents. Each experiment was
carried out at least five times and a mean of the alteration in relative fluorescence for all
experiments calculated and presented below. Statistically significant alterations in mean
relative fluorescence, before and after addition of various substrates, were assessed by two-
tailed t-test; and a probability value of less than 5 % (p< 0.05) was considered significant.
Figure R3.1. Representative image of a decrease in mitochondrial membrane potential, seen
as a decrease in relative fluorescence (due to pre-incubation with TMRM) between left and
right images. The change occurred following addition of ang II (1mM) and these example
images demonstrate that alterations in relative fluorescence can be visibly observed with the
naked eye, as well as formally quantified.
Figure R3.2. Representative image grid demonstrating relative increases and decreases in
red fluorescence (mitochondrial membrane potential) in live HeLa cells over time (approx.7
minutes), following addition of various substrates (a red square in the top right hand corner
of an image demonstrates that a new reagent has been added). The grid of images is read
from left to right and a new image is captured every seven seconds.
!"#$%&'($) *(+),,) !
!"#$%#&'()#$*+,%#-.#/.#$0/$'/$0/10)01+'&$.#&&$.'/$2#$'--#--#1$'-$03$."'/4#-$,)#%$
(5#$
67785$ 67785$
9/10)01+'&$:#&&$
;03,.",/1%0'$$<=#1$*+,%#-.#/.#>$
?+.&#+-$<@'.A$,B$*+,%#-.#/.#>$
Addition of reagent
+7 sec +7 sec +7 sec +7 sec +7 sec +7 sec
7 sec
+7 sec +7 sec
0 secs
220 secs
168 secs
112 secs
56 secs
324 secs
276 secs

Hepatic Mitochondrial Renin-Angiotensin Systems
James R A Skipworth 142
R3.2.b. Oxygen Consumption Real-time, dynamic alterations in oxygen consumption were assessed via a Clark electrode
(see Figure 3.14 and ‘M10. Oxygen Consumption’; page 92), in both HepG2 and HeLa
cells, in response to angiotensin II and to its receptor antagonists (Losartan and PD123319).
Well-established substrates that alter mitochondrial metabolism in a predictable fashion,
including oligomycin (inhibitor of ATP synthase) and FCCP (uncoupling agent) were
utilised as positive controls (for further information see ‘M1. b. Reagents’; page 61).
Two million live cells (HepG2 or HeLa) were allowed to equilibrate within the chamber of
the Clark electrode at 38 °C and oxygen consumption set to 100 % after an equilibration
period of at least five minutes. The rate of oxygen consumption was subsequently measured
for two minutes and a basal rate of oxygen consumption measured and set arbitrarily to 100
%. Thus, any subsequent change in the rate of oxygen consumption per minute was
expressed as a percentage change from 100 % (e.g. -0.02 equals decrease in rate of oxygen
consumption of 2 % per minute from pre-set level of 100 %). A substrate was subsequently
added via the designated hole in the lid of the apparatus chamber and the rate of oxygen
consumption again measured for two minutes. The rate of oxygen consumption naturally
reduces over time in cells examined in this fashion and each separate set of cells was
therefore replaced after ten minutes to allow for this. Each experiment was performed five
times and the mean of the results presented below. Statistically significant alterations in
mean rates of oxygen consumption, following addition of various substrates, were assessed
by two-tailed t-test; and a probability value of less than 5 % (p<0.05) was considered
significant.

Hepatic Mitochondrial Renin-Angiotensin Systems
James R A Skipworth 143
Figure R3.14. An image of the computer software utilised to measure oxygen consumption
demonstratedd how alterations in the rate of oxygen consumption were calculated. The
initial level is arbitrarily set to 100 % after cellular equilibration (for at least five minutes)
and the steepness of the rate of decline was measured following addition of various
reagents. Oxygen consumption was assessed for at least two minutes prior to and following
the addition of each reagent (O2CR- Rate of oxygen consumption).
!""#$%&'%(')*+,*&-'
./0)'1')*+,*&-'2'
./0)'1')*+,*&-'/'
2334'
5+6*7#&*'./0)'

Hepatic Mitochondrial Renin-Angiotensin Systems
James R A Skipworth 144
R3.3 Results
R3.3. a. Functional Fluorescence Microscopy
R3.3. a.i HepG2 Cells (see Figures R3.3-3.6)
The addition of FCCP to live HepG2 cells led to predictable and significant decreases in
intracellular calcium, NADH and mitochondrial membrane potential. Ang II addition
produced a significant decrease in NADH concentration and a significant increase in
mitochondrial membrane potential, with no significant effect noted upon intracellular
calcium. Losartan addition significantly decreased intracellular NADH and significantly
increased intracellular calcium levels; whereas, PD123319 treatment had no significant
effects.
Figure R3.3. The addition of FCCP (uncoupling agent; concentration 1 µM) to live HepG2
cells led to predictable and significant decreases in concentrations of intracellular calcium
(Fluo-4; p= 0.000) and NADH (p= 0.000), as well as a significant decrease in mitochondrial
membrane potential (TMRM; p= 0.006). Each time point represents 7 seconds and each
experiment was performed 6 times with the mean presented here.
!"#$
!"%$
!"&$
'"'$
'"($
'"#$
'"%$
'"&$
)"'$
)"($
)"#$
*+,-./
+$0,12
3+45+6
5+$
78*8$
0,129:$
;<=>$
0??@$
7AB+$CD+54E!!
!!
!!FG!"!#$0??@$H$'I8$
!!
!!
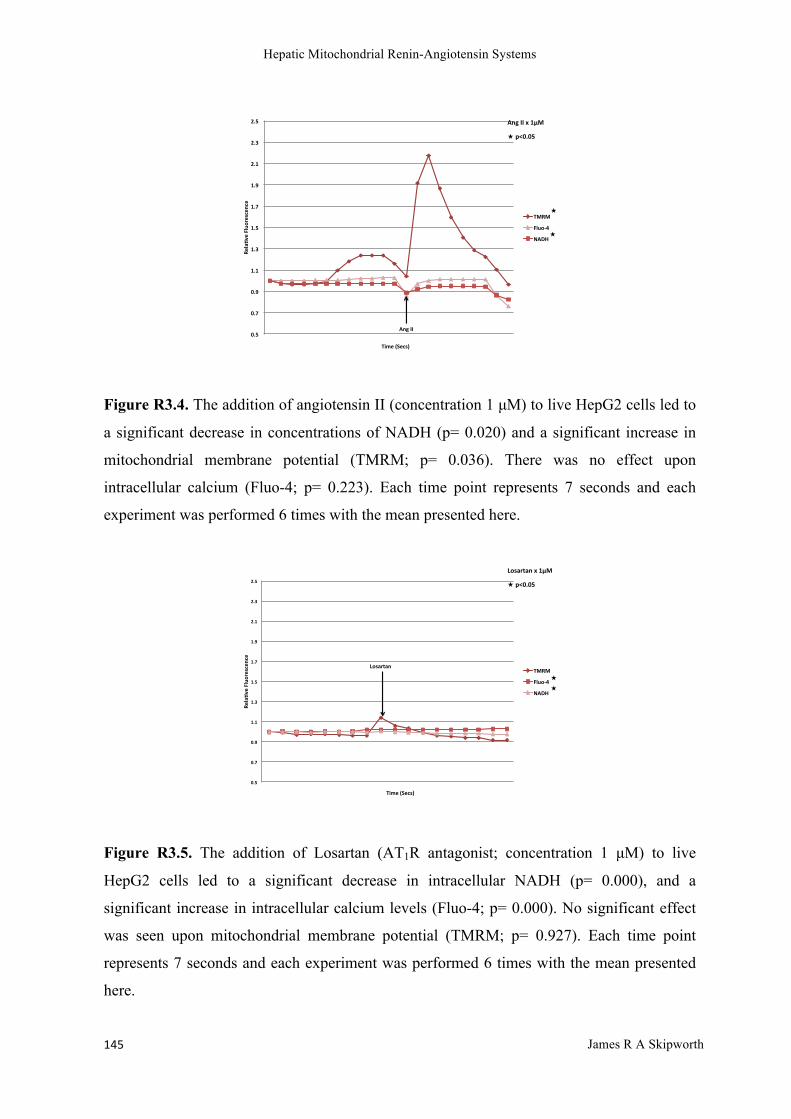
Hepatic Mitochondrial Renin-Angiotensin Systems
James R A Skipworth 145
Figure R3.4. The addition of angiotensin II (concentration 1 µM) to live HepG2 cells led to
a significant decrease in concentrations of NADH (p= 0.020) and a significant increase in
mitochondrial membrane potential (TMRM; p= 0.036). There was no effect upon
intracellular calcium (Fluo-4; p= 0.223). Each time point represents 7 seconds and each
experiment was performed 6 times with the mean presented here.
Figure R3.5. The addition of Losartan (AT1R antagonist; concentration 1 µM) to live
HepG2 cells led to a significant decrease in intracellular NADH (p= 0.000), and a
significant increase in intracellular calcium levels (Fluo-4; p= 0.000). No significant effect
was seen upon mitochondrial membrane potential (TMRM; p= 0.927). Each time point
represents 7 seconds and each experiment was performed 6 times with the mean presented
here.
!"#$
!"%$
!"&$
'"'$
'"($
'"#$
'"%$
'"&$
)"'$
)"($
)"#$
*+,-./
+$0,12
3+45+6
5+$
78*8$
0,129:$
;<=>$
<6?$@@$
7AB+$CD+54E!!
!!
!!FG!"!#$<6?$@@$H$'I8$
!!
!"#$
!"%$
!"&$
'"'$
'"($
'"#$
'"%$
'"&$
)"'$
)"($
)"#$
*+,-./
+$0,12
3+45+6
5+$
78*8$
0,129:$
;<=>$
?24-3@-6$
7AB+$CD+54E!!
!!
!!FG!"!#$?24-3@-6$H$'I8$
!!

Hepatic Mitochondrial Renin-Angiotensin Systems
James R A Skipworth 146
Figure R3.6. The addition of PD123319 (AT2R antagonist; concentration 1 µM) to live
HepG2 cells had no significant effects upon intracellular calcium concentration (Fluo-4; p=
0.734), NADH concentration (p= 0.431) or mitochondrial membrane potential (TMRM; p=
0.918. Each time point represents 7 seconds and each experiment was performed 6 times
with the mean presented here.
!"#$
!"%$
!"&$
'"'$
'"($
'"#$
'"%$
'"&$
)"'$
)"($
)"#$
*+,-./
+$0,12
3+45+6
5+$
78*8$
0,129:$
;<=>$
?=')(('&$
7@A+$BC+54D!!
!!EF!"!#$?=')(('&$G$'H8$

Hepatic Mitochondrial Renin-Angiotensin Systems
James R A Skipworth 147
R3.3. a.ii HeLa Cells (see Figures R3.7-3.13)
HeLa cells have no plasma membrane angiotensin receptors [personal communication: Peter
Varnai (Semmelweis Medical School, Budapest, Hungary)] and therefore any cellular
metabolic alteration following the introduction of RAS components must occur secondary to
direct mitochondrial or non-specific action only, and not via plasma angiotensin receptors.
The addition of angiotensin II to live HeLa cells led to a significant decrease in
mitochondrial membrane potential, intracellular calcium concentration and NADH
concentration. Losartan addition conversely produced a significant decrease in intracellular
calcium concentration and a significant increase in mitochondrial membrane potential, and
PD123319 resulted in significant decreases in mitochondrial membrane potential,
intracellular calcium concentration and NADH concentration.
Control reagents had predictable effects, with histamine causing no effects apart from a brief
calcium surge (calcium spike); and FCCP leading to a significant decrease in mitochondrial
membrane potential, intracellular calcium and intracellular NADH. Rotenone addition
resulted in a significant decrease in mitochondrial membrane potential, and intracellular
calcium, associated with an increase in NADH concentration; and when HeLa cells were
pre-treated with rotenone prior to ang II addition, ang II led to an additional increase in
mitochondrial depolarization and NADH levels, super-imposed upon rotenone effects,
suggesting that the mechanism of ang II action was separate to that of rotenone (therefore
not occurring via complex I).

Hepatic Mitochondrial Renin-Angiotensin Systems
James R A Skipworth 148
Figure R3.7. The addition of Histamine (concentration 1 µM) to live HeLa cells led to a
predictable and swift increase in intracellular calcium levels (calcium spike) (Fluo-4) but no
longer-term effects upon intracellular calcium levels (Fluo-4; p= 0.349), mitochondrial
membrane potential (TMRM; p= 0.524), or NADH concentration (p= 0.194). Each time
point represents 7 seconds and each experiment was performed 6 times with the mean
presented here.
Figure R3.8. The addition of FCCP (uncoupling agent; concentration 1 µM) to live HeLa
cells led to a predictable and significant decrease in concentrations of intracellular calcium
(Fluo-4; p= 0.002) and NADH (p= 0.000), as well as a significant decrease in mitochondrial
membrane potential (TMRM; p= 0.000). Each time point represents 7 seconds and each
experiment was performed 6 times with the mean presented here.
!"#$
!"%$
!"&$
'"'$
'"($
'"#$
'"%$
'"&$
)"'$
)"($
)"#$
*+,-./
+$0,12
3+45+6
5+$
78*8$
0,129:$
;<=>$
7?@+!"#$%&'!!>?4A-@?6+$
!!BC!"!#$>?4A-@?6+$D$'E8$
!"#$
!"%$
!"&$
'"'$
'"($
'"#$
'"%$
'"&$
)"'$
)"($
)"#$
*+,-./
+$0,12
3+45+6
5+$
78*8$
0,129:$
;<=>$
0??@$
7AB+$CD+54E!!
!!FG!"!#$
!!
0??@$H$'I8$
!!
!!

Hepatic Mitochondrial Renin-Angiotensin Systems
James R A Skipworth 149
Figure R3.9. The addition of rotenone (inhibitor of electron transport chain complex I & II;
concentration 1 µm) to live hela cells led to a predictable and significant decrease in
mitochondrial membrane potential (TMRM; p= 0.000), and intracellular calcium (Fluo-4;
p= 0.000), associated with an increase in NADH concentration (p= 0.000). Each time point
represents 7 seconds and each experiment was performed 6 times with the mean presented
here.
Figure R3.10. The addition of angiotensin II (concentration 1 µM) to live HeLa cells led to
a significant decrease in mitochondrial membrane potential (TMRM; p= 0.000),
intracellular calcium concentration (Fluo-4; p= 0.011) and NADH (p= 0.000) concentration.
Each time point represents 7 seconds and each experiment was performed 6 times with the
mean presented here.
!"#$
!"%$
!"&$
'"'$
'"($
'"#$
'"%$
'"&$
)"'$
)"($
)"#$
*+,-./
+$0,12
3+45+6
5+$
78*8$
0,129:$
;<=>$
7?@+$AB+54C!!
*2D+626+$
!!EF!"!#$
!!
*2D+626+$G$'H8$
!!
!!
!"#$
!"%$
!"&$
'"'$
'"($
'"#$
'"%$
'"&$
)"'$
)"($
)"#$
*+,-./
+$0,12
3+45+6
5+$
78*8$
0,129:$
;<=>$
7?@+$AB+54C!!
<6D$EE$
!!
!!FG!"!#$
!!
!!
<6D$EE$H$'I8$

Hepatic Mitochondrial Renin-Angiotensin Systems
James R A Skipworth 150
Figure R3.11. The addition of Losartan (AT1R antagonist; concentration 1 µM) to live
HeLa cells led to a significant decrease in intracellular calcium concentration (Fluo-4; p=
0.000) and a significant increase in mitochondrial membrane potential (TMRM; p= 0.005)
with no significant effect upon NADH concentration (p= 0.140). Each time point represents
7 seconds and each experiment was performed 6 times with the mean presented here.
Figure R3.12. The addition of PD123319 (AT2R antagonist; concentration 1 µM) to live
HeLa cells led to significant decreases in mitochondrial membrane potential (TMRM; p=
0.000), intracellular calcium concentration (Fluo-4; p= 0.000) and NADH concentration (p=
0.000). Each time point represents 7 seconds and each experiment was performed 6 times
with the mean presented here.
!"#$
!"%$
!"&$
'"'$
'"($
'"#$
'"%$
'"&$
)"'$
)"($
)"#$
*+,-./
+$0,12
3+45+6
5+$
78*8$
0,129:$
;<=>$
7?@+$AB+54C!!
D24-3E-6$
!!FG!"!#$
!!
D24-3E-6$H$'I8$
!!
!"#$
!"%$
!"&$
'"'$
'"($
'"#$
'"%$
'"&$
)"'$
)"($
)"#$
*+,-./
+$0,12
3+45+6
5+$
78*8$
0,129:$
;<=>$?=')(('&$
7@A+$$BC+54D!!
!!EF!"!#$
!!
?=')(('&$G$'H8$
!!
!!

Hepatic Mitochondrial Renin-Angiotensin Systems
James R A Skipworth 151
Figure 3.13.a. and 3.13.b. Addition of ang II to HeLa cells pre-treated with rotenone
demonstrated additional mitochondrial depolarization (a. Upper image) and NADH
elevation (b. Lower image), super-imposed upon the effects occurring secondary to rotenone
(w rotenone- Pre-treated with rotenone; w/o rotenone- Not pre-treated with rotenone).
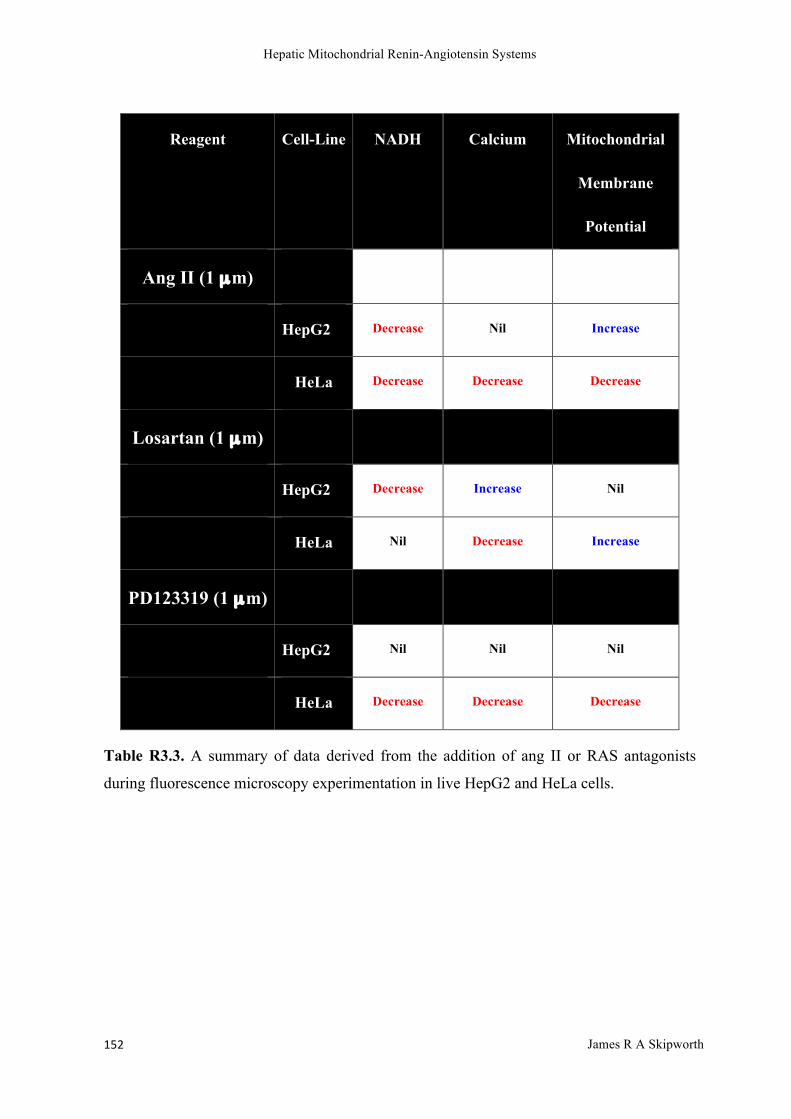
Hepatic Mitochondrial Renin-Angiotensin Systems
James R A Skipworth 152
Reagent Cell-Line NADH Calcium Mitochondrial
Membrane
Potential
Ang II (1 µm)
HepG2 Decrease Nil Increase
HeLa Decrease Decrease Decrease
Losartan (1 µm)
HepG2 Decrease Increase Nil
HeLa Nil Decrease Increase
PD123319 (1 µm)
HepG2 Nil Nil Nil
HeLa Decrease Decrease Decrease
Table R3.3. A summary of data derived from the addition of ang II or RAS antagonists
during fluorescence microscopy experimentation in live HepG2 and HeLa cells.

Hepatic Mitochondrial Renin-Angiotensin Systems
James R A Skipworth 153
R3.3.b Oxygen Consumption
R3.3. b.i. HepG2 Cells (see Figures R3.15-R3.18)
These experiments demonstrated that there was no effect upon mitochondrial oxygen
consumption, as measured by Clark electrode, of adding angiotensin II (1 µM or 1 mM) to
live HepG2 cells. Similarly, there was no effect upon adding RAS antagonists at 1 µM;
however, when the concentration was increased to 1 mM, an increase in the rate of oxygen
consumption was seen following addition of both Losartan and PD123319; however, such a
concentration is significantly higher than the concentratyions that would be found in vivo.
Table R3.1. Mean rates of oxygen consumption measured at baseline and after addition of
each reagent in live HepG2 cells. Rates of oxygen consumption are expressed as a change in
oxygen consumption per minute, as compared to 100 % (e.g. -0.02 arbitrary units (AU)
equals decrease in rate of oxygen consumption of 2 % per minute from baseline rate of
oxygen consumption). Significant changes in rate of oxygen consumption are highlighted in
red (p< 0.05).
n Mean Basal Rate
(AU)
Rate After
Reagent (AU)
Mean Change in
Rate (AU)
p
Ang II (1µM) 11 -0.230 -0.204 -0.016 0.062
Ang II (1mM)
13 -0.251 -0.249 -0.003 0.502
Losartan (1µM) 8 -0.072 -0.064 -0.002 0.375
Losartan (1mM)
6 -0.137 -0.179 0.042 0.029
PD123319 (1µM) 8 -0.072 -0.079 0.002 0.533
PD123319 (1mM) 6 -0.137 -0.174 0.037 0.019

Hepatic Mitochondrial Renin-Angiotensin Systems
James R A Skipworth 154
Figure R3.15. The addition of angiotensin II to live HepG2 cells, at a concentration of 1
µM, had no significant effect upon cellular oxygen consumption (p= 0.062). Substrates with
known mitochondrial effects (histamine- no effect; (p= 0.307) oligomycin (complex I&II
inhibitor)- significant decrease (p= 0.001); FCCP (uncoupling agent)- significant increase
(p= 0.000)) were included as positive and negative controls (Ang II- Angiotensin II; O2C- Change
in Oxygen consumption; AU- Arbitrary units).
Figure R3.16. The addition of angiotensin II to live HepG2 cells, at a concentration of 1
mM, had no significant effect upon cellular oxygen consumption (p= 0.502). Substrates with
known mitochondrial effects (oligomycin (complex I&II inhibitor)- significant decrease (p=
0.003); FCCP (uncoupling agent)- significant increase (p= 0.002)) were included to act as
positive controls.
!"#$%
!"#&%
"%
"#&%
"#$%
"#'%
"#(%
)%
*+,-%./+01% *+23,-%./+01% *,4%./+01% *3-%./+01%
5361,73-+%
8-9%::%
;<39=7>03-%
?@@A%
!!BC"#"D%
8-9%::%4%)E*%
!!
!!
;&@F*3-%G8HI%
!"#$%
!"#&%
!"#'%
"%
"#'%
"#&%
"#$%
"#(%
"#)%
"#*%
"#+%
,-./%01-23% ,-45./%01-23% ,.6%01-23% ,5/%01-23%
7/8%99%
:;58<=>25/%
?@@A%
7/8%99%6%'=,%
!!
!!
!!BC"#")%
:&@D,5/%E7FG%

Hepatic Mitochondrial Renin-Angiotensin Systems
James R A Skipworth 155
Figure R3.17. The addition of Losartan (AT1R antagonist) and PD123319 (AT2R
antagonist) to live HepG2 cells, at a concentration of 1 µM, had no significant effect upon
cellular oxygen consumption (p= 0.375 and 0.533 respectively). Substrates with known
mitochondrial effects (oligomycin (complex I&II inhibitor)- significant decrease (p= 0.049);
FCCP (uncoupling agent)- significant increase (p= 0.001)) were included to act as positive
controls.
Figure R3.18. The addition of Losartan (AT1R antagonist) and PD123319 (AT2R
antagonist) to live HepG2 cells, at a concentration of 1 mM, led to a significant increase in
cellular oxygen consumption (p= 0.029 and 0.019 respectively). Substrates with known
mitochondrial effects (oligomycin (complex I&II inhibitor)- significant decrease (p= 0.002);
FCCP (uncoupling agent)- no change (p= 0.058)) were included to act as positive controls.
!"#"$%
!"#"&%
!"#"'%
"%
"#"'%
"#"&%
()*+%,-)./% ()01*+%,-)./% (*2%,-)./% (1+%,-)./%
345*6/*+%
789'::9;%
<=1>[email protected]+%
ABB7%
!!CD"#"E%FGH%I+J1K1/46%2%9L(%!!
!!
<'BM(1+%NGOP%
!"#"$%
!"#"&%
!"#"'%
"#"'%
"#"&%
"#"$%
()*+%,-)./% ()01*+%,-)./% (*2%,-)./% (1+%,-)./%
345*6/*+%
78'9&&':%
;<1=4>?.1+%
@AA7%
!!BC"#"$%
DEF%G+H1I1/46%2%'>(%
!!
!!!!
;9AJ(1+%KELM%

Hepatic Mitochondrial Renin-Angiotensin Systems
James R A Skipworth 156
R3.3. b.i. HepG2 Cells These data demonstrate that a significant decrease in mitochondrial oxygen consumption
was seen upon addition of angiotensin II (concentration 1 µM) to live HeLa cells, as
assessed by Clark electrode (see Table R3.2). There was no effect upon adding RAS
inhibitors, unless the concentration was increased to 1 mM, at which point an increase in the
rate of oxygen consumption was seen following addition of both Losartan and PD123319
(see Figures R3.19-R3.21); an effect that is biologically inconsistent and occurring at only
extremely high antagonist concentrations.
Table R3.2. Mean rates of oxygen consumption measured at baseline and after addition of
each reagent in live HeLa cells. Rates of oxygen consumption are expressed as a change in
oxygen consumption per minute, as compared to 100 % (e.g. -0.02 arbitrary units (AU)
equals decrease in rate of oxygen consumption of 2 % per minute from baseline rate of
oxygen consumption). Significant changes in rate of oxygen consumption are highlighted in
red.
n Mean Basal Rate
(AU)
Rate After
Reagent (AU)
Change in Rate
(AU)
p
Ang II (1 µM)
7 -0.485 -0.013 -0.007 0.005
Losartan (1 µM)
7 -0.039 -0.050 0.004 0.149
Losartan (1 mM)
6 -0.137 -0.179 0.0412 0.029
PD123319 (1 µM)
6 -0.039 -0.034 0.003 0.626
PD123319 (1 mM)
6 -0.137 -0.174 0.037 0.019

Hepatic Mitochondrial Renin-Angiotensin Systems
James R A Skipworth 157
Figure R3.19. The addition of angiotensin II to live HeLa cells, at a concentration of 1 µM,
led to a significant decrease in cellular oxygen consumption (p=0.005). Substrates with
known mitochondrial effects (oligomycin (complex I&II inhibitor)- significant decrease
(p=0.003); FCCP (uncoupling agent)- significant increase (p=0.005)) were included to act as
positive controls.
Figure R3.20. The addition of Losartan (AT1R antagonist) and PD123319 (AT2R
antagonist) to live HeLa cells, at a concentration of 1 µM, had no significant effect upon
cellular oxygen consumption (p=0.149 and 0.626 respectively). Substrates with known
mitochondrial effects (oligomycin (complex I&II inhibitor)- significant decrease (p=0.000);
FCCP (uncoupling agent)- significant increase (p=0.006)) were included to act as positive
controls.
!"#"$%
!"#"&%
!"#"'%
"%
"#"'%
"#"&%
"#"$%
()*+%,-)./% ()01*+%,-)./% (*2%,-)./% (1+%,-)./%
3+4%55%
671489:.1+%
;<<=%
!!>?"#"@%3+4%55%2%'A(%
!!
!!!!
6&<B(1+%C3DE%
!"#"$%
!"#"&%
!"#"'%
!"#"(%
"%
"#"(%
"#"'%
"#"&%
"#"$%
)*+,%-.*/0% )*12+,%-.*/0% )+3%-.*/0% )2,%-.*/0%
456+70+,%
89('&&(:%
;<2=5>?/2,%
@AA8%
!!BC"#"D%
EFG%H,I2J20576%3%(K)%
!!
!!
;'AL)2,%MFNO%

Hepatic Mitochondrial Renin-Angiotensin Systems
James R A Skipworth 158
Figure R3.21. The addition of Losartan (AT1R antagonist) and PD123319 (AT2R
antagonist) to live HeLa cells, at a concentration of 1 mM, led to a significant increase in
cellular oxygen consumption (p=0.029 and 0.019 respectively). Substrates with known
mitochondrial effects (oligomycin (complex I&II inhibitor)- significant decrease (p=0.002);
FCCP (uncoupling agent)- non-significant increase (p=0.058)) were included to act as
positive controls.
!"#$%
!"#&'%
!"#&%
!"#"'%
"%
"#"'%
"#&%
"#&'%
"#$%
"#$'%
()*+%,-)./% ()01*+%,-)./% (*2%,-)./% (1+%,-)./%
345*6/*+%
78&$99&:%
;<1=4>?.1+%
@AA7%
;$AB(1+%CDEF%
!!GH"#"'%IDJ%K+L1M1/465%2%&>(%
!!
!!
!!
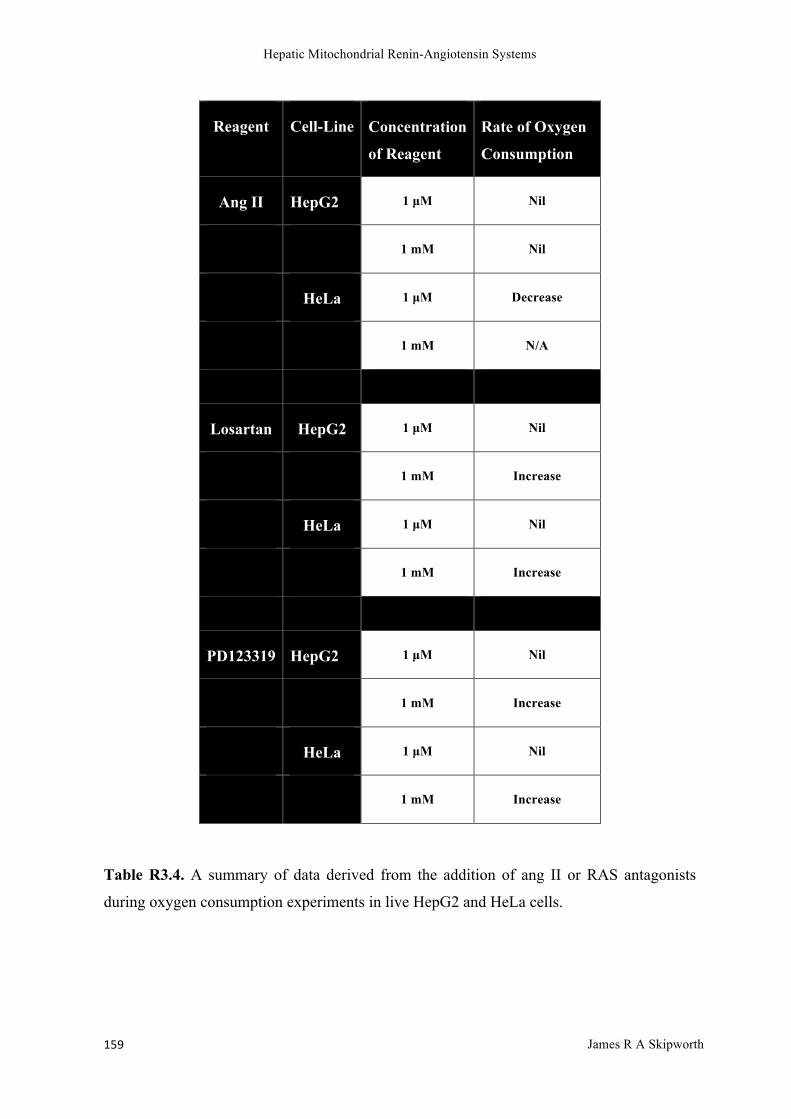
Hepatic Mitochondrial Renin-Angiotensin Systems
James R A Skipworth 159
Reagent Cell-Line Concentration
of Reagent
Rate of Oxygen
Consumption
Ang II HepG2 1 µM Nil
1 mM Nil
HeLa 1 µM Decrease
1 mM N/A
Losartan HepG2 1 µM Nil
1 mM Increase
HeLa 1 µM Nil
1 mM Increase
PD123319 HepG2 1 µM Nil
1 mM Increase
HeLa 1 µM Nil
1 mM Increase
Table R3.4. A summary of data derived from the addition of ang II or RAS antagonists
during oxygen consumption experiments in live HepG2 and HeLa cells.

Hepatic Mitochondrial Renin-Angiotensin Systems
James R A Skipworth 160
R3.4 Discussion
These functional fluorescence microscopy results demonstrate accurate positive controls
with the use of histamine resulting in no effects apart from a brief intracellular calcium
surge (calcium spike); FCCP leading to significant decreases in mitochondrial membrane
potential, intracellular calcium and intracellular NADH; and rotenone resulting in
significant decreases in mitochondrial membrane potential, and intracellular calcium,
associated with an increase in NADH concentration (see Table R3.3). These control data
indicate that the functional fluorescence technique described is an accurate assessment of
mitochondrial function in these cell-lines. When the same technique was used and ang II or
its antagonists were applied to live HepG2 or HeLa cells, inconsistent results were
demonstrated. Ang II (concentration 1 µM) added to live HepG2 cells caused a significant
decrease in NADH concentration and a significant increase in mitochondrial membrane
potential; Losartan (AT1R antagonist; concentration 1 µM) led to a significant decrease in
intracellular NADH and a significant increase in intracellular calcium levels; and PD123319
(AT2R antagonist; concentration 1 µM) had no significant effects. In HeLa cells, ang II
(concentration 1 µM) led to a significant decrease in mitochondrial membrane potential,
intracellular calcium concentration and NADH concentration; Losartan (AT1R antagonist;
concentration 1 µM) led to a significant decrease in intracellular calcium concentration and
a significant increase in mitochondrial membrane potential; and PD123319 (AT2R
antagonist; concentration 1 µM) led to a significant decrease in mitochondrial membrane
potential, intracellular calcium concentration and NADH concentration.
Published studies suggest that the addition of ang II might be expected to depolarize the
mitochondrial membrane potential (Doughan et al., 2008), and decrease oxygen
consumption via AT1-receptor dependent action (Cassis et al., 2002). Further, ang II might
be expected to reduce NADH levels via the activation of plasma membrane-bound NADH-
/NADPH-oxidases, contributing to decreased mitochondrial membrane potential and oxygen
consumption, as well as increased production of reactive oxygen species and superoxides,
effects that are antagonized by AT1R inhibitors and less so by AT2R inhibitors (Zhang et al.,
1999a). Ang II has also been shown to increase intracellular calcium concentration,
similarly via action at the AT1 receptor (Greco et al., 2002, Nitschke et al., 2000).

Hepatic Mitochondrial Renin-Angiotensin Systems
James R A Skipworth 161
The non-consistent results seen in these experiments with HepG2 cells could be ascribed to
confusing dual effects of both cell membrane and intra-cellular or mitochondrial (if they
exist) angiotensin receptors in HepG2 cells. However, HeLa cell results should represent
true mitochondrial effects of reagent addition, without the compromising effects of cell
membrane receptors (as they contain no cell-membrane ang receptors), suggesting that the
addition of ang II leads to a significant decrease in mitochondrial membrane potential,
intracellular calcium concentration and NADH concentration via an intracellular mechanism
(rather than acting via cell membrane receptors), with NADH and mitochondrial membrane
potential effects antagonised by the AT1R antagonist Losartan and AT2R antagonists having
no effect. These effects are potentially compatible with two hypotheses: ang II might inhibit
complex I, thus reducing NADH consumption and depolarising the mitochondrial
membrane; or ang II may stimulate mitochondrial metabolism via a non-Ca2+ dependent
mechanism. In order to test whether the effect of ang II occurs via increased NADH from
the Krebs cycle, I pre-treated HeLa cells were pre-treated with rotenone (complex I inhibitor
i.e. inhibitor of NADH consumption) to demonstrate that ang II led to further elevations of
NADH, even following rotenone application, suggesting a separate mechanism of action.
Furthermore, ang II increased mitochondrial depolarisation even in the presence of
rotenone, potentially indicating a direct effect upon ATP synthase.
Another potential strategy to investigate such RAS effects upon mitochondria would be to
add reagents to isolated mitochondria; however, such techniques have recently fallen out of
favour. Isolation of pure mitochondria exposes the mitochondria to non-physiological
oxygen conditions and removes cellular regulatory systems, thus, all results are assessed
outside the context of the mitochondrion’s normal functioning conditions. Further, although
the intracellular concentrations of ang II are yet to be reported, tissue ang II levels are likely
to vary from picomolar to the low nanomolar range (depending upon tissue type and
conditions), and the physiological concentrations of intracellular ang II are likely to occur in
the picomolar range, in accordance with the sub-nanomolar affinity of angiotensin receptors
on the cell surface. In contrast, isolated mitochondria are inevitably exposed to substrate
concentrations far higher than that found in the endogenous cellular microenvironment in
vivo. To provide the most robust evidence for a functioning mitochondrial RAS, a
combination of data from isolated mitochondria and intact cells, in conjunction with both in
vivo and in vitro techniques is likely to be required.
Hepatic Mitochondrial Renin-Angiotensin Systems
James R A Skipworth 162
Abadir et al (2011) suggested that functional AT2Rs are present on inner mitochondrial
membranes (co-localising with ang II) of rat heart and liver, where they lead to modulation
of respiration via coupling to mitochondrial nitric oxide production. However, the AT2R
(although highly expressed in the foetus) has low expression levels in normal adults and its
precise role remains open for clarification. The AT2R may be involved in signaling
pathways such as activation of protein phosphatases and the bradykinin/nitric oxide/cyclic
guanosine 3’,5’-monophosphate pathway, as well as stimulation of phospholipase A2, but its
only true established function is vasodilation, although it may be involved in cardiovascular
remodeling and inflammation. Similarly, it may also be involved in apoptotic cell death,
thereby playing a role in developmental biology; however, mice lacking the gene encoding
the AT2R develop normally and have a normal blood pressure (although they display an
increased response to the addition of ang II) (Hein et al., 1995), potentially suggesting that it
may not play a crucial role in mitochondria or elsewhere. Abadir’s group also utilised only
one antibody for their immunofluorescence results and provided no examination of antibody
specificity: their results should therefore be interpreted with this in mind. Further, the study
utilised only CGP 42112 for AT2R agonism, a compound that has been reported to
antagonise the AT1R as well as agonise the AT2R, and a functional assessment of
endogenous ATR ligands was not undertaken.
In contrast to these functional immunofluorescence data, the addition of various reagents to
live HepG2 cells demonstrated consistent oxygen consumption results: ang II had no
significant effect upon cellular oxygen consumption at 1 µM or 1 mM; whereas, both
Losartan (AT1R antagonist) and PD123319 (AT2R antagonist) had no effect at 1 µM
concentration but led to a significant increase in cellular oxygen consumption at a high 1
mM concentration (see Table R3.4). When added to live HeLa cells, ang II led to a
significant decrease in cellular oxygen consumption at 1 µM concentration; whereas, both
Losartan and PD123319 had no significant effect at a concentration of 1 µM, but led to a
significant increase in cellular oxygen consumption at 1 mM concentration. As previously
discussed, the HepG2 cell results may be confused by the dual presence of cell membrane
and mitochondrial membrane receptors; whereas, results derived from HeLa cells should
represent effects at the mitochondria only. Thus, addition of ang II may lead to a decrease in
cellular oxygen consumption, a result that would be consistent with previously described
studies; however, this effect appears to be antagonised by both AT1and AT2 receptors, a

Hepatic Mitochondrial Renin-Angiotensin Systems
James R A Skipworth 163
finding which would appear to be biologically inconsistent. Further, as previously discussed,
the physiological intracellular concentration of ang II is likely to be in the picomolar range,
in accordance with the sub-nanomolar affinity of angiotensin receptors on the cell surface,
and the supra-physiological reagent concentrations utilised here may therefore result in non-
endogenous effects.

Hepatic Mitochondrial Renin-Angiotensin Systems
James R A Skipworth 164
DISCUSSION

Hepatic Mitochondrial Renin-Angiotensin Systems
James R A Skipworth 165
D1. Conclusions The existence of an intracellular RAS has now been extensively investigated and its putative
actions have been reported to include mitochondrial dysfunction in the form of increased
ROS production, decreased mitochondrial respiratory control and decreased mitochondrial
membrane potential (Li et al., 2014, Mariappan et al., 2012, Doughan et al., 2008). RAS
inhibition subsequently improves ATP production and overall mitochondrial function
(Sumbalova et al., 2010, Taskin et al., 2014). Such effects upon mitochondria may, of
course, be mediated indirectly via cell-surface receptors and second messenging systems, or
alternate endocrine, paracrine or autocrine actions. Published data had suggested that an
intra-mitochondrial RAS might be responsible (Abadir et al., 2011); however, a paucity of
data and the fact that many of the studies to date, particularly those reliant upon single
antibodies, remain significantly flawed from a methodological point of view, thus raised the
question of whether the conclusions from such studies are valid. To explore this issue
further, a variety of techniques were utilised in hepatic cells and tissue. Two major
hypotheses were proposed at the commencement of the study:
1. RAS components can be found within mitochondria (mRAS) derived from rat liver
tissue and a liver cell-line, utilizing Western blotting, confocal microscopy and
electron microscopy techniques.
The studies performed for this thesis initially suggested the presence of renin, AT1R, AT2R
and angiotensin within sub-fractionated mitochondrial compartments in both rat liver tissue
and HepG2 cells on Western blotting; renin, ang and ACE co-localising with mitochondria
in HepG2 cells on immunofluorescence and confocal microscopy; and ACE, ang, AT1R and
AT2R in association with mitochondria of rat liver and the HepG2 cell line on immunogold
labeling and electron microscopy. However, findings were inconsistent between techniques
and tissue/cell-lines, in keeping with a recent American study (Benicky et al., 2012) which
reported that six commercially-available antibodies against AT1R (including the sc-1173
AT1R antibody (Santa Cruz Biotechnology, Dallas, Texas, USA) utilised for this thesis) lack
specificity. The authors demonstrated that each AT1R antibody (utilised for Western blotting
and immunocytochemistry) yielded multiple prominent immunoreactive bands and that the
immunostaining patterns were different for each antibody tested. Further, although each
antibody did identify a 43 kDa band (target size of AT1R), the same bands were seen in

Hepatic Mitochondrial Renin-Angiotensin Systems
James R A Skipworth 166
AT1R knockout mice and rat hypothalamic 4B cells not expressing AT1 receptors. The
authors subsequently concluded that none of the tested antibodies met sufficient criteria to
be considered specific and suggested that radioligand binding might be the only reliable
approach for the assessment of AT1R physiology.
Initial Western blots also identified a previously unexpected but prominent 55 kDa band,
when immunostaining a crude mitochondrial fraction with ACE C-terminal antibody. Thus,
the original experimental plan was altered to attempt analysis of the prominent band and in
particular to assess whether it represented a novel, mitochondrial-specific form of ACE.
However, multiple subsequent fruitless attempts to identify an underlying protein
demonstrated that these Western blot findings most likely represent non-specific antibody
binding only. The majority of studies investigating the presence of an intra-mitochondrial
RAS have relied upon the findings of one antibody, and these studies must now be reviewed
in the light of these recent findings.
Abadir et al (2011) suggested that AT2Rs are located upon the inner mitochondrial
membrane of rat heart and liver, where they co-localise with endogenous ang II to modulate
cellular respiration via mitochondrial nitric oxide production, based upon the use of a single
antibody. Similarly, Peters et al (1996), who identified renin and ACE in intramitochondrial
dense bodies of the rat adrenal zona glomerulosa and cortex after nephrectomy and
hemodialysis but relied upon single antibodies and provided no assessment of antibody
sensitivity. Close inspection of EM images provided by Peters et al show a scattered
distribution of immunogold labeling around mitochondria, consistent with non-specific
binding. Further, the work of Wanka et al (2009) identified the presence of mitochondrial
renin, again reliant upon the use of a single antibody. Indeed, the only intra-mitochondrial
RAS study to date to utilize radio-labeled ligands demonstrated the presence of a truncated
prorenin that was imported into mitochondria in adrenal zona glomerulosa cells
endogenously (Clausmeyer et al., 1999). However, this study utilised a laboratory-created
construct and therefore does not necessarily reflect a phenomenon that occurs endogenously.
Thus, such qualitative techniques (e.g. Western blotting, immunofluorescence and electron
microscopy) contain inherent limitations in that they rely upon the limited specificity of
antibodies to definitively prove the existence of intra-mitochondrial RAS components.
Hepatic Mitochondrial Renin-Angiotensin Systems
James R A Skipworth 167
2. Addition of RAS components to liver cells adversely affects a variety of hepatic
mitochondrial functions (as assessed via measurement of oxygen consumption and
dynamic fluorescence microscopy); whereas, RAS antagonism leads to
improvements in hepatic mitochondrial function.
Functional experimentation performed for this thesis, via addition of ang II to live HepG2
cells, demonstrated a significant decrease in NADH concentration and a significant increase
in mitochondrial membrane potential. Conversely, the addition of Losartan (AT1R
antagonist) significantly decreased intracellular NADH and increased intracellular calcium
levels. The use of ang II in HeLa cells, however, led to a significant decrease in
mitochondrial membrane potential, intracellular calcium concentration and NADH
concentration, whilst the addition of Losartan led to a significant decrease in intracellular
calcium concentration and a significant increase in mitochondrial membrane potential.
Exposure to PD123319, a selective, non-peptide AT2 receptor antagonist led to a significant
decrease in mitochondrial membrane potential, intracellular calcium concentration and
NADH concentration. The clear inconsistencies within this data suggest that such functional
experimentation, particularly when used at such significantly supra-physiological levels (1
µM – 1 mM), is incapable of separating effects secondary to RAS receptor-ligand binding at
the cell-surface, intracellularly or, specifically, intra-mitochondrially. Such data therefore
suggests that the effect of ang II on liver mitochondria is unlikely to be direct, and that any
positive associations discovered to date are likely to be secondary to methodological flaws.
Such findings do not exclude ang II effects upon mitochondrial function, but suggest that
any action is likely to occur via one of several intracellular pathways, such as Ca2+ signaling
via the AT1R/G-protein/IP3 system, regulation of gene expression or mitochondrial
biogenesis pathways.
This thesis contains unbiased analyses of all known classical RAS components, as well as a
targeted evaluation of the presence of ACE via mass spectrometry. The results, as presented
here, provide no evidence for the idea of a complete, functioning hepatic mitochondrial
RAS of the type postulated by other authors. It remains possible, if unlikely, however, that
RAS components may be imported into mitochondria for a specific function in certain
tissues under certain specific conditions. Perhaps more likely is that the observed effects of
ang II on mitochondrial function (in certain tissues) occurs via its well-established and

Hepatic Mitochondrial Renin-Angiotensin Systems
James R A Skipworth 168
ubiquitous intracrine actions upon the nucleus (Erdmann et al., 1996, Huang et al., 2003,
Robertson and Khairallah, 1971b), albeit that the specific mechanisms and consequences of
such actions require further elucidation (Re and Cook, 2010). Another possibility remains
the theory of endosomal escape, whereby the ligand (in this case ang II) leaks from
endosomes following receptor-ligand internalisation, becoming free within the cytoplasm to
act upon organelles, including mitochondria, and leading to intracrine effects (Cho et al.,
2003), a mechanism that forms the basis of many mammalian DNA transfection strategies.
Angiotensin receptor (AT1R or AT2R) antagonists may therefore protect from such
intracrine or mitochondrial ang II action by preventing receptor-ligand endocytosis, and
subsequent endosomal escape, rather than via local receptor blockade of putative
mitochondrial or other such functional intracellular receptors. Furthermore, there is no
evidence to prove the existence of intra-mitochondrial ang II production, a necessary
requirement for an intrinsic mitochondrial RAS.
Taken together, therefore, these data exclude the presence of a complete, functioning RAS
within hepatic mitochondria, as well as the direct action of intracrine ang II upon
mitochondria. If an intrinsic, functional hepatic mitochondrial RAS were to exist, its
regulation, roles and actions remain unknown, and the role of ACE2 and the Mas receptor
remain similarly unknown. Challenges exist in the examination of the presence of such an
intracrine/intracellular system, particularly given the limitations of immunohistochemical
techniques, and following such negative experimentation, as presented here, it must be
asked whether further experimentation is indeed required to investigate the presence of a
hepatic mitochondrial RAS. Repeating the experiments presented here upon isolated
mitochondria would be unlikely to yield novel results, although the further study of both
isolated mitochondria and intact cells, in conjunction with both in vivo and in vitro
techniques, might be advantageous. In particular, the development of functional strategies
that can distinguish intracellular ang II’s effects on cytoplasmic, nuclear or mitochondrial
receptors and those from extracellular ang II (via cell surface receptors) may help provide
further evidence. To this end, the creation of cell-permeable angiotensin probes would aid in
the delineation of the site of action of ang II, as would the generation of transgenic animals
expressing intracellular ang II proteins, and strategies, such as high-affinity radio-ligand

Hepatic Mitochondrial Renin-Angiotensin Systems
James R A Skipworth 169
binding assays, aimed at identifying those molecules endogenously bound to ang II
intracellularly (Redding et al., 2010).
Further functional strategies would include pre-treatment of tissues and cell-lines with ang II
or inhibitors, to assess effects upon metabolic rate and the utilisation of SiRNA (small
interfering ribonucleic acid), cDNA constructs and tissue from knock-out models to
investigate the functional effects of under- and over-expression of various RAS components.
Functional assessments could also be extended to include OXPHOS (oxidative
phosphorylation) measurements (via a Seahorse plate reader (Seahorse Bioscience, North
Billerica, MA, USA)), confocal microscopic assessment of cellular ATP levels (via FRET
(Fluorescence Resonance Energy Transfer)-based fluorescent probes targeted to the
cytoplasm or mitochondrial matrix) and mitochondrial ROS production (via fluorescent
probes DHEt (Dihydroethidium) and mitoSox (Molecular probes, Invitrogen, Carlsbad, CA,
USA)), as well as measurement of mitochondrial DNA content (via real-time quantitative
polymerase chain reaction).
If such assessment of hepatic tissue provides no definitive evidence for the presence of
mitochondrial RAS, the exploration of alternate cell and tissue types could be attempted as
differential expression of RAS components in various tissues has already been observed
(e.g. human liver and aorta predominantly express AT1 receptor mRNA, whilst human right
atrium contains both AT1 and AT2 receptor mRNAs). The presence of such mitochondrial
RAS components may be limited to certain tissues and conditions, particularly to the adrenal
cortex following nephrectomy (Rong et al., 1994, Peters et al., 1996) and may not be present
within hepatocytes at all. Future experimentation could therefore be expanded initially to
renal and adrenal tissues, and assessment of novel and alternate peptides of the RAS,
including AT4R, BK1R, BK2R, & ACE2, could also take place.

Hepatic Mitochondrial Renin-Angiotensin Systems
James R A Skipworth 170
D2. Hepatocellular RAS If we thus exclude the presence of a complete and functional intra-mitochondrial RAS
within hepatocytes, we can clarify, to some extent, a mechanism of action for hepatic RAS.
Although all classical RAS components (renin, angiotensinogen, ACE, ang II, AT1R and
AT2R) have been identified in rat and human liver (Paizis et al., 2002, Paizis et al., 2005),
hepatic RAS appears to predominantly act via ang II binding to extracellular AT1Rs.
Hepatocyte ang II exposure leads to a decrease in surface ang II receptors, consistent with
swift endocytosis and internalisation of the receptor-ligand complex (a process that could be
reliant upon cysteine residues) (Jimenez et al., 1999). Such internalisation leads to inhibition
of cyclic adenosine monophosphate (cAMP) production and increases in intracellular
inositol 4,5-bisphosphate (IP2), inositol 1,4,5-trisphosphate (IP3) generation and calcium
concentration, suggesting that these second messenger systems are crucial to the
downstream intracellular function of ang II (Jimenez et al., 1999). Such intracellular
calcium mobilisation following calcium release from ER stores (Spat and Hunyady, 2004)
results in activation of the Krebs cycle and oxidative phosphorylation; although over-
stimulation of the system may result in adverse effects including mitochondrial calcium
overload, mitochondrial membrane depolarisation and reduced efficiency of ATP
production (Mizuno et al., 1988, Fournier et al., 2012, Yogev and Pines, 2011).
Other AT1R-dependant second messaging systems activated include ROS, MAPK, P13-
kinase, PKC and NF-κB signal pathways (Zhao et al., 2013, Karimian et al., 2012), all of
which may have effects upon mitochondrial physiology or pathophysiology (Hunyady and
Catt, 2006, Re et al., 1981), as well as resulting in induction of C-reactive protein (CRP) and
its related signal pathway expression (in vitro and in vivo), ROS production (Zhao et al.,
2013) and protection against bile-salt induced apoptosis, via inhibition of ER stress
(Karimian et al., 2012).
The addition of exogenous ang II also increases hepatocellular collagen expression, via an
AT1R-NADPH oxidase-mediated pathway (Bataller et al., 2003c), contributing to hepatic
fibrosis (Bataller et al., 2000, Hirose et al., 2007, Kim et al., 2008, Ibanez et al., 2007, Ueki
et al., 2006, Yang et al., 2005, Tuncer et al., 2003, Bataller et al., 2005, Colmenero et al.,
2009, Debernardi-Venon et al., 2007, Sookoian et al., 2005, Terui et al., 2002, Yoshiji et al.,

Hepatic Mitochondrial Renin-Angiotensin Systems
James R A Skipworth 171
2005, Yoshiji et al., 2006, Yokohama et al., 2006) and has pro-mitotic and pro–proliferative
effects, possibly via an autocrine/paracrine AT1R-PDGF pathway (Cook et al., 2001).
Antagonism of hepatic ACE or AT1R, however, enhances NRF-1 and PGCV-1 mRNA,
resulting in attenuation of age-related mitochondrial DNA decrease, improved
mitochondrial function and lower oxidant production (de Cavanagh et al., 2008b).

Hepatic Mitochondrial Renin-Angiotensin Systems
James R A Skipworth 172
REFERENCES

Hepatic Mitochondrial Renin-Angiotensin Systems
James R A Skipworth 173
(2010) Human Mitochondrial Protein Database.
ABADIR, P. M., FOSTER, D. B., CROW, M., COOKE, C. A., RUCKER, J. J., JAIN, A.,
SMITH, B. J., BURKS, T. N., COHN, R. D., FEDARKO, N. S., CAREY, R. M.,
O'ROURKE, B. & WALSTON, J. D. (2011) Identification and characterization of a
functional mitochondrial angiotensin system. Proc Natl Acad Sci U S A, 108, 14849-54.
ADVANI, A., KELLY, D. J., COX, A. J., WHITE, K. E., ADVANI, S. L., THAI, K.,
CONNELLY, K. A., YUEN, D., TROGADIS, J., HERZENBERG, A. M., KULISZEWSKI,
M. A., LEONG-POI, H. & GILBERT, R. E. (2009) The (Pro)renin receptor: site-specific
and functional linkage to the vacuolar H+-ATPase in the kidney. Hypertension, 54, 261-9.
AHMED, A. U. & FISHER, P. R. (2009) Import of nuclear-encoded mitochondrial proteins:
a cotranslational perspective. Int Rev Cell Mol Biol, 273, 49-68.
ALMEIDA, A. P., FRABREGAS, B. C., MADUREIRA, M. M., SANTOS, R. J.,
CAMPAGNOLE-SANTOS, M. J. & SANTOS, R. A. (2000) Angiotensin-(1-7) potentiates
the coronary vasodilatatory effect of bradykinin in the isolated rat heart. Braz J Med Biol
Res, 33, 709-13.
ANBORGH, P. H., SEACHRIST, J. L., DALE, L. B. & FERGUSON, S. S. (2000)
Receptor/beta-arrestin complex formation and the differential trafficking and resensitization
of beta2-adrenergic and angiotensin II type 1A receptors. Mol Endocrinol, 14, 2040-53.
BARTON, B. E. (2001) IL-6-like cytokines and cancer cachexia: consequences of chronic
inflammation. Immunol Res, 23, 41-58.
BASSO, N., CINI, R., PIETRELLI, A., FERDER, L., TERRAGNO, N. A. & INSERRA, F.
(2007) Protective effect of long-term angiotensin II inhibition. Am J Physiol Heart Circ
Physiol, 293, H1351-8.
BASTIANUTTO, C., CLEMENTI, E., CODAZZI, F., PODINI, P., DE GIORGI, F.,
RIZZUTO, R., MELDOLESI, J. & POZZAN, T. (1995) Overexpression of calreticulin
increases the Ca2+ capacity of rapidly exchanging Ca2+ stores and reveals aspects of their
lumenal microenvironment and function. J Cell Biol, 130, 847-55.
BATALLER, R. & BRENNER, D. A. (2005) Liver fibrosis. J Clin Invest, 115, 209-18.

Hepatic Mitochondrial Renin-Angiotensin Systems
James R A Skipworth 174
BATALLER, R., GABELE, E., PARSONS, C. J., MORRIS, T., YANG, L.,
SCHOONHOVEN, R., BRENNER, D. A. & RIPPE, R. A. (2005) Systemic infusion of
angiotensin II exacerbates liver fibrosis in bile duct-ligated rats. Hepatology, 41, 1046-55.
BATALLER, R., GABELE, E., SCHOONHOVEN, R., MORRIS, T., LEHNERT, M.,
YANG, L., BRENNER, D. A. & RIPPE, R. A. (2003a) Prolonged infusion of angiotensin II
into normal rats induces stellate cell activation and proinflammatory events in liver. Am J
Physiol Gastrointest Liver Physiol, 285, G642-51.
BATALLER, R., GINES, P., NICOLAS, J. M., GORBIG, M. N., GARCIA-RAMALLO,
E., GASULL, X., BOSCH, J., ARROYO, V. & RODES, J. (2000) Angiotensin II induces
contraction and proliferation of human hepatic stellate cells. Gastroenterology, 118, 1149-
56.
BATALLER, R., SANCHO-BRU, P., GINES, P., LORA, J. M., AL-GARAWI, A., SOLE,
M., COLMENERO, J., NICOLAS, J. M., JIMENEZ, W., WEICH, N., GUTIERREZ-
RAMOS, J. C., ARROYO, V. & RODES, J. (2003b) Activated human hepatic stellate cells
express the renin-angiotensin system and synthesize angiotensin II. Gastroenterology, 125,
117-25.
BATALLER, R., SCHWABE, R. F., CHOI, Y. H., YANG, L., PAIK, Y. H., LINDQUIST,
J., QIAN, T., SCHOONHOVEN, R., HAGEDORN, C. H., LEMASTERS, J. J. &
BRENNER, D. A. (2003c) NADPH oxidase signal transduces angiotensin II in hepatic
stellate cells and is critical in hepatic fibrosis. J Clin Invest, 112, 1383-94.
BEARD, K. M., LU, H., HO, K. & FANTUS, I. G. (2006) Bradykinin augments insulin-
stimulated glucose transport in rat adipocytes via endothelial nitric oxide synthase-mediated
inhibition of Jun NH2-terminal kinase. Diabetes, 55, 2678-87.
BENICKY, J., HAFKO, R., SANCHEZ-LEMUS, E., AGUILERA, G. & SAAVEDRA, J.
M. (2012) Six commercially available angiotensin II AT1 receptor antibodies are non-
specific. Cell Mol Neurobiol, 32, 1353-65.
BENIGNI, A., CORNA, D., ZOJA, C., SONZOGNI, A., LATINI, R., SALIO, M., CONTI,
S., ROTTOLI, D., LONGARETTI, L., CASSIS, P., MORIGI, M., COFFMAN, T. M. &
REMUZZI, G. (2009) Disruption of the Ang II type 1 receptor promotes longevity in mice.
J Clin Invest, 119, 524-30.

Hepatic Mitochondrial Renin-Angiotensin Systems
James R A Skipworth 175
BHATHAL, P. S. & GROSSMAN, H. J. (1985) Reduction of the increased portal vascular
resistance of the isolated perfused cirrhotic rat liver by vasodilators. J Hepatol, 1, 325-37.
BKAILY, G., SLEIMAN, S., STEPHAN, J., ASSELIN, C., CHOUFANI, S., KAMAL, M.,
JACQUES, D., GOBEIL, F., JR. & D'ORLEANS-JUSTE, P. (2003) Angiotensin II AT1
receptor internalization, translocation and de novo synthesis modulate cytosolic and nuclear
calcium in human vascular smooth muscle cells. Can J Physiol Pharmacol, 81, 274-87.
BOSNYAK, S., JONES, E. S., CHRISTOPOULOS, A., AGUILAR, M. I., THOMAS, W.
G. & WIDDOP, R. E. (2011) Relative affinity of angiotensin peptides and novel ligands at
AT1 and AT2 receptors. Clin Sci (Lond), 121, 297-303.
BOTTINGER, L., GUIARD, B., OELJEKLAUS, S., KULAWIAK, B., ZUFALL, N.,
WIEDEMANN, N., WARSCHEID, B., VAN DER LAAN, M. & BECKER, T. (2013) A
complex of Cox4 and mitochondrial Hsp70 plays an important role in the assembly of the
cytochrome c oxidase. Mol Biol Cell, 24, 609-19.
BRECHLER, V., JONES, P. W., LEVENS, N. R., DE GASPARO, M. & BOTTARI, S. P.
(1993) Agonistic and antagonistic properties of angiotensin analogs at the AT2 receptor in
PC12W cells. Regul Pept, 44, 207-13.
BRINK, M., PRICE, S. R., CHRAST, J., BAILEY, J. L., ANWAR, A., MITCH, W. E. &
DELAFONTAINE, P. (2001) Angiotensin II induces skeletal muscle wasting through
enhanced protein degradation and down-regulates autocrine insulin-like growth factor I.
Endocrinology, 142, 1489-96.
BRINK, M., WELLEN, J. & DELAFONTAINE, P. (1996) Angiotensin II causes weight
loss and decreases circulating insulin-like growth factor I in rats through a pressor-
independent mechanism. J Clin Invest, 97, 2509-16.
BROWN, D., BRETON, S., AUSIELLO, D. A. & MARSHANSKY, V. (2009) Sensing,
signaling and sorting events in kidney epithelial cell physiology. Traffic, 10, 275-84.
BROWN, G. P. & DOUGLAS, J. G. (1982) Angiotensin II binding sites on isolated rat
renal brush border membranes. Endocrinology, 111, 1830-6.
BROWN, N. J., BLAIS, C., JR., GANDHI, S. K. & ADAM, A. (1998) ACE
insertion/deletion genotype affects bradykinin metabolism. J Cardiovasc Pharmacol, 32,
373-7.

Hepatic Mitochondrial Renin-Angiotensin Systems
James R A Skipworth 176
BRULL, D., DHAMRAIT, S., MYERSON, S., ERDMANN, J., WOODS, D., WORLD, M.,
PENNELL, D., HUMPHRIES, S., REGITZ-ZAGROSEK, V. & MONTGOMERY, H.
(2001) Bradykinin B2BKR receptor polymorphism and left-ventricular growth response.
Lancet, 358, 1155-6.
BUCHWALOW, I., SAMOILOVA, V., BOECKER, W. & TIEMANN, M. (2011) Non-
specific binding of antibodies in immunohistochemistry: fallacies and facts. Sci Rep, 1, 28.
CALDWELL, P. R., SEEGAL, B. C., HSU, K. C., DAS, M. & SOFFER, R. L. (1976)
Angiotensin-converting enzyme: vascular endothelial localization. Science, 191, 1050-1.
CAMARGO DE ANDRADE, M. C., DI MARCO, G. S., DE PAULO CASTRO
TEIXEIRA, V., MORTARA, R. A., SABATINI, R. A., PESQUERO, J. B., BOIM, M. A.,
CARMONA, A. K., SCHOR, N. & CASARINI, D. E. (2006) Expression and localization of
N-domain ANG I-converting enzymes in mesangial cells in culture from spontaneously
hypertensive rats. Am J Physiol Renal Physiol, 290, F364-75.
CAMPBELL, D. J. (1987) Circulating and tissue angiotensin systems. J Clin Invest, 79, 1-6.
CAMPBELL, D. J. (1996) Endogenous angiotensin II levels and the mechanism of action of
angiotensin-converting enzyme inhibitors and angiotensin receptor type 1 antagonists. Clin
Exp Pharmacol Physiol, 23 Suppl 3, S125-31.
CAMPBELL, D. J. & HABENER, J. F. (1986) Angiotensinogen gene is expressed and
differentially regulated in multiple tissues of the rat. J Clin Invest, 78, 31-9.
CAMPBELL, D. J., KLADIS, A. & DUNCAN, A. M. (1994) Effects of converting enzyme
inhibitors on angiotensin and bradykinin peptides. Hypertension, 23, 439-49.
CAMPBELL, D. J., SERNIA, C., THOMAS, W. G. & OLDFIELD, B. J. (1991)
Immunccytochemical localization of angiotensinogen in rat brain: dependence of neuronal
immunoreactivity on method of tissue processing. J Neuroendocrinol, 3, 653-60.
CAREY, R. M. & SIRAGY, H. M. (2003) Newly recognized components of the renin-
angiotensin system: potential roles in cardiovascular and renal regulation. Endocr Rev, 24,
261-71.
CASSIS, L., HELTON, M., ENGLISH, V. & BURKE, G. (2002) Angiotensin II regulates
oxygen consumption. Am J Physiol Regul Integr Comp Physiol, 282, R445-53.
Hepatic Mitochondrial Renin-Angiotensin Systems
James R A Skipworth 177
CASSIS, P., CONTI, S., REMUZZI, G. & BENIGNI, A. (2010) Angiotensin receptors as
determinants of life span. Pflugers Arch, 459, 325-32.
CERVENKA, L., VANECKOVA, I., HUSKOVA, Z., VANOURKOVA, Z., ERBANOVA,
M., THUMOVA, M., SKAROUPKOVA, P., OPOCENSKY, M., MALY, J., CHABOVA,
V. C., TESAR, V., BURGELOVA, M., VIKLICKY, O., TEPLAN, V., ZELIZKO, M.,
KRAMER, H. J. & NAVAR, L. G. (2008) Pivotal role of angiotensin II receptor subtype 1A
in the development of two-kidney, one-clip hypertension: study in angiotensin II receptor
subtype 1A knockout mice. J Hypertens, 26, 1379-89.
CHAI, S. Y., FERNANDO, R., PECK, G., YE, S. Y., MENDELSOHN, F. A., JENKINS, T.
A. & ALBISTON, A. L. (2004) The angiotensin IV/AT4 receptor. Cell Mol Life Sci, 61,
2728-37.
CHAI, S. Y., MENDELSOHN, F. A. & PAXINOS, G. (1987) Angiotensin converting
enzyme in rat brain visualized by quantitative in vitro autoradiography. Neuroscience, 20,
615-27.
CHATTOPADHYAY, S., KARAN, G., SEN, I. & SEN, G. C. (2008) A small region in the
angiotensin-converting enzyme distal ectodomain is required for cleavage-secretion of the
protein at the plasma membrane. Biochemistry, 47, 8335-41.
CHEN, G., LIN, L. X., ZHUANG, W. T., YAO, J., HUANG, H. B., LIANG, J. X.,
ZHANG, F. L., WEN, J. P., LI, L. T., LIN, M. & LIN, Q. M. (2004) [Effects of captopril on
myocardial tissue energy metabolism and inflammation in rats with diabetic
cardiomyopathy]. Di Yi Jun Yi Da Xue Xue Bao, 24, 827-8, 831.
CHEN, R., MUKHIN, Y. V., GARNOVSKAYA, M. N., THIELEN, T. E., IIJIMA, Y.,
HUANG, C., RAYMOND, J. R., ULLIAN, M. E. & PAUL, R. V. (2000) A functional
angiotensin II receptor-GFP fusion protein: evidence for agonist-dependent nuclear
translocation. Am J Physiol Renal Physiol, 279, F440-8.
CHO, Y. W., KIM, J. D. & PARK, K. (2003) Polycation gene delivery systems: escape
from endosomes to cytosol. J Pharm Pharmacol, 55, 721-34.
CLARK, A. F., SHARP, M. G., MORLEY, S. D., FLEMING, S., PETERS, J. &
MULLINS, J. J. (1997) Renin-1 is essential for normal renal juxtaglomerular cell
granulation and macula densa morphology. J Biol Chem, 272, 18185-90.

Hepatic Mitochondrial Renin-Angiotensin Systems
James R A Skipworth 178
CLAUSMEYER, S., REINECKE, A., FARRENKOPF, R., UNGER, T. & PETERS, J.
(2000) Tissue-specific expression of a rat renin transcript lacking the coding sequence for
the prefragment and its stimulation by myocardial infarction. Endocrinology, 141, 2963-70.
CLAUSMEYER, S., STURZEBECHER, R. & PETERS, J. (1999) An alternative transcript
of the rat renin gene can result in a truncated prorenin that is transported into adrenal
mitochondria. Circ Res, 84, 337-44.
COGAN, M. G. (1990) Angiotensin II: a powerful controller of sodium transport in the
early proximal tubule. Hypertension, 15, 451-8.
COLMENERO, J., BATALLER, R., SANCHO-BRU, P., DOMINGUEZ, M., MORENO,
M., FORNS, X., BRUGUERA, M., ARROYO, V., BRENNER, D. A. & GINES, P. (2009)
Effects of losartan on hepatic expression of nonphagocytic NADPH oxidase and fibrogenic
genes in patients with chronic hepatitis C. Am J Physiol Gastrointest Liver Physiol, 297,
G726-34.
COLQUHOUN, E. Q., HETTIARACHCHI, M., YE, J. M., RICHTER, E. A., HNIAT, A.
J., RATTIGAN, S. & CLARK, M. G. (1988) Vasopressin and angiotensin II stimulate
oxygen uptake in the perfused rat hindlimb. Life Sci, 43, 1747-54.
COOK, J. L., MILLS, S. J., NAQUIN, R., ALAM, J. & RE, R. N. (2006) Nuclear
accumulation of the AT1 receptor in a rat vascular smooth muscle cell line: effects upon
signal transduction and cellular proliferation. J Mol Cell Cardiol, 40, 696-707.
COOK, J. L., MILLS, S. J., NAQUIN, R. T., ALAM, J. & RE, R. N. (2007) Cleavage of the
angiotensin II type 1 receptor and nuclear accumulation of the cytoplasmic carboxy-terminal
fragment. Am J Physiol Cell Physiol, 292, C1313-22.
COOK, J. L., RE, R., ALAM, J., HART, M. & ZHANG, Z. (2004) Intracellular angiotensin
II fusion protein alters AT1 receptor fusion protein distribution and activates CREB. J Mol
Cell Cardiol, 36, 75-90.
COOK, J. L., ZHANG, Z. & RE, R. N. (2001) In vitro evidence for an intracellular site of
angiotensin action. Circ Res, 89, 1138-46.
COSTEROUSSE, O., ALLEGRINI, J., LOPEZ, M. & ALHENC-GELAS, F. (1993)
Angiotensin I-converting enzyme in human circulating mononuclear cells: genetic
polymorphism of expression in T-lymphocytes. Biochem J, 290 ( Pt 1), 33-40.

Hepatic Mitochondrial Renin-Angiotensin Systems
James R A Skipworth 179
CSORDAS, G., RENKEN, C., VARNAI, P., WALTER, L., WEAVER, D., BUTTLE, K.
F., BALLA, T., MANNELLA, C. A. & HAJNOCZKY, G. (2006) Structural and functional
features and significance of the physical linkage between ER and mitochondria. J Cell Biol,
174, 915-21.
CSORDAS, G., VARNAI, P., GOLENAR, T., ROY, S., PURKINS, G., SCHNEIDER, T.
G., BALLA, T. & HAJNOCZKY, G. (2010) Imaging interorganelle contacts and local
calcium dynamics at the ER-mitochondrial interface. Mol Cell, 39, 121-32.
DANSER, A. H. (2009) (Pro)renin receptor and vacuolar H+-ATPase. Hypertension, 54,
219-21.
DANSER, A. H., ADMIRAAL, P. J., DERKX, F. H. & SCHALEKAMP, M. A. (1998)
Angiotensin I-to-II conversion in the human renal vascular bed. J Hypertens, 16, 2051-6.
DANSER, A. H., SCHALEKAMP, M. A., BAX, W. A., VAN DEN BRINK, A. M.,
SAXENA, P. R., RIEGGER, G. A. & SCHUNKERT, H. (1995) Angiotensin-converting
enzyme in the human heart. Effect of the deletion/insertion polymorphism. Circulation, 92,
1387-8.
DANSER, A. H., VAN KATS, J. P., ADMIRAAL, P. J., DERKX, F. H., LAMERS, J. M.,
VERDOUW, P. D., SAXENA, P. R. & SCHALEKAMP, M. A. (1994) Cardiac renin and
angiotensins. Uptake from plasma versus in situ synthesis. Hypertension, 24, 37-48.
DARBY, I. A., ALDRED, P., CRAWFORD, R. J., FERNLEY, R. T., NIALL, H. D.,
PENSCHOW, J. D., RYAN, G. B. & COGHLAN, J. P. (1985) Renin gene expression in
vessels of the ovine renal cortex. J Hypertens, 3, 9-11.
DARBY, I. A. & SERNIA, C. (1995) In situ hybridization and immunohistochemistry of
renal angiotensinogen in neonatal and adult rat kidneys. Cell Tissue Res, 281, 197-206.
DE BRITO, O. M. & SCORRANO, L. (2008) Mitofusin 2 tethers endoplasmic reticulum to
mitochondria. Nature, 456, 605-10.
DE CAVANAGH, E. M., FERDER, L., TOBLLI, J. E., PIOTRKOWSKI, B., STELLA, I.,
FRAGA, C. G. & INSERRA, F. (2008a) Renal mitochondrial impairment is attenuated by
AT1 blockade in experimental Type I diabetes. Am J Physiol Heart Circ Physiol, 294,
H456-65.
Hepatic Mitochondrial Renin-Angiotensin Systems
James R A Skipworth 180
DE CAVANAGH, E. M., FERDER, M., INSERRA, F. & FERDER, L. (2009) Angiotensin
II, mitochondria, cytoskeletal, and extracellular matrix connections: an integrating
viewpoint. Am J Physiol Heart Circ Physiol, 296, H550-8.
DE CAVANAGH, E. M., FLORES, I., FERDER, M., INSERRA, F. & FERDER, L.
(2008b) Renin-angiotensin system inhibitors protect against age-related changes in rat liver
mitochondrial DNA content and gene expression. Exp Gerontol, 43, 919-28.
DE CAVANAGH, E. M., INSERRA, F. & FERDER, L. (2011) Angiotensin II blockade: a
strategy to slow ageing by protecting mitochondria? Cardiovasc Res, 89, 31-40.
DE CAVANAGH, E. M., INSERRA, F., FERDER, M. & FERDER, L. (2007) From
mitochondria to disease: role of the renin-angiotensin system. Am J Nephrol, 27, 545-53.
DE CAVANAGH, E. M., PIOTRKOWSKI, B., BASSO, N., STELLA, I., INSERRA, F.,
FERDER, L. & FRAGA, C. G. (2003) Enalapril and losartan attenuate mitochondrial
dysfunction in aged rats. Faseb J, 17, 1096-8.
DE CAVANAGH, E. M., TOBLLI, J. E., FERDER, L., PIOTRKOWSKI, B., STELLA, I.,
FRAGA, C. G. & INSERRA, F. (2005) Angiotensin II blockade improves mitochondrial
function in spontaneously hypertensive rats. Cell Mol Biol (Noisy-le-grand), 51, 573-8.
DE CAVANAGH, E. M., TOBLLI, J. E., FERDER, L., PIOTRKOWSKI, B., STELLA, I.
& INSERRA, F. (2006) Renal mitochondrial dysfunction in spontaneously hypertensive rats
is attenuated by losartan but not by amlodipine. Am J Physiol Regul Integr Comp Physiol,
290, R1616-25.
DE GASPARO, M., CATT, K. J., INAGAMI, T., WRIGHT, J. W. & UNGER, T. (2000)
International union of pharmacology. XXIII. The angiotensin II receptors. Pharmacol Rev,
52, 415-72.
DE MELLO, W. C. (1998) Intracellular angiotensin II regulates the inward calcium current
in cardiac myocytes. Hypertension, 32, 976-82.
DE MELLO, W. C. (2006) Renin increments the inward calcium current in the failing heart.
J Hypertens, 24, 1181-6.
DEBERNARDI-VENON, W., MARTINI, S., BIASI, F., VIZIO, B., TERMINE, A., POLI,
G., BRUNELLO, F., ALESSANDRIA, C., BONARDI, R., SARACCO, G., RIZZETTO, M.

Hepatic Mitochondrial Renin-Angiotensin Systems
James R A Skipworth 181
& MARZANO, A. (2007) AT1 receptor antagonist Candesartan in selected cirrhotic
patients: effect on portal pressure and liver fibrosis markers. J Hepatol, 46, 1026-33.
DECUYPERE, J. P., MONACO, G., BULTYNCK, G., MISSIAEN, L., DE SMEDT, H. &
PARYS, J. B. (2011) The IP(3) receptor-mitochondria connection in apoptosis and
autophagy. Biochim Biophys Acta, 1813, 1003-13.
DENG, A., TANG, T., SINGH, P., WANG, C., SATRIANO, J., THOMSON, S. C. &
BLANTZ, R. C. (2009) Regulation of oxygen utilization by angiotensin II in chronic kidney
disease. Kidney Int, 75, 197-204.
DESCHEPPER, C. F., MELLON, S. H., CUMIN, F., BAXTER, J. D. & GANONG, W. F.
(1986) Analysis by immunocytochemistry and in situ hybridization of renin and its mRNA
in kidney, testis, adrenal, and pituitary of the rat. Proc Natl Acad Sci U S A, 83, 7552-6.
DIKALOVA, A. E., BIKINEYEVA, A. T., BUDZYN, K., NAZAREWICZ, R. R.,
MCCANN, L., LEWIS, W., HARRISON, D. G. & DIKALOV, S. I. (2010) Therapeutic
targeting of mitochondrial superoxide in hypertension. Circ Res, 107, 106-16.
DOI, Y., ATARASHI, K., FRANCO-SAENZ, R. & MULROW, P. J. (1984) Effect of
changes in sodium or potassium balance, and nephrectomy, on adrenal renin and aldosterone
concentrations. Hypertension, 6, I124-9.
DONOGHUE, M., HSIEH, F., BARONAS, E., GODBOUT, K., GOSSELIN, M.,
STAGLIANO, N., DONOVAN, M., WOOLF, B., ROBISON, K., JEYASEELAN, R.,
BREITBART, R. E. & ACTON, S. (2000) A novel angiotensin-converting enzyme-related
carboxypeptidase (ACE2) converts angiotensin I to angiotensin 1-9. Circ Res, 87, E1-9.
DOUGHAN, A. & DIKALOV, S. (2005) Angiotensin II increases mitochondrial superoxide
production in endothelial cells: a potential link between NADPH oxidase and mitochondrial
dysfunction. Free Radic Biol Med(in Davies, K.; SFRBM 12th Annual Meeting: Program
and Abstracts), 39 (Suppl. 1), S23.
DOUGHAN, A. K., HARRISON, D. G. & DIKALOV, S. I. (2008) Molecular mechanisms
of angiotensin II-mediated mitochondrial dysfunction: linking mitochondrial oxidative
damage and vascular endothelial dysfunction. Circ Res, 102, 488-96.
DOUGLAS, J. G. (1987) Angiotensin receptor subtypes of the kidney cortex. Am J Physiol,
253, F1-7.

Hepatic Mitochondrial Renin-Angiotensin Systems
James R A Skipworth 182
DREHER, D., JORNOT, L. & JUNOD, A. F. (1995) Effects of hypoxanthine-xanthine
oxidase on Ca2+ stores and protein synthesis in human endothelial cells. Circ Res, 76, 388-
95.
DULIN, N. O., ERNSBERGER, P., SUCIU, D. J. & DOUGLAS, J. G. (1994) Rabbit renal
epithelial angiotensin II receptors. Am J Physiol, 267, F776-82.
DZAU, V. J. (1989) Multiple pathways of angiotensin production in the blood vessel wall:
evidence, possibilities and hypotheses. J Hypertens, 7, 933-6.
DZAU, V. J., BURT, D. W. & PRATT, R. E. (1988) Molecular biology of the renin-
angiotensin system. Am J Physiol, 255, F563-73.
EKKER, M., TRONIK, D. & ROUGEON, F. (1989) Extra-renal transcription of the renin
genes in multiple tissues of mice and rats. Proc Natl Acad Sci U S A, 86, 5155-8.
ERDMANN, B., FUXE, K. & GANTEN, D. (1996) Subcellular localization of angiotensin
II immunoreactivity in the rat cerebellar cortex. Hypertension, 28, 818-24.
ERMAK, G. & DAVIES, K. J. (2002) Calcium and oxidative stress: from cell signaling to
cell death. Mol Immunol, 38, 713-21.
FERDER, L., INSERRA, F., ROMANO, L., ERCOLE, L. & PSZENNY, V. (1993) Effects
of angiotensin-converting enzyme inhibition on mitochondrial number in the aging mouse.
Am J Physiol, 265, C15-8.
FERGUSON, S. S. (2001) Evolving concepts in G protein-coupled receptor endocytosis: the
role in receptor desensitization and signaling. Pharmacol Rev, 53, 1-24.
FERNANDES, F. B., PLAVNIK, F. L., TEIXEIRA, A. M., CHRISTOFALO, D. M.,
AJZEN, S. A., HIGA, E. M., RONCHI, F. A., SESSO, R. C. & CASARINI, D. E. (2008)
Association of urinary N-domain Angiotensin I-converting enzyme with plasma
inflammatory markers and endothelial function. Mol Med, 14, 429-35.
FLORYK, D. & HOUSTEK, J. (1999) Tetramethyl rhodamine methyl ester (TMRM) is
suitable for cytofluorometric measurements of mitochondrial membrane potential in cells
treated with digitonin. Biosci Rep, 19, 27-34.
FOLSCH, H., GUIARD, B., NEUPERT, W. & STUART, R. A. (1996) Internal targeting
signal of the BCS1 protein: a novel mechanism of import into mitochondria. EMBO J, 15,
479-87.

Hepatic Mitochondrial Renin-Angiotensin Systems
James R A Skipworth 183
FOURNIER, D., LUFT, F. C., BADER, M., GANTEN, D. & ANDRADE-NAVARRO, M.
A. (2012) Emergence and evolution of the renin-angiotensin-aldosterone system. J Mol Med
(Berl), 90, 495-508.
FOWLER, J. D., KRUETH, S. B., BERNLOHR, D. A. & KATZ, S. A. (2009) Renin
dynamics in adipose tissue: adipose tissue control of local renin concentrations. Am J
Physiol Endocrinol Metab, 296, E343-50.
FRIEDMAN, J. R., LACKNER, L. L., WEST, M., DIBENEDETTO, J. R., NUNNARI, J.
& VOELTZ, G. K. (2011) ER tubules mark sites of mitochondrial division. Science, 334,
358-62.
FRIEDMAN, S. L. (2008) Mechanisms of hepatic fibrogenesis. Gastroenterology, 134,
1655-69.
FUXE, K., GANTEN, D., HOKFELT, T. & BOLME, P. (1976) Immunohistochemical
evidence for the existence of angiotensin II-containing nerve terminals in the brain and
spinal cord in the rat. Neurosci Lett, 2, 229-34.
FUXE, K., GANTEN, D., HOKFELT, T., LOCATELLI, V., POULSEN, K., STOCK, G.,
RIX, E. & TAUGNER, R. (1980) Renin-like immunocytochemical activity in the rat and
mouse brain. Neurosci Lett, 18, 245-50.
FYHRQUIST, F. & SAIJONMAA, O. (2008) Renin-angiotensin system revisited. J Intern
Med, 264, 224-36.
GANONG, W. F. (1995) Reproduction and the renin-angiotensin system. Neurosci
Biobehav Rev, 19, 241-50.
GARLID, K. D., JABUREK, M. & JEZEK, P. (1998) The mechanism of proton transport
mediated by mitochondrial uncoupling proteins. FEBS Lett, 438, 10-4.
GARNIER, A., ZOLL, J., FORTIN, D., N'GUESSAN, B., LEFEBVRE, F., GENY, B.,
METTAUER, B., VEKSLER, V. & VENTURA-CLAPIER, R. (2009) Control by
circulating factors of mitochondrial function and transcription cascade in heart failure: a role
for endothelin-1 and angiotensin II. Circ Heart Fail, 2, 342-50.
GEE, K. R., BROWN, K. A., CHEN, W. N., BISHOP-STEWART, J., GRAY, D. &
JOHNSON, I. (2000) Chemical and physiological characterization of fluo-4 Ca(2+)-
indicator dyes. Cell Calcium, 27, 97-106.

Hepatic Mitochondrial Renin-Angiotensin Systems
James R A Skipworth 184
GEMBARDT, F., STERNER-KOCK, A., IMBODEN, H., SPALTEHOLZ, M., REIBITZ,
F., SCHULTHEISS, H. P., SIEMS, W. E. & WALTHER, T. (2005) Organ-specific
distribution of ACE2 mRNA and correlating peptidase activity in rodents. Peptides, 26,
1270-7.
GIRONACCI, M. M., VALERA, M. S., YUJNOVSKY, I. & PENA, C. (2004)
Angiotensin-(1-7) inhibitory mechanism of norepinephrine release in hypertensive rats.
Hypertension, 44, 783-7.
GONZALEZ-GAITAN, M. (2003) Signal dispersal and transduction through the endocytic
pathway. Nat Rev Mol Cell Biol, 4, 213-24.
GRACE, J. A., HERATH, C. B., MAK, K. Y., BURRELL, L. M. & ANGUS, P. W. (2012)
Update on new aspects of the renin-angiotensin system in liver disease: clinical implications
and new therapeutic options. Clin Sci (Lond), 123, 225-39.
GRECO, S., ELIA, M. G., MUSCELLA, A., STORELLI, C. & MARSIGLIANTE, S.
(2002) AT1 angiotensin II receptor mediates intracellular calcium mobilization in normal
and cancerous breast cells in primary culture. Cell Calcium, 32, 1-10.
GROBE, J. L., DER SARKISSIAN, S., STEWART, J. M., MESZAROS, J. G., RAIZADA,
M. K. & KATOVICH, M. J. (2007) ACE2 overexpression inhibits hypoxia-induced
collagen production by cardiac fibroblasts. Clin Sci (Lond), 113, 357-64.
GROVER, A. K., SAMSON, S. E., FOMIN, V. P. & WERSTIUK, E. S. (1995) Effects of
peroxide and superoxide on coronary artery: ANG II response and sarcoplasmic reticulum
Ca2+ pump. Am J Physiol, 269, C546-53.
GWATHMEY, T. M., PENDERGRASS, K. D., REID, S. D., ROSE, J. C., DIZ, D. I. &
CHAPPELL, M. C. (2010) Angiotensin-(1-7)-angiotensin-converting enzyme 2 attenuates
reactive oxygen species formation to angiotensin II within the cell nucleus. Hypertension,
55, 166-71.
GWATHMEY, T. M., SHALTOUT, H. A., PENDERGRASS, K. D., PIRRO, N. T.,
FIGUEROA, J. P., ROSE, J. C., DIZ, D. I. & CHAPPELL, M. C. (2009) Nuclear
angiotensin II type 2 (AT2) receptors are functionally linked to nitric oxide production. Am
J Physiol Renal Physiol, 296, F1484-93.
HABIBI, J., WHALEY-CONNELL, A., HAYDEN, M. R., DEMARCO, V. G.,
SCHNEIDER, R., SOWERS, S. D., KARUPARTHI, P., FERRARIO, C. M. & SOWERS, J.

Hepatic Mitochondrial Renin-Angiotensin Systems
James R A Skipworth 185
R. (2008) Renin inhibition attenuates insulin resistance, oxidative stress, and pancreatic
remodeling in the transgenic Ren2 rat. Endocrinology, 149, 5643-53.
HABOUZIT, E., RICHARD, H., SANCHEZ, H., KOULMANN, N., SERRURIER, B.,
MONNET, R., VENTURA-CLAPIER, R. & BIGARD, X. (2009) Decreased muscle ACE
activity enhances functional response to endurance training in rats, without change in
muscle oxidative capacity or contractile phenotype. J Appl Physiol, 107, 346-53.
HACKENTHAL, E., PAUL, M., GANTEN, D. & TAUGNER, R. (1990) Morphology,
physiology, and molecular biology of renin secretion. Physiol Rev, 70, 1067-116.
HAGEN, TM., YOWE DL., BARTHOLOMEW, JC., WEHR, CM., DO, KL., PARK, J-Y.
& BRUCE N. AMES, BN. (1997) Mitochondrial decay in hepatocytes from old rats:
Membrane potential declines, heterogeneity and oxidants increase. Proc Natl Acad Sci U S
A, 94, 3064–3069.
HAJNOCZKY, G., CSORDAS, G. & YI, M. (2002) Old players in a new role:
mitochondria-associated membranes, VDAC, and ryanodine receptors as contributors to
calcium signal propagation from endoplasmic reticulum to the mitochondria. Cell Calcium,
32, 363-77.
HALLER, H., LINDSCHAU, C., ERDMANN, B., QUASS, P. & LUFT, F. C. (1996)
Effects of intracellular angiotensin II in vascular smooth muscle cells. Circ Res, 79, 765-72.
HALLER, H., LINDSCHAU, C., QUASS, P. & LUFT, F. C. (1999) Intracellular actions of
angiotensin II in vascular smooth muscle cells. J Am Soc Nephrol, 10 Suppl 11, S75-83.
HARRIS, P. J. & NAVAR, L. G. (1985) Tubular transport responses to angiotensin. Am J
Physiol, 248, F621-30.
HAYASHI, T. & SU, T. P. (2007) Sigma-1 receptor chaperones at the ER-mitochondrion
interface regulate Ca(2+) signaling and cell survival. Cell, 131, 596-610.
HAYNES, C. M. & RON, D. (2010) The mitochondrial UPR - protecting organelle protein
homeostasis. J Cell Sci, 123, 3849-55.
HEIN, L., BARSH, G. S., PRATT, R. E., DZAU, V. J. & KOBILKA, B. K. (1995)
Behavioural and cardiovascular effects of disrupting the angiotensin II type-2 receptor in
mice. Nature, 377, 744-7.

Hepatic Mitochondrial Renin-Angiotensin Systems
James R A Skipworth 186
HEIN, L., MEINEL, L., PRATT, R. E., DZAU, V. J. & KOBILKA, B. K. (1997)
Intracellular trafficking of angiotensin II and its AT1 and AT2 receptors: evidence for
selective sorting of receptor and ligand. Mol Endocrinol, 11, 1266-77.
HERATH, C. B., LUBEL, J. S., JIA, Z., VELKOSKA, E., CASLEY, D., BROWN, L.,
TIKELLIS, C., BURRELL, L. M. & ANGUS, P. W. (2009) Portal pressure responses and
angiotensin peptide production in rat liver are determined by relative activity of ACE and
ACE2. Am J Physiol Gastrointest Liver Physiol, 297, G98-G106.
HILLENKAMP, F., KARAS, M., BEAVIS, R. C. & CHAIT, B. T. (1991) Matrix-assisted
laser desorption/ionization mass spectrometry of biopolymers. Anal Chem, 63, 1193A-
1203A.
HIROSE, A., ONO, M., SAIBARA, T., NOZAKI, Y., MASUDA, K., YOSHIOKA, A.,
TAKAHASHI, M., AKISAWA, N., IWASAKI, S., OBEN, J. A. & ONISHI, S. (2007)
Angiotensin II type 1 receptor blocker inhibits fibrosis in rat nonalcoholic steatohepatitis.
Hepatology, 45, 1375-81.
HITOMI, H., KIYOMOTO, H. & NISHIYAMA, A. (2007) Angiotensin II and oxidative
stress. Curr Opin Cardiol, 22, 311-5.
HOBART, P. M., FOGLIANO, M., O'CONNOR, B. A., SCHAEFER, I. M. & CHIRGWIN,
J. M. (1984) Human renin gene: structure and sequence analysis. Proc Natl Acad Sci U S A,
81, 5026-30.
HOLLENBERG, N. K., CHENITZ, W. R., ADAMS, D. F. & WILLIAMS, G. H. (1974)
Reciprocal influence of salt intake on adrenal glomerulosa and renal vascular responses to
angiotensin II in normal man. J Clin Invest, 54, 34-42.
HOUILLIER, P., CHAMBREY, R., ACHARD, J. M., FROISSART, M., POGGIOLI, J. &
PAILLARD, M. (1996) Signaling pathways in the biphasic effect of angiotensin II on apical
Na/H antiport activity in proximal tubule. Kidney Int, 50, 1496-505.
HUANG, J., HARA, Y., ANRATHER, J., SPETH, R. C., IADECOLA, C. & PICKEL, V.
M. (2003) Angiotensin II subtype 1A (AT1A) receptors in the rat sensory vagal complex:
subcellular localization and association with endogenous angiotensin. Neuroscience, 122,
21-36.

Hepatic Mitochondrial Renin-Angiotensin Systems
James R A Skipworth 187
HUNDAL, T., NORLING, B. & ERNSTER, L. (1984) The oligomycin sensitivity
conferring protein (OSCP) of beef heart mitochondria: studies of its binding to F1 and its
function. J Bioenerg Biomembr, 16, 535-50.
HUNYADY, L. (1999) Molecular mechanisms of angiotensin II receptor internalization. J
Am Soc Nephrol, 10 Suppl 11, S47-56.
HUNYADY, L. & CATT, K. J. (2006) Pleiotropic AT1 receptor signaling pathways
mediating physiological and pathogenic actions of angiotensin II. Mol Endocrinol, 20, 953-
70.
HUNYADY, L., CATT, K. J., CLARK, A. J. & GABORIK, Z. (2000) Mechanisms and
functions of AT(1) angiotensin receptor internalization. Regul Pept, 91, 29-44.
IBANEZ, P., SOLIS, N., PIZARRO, M., AGUAYO, G., DUARTE, I., MIQUEL, J. F.,
ACCATINO, L. & ARRESE, M. (2007) Effect of losartan on early liver fibrosis
development in a rat model of nonalcoholic steatohepatitis. J Gastroenterol Hepatol, 22,
846-51.
IMAI, T., MIYAZAKI, H., HIROSE, S., HORI, H., HAYASHI, T., KAGEYAMA, R.,
OHKUBO, H., NAKANISHI, S. & MURAKAMI, K. (1983) Cloning and sequence analysis
of cDNA for human renin precursor. Proc Natl Acad Sci U S A, 80, 7405-9.
IMAIZUMI, T., TAKESHITA, A., NAKAMURA, N., SAKAI, K., HIROOKA, Y.,
SUZUKI, S., YOSHIDA, M. & NAKAMURA, M. (1990) Effects of captopril on forearm
oxygen consumption during dynamic handgrip exercise in patients with congestive heart
failure. Jpn Heart J, 31, 817-28.
IMIG, J. D., NAVAR, G. L., ZOU, L. X., O'REILLY, K. C., ALLEN, P. L., KAYSEN, J.
H., HAMMOND, T. G. & NAVAR, L. G. (1999) Renal endosomes contain angiotensin
peptides, converting enzyme, and AT(1A) receptors. Am J Physiol, 277, F303-11.
INGELFINGER, J. R., JUNG, F., DIAMANT, D., HAVERAN, L., LEE, E., BREM, A. &
TANG, S. S. (1999) Rat proximal tubule cell line transformed with origin-defective SV40
DNA: autocrine ANG II feedback. Am J Physiol, 276, F218-27.
INGERT, C., GRIMA, M., COQUARD, C., BARTHELMEBS, M. & IMBS, J. L. (2002)
Contribution of angiotensin II internalization to intrarenal angiotensin II levels in rats. Am J
Physiol Renal Physiol, 283, F1003-10.

Hepatic Mitochondrial Renin-Angiotensin Systems
James R A Skipworth 188
IVANKOVIC, M., CUKUSIC, A., GOTIC, I., SKROBOT, N., MATIJASIC, M.,
POLANCEC, D. & RUBELJ, I. (2007) Telomerase activity in HeLa cervical carcinoma cell
line proliferation. Biogerontology, 8, 163-72.
IWANAMI, J., MOGI, M., IWAI, M. & HORIUCHI, M. (2009) Inhibition of the renin-
angiotensin system and target organ protection. Hypertens Res, 32, 229-37.
JABUREK, M., VARECHA, M., GIMENO, R. E., DEMBSKI, M., JEZEK, P., ZHANG,
M., BURN, P., TARTAGLIA, L. A. & GARLID, K. D. (1999) Transport function and
regulation of mitochondrial uncoupling proteins 2 and 3. J Biol Chem, 274, 26003-7.
JIMENEZ, E., CARO, M. C., MARSIGLIANTE, S. & MONTIEL, M. (1999) Angiotensin
II receptor internalization and signaling in isolated rat hepatocytes. Biochem Pharmacol, 57,
1125-31.
JONDEAU, G., DIB, J. C., DUBOURG, O. & BOURDARIAS, J. P. (1997) Relation of
functional improvement in congestive heart failure after quinapril therapy to peripheral
limitation. Am J Cardiol, 79, 635-8.
KANEDA, K., EKATAKSIN, W., SOGAWA, M., MATSUMURA, A., CHO, A. &
KAWADA, N. (1998) Endothelin-1-induced vasoconstriction causes a significant increase
in portal pressure of rat liver: localized constrictive effect on the distal segment of
preterminal portal venules as revealed by light and electron microscopy and serial
reconstruction. Hepatology, 27, 735-47.
KARIMIAN, G., BUIST-HOMAN, M., MIKUS, B., HENNING, R. H., FABER, K. N. &
MOSHAGE, H. (2012) Angiotensin II protects primary rat hepatocytes against bile salt-
induced apoptosis. PLoS One, 7, e52647.
KAWAS, L. H., MCCOY, A. T., YAMAMOTO, B. J., WRIGHT, J. W. & HARDING, J.
W. (2012) Development of angiotensin IV analogs as hepatocyte growth factor/Met
modifiers. J Pharmacol Exp Ther, 340, 539-48.
KEM, D. C. & BROWN, R. D. (1990) Renin--from beginning to end. N Engl J Med, 323,
1136-7.
KERINS, D. M., HAO, Q. & VAUGHAN, D. E. (1995) Angiotensin induction of PAI-1
expression in endothelial cells is mediated by the hexapeptide angiotensin IV. J Clin Invest,
96, 2515-20.

Hepatic Mitochondrial Renin-Angiotensin Systems
James R A Skipworth 189
KIM, M. Y., BAIK, S. K., PARK, D. H., JANG, Y. O., SUK, K. T., YEA, C. J., LEE, I. Y.,
KIM, J. W., KIM, H. S., KWON, S. O., CHO, M. Y., KO, S. B., CHANG, S. J., UM, S. H.
& HAN, K. H. (2008) Angiotensin receptor blockers are superior to angiotensin-converting
enzyme inhibitors in the suppression of hepatic fibrosis in a bile duct-ligated rat model. J
Gastroenterol, 43, 889-96.
KIMURA, S., ZHANG, G. X., NISHIYAMA, A., SHOKOJI, T., YAO, L., FAN, Y. Y.,
RAHMAN, M. & ABE, Y. (2005) Mitochondria-derived reactive oxygen species and
vascular MAP kinases: comparison of angiotensin II and diazoxide. Hypertension, 45, 438-
44.
KISHI, K., MUROMOTO, N., NAKAYA, Y., MIYATA, I., HAGI, A., HAYASHI, H. &
EBINA, Y. (1998) Bradykinin directly triggers GLUT4 translocation via an insulin-
independent pathway. Diabetes, 47, 550-8.
KOBORI, H., HARRISON-BERNARD, L. M. & NAVAR, L. G. (2001a) Enhancement of
angiotensinogen expression in angiotensin II-dependent hypertension. Hypertension, 37,
1329-35.
KOBORI, H., HARRISON-BERNARD, L. M. & NAVAR, L. G. (2001b) Expression of
angiotensinogen mRNA and protein in angiotensin II-dependent hypertension. J Am Soc
Nephrol, 12, 431-9.
KOBORI, H., HARRISON-BERNARD, L. M. & NAVAR, L. G. (2002) Urinary excretion
of angiotensinogen reflects intrarenal angiotensinogen production. Kidney Int, 61, 579-85.
KOBORI, H., OZAWA, Y., SUZAKI, Y., PRIETO-CARRASQUERO, M. C.,
NISHIYAMA, A., SHOJI, T., COHEN, E. P. & NAVAR, L. G. (2006) Young Scholars
Award Lecture: Intratubular angiotensinogen in hypertension and kidney diseases. Am J
Hypertens, 19, 541-50.
KUMAR, R., SINGH, V. P. & BAKER, K. M. (2007) The intracellular renin-angiotensin
system: a new paradigm. Trends Endocrinol Metab, 18, 208-14.
KUZNETSOV, A. V., VEKSLER, V., GELLERICH, F. N., SAKS, V., MARGREITER, R.
& KUNZ, W. S. (2008) Analysis of mitochondrial function in situ in permeabilized muscle
fibers, tissues and cells. Nat Protoc, 3, 965-76.
LAMBERT, D. W., YARSKI, M., WARNER, F. J., THORNHILL, P., PARKIN, E. T.,
SMITH, A. I., HOOPER, N. M. & TURNER, A. J. (2005) Tumor necrosis factor-alpha

Hepatic Mitochondrial Renin-Angiotensin Systems
James R A Skipworth 190
convertase (ADAM17) mediates regulated ectodomain shedding of the severe-acute
respiratory syndrome-coronavirus (SARS-CoV) receptor, angiotensin-converting enzyme-2
(ACE2). J Biol Chem, 280, 30113-9.
LANTELME, P., ROHRWASSER, A., GOCIMAN, B., HILLAS, E., CHENG, T., PETTY,
G., THOMAS, J., XIAO, S., ISHIGAMI, T., HERRMANN, T., TERREROS, D. A.,
WARD, K. & LALOUEL, J. M. (2002) Effects of dietary sodium and genetic background
on angiotensinogen and Renin in mouse. Hypertension, 39, 1007-14.
LARKIN, J. E., FRANK, B. C., GASPARD, R. M., DUKA, I., GAVRAS, H. &
QUACKENBUSH, J. (2004) Cardiac transcriptional response to acute and chronic
angiotensin II treatments. Physiol Genomics, 18, 152-66.
LATT, S. A. & STETTEN, G. (1976) Spectral studies on 33258 Hoechst and related
bisbenzimidazole dyes useful for fluorescent detection of deoxyribonucleic acid synthesis. J
Histochem Cytochem, 24, 24-33.
LATT, S. A., STETTEN, G., JUERGENS, L. A., WILLARD, H. F. & SCHER, C. D.
(1975) Recent developments in the detection of deoxyribonucleic acid synthesis by 33258
Hoechst fluorescence. J Histochem Cytochem, 23, 493-505.
LAU, T., CARLSSON, P. O. & LEUNG, P. S. (2004) Evidence for a local angiotensin-
generating system and dose-dependent inhibition of glucose-stimulated insulin release by
angiotensin II in isolated pancreatic islets. Diabetologia, 47, 240-8.
LAVRENTYEV, E. N., ESTES, A. M. & MALIK, K. U. (2007) Mechanism of high glucose
induced angiotensin II production in rat vascular smooth muscle cells. Circ Res, 101, 455-
64.
LAVRENTYEV, E. N. & MALIK, K. U. (2009) High glucose-induced Nox1-derived
superoxides downregulate PKC-betaII, which subsequently decreases ACE2 expression and
ANG(1-7) formation in rat VSMCs. Am J Physiol Heart Circ Physiol, 296, H106-18.
LEARY, S. C., MICHAUD, D., LYONS, C. N., HALE, T. M., BUSHFIELD, T. L.,
ADAMS, M. A. & MOYES, C. D. (2002) Bioenergetic remodeling of heart during
treatment of spontaneously hypertensive rats with enalapril. Am J Physiol Heart Circ
Physiol, 283, H540-8.
LEE, D. K., LANCA, A. J., CHENG, R., NGUYEN, T., JI, X. D., GOBEIL, F., JR.,
CHEMTOB, S., GEORGE, S. R. & O'DOWD, B. F. (2004) Agonist-independent nuclear
Hepatic Mitochondrial Renin-Angiotensin Systems
James R A Skipworth 191
localization of the Apelin, angiotensin AT1, and bradykinin B2 receptors. J Biol Chem, 279,
7901-8.
LEE, M. Y. & GRIENDLING, K. K. (2008) Redox signaling, vascular function, and
hypertension. Antioxid Redox Signal, 10, 1045-59.
LEE-KIRSCH, M. A., GAUDET, F., CARDOSO, M. C. & LINDPAINTNER, K. (1999)
Distinct renin isoforms generated by tissue-specific transcription initiation and alternative
splicing. Circ Res, 84, 240-6.
LEEB-LUNDBERG, L. M., MARCEAU, F., MULLER-ESTERL, W., PETTIBONE, D. J.
& ZURAW, B. L. (2005) International union of pharmacology. XLV. Classification of the
kinin receptor family: from molecular mechanisms to pathophysiological consequences.
Pharmacol Rev, 57, 27-77.
LENKEI, Z., PALKOVITS, M., CORVOL, P. & LLORENS-CORTES, C. (1997)
Expression of angiotensin type-1 (AT1) and type-2 (AT2) receptor mRNAs in the adult rat
brain: a functional neuroanatomical review. Front Neuroendocrinol, 18, 383-439.
LEUNG, P. S. (2007) The physiology of a local renin-angiotensin system in the pancreas. J
Physiol, 580, 31-7.
LEUNG, P. S. & CARLSSON, P. O. (2001) Tissue renin-angiotensin system: its expression,
localization, regulation and potential role in the pancreas. J Mol Endocrinol, 26, 155-64.
LEUNG, P. S., CHAN, H. C., FU, L. X. & WONG, P. Y. (1997) Localization of
angiotensin II receptor subtypes AT1 and AT2 in the pancreas of rodents. J Endocrinol,
153, 269-74.
LEUNG, P. S., CHAN, W. P., WONG, T. P. & SERNIA, C. (1999) Expression and
localization of the renin-angiotensin system in the rat pancreas. J Endocrinol, 160, 13-9.
LEUNG, P. S. & IP, S. P. (2006) Pancreatic acinar cell: its role in acute pancreatitis. Int J
Biochem Cell Biol, 38, 1024-30.
LEUNG, P. S. & SERNIA, C. (2003) The renin-angiotensin system and male reproduction:
new functions for old hormones. J Mol Endocrinol, 30, 263-70.
LI, G., WANG, M., HAO, L., LOO, W. T., JIN, L., CHEUNG, M. N., CHOW, L. W. &
NG, E. L. (2014) Angiotensin II induces mitochondrial dysfunction and promotes apoptosis

Hepatic Mitochondrial Renin-Angiotensin Systems
James R A Skipworth 192
via JNK signalling pathway in primary mouse calvaria osteoblast. Arch Oral Biol, 59, 513-
523.
LI, W., MOORE, M. J., VASILIEVA, N., SUI, J., WONG, S. K., BERNE, M. A.,
SOMASUNDARAN, M., SULLIVAN, J. L., LUZURIAGA, K., GREENOUGH, T. C.,
CHOE, H. & FARZAN, M. (2003) Angiotensin-converting enzyme 2 is a functional
receptor for the SARS coronavirus. Nature, 426, 450-4.
LI, X. C., CARRETERO, O. A., NAVAR, L. G. & ZHUO, J. L. (2006) AT1 receptor-
mediated accumulation of extracellular angiotensin II in proximal tubule cells: role of
cytoskeleton microtubules and tyrosine phosphatases. Am J Physiol Renal Physiol, 291,
F375-83.
LI, X. C., HOPFER, U. & ZHUO, J. L. (2009) AT1 receptor-mediated uptake of angiotensin
II and NHE-3 expression in proximal tubule cells through a microtubule-dependent
endocytic pathway. Am J Physiol Renal Physiol, 297, F1342-52.
LI, X. C., NAVAR, L. G., SHAO, Y. & ZHUO, J. L. (2007) Genetic deletion of AT1a
receptors attenuates intracellular accumulation of ANG II in the kidney of AT1a receptor-
deficient mice. Am J Physiol Renal Physiol, 293, F586-93.
LI, X. C. & ZHUO, J. L. (2007) Selective knockdown of AT1 receptors by RNA
interference inhibits Val5-ANG II endocytosis and NHE-3 expression in immortalized
rabbit proximal tubule cells. Am J Physiol Cell Physiol, 293, C367-78.
LI, X. C. & ZHUO, J. L. (2008a) In vivo regulation of AT1a receptor-mediated intracellular
uptake of [125I]Val5-ANG II in the kidneys and adrenals of AT1a receptor-deficient mice.
Am J Physiol Renal Physiol, 294, F293-302.
LI, X. C. & ZHUO, J. L. (2008b) Intracellular ANG II directly induces in vitro transcription
of TGF-beta1, MCP-1, and NHE-3 mRNAs in isolated rat renal cortical nuclei via activation
of nuclear AT1a receptors. Am J Physiol Cell Physiol, 294, C1034-45.
LICEA, H., WALTERS, M. R. & NAVAR, L. G. (2002) Renal nuclear angiotensin II
receptors in normal and hypertensive rats. Acta Physiol Hung, 89, 427-38.
LILL, R., STUART, R. A., DRYGAS, M. E., NARGANG, F. E. & NEUPERT, W. (1992)
Import of cytochrome c heme lyase into mitochondria: a novel pathway into the
intermembrane space. EMBO J, 11, 449-56.

Hepatic Mitochondrial Renin-Angiotensin Systems
James R A Skipworth 193
LIND, R. W., SWANSON, L. W. & GANTEN, D. (1985) Organization of angiotensin II
immunoreactive cells and fibers in the rat central nervous system. An immunohistochemical
study. Neuroendocrinology, 40, 2-24.
LINDQUIST, S. (1986) The heat-shock response. Annu Rev Biochem, 55, 1151-91.
LIPPOLDT, A., BUNNEMANN, B., UEKI, A., ROSEN, L., CINTRA, A., HASSELROT,
U., METZGER, R., HILGENFELDT, U., BROSNIHAN, B., GANTEN, D. & ET AL.
(1994) On the plasticity of the cerebellar renin-angiotensin system: localization of
components and effects of mechanical perturbation. Brain Res, 668, 144-59.
LOEW, L. M., TUFT, R. A., CARRINGTON, W. & FAY, F. S. (1993) Imaging in five
dimensions: time-dependent membrane potentials in individual mitochondria. Biophys J, 65,
2396-407.
MAILLOUX, R. J. & HARPER, M. E. (2011) Uncoupling proteins and the control of
mitochondrial reactive oxygen species production. Free Radic Biol Med, 51, 1106-15.
MARGOLIUS, H. S. (1996) Kallikreins and kinins. Molecular characteristics and cellular
and tissue responses. Diabetes, 45 Suppl 1, S14-9.
MARIAPPAN, N., ELKS, C. M., HAQUE, M. & FRANCIS, J. (2012) Interaction of TNF
with angiotensin II contributes to mitochondrial oxidative stress and cardiac damage in rats.
PLoS One, 7, e46568.
MARKTANNER, R., NACKE, P., FEINDT, P., HOHLFELD, T., SCHIPKE, J. D. &
GAMS, E. (2006) Delayed preconditioning via Angiotensin-converting enzyme inhibition:
pros and cons from an experimental study. Clin Exp Pharmacol Physiol, 33, 787-92.
MATSUMURA, T., YOSHIHARA, H., JEFFS, R., TAKEI, Y., NUKINA, S., HIJIOKA, T.,
EVANS, R. K., KAUFFMAN, F. C. & THURMAN, R. G. (1992) Hormones increase
oxygen uptake in periportal and pericentral regions of the liver lobule. Am J Physiol, 262,
G645-50.
MATSUSAKA, T. & ICHIKAWA, I. (1997) Biological functions of angiotensin and its
receptors. Annu Rev Physiol, 59, 395-412.
MEHTA, P. K. & GRIENDLING, K. K. (2007) Angiotensin II cell signaling: physiological
and pathological effects in the cardiovascular system. Am J Physiol Cell Physiol, 292, C82-
97.
Hepatic Mitochondrial Renin-Angiotensin Systems
James R A Skipworth 194
MENARD, J. (1993) Anthology of the renin-angiotensin system: a one hundred reference
approach to angiotensin II antagonists. J Hypertens Suppl, 11, S3-11.
MESSADI, E., VINCENT, M. P., GRIOL-CHARHBILI, V., MANDET, C., COLUCCI, J.,
KREGE, J. H., BRUNEVAL, P., BOUBY, N., SMITHIES, O., ALHENC-GELAS, F. &
RICHER, C. (2010) Genetically determined angiotensin converting enzyme level and
myocardial tolerance to ischemia. FASEB J, 24, 4691-700.
METZGER, R., BOHLE, R. M., PAULS, K., EICHNER, G., ALHENC-GELAS, F.,
DANILOV, S. M. & FRANKE, F. E. (1999) Angiotensin-converting enzyme in non-
neoplastic kidney diseases. Kidney Int, 56, 1442-54.
MILLER, R. J. (1998) Mitochondria - the Kraken wakes! Trends Neurosci, 21, 95-7.
MITSUISHI, M., MIYASHITA, K., MURAKI, A. & ITOH, H. (2009) Angiotensin II
reduces mitochondrial content in skeletal muscle and affects glycemic control. Diabetes, 58,
710-7.
MIYATA, T., TAGUCHI, T., UEHARA, M., ISAMI, S., KISHIKAWA, H., KANEKO, K.,
ARAKI, E. & SHICHIRI, M. (1998) Bradykinin potentiates insulin-stimulated glucose
uptake and enhances insulin signal through the bradykinin B2 receptor in dog skeletal
muscle and rat L6 myoblasts. Eur J Endocrinol, 138, 344-52.
MIZUNO, K., HOFFMAN, L. H., MCKENZIE, J. C. & INAGAMI, T. (1988) Presence of
renin secretory granules in rat adrenal gland and stimulation of renin secretion by
angiotensin II but not by adrenocorticotropin. J Clin Invest, 82, 1007-16.
MODRALL, J. G., SADJADI, J., BROSNIHAN, K. B., GALLAGHER, P. E., YU, C. H.,
KRAMER, G. L., BERNSTEIN, K. E. & CHAPPELL, M. C. (2004) Depletion of tissue
angiotensin-converting enzyme differentially influences the intrarenal and urinary
expression of angiotensin peptides. Hypertension, 43, 849-53.
MONTGOMERY, H. E., MARSHALL, R., HEMINGWAY, H., MYERSON, S.,
CLARKSON, P., DOLLERY, C., HAYWARD, M., HOLLIMAN, D. E., JUBB, M.,
WORLD, M., THOMAS, E. L., BRYNES, A. E., SAEED, N., BARNARD, M., BELL, J.
D., PRASAD, K., RAYSON, M., TALMUD, P. J. & HUMPHRIES, S. E. (1998) Human
gene for physical performance. Nature, 393, 221-2.
MORINELLI, T. A., RAYMOND, J. R., BALDYS, A., YANG, Q., LEE, M. H.,
LUTTRELL, L. & ULLIAN, M. E. (2007) Identification of a putative nuclear localization

Hepatic Mitochondrial Renin-Angiotensin Systems
James R A Skipworth 195
sequence within ANG II AT(1A) receptor associated with nuclear activation. Am J Physiol
Cell Physiol, 292, C1398-408.
MULLINS, J. J., BURT, D. W., WINDASS, J. D., MCTURK, P., GEORGE, H. &
BRAMMAR, W. J. (1982) Molecular cloning of two distinct renin genes from the DBA/2
mouse. EMBO J, 1, 1461-6.
MULLINS, J. J., PETERS, J. & GANTEN, D. (1990) Fulminant hypertension in transgenic
rats harbouring the mouse Ren-2 gene. Nature, 344, 541-4.
MURPHEY, L. J., GAINER, J. V., VAUGHAN, D. E. & BROWN, N. J. (2000)
Angiotensin-converting enzyme insertion/deletion polymorphism modulates the human in
vivo metabolism of bradykinin. Circulation, 102, 829-32.
MURPHY, J. E., PADILLA, B. E., HASDEMIR, B., COTTRELL, G. S. & BUNNETT, N.
W. (2009) Endosomes: a legitimate platform for the signaling train. Proc Natl Acad Sci U S
A, 106, 17615-22.
MYERSON, S., HEMINGWAY, H., BUDGET, R., MARTIN, J., HUMPHRIES, S. &
MONTGOMERY, H. (1999) Human angiotensin I-converting enzyme gene and endurance
performance. J Appl Physiol, 87, 1313-6.
MYHILL, N., LYNES, E. M., NANJI, J. A., BLAGOVESHCHENSKAYA, A. D., FEI, H.,
CARMINE SIMMEN, K., COOPER, T. J., THOMAS, G. & SIMMEN, T. (2008) The
subcellular distribution of calnexin is mediated by PACS-2. Mol Biol Cell, 19, 2777-88.
NABI, A. H., KAGESHIMA, A., UDDIN, M. N., NAKAGAWA, T., PARK, E. Y. &
SUZUKI, F. (2006) Binding properties of rat prorenin and renin to the recombinant rat
renin/prorenin receptor prepared by a baculovirus expression system. Int J Mol Med, 18,
483-8.
NAVAR, L. G., MITCHELL, K. D., HARRISON-BERNARD, L. M., KOBORI, H. &
NISHIYAMA, A. (2001) Intrarenal angiotensin II levels in normal and hypertensive states.
J Renin Angiotensin Aldosterone Syst, 2, S176-S184.
NEGRE-SALVAYRE, A., HIRTZ, C., CARRERA, G., CAZENAVE, R., TROLY, M.,
SALVAYRE, R., PENICAUD, L. & CASTEILLA, L. (1997) A role for uncoupling protein-
2 as a regulator of mitochondrial hydrogen peroxide generation. FASEB J, 11, 809-15.

Hepatic Mitochondrial Renin-Angiotensin Systems
James R A Skipworth 196
NEUBAUER, B., MACHURA, K., CHEN, M., WEINSTEIN, L. S., OPPERMANN, M.,
SEQUEIRA-LOPEZ, M. L., GOMEZ, R. A., SCHNERMANN, J., CASTROP, H., KURTZ,
A. & WAGNER, C. (2009) Development of vascular renin expression in the kidney
critically depends on the cyclic AMP pathway. Am J Physiol Renal Physiol, 296, F1006-12.
NEUPERT, W. (1997) Protein import into mitochondria. Annu Rev Biochem, 66, 863-917.
NGUYEN, G. (2011) Renin, (pro)renin and receptor: an update. Clin Sci (Lond), 120, 169-
78.
NGUYEN, G. (2010) The (pro)renin receptor in health and disease. Ann Med, 42, 13-8.
NGUYEN, G. & CONTREPAS, A. (2008) Physiology and pharmacology of the (pro)renin
receptor. Curr Opin Pharmacol, 8, 127-32.
NGUYEN, G., DELARUE, F., BERROU, J., RONDEAU, E. & SRAER, J. D. (1996)
Specific receptor binding of renin on human mesangial cells in culture increases
plasminogen activator inhibitor-1 antigen. Kidney Int, 50, 1897-903.
NGUYEN, G., DELARUE, F., BURCKLE, C., BOUZHIR, L., GILLER, T. & SRAER, J.
D. (2002) Pivotal role of the renin/prorenin receptor in angiotensin II production and
cellular responses to renin. J Clin Invest, 109, 1417-27.
NICHOLSON, D. W., HERGERSBERG, C. & NEUPERT, W. (1988) Role of cytochrome c
heme lyase in the import of cytochrome c into mitochondria. J Biol Chem, 263, 19034-42.
NITSCHKE, R., HENGER, A., RICKEN, S., GLOY, J., MULLER, V., GREGER, R. &
PAVENSTADT, H. (2000) Angiotensin II increases the intracellular calcium activity in
podocytes of the intact glomerulus. Kidney Int, 57, 41-9.
NOSTRAMO, R., TILLINGER, A., SAAVEDRA, J. M., KUMAR, A., PANDEY, V.,
SEROVA, L., KVETNANSKY, R. & SABBAN, E. L. (2012) Regulation of angiotensin II
type 2 receptor gene expression in the adrenal medulla by acute and repeated
immobilization stress. J Endocrinol, 215, 291-301.
PAIZIS, G., COOPER, M. E., SCHEMBRI, J. M., TIKELLIS, C., BURRELL, L. M. &
ANGUS, P. W. (2002) Up-regulation of components of the renin-angiotensin system in the
bile duct-ligated rat liver. Gastroenterology, 123, 1667-76.
PAIZIS, G., TIKELLIS, C., COOPER, M. E., SCHEMBRI, J. M., LEW, R. A., SMITH, A.
I., SHAW, T., WARNER, F. J., ZUILLI, A., BURRELL, L. M. & ANGUS, P. W. (2005)

Hepatic Mitochondrial Renin-Angiotensin Systems
James R A Skipworth 197
Chronic liver injury in rats and humans upregulates the novel enzyme angiotensin
converting enzyme 2. Gut, 54, 1790-6.
PANDYA, J. D., NUKALA, V. N. & SULLIVAN, P. G. (2013) Concentration dependent
effect of calcium on brain mitochondrial bioenergetics and oxidative stress parameters.
Front Neuroenergetics, 5, 10.
PANG, S., CHUBB, A. J., SCHWAGER, S. L., EHLERS, M. R., STURROCK, E. D. &
HOOPER, N. M. (2001) Roles of the juxtamembrane and extracellular domains of
angiotensin-converting enzyme in ectodomain shedding. Biochem J, 358, 185-92.
PANTHIER, J. J., FOOTE, S., CHAMBRAUD, B., STROSBERG, A. D., CORVOL, P. &
ROUGEON, F. (1982) Complete amino acid sequence and maturation of the mouse
submaxillary gland renin precursor. Nature, 298, 90-2.
PAUL, M., POYAN MEHR, A. & KREUTZ, R. (2006) Physiology of local renin-
angiotensin systems. Physiol Rev, 86, 747-803.
PEACH, M. J. (1977) Renin-angiotensin system: biochemistry and mechanisms of action.
Physiol Rev, 57, 313-70.
PETERS, J., FARRENKOPF, R., CLAUSMEYER, S., ZIMMER, J., KANTACHUVESIRI,
S., SHARP, M. G. & MULLINS, J. J. (2002) Functional significance of prorenin
internalization in the rat heart. Circ Res, 90, 1135-41.
PETERS, J. & GANTEN, D. (1998) Adrenal renin expression and its role in ren-2
transgenic rats TGR(mREN2)27. Horm Metab Res, 30, 350-4.
PETERS, J., KRANZLIN, B., SCHAEFFER, S., ZIMMER, J., RESCH, S., BACHMANN,
S., GRETZ, N. & HACKENTHAL, E. (1996) Presence of renin within intramitochondrial
dense bodies of the rat adrenal cortex. Am J Physiol, 271, E439-50.
PETERS, J., MUNTER, K., BADER, M., HACKENTHAL, E., MULLINS, J. J. &
GANTEN, D. (1993) Increased adrenal renin in transgenic hypertensive rats,
TGR(mREN2)27, and its regulation by cAMP, angiotensin II, and calcium. J Clin Invest,
91, 742-7.
PETERS, J., OBERMULLER, N., WOYTH, A., PETERS, B., MASER-GLUTH, C.,
KRANZLIN, B. & GRETZ, N. (1999) Losartan and angiotensin II inhibit aldosterone

Hepatic Mitochondrial Renin-Angiotensin Systems
James R A Skipworth 198
production in anephric rats via different actions on the intraadrenal renin-angiotensin
system. Endocrinology, 140, 675-82.
PFANNER, N., HOEBEN, P., TROPSCHUG, M. & NEUPERT, W. (1987) The carboxyl-
terminal two-thirds of the ADP/ATP carrier polypeptide contains sufficient information to
direct translocation into mitochondria. J Biol Chem, 262, 14851-4.
PIERUZZI, F., ABASSI, Z. A. & KEISER, H. R. (1995) Expression of renin-angiotensin
system components in the heart, kidneys, and lungs of rats with experimental heart failure.
Circulation, 92, 3105-12.
PIOTRKOWSKI, B., FRAGA, C. G. & DE CAVANAGH, E. M. (2007) Mitochondrial
function and nitric oxide metabolism are modified by enalapril treatment in rat kidney. Am J
Physiol Regul Integr Comp Physiol, 292, R1494-501.
PIOTRKOWSKI, B., KOCH, O. R., DE CAVANAGH, E. M. & FRAGA, C. G. (2009)
Cardiac mitochondrial function and tissue remodelling are improved by a non-
antihypertensive dose of enalapril in spontaneously hypertensive rats. Free Radic Res, 43,
390-9.
POMPELLA, A., VISVIKIS, A., PAOLICCHI, A., DE TATA, V. & CASINI, A. F. (2003)
The changing faces of glutathione, a cellular protagonist. Biochem Pharmacol, 66, 1499-
503.
PORTUGAL, J. & WARING, M. J. (1988) Assignment of DNA binding sites for 4',6-
diamidine-2-phenylindole and bisbenzimide (Hoechst 33258). A comparative footprinting
study. Biochim Biophys Acta, 949, 158-68.
PRATT, R. E., OUELLETTE, A. J. & DZAU, V. J. (1983) Biosynthesis of renin:
multiplicity of active and intermediate forms. Proc Natl Acad Sci U S A, 80, 6809-13.
PRESCOTT, G., SILVERSIDES, D. W. & REUDELHUBER, T. L. (2002) Tissue activity
of circulating prorenin. Am J Hypertens, 15, 280-5.
PURI, P. L., AVANTAGGIATI, M. L., BURGIO, V. L., CHIRILLO, P., COLLEPARDO,
D., NATOLI, G., BALSANO, C. & LEVRERO, M. (1995) Reactive oxygen intermediates
mediate angiotensin II-induced c-Jun.c-Fos heterodimer DNA binding activity and
proliferative hypertrophic responses in myogenic cells. J Biol Chem, 270, 22129-34.

Hepatic Mitochondrial Renin-Angiotensin Systems
James R A Skipworth 199
RABILLOUD, T., VUILLARD, L., GILLY, C. & LAWRENCE, J. J. (1994) Silver-staining
of proteins in polyacrylamide gels: a general overview. Cell Mol Biol (Noisy-le-grand), 40,
57-75.
RACZ, K., PINET, F., GASC, J. M., GUYENE, T. T. & CORVOL, P. (1992) Coexpression
of renin, angiotensinogen, and their messenger ribonucleic acids in adrenal tissues. J Clin
Endocrinol Metab, 75, 730-7.
RAJAGOPAL, K., WHALEN, E. J., VIOLIN, J. D., STIBER, J. A., ROSENBERG, P. B.,
PREMONT, R. T., COFFMAN, T. M., ROCKMAN, H. A. & LEFKOWITZ, R. J. (2006)
Beta-arrestin2-mediated inotropic effects of the angiotensin II type 1A receptor in isolated
cardiac myocytes. Proc Natl Acad Sci U S A, 103, 16284-9.
RAMMOS, G., TSEKE, P. & ZIAKKA, S. (2008) Vitamin D, the renin-angiotensin system,
and insulin resistance. Int Urol Nephrol, 40, 419-26.
RE, R. N. (1984) Cellular biology of the renin-angiotensin systems. Arch Intern Med, 144,
2037-41.
RE, R. N. (2003) Cardiac angiotensin II: an intracrine hormone? Am J Hypertens, 16, 426-7.
RE, R. N. & COOK, J. L. (2010) The mitochondrial component of intracrine action. Am J
Physiol Heart Circ Physiol, 299, H577-83.
RE, R. N., MACPHEE, A. A. & FALLON, J. T. (1981) Specific nuclear binding of
angiotensin II by rat liver and spleen nuclei. Clin Sci (Lond), 61 Suppl 7, 245s-247s.
REAMS, G. P. (1992) Angiotensin-converting enzyme in renal and cerebral tissue and
implications for successful blood pressure management. Am J Cardiol, 69, 59C-64C.
REDDING, K. M., CHEN, B. L., SINGH, A., RE, R. N., NAVAR, L. G., SETH, D. M.,
SIGMUND, C. D., TANG, W. W. & COOK, J. L. (2010) Transgenic mice expressing an
intracellular fluorescent fusion of angiotensin II demonstrate renal thrombotic
microangiopathy and elevated blood pressure. Am J Physiol Heart Circ Physiol, 298,
H1807-18.
REGULSKA, K., STANISZ, B. & REGULSKI, M. (2013) The Renin-Angiotensin System
As A Target of Novel Anticancer Therapy. Curr Pharm Des, 19, 7103-25.
REHLING, P., WIEDEMANN, N., PFANNER, N. & TRUSCOTT, K. N. (2001) The
mitochondrial import machinery for preproteins. Crit Rev Biochem Mol Biol, 36, 291-336.
Hepatic Mitochondrial Renin-Angiotensin Systems
James R A Skipworth 200
REID, I. A., MORRIS, B. J. & GANONG, W. F. (1978) The renin-angiotensin system.
Annu Rev Physiol, 40, 377-410.
RIGAT, B., HUBERT, C., ALHENC-GELAS, F., CAMBIEN, F., CORVOL, P. &
SOUBRIER, F. (1990) An insertion/deletion polymorphism in the angiotensin I-converting
enzyme gene accounting for half the variance of serum enzyme levels. J Clin Invest, 86,
1343-6.
RIZZUTO, R., MARCHI, S., BONORA, M., AGUIARI, P., BONONI, A., DE STEFANI,
D., GIORGI, C., LEO, S., RIMESSI, A., SIVIERO, R., ZECCHINI, E. & PINTON, P.
(2009) Ca(2+) transfer from the ER to mitochondria: when, how and why. Biochim Biophys
Acta, 1787, 1342-51.
RIZZUTO, R., PINTON, P., CARRINGTON, W., FAY, F. S., FOGARTY, K. E.,
LIFSHITZ, L. M., TUFT, R. A. & POZZAN, T. (1998) Close contacts with the endoplasmic
reticulum as determinants of mitochondrial Ca2+ responses. Science, 280, 1763-6.
ROBERTSON, A. L., JR. & KHAIRALLAH, P. A. (1971a) Angiotensin II: rapid
localization in nuclei of smooth and cardiac muscle. Science, 172, 1138-9.
ROBERTSON, A. L., JR. & KHAIRALLAH, P. A. (1971b) Angiotensin II: rapid
localization in nuclei of smooth and cardiac muscle. Science, 172, 1138-9.
ROCKEY, D. (1997) The cellular pathogenesis of portal hypertension: stellate cell
contractility, endothelin, and nitric oxide. Hepatology, 25, 2-5.
ROHRWASSER, A., MORGAN, T., DILLON, H. F., ZHAO, L., CALLAWAY, C. W.,
HILLAS, E., ZHANG, S., CHENG, T., INAGAMI, T., WARD, K., TERREROS, D. A. &
LALOUEL, J. M. (1999) Elements of a paracrine tubular renin-angiotensin system along the
entire nephron. Hypertension, 34, 1265-74.
ROISE, D. & SCHATZ, G. (1988) Mitochondrial presequences. J Biol Chem, 263, 4509-11.
RONCHI, F. A., ANDRADE, M. C., CARMONA, A. K., KRIEGER, J. E. & CASARINI,
D. E. (2005) N-domain angiotensin-converting enzyme isoform expression in tissues of
Wistar and spontaneously hypertensive rats. J Hypertens, 23, 1869-78.
RONCHI, F. A., IRIGOYEN, M. C. & CASARINI, D. E. (2007) Association of somatic
and N-domain angiotensin-converting enzymes from Wistar rat tissue with renal
dysfunction in diabetes mellitus. J Renin Angiotensin Aldosterone Syst, 8, 34-41.
Hepatic Mitochondrial Renin-Angiotensin Systems
James R A Skipworth 201
RONG, P., BERKA, J. L., KELLY, D. J., ALCORN, D. & SKINNER, S. L. (1994) Renin
processing and secretion in adrenal and retina of transgenic (mREN-2)27 rats. Kidney Int,
46, 1583-7.
ROSIVALL, L. & NAVAR, L. G. (1983) Effects on renal hemodynamics of intra-arterial
infusions of angiotensins I and II. Am J Physiol, 245, F181-7.
ROUSSET, S., ALVES-GUERRA, M. C., MOZO, J., MIROUX, B., CASSARD-
DOULCIER, A. M., BOUILLAUD, F. & RICQUIER, D. (2004) The biology of
mitochondrial uncoupling proteins. Diabetes, 53 Suppl 1, S130-5.
ROWLAND, A. A. & VOELTZ, G. K. (2012) Endoplasmic reticulum-mitochondria
contacts: function of the junction. Nat Rev Mol Cell Biol, 13, 607-25.
RUBIO, M. A., RINEHART, J. J., KRETT, B., DUVEZIN-CAUBET, S., REICHERT, A.
S., SOLL, D. & ALFONZO, J. D. (2008) Mammalian mitochondria have the innate ability
to import tRNAs by a mechanism distinct from protein import. Proc Natl Acad Sci U S A,
105, 9186-91.
RUSINOL, A. E., CUI, Z., CHEN, M. H. & VANCE, J. E. (1994) A unique mitochondria-
associated membrane fraction from rat liver has a high capacity for lipid synthesis and
contains pre-Golgi secretory proteins including nascent lipoproteins. J Biol Chem, 269,
27494-502.
SADJADI, J., KRAMER, G. L., YU, C. H., WELBORN, M. B., 3RD & MODRALL, J. G.
(2005) Angiotensin II exerts positive feedback on the intrarenal renin-angiotensin system by
an angiotensin converting enzyme-dependent mechanism. J Surg Res, 129, 272-7.
SAMPAIO, W. O., SOUZA DOS SANTOS, R. A., FARIA-SILVA, R., DA MATA
MACHADO, L. T., SCHIFFRIN, E. L. & TOUYZ, R. M. (2007) Angiotensin-(1-7) through
receptor Mas mediates endothelial nitric oxide synthase activation via Akt-dependent
pathways. Hypertension, 49, 185-92.
SANDERS, P. M., RUSSELL, S. T. & TISDALE, M. J. (2005) Angiotensin II directly
induces muscle protein catabolism through the ubiquitin-proteasome proteolytic pathway
and may play a role in cancer cachexia. Br J Cancer, 93, 425-34.
SANTOS, R. A., SIMOES E SILVA, A. C., MARIC, C., SILVA, D. M., MACHADO, R.
P., DE BUHR, I., HERINGER-WALTHER, S., PINHEIRO, S. V., LOPES, M. T., BADER,
M., MENDES, E. P., LEMOS, V. S., CAMPAGNOLE-SANTOS, M. J., SCHULTHEISS,

Hepatic Mitochondrial Renin-Angiotensin Systems
James R A Skipworth 202
H. P., SPETH, R. & WALTHER, T. (2003) Angiotensin-(1-7) is an endogenous ligand for
the G protein-coupled receptor Mas. Proc Natl Acad Sci U S A, 100, 8258-63.
SAOTOME, M., SAFIULINA, D., SZABADKAI, G., DAS, S., FRANSSON, A.,
ASPENSTROM, P., RIZZUTO, R. & HAJNOCZKY, G. (2008) Bidirectional Ca2+-
dependent control of mitochondrial dynamics by the Miro GTPase. Proc Natl Acad Sci U S
A, 105, 20728-33.
SARIS, J. J., DERKX, F. H., LAMERS, J. M., SAXENA, P. R., SCHALEKAMP, M. A. &
DANSER, A. H. (2001) Cardiomyocytes bind and activate native human prorenin : role of
soluble mannose 6-phosphate receptors. Hypertension, 37, 710-5.
SARIS, J. J., T HOEN, P. A., GARRELDS, I. M., DEKKERS, D. H., DEN DUNNEN, J.
T., LAMERS, J. M. & JAN DANSER, A. H. (2006) Prorenin induces intracellular signaling
in cardiomyocytes independently of angiotensin II. Hypertension, 48, 564-71.
SCHMIDT, O., PFANNER, N. & MEISINGER, C. (2010) Mitochondrial protein import:
from proteomics to functional mechanisms. Nat Rev Mol Cell Biol, 11, 655-67.
SEALEY, J. E., GLORIOSO, N., ITSKOVITZ, J. & LARAGH, J. H. (1986) Prorenin as a
reproductive hormone. New form of the renin system. Am J Med, 81, 1041-6.
SECHI, S. & CHAIT, B. T. (1998) Modification of cysteine residues by alkylation. A tool
in peptide mapping and protein identification. Anal Chem, 70, 5150-8.
SHAO, W., SETH, D. M. & NAVAR, L. G. (2009) Augmentation of endogenous intrarenal
angiotensin II levels in Val5-ANG II-infused rats. Am J Physiol Renal Physiol, 296, F1067-
71.
SHARP, M. G., FETTES, D., BROOKER, G., CLARK, A. F., PETERS, J., FLEMING, S.
& MULLINS, J. J. (1996) Targeted inactivation of the Ren-2 gene in mice. Hypertension,
28, 1126-31.
SHERROD, M., LIU, X., ZHANG, X. & SIGMUND, C. D. (2005) Nuclear localization of
angiotensinogen in astrocytes. Am J Physiol Regul Integr Comp Physiol, 288, R539-46.
SHOSHAN-BARMATZ, V., DE PINTO, V., ZWECKSTETTER, M., RAVIV, Z.,
KEINAN, N. & ARBEL, N. (2010) VDAC, a multi-functional mitochondrial protein
regulating cell life and death. Mol Aspects Med, 31, 227-85.

Hepatic Mitochondrial Renin-Angiotensin Systems
James R A Skipworth 203
SHUM, M., PINARD, S., GUIMOND, M. O., LABBE, S. M., ROBERGE, C.,
BAILLARGEON, J. P., LANGLOIS, M. F., ALTERMAN, M., WALLINDER, C.,
HALLBERG, A., CARPENTIER, A. C. & GALLO-PAYET, N. (2013) Angiotensin II type
2 receptor promotes adipocyte differentiation and restores adipocyte size in high-fat/high-
fructose diet-induced insulin resistance in rats. Am J Physiol Endocrinol Metab, 304, E197-
210.
SIHN, G., ROUSSELLE, A., VILIANOVITCH, L., BURCKLE, C. & BADER, M. (2010)
Physiology of the (pro)renin receptor: Wnt of change? Kidney Int, 78, 246-56.
SIMS, N. R. & ANDERSON, M. F. (2008) Isolation of mitochondria from rat brain using
Percoll density gradient centrifugation. Nat Protoc, 3, 1228-39.
SINGH, V. P., LE, B., BHAT, V. B., BAKER, K. M. & KUMAR, R. (2007) High-glucose-
induced regulation of intracellular ANG II synthesis and nuclear redistribution in cardiac
myocytes. Am J Physiol Heart Circ Physiol, 293, H939-48.
SINGH, V. P., LE, B., KHODE, R., BAKER, K. M. & KUMAR, R. (2008) Intracellular
angiotensin II production in diabetic rats is correlated with cardiomyocyte apoptosis,
oxidative stress, and cardiac fibrosis. Diabetes, 57, 3297-306.
SIRETT, N. E., MCLEAN, A. S., BRAY, J. J. & HUBBARD, J. I. (1977) Distribution of
angiotensin II receptors in rat brain. Brain Res, 122, 299-312.
SLOT, J. W., POSTHUMA, G., CHANG, L. Y., CRAPO, J. D. & GEUZE, H. J. (1989)
Quantitative assessment of immuno-gold labeling in cryosections. Am J Anat, 185, 271-81.
SOINILA, S., MPITSOS, G. J. & SOINILA, J. (1992) Immunohistochemistry of
enkephalins: model studies on hapten-carrier conjugates and fixation methods. J Histochem
Cytochem, 40, 231-9.
SONG, K., ZHUO, J., CHAI, S. Y. & MENDELSOHN, F. A. (1992) A new method to
localize active renin in tissues by autoradiography: application to dog kidney. Kidney Int,
42, 639-46.
SOOKOIAN, S., FERNANDEZ, M. A. & CASTANO, G. (2005) Effects of six months
losartan administration on liver fibrosis in chronic hepatitis C patients: a pilot study. World
J Gastroenterol, 11, 7560-3.

Hepatic Mitochondrial Renin-Angiotensin Systems
James R A Skipworth 204
SPAT, A. & HUNYADY, L. (2004) Control of aldosterone secretion: a model for
convergence in cellular signaling pathways. Physiol Rev, 84, 489-539.
SPEICHER, K. D., KOLBAS, O., HARPER, S. & SPEICHER, D. W. (2000) Systematic
analysis of peptide recoveries from in-gel digestions for protein identifications in proteome
studies. J Biomol Tech, 11, 74-86.
SPETH, R. C., DAUBERT, D. L. & GROVE, K. L. (1999) Angiotensin II: a reproductive
hormone too? Regul Pept, 79, 25-40.
STURROCK, E. D., NATESH, R., VAN ROOYEN, J. M. & ACHARYA, K. R. (2004)
Structure of angiotensin I-converting enzyme. Cell Mol Life Sci, 61, 2677-86.
SUMBALOVA, Z., KUCHARSKA, J. & KRISTEK, F. (2010) Losartan improved
respiratory function and coenzyme Q content in brain mitochondria of young spontaneously
hypertensive rats. Cell Mol Neurobiol, 30, 751-8.
SUZUKI, Y., RUIZ-ORTEGA, M., GOMEZ-GUERRERO, C., TOMINO, Y. & EGIDO, J.
(2003) Angiotensin II, the immune system and renal diseases: another road for RAS?
Nephrol Dial Transplant, 18, 1423-6.
SZABADKAI, G., BIANCHI, K., VARNAI, P., DE STEFANI, D., WIECKOWSKI, M. R.,
CAVAGNA, D., NAGY, A. I., BALLA, T. & RIZZUTO, R. (2006) Chaperone-mediated
coupling of endoplasmic reticulum and mitochondrial Ca2+ channels. J Cell Biol, 175, 901-
11.
SZABADKAI, G. & RIZZUTO, R. (2004) Participation of endoplasmic reticulum and
mitochondrial calcium handling in apoptosis: more than just neighborhood? FEBS Lett, 567,
111-5.
TADEVOSYAN, A., MAGUY, A., VILLENEUVE, L. R., BABIN, J., BONNEFOY, A.,
ALLEN, B. G. & NATTEL, S. (2010) Nuclear-delimited angiotensin receptor-mediated
signaling regulates cardiomyocyte gene expression. J Biol Chem, 285, 22338-49.
TASKIN, E., OZDOGAN, K., KUNDUZ KINDAP, E. & DURSUN, N. (2014) The
restoration of kidney mitochondria function by inhibition of angiotensin-II production in
rats with acute adriamycin-induced nephrotoxicity. Ren Fail.

Hepatic Mitochondrial Renin-Angiotensin Systems
James R A Skipworth 205
TAUGNER, R., HACKENTHAL, E., NOBILING, R., HARLACHER, M. & REB, G.
(1981) The distribution of renin in the different segments of the renal arterial tree:
immunocytochemical investigation in the mouse kidney. Histochemistry, 73, 75-88.
TERUI, Y., SAITO, T., WATANABE, H., TOGASHI, H., KAWATA, S., KAMADA, Y. &
SAKUTA, S. (2002) Effect of angiotensin receptor antagonist on liver fibrosis in early
stages of chronic hepatitis C. Hepatology, 36, 1022.
THEKKUMKARA, T. & LINAS, S. L. (2002) Role of internalization in AT(1A) receptor
function in proximal tubule epithelium. Am J Physiol Renal Physiol, 282, F623-9.
THOMAS, W. G., THEKKUMKARA, T. J. & BAKER, K. M. (1996) Molecular
mechanisms of angiotensin II (AT1a) receptor endocytosis. Clin Exp Pharmacol Physiol, 23
Suppl 3, S74-80.
THOMPSON, J., RAITT, J., HUTCHINGS, L., DRENOS, F., BJARGO, E., LOSET, A.,
GROCOTT, M. & MONTGOMERY, H. (2007) Angiotensin-converting enzyme genotype
and successful ascent to extreme high altitude. High Alt Med Biol, 8, 278-85.
TIKELLIS, C., BIALKOWSKI, K., PETE, J., SHEEHY, K., SU, Q., JOHNSTON, C.,
COOPER, M. E. & THOMAS, M. C. (2008) ACE2 deficiency modifies renoprotection
afforded by ACE inhibition in experimental diabetes. Diabetes, 57, 1018-25.
TIMMERMANS, P. B. & SMITH, R. D. (1994) Angiotensin II receptor subtypes: selective
antagonists and functional correlates. Eur Heart J, 15 Suppl D, 79-87.
TIMMERMANS, P. B., WONG, P. C., CHIU, A. T., HERBLIN, W. F., BENFIELD, P.,
CARINI, D. J., LEE, R. J., WEXLER, R. R., SAYE, J. A. & SMITH, R. D. (1993)
Angiotensin II receptors and angiotensin II receptor antagonists. Pharmacol Rev, 45, 205-
51.
TIPNIS, S. R., HOOPER, N. M., HYDE, R., KARRAN, E., CHRISTIE, G. & TURNER, A.
J. (2000) A human homolog of angiotensin-converting enzyme. Cloning and functional
expression as a captopril-insensitive carboxypeptidase. J Biol Chem, 275, 33238-43.
TO, M. S., AROMATARIS, E. C., CASTRO, J., ROBERTS, M. L., BARRITT, G. J. &
RYCHKOV, G. Y. (2010) Mitochondrial uncoupler FCCP activates proton conductance but
does not block store-operated Ca(2+) current in liver cells. Arch Biochem Biophys, 495,
152-8.
Hepatic Mitochondrial Renin-Angiotensin Systems
James R A Skipworth 206
TOBLLI, J. E., MUNOZ, M. C., CAO, G., MELLA, J., PEREYRA, L. & MASTAI, R.
(2008) ACE inhibition and AT1 receptor blockade prevent fatty liver and fibrosis in obese
Zucker rats. Obesity (Silver Spring), 16, 770-6.
TOUYZ, R. M. (2005) Reactive oxygen species as mediators of calcium signaling by
angiotensin II: implications in vascular physiology and pathophysiology. Antioxid Redox
Signal, 7, 1302-14.
TOUYZ, R. M. & SCHIFFRIN, E. L. (2000) Signal transduction mechanisms mediating the
physiological and pathophysiological actions of angiotensin II in vascular smooth muscle
cells. Pharmacol Rev, 52, 639-72.
TSIANOS, G., ELEFTHERIOU, K. I., HAWE, E., WOOLRICH, L., WATT, M., WATT,
I., PEACOCK, A., MONTGOMERY, H. & GRANT, S. (2005) Performance at altitude and
angiotensin I-converting enzyme genotype. Eur J Appl Physiol, 93, 630-3.
TSIANOS, G., WOOLRICH-BURT, L., AITCHISON, T., PEACOCK, A., WATT, M.,
MONTGOMERY, H., WATT, I. & GRANT, S. (2006) Factors affecting a climber's ability
to ascend Mont Blanc. Eur J Appl Physiol, 96, 32-6.
TUNCER, I., OZBEK, H., UGRAS, S. & BAYRAM, I. (2003) Anti-fibrogenic effects of
captopril and candesartan cilexetil on the hepatic fibrosis development in rat. The effect of
AT1-R blocker on the hepatic fibrosis. Exp Toxicol Pathol, 55, 159-66.
TURNER, A. J., TIPNIS, S. R., GUY, J. L., RICE, G. & HOOPER, N. M. (2002)
ACEH/ACE2 is a novel mammalian metallocarboxypeptidase and a homologue of
angiotensin-converting enzyme insensitive to ACE inhibitors. Can J Physiol Pharmacol, 80,
346-53.
UEKI, M., KODA, M., YAMAMOTO, S., MATSUNAGA, Y. & MURAWAKI, Y. (2006)
Preventive and therapeutic effects of angiotensin II type 1 receptor blocker on hepatic
fibrosis induced by bile duct ligation in rats. J Gastroenterol, 41, 996-1004.
VAN KATS, J. P., CHAI, W., DUNCKER, D. J., SCHALEKAMP, M. A. & DANSER, A.
H. (2005) Adrenal angiotensin: origin and site of generation. Am J Hypertens, 18, 1104-10.
VAN KATS, J. P., SCHALEKAMP, M. A., VERDOUW, P. D., DUNCKER, D. J. &
DANSER, A. H. (2001) Intrarenal angiotensin II: interstitial and cellular levels and site of
production. Kidney Int, 60, 2311-7.
Hepatic Mitochondrial Renin-Angiotensin Systems
James R A Skipworth 207
VAN KESTEREN, C. A., DANSER, A. H., DERKX, F. H., DEKKERS, D. H., LAMERS,
J. M., SAXENA, P. R. & SCHALEKAMP, M. A. (1997) Mannose 6-phosphate receptor-
mediated internalization and activation of prorenin by cardiac cells. Hypertension, 30, 1389-
96.
VANCE, J. E. (1990) Phospholipid synthesis in a membrane fraction associated with
mitochondria. J Biol Chem, 265, 7248-56.
VATASSERY, G. T., SANTACRUZ, K. S., DEMASTER, E. G., QUACH, H. T. &
SMITH, W. E. (2004) Oxidative stress and inhibition of oxidative phosphorylation induced
by peroxynitrite and nitrite in rat brain subcellular fractions. Neurochem Int, 45, 963-70.
VICKERS, C., HALES, P., KAUSHIK, V., DICK, L., GAVIN, J., TANG, J., GODBOUT,
K., PARSONS, T., BARONAS, E., HSIEH, F., ACTON, S., PATANE, M., NICHOLS, A.
& TUMMINO, P. (2002) Hydrolysis of biological peptides by human angiotensin-
converting enzyme-related carboxypeptidase. J Biol Chem, 277, 14838-43.
VIGANO, A., TRUTSCHNIGG, B., KILGOUR, R. D., HAMEL, N., HORNBY, L.,
LUCAR, E., FOULKES, W., TREMBLAY, M. L. & MORAIS, J. A. (2009) Relationship
between angiotensin-converting enzyme gene polymorphism and body composition,
functional performance, and blood biomarkers in advanced cancer patients. Clin Cancer
Res, 15, 2442-7.
VON HEIJNE, G., STEPPUHN, J. & HERRMANN, R. G. (1989) Domain structure of
mitochondrial and chloroplast targeting peptides. Eur J Biochem, 180, 535-45.
VON THUN, A. M., VARI, R. C., EL-DAHR, S. S. & NAVAR, L. G. (1994)
Augmentation of intrarenal angiotensin II levels by chronic angiotensin II infusion. Am J
Physiol, 266, F120-8.
WALTERS, P. E., GASPARI, T. A. & WIDDOP, R. E. (2005) Angiotensin-(1-7) acts as a
vasodepressor agent via angiotensin II type 2 receptors in conscious rats. Hypertension, 45,
960-6.
WANG, T. & CHAN, Y. L. (1991) The role of phosphoinositide turnover in mediating the
biphasic effect of angiotensin II on renal tubular transport. J Pharmacol Exp Ther, 256, 309-
17.
Hepatic Mitochondrial Renin-Angiotensin Systems
James R A Skipworth 208
WANKA, H., KESSLER, N., ELLMER, J., ENDLICH, N., PETERS, B. S.,
CLAUSMEYER, S. & PETERS, J. (2009) Cytosolic renin is targeted to mitochondria and
induces apoptosis in H9c2 rat cardiomyoblasts. J Cell Mol Med, 13, 2926-37.
WEI, Y., CLARK, S. E., THYFAULT, J. P., UPTERGROVE, G. M., LI, W., WHALEY-
CONNELL, A. T., FERRARIO, C. M., SOWERS, J. R. & IBDAH, J. A. (2009) Oxidative
stress-mediated mitochondrial dysfunction contributes to angiotensin II-induced
nonalcoholic fatty liver disease in transgenic Ren2 rats. Am J Pathol, 174, 1329-37.
WILLIAMS, A. G., DHAMRAIT, S. S., WOOTTON, P. T., DAY, S. H., HAWE, E.,
PAYNE, J. R., MYERSON, S. G., WORLD, M., BUDGETT, R., HUMPHRIES, S. E. &
MONTGOMERY, H. E. (2004) Bradykinin receptor gene variant and human physical
performance. J Appl Physiol, 96, 938-42.
WILLIAMS, G. H. & HOLLENBERG, N. K. (1991) Functional derangements in the
regulation of aldosterone secretion in hypertension. Hypertension, 18, III143-9.
WONG, T. P., DEBNAM, E. S. & LEUNG, P. S. (2007) Involvement of an enterocyte
renin-angiotensin system in the local control of SGLT1-dependent glucose uptake across the
rat small intestinal brush border membrane. J Physiol, 584, 613-23.
WOODS, D. R., WORLD, M., RAYSON, M. P., WILLIAMS, A. G., JUBB, M.,
JAMSHIDI, Y., HAYWARD, M., MARY, D. A., HUMPHRIES, S. E. &
MONTGOMERY, H. E. (2002) Endurance enhancement related to the human angiotensin I-
converting enzyme I-D polymorphism is not due to differences in the cardiorespiratory
response to training. Eur J Appl Physiol, 86, 240-4.
XIA, H. & LAZARTIGUES, E. (2008) Angiotensin-converting enzyme 2 in the brain:
properties and future directions. J Neurochem, 107, 1482-94.
XIA, Y., BUJA, L. M. & MCMILLIN, J. B. (1998) Activation of the cytochrome c gene by
electrical stimulation in neonatal rat cardiac myocytes. Role of NRF-1 and c-Jun. J Biol
Chem, 273, 12593-8.
YAMAGUCHI, F., KAWANA, K., TANONAKA, K., KAMANO, I., IGARASHI, T.,
GEN, E., FUJIMOTO, Y., MAKI, T., SANBE, A., NASA, Y. & TAKEO, S. (1999)
Improvement of exercise capacity of rats with chronic heart failure by long-term treatment
with trandolapril. Br J Pharmacol, 126, 1585-92.

Hepatic Mitochondrial Renin-Angiotensin Systems
James R A Skipworth 209
YANG, H., ZENG, X. J., WANG, H. X., ZHANG, L. K., DONG, X. L., GUO, S., DU, J.,
LI, H. H. & TANG, C. S. (2011) Angiotensin IV protects against angiotensin II-induced
cardiac injury via AT4 receptor. Peptides, 32, 2108-15.
YANG, L., BATALLER, R., DULYX, J., COFFMAN, T. M., GINES, P., RIPPE, R. A. &
BRENNER, D. A. (2005) Attenuated hepatic inflammation and fibrosis in angiotensin type
1a receptor deficient mice. J Hepatol, 43, 317-23.
YIN, J. X., YANG, R. F., LI, S., RENSHAW, A. O., LI, Y. L., SCHULTZ, H. D. &
ZIMMERMAN, M. C. (2010) Mitochondria-produced superoxide mediates angiotensin II-
induced inhibition of neuronal potassium current. Am J Physiol Cell Physiol, 298, C857-65.
YOGEV, O. & PINES, O. (2011) Dual targeting of mitochondrial proteins: mechanism,
regulation and function. Biochim Biophys Acta, 1808, 1012-20.
YOKOHAMA, S., TOKUSASHI, Y., NAKAMURA, K., TAMAKI, Y., OKAMOTO, S.,
OKADA, M., ASO, K., HASEGAWA, T., AOSHIMA, M., MIYOKAWA, N., HANEDA,
M. & YONEDA, M. (2006) Inhibitory effect of angiotensin II receptor antagonist on hepatic
stellate cell activation in non-alcoholic steatohepatitis. World J Gastroenterol, 12, 322-6.
YOSHIJI, H., NOGUCHI, R. & FUKUI, H. (2005) Combined effect of an ACE inhibitor,
perindopril, and interferon on liver fibrosis markers in patients with chronic hepatitis C. J
Gastroenterol, 40, 215-6.
YOSHIJI, H., NOGUCHI, R., KOJIMA, H., IKENAKA, Y., KITADE, M., KAJI, K.,
UEMURA, M., YAMAO, J., FUJIMOTO, M., YAMAZAKI, M., TOYOHARA, M.,
MITORO, A. & FUKUI, H. (2006) Interferon augments the anti-fibrotic activity of an
angiotensin-converting enzyme inhibitor in patients with refractory chronic hepatitis C.
World J Gastroenterol, 12, 6786-91.
ZHANG, G. X., LU, X. M., KIMURA, S. & NISHIYAMA, A. (2007) Role of mitochondria
in angiotensin II-induced reactive oxygen species and mitogen-activated protein kinase
activation. Cardiovasc Res, 76, 204-12.
ZHANG, H., SCHMEISSER, A., GARLICHS, C. D., PLOTZE, K., DAMME, U.,
MUGGE, A. & DANIEL, W. G. (1999a) Angiotensin II-induced superoxide anion
generation in human vascular endothelial cells: role of membrane-bound NADH-/NADPH-
oxidases. Cardiovasc Res, 44, 215-22.

Hepatic Mitochondrial Renin-Angiotensin Systems
James R A Skipworth 210
ZHANG, J., BARAK, L. S., ANBORGH, P. H., LAPORTE, S. A., CARON, M. G. &
FERGUSON, S. S. (1999b) Cellular trafficking of G protein-coupled receptor/beta-arrestin
endocytic complexes. J Biol Chem, 274, 10999-1006.
ZHANG, J., FERGUSON, S. S., BARAK, L. S., ABER, M. J., GIROS, B., LEFKOWITZ,
R. J. & CARON, M. G. (1997) Molecular mechanisms of G protein-coupled receptor
signaling: role of G protein-coupled receptor kinases and arrestins in receptor
desensitization and resensitization. Receptors Channels, 5, 193-9.
ZHAO, J., LIU, J., PANG, X., WANG, S., WU, D., ZHANG, X. & FENG, L. (2013)
Angiotensin II induces C-reactive protein expression via AT1-ROS-MAPK-NF-kappaB
signal pathway in hepatocytes. Cell Physiol Biochem, 32, 569-80.
ZHONG, J. C., YU, X. Y., LIN, Q. X., LI, X. H., HUANG, X. Z., XIAO, D. Z. & LIN, S.
G. (2008) Enhanced angiotensin converting enzyme 2 regulates the insulin/Akt signalling
pathway by blockade of macrophage migration inhibitory factor expression. Br J
Pharmacol, 153, 66-74.
ZHOU, A., CARRELL, R. W., MURPHY, M. P., WEI, Z., YAN, Y., STANLEY, P. L.,
STEIN, P. E., BROUGHTON PIPKIN, F. & READ, R. J. (2010) A redox switch in
angiotensinogen modulates angiotensin release. Nature, 468, 108-11.
ZHUO, J., ANDERSON, W. P., SONG, K. & MENDELSOHN, F. A. (1996)
Autoradiographic localization of active renin in the juxtaglomerular apparatus of the dog
kidney: effects of sodium intake. Clin Exp Pharmacol Physiol, 23, 291-8.
ZHUO, J., MOELLER, I., JENKINS, T., CHAI, S. Y., ALLEN, A. M., OHISHI, M. &
MENDELSOHN, F. A. (1998) Mapping tissue angiotensin-converting enzyme and
angiotensin AT1, AT2 and AT4 receptors. J Hypertens, 16, 2027-37.
ZHUO, J., THOMAS, D., HARRIS, P. J. & SKINNER, S. L. (1992) The role of
endogenous angiotensin II in the regulation of renal haemodynamics and proximal fluid
reabsorption in the rat. J Physiol, 453, 1-13.
ZHUO, J. L. (2006) Intracrine renin and angiotensin II: a novel role in cardiovascular and
renal cellular regulation. J Hypertens, 24, 1017-20.
ZHUO, J. L., CARRETERO, O. A. & LI, X. C. (2006a) Effects of AT1 receptor-mediated
endocytosis of extracellular Ang II on activation of nuclear factor-kappa B in proximal
tubule cells. Ann N Y Acad Sci, 1091, 336-45.

Hepatic Mitochondrial Renin-Angiotensin Systems
James R A Skipworth 211
ZHUO, J. L., IMIG, J. D., HAMMOND, T. G., ORENGO, S., BENES, E. & NAVAR, L. G.
(2002) Ang II accumulation in rat renal endosomes during Ang II-induced hypertension:
role of AT(1) receptor. Hypertension, 39, 116-21.
ZHUO, J. L. & LI, X. C. (2007) Novel roles of intracrine angiotensin II and signalling
mechanisms in kidney cells. J Renin Angiotensin Aldosterone Syst, 8, 23-33.
ZHUO, J. L., LI, X. C., GARVIN, J. L., NAVAR, L. G. & CARRETERO, O. A. (2006b)
Intracellular ANG II induces cytosolic Ca2+ mobilization by stimulating intracellular AT1
receptors in proximal tubule cells. Am J Physiol Renal Physiol, 290, F1382-90.
ZOU, L. X., IMIG, J. D., HYMEL, A. & NAVAR, L. G. (1998) Renal uptake of circulating
angiotensin II in Val5-angiotensin II infused rats is mediated by AT1 receptor. Am J
Hypertens, 11, 570-8.

Hepatic Mitochondrial Renin-Angiotensin Systems
James R A Skipworth 212
APPENDICES

Hepatic Mitochondrial Renin-Angiotensin Systems
James R A Skipworth 213
APP1. Experimental Working Solutions
APP1. a. Krebs-Ringer Buffer (KRB)
KRB is a buffer solution utilised for maintenance of osmotic balance and pH within cells, as
well as providing access to water and inorganic ions. 1 L of KRB is made up by dissolving
the following in 1 L of distilled water at pH 7.4 and storing at 4 ˚C (see Table APP1. a.).
Ion/Reagent Molecular
Weight
Final
Concentration
NaCl 58.44 125 mM
KCl 74.55 5 mM
Na3PO4.12H2O 380.12 1 mM
MgSO4.7H2O 246.48 1 mM
Glucose 180.16 5 mM
HEPES
(Organic chemical
buffer)
238.3 20 mM
Table APP1. a. The ingredients for KRB Solution
APP1. b. Phosphate-Buffered Saline (PBS) (Invitrogen (Cat. No. 20012-068)); Carlsbad,
CA, USA)
PBS is an isotonic water-based salt solution, which has many uses as a physiological buffer
as its phosphate groups aid in the maintenance of a constant pH of 7.2. It contains the
following within distilled water (see Table APP1. b.).
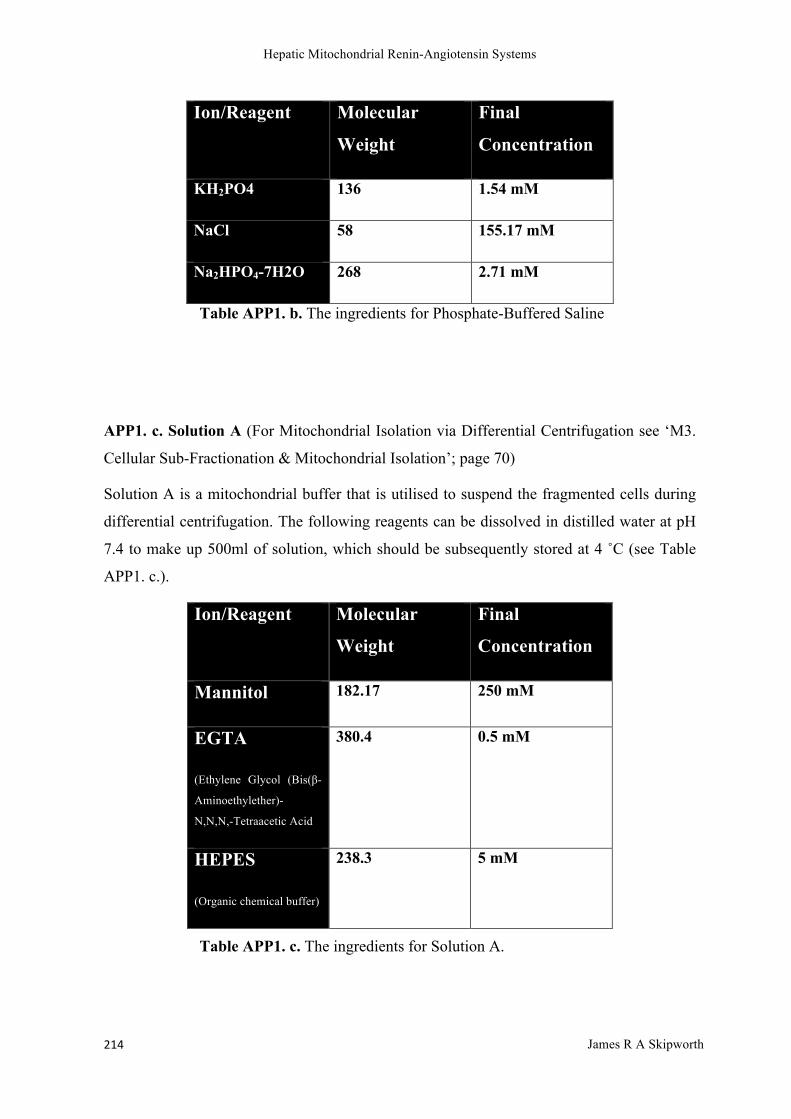
Hepatic Mitochondrial Renin-Angiotensin Systems
James R A Skipworth 214
Ion/Reagent Molecular
Weight
Final
Concentration
KH2PO4 136 1.54 mM
NaCl 58 155.17 mM
Na2HPO4-7H2O 268 2.71 mM
Table APP1. b. The ingredients for Phosphate-Buffered Saline
APP1. c. Solution A (For Mitochondrial Isolation via Differential Centrifugation see ‘M3.
Cellular Sub-Fractionation & Mitochondrial Isolation’; page 70)
Solution A is a mitochondrial buffer that is utilised to suspend the fragmented cells during
differential centrifugation. The following reagents can be dissolved in distilled water at pH
7.4 to make up 500ml of solution, which should be subsequently stored at 4 ˚C (see Table
APP1. c.).
Ion/Reagent Molecular
Weight
Final
Concentration
Mannitol 182.17 250 mM
EGTA
(Ethylene Glycol (Bis(β-
Aminoethylether)-
N,N,N,-Tetraacetic Acid
380.4 0.5 mM
HEPES
(Organic chemical buffer)
238.3 5 mM
Table APP1. c. The ingredients for Solution A.

Hepatic Mitochondrial Renin-Angiotensin Systems
James R A Skipworth 215
APP1. d. Solution B & Percoll (For Mitochondrial Isolation via Differential Centrifugation
see ‘M3. Cellular Sub-Fractionation & Mitochondrial Isolation’; page 70).
Solution B is a similar mitochondrial buffer that is utilised to suspend the fragmented cells
while Percoll density gradient separation occurs. The following reagents can be dissolved in
distilled water to make up 100 ml of solution at pH 7.4, which should be subsequently
stored at 4 oC (see Table APP1. d.).
Percoll consists of colloidal silica particles coated with polyvinylpyrrolidone and has a low
viscosity and osmolarity with no toxicity, and is therefore well-suited for density gradient
separation experiments. When required, Solution B is added to Percoll to make a final
solution of 70%/30% (vol/vol) solution.
Ion/Reagent Molecular
Weight
Final
Concentration
Mannitol 182.17 225 mM
EGTA
(Ethylene Glycol (Bis(β-
Aminoethylether)-
N,N,N,-Tetraacetic Acid
380.4 5 mM
HEPES
(Organic chemical buffer)
238.3 25 mM
Table APP1. d. The ingredients for Solution B.

Hepatic Mitochondrial Renin-Angiotensin Systems
James R A Skipworth 216
APP2. Antibodies
APP2. a. Primary Antibodies
Primary antibodies were sourced from a variety of different manufacturers and utilized at
manufacturer’s recommended concentrations (see Table APP2. a.).
Antibody Manufacturer Catalogue
Number
Antibody Type Molecular
Weight
Dilution
RAS Components
Renin (B-12) Santa-Cruz
Biotechnology (Dallas, Texas, USA)
sc-133145 Mouse
Monoclonal IgG1
38-46 kDa 1:100
Renin Antibody Atlas Antibodies (Stockholm, Sweden)
HPA005131 Rabbit Polyclonal
IgG
40kDa 1:250 to 1:500
ACE (C-20) Santa Cruz
Biotechnology (Dallas, Texas, USA)
sc-12187 Goat Polyclonal
IgG
195 kDa 1:100
ACE (N-20) Santa Cruz
Biotechnology (Dallas, Texas, USA)
sc-12184 Goat Polyclonal
IgG
195kDa 1:200
ACE
(C-Terminal) Abcam (Cambridge,
UK)
ab39172 Rabbit Polyclonal
IgG
170kDa 1:1000
ACE (Clone 9B9) Millipore (Billerica, MA, USA)
MAB4051 Mouse
Monoclonal
170-180kDa 1:100
Angiotensinogen LSBio LS-A9700 Rabbit Polyclonal Various 1:200

Hepatic Mitochondrial Renin-Angiotensin Systems
James R A Skipworth 217
Antibody (Seattle, WA, USA)
Angiotensin (N-10)
Antibody Santa Cruz
Biotechnology (Dallas, Texas, USA)
sc-7419 Goat Polyclonal
IgG
60kDa 1:200
AT1R (N-10)
Antibody Santa Cruz
Biotechnology (Dallas, Texas, USA)
sc-1173 Rabbit Polyclonal
IgG
43kDa 1:200
AT1R Antibody Santa Cruz
Biotechnology (Dallas, Texas, USA)
sc-20255 Goat Polyclonal
IgG
40kDa 1:200
AT2R Abcam (Cambridge, UK)
ab19134-50 Rabbit Polyclonal 44 kDa 1:200
AT2R (C-18)
Antibody Santa Cruz
Biotechnology (Dallas, Texas, USA)
sc-7420 Goat Polyclonal
IgG
44kDa 1:200
Standard Cellular
Components
Cox-4 Cell Signalling
Technology (Danvers, MA, USA)
#4844 Polyclonal Rabbit 17kDa 1:1000
VDAC (Anti-Porin
31HL) Antibody Calbiochem (Merck Group,
Darmstadt, Germany)
529534 Mouse IgG 20-30kDa 1:500
Grp75 Santa Cruz sc-1058 Goat Polyclonal
IgG
75 kDa 1:200

Hepatic Mitochondrial Renin-Angiotensin Systems
James R A Skipworth 218
Biotechnology (Dallas, Texas, USA)
ATP5b Abcam
(Cambridge, UK)
ab37922 Chicken
Polyclonal
57kDa 1:2000
ATP5b [3D5] Abcam (Cambridge, UK)
ab14730 Mouse monoclonal 52kDa 1:200
Hoescht 33258 Life Technologies (Paisley, UK)
H3569 Nucleic acid stain Binds to DNA 1:1000
Table APP2. a. Primary antibodies utilised for experimentation

Hepatic Mitochondrial Renin-Angiotensin Systems
James R A Skipworth 219
APP2. b. Secondary Antibodies
Secondary antibodies were sourced from a variety of different manufacturers and utilized at
multiple different concentrations to investigate the optimum working conditions (see Table
APP2. b.).
Antibody Manufacturer Catalogue
Number
Optimal
Dilution
Rabbit Anti-Goat IgG
(Fc), Peroxidase
Conjugated
Thermo Scientific (Waltham, MA, USA)
#31433 1:200
Cy2 Green
Conjugated
Affinipure Donkey
Anti-Chicken
Jackson
Immunoresearch (West Grove, PA,
USA)
82544 1:50
AlexaFluor® 594
Donkey Anti-Goat
IgG
Invitrogen (Carlsbad, CA, USA)
A-11058 1:200
Alexa Fluor® 488
donkey anti-mouse
IgG
Invitrogen (Carlsbad, CA, USA)
A-21202 1:200
Alexa Fluor® 488
donkey anti-goat IgG
Invitrogen (Carlsbad, CA, USA)
A-11055 1:200
Alexa Fluor® 594
donkey anti-mouse
IgG
Invitrogen (Carlsbad, CA, USA)
A-21203 1:200
Alexa Fluor® 594
donkey anti-rabbit
IgG
Invitrogen (Carlsbad, CA, USA)
A-21207 1:200

Hepatic Mitochondrial Renin-Angiotensin Systems
James R A Skipworth 220
Alexa Fluor® 647
donkey anti-mouse
IgG
Invitrogen (Carlsbad, CA, USA)
A-31571 1:200
Alexa Fluor® 647
donkey anti-goat IgG
Invitrogen (Carlsbad, CA, USA)
A-21447 1:200
Table APP2. b. Secondary antibodies utilized for experimentation

Hepatic Mitochondrial Renin-Angiotensin Systems
James R A Skipworth 221
APP3. Complete Mass Spectrometry Results
Table APP3. a. A table of database search results, following mass spectrometry performed
at University College London, demonstrated no findings consistent with ACE, but multiple
contaminants (keratin, dermicidin) and experimental reagents (trypsin, enolase) (mW-
Molecular weight; Da- Daltons; PLGS Score- Protein Lynx Global Server Score).
Description mW (Da) PLGS Score Coverage (%)
Q6IG03
K2C73 RAT Keratin type II cytoskeletal 73 OS Rattus norvegicus GN
Krt73 PE 1 SV 1 60349 284.036 36.528
Q6IMF3
K2C1 RAT Keratin type II cytoskeletal 1 OS Rattus norvegicus GN
Krt1 PE 2 SV 1 64790 505.1323 29.44
Q68FR8
TBA3 RAT Tubulin alpha 3 chain OS Rattus norvegicus GN Tuba3a
PE 2 SV 1 49927 497.5478 40.4444
Q4FZU2
K2C6A RAT Keratin type II cytoskeletal 6A OS Rattus norvegicus GN
Krt6a PE 1 SV 1 59212 211.974 33.8768
Q6IG01
K2C1B RAT Keratin type II cytoskeletal 1b OS Rattus norvegicus GN
Krt77 PE 2 SV 1 57219 252.1117 27.9383
P11980
KPYM RAT Pyruvate kinase isozymes M1 M2 OS Rattus norvegicus
GN Pkm2 PE 1 SV 3 57780 179.5759 28.4369
P00924
ENO1 YEAST Enolase 1 OS Saccharomyces cerevisiae GN ENO1 PE 1
SV 2 46773 297.3125 37.2998
Q6AY56
TBA8 RAT Tubulin alpha 8 chain OS Rattus norvegicus GN Tuba8 PE
2 SV 1 50005 318.9343 23.3853
P07323
ENOG RAT Gamma enolase OS Rattus norvegicus GN Eno2 PE 1 SV 2
47110 296.8302 29.4931
P85108
TBB2A RAT Tubulin beta 2A chain OS Rattus norvegicus GN Tubb2a
PE 1 SV 1 49874 256.935 33.2584
Q6P9T8
TBB2C RAT Tubulin beta 2C chain OS Rattus norvegicus GN Tubb2c
PE 1 SV 1 49769 244.966 25.618
Q6AYZ1
TBA1C RAT Tubulin alpha 1C chain OS Rattus norvegicus GN Tuba1c
PE 1 SV 1 49905 373.2762 26.9488
Q6P9V9
TBA1B RAT Tubulin alpha 1B chain OS Rattus norvegicus GN Tuba1b
PE 1 SV 1 50119 429.9057 21.286
P04764
ENOA RAT Alpha enolase OS Rattus norvegicus GN Eno1 PE 1 SV 4
47098 322.2678 19.1244
P69897
TBB5 RAT Tubulin beta 5 chain OS Rattus norvegicus GN Tubb5 PE 1
SV 1 49638 293.6011 21.1712
P15429
ENOB RAT Beta enolase OS Rattus norvegicus GN Eno3 PE 1 SV 3
46984 272.7215 21.659
Q3KRE8
TBB2B RAT Tubulin beta 2B chain OS Rattus norvegicus GN Tubb2b
PE 1 SV 1 49920 247.7995 11.4607

Hepatic Mitochondrial Renin-Angiotensin Systems
James R A Skipworth 222
Gel Piece
Accession Description
mW
(Da)
PLGS
Score
Coverage
(%) 1
P70610
DOC2B RAT Double C2 like domain
containing protein beta OS Rattus
norvegicus GN Doc2b PE 1 SV 2 45812 76.1767 2.1845
2
P70610
DOC2B RAT Double C2 like domain
containing protein beta OS Rattus
norvegicus GN Doc2b PE 1 SV 2 45812 63.0816 2.1845
Table APP3.2. Two gel pieces analysed at University College London demonstrated no
significant correlations and no findings consistent with ACE (mW- Molecular weight; Da-
Daltons; PLGS Score- Protein Lynx Global Server Score).

Hepatic Mitochondrial Renin-Angiotensin Systems
James R A Skipworth 223
Description dCn Ions XCorr
URIC_RAT Uricase OS=Rattus norvegicus GN=Uox PE=1
SV=3
0.3522 16/20 3.1180
ACTA_RAT Actin, aortic smooth muscle OS=Rattus
norvegicus GN=Acta2 PE=1 SV=1
0.1048 28/60 4.0710
ANXA1_RAT Annexin A1 OS=Rattus norvegicus
GN=Anxa1 PE=1 SV=2
0.3589 21/26 5.0531
ACTB_RAT Actin, cytoplasmic 1 OS=Rattus norvegicus
GN=Actb PE=1 SV=1
0.2091 27/68 4.1511
ANXA2_RAT Annexin A2 OS=Rattus norvegicus
GN=Anxa2 PE=1 SV=2
0.2074 35/68 5.2817
RLA0_RAT 60S acidic ribosomal protein P0 OS=Rattus
norvegicus GN=Rplp0 PE=1 SV=2
0.4936 20/32 5.1187
1433Z_RAT 14-3-3 protein zeta/delta OS=Rattus norvegicus
GN=Ywhaz PE=1 SV=1
0.3792 22/26 5.0860
ENOA_RAT Alpha-enolase OS=Rattus norvegicus
GN=Eno1 PE=1 SV=4
0.5344 22/34 4.5639
Table APP3.3. A table of database search results, following mass spectrometry performed
at Harvard Medical School demonstrated no findings consistent with ACE (dCn- Delta
correlation score; XCorr- Cross correlation score).