Postharvest physicochemical changes in mutant (dg, ogc and rin) and non-mutant tomatoes
13
1 23 Acta Physiologiae Plantarum ISSN 0137-5881 Volume 37 Number 1 Acta Physiol Plant (2015) 37:1-11 DOI 10.1007/s11738-014-1728-0 Postharvest physicochemical changes in mutant (dg, og c , and rin) and non- mutant tomatoes Mohammed Wasim Siddiqui, Ivi Chakraborty, Pradeep Mishra, Pranab Hazra & J. F. Ayala-Zavala
Transcript of Postharvest physicochemical changes in mutant (dg, ogc and rin) and non-mutant tomatoes
1 23
Acta Physiologiae Plantarum ISSN 0137-5881Volume 37Number 1 Acta Physiol Plant (2015) 37:1-11DOI 10.1007/s11738-014-1728-0
Postharvest physicochemical changes inmutant (dg, og c , and rin) and non-mutant tomatoes
Mohammed Wasim Siddiqui, IviChakraborty, Pradeep Mishra, PranabHazra & J. F. Ayala-Zavala
1 23
Your article is protected by copyright and
all rights are held exclusively by Franciszek
Górski Institute of Plant Physiology, Polish
Academy of Sciences, Kraków. This e-offprint
is for personal use only and shall not be self-
archived in electronic repositories. If you wish
to self-archive your article, please use the
accepted manuscript version for posting on
your own website. You may further deposit
the accepted manuscript version in any
repository, provided it is only made publicly
available 12 months after official publication
or later and provided acknowledgement is
given to the original source of publication
and a link is inserted to the published article
on Springer's website. The link must be
accompanied by the following text: "The final
publication is available at link.springer.com”.
ORIGINAL PAPER
Postharvest physicochemical changes in mutant (dg, ogc, and rin)and non-mutant tomatoes
Mohammed Wasim Siddiqui • Ivi Chakraborty •
Pradeep Mishra • Pranab Hazra • J. F. Ayala-Zavala
Received: 29 March 2014 / Revised: 31 October 2014 / Accepted: 16 November 2014
� Franciszek Gorski Institute of Plant Physiology, Polish Academy of Sciences, Krakow 2014
Abstract Early postharvest decay of tomato is a major
concern of research. Several pre and postharvest efforts
have been suggested to improve the shelf life of commer-
cially grown tomatoes. However, finding the cultivars with
increased shelf life is not yet achieved. Our study focused
on the characterization of two color mutants [dg (BCT-
115) and ogc (BCT-119)], one ripening mutant [rin (BCT-
111)], and seven normal tomato genotypes [Berika (high
lycopene) Punjab, Chhuhara, FEB-2, BCT-53, Patharku-
tchi, CLN-B, and CLN-R] using different physicochemical
and subjective variables to acknowledge the storage
potential at 25 ± 1 �C and RH 80–82 %. There were sig-
nificant variations in storage life among all tomato geno-
types. Except ogc, the mutant (dg and rin) tomatoes showed
longer shelf life in relation to normal tomatoes. Based on
their storability, the genotypes were classified into three
groups i.e. shelf life less than 15 days [CLN-B, BCT-53,
CLN-R, and BCT-119 (ogc)], 15–18 days [FEB-2, Punjab
Chhuhara, Patharkutchi, and Berika] and more than
18 days [BCT-115 (dg) and BCT-111 (rin)]. We suggest
that selecting the genotype/cultivar having longer shelf life
during formulation of breeding strategy could improve the
marketability of tomato fruits for relatively longer period.
Keywords Lycopersicon esculentum � Dark green � Old
gold crimson � Ripening inhibitor � Postharvest quality �Storage
Introduction
The shelf life is the period where a produce retains its
sensory, functional, and nutritional attributes in optimal
conditions in such a way that it is acceptable for consum-
ers. Within a group of commodity, there is a genotypic
difference in phytochemicals, shelf life potential, as well as
ultimate quality. The fresh produce quality could be
maintained under postharvest conditions, but cannot be
improved. It can only be improved through pre-harvest
strategies like breeding new cultivars. This could be real-
ized through the introduction and/or selection of genotypes
with better keeping quality (Yogendra and Gowda 2013).
The tomato is considered a model crop for shelf life study
due to high perishability and occurrence of divergent geno-
types including color and non-ripening mutants. The per-
ishable nature of tomato fruit makes it difficult to store for a
longer time. This view is based on the apparent changes in
the physical attributes of the fruit such as the firmness and
color as well as occurrence of rotting. However, several
Communicated by P.K. Nagar.
M. W. Siddiqui (&)
Department of Food Science and Technology, Bihar Agricultural
University, Sabour, Bhagalpur, Bihar 813210, India
e-mail: [email protected]
I. Chakraborty
Department of Post Harvest Technology of Horticultural Crops,
Bidhan Chandra Krishi Viswavidyalaya, Mohanpur, Nadia,
West Bengal, India
P. Mishra
Department of Agricultural Statistics, Bidhan Chandra Krishi
Viswavidyalaya, Mohanpur, Nadia, West Bengal, India
P. Hazra
Department of Vegetable Crops, Bidhan Chandra Krishi
Viswavidyalaya, Mohanpur, Nadia, West Bengal, India
J. F. Ayala-Zavala
Centro de Investigacion en Alimentacion y Desarrollo, A.C.
(CIAD, AC), Carretera a la Victoria Km 0.6, La Victoria,
83000 Hermosillo, SON, Mexico
123
Acta Physiol Plant (2015) 37:1728
DOI 10.1007/s11738-014-1728-0
Author's personal copy

postharvest efforts such as 1-MCP (Ilic et al. 2013), gum
arabic coating (Ali et al. 2013), waxing, chlorination, and hot
water treatments (Hernandez-Yepez et al. 2013), shellac,
aloevera gel (Chauhan et al. 2013) and active packaging
(Garcıa-Garcıa et al. 2013), and low temperature storage
(Vinha et al. 2013) have been dealt for shelf life increment of
tomato fruits, but with limited success. Several pre-harvest
efforts have also been made to down regulate the ethylene
biosynthesis and cell wall degrading genes using advanced
RNA interference technique (Carrari et al. 2007) to increase
the postharvest life of tomato (Meli et al. 2010). Certainly,
the genetical modification increased the shelf life of toma-
toes to a considerable level, but genetically modified crops
are not marketable worldwide having health and environ-
mental safety concerns.
Genetic improvement of quality characteristics of
tomato fruits in terms of longer availability through utili-
zation of genetic diversity is a feasible and environmentally
harmless option for improving shelf life. In tomato, several
single gene mutations like ripening inhibitor (rin), non-
ripening (nor), and Colorless non-ripening (Cnr) have been
identified that abolish the normal fruit ripening. The genes
dark green (dg), old gold crimson (ogc) and high pigment-1
(hp-1), high pigment-2 (hp-2) are examples of genes that
have a positive effect on the concentration of bioactive
molecules especially lycopene (Siddiqui et al. 2013). These
high lycopene-attributing genes can be used to improve the
color of tomatoes (Siddiqui et al. 2014).
The non-ripening mutants such as rin, nor, and Nr have
been studied for shelf life extension of tomatoes. To the best
of our knowledge, there is no published report describing
the shelf life potential of color mutants involving dg and ogc
genes. Therefore, the present study was undertaken to
somewhat fill the information gap via assessing shelf life
potential of dark green, old gold crimson, ripening inhibitor,
and some normal tomatoes with the employment of physi-
cal, biochemical, and subjective variables at ambient con-
ditions (25 ± 1 �C and RH 80–82 %).
Materials and methods
Plant materials and growing
Total ten diverse tomato genotypes consisting one high
lycopene genotype (Berika), two color mutants [dg (BCT-
115) and ogc (BCT-119)], one ripening mutant [rin (BCT-
111)], and six normal tomato genotypes (Punjab Chhuhara,
FEB-2, BCT-53, Patharkutchi, CLN-B, CLN-R) were
selected for the study (Table 1). The term normal or
ordinary was used for the genotypes having no mutation.
All the genotypes were grown simultaneously at the Cen-
tral Research Farm, Gayeshpur, Nadia, West Bengal, India
during growing season October–March where the seedlings
(21 days old) were transplanted on raised beds in the same
field receiving similar agronomic practices (irrigation,
nutrient, and pesticide application etc.). These conditions
allowed avoiding the effects of pre and postharvest factors
on genotype-related differences in tomatoes grown in open
field (Ilahy et al. 2011a). The fruits of all ten genotypes
Table 1 Description of the tomato genotypes used in the experiment
Genotypes Specific features Source
Berika High lycopene containing variety Institute of Genetics, Bulgarian Academy of Science,
Sofia, Bulgaria
BCT-115 Dark green and high pigmented line carrying dark green (dg) gene United States Department of Agriculture (USDA), USA
BCT-119 High pigmented line containing old gold crimson (ogc) gene United States Department of Agriculture (USDA), USA
BCT-111 Slow ripening line having ripening inhibitor (rin) gene, devoid of
lycopene
Department of Vegetable Science, HAU, Hisar, Haryana,
India
Punjab
Chhuhara
Popular variety having good processing characteristics AICRP on Vegetable Crops, BCKV, Mohanpur, West
Bengal, India
FEB-2 Early blight resistant variety Division of Vegetable Science, IARI, New Delhi, India
BCT-53 A high yielding line with appreciable fruit quality Department of Vegetable Crops, BCKV, Mohanpur, West
Bengal, India
Patharkutchi Local adaptable cultivar, low in pigment with stay-green shoulder Department of Vegetable Crops, BCKV, Mohanpur, West
Bengal, India
CLN-B Heat tolerant line, low in pigment Asian Vegetable Research and Development Center
(AVRDC), Taiwan
CLN-R Heat tolerant line, low in pigment Asian Vegetable Research and Development Center
(AVRDC), Taiwan
USA United States of America, AICRP All India Coordinated Research Project, BCKV Bidhan Chandra Krishi Viswavidyalaya, IARI Indian
Agricultural Research Institute, HAU Hisar Agricultural University
1728 Page 2 of 11 Acta Physiol Plant (2015) 37:1728
123
Author's personal copy
were harvested thrice over the growing period randomly at
color stage III (Turning; 10–30 % red, pink or tannish-
yellow area), and packed in low-density polyethylene
(thickness- 30 lm, oxygen permeance-1.5 9 10-12
mols-1 m-2 Pa-1, water vapor permeance- 9.0 9 10-12
mols-1 m-2 Pa-1, and dimension- L 9 W = 25 cm 9
30 cm;) having 10 % perforation and stored at 25 ± 1 �C
and RH 80–82 % for 18–20 days. Different analyses were
carried out at 3 or 4 day intervals. There were three dif-
ferent lots for destructive, subjective and shelf life analysis
packed and stored under the same conditions. The whole
experiment was performed in triplicate.
Weight loss (%) To estimate this parameter, initially the
weight of fruits was taken and recorded in grams. After-
wards the fruits were weighed during storage at 3 days
interval.
Fruit firmness (lb) Firmness of fruits was measured by
destructive or invasive method. For determination, skin
(epicarp) at three different equators (shoulder, apex and
middle) of two fruits was removed to allow three separate
flesh firmness readings to be made on each fruit using a
Penetrometer (Model no. F-327) equipped with a 5-mm-
diameter flat probe. The firmness was recorded in pound
(lb) and the average values were reported.
At each interval, the firmness of two fruits was addition-
ally determined subjectively by manual grading and visual
examination using 1–10 scale as described by Phakawat-
mongkol et al. (2004). The points varied from 1 to 10 from
soft to firm fruit, respectively. For this, total 60 fruits were
kept in each treatment consisting of three replicates (20 fruits
each). The firmness index of tomato fruits was assessed at
4 days interval during storage and calculated as:
Firmness index
¼X10
1
ðindex levelÞðnumber of fruits in this levelÞtotal number of fruits
Total soluble solids, titratable acidity, and total sugar
The total soluble solids (�Brix), titratable acidity (as %
citric acid) and total sugar (%) of fresh tissue were deter-
mined following the standard methods (AOAC 1990).
Ascorbic acid Ascorbic acid (mg/100 g FW) in the
sample was determined according to AOAC (1990) official
methods using a standard dye (2,6-dichlorophenol indo-
phenol) solution.
Carotenoids (Lycopene and b-carotene): Lycopene and
b-carotene (mg/100 g FW) from tomato fractions (peel and
pulp) were extracted with hexane: methanol: acetone
(2:1:1), containing 2.5 % butylated hydroxy toluene
(BHT). The absorbance of the extract (hexane) was mea-
sured at 502 nm against a hexane blank. Concentration of
lycopene was calculated using the extinction coefficient
(E %) of 3,150 (Rao et al. 1998). The b-carotene content in
the hexane extract was measured at 452 nm and calculated
using a calibration curve against a pure b-carotene.
Percentage marketability The percentage marketability
was assessed according to Getinet et al. (2008). Descriptive
quality attributes of fruits were visually assessed at 4 days
interval as per the occurrence of shriveling, visible mold
growth, decay, smoothness, and shininess of fruit.
PM %ð Þ
¼ Total number of fruits � Number of fruits discarded
Total number of fruits� 100
Determination of shelflife of fruits Twenty-one fruits of
each genotype were evaluated during storage. Fruits were
removed at 24 h intervals at the first deterioration mark
(slight wrinkles, desiccation). The removal of fruits carried
out until the last fruit became unmarketable (differed
according to genotypes). The shelf life index, accounting
both the number of fruits possessing marketability and
length of storage, was calculated using following formula
(Garg et al. 2008a).
Shelf life index ¼ 1
NR½ðni � niþ1Þdi�
where, ni is the number of marketable fruits on ith day; ni?1
is the number of marketable fruits on (i ? 1)th day; N is
the total number of fruits under observation; di is the
number of days after picking.
Statistical analysis
The evaluated factors were the genotype and storage time,
data, in triplicate, were statistically analyzed using statistical
software, SPSS version 14.0 for Windows (SPSS Inc, Chi-
cago, IL, USA) and expressed as a mean ± standard devi-
ation. One-way ANOVA (Duncan’s Multiple Range Test)
was used to compare the mean values of the variables
assessed for different genotypes at probability level of 95 %.
Results
Weight loss The fruits of all genotypes underwent to stor-
age of 18 days, showed an increasing trend of weight loss
with significant (P \ 0.05) differences (Table 2). In gen-
eral, higher rates of PLW were recorded in the normal
genotypes than that of high-pigment and rin mutants. The
BCT-111 (rin) lost the lowest weight (4.1 %) even on the
last day of storage. In case of high pigment and normal
genotypes, the highest PLW was recorded in BCT-119
(9.70 %) and FEB-2 (16.03 %), respectively.
Firmness The fruit firmness decreased during the stor-
age with significant (P \ 0.05) differences irrespective of
Acta Physiol Plant (2015) 37:1728 Page 3 of 11 1728
123
Author's personal copy
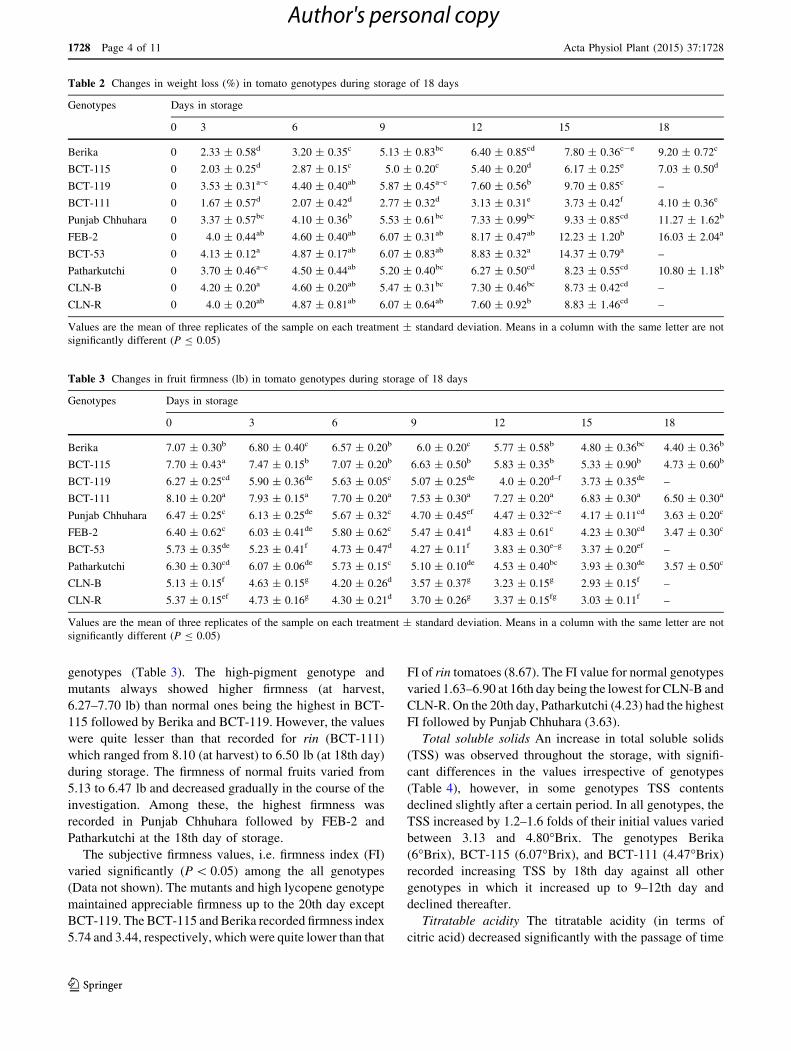
genotypes (Table 3). The high-pigment genotype and
mutants always showed higher firmness (at harvest,
6.27–7.70 lb) than normal ones being the highest in BCT-
115 followed by Berika and BCT-119. However, the values
were quite lesser than that recorded for rin (BCT-111)
which ranged from 8.10 (at harvest) to 6.50 lb (at 18th day)
during storage. The firmness of normal fruits varied from
5.13 to 6.47 lb and decreased gradually in the course of the
investigation. Among these, the highest firmness was
recorded in Punjab Chhuhara followed by FEB-2 and
Patharkutchi at the 18th day of storage.
The subjective firmness values, i.e. firmness index (FI)
varied significantly (P \ 0.05) among the all genotypes
(Data not shown). The mutants and high lycopene genotype
maintained appreciable firmness up to the 20th day except
BCT-119. The BCT-115 and Berika recorded firmness index
5.74 and 3.44, respectively, which were quite lower than that
FI of rin tomatoes (8.67). The FI value for normal genotypes
varied 1.63–6.90 at 16th day being the lowest for CLN-B and
CLN-R. On the 20th day, Patharkutchi (4.23) had the highest
FI followed by Punjab Chhuhara (3.63).
Total soluble solids An increase in total soluble solids
(TSS) was observed throughout the storage, with signifi-
cant differences in the values irrespective of genotypes
(Table 4), however, in some genotypes TSS contents
declined slightly after a certain period. In all genotypes, the
TSS increased by 1.2–1.6 folds of their initial values varied
between 3.13 and 4.80�Brix. The genotypes Berika
(6�Brix), BCT-115 (6.07�Brix), and BCT-111 (4.47�Brix)
recorded increasing TSS by 18th day against all other
genotypes in which it increased up to 9–12th day and
declined thereafter.
Titratable acidity The titratable acidity (in terms of
citric acid) decreased significantly with the passage of time
Table 2 Changes in weight loss (%) in tomato genotypes during storage of 18 days
Genotypes Days in storage
0 3 6 9 12 15 18
Berika 0 2.33 ± 0.58d 3.20 ± 0.35c 5.13 ± 0.83bc 6.40 ± 0.85cd 7.80 ± 0.36c-e 9.20 ± 0.72c
BCT-115 0 2.03 ± 0.25d 2.87 ± 0.15c 5.0 ± 0.20c 5.40 ± 0.20d 6.17 ± 0.25e 7.03 ± 0.50d
BCT-119 0 3.53 ± 0.31a–c 4.40 ± 0.40ab 5.87 ± 0.45a–c 7.60 ± 0.56b 9.70 ± 0.85c –
BCT-111 0 1.67 ± 0.57d 2.07 ± 0.42d 2.77 ± 0.32d 3.13 ± 0.31e 3.73 ± 0.42f 4.10 ± 0.36e
Punjab Chhuhara 0 3.37 ± 0.57bc 4.10 ± 0.36b 5.53 ± 0.61bc 7.33 ± 0.99bc 9.33 ± 0.85cd 11.27 ± 1.62b
FEB-2 0 4.0 ± 0.44ab 4.60 ± 0.40ab 6.07 ± 0.31ab 8.17 ± 0.47ab 12.23 ± 1.20b 16.03 ± 2.04a
BCT-53 0 4.13 ± 0.12a 4.87 ± 0.17ab 6.07 ± 0.83ab 8.83 ± 0.32a 14.37 ± 0.79a –
Patharkutchi 0 3.70 ± 0.46a–c 4.50 ± 0.44ab 5.20 ± 0.40bc 6.27 ± 0.50cd 8.23 ± 0.55cd 10.80 ± 1.18b
CLN-B 0 4.20 ± 0.20a 4.60 ± 0.20ab 5.47 ± 0.31bc 7.30 ± 0.46bc 8.73 ± 0.42cd –
CLN-R 0 4.0 ± 0.20ab 4.87 ± 0.81ab 6.07 ± 0.64ab 7.60 ± 0.92b 8.83 ± 1.46cd –
Values are the mean of three replicates of the sample on each treatment ± standard deviation. Means in a column with the same letter are not
significantly different (P B 0.05)
Table 3 Changes in fruit firmness (lb) in tomato genotypes during storage of 18 days
Genotypes Days in storage
0 3 6 9 12 15 18
Berika 7.07 ± 0.30b 6.80 ± 0.40c 6.57 ± 0.20b 6.0 ± 0.20c 5.77 ± 0.58b 4.80 ± 0.36bc 4.40 ± 0.36b
BCT-115 7.70 ± 0.43a 7.47 ± 0.15b 7.07 ± 0.20b 6.63 ± 0.50b 5.83 ± 0.35b 5.33 ± 0.90b 4.73 ± 0.60b
BCT-119 6.27 ± 0.25cd 5.90 ± 0.36de 5.63 ± 0.05c 5.07 ± 0.25de 4.0 ± 0.20d–f 3.73 ± 0.35de –
BCT-111 8.10 ± 0.20a 7.93 ± 0.15a 7.70 ± 0.20a 7.53 ± 0.30a 7.27 ± 0.20a 6.83 ± 0.30a 6.50 ± 0.30a
Punjab Chhuhara 6.47 ± 0.25c 6.13 ± 0.25de 5.67 ± 0.32c 4.70 ± 0.45ef 4.47 ± 0.32c–e 4.17 ± 0.11cd 3.63 ± 0.20c
FEB-2 6.40 ± 0.62c 6.03 ± 0.41de 5.80 ± 0.62c 5.47 ± 0.41d 4.83 ± 0.61c 4.23 ± 0.30cd 3.47 ± 0.30c
BCT-53 5.73 ± 0.35de 5.23 ± 0.41f 4.73 ± 0.47d 4.27 ± 0.11f 3.83 ± 0.30e–g 3.37 ± 0.20ef –
Patharkutchi 6.30 ± 0.30cd 6.07 ± 0.06de 5.73 ± 0.15c 5.10 ± 0.10de 4.53 ± 0.40bc 3.93 ± 0.30de 3.57 ± 0.50c
CLN-B 5.13 ± 0.15f 4.63 ± 0.15g 4.20 ± 0.26d 3.57 ± 0.37g 3.23 ± 0.15g 2.93 ± 0.15f –
CLN-R 5.37 ± 0.15ef 4.73 ± 0.16g 4.30 ± 0.21d 3.70 ± 0.26g 3.37 ± 0.15fg 3.03 ± 0.11f –
Values are the mean of three replicates of the sample on each treatment ± standard deviation. Means in a column with the same letter are not
significantly different (P B 0.05)
1728 Page 4 of 11 Acta Physiol Plant (2015) 37:1728
123
Author's personal copy
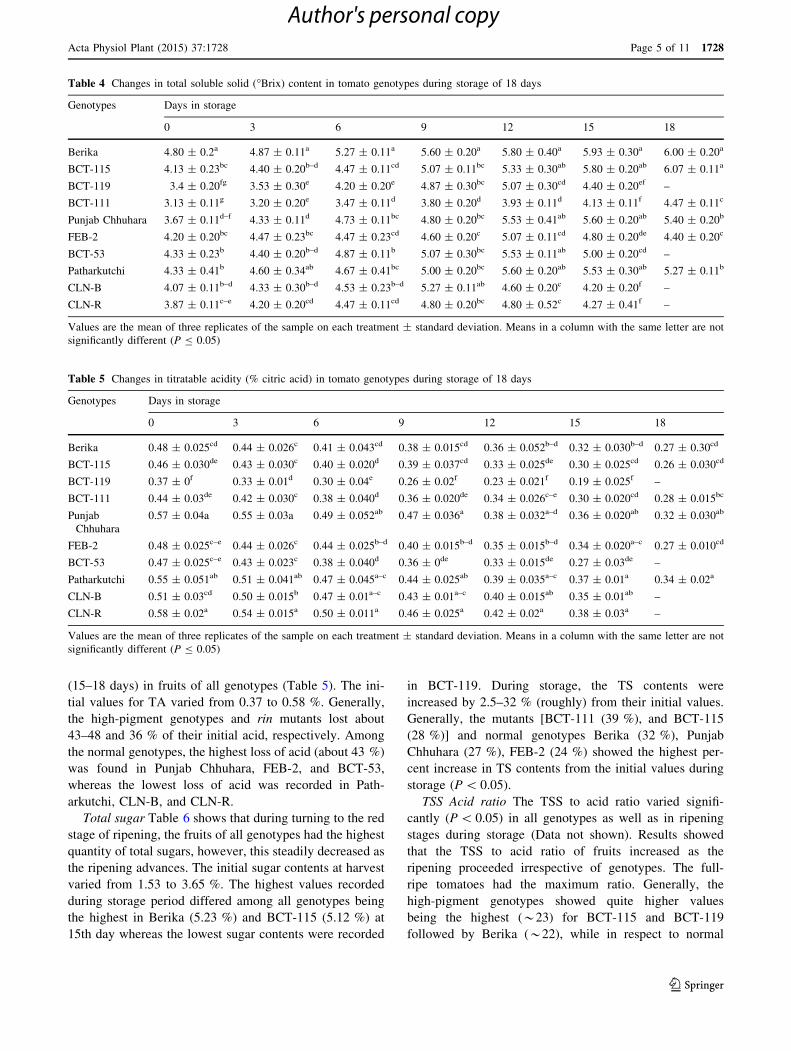
(15–18 days) in fruits of all genotypes (Table 5). The ini-
tial values for TA varied from 0.37 to 0.58 %. Generally,
the high-pigment genotypes and rin mutants lost about
43–48 and 36 % of their initial acid, respectively. Among
the normal genotypes, the highest loss of acid (about 43 %)
was found in Punjab Chhuhara, FEB-2, and BCT-53,
whereas the lowest loss of acid was recorded in Path-
arkutchi, CLN-B, and CLN-R.
Total sugar Table 6 shows that during turning to the red
stage of ripening, the fruits of all genotypes had the highest
quantity of total sugars, however, this steadily decreased as
the ripening advances. The initial sugar contents at harvest
varied from 1.53 to 3.65 %. The highest values recorded
during storage period differed among all genotypes being
the highest in Berika (5.23 %) and BCT-115 (5.12 %) at
15th day whereas the lowest sugar contents were recorded
in BCT-119. During storage, the TS contents were
increased by 2.5–32 % (roughly) from their initial values.
Generally, the mutants [BCT-111 (39 %), and BCT-115
(28 %)] and normal genotypes Berika (32 %), Punjab
Chhuhara (27 %), FEB-2 (24 %) showed the highest per-
cent increase in TS contents from the initial values during
storage (P \ 0.05).
TSS Acid ratio The TSS to acid ratio varied signifi-
cantly (P \ 0.05) in all genotypes as well as in ripening
stages during storage (Data not shown). Results showed
that the TSS to acid ratio of fruits increased as the
ripening proceeded irrespective of genotypes. The full-
ripe tomatoes had the maximum ratio. Generally, the
high-pigment genotypes showed quite higher values
being the highest (*23) for BCT-115 and BCT-119
followed by Berika (*22), while in respect to normal
Table 4 Changes in total soluble solid (�Brix) content in tomato genotypes during storage of 18 days
Genotypes Days in storage
0 3 6 9 12 15 18
Berika 4.80 ± 0.2a 4.87 ± 0.11a 5.27 ± 0.11a 5.60 ± 0.20a 5.80 ± 0.40a 5.93 ± 0.30a 6.00 ± 0.20a
BCT-115 4.13 ± 0.23bc 4.40 ± 0.20b–d 4.47 ± 0.11cd 5.07 ± 0.11bc 5.33 ± 0.30ab 5.80 ± 0.20ab 6.07 ± 0.11a
BCT-119 3.4 ± 0.20fg 3.53 ± 0.30e 4.20 ± 0.20e 4.87 ± 0.30bc 5.07 ± 0.30cd 4.40 ± 0.20ef –
BCT-111 3.13 ± 0.11g 3.20 ± 0.20e 3.47 ± 0.11d 3.80 ± 0.20d 3.93 ± 0.11d 4.13 ± 0.11f 4.47 ± 0.11c
Punjab Chhuhara 3.67 ± 0.11d–f 4.33 ± 0.11d 4.73 ± 0.11bc 4.80 ± 0.20bc 5.53 ± 0.41ab 5.60 ± 0.20ab 5.40 ± 0.20b
FEB-2 4.20 ± 0.20bc 4.47 ± 0.23bc 4.47 ± 0.23cd 4.60 ± 0.20c 5.07 ± 0.11cd 4.80 ± 0.20de 4.40 ± 0.20c
BCT-53 4.33 ± 0.23b 4.40 ± 0.20b–d 4.87 ± 0.11b 5.07 ± 0.30bc 5.53 ± 0.11ab 5.00 ± 0.20cd –
Patharkutchi 4.33 ± 0.41b 4.60 ± 0.34ab 4.67 ± 0.41bc 5.00 ± 0.20bc 5.60 ± 0.20ab 5.53 ± 0.30ab 5.27 ± 0.11b
CLN-B 4.07 ± 0.11b–d 4.33 ± 0.30b–d 4.53 ± 0.23b–d 5.27 ± 0.11ab 4.60 ± 0.20c 4.20 ± 0.20f –
CLN-R 3.87 ± 0.11c–e 4.20 ± 0.20cd 4.47 ± 0.11cd 4.80 ± 0.20bc 4.80 ± 0.52c 4.27 ± 0.41f –
Values are the mean of three replicates of the sample on each treatment ± standard deviation. Means in a column with the same letter are not
significantly different (P B 0.05)
Table 5 Changes in titratable acidity (% citric acid) in tomato genotypes during storage of 18 days
Genotypes Days in storage
0 3 6 9 12 15 18
Berika 0.48 ± 0.025cd 0.44 ± 0.026c 0.41 ± 0.043cd 0.38 ± 0.015cd 0.36 ± 0.052b–d 0.32 ± 0.030b–d 0.27 ± 0.30cd
BCT-115 0.46 ± 0.030de 0.43 ± 0.030c 0.40 ± 0.020d 0.39 ± 0.037cd 0.33 ± 0.025de 0.30 ± 0.025cd 0.26 ± 0.030cd
BCT-119 0.37 ± 0f 0.33 ± 0.01d 0.30 ± 0.04e 0.26 ± 0.02f 0.23 ± 0.021f 0.19 ± 0.025f –
BCT-111 0.44 ± 0.03de 0.42 ± 0.030c 0.38 ± 0.040d 0.36 ± 0.020de 0.34 ± 0.026c–e 0.30 ± 0.020cd 0.28 ± 0.015bc
Punjab
Chhuhara
0.57 ± 0.04a 0.55 ± 0.03a 0.49 ± 0.052ab 0.47 ± 0.036a 0.38 ± 0.032a–d 0.36 ± 0.020ab 0.32 ± 0.030ab
FEB-2 0.48 ± 0.025c–e 0.44 ± 0.026c 0.44 ± 0.025b–d 0.40 ± 0.015b–d 0.35 ± 0.015b–d 0.34 ± 0.020a–c 0.27 ± 0.010cd
BCT-53 0.47 ± 0.025c–e 0.43 ± 0.023c 0.38 ± 0.040d 0.36 ± 0de 0.33 ± 0.015de 0.27 ± 0.03de –
Patharkutchi 0.55 ± 0.051ab 0.51 ± 0.041ab 0.47 ± 0.045a–c 0.44 ± 0.025ab 0.39 ± 0.035a–c 0.37 ± 0.01a 0.34 ± 0.02a
CLN-B 0.51 ± 0.03cd 0.50 ± 0.015b 0.47 ± 0.01a–c 0.43 ± 0.01a–c 0.40 ± 0.015ab 0.35 ± 0.01ab –
CLN-R 0.58 ± 0.02a 0.54 ± 0.015a 0.50 ± 0.011a 0.46 ± 0.025a 0.42 ± 0.02a 0.38 ± 0.03a –
Values are the mean of three replicates of the sample on each treatment ± standard deviation. Means in a column with the same letter are not
significantly different (P B 0.05)
Acta Physiol Plant (2015) 37:1728 Page 5 of 11 1728
123
Author's personal copy

tomatoes the highest ratio was noted for BCT-53 (*18)
and Punjab Chhuhara (*17) followed by FEB-2. The
genotype BCT-111 (rin) showed TSS to acid ratio to be
around 16.
Ascorbic acid It can easily be accessed from Table 7,
ascorbic acid (AA) contents recorded to be increased about
5, 6, and 8 % from the initial values throughout the storage
(18th day) in Berika, BCT-115 (dg), and BCT-111 (rin),
respectively. However, in BCT-119 (ogc), only 4.8 %
increase recorded on the 12th day and decreased after-
wards. The highest AA contents were recorded in BCT-115
(37.10 mg/100 g FW) and Berika (36.82 mg/100 g FW).
As regards to ordinary genotypes, the AA contents
increased up to the 15th day of storage with about 4–10 %
increment in initial values that tended to decrease at further
days. The highest amount noted in Punjab Chhuhara
(35.98 mg/100 g FW) followed by BCT-53 and
Patharkutchi whilst the lowest value was measured in
CLN- R (24.04 mg/100 g FW) (P \ 0.05).
Lycopene Lycopene concentration of all genotypes, high
lycopene, color mutants, rin mutant, and normal ones,
tended to increase during 18 days of storage (Table 8). In
general, high-pigment genotypes found to accumulate
higher quantity of lycopene contents throughout the stor-
age. At the time of harvest, the lycopene contents of high-
pigment and normal genotypes ranged between 1.41 and
2.26 mg/100 g FW. In high-pigment genotypes, the highest
value recorded in BCT-115 and Berika whereas among
normal genotypes it was the highest in Patharkutchi and
Punjab Chhuhara. In general, the lycopene contents
increased by 1.7–3 times more than that of initial values. In
respect to BCT-111 containing rin gene, no lycopene was
measured at the time of harvest; however, a slight amount
has been concentrated during the storage.
Table 6 Changes in total sugar (%) content in tomato genotypes during storage of 18 days
Genotypes Days in storage
0 3 6 9 12 15 18
Berika 3.54 ± 0.07b 3.92 ± 0.25a–c 4.30 ± 0.38a 4.74 ± 0.25b 4.98 ± 0.14ab 5.23 ± 0.12a 3.54 ± 0.03a
BCT-115 3.65 ± 0.20b 4.04 ± 0.19ab 4.64 ± 0.24a 4.90 ± 0.25a 5.02 ± 0.11c 5.12 ± 0.08a 3.25 ± 0.04a
BCT-119 2.59 ± 0.17de 2.96 ± 0.29e 3.08 ± 0.30e 3.18 ± 0.29f 3.14 ± 0.05c 2.29 ± 0.16f –
BCT-111 1.53 ± 0.04f 1.67 ± 0.05f 1.90 ± 0.08f 2.13 ± 0.03g 2.27 ± 0.10e 2.48 ± 0.22g 2.75 ± 0.36e
Punjab Chhuhara 2.75 ± 0.07c 3.11 ± 0.03d 3.19 ± 0.01de 3.54 ± 0.07ef 4.03 ± 0.15a 3.89 ± 0.12d 2.93 ± 0.08d
FEB-2 3.21 ± 0.02b 3.83 ± 0.20c 4.13 ± 0.18ab 4.44 ± 0.07b 4.42 ± 0.01b 3.99 ± 0.14c 3.35 ± 0.14d
BCT-53 2.46 ± 0.09d 2.86 ± 0.19e 3.11 ± 0.22e 3.36 ± 0.25f 3.20 ± 0.22b 2.59 ± 0.15f –
Patharkutchi 3.64 ± 0.08a 3.91 ± 0.15a 4.05 ± 0.12a 4.22 ± 0.17bc 4.29 ± 0.13b 4.28 ± 0.11c 3.71 ± 0.14c
CLN-B 3.22 ± 0.06b 3.39 ± 0.15bc 3.48 ± 0.17 cd 3.32 ± 0.08de 3.24 ± 0.10c 3.39 ± 0.13f –
CLN-R 3.30 ± 0.21b 3.57 ± 0.24bc 3.77 ± 0.32bc 3.70 ± 0.37cd 3.58 ± 0.23d 3.40 ± 0.22e –
Values are the mean of three replicates of the sample on each treatment ± standard deviation. Means in a column with the same letter are not
significantly different (P B 0.05)
Table 7 Changes in ascorbic acid (mg/100 g FW) content in tomato genotypes during storage of 18 days
Genotypes Days in storage
0 3 6 9 12 15 18
Berika 34.67 ± 0.51a 34.85 ± 0.09a 35.14 ± 0.05a 35.19 ± 0.70a 35.78 ± 0.62a 36.19 ± 0.93a 36.82 ± 0.26a
BCT-115 34.75 ± 0.38a 35.43 ± 0.44a 35.39 ± 0.47a 35.63 ± 0.76a 36.39 ± 0.30a 36.52 ± 0.61a 37.10 ± 0.21a
BCT-119 23.75 ± 0.40de 23.87 ± 0.35ef 24.05 ± 0.49cd 24.57 ± 0.23d–f 24.96 ± 0.24de 24.64 ± 0.98de –
BCT-111 22.60 ± 0.59ef 22.95 ± 0.55fg 23.13 ± 0.76d 23.69 ± 0.38ef 23.87 ± 0.47f 24.39 ± 0.24f 24.68 ± 0.33d
Punjab Chhuhara 33.01 ± 1.50b 33.63 ± 1.05b 34.27 ± 0.78a 35.10 ± 0.07a 35.72 ± 0.31a 35.98 ± 0.13a 35.95 ± 0.53a
FEB-2 21.78 ± 0.41f 22.40 ± 0.40g 22.72 ± 0.56d 23.12 ± 0.70f 23.72 ± 0.42f 24.05 ± 0.81f 23.65 ± 0.61d
BCT-53 27.13 ± 0.14c 27.30 ± 0.27c 27.71 ± 0.23b 28.05 ± 0.18b 28.37 ± 0.34b 28.51 ± 0.17b –
Patharkutchi 24.12 ± 0.26d 24.51 ± 0.40de 24.86 ± 0.50c 25.17 ± 0.56c–e 25.64 ± 0.46cd 26.65 ± 0.42cd 26.27 ± 0.36c
CLN-B 24.89 ± 0.67d 25.43 ± 0.25d 25.38 ± 1.01c 26.06 ± 0.90cd 26.56 ± 1.0c 27.17 ± 0.90c –
CLN-R 22.44 ± 0.47ef 22.69 ± 0.46g 22.98 ± 0.45d 23.38 ± 0.39f 24.04 ± 0.18ef 23.49 ± 1.23ef –
Values are the mean of three replicates of the sample on each treatment ± standard deviation. Means in a column with the same letter are not
significantly different (P B 0.05)
1728 Page 6 of 11 Acta Physiol Plant (2015) 37:1728
123
Author's personal copy

b-Carotene As for b-carotene, its amount increased in
relation to the advanced ripeness in harmony with the fast
fruit coloration during storage (Table 9). The initial con-
centration of carotene varied significantly (P \ 0.05) from
0.16 to 0.36 mg/100 g FW among all genotypes. The car-
otene contents increased about 4–7 fold more than the
initial amount during the course of storage. Generally, the
highest amount was noted in high lycopene genotypes i.e.
BCT-115 (1.75) and Berika (1.57 mg/100 g FW). In case
of normal genotypes, CLN-R and Patharkutchi recorded
the highest carotene contents 1.57 and 1.37 mg/100 g FW,
respectively. The rin mutant (BCT-111) which accumu-
lated negligible amount of lycopene, found to have a
substantial quantity (0.71 mg/100 g FW) of b-carotene at
the 18th day of storage.
Percentage marketability Of the ten analyzed tomato
genotypes, CLN-R and CLN-B retained marketability for
the shortest duration of storage, retaining only 50 and
*53 % marketability on the 16th day at which these fruits
were discarded (data not shown). The genotypes containing
dg gene (BCT-115) maintained good marketability (80 %)
whereas BCT-119 containing ogc gene had lower market-
ability (*57 % only) on the 20th day. In case of normal
genotypes, Berika (*77 %) and Patharkutchi (*67 %)
had the highest marketability at 20th day followed by FEB-
2 (*63 %). The rin tomatoes, devoid of red color, main-
tained marketability (80 %) successfully more than
3 weeks at room temperature.
Shelf life index
The shelf life index presents the average storage life of
fruits belonging to different genotypes varied significantly
Table 9 Changes in b-carotene (mg/100 g FW) content in tomato genotypes during storage of 18 days
Genotypes Days in storage
0 3 6 9 12 15 18
Berika 0.23 ± 0.04bc 0.28 ± 0.03c–e 0.47 ± 0.08c–e 0.68 ± 0.04c 0.76 ± 0.11fg 0.92 ± 0.05de 1.57 ± 0.12b
BCT-115 0.29 ± 0.06b 0.48 ± 0.10a 0.76 ± 0.05a 0.94 ± 0.04a 1.16 ± 0.06b 1.43 ± 0.50ab 1.75 ± 0.13a
BCT-119 0.20 ± 0.03cd 0.42 ± 0.04ab 0.64 ± 0.04b 0.89 ± 0.03a 1.06 ± 0.14bc 1.21 ± 0.11c –
BCT-111 0.17 ± 0.04cd 0.22 ± 0.05e 0.43 ± 0.13d–f 0.54 ± 0.06d 0.63 ± 0.14gh 0.68 ± 0.09f 0.71 ± 0.07f
Punjab Chhuhara 0.16 ± 0.03cd 0.21 ± 0.02e 0.24 ± 0.04g 0.36 ± 0.07e 0.58 ± 0.04h 0.82 ± 0.06e 1.09 ± 0.11d
FEB-2 0.16 ± 0.04d 0.27 ± 0.03de 0.33 ± 0.0fg 0.54 ± 0.06d 0.73 ± 0.05f–h 0.82 ± 0.02e 0.92 ± 0.10e
BCT-53 0.19 ± 0.02cd 0.22 ± 0.02e 0.35 ± 0.06e–g 0.50 ± 0.09d 0.66 ± 0.06gh 0.86 ± 0.05de –
Patharkutchi 0.29 ± 0.06b 0.31 ± 0.02c–e 0.43 ± 0.05d–f 0.69 ± 0.03c 0.89 ± 0.09d–f 1.35 ± 0.10b 1.37 ± 0.05c
CLN-B 0.28 ± 0.04b 0.38 ± 0.04a–c 0.55 ± 0.05b–d 0.76 ± 0.11bc 1.04 ± 0.06b–d 1.17 ± 0.09c –
CLN-R 0.36 ± 0.06a 0.43 ± 0.10ab 0.65 ± 0.10ab 0.87 ± 0.04ab 1.31 ± 0.10a 1.54 ± 0.09a –
Values are the mean of three replicates of the sample on each treatment ± standard deviation. Means in a column with the same letter are not
significantly different (P B 0.05)
Table 8 Changes in lycopene (mg/100 g FW) content in tomato genotypes during storage of 18 days
Genotypes Days in storage
0 3 6 9 12 15 18
Berika 2.29 ± 0.03a 2.51 ± 0.28a 3.05 ± 0.34a 3.31 ± 0.44a 3.61 ± 0.38a 4.06 ± 0.28a 4.35 ± 0.41ab
BCT-115 1.55 ± 0.16d 1.99 ± 0.18bc 2.53 ± 0.24bc 2.97 ± 0.40a–c 3.56 ± 0.11a 4.06 ± 0.25a 4.65 ± 0.50a
BCT-119 2.00 ± 0.17a–c 2.31 ± 0.11ab 2.56 ± 0.19bc 2.80 ± 0.20bc 3.11 ± 0.23ab 3.52 ± 0.36b –
BCT-111 – – – 0.04 ± 0e 0.12 ± 0.01e 0.15 ± 0.02d 0.18 ± 0.02d
Punjab Chhuhara 2.03 ± 0.07a–c 2.23 ± 0.14ab 2.36 ± 0.09cd 2.61 ± 0.14cd 3.08 ± 0.14ab 3.29 ± 0.12bc 3.66 ± 0.09c
FEB-2 2.19 ± 0.16ab 2.31 ± 0.19ab 2.60 ± 0.20bc 2.91 ± 0.18bc 3.14 ± 0.19ab 3.36 ± 0.21bc 3.65 ± 0.13c
BCT-53 1.41 ± 0.16d 1.57 ± 0.13d 1.81 ± 0.11e 2.31 ± 0.18d 2.80 ± 0.19cd 3.27 ± 0.20bc –
Patharkutchi 2.26 ± 0.20a 2.44 ± 0.11a 2.77 ± 0.07ab 3.18 ± 0.12ab 3.60 ± 0.06a 3.99 ± 0.14a 4.30 ± 0.04b
CLN-B 1.59 ± 0.47d 1.84 ± 0.41cd 2.17 ± 0.37d 2.69 ± 0.27c 3.08 ± 0.35ab 3.42 ± 0.46bc –
CLN-R 1.77 ± 0.08c–d 2.01 ± 0.10bc 2.12 ± 0.12de 2.28 ± 0.08d 2.63 ± 0.18d 3.08 ± 0.27c –
Values are the mean of three replicates of the sample on each treatment ± standard deviation. Means in a column with the same letter are not
significantly different (P B 0.05)
Acta Physiol Plant (2015) 37:1728 Page 7 of 11 1728
123
Author's personal copy
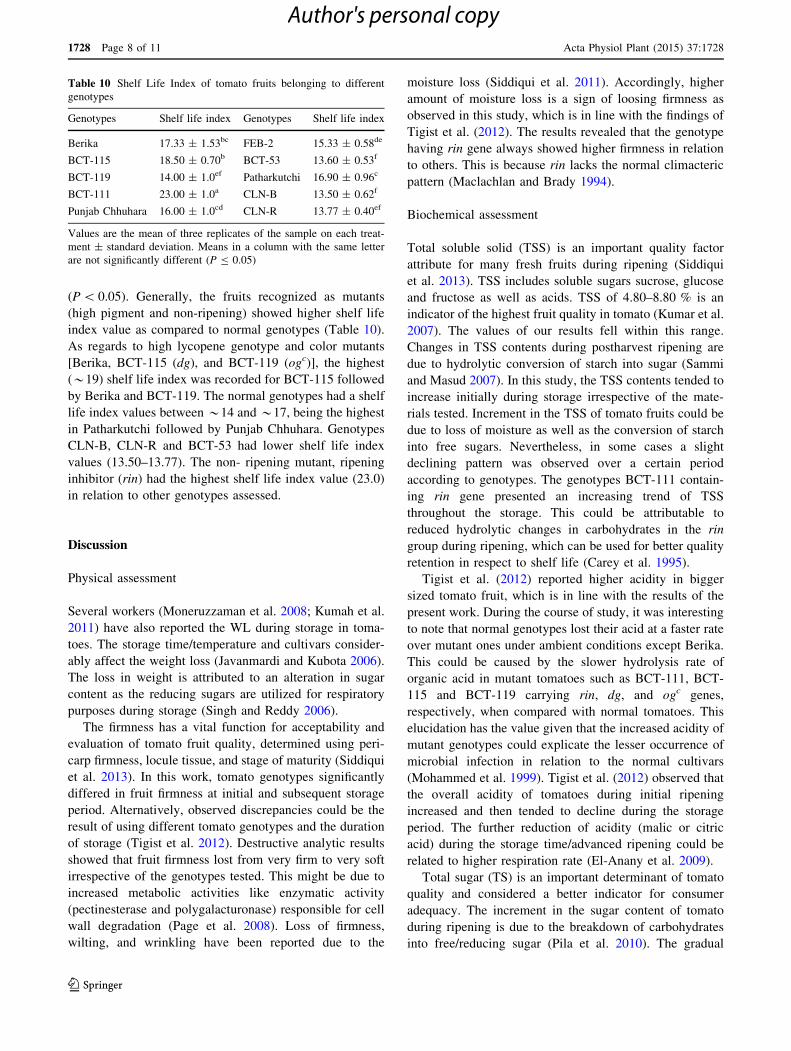
(P \ 0.05). Generally, the fruits recognized as mutants
(high pigment and non-ripening) showed higher shelf life
index value as compared to normal genotypes (Table 10).
As regards to high lycopene genotype and color mutants
[Berika, BCT-115 (dg), and BCT-119 (ogc)], the highest
(*19) shelf life index was recorded for BCT-115 followed
by Berika and BCT-119. The normal genotypes had a shelf
life index values between *14 and *17, being the highest
in Patharkutchi followed by Punjab Chhuhara. Genotypes
CLN-B, CLN-R and BCT-53 had lower shelf life index
values (13.50–13.77). The non- ripening mutant, ripening
inhibitor (rin) had the highest shelf life index value (23.0)
in relation to other genotypes assessed.
Discussion
Physical assessment
Several workers (Moneruzzaman et al. 2008; Kumah et al.
2011) have also reported the WL during storage in toma-
toes. The storage time/temperature and cultivars consider-
ably affect the weight loss (Javanmardi and Kubota 2006).
The loss in weight is attributed to an alteration in sugar
content as the reducing sugars are utilized for respiratory
purposes during storage (Singh and Reddy 2006).
The firmness has a vital function for acceptability and
evaluation of tomato fruit quality, determined using peri-
carp firmness, locule tissue, and stage of maturity (Siddiqui
et al. 2013). In this work, tomato genotypes significantly
differed in fruit firmness at initial and subsequent storage
period. Alternatively, observed discrepancies could be the
result of using different tomato genotypes and the duration
of storage (Tigist et al. 2012). Destructive analytic results
showed that fruit firmness lost from very firm to very soft
irrespective of the genotypes tested. This might be due to
increased metabolic activities like enzymatic activity
(pectinesterase and polygalacturonase) responsible for cell
wall degradation (Page et al. 2008). Loss of firmness,
wilting, and wrinkling have been reported due to the
moisture loss (Siddiqui et al. 2011). Accordingly, higher
amount of moisture loss is a sign of loosing firmness as
observed in this study, which is in line with the findings of
Tigist et al. (2012). The results revealed that the genotype
having rin gene always showed higher firmness in relation
to others. This is because rin lacks the normal climacteric
pattern (Maclachlan and Brady 1994).
Biochemical assessment
Total soluble solid (TSS) is an important quality factor
attribute for many fresh fruits during ripening (Siddiqui
et al. 2013). TSS includes soluble sugars sucrose, glucose
and fructose as well as acids. TSS of 4.80–8.80 % is an
indicator of the highest fruit quality in tomato (Kumar et al.
2007). The values of our results fell within this range.
Changes in TSS contents during postharvest ripening are
due to hydrolytic conversion of starch into sugar (Sammi
and Masud 2007). In this study, the TSS contents tended to
increase initially during storage irrespective of the mate-
rials tested. Increment in the TSS of tomato fruits could be
due to loss of moisture as well as the conversion of starch
into free sugars. Nevertheless, in some cases a slight
declining pattern was observed over a certain period
according to genotypes. The genotypes BCT-111 contain-
ing rin gene presented an increasing trend of TSS
throughout the storage. This could be attributable to
reduced hydrolytic changes in carbohydrates in the rin
group during ripening, which can be used for better quality
retention in respect to shelf life (Carey et al. 1995).
Tigist et al. (2012) reported higher acidity in bigger
sized tomato fruit, which is in line with the results of the
present work. During the course of study, it was interesting
to note that normal genotypes lost their acid at a faster rate
over mutant ones under ambient conditions except Berika.
This could be caused by the slower hydrolysis rate of
organic acid in mutant tomatoes such as BCT-111, BCT-
115 and BCT-119 carrying rin, dg, and ogc genes,
respectively, when compared with normal tomatoes. This
elucidation has the value given that the increased acidity of
mutant genotypes could explicate the lesser occurrence of
microbial infection in relation to the normal cultivars
(Mohammed et al. 1999). Tigist et al. (2012) observed that
the overall acidity of tomatoes during initial ripening
increased and then tended to decline during the storage
period. The further reduction of acidity (malic or citric
acid) during the storage time/advanced ripening could be
related to higher respiration rate (El-Anany et al. 2009).
Total sugar (TS) is an important determinant of tomato
quality and considered a better indicator for consumer
adequacy. The increment in the sugar content of tomato
during ripening is due to the breakdown of carbohydrates
into free/reducing sugar (Pila et al. 2010). The gradual
Table 10 Shelf Life Index of tomato fruits belonging to different
genotypes
Genotypes Shelf life index Genotypes Shelf life index
Berika 17.33 ± 1.53bc FEB-2 15.33 ± 0.58de
BCT-115 18.50 ± 0.70b BCT-53 13.60 ± 0.53f
BCT-119 14.00 ± 1.0ef Patharkutchi 16.90 ± 0.96c
BCT-111 23.00 ± 1.0a CLN-B 13.50 ± 0.62f
Punjab Chhuhara 16.00 ± 1.0cd CLN-R 13.77 ± 0.40ef
Values are the mean of three replicates of the sample on each treat-
ment ± standard deviation. Means in a column with the same letter
are not significantly different (P B 0.05)
1728 Page 8 of 11 Acta Physiol Plant (2015) 37:1728
123
Author's personal copy
increase followed by a slight decline (after a certain period)
in TS observed in this study is the conformity of the results
of Sammi and Masud (2007) and Moneruzzaman et al.
(2008). This decrease might be due to utilization and
breakdown of sugar during the respiration process and
fermentation during prolonged storage.
Being an antioxidant, changes in ascorbic acid level in
fruits during storage should be assessed for the effects of
genetic factors (Tigist et al. 2012). The ascorbic acid
content in all genotypes increased up to a certain period
and followed by a gradual decline (in some cases). The
trend was dependent upon the genotypes. Among all
normal genotypes except Berika, the AA contents
increased at a faster rate as compared to mutant ones. This
could have better insinuation towards retention of high
AA in mutant tomato genotypes. The rin gene containing
genotype (BCT-111) showed continuous increase up to
the last day of storage. The AA increase in the tomatoes is
an indication that the fruit is still in the ripening phase,
whereas a decline indicates the senescence (Pila et al.
2010). Different workers pointed out an increase in AA
during ripening of some tomato genotypes (Tigist et al.
2012). One of the most important noticeable change
during ripening is the de novo carotenoids synthesis
mainly lycopene and b-carotene transforming fruit color
from green (chloroplasts) to red (chromoplasts) (Davila-
Avina et al. 2011). The increase was equivalent with the
other parameters of ripening. The high lycopene genotype
(Berika) and color mutants such as BCT-115 and BCT-
119 having dg and ogc genes, respectively accumulated
higher carotenoids over normal genotypes in which
Patharkutchi had the highest contents. These results are
also in accordance and corroborate those of Lenucci et al.
(2010) and Ilahy et al. (2011a, b) who reported that high-
pigment tomatoes accumulate high amounts of carotenoid
contents. The higher accumulation of carotenoid contents
by color mutants is attributed mainly due to genotypic
factors (Ilahy et al. 2011a). The significant lycopene
buildup in high lycopene tomato genotypes could be due
to the condensed cycling rate of this compound to produce
carotenes and/or to a superior phytoene synthase-I activ-
ity, which causes an enormous production of lycopene
precursors in tomato fruits during ripening (Fraser et al.
2009). The genotype BCT-111 consisting rin gene did not
develop lycopene whilst b-carotene content accumulation
was in appreciable amount. This is because in ripening-
inhibitor (rin) tomato nearly all features of the ripening
(increased respiration and ethylene production, carotenoid
synthesis, texture loss etc.) are repressed (Barry and
Giovannoni 2007).
Subjective assessment
The subjective (finger touch) firmness and percentage
marketability tended to decrease during storage period
irrespective of the genotypes. Generally, the mutant
genotypes found to maintain good firmness than normal
ones except Patharkutchi that also maintained good firm-
ness until last the day of storage. The fruits containing rin
gene had the highest firmness in relation to other tomatoes.
Tigist et al. (2012) reported varietal difference in normal
tomato fruit firmness with a decreasing trend during stor-
age at ambient condition. The study revealed that effect of
genotypes significantly altered the percentage of market-
able tomatoes during storage. Due to lower marketability of
CLN-B and CLN-R were discarded at 16th day. BCT-115
having dg gene and Berika had the highest marketability
even at 20th day of storage. Postharvest decays normally
develop in wounded, bruised, and soft fruits. The inflicted
damage or bruises are not always instantly observable but
they become perceptible during successive handling and
postharvest life. Tomatoes are susceptible to numerous
fruit decays, from the field through postharvest handling
(Assi et al. 2009; Tadesse et al. 2012). Shriveling of fruits
is also a serious problem encountered in tomatoes that
contributed to the reduction in the marketable fruits as the
storage period advanced (Tadesse et al. 2012). Fruits of all
genotypes were collected from the same field having sim-
ilar stage of ripeness. The storability assessment was car-
ried out under the same storage conditions. Thus, the
difference in the fruit quality was dependent on the
genotype.
Shelf life index
The shelf life index of fruits belonging to different geno-
types varied significantly as a function genotypic factor.
Current molecular approaches have demonstrated that
factors like moisture content and structure of the cuticle of
fruits are vital for the extended shelf life (Matas et al.
2009). This information opines that increased shelf life of
mutants and bigger sized normal tomatoes might be
because of their molecular mechanisms.
The results also revealed that BCT-111 possessing rin
gene had the highest shelf life. These results are in line
with Garg et al. (2008a, b) who reported that the shelf life
of genotypes possessing rin, nor, and alc alleles was more
than other genotypes. Ripening-inhibitor (rin) mutant
tomato lacks color development (lycopene synthesis) and
polygalacturonase activity during ripening remains negli-
gible (Barry and Giovannoni 2007).
Acta Physiol Plant (2015) 37:1728 Page 9 of 11 1728
123
Author's personal copy
Conclusions
Considering the all storability assessment data, it can be
summarized that mutants BCT-111 and BCT-115 carrying
rin and dg genes, respectively, showed the highest shelf
life. The occurrence of fruit cracking in BCT-119 pos-
sessing ogc gene renders it unsuitable for storage. Among
the normal genotypes, Berika, Patharkutchi, and Punjab
Chhuhara had a longer shelf life amongst others. Based on
evaluation of shelf life, the genotypes are categorized into
three groups such as less than 15 days [CLN-B, BCT-53,
CLN-R, and BCT-119 (ogc)], 15–18 days [Feb-2, Punjab
Chhuhara, Patharkutchi, and Berika], and More than
18 days [BCT-115 (dg), and BCT-111 (rin)]. We have
endeavored to unravel the available variants in tomato for
important traits such as fruit shelf life, marketability, and
bioactive compounds. Thus, the present study clearly
indicates selecting the cultivar having a long shelf life
could improve marketability of tomato fruits for relatively
longer period.
Author contribution statement MWS and IC envis-
aged, designed and coordinated the study. MWS contrib-
uted by writing and correction of the manuscript. JFA
contributed by scientific advices. PH provided study site
and helped in identification and collection of plants. PM
performed the statistical interpretation of all the experi-
mental data. All the authors approved the final manuscript.
References
Ali A, Maqbool M, Alderson PG, Zahid N (2013) Effect of gum
arabic as an edible coating on antioxidant capacity of tomato
(Solanum lycopersicum L.) fruit during storage. Postharvest Biol
Technol 76:119–124
AOAC (1990) Official methods of analysis, 5th edn. Association of
Official Analytical Chemists, Arlington
Assi NE, Jabarin A, Al-Debei H (2009) Technical and economical
evaluation of traditional vs advanced handling of tomatoes in
Jordan. J Agron 8(1):39–44
Barry CS, Giovannoni JJ (2007) Ethylene and Fruit ripening. J Plant
Growth Regul 26:143–159
Carey AT, Holt K, Picard S, Wilde R, Tucker GA, Bird CR, Schuch
W, Seymour GB (1995) Tomato exo (1 ? 4) b-D-galactanase.
Isolation, changes during ripening in normal and mutant tomato
fruit, and characterization of a related cDNA clone. Plant Physiol
108:1099–1107
Carrari F, Asis R, Fernie AR (2007) The metabolic shifts underlying
tomato fruit development. Plant Biotech. J. 24:45–55
Chauhan OP, Nanjappa C, Ashok N, Ravi N, Roopa N, Raju PS
(2013) Shellac and Aloe vera gel based surface coating for shelf
life extension of tomatoes. J Food Sci Technol. doi:10.1007/
s13197-013-1035-6
Davila-Avina JEDJ, Villa-Rodrıguez J, Cruz-valenzuela R, Rodrı-
guez-Armenta M, Espino-Dıaz M, Ayala-Zavala JF, Olivas-
Orozco GI (2011) Effect of edible coatings, storage time and
maturity stage on overall quality of tomato fruits. Am J Agric
Biol Sci 6(1):162–171
El-Anany AM, Hassan GFA, Rehab Ali FM (2009) Effects of edible
coatings on the shelf-life and quality of Anna apple (Malus
domestica Borkh) during cold storage. J Food Technol 7:5–11
Fraser PD, Enfissi EMA, Bramley PM (2009) Genetic engineering of
carotenoid formation in tomato fruit and the potential application
of systems and synthetic biology approaches. Arch Biochem
Biophys 483:196–204
Garcıa-Garcıa I, Taboada-Rodrıguez A, Lopez-Gomez A, Marın-
Iniesta F (2013) Active packaging of cardboard to extend the
shelf life of tomatoes. Food Bioprocess Technol 6:754–761
Garg N, Cheema DS, Dhatt AS (2008a) Genetics of yield, quality and
shelf life characteristics in tomato under normal and late planting
conditions. Euphytica 159:275–288
Garg N, Cheema DS, Dhatt AS (2008b) Utilization of rin, nor, and alc
alleles to extend tomato fruit availability. Int J Veg Sci 14:41–54
Getinet H, Seyoum T, Woldetsadik K (2008) The effect of cultivar,
maturity stage and storage environment on quality of tomatoes.
J Food Eng 87:467–478
Hernandez-Yepez JN, De la Haba MJ, Sanchez MT (2013) Effect of
different prepackaging treatments on the physical/chemical
quality of Margariteno tomatoes during postharvest storage at
room temperature. J Food Qual 36:113–120
Ilahy R, Hdider C, Lenucci MS, Tlili I, Dalessandro G (2011a)
Antioxidant activity and bioactive compound changes during
fruit ripening of high-lycopene tomato cultivars. J Food Compos
Anal 24(4–5):588–595
Ilahy R, Hdider C, Lenucci MS, Tlili I, Dalessandro G (2011b)
Phytochemical composition and antioxidant activity of high-
lycopene tomato (Solanum lycopersicum L.) cultivars grown in
Southern Italy. Sci Hortic 127(3):255–261
Ilic ZS, Marinkovic D, Trajkovic R, Sunic L, Perzelan Y, Alkalai-
Tuvia S, Fallik E (2013) Effect of 1-methylcyclopropene on the
antioxidant capacity and postharvest quality of tomato fruit. Afr
J Biotechnol 12(6):547–553
Javanmardi J, Kubota C (2006) Variation of lycopene, antioxidant
activity, total soluble solids and weight loss of tomato during
postharvest storage. Postharvest Biol Technol 41:151–155
Kumah P, Olympio NS, Tayviah CS (2011) Sensitivity of three
tomato (Lycopersicon esculentum) cultivars—Akoma, Pecto-
mech and Power—to chilling injury. Agr Biol J N Am
2(5):799–805
Kumar M, Singh P, Singh N, Singh L, PrAAd RN (2007) Studies on
quality traits of open pollinated varieties and hybrids of tomato
responsible for their shelf life at ambient conditions. Indian J
Agric Biochem 20(1):17–22
Lenucci MS, Caccioppola A, Durante M, Serrone L, Rescio L, Piro G,
Dalessandro G (2010) Optimization of biological and physical
parameters for lycopene supercritical CO2 extraction from
ordinary and high-pigment tomato cultivars. J Sci Food Agric
90:1709–1718
Maclachlan G, Brady C (1994) Endo-1, 4-b-glucanase, xyloglucanase
and xyloglucan endo-transglycosylase activities versus potential
substrates in ripening tomatoes. Plant Physiol 105:965–974
Matas AJ, Gapper NE, Chung MY, Giovannoni JJ, Rose JKC (2009)
Biology and genetic engineering of fruit maturation for enhanced
quality and shelf-life. Curr Opin Biotechnol 20:197–203
Meli VS, Ghosh S, Prabha TN, Chakraborty N (2010) Enhancement
of fruit shelf life by suppressing N-glycan processing enzymes.
Proc Natl Acad Sci USA 107:2413–2418
Mohammed M, Wilson LA, Gomes PL (1999) Postharvest sensory
and physiochemical attributes of processing and non-processing
tomato cultivar. J Food Qual 22:167–182
Moneruzzaman KM, Hossain ABMS, Sani W, Saifuddin M (2008)
Effect of stages of maturity and ripening conditions on the
1728 Page 10 of 11 Acta Physiol Plant (2015) 37:1728
123
Author's personal copy

biochemical characteristics of tomato. Am J Biochem Biotechnol
4(4):336–344
Page D, Marty I, Bouchet JP, Gouble B, Causse M (2008) Isolation of
genes potentially related to fruit quality by subtractive selective
hybridization in tomato. Postharvest Biol Technol 50:117–124
Phakawatmongkol W, Ketsa S, Doorn WG (2004) Variation in fruit
chilling injury among mango cultivars. Postharvest Biol Technol
32:115–118
Pila N, Gol NB, Rao TVR (2010) Effect of post harvest treatments on
physicochemical characteristics and shelf life of tomato (Lycop-
ersicon esculentum Mill.) fruits during storage. Am Eurasian J
Agric Environ Sci 9(5):470–479
Rao AV, Waseem Z, Agarwal S (1998) Lycopene content of tomatoes
and tomato products and their contribution to dietary lycopene.
Food Res Int 31(10):737–741
Sammi S, Masud T (2007) Effect of different packaging systems on
storage life and quality of tomato (Lycopersicon esculentum var.
Rio Grande) during different ripening stages. Internet J Food Saf
9:37–44
Siddiqui MW, Bhattacharjya A, Chakraborty I, Dhua RS (2011)
6-Benzylaminopurine improves shelf life, organoleptic quality
and health-promoting compounds of fresh-cut broccoli florets.
J Sci Ind Res 70(6):461–465
Siddiqui MW, Ayala-Zavala JF, Dhua RS (2013) Genotypic variation
in tomatoes affecting processing and antioxidant attributes. Crit
Rev Food Sci Nutr. doi:10.1080/10408398.2012.710278 (In
Press)
Siddiqui MW, Chakraborty I, Mishra P, Hazra P (2014) Bioactive
attributes of tomatoes possessing dg, ogc, and rin genes. Food
Funct 5(5):936–943
Singh KK, Reddy BS (2006) Post-harvest physico-mechanical
properties of orange peel and fruit. J Food Eng 73:112–120
Tadesse T, Workneh TS, Woldetsadik K (2012) Effect of varieties on
changes in sugar content and marketability of tomato stored
under ambient conditions. Afr J Agric Res 7(14):2124–2130
Vinha AF, Sergio VP, Castro BA, Costa A, Beatriz M, Oliveira PP
(2013) Influence of the Storage Conditions on the Physicochem-
ical Properties, Antioxidant Activity and Microbial Flora of
Different Tomato (Lycopersicon esculentum L.) Cultivars.
J Agric Sci 5:118–128
Tigist M, Workneh TS, Woldetsadik, K (2012) Effects of variety on
the quality of tomato stored under ambient conditions. J Food Sci
Technol (In Press)
Yogendra KN, Gowda PHR (2013) Phenotypic and molecular
characterization of a tomato (Solanum lycopersicum L.) F2
population segregation for improving shelf life. Genet Mol Res
12:506–518
Acta Physiol Plant (2015) 37:1728 Page 11 of 11 1728
123
Author's personal copy