Analysis of induced pluripotent stem cells from a BRCA1 mutant family
14
Stem Cell Reports Resource Analysis of Induced Pluripotent Stem Cells from a BRCA1 Mutant Family Abigail A. Soyombo, 1,7 Yipin Wu, 1,7 Lauren Kolski, 1 Jonathan J. Rios, 4 Dinesh Rakheja, 2,3 Alice Chen, 5 James Kehler, 5 Heather Hampel, 6 Alanna Coughran, 1 and Theodora S. Ross 1, * 1 Department of Internal Medicine, High Risk Cancer Genetics Program 2 Department of Pediatrics 3 Department of Pathology University of Texas Southwestern Medical Center, Dallas, TX 75390, USA 4 Sarah M. and Charles E. Seay Center for Musculoskeletal Research, Texas Scottish Rite Hospital for Children, Dallas, TX 75390, USA 5 Stemgent, Inc., San Diego, CA 92037, USA 6 Division of Human Genetics, Ohio State University, Columbus, OH 43240, USA 7 These authors contributed equally to this work *Correspondence: [email protected] http://dx.doi.org/10.1016/j.stemcr.2013.08.004 This is an open-access article distributed under the terms of the Creative Commons Attribution-NonCommercial-No Derivative Works License, which permits non-commercial use, distribution, and reproduction in any medium, provided the original author and source are credited. SUMMARY Understanding BRCA1 mutant cancers is hampered by difficulties in obtaining primary cells from patients. We therefore generated and characterized 24 induced pluripotent stem cell (iPSC) lines from fibroblasts of eight individuals from a BRCA1 5382insC mutant family. All BRCA1 5382insC heterozygous fibroblasts, iPSCs, and teratomas maintained equivalent expression of both wild-type and mutant BRCA1 transcripts. Although no difference in differentiation capacity was observed between BRCA1 wild-type and mutant iPSCs, there was elevated protein kinase C-theta (PKC-theta) in BRCA1 mutant iPSCs. Cancer cell lines with BRCA1 mutations and hormone-receptor- negative breast cancers also displayed elevated PKC-theta. Genome sequencing of the 24 iPSC lines showed a similar frequency of reprog- ramming-associated de novo mutations in BRCA1 mutant and wild-type iPSCs. These data indicate that iPSC lines can be derived from BRCA1 mutant fibroblasts to study the effects of the mutation on gene expression and genome stability. INTRODUCTION BRCA1/2 mutations are autosomal-dominant mutations that dramatically increase the risk for developing breast and ovarian cancer, and to a lesser extent other malig- nancies, such as melanoma, pancreatic cancer, and pros- tate cancer (Futreal et al., 1994; Lancaster et al., 1996; Miki et al., 1994). The BRCA1 and BRCA2 tumor-suppres- sor proteins play roles in transcriptional regulation and DNA repair (Turner et al., 2004). BRCA1 also participates in cell-cycle regulation (McPherson et al., 2004), polyade- nylation of messenger RNA (mRNA) (Kleiman et al., 2005), and ubiquitinylation (Baer and Ludwig, 2002). The cancers that arise in patients with inherited BRCA1 muta- tions appear to be more aggressive than those in patients with BRCA2 mutations or sporadic breast tumors. This aggressiveness is thought to result at least in part from the fact that BRCA1-deficient tumors, but not BRCA2-defi- cient tumors, are usually estrogen receptor (ER) and proges- terone receptor (PR) negative (Turner et al., 2004) and therefore unresponsive to hormonal therapies. These observations suggest that the shared DNA repair functions of BRCA1 and BRCA2 do not solely account for differences in cancer incidence among patients with mutations in these genes. Evidence also indicates that cancer risk differs depending on the location of the mutation in the BRCA sequences (Risch et al., 2006). Examination of different BRCA1/2 mutant cells that are prone to tumor formation will identify new BRCA1 and BRCA2 tumor-suppressor functions. One BRCA2 (BRCA2 6174 delT) and two BRCA1 (BRCA1 5382insC and BRCA1 185 delAG) founder mutations account for 90% of inherited BRCA1/2 mutations in patients of Ashkenazi Jewish descent (Petrucelli et al., 2010). Because 0.1% of the Ashkenazi population carries the BRCA1 5382insC mutation, we estimate that this muta- tion is present in approximately 10,000 individuals in the United States alone. A deeper understanding of how each of the Ashkenazi BRCA mutations leads to breast cancer is important because it will improve our understanding of phenotypic variabilities due to different mutations in the same gene. Although mice genetically engineered to have either Brca1 or Brca2 deficiency have been informative models for studies of breast cancer development (Drost et al., 2011; Drost and Jonkers, 2009; Evers and Jonkers, 2006; Shakya et al., 2011), differences in underlying biology exist between humans and mice. Thus, human models are necessary to complement animal models. It has been re- ported that mutation of a single BRCA1 allele leads to genomic instability in human cells, a phenomenon not observed in mice (Konishi et al., 2011). Generation of induced pluripotent stem cells (iPSCs) (Takahashi et al., 2007) from patients carrying BRCA1/2 mutations may pro- vide a window into the cellular phenotypic differences driving their increased cancer risk. BRCA1/2 mutant iPSC 336 Stem Cell Reports j Vol. 1 j 336–349 j October 15, 2013 j ª2013 The Authors
-
Upload
ittehuacan -
Category
Documents
-
view
2 -
download
0
Transcript of Analysis of induced pluripotent stem cells from a BRCA1 mutant family
Stem Cell Reports
ResourceAnalysis of Induced Pluripotent Stem Cells from a BRCA1 Mutant Family
Abigail A. Soyombo,1,7 Yipin Wu,1,7 Lauren Kolski,1 Jonathan J. Rios,4 Dinesh Rakheja,2,3 Alice Chen,5
James Kehler,5 Heather Hampel,6 Alanna Coughran,1 and Theodora S. Ross1,*1Department of Internal Medicine, High Risk Cancer Genetics Program2Department of Pediatrics3Department of Pathology
University of Texas Southwestern Medical Center, Dallas, TX 75390, USA4Sarah M. and Charles E. Seay Center for Musculoskeletal Research, Texas Scottish Rite Hospital for Children, Dallas, TX 75390, USA5Stemgent, Inc., San Diego, CA 92037, USA6Division of Human Genetics, Ohio State University, Columbus, OH 43240, USA7These authors contributed equally to this work
*Correspondence: [email protected]
http://dx.doi.org/10.1016/j.stemcr.2013.08.004
This is an open-access article distributed under the terms of the Creative Commons Attribution-NonCommercial-No Derivative Works License, which
permits non-commercial use, distribution, and reproduction in any medium, provided the original author and source are credited.
SUMMARY
Understanding BRCA1mutant cancers is hampered by difficulties in obtaining primary cells from patients. We therefore generated and
characterized 24 induced pluripotent stem cell (iPSC) lines from fibroblasts of eight individuals from a BRCA1 5382insC mutant family.
All BRCA1 5382insC heterozygous fibroblasts, iPSCs, and teratomas maintained equivalent expression of both wild-type and mutant
BRCA1 transcripts. Although no difference in differentiation capacity was observed between BRCA1 wild-type and mutant iPSCs, there
was elevated protein kinase C-theta (PKC-theta) in BRCA1mutant iPSCs. Cancer cell lines with BRCA1mutations and hormone-receptor-
negative breast cancers also displayed elevated PKC-theta. Genome sequencing of the 24 iPSC lines showed a similar frequency of reprog-
ramming-associated de novo mutations in BRCA1 mutant and wild-type iPSCs. These data indicate that iPSC lines can be derived from
BRCA1 mutant fibroblasts to study the effects of the mutation on gene expression and genome stability.
INTRODUCTION
BRCA1/2 mutations are autosomal-dominant mutations
that dramatically increase the risk for developing breast
and ovarian cancer, and to a lesser extent other malig-
nancies, such as melanoma, pancreatic cancer, and pros-
tate cancer (Futreal et al., 1994; Lancaster et al., 1996;
Miki et al., 1994). The BRCA1 and BRCA2 tumor-suppres-
sor proteins play roles in transcriptional regulation and
DNA repair (Turner et al., 2004). BRCA1 also participates
in cell-cycle regulation (McPherson et al., 2004), polyade-
nylation of messenger RNA (mRNA) (Kleiman et al.,
2005), and ubiquitinylation (Baer and Ludwig, 2002). The
cancers that arise in patients with inherited BRCA1 muta-
tions appear to be more aggressive than those in patients
with BRCA2 mutations or sporadic breast tumors. This
aggressiveness is thought to result at least in part from
the fact that BRCA1-deficient tumors, but not BRCA2-defi-
cient tumors, are usually estrogen receptor (ER) and proges-
terone receptor (PR) negative (Turner et al., 2004) and
therefore unresponsive to hormonal therapies. These
observations suggest that the shared DNA repair functions
of BRCA1 and BRCA2 do not solely account for differences
in cancer incidence among patients with mutations in
these genes. Evidence also indicates that cancer risk differs
depending on the location of the mutation in the BRCA
sequences (Risch et al., 2006). Examination of different
BRCA1/2 mutant cells that are prone to tumor formation
336 Stem Cell Reports j Vol. 1 j 336–349 j October 15, 2013 j ª2013 The A
will identify new BRCA1 and BRCA2 tumor-suppressor
functions.
One BRCA2 (BRCA2 6174 delT) and two BRCA1 (BRCA1
5382insC and BRCA1 185 delAG) founder mutations
account for 90% of inherited BRCA1/2 mutations in
patients of Ashkenazi Jewish descent (Petrucelli et al.,
2010). Because 0.1% of the Ashkenazi population carries
the BRCA1 5382insCmutation, we estimate that thismuta-
tion is present in approximately 10,000 individuals in the
United States alone. A deeper understanding of how each
of the Ashkenazi BRCA mutations leads to breast cancer is
important because it will improve our understanding of
phenotypic variabilities due to different mutations in the
same gene.
Although mice genetically engineered to have either
Brca1 or Brca2 deficiency have been informative models
for studies of breast cancer development (Drost et al.,
2011; Drost and Jonkers, 2009; Evers and Jonkers, 2006;
Shakya et al., 2011), differences in underlying biology exist
between humans and mice. Thus, human models are
necessary to complement animal models. It has been re-
ported that mutation of a single BRCA1 allele leads to
genomic instability in human cells, a phenomenon not
observed in mice (Konishi et al., 2011). Generation of
induced pluripotent stem cells (iPSCs) (Takahashi et al.,
2007) from patients carrying BRCA1/2mutations may pro-
vide a window into the cellular phenotypic differences
driving their increased cancer risk. BRCA1/2 mutant iPSC
uthors
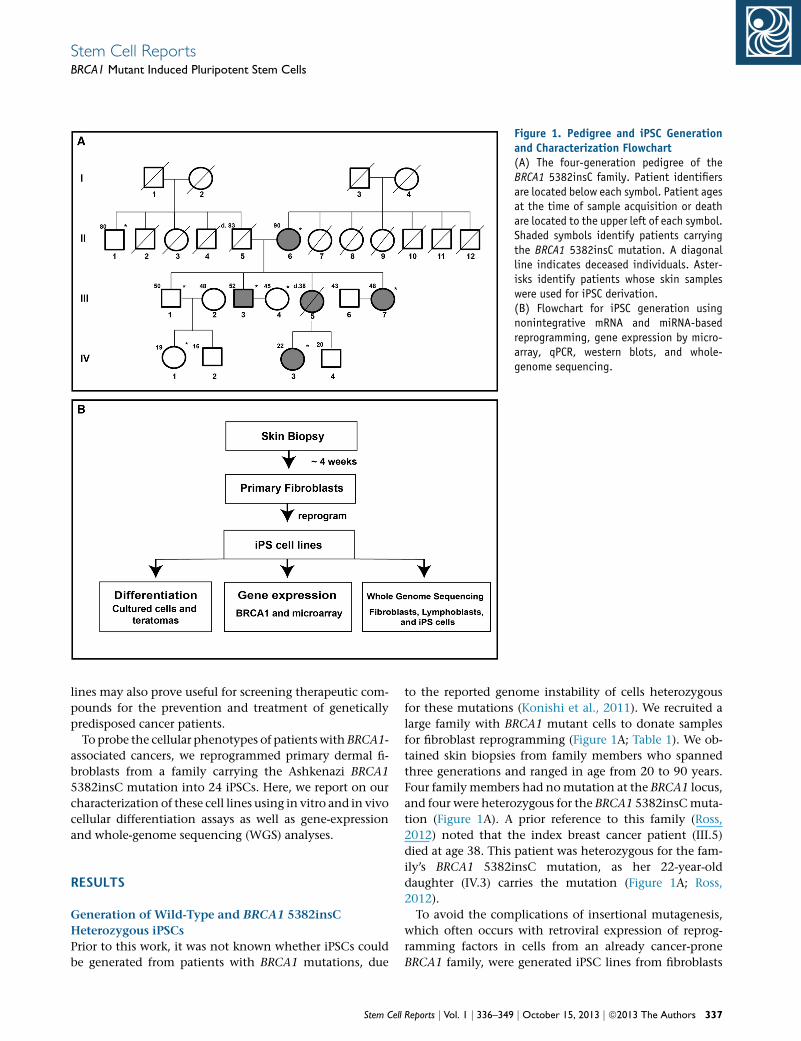
Figure 1. Pedigree and iPSC Generationand Characterization Flowchart(A) The four-generation pedigree of theBRCA1 5382insC family. Patient identifiersare located below each symbol. Patient agesat the time of sample acquisition or deathare located to the upper left of each symbol.Shaded symbols identify patients carryingthe BRCA1 5382insC mutation. A diagonalline indicates deceased individuals. Aster-isks identify patients whose skin sampleswere used for iPSC derivation.(B) Flowchart for iPSC generation usingnonintegrative mRNA and miRNA-basedreprogramming, gene expression by micro-array, qPCR, western blots, and whole-genome sequencing.
Stem Cell ReportsBRCA1 Mutant Induced Pluripotent Stem Cells
lines may also prove useful for screening therapeutic com-
pounds for the prevention and treatment of genetically
predisposed cancer patients.
To probe the cellular phenotypes of patients with BRCA1-
associated cancers, we reprogrammed primary dermal fi-
broblasts from a family carrying the Ashkenazi BRCA1
5382insC mutation into 24 iPSCs. Here, we report on our
characterization of these cell lines using in vitro and in vivo
cellular differentiation assays as well as gene-expression
and whole-genome sequencing (WGS) analyses.
RESULTS
Generation of Wild-Type and BRCA1 5382insC
Heterozygous iPSCs
Prior to this work, it was not known whether iPSCs could
be generated from patients with BRCA1 mutations, due
Stem Cell
to the reported genome instability of cells heterozygous
for these mutations (Konishi et al., 2011). We recruited a
large family with BRCA1 mutant cells to donate samples
for fibroblast reprogramming (Figure 1A; Table 1). We ob-
tained skin biopsies from family members who spanned
three generations and ranged in age from 20 to 90 years.
Four family members had nomutation at the BRCA1 locus,
and four were heterozygous for the BRCA1 5382insCmuta-
tion (Figure 1A). A prior reference to this family (Ross,
2012) noted that the index breast cancer patient (III.5)
died at age 38. This patient was heterozygous for the fam-
ily’s BRCA1 5382insC mutation, as her 22-year-old
daughter (IV.3) carries the mutation (Figure 1A; Ross,
2012).
To avoid the complications of insertional mutagenesis,
which often occurs with retroviral expression of reprog-
ramming factors in cells from an already cancer-prone
BRCA1 family, were generated iPSC lines from fibroblasts
Reports j Vol. 1 j 336–349 j October 15, 2013 j ª2013 The Authors 337
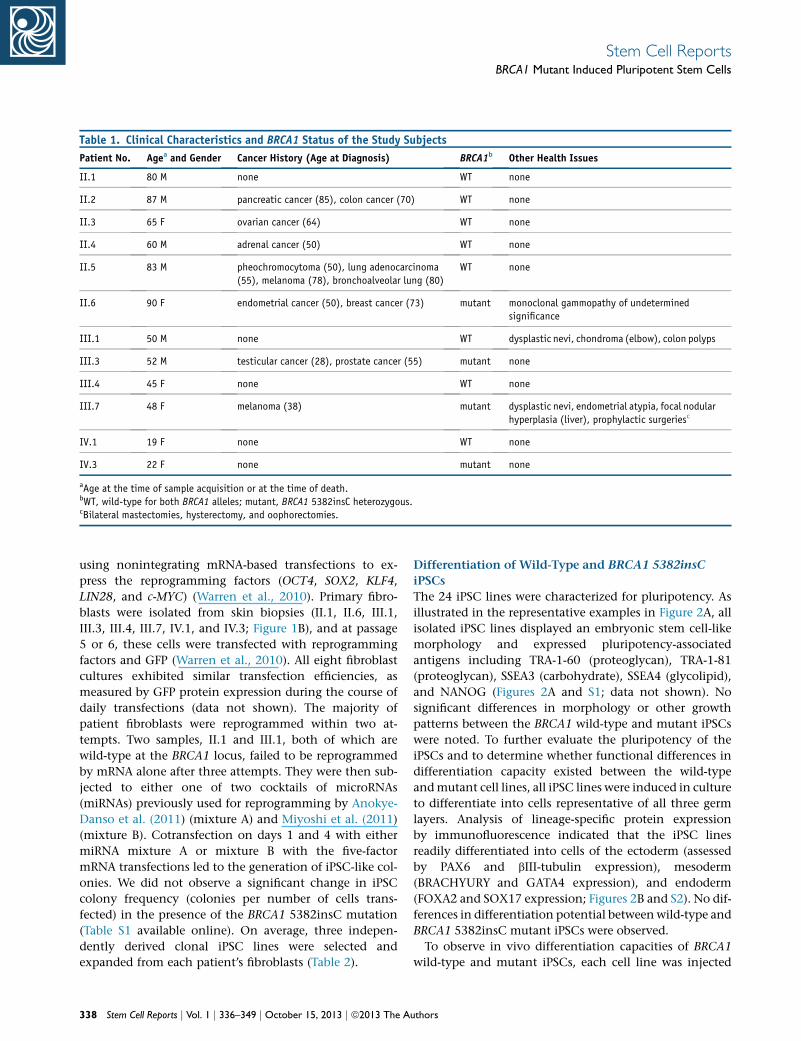
Table 1. Clinical Characteristics and BRCA1 Status of the Study Subjects
Patient No. Agea and Gender Cancer History (Age at Diagnosis) BRCA1b Other Health Issues
II.1 80 M none WT none
II.2 87 M pancreatic cancer (85), colon cancer (70) WT none
II.3 65 F ovarian cancer (64) WT none
II.4 60 M adrenal cancer (50) WT none
II.5 83 M pheochromocytoma (50), lung adenocarcinoma
(55), melanoma (78), bronchoalveolar lung (80)
WT none
II.6 90 F endometrial cancer (50), breast cancer (73) mutant monoclonal gammopathy of undetermined
significance
III.1 50 M none WT dysplastic nevi, chondroma (elbow), colon polyps
III.3 52 M testicular cancer (28), prostate cancer (55) mutant none
III.4 45 F none WT none
III.7 48 F melanoma (38) mutant dysplastic nevi, endometrial atypia, focal nodular
hyperplasia (liver), prophylactic surgeriesc
IV.1 19 F none WT none
IV.3 22 F none mutant none
aAge at the time of sample acquisition or at the time of death.bWT, wild-type for both BRCA1 alleles; mutant, BRCA1 5382insC heterozygous.cBilateral mastectomies, hysterectomy, and oophorectomies.
Stem Cell ReportsBRCA1 Mutant Induced Pluripotent Stem Cells
using nonintegrating mRNA-based transfections to ex-
press the reprogramming factors (OCT4, SOX2, KLF4,
LIN28, and c-MYC) (Warren et al., 2010). Primary fibro-
blasts were isolated from skin biopsies (II.1, II.6, III.1,
III.3, III.4, III.7, IV.1, and IV.3; Figure 1B), and at passage
5 or 6, these cells were transfected with reprogramming
factors and GFP (Warren et al., 2010). All eight fibroblast
cultures exhibited similar transfection efficiencies, as
measured by GFP protein expression during the course of
daily transfections (data not shown). The majority of
patient fibroblasts were reprogrammed within two at-
tempts. Two samples, II.1 and III.1, both of which are
wild-type at the BRCA1 locus, failed to be reprogrammed
by mRNA alone after three attempts. They were then sub-
jected to either one of two cocktails of microRNAs
(miRNAs) previously used for reprogramming by Anokye-
Danso et al. (2011) (mixture A) and Miyoshi et al. (2011)
(mixture B). Cotransfection on days 1 and 4 with either
miRNA mixture A or mixture B with the five-factor
mRNA transfections led to the generation of iPSC-like col-
onies. We did not observe a significant change in iPSC
colony frequency (colonies per number of cells trans-
fected) in the presence of the BRCA1 5382insC mutation
(Table S1 available online). On average, three indepen-
dently derived clonal iPSC lines were selected and
expanded from each patient’s fibroblasts (Table 2).
338 Stem Cell Reports j Vol. 1 j 336–349 j October 15, 2013 j ª2013 The A
Differentiation of Wild-Type and BRCA1 5382insC
iPSCs
The 24 iPSC lines were characterized for pluripotency. As
illustrated in the representative examples in Figure 2A, all
isolated iPSC lines displayed an embryonic stem cell-like
morphology and expressed pluripotency-associated
antigens including TRA-1-60 (proteoglycan), TRA-1-81
(proteoglycan), SSEA3 (carbohydrate), SSEA4 (glycolipid),
and NANOG (Figures 2A and S1; data not shown). No
significant differences in morphology or other growth
patterns between the BRCA1 wild-type and mutant iPSCs
were noted. To further evaluate the pluripotency of the
iPSCs and to determine whether functional differences in
differentiation capacity existed between the wild-type
andmutant cell lines, all iPSC lines were induced in culture
to differentiate into cells representative of all three germ
layers. Analysis of lineage-specific protein expression
by immunofluorescence indicated that the iPSC lines
readily differentiated into cells of the ectoderm (assessed
by PAX6 and bIII-tubulin expression), mesoderm
(BRACHYURY and GATA4 expression), and endoderm
(FOXA2 and SOX17 expression; Figures 2B and S2). No dif-
ferences in differentiation potential betweenwild-type and
BRCA1 5382insC mutant iPSCs were observed.
To observe in vivo differentiation capacities of BRCA1
wild-type and mutant iPSCs, each cell line was injected
uthors

Table 2. Summary of iPSC Derivation from Fibroblasts
Fibroblast Samplesa Reprogramming Methodb iPSC Clones Attempts to Reprogram BRCA1 Statusc
II.1 mRNA + miRNA iPS.II.1.1, iPS.II.1.2, iPS.II.1.3, iPS.II.1.4 4 WT
II.6 mRNA iPS.II.6.1, iPS.II.6.2, iPS.II.6.3 1 mutant
III.1 mRNA + miRNA iPS.III.1.1, iPS.III.1.2 4 WT
III.3 mRNA iPS.III.3.1, iPS.III.3.2, iPS.III.3.3 2 mutant
III.4 mRNA iPS.III.4.1, iPS.III.4.2 1 WT
III.7 mRNA iPS.III.7.1, iPS.III.7.2, iPS.III.7.3, iPS.III.7.4 2 mutant
IV.1 mRNA iPS.IV.1.1, iPS.IV.1.2, iPS.IV.1.3 2 WT
IV.3 mRNA iPS.IV.3.1, iPS.IV.3.2, iPS.IV.3.3 1 mutant
See also Table S1.aSkin samples were harvested from patients after they gave informed consent.bmRNA transfection (Warren et al., 2010) and miRNA choices and expression were as previously described (Anokye-Danso et al., 2011; Miyoshi et al., 2011).cWT, wild-type at both BRCA1 alleles; mutant, BRCA1 5382insC heterozygous.
Stem Cell ReportsBRCA1 Mutant Induced Pluripotent Stem Cells
into the kidney capsule of nonobese diabetic (NOD)/severe
combined immunodeficiency (SCID) mice and observed
for teratoma formation and composition. Once tumors
formed, the histopathology of the tumors was evaluated
for mesoderm-, ectoderm-, and endoderm-derived tissues.
The ability to form benign teratomas containing tissues
from all three germ layers is an inherent characteristic of
iPSCs. Figure 2C displays histologic sections from represen-
tative BRCA1-mutant- and wild-type iPSC-derived tera-
tomas, and demonstrates the presence of tissues from all
three germ layers. The ectoderm is represented by the neu-
ral epithelium, the mesoderm is represented by muscle,
and the endoderm is represented by gut epithelium. All
iPSC lines formed teratomas in vivowithout obvious differ-
ences in their differentiation patterns (Figure S3). Invasive
cancers were not observed in any of the BRCA1wild-type or
mutant teratomas.
BRCA1 mRNA Expression Levels in Fibroblasts, iPSCs,
and Teratomas
Because the BRCA1 mutant fibroblasts reprogrammed so
readily, we hypothesized that rare fibroblasts with loss of
heterozygosity (LOH) at the BRCA1 locus or loss of
BRCA1 expression might have been present in the skin
biopsies, and that these cells were under positive selection
during reprogramming. The process of reprogramming has
been reported to be similar to tumorigenesis (Riggs et al.,
2013), which is supported by the fact that p53 deficiency
enhances reprogramming (Hong et al., 2009). To compare
total BRCA1 expression levels in fibroblasts and iPSCs, we
measured the absolute levels of BRCA1 transcripts using
quantitative PCR (qPCR). Wild-type and heterozygous
mutant fibroblasts expressed, on average, similar levels of
total BRCA1 with 70 copies/ng total RNA, and a 2-fold up-
Stem Cell
regulation of total BRCA1 transcript was observed in all
derivative iPSCs (n = 24) upon reprogramming (Figure 3A).
This differential expression of the BRCA1 gene was
confirmed at the protein level (Figure 3A, inset). Because
BRCA1 is thought to be involved in differentiation of
luminal mammary progenitors into luminal epithelial cells
(Lim et al., 2009), it was somewhat of a surprise that BRCA1
levels increased upon dedifferentiation; however, this in-
crease may be required to maintain genomic stability in
iPSCs. In fact, increased expression of DNA damage repair
genes in two iPSC lines as compared with two differenti-
ated fibroblast lines have been observed previously (Mom-
cilovic et al., 2010).
To explore the possibility of BRCA1 LOH or a compensa-
tory alteration in the expression levels of either the BRCA1
wild-type or mutant alleles in the mutant iPSCs during
reprogramming, we quantified BRCA1wild-type or mutant
allele-specific expression in the patient fibroblasts, iPSCs,
and teratomas. To quantify the absolute levels of BRCA1
wild-type and mutant transcripts, we designed mis-
matched primers that specifically amplified either the
wild-type or mutant mRNA (Figure S1). Wild-type and
mutant BRCA1 transcripts were present at equivalent levels
in the heterozygous fibroblasts (Figure 3B). Thus, mutant
cells (II.6, III.3, III.7, and IV.3) exhibited a 50% decrease
in the absolute amount of wild-type BRCA1 transcript
compared with fibroblasts with two wild-type BRCA1
alleles (II.1, III.1, III.4, and IV.1). All of the mutant iPSC
lines (Figure 3C) and teratomas (Figure 3D) also expressed
equivalent levels of both wild-type andmutant transcripts,
indicating that neither the wild-type nor themutant alleles
were lost during the reprogramming process or during dif-
ferentiation into teratomas, and that BRCA1 haploinsuffi-
ciency persisted. Hence, there was no evidence for
Reports j Vol. 1 j 336–349 j October 15, 2013 j ª2013 The Authors 339
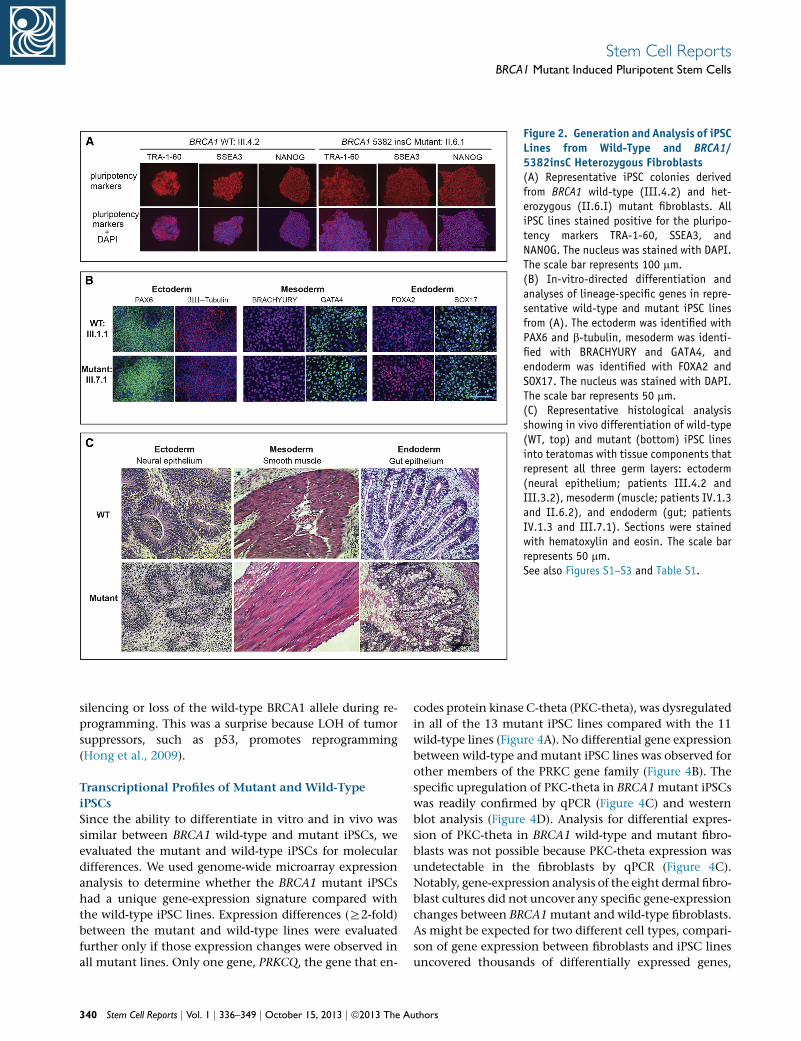
Figure 2. Generation and Analysis of iPSCLines from Wild-Type and BRCA1/5382insC Heterozygous Fibroblasts(A) Representative iPSC colonies derivedfrom BRCA1 wild-type (III.4.2) and het-erozygous (II.6.I) mutant fibroblasts. AlliPSC lines stained positive for the pluripo-tency markers TRA-1-60, SSEA3, andNANOG. The nucleus was stained with DAPI.The scale bar represents 100 mm.(B) In-vitro-directed differentiation andanalyses of lineage-specific genes in repre-sentative wild-type and mutant iPSC linesfrom (A). The ectoderm was identified withPAX6 and b-tubulin, mesoderm was identi-fied with BRACHYURY and GATA4, andendoderm was identified with FOXA2 andSOX17. The nucleus was stained with DAPI.The scale bar represents 50 mm.(C) Representative histological analysisshowing in vivo differentiation of wild-type(WT, top) and mutant (bottom) iPSC linesinto teratomas with tissue components thatrepresent all three germ layers: ectoderm(neural epithelium; patients III.4.2 andIII.3.2), mesoderm (muscle; patients IV.1.3and II.6.2), and endoderm (gut; patientsIV.1.3 and III.7.1). Sections were stainedwith hematoxylin and eosin. The scale barrepresents 50 mm.See also Figures S1–S3 and Table S1.
Stem Cell ReportsBRCA1 Mutant Induced Pluripotent Stem Cells
silencing or loss of the wild-type BRCA1 allele during re-
programming. This was a surprise because LOH of tumor
suppressors, such as p53, promotes reprogramming
(Hong et al., 2009).
Transcriptional Profiles of Mutant and Wild-Type
iPSCs
Since the ability to differentiate in vitro and in vivo was
similar between BRCA1 wild-type and mutant iPSCs, we
evaluated the mutant and wild-type iPSCs for molecular
differences. We used genome-wide microarray expression
analysis to determine whether the BRCA1 mutant iPSCs
had a unique gene-expression signature compared with
the wild-type iPSC lines. Expression differences (R2-fold)
between the mutant and wild-type lines were evaluated
further only if those expression changes were observed in
all mutant lines. Only one gene, PRKCQ, the gene that en-
340 Stem Cell Reports j Vol. 1 j 336–349 j October 15, 2013 j ª2013 The A
codes protein kinase C-theta (PKC-theta), was dysregulated
in all of the 13 mutant iPSC lines compared with the 11
wild-type lines (Figure 4A). No differential gene expression
between wild-type and mutant iPSC lines was observed for
other members of the PRKC gene family (Figure 4B). The
specific upregulation of PKC-theta in BRCA1mutant iPSCs
was readily confirmed by qPCR (Figure 4C) and western
blot analysis (Figure 4D). Analysis for differential expres-
sion of PKC-theta in BRCA1 wild-type and mutant fibro-
blasts was not possible because PKC-theta expression was
undetectable in the fibroblasts by qPCR (Figure 4C).
Notably, gene-expression analysis of the eight dermal fibro-
blast cultures did not uncover any specific gene-expression
changes between BRCA1mutant and wild-type fibroblasts.
As might be expected for two different cell types, compari-
son of gene expression between fibroblasts and iPSC lines
uncovered thousands of differentially expressed genes,
uthors
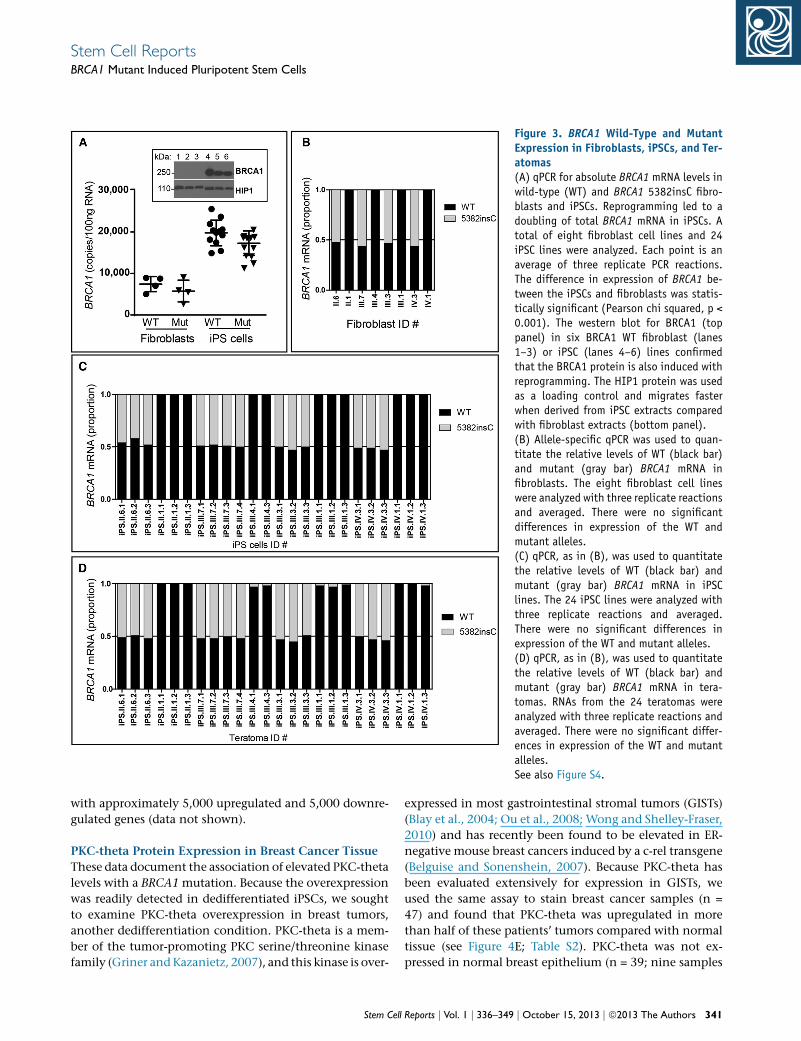
Figure 3. BRCA1 Wild-Type and MutantExpression in Fibroblasts, iPSCs, and Ter-atomas(A) qPCR for absolute BRCA1 mRNA levels inwild-type (WT) and BRCA1 5382insC fibro-blasts and iPSCs. Reprogramming led to adoubling of total BRCA1 mRNA in iPSCs. Atotal of eight fibroblast cell lines and 24iPSC lines were analyzed. Each point is anaverage of three replicate PCR reactions.The difference in expression of BRCA1 be-tween the iPSCs and fibroblasts was statis-tically significant (Pearson chi squared, p <0.001). The western blot for BRCA1 (toppanel) in six BRCA1 WT fibroblast (lanes1–3) or iPSC (lanes 4–6) lines confirmedthat the BRCA1 protein is also induced withreprogramming. The HIP1 protein was usedas a loading control and migrates fasterwhen derived from iPSC extracts comparedwith fibroblast extracts (bottom panel).(B) Allele-specific qPCR was used to quan-titate the relative levels of WT (black bar)and mutant (gray bar) BRCA1 mRNA infibroblasts. The eight fibroblast cell lineswere analyzed with three replicate reactionsand averaged. There were no significantdifferences in expression of the WT andmutant alleles.(C) qPCR, as in (B), was used to quantitatethe relative levels of WT (black bar) andmutant (gray bar) BRCA1 mRNA in iPSClines. The 24 iPSC lines were analyzed withthree replicate reactions and averaged.There were no significant differences inexpression of the WT and mutant alleles.(D) qPCR, as in (B), was used to quantitatethe relative levels of WT (black bar) andmutant (gray bar) BRCA1 mRNA in tera-tomas. RNAs from the 24 teratomas wereanalyzed with three replicate reactions andaveraged. There were no significant differ-ences in expression of the WT and mutantalleles.See also Figure S4.
Stem Cell ReportsBRCA1 Mutant Induced Pluripotent Stem Cells
with approximately 5,000 upregulated and 5,000 downre-
gulated genes (data not shown).
PKC-theta Protein Expression in Breast Cancer Tissue
These data document the association of elevated PKC-theta
levels with a BRCA1 mutation. Because the overexpression
was readily detected in dedifferentiated iPSCs, we sought
to examine PKC-theta overexpression in breast tumors,
another dedifferentiation condition. PKC-theta is a mem-
ber of the tumor-promoting PKC serine/threonine kinase
family (Griner andKazanietz, 2007), and this kinase is over-
Stem Cell
expressed in most gastrointestinal stromal tumors (GISTs)
(Blay et al., 2004; Ou et al., 2008; Wong and Shelley-Fraser,
2010) and has recently been found to be elevated in ER-
negative mouse breast cancers induced by a c-rel transgene
(Belguise and Sonenshein, 2007). Because PKC-theta has
been evaluated extensively for expression in GISTs, we
used the same assay to stain breast cancer samples (n =
47) and found that PKC-theta was upregulated in more
than half of these patients’ tumors compared with normal
tissue (see Figure 4E; Table S2). PKC-theta was not ex-
pressed in normal breast epithelium (n = 39; nine samples
Reports j Vol. 1 j 336–349 j October 15, 2013 j ª2013 The Authors 341
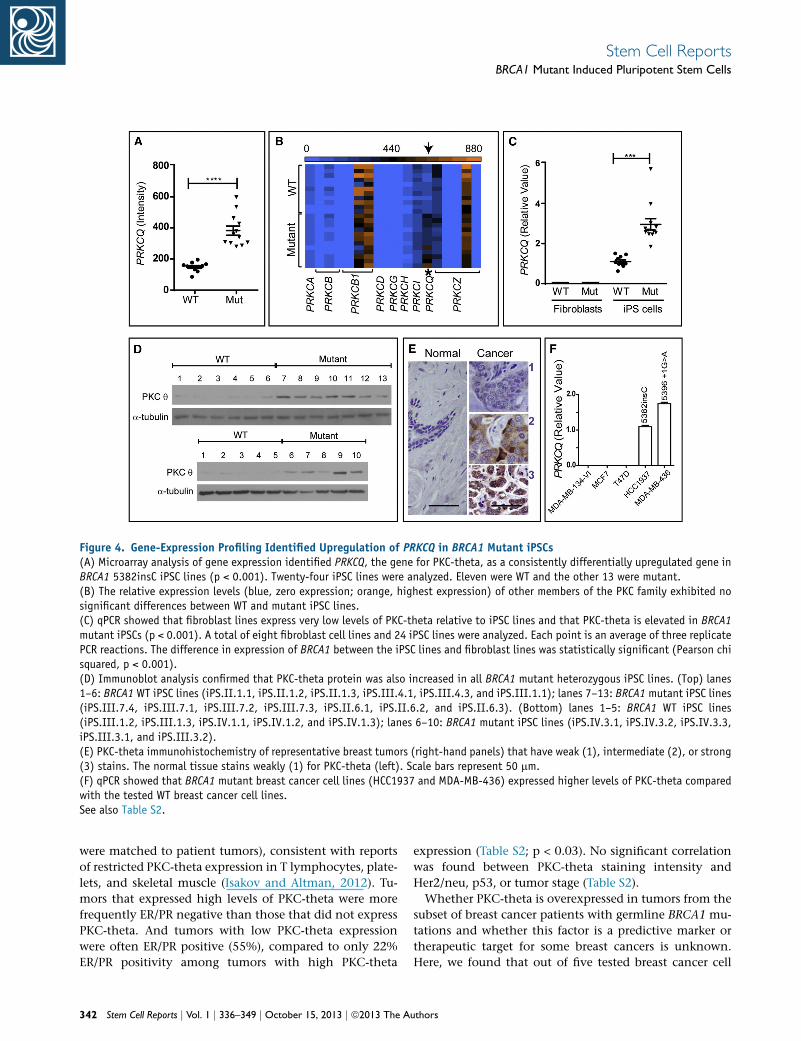
Figure 4. Gene-Expression Profiling Identified Upregulation of PRKCQ in BRCA1 Mutant iPSCs(A) Microarray analysis of gene expression identified PRKCQ, the gene for PKC-theta, as a consistently differentially upregulated gene inBRCA1 5382insC iPSC lines (p < 0.001). Twenty-four iPSC lines were analyzed. Eleven were WT and the other 13 were mutant.(B) The relative expression levels (blue, zero expression; orange, highest expression) of other members of the PKC family exhibited nosignificant differences between WT and mutant iPSC lines.(C) qPCR showed that fibroblast lines express very low levels of PKC-theta relative to iPSC lines and that PKC-theta is elevated in BRCA1mutant iPSCs (p < 0.001). A total of eight fibroblast cell lines and 24 iPSC lines were analyzed. Each point is an average of three replicatePCR reactions. The difference in expression of BRCA1 between the iPSC lines and fibroblast lines was statistically significant (Pearson chisquared, p < 0.001).(D) Immunoblot analysis confirmed that PKC-theta protein was also increased in all BRCA1 mutant heterozygous iPSC lines. (Top) lanes1–6: BRCA1 WT iPSC lines (iPS.II.1.1, iPS.II.1.2, iPS.II.1.3, iPS.III.4.1, iPS.III.4.3, and iPS.III.1.1); lanes 7–13: BRCA1 mutant iPSC lines(iPS.III.7.4, iPS.III.7.1, iPS.III.7.2, iPS.III.7.3, iPS.II.6.1, iPS.II.6.2, and iPS.II.6.3). (Bottom) lanes 1–5: BRCA1 WT iPSC lines(iPS.III.1.2, iPS.III.1.3, iPS.IV.1.1, iPS.IV.1.2, and iPS.IV.1.3); lanes 6–10: BRCA1 mutant iPSC lines (iPS.IV.3.1, iPS.IV.3.2, iPS.IV.3.3,iPS.III.3.1, and iPS.III.3.2).(E) PKC-theta immunohistochemistry of representative breast tumors (right-hand panels) that have weak (1), intermediate (2), or strong(3) stains. The normal tissue stains weakly (1) for PKC-theta (left). Scale bars represent 50 mm.(F) qPCR showed that BRCA1 mutant breast cancer cell lines (HCC1937 and MDA-MB-436) expressed higher levels of PKC-theta comparedwith the tested WT breast cancer cell lines.See also Table S2.
Stem Cell ReportsBRCA1 Mutant Induced Pluripotent Stem Cells
were matched to patient tumors), consistent with reports
of restricted PKC-theta expression in T lymphocytes, plate-
lets, and skeletal muscle (Isakov and Altman, 2012). Tu-
mors that expressed high levels of PKC-theta were more
frequently ER/PR negative than those that did not express
PKC-theta. And tumors with low PKC-theta expression
were often ER/PR positive (55%), compared to only 22%
ER/PR positivity among tumors with high PKC-theta
342 Stem Cell Reports j Vol. 1 j 336–349 j October 15, 2013 j ª2013 The A
expression (Table S2; p < 0.03). No significant correlation
was found between PKC-theta staining intensity and
Her2/neu, p53, or tumor stage (Table S2).
Whether PKC-theta is overexpressed in tumors from the
subset of breast cancer patients with germline BRCA1 mu-
tations and whether this factor is a predictive marker or
therapeutic target for some breast cancers is unknown.
Here, we found that out of five tested breast cancer cell
uthors

Stem Cell ReportsBRCA1 Mutant Induced Pluripotent Stem Cells
lines, the two breast cell lines known to have deleterious
C-terminal BRCA1 frameshift (HCC1937 has the BRCA1
5382insC mutation of the family studied here) or trunca-
tion (MDA-MB-436 has the BRCA1 5396+1G > Amutation)
mutations had significantly higher PKC-theta mRNA levels
(Figure 4F). The other three breast cancer cell lines known
to have wild-type BRCA1 (MDA-MB-134-VI, MCF7 and
T47D) did not express PKC-theta.
Whole-Genome Sequence Analysis of iPSC Lines
To determine whether increased expression of PKC-theta
in BRCA1 mutant iPSCs resulted from an accumulation
of distinct de novo mutations during the reprogramming
process, we performed WGS on all 24 iPSC lines, their
parental fibroblasts, and matched lymphoblasts to iden-
tify de novo mutations. It has been reported that the
process of reprogramming results in de novo coding muta-
tions in iPSCs (Gore et al., 2011; Ji et al., 2012; Ruiz et al.,
2013).
Variants identified byWGSwere conservatively analyzed
to reduce the number of false-positive de novo mutations.
Because putative de novo variants are often false positives
with low sequence quality, we saw an enrichment of de
novo variants with low-quality scores compared with vari-
ants annotated in the Single Nucleotide Polymorphism
database (dbSNP; Figure 5A). A stringent quality threshold
was used to filter de novo variants (see the Experimental
Procedures). The performance of quality control (QC)
filtering was assessed using two methods: (1) measuring
genome-wide genotype concordance between matched
fibroblast and lymphoblast genomes and (2) Sanger
sequence validation of randomly selected variants.
Genome-wide genotype concordance between the fibro-
blast and lymphoblast genomes after QC filtering was
>98.45% (data not shown), and Sanger sequencing
confirmed 85% of the called variants (Table S3).
Nonsynonymous sequence variants identified by WGS
of each iPSC line were analyzed to identify high-confi-
dence de novo mutations (Table S4). To distinguish de
novo nonsynonymous coding mutations from those in-
herited from small populations of parental fibroblasts, we
excluded iPSC linemutations present in thematched fibro-
blast and/or lymphoblast sequences. This effectively
excluded 98.6%–99.5% of nonsynonymous variants.
Because the iPSCs in this study were generated from related
individuals, we further refined our analysis by excluding
mutations present in iPSCs, fibroblast, and/or lymphoblast
sequences of other related individuals. This additional
layer of filtering allows for improved specificity in deter-
mining whether a variant is a true or false positive call
(Gore et al., 2011; Ji et al., 2012; Ruiz et al., 2013). It also
reduces the chance of mistakenly categorizing a false-nega-
tive variant in the parental fibroblasts as de novo in the
Stem Cell
iPSCs. Because de novo mutations are not likely to appear
in public databases such as the 1000 Genomes Project and
the NHLBI Exome Variant Server, we removed all putative
de novo mutations that appeared in these databases.
Finally, because de novo mutations are unlikely to occur
in more than one iPSC line (unless of course they are
selected for biological reasons), we compared de novo
mutations between iPSC lines and excluded mutations
present in more than one cell line. As expected, we
observed a decrease in the median quality score of variants
throughout out analysis (Figure S4). Sequence analysis
identified on average 10.7 nonsynonymous de novomuta-
tions per iPSC line, ranging from no mutations to 21
mutations (Table S5), not including the iPSC line
iPS.IV.3.2, which had a uniquely �12-fold higher number
of de novo nonsynonymous mutations. Pathway analysis
failed to identify any specific enrichment for de novo non-
synonymous mutations regardless of BRCA1 mutation
status (data not shown), suggesting a random distribution
of de novo mutations throughout the genome. Consistent
with this, the frequency of de novo nonsynonymous
mutations was significantly correlated with the frequency
of genome-wide de novo mutations for both SNPs and
insertion/deletions (r = 0.79, p = 0.00003787) and SNPs
alone (r = 0.82; p = 0.0000164).
Since heterozygosity for BRCA1 mutations has been re-
ported to result in genomic instability (Konishi et al.,
2011), we expected to observe an increased frequency of
de novo mutations in the BRCA1 mutant iPSCs compared
with wild-type iPSCs. We compared the number of nonsy-
nonymous de novo mutations in BRCA1 wild-type (n = 9)
versus mutant (n = 11) iPSC lines to determine whether
iPSC lines heterozygous for the BRCA1 5382insC mutation
had an increased frequency of mutations. No statistically
significant difference was observed in the number of de
novo nonsynonymous SNPs and insertions/deletions (p =
0.08053) or SNPs alone (p = 0.06208; Figure 5B; Table S5).
Likewise, the number of genome-wide de novo SNPs and
indels or SNPs alone was not significantly different
between the BRCA1wild-type andmutant iPSC lines (Table
S6). From these data, we conclude that although de novo
mutations do occur during the reprogramming of fibro-
blasts into iPSCs with mRNA transfection technology
(Warren et al., 2010), BRCA1 haploinsufficiency does not
significantly increase mutation frequency in coding or
noncoding regions of the iPSC genome.
One iPSC line (iPS.IV.3.2) displayed all of the normal
morphological characteristics and differentiation capabil-
ities assayed in our screen for normal iPSC lines, but
acquired�12 times as many de novomutations as all other
iPSC lines (Tables S5 and S6). Although the cause of this
genomic instability is not known, a de novo nonsense
mutation in PALB2 (Q1004X) was identified by WGS and
Reports j Vol. 1 j 336–349 j October 15, 2013 j ª2013 The Authors 343

Figure 5. Whole-Genome Sequence Analysis of iPSC Lines(A) Distribution of quality scores for genome-wide SNPs annotated in the dbSNP database (black) compared with de novo SNPs (yellow).The y axis ‘‘proportion’’ is the frequency of all identified variants (numerical distribution). Each line represents a single genome’s
(legend continued on next page)
344 Stem Cell Reports j Vol. 1 j 336–349 j October 15, 2013 j ª2013 The Authors
Stem Cell ReportsBRCA1 Mutant Induced Pluripotent Stem Cells
Stem Cell ReportsBRCA1 Mutant Induced Pluripotent Stem Cells
confirmed by Sanger sequencing. PALB2 binds to the
coiled-coil domain of BRCA1 and collaborates with
BRCA1 in homologous recombination DNA repair
(Sy et al., 2009). Additionally, germline PALB2 mutations
have been implicated in familial pancreatic cancer syn-
dromes (Jones et al., 2009). It remains possible that muta-
tions in both BRCA1 and PALB2 lead to increased genome
instability. In addition to an increased frequency of de
novo mutations, iPS.IV.3.2 had de novo structural abnor-
malities. WGS coverage analysis suggested copy-number
variation of chromosome 20, including loss and gain of
copy number of the entire short (p-arm) and long (q-arm)
arms, respectively. LOH analysis confirmed de novo LOH
for chromosome 20p (Figure 5C). Consistent with this,
expression analysis showed expected changes in gene
expression based on the copy-number variations of genes
on the p-arm of chromosome 20 compared with other
iPSC lines from patient IV.3 (Figure 5D).
DISCUSSION
We report the generation of a series of iPSC lines from indi-
viduals with the BRCA1 5382insC mutation, which is a
well-known predictor of high risk for breast and ovarian
cancer (Futreal et al., 1994). Generation of iPSCs from indi-
viduals with BRCA1 mutations provides an opportunity to
examine why cancer develops more frequently in these pa-
tients. In this study, it was easier to reprogram the mutant
fibroblasts than the fibroblasts from relatives without the
BRCA1 mutation. Determining whether this difference is
due to the mutation itself or simply to line-to-line varia-
tions due to other characteristics (e.g., growth characteris-
tics and handling) will require the generation of iPSCs
from additional families and/or heterozygous mice with
BRCA1 mutations. Our data contrast with those obtained
by Gonzalez et al. (2013) from mouse embryonic fibro-
blasts (MEFs), in which homozygous mutations of Brca1
led to reprogramming defects. Those authors did not
distribution (iPSC, fibroblast, or lymphoblast line). De novo variants a(blue line) was used to exclude potential false-positive sequencing e(B) Frequency of de novo nonsynonymous mutations in iPSC lines withde novo nonsynonymous mutations was observed between WT (n = 9excluded from this analysis. ‘‘All’’ mutations include SNPs and indels (lethat represent the numbers of de novo variants identified per cell linebetween mutant and WT using Student’s unpaired t test. No significantonly,’’ respectively).(C) De novo LOH of chromosome 20p in iPS.IV.3.2 (upper panel) as dsegmented window. No LOH was detected in the matched fibroblast s(D) Copy-number variation in chromosome 20p of iPS.IV.3.2 was coHeatmaps show the fold change in expression in iPS.IV.3.1, iPS.IV.3.2iPSC lines. Red, <0.5-fold; green, >2.0-fold.See also Figure S5, Table S3, and Tables S4–S6.
Stem Cell
include MEFs from heterozygous Brca1 mutant embryos,
and the human BRCA1 mutations we used are different
from the mouse Brca1 mutations used in their study.
Finally, the parental fibroblasts in the mouse experiments
were embryonic, whereas our fibroblasts were adult. The re-
programming experiments in mice with the BRCA1
5382insC mutation reported here, and TALEN-mediated
targeting of the remaining human wild-type BRCA1 allele
in the heterozygous iPSC or fibroblast lines generated in
this study will begin to address these differences.
We observed that mutant and wild-type BRCA1 alleles
were expressed at equivalent levels in fibroblasts and their
derivative iPSCs and teratomas. There was also a specific
upregulation of PKC-theta in the BRCA1 5382insC iPSCs
compared with the wild-type iPSCs. A functional relation-
ship between BRCA1 and PKC-theta levels may involve
the known interaction of BRCA1with theHDAC2 complex
(Chang et al., 2011) or the role of BRCA1 as a transcription
factor (Haile and Parvin, 1999; Horwitz et al., 2006; Schle-
gel et al., 2000).
A related finding in this report is that PKC-theta is over-
expressed in some breast tumors. PKC-theta has been
found to be a reliable marker of GISTs (Blay et al., 2004;
Motegi et al., 2005; Ou et al., 2008), and prior reports
have suggested that PKC activity, although not specifically
PKC-theta activity, is upregulated in a subset of breast can-
cers (Gordge et al., 1996; O’Brian et al., 1989). We found
PKC-theta to be upregulated in a fraction of breast tumors
that are frequently hormone-receptor negative, a charac-
teristic of BRCA1 mutant tumors. Because of the tumori-
genic potential of PKC-theta, these results suggest that
lower levels of PKC-theta in the presence of wild-type
BRCA1 may be a mechanism for the tumor-suppressor
function of BRCA1. In fact, Belguise et al. determined
that PKC-theta is elevated in ER-negative human breast
cancer cell lines (Belguise et al., 2012) and NF-kappaB-
induced mouse breast tumors (Belguise and Sonenshein,
2007). They showed that PKC-theta inhibits ER expression.
The MDA-436 BRCA1 mutant cell line, which expresses
re generally called with low quality. A quality score threshold of 100rrors called at low quality.WT and mutant BRCA1. No significant difference in the frequency of) and mutant (n = 11) BRCA1 iPSC lines. The iPS.IV.3.2 outlier wasft-hand side) and ‘‘SNPs only’’ (right-hand side) are displayed as bars. We calculated p values to detect differences in mutation frequencydifferences were identified (p < 0.08 and p < 0.06 for ‘‘All’’ and ‘‘SNPs
etermined from the average heterozygosity of SNPs using a 20 KBample (lower panel).nfirmed by transcriptional profiling of genes on this chromosome., and iPS.IV.3.3 versus the average expression level in the other 21
Reports j Vol. 1 j 336–349 j October 15, 2013 j ª2013 The Authors 345

Stem Cell ReportsBRCA1 Mutant Induced Pluripotent Stem Cells
PKC-theta at levels higher than any of the other ER-nega-
tive breast cancer lines tested in their report, was the only
BRCA1 mutant cell line they analyzed (Belguise et al.,
2012). However, all of the ER-negative lines that were
found to have high PKC-theta have been reported to be
haploinsufficient for BRCA1 (Elstrodt et al., 2006). Upregu-
lation of PKC-theta in our BRCA1 mutant iPSCs may be
direct or indirect. If BRCA1 is directly upstream of PKC-
theta, this would explain why BRCA1 mutant breast can-
cers are frequently ER negative (Hosey et al., 2007).
Although our work with BRCA1 mutant iPSCs led to our
investigation of PKC-theta upregulation in human breast
tumors, future studies will be necessary to validate whether
PKC-theta can be used as a biomarker or therapeutic target
in BRCA1mutant tumors. Because the frequency of BRCA1
mutations in patients with breast cancer is only 5%–10%,
but we found PKC-theta to be elevated in greater than
half of the breast tumors in this study, the PKC-theta
upregulation must occur in some tumors without BRCA1
mutations. PKC-theta elevation does support the consider-
ation of this protein as a new drug target, with potential
applications in patients with BRCA1 mutations (Figure 4E;
Table S1).
Through our use of WGS, we increased the depth of our
characterization of iPSCs to include not just cellular but
also genetic changes that occur during the reprogramming
process in BRCA1mutant cells. It has been reported that re-
programming of differentiated cells to a pluripotent state
results in an estimated 6 protein-coding point mutations
per exome (Gore et al., 2011). By comparing the WGS of
iPSCs generated in this study with not only their fibroblast
progenitors but also the fibroblasts of related individuals,
we increased the ability to remove mutations that are not
de novo but instead are inherited from the fibroblast pro-
genitors. To our surprise, the WGS approach identified
only slightly higher numbers of de novo nonsynonymous
mutations than Gore et al., although the small difference
can be attributed to the difficulty of calling high-confi-
dence insertion/deletion mutations using hybridization
capture/sequencing methods (Gore et al., 2011). If we
consider only SNP mutations, our results (average 6.7 non-
synonymous de novo SNPs per iPSC line) are consistent
with previous reports (Gore et al., 2011). To our further
surprise, through this analysis we did not find a statistically
significant difference in the number of de novo nonsynon-
ymous mutations in BRCA1 wild-type versus mutant iPSC
lines. This contrasts with the prior report that the human
BRCA1 heterozygous state is genetically unstable (Konishi
et al., 2011). It is intriguing to speculate about why our
result differs from theirs. Konishi et al. analyzed genome
stability in breast epithelial cells, which are known to be
susceptible to BRCA1 mutant tumorigenesis. Because our
genome analyses were conducted in stem cells, it will be
346 Stem Cell Reports j Vol. 1 j 336–349 j October 15, 2013 j ª2013 The A
important to analyze the genomes of their derivative
epithelial cells. One exception to the surprising lack of
genome instability in BRCA1 mutant iPSC lines was the
mutant iPSC line iPS.IV.3.2, which harbored >10-fold
more de novo mutations than the other iPSC lines.
Although this resulted in significant differences in the
gene-expression profiles, we could not readily identify a
functional consequence of this genomic instability using
standard iPSC characterization techniques. This indicates
that WGS of iPSC lines prior to biological study is
warranted.
In conclusion, we have generated and characterized
patient-derived iPSC lines with a BRCA1 mutation and
identified a correlation between BRCA1 mutations and
PKC-theta expression. Similar analyses of other mutant
iPSC lines may lead to the discovery of other molecular
consequences that result from specific mutations associ-
ated with BRCA1. These data should encourage others to
generate iPSC lines from families with mutations that
confer a high cancer risk.
EXPERIMENTAL PROCEDURES
Generation and Characterization of Human iPSCsPrimary fibroblasts were established from skin biopsies taken from
wild-type andBRCA1 5382insCheterozygousmutant familymem-
bers shown in Figure 1A and Table 1 after informed consent and
with institutional review board approval. Skin-punch (forearm)
biopsies were cultured in six-well plates at 37�C in 5% CO2 in
1 ml Dulbecco’s modified Eagle’s medium (DMEM) with 10% fetal
bovine serum, penicillin, and streptomycin until fibroblasts
migrated out from the skin explants. The iPSCs were generated
by nonintegrative mRNA-based reprogramming using a cocktail
of mRNAs (and in some cases miRNAs) for OCT4, SOX2, KLF4,
LIN28, and c-MYC as previously described (Anokye-Danso et al.,
2011; Miyoshi et al., 2011; Warren et al., 2010). All 24 cell lines
are available for research purposes.
In Vitro and In Vivo Differentiation into TeratomasiPSCs were subjected to directed differentiation in vitro as previ-
ously described (Chambers et al., 2009; D’Amour et al., 2005,
2006). For the teratoma formation assays, iPSCs (approximately
1–23 106 cells) were injected into the kidney capsules of immuno-
deficient NOD/SCID mice. Teratomas were harvested 10–16 weeks
later. A small portion from each teratoma was extracted for RNA
analysis and the rest was fixed in PBS containing 4%paraformalde-
hyde for histology.
mRNA Expression Profiling in Fibroblasts and iPSCsFor gene-expression analysis in primary fibroblasts and
iPSC lines, labeled complementary RNA was hybridized to an
HT-12v4 BeadChip (Illumina). Data analysis was performed
via fold-change analysis of relative signal intensities followed
by Student’s paired t test. A p value < 0.05 was considered
significant.
uthors
Stem Cell ReportsBRCA1 Mutant Induced Pluripotent Stem Cells
RNA Isolation and qPCR Analysis of Gene ExpressionRNA was purified with Trizol (Invitrogen) and treated with
DNAase (QIAGEN) to remove genomic DNA contamination.
One microgram of total RNAwas used for the reverse transcriptase
reaction using Script III (Invitrogen) and randomhexamer primers
according to manufacturer’s instructions. qPCR was performed us-
ing the StepOnePlus Real-Time PCR system (Applied Biosystems)
with the Taqman gene-expression master mix. Mismatched
primer sequences for BRCA1 gene analysis are described in Fig-
ure S1. Standard Taqman primers for PRKCQ were purchased
from Invitrogen.
ImmunohistochemistryTissue microarrays (IMH-364 and IMH-371) of breast cancers and
normal adjacent tissues were purchased from Imgenex and sub-
jected to staining with anti-PKC-theta antibody (mAb 27; BD
Bioscience) as previously described (Motegi et al., 2005). Scoring
was performed by two scorers (D.R. and T.S.R.) using intensity
scores of 1–3 (1, weak staining; 2, intermediate staining; 3, strong
staining).
Western Blot AnalysisThe iPSCs were homogenized in 13 RIPA buffer (Cell Signaling
Technology) containing 1 mM phenylmethylsulfonyl fluoride,
centrifuged at 10,000 rpm for 15 min at 4�C, and protein quanti-
tated (DC assay; BioRad). Eighty micrograms of total protein was
resolved on SDS-PAGE, transferred to nitrocellulose, and blotted
for PKC-theta (mAb 27; BD Biosciences), a-tubulin, anti-HIP1
4B10 monoclonal, and BRCA1 monoclonal (Abcam).
WGS and De Novo Mutation IdentificationWGS using the combinatorial probe-anchor ligation method
was performed by Complete Genomics as previously described
(Drmanac et al., 2010). WGS of all iPSC lines, fibroblasts, and
lymphoblasts generated sufficient coverage for variant calling
and copy-number analysis, both performed by Complete Geno-
mics. QC was performed by excluding iPS variants if (1) the
variant position was ‘‘no-called’’ in two or more samples (to re-
move genomic regions that would be difficult to assemble using
short-read technology) or (2) the variant quality score was <100.
QC was confirmed by measuring concordance between matched
fibroblast and lymphoblast samples (>98.45) and direct Sanger
sequencing of randomly selected mutations (85% confirmed).
Nonsynonymous iPSC variants passing the QC filters were
analyzed to identify de novo mutations by excluding (1) variants
in the fibroblast or lymphoblast of sample-matched or related
family members, (2) variants annotated in the Exome Variant
Server containing �6,500 exomes or the 1000 Genomes database,
or (3) variants present in any of 54 samples sequenced by Com-
plete Genomics or whole-exome sequenced using the Illumina
platform (Table S3). Finally, similarly to previous reports (Gore
et al., 2011), only variants present in single iPSC lines were
considered de novo.
LOH analysis of SNPs passing the QC filters was performed on
iPS.IV.3.2 and the matched fibroblast (Fb.IV.3). Average heterozy-
gositywas calculated using a 20 KB segmentedwindow andplotted
along the entire chromosome 20.
Stem Cell
Confirmation of De Novo Mutations by Sanger
SequencingFor each iPSC line, a subset of the putative de novo mutations was
selected for confirmation by Sanger sequencing. DNA was ex-
tracted from iPSC and fibroblast cell lines by standard procedures.
Primerswere designedusing Primer Express 3.0 software to amplify
the genomic region in which each mutation was located. The
cycling conditions were as follows: 4 min at 94�C, 40 cycles of
1 min at 94�C, 30 s at the appropriate annealing temperature for
each primer (49–54�C), 1 min at 72�C, and 72�C for 5 min. PCR
products were resolved on a 1%–2% agarose gel. PCR products
were purified using the QiaQuick Gel Extraction Kit (QIAGEN)
and sequenced.
SUPPLEMENTAL INFORMATION
Supplemental Information includes five figures and six tables and
can be found with this article online at http://dx.doi.org/10.1016/
j.stemcr.2013.08.004.
ACKNOWLEDGMENTS
We are grateful to members of the anonymous family for their
generous participation as research subjects and to Ms. Katie
Wood and Drs. Victoria Mgbemena, Sean Morrison, Guangwen
Wang, and Anj Dlugosz for intellectual and technical contribu-
tions. This work was funded in part by the Burroughs Wellcome
Fund (Clinical Scientist Award to T.S.R.) and the National Cancer
Institute (R01 CA82363-03 and R01 CA098730-01 to T.S.R.).
T.S.R. holds the Jeanne Ann Plitt Professorship in Breast Cancer
Research and the H. Ben and Isabelle T. Decherd Chair in Internal
Medicine at UT Southwestern Medical Center.
Received: June 20, 2013
Revised: August 14, 2013
Accepted: August 15, 2013
Published: October 3, 2013
REFERENCES
Anokye-Danso, F., Trivedi, C.M., Juhr, D., Gupta, M., Cui, Z., Tian,
Y., Zhang, Y., Yang,W., Gruber, P.J., Epstein, J.A., andMorrisey, E.E.
(2011). Highly efficient miRNA-mediated reprogramming of
mouse and human somatic cells to pluripotency. Cell Stem Cell
8, 376–388.
Baer, R., and Ludwig, T. (2002). The BRCA1/BARD1 heterodimer, a
tumor suppressor complex with ubiquitin E3 ligase activity. Curr.
Opin. Genet. Dev. 12, 86–91.
Belguise, K., and Sonenshein, G.E. (2007). PKCtheta promotes
c-Rel-driven mammary tumorigenesis in mice and humans by re-
pressing estrogen receptor alpha synthesis. J. Clin. Invest. 117,
4009–4021.
Belguise, K., Milord, S., Galtier, F., Moquet-Torcy, G., Piechaczyk,
M., and Chalbos, D. (2012). The PKCq pathway participates in
the aberrant accumulation of Fra-1 protein in invasive ER-negative
breast cancer cells. Oncogene 31, 4889–4897.
Blay, P., Astudillo, A., Buesa, J.M., Campo, E., Abad,M., Garcıa-Gar-
cıa, J., Miquel, R., Marco, V., Sierra, M., Losa, R., et al. (2004).
Reports j Vol. 1 j 336–349 j October 15, 2013 j ª2013 The Authors 347
Stem Cell ReportsBRCA1 Mutant Induced Pluripotent Stem Cells
Protein kinase C theta is highly expressed in gastrointestinal stro-
mal tumors but not in other mesenchymal neoplasias. Clin.
Cancer Res. 10, 4089–4095.
Chambers, S.M., Fasano, C.A., Papapetrou, E.P., Tomishima, M.,
Sadelain, M., and Studer, L. (2009). Highly efficient neural conver-
sion of human ES and iPS cells by dual inhibition of SMAD
signaling. Nat. Biotechnol. 27, 275–280.
Chang, S., Wang, R.H., Akagi, K., Kim, K.A., Martin, B.K., Caval-
lone, L., Haines, D.C., Basik, M., Mai, P., Poggi, E., et al.; Kathleen
Cuningham Foundation Consortium for Research into Familial
Breast Cancer (kConFab). (2011). Tumor suppressor BRCA1 epige-
netically controls oncogenic microRNA-155. Nat. Med. 17, 1275–
1282.
D’Amour, K.A., Agulnick, A.D., Eliazer, S., Kelly, O.G., Kroon, E.,
and Baetge, E.E. (2005). Efficient differentiation of human embry-
onic stem cells to definitive endoderm. Nat. Biotechnol. 23, 1534–
1541.
D’Amour, K.A., Bang, A.G., Eliazer, S., Kelly, O.G., Agulnick, A.D.,
Smart, N.G., Moorman, M.A., Kroon, E., Carpenter, M.K., and
Baetge, E.E. (2006). Production of pancreatic hormone-expressing
endocrine cells from human embryonic stem cells. Nat.
Biotechnol. 24, 1392–1401.
Drmanac, R., Sparks, A.B., Callow, M.J., Halpern, A.L., Burns, N.L.,
Kermani, B.G., Carnevali, P., Nazarenko, I., Nilsen, G.B., Yeung, G.,
et al. (2010). Human genome sequencing using unchained base
reads on self-assembling DNA nanoarrays. Science 327, 78–81.
Drost, R.M., and Jonkers, J. (2009). Preclinical mouse models for
BRCA1-associated breast cancer. Br. J. Cancer 101, 1651–1657.
Drost, R., Bouwman, P., Rottenberg, S., Boon, U., Schut, E., Klaren-
beek, S., Klijn, C., van der Heijden, I., van der Gulden, H., Wient-
jens, E., et al. (2011). BRCA1 RING function is essential for tumor
suppression but dispensable for therapy resistance. Cancer Cell 20,
797–809.
Elstrodt, F., Hollestelle, A., Nagel, J.H., Gorin, M., Wasielewski, M.,
van den Ouweland, A., Merajver, S.D., Ethier, S.P., and Schutte, M.
(2006). BRCA1 mutation analysis of 41 human breast cancer cell
lines reveals three new deleteriousmutants. Cancer Res. 66, 41–45.
Evers, B., and Jonkers, J. (2006). Mouse models of BRCA1 and
BRCA2 deficiency: past lessons, current understanding and future
prospects. Oncogene 25, 5885–5897.
Futreal, P.A., Liu, Q., Shattuck-Eidens, D., Cochran, C., Harshman,
K., Tavtigian, S., Bennett, L.M., Haugen-Strano, A., Swensen, J.,
Miki, Y., et al. (1994). BRCA1 mutations in primary breast and
ovarian carcinomas. Science 266, 120–122.
Gonzalez, F., Georgieva, D., Vanoli, F., Shi, Z.D., Stadtfeld, M., Lud-
wig, T., Jasin, M., and Huangfu, D. (2013). Homologous recombi-
nation DNA repair genes play a critical role in reprogramming to
a pluripotent state. Cell Rep. 3, 651–660.
Gordge, P.C., Hulme, M.J., Clegg, R.A., and Miller, W.R. (1996).
Elevation of protein kinase A and protein kinase C activities in
malignant as compared with normal human breast tissue. Eur. J.
Cancer 32A, 2120–2126.
Gore, A., Li, Z., Fung, H.L., Young, J.E., Agarwal, S., Antosiewicz-
Bourget, J., Canto, I., Giorgetti, A., Israel, M.A., Kiskinis, E., et al.
348 Stem Cell Reports j Vol. 1 j 336–349 j October 15, 2013 j ª2013 The A
(2011). Somatic coding mutations in human induced pluripotent
stem cells. Nature 471, 63–67.
Griner, E.M., and Kazanietz, M.G. (2007). Protein kinase C
and other diacylglycerol effectors in cancer. Nat. Rev. Cancer 7,
281–294.
Haile, D.T., and Parvin, J.D. (1999). Activation of transcription
in vitro by the BRCA1 carboxyl-terminal domain. J. Biol. Chem.
274, 2113–2117.
Hong, H., Takahashi, K., Ichisaka, T., Aoi, T., Kanagawa, O., Naka-
gawa, M., Okita, K., and Yamanaka, S. (2009). Suppression of
induced pluripotent stem cell generation by the p53-p21 pathway.
Nature 460, 1132–1135.
Horwitz, A.A., Sankaran, S., and Parvin, J.D. (2006). Direct stimula-
tion of transcription initiation by BRCA1 requires both its amino
and carboxyl termini. J. Biol. Chem. 281, 8317–8320.
Hosey, A.M., Gorski, J.J., Murray, M.M., Quinn, J.E., Chung, W.Y.,
Stewart, G.E., James, C.R., Farragher, S.M., Mulligan, J.M., Scott,
A.N., et al. (2007). Molecular basis for estrogen receptor alpha defi-
ciency in BRCA1-linked breast cancer. J. Natl. Cancer Inst. 99,
1683–1694.
Isakov, N., and Altman, A. (2012). PKC-theta-mediated signal
delivery from the TCR/CD28 surface receptors. Front. Immunol.
3, 273.
Ji, J., Ng, S.H., Sharma, V., Neculai, D., Hussein, S., Sam, M., Trinh,
Q., Church, G.M., McPherson, J.D., Nagy, A., and Batada, N.N.
(2012). Elevated coding mutation rate during the reprogramming
of human somatic cells into induced pluripotent stem cells. Stem
Cells 30, 435–440.
Jones, S., Hruban, R.H., Kamiyama, M., Borges, M., Zhang, X., Par-
sons, D.W., Lin, J.C., Palmisano, E., Brune, K., Jaffee, E.M., et al.
(2009). Exomic sequencing identifies PALB2 as a pancreatic cancer
susceptibility gene. Science 324, 217.
Kleiman, F.E., Wu-Baer, F., Fonseca, D., Kaneko, S., Baer, R., and
Manley, J.L. (2005). BRCA1/BARD1 inhibition ofmRNA 30 process-ing involves targeted degradation of RNA polymerase II. Genes
Dev. 19, 1227–1237.
Konishi, H., Mohseni, M., Tamaki, A., Garay, J.P., Croessmann, S.,
Karnan, S., Ota, A., Wong, H.Y., Konishi, Y., Karakas, B., et al.
(2011). Mutation of a single allele of the cancer susceptibility
gene BRCA1 leads to genomic instability in human breast epithe-
lial cells. Proc. Natl. Acad. Sci. USA 108, 17773–17778.
Lancaster, J.M., Wooster, R., Mangion, J., Phelan, C.M., Cochran,
C., Gumbs, C., Seal, S., Barfoot, R., Collins, N., Bignell, G., et al.
(1996). BRCA2 mutations in primary breast and ovarian cancers.
Nat. Genet. 13, 238–240.
Lim, E., Vaillant, F., Wu, D., Forrest, N.C., Pal, B., Hart, A.H., Asse-
lin-Labat, M.L., Gyorki, D.E., Ward, T., Partanen, A., et al.; kCon-
Fab. (2009). Aberrant luminal progenitors as the candidate target
population for basal tumor development in BRCA1 mutation
carriers. Nat. Med. 15, 907–913.
McPherson, J.P., Lemmers, B., Hirao, A., Hakem, A., Abraham, J.,
Migon, E., Matysiak-Zablocki, E., Tamblyn, L., Sanchez-Sweatman,
O., Khokha, R., et al. (2004). Collaboration of Brca1 and Chk2 in
tumorigenesis. Genes Dev. 18, 1144–1153.
uthors
Stem Cell ReportsBRCA1 Mutant Induced Pluripotent Stem Cells
Miki, Y., Swensen, J., Shattuck-Eidens, D., Futreal, P.A., Harshman,
K., Tavtigian, S., Liu, Q., Cochran, C., Bennett, L.M., Ding,W., et al.
(1994). A strong candidate for the breast and ovarian cancer sus-
ceptibility gene BRCA1. Science 266, 66–71.
Miyoshi, N., Ishii, H., Nagano, H., Haraguchi, N., Dewi, D.L., Kano,
Y., Nishikawa, S., Tanemura, M., Mimori, K., Tanaka, F., et al.
(2011). Reprogramming ofmouse andhuman cells to pluripotency
using mature microRNAs. Cell Stem Cell 8, 633–638.
Momcilovic, O., Knobloch, L., Fornsaglio, J., Varum, S., Easley, C.,
and Schatten, G. (2010). DNA damage responses in human
induced pluripotent stem cells and embryonic stem cells. PLoS
ONE 5, e13410.
Motegi, A., Sakurai, S., Nakayama, H., Sano, T., Oyama, T., and
Nakajima, T. (2005). PKC theta, a novel immunohistochemical
marker for gastrointestinal stromal tumors (GIST), especially useful
for identifying KIT-negative tumors. Pathol. Int. 55, 106–112.
O’Brian, C., Vogel, V.G., Singletary, S.E., and Ward, N.E. (1989).
Elevated protein kinase C expression in human breast tumor
biopsies relative to normal breast tissue. Cancer Res. 49, 3215–
3217.
Ou, W.B., Zhu, M.J., Demetri, G.D., Fletcher, C.D., and Fletcher,
J.A. (2008). Protein kinase C-theta regulates KIT expression and
proliferation in gastrointestinal stromal tumors. Oncogene 27,
5624–5634.
Petrucelli, N., Daly, M.B., and Feldman, G.L. (2010). Hereditary
breast and ovarian cancer due to mutations in BRCA1 and
BRCA2. Genet. Med. 12, 245–259.
Riggs, J.W., Barrilleaux, B., Varlakhanova, N., Bush, K., Chan, V.,
and Knoepfler, P. (2013). Induced pluripotency and oncogenic
transformation are related processes. Stem Cells Dev. 22, 37–50.
Risch,H.A.,McLaughlin, J.R., Cole, D.E., Rosen, B., Bradley, L., Fan,
I., Tang, J., Li, S., Zhang, S., Shaw, P.A., andNarod, S.A. (2006). Pop-
ulation BRCA1 and BRCA2 mutation frequencies and cancer pen-
etrances: a kin-cohort study in Ontario, Canada. J. Natl. Cancer
Inst. 98, 1694–1706.
Stem Cell
Ross, T.S. (2012). Grace Rock’s consent. Endocr. Relat. Cancer 19,
C29–C31.
Ruiz, S., Gore, A., Li, Z., Panopoulos, A.D., Montserrat, N., Fung,
H.L., Giorgetti, A., Bilic, J., Batchelder, E.M., Zaehres, H., et al.
(2013). Analysis of protein-coding mutations in hiPSCs and their
possible role during somatic cell reprogramming. Nat. Commun.
4, 1382.
Schlegel, B.P., Green, V.J., Ladias, J.A., and Parvin, J.D. (2000).
BRCA1 interaction with RNA polymerase II reveals a role for
hRPB2 and hRPB10alpha in activated transcription. Proc. Natl.
Acad. Sci. USA 97, 3148–3153.
Shakya, R., Reid, L.J., Reczek, C.R., Cole, F., Egli, D., Lin, C.S., deR-
ooij, D.G., Hirsch, S., Ravi, K., Hicks, J.B., et al. (2011). BRCA1
tumor suppression depends on BRCT phosphoprotein binding,
but not its E3 ligase activity. Science 334, 525–528.
Sy, S.M., Huen, M.S., and Chen, J. (2009). PALB2 is an integral
component of the BRCA complex required for homologous recom-
bination repair. Proc. Natl. Acad. Sci. USA 106, 7155–7160.
Takahashi, K., Tanabe, K., Ohnuki, M., Narita, M., Ichisaka, T.,
Tomoda, K., and Yamanaka, S. (2007). Induction of pluripotent
stem cells from adult human fibroblasts by defined factors. Cell
131, 861–872.
Turner, N., Tutt, A., and Ashworth, A. (2004). Hallmarks of ‘BRCA-
ness’ in sporadic cancers. Nat. Rev. Cancer 4, 814–819.
Warren, L., Manos, P.D., Ahfeldt, T., Loh, Y.H., Li, H., Lau, F., Ebina,
W., Mandal, P.K., Smith, Z.D., Meissner, A., et al. (2010). Highly
efficient reprogramming to pluripotency and directed differentia-
tion of human cells with synthetic modified mRNA. Cell Stem
Cell 7, 618–630.
Wong, N.A., and Shelley-Fraser, G. (2010). Specificity of DOG1 (K9
clone) and protein kinaseC theta (clone 27) as immunohistochem-
ical markers of gastrointestinal stromal tumour. Histopathology
57, 250–258.
Reports j Vol. 1 j 336–349 j October 15, 2013 j ª2013 The Authors 349