Integrating omics into the cardiac differentiation of human pluripotent stem cells
Upload
independentCategory
view
1download
0
Identification of Cisplatin-Regulated Metabolic Pathwaysin Pluripotent Stem CellsLouise von Stechow1,3., Ainhoa Ruiz-Aracama2,3., Bob van de Water1, Ad Peijnenburg2, Erik Danen1*,
Arjen Lommen2*
1Department of Toxicology, LACDR, Leiden University, Leiden, The Netherlands, 2 RIKILT - Institute of Food Safety, Wageningen, The Netherlands, 3Netherlands
Toxicogenomics Center, Maastricht, The Netherlands
Abstract
The chemotherapeutic compound, cisplatin causes various kinds of DNA lesions but also triggers other pertubations, suchas ER and oxidative stress. We and others have shown that treatment of pluripotent stem cells with cisplatin causes aplethora of transcriptional and post-translational alterations that, to a major extent, point to DNA damage response (DDR)signaling. The orchestrated DDR signaling network is important to arrest the cell cycle and repair the lesions or, in case ofdamage beyond repair, eliminate affected cells. Failure to properly balance the various aspects of the DDR in stem cellscontributes to ageing and cancer. Here, we performed metabolic profiling by mass spectrometry of embryonic stem (ES)cells treated for different time periods with cisplatin. We then integrated metabolomics with transcriptomics analyses andconnected cisplatin-regulated metabolites with regulated metabolic enzymes to identify enriched metabolic pathways.These included nucleotide metabolism, urea cycle and arginine and proline metabolism. Silencing of identified prolinemetabolic and catabolic enzymes indicated that altered proline metabolism serves as an adaptive, rather than a toxicresponse. A group of enriched metabolic pathways clustered around the metabolite S-adenosylmethionine, which is a hubfor methylation and transsulfuration reactions and polyamine metabolism. Enzymes and metabolites with pro- or anti-oxidant functions were also enriched but enhanced levels of reactive oxygen species were not measured in cisplatin-treatedES cells. Lastly, a number of the differentially regulated metabolic enzymes were identified as target genes of thetranscription factor p53, pointing to p53-mediated alterations in metabolism in response to genotoxic stress. Altogether,our findings reveal interconnecting metabolic pathways that are responsive to cisplatin and may serve as signaling modulesin the DDR in pluripotent stem cells.
Citation: von Stechow L, Ruiz-Aracama A, van de Water B, Peijnenburg A, Danen E, et al. (2013) Identification of Cisplatin-Regulated Metabolic Pathways inPluripotent Stem Cells. PLoS ONE 8(10): e76476. doi:10.1371/journal.pone.0076476
Editor: Janine Santos, University of Medicine and Dentistry of New Jersey, United States of America
Received July 12, 2013; Accepted August 29, 2013; Published October 16, 2013
Copyright: � 2013 von Stechow et al. This is an open-access article distributed under the terms of the Creative Commons Attribution License, which permitsunrestricted use, distribution, and reproduction in any medium, provided the original author and source are credited.
Funding: This work was supported by the Netherlands Genomics Initiative/Netherlands Organization for Scientific Research (NWO): nr 050-060-510. The fundershad no role in study design, data collection and analysis, decision to publish, or preparation of the manuscript.
Competing Interests: The authors have declared that no competing interests exist.
* E-mail: [email protected] (AL); [email protected] (ED)
. These authors contributed equally to this work.
Introduction
Metabolic changes are associated with a number of complex
diseases, including cancer, diabetes and neurological disorders.
Often, changes in the abundance of small metabolites are linked to
changes in the expression or activity of metabolic enzymes or the
complete rewiring of metabolic pathways, as seen for cancer cells,
which frequently switch their energy production to aerobic
glycolysis (known as Warburg effect) and develop a glutamine
addiction [1,2,3]. Indeed, mutations in a number of metabolic
enzymes were recently related to inherited cancer syndromes [3].
This link between metabolism and disease suggests that metabo-
lomics may be used to identify biomarkers suitable for non-
invasive methods to determine disease state, treatment and toxic
responses [4].
Changes in metabolism may be linked to stress responses, such
as genotoxic stress. Irradiation or chemotherapeutic treatment
alters the abundance of metabolites, including for example
choline-containing compounds, lipids and several amino acids in
cancer cell lines [5,6]. Interestingly, metabolites excreted by
cancer-associated stromal cells can modulate chemosensitivity of
cancer cells in a paracrine manner [7]. Recently, the NCI60 panel
of tumor cells lines was used to correlate treatment response to
platinum drugs with baseline metabolic pathways extracted from
metabolomics and transcriptomics [8]. However, integrated
approaches aimed at unraveling perturbation of metabolic
pathways in response to therapy are currently lacking.
The ability of cells to recognize and respond to DNA damage is
of vital importance for the maintenance of an intact genome. The
DNA crosslinking drug cisplatin is used as common treatment for
various solid tumors, e.g. ovarian, non-small cell lung, head and
neck, bladder, colorectal and testicular cancer. Despite initial good
responses to therapy, patients often develop resistance to cisplatin
treatment and toxicity to healthy tissues (including neuro- and
renal as well as gastric toxicity) limits the therapeutic window [9].
Next to direct DNA damage, cisplatin also induces non-genotoxic
perturbations, such as oxidative stress by shifting the redox
balance through binding to nucleophilic molecules; and ER stress,
which has been shown to kill enucleated cells [10,11]. We have
unraveled cisplatin-responsive signaling networks in mouse
PLOS ONE | www.plosone.org 1 October 2013 | Volume 8 | Issue 10 | e76476
embryonic stem (ES) cells through integration of functional
genomics, phosphoproteomics, and transcriptomics [12,13]. These
studies point to a major role for DNA damage response (DDR)
signaling in determining the cellular outcome of cisplatin
treatment.
Cancer cells typically have disabled crucial DDR signaling
routes and often rewire metabolic pathways [3,14]. We decided to
make use of ES cells to study the DDR using systems wide analyses
[12,13]. These cells have an intact, effective DDR and show robust
DNA damage-induced apoptosis. At the same time, they have
several features that can be extrapolated to cancer cells, such as the
lack of G1/S checkpoint after DNA damage, expression of marker
genes (e.g. c-Myc), and a high proliferation rate [15,16]. In this
study, we combined metabolomics and transcriptomics analysis of
the response to cisplatin in ES cells. The aim was to integrate
affected metabolites with regulated metabolic enzymes in order to
delineate alterations in metabolic pathways in response to
genotoxic stress in pluripotent stem cells.
Materials and Methods
Cell Culture and MaterialsHM1 mouse ES cells derived from OLA/129 genetic
background (provided by Dr. Klaus Willecke, University of Bonn
GE) [17] were maintained under feeder free conditions in GMEM
medium containing 10% FBS, 56105 U mouse recombinant
leukemia inhibitory factor (LIF; PAA), 25 U/ml penicillin, and
25 mg/ml streptomycin. For metabolomics analysis and micro-
arrays ES cells were used at passage 22. Cells were confirmed to be
mycoplasma-free using the Mycosensor kit from Stratagene. The
DNA cross-linker cisplatin (cisplatin; Cis-PtCl2(NH3)2) was pro-
vided by the Pharmacy unit of University Hospital, Leiden NL.
Ammonium acetate (NH4Ac), sodium chloride (NaCl) and
deuterated chloroform (CDCl3) were obtained from Merck
(Darmstadt, Germany); methanol (MeOH) and acetone from
Biosolve (Valkenswaard, The Netherlands). All chemicals and
solvents were purchased in the highest purity available. Ultra-pure
water was obtained using the PureLab equipment from Rossmark
(Ede, The Netherlands).
Cell Viability, Apoptosis and Cell Cycle AnalysesTo monitor cisplatin-induced cell killing, a cell viability assay
using ATPlite 1 Step kit (Perkin Elmer) was performed according
to the manufacturer’s instructions followed by luminescence
measurement using a plate reader. For cell cycle and apoptosis
analysis cells were exposed to vehicle (PBS) or cisplatin for 8 h or
24 h. Floating and attached cells were pooled and fixed in 80%
ethanol overnight. Cells were stained using PBS EDTA containing
7.5 mM propidium iodine and 40 mg/ml RNAseA and measured
by flow cytometry (FACSCanto II; Becton Dickinson). The
number of cells in the different cell cycle fractions (and in sub
G0/G1 for apoptotic cells), as seen in Fig. S1 was calculated using
the BD FACSDiva software.
Metabolomics – Sample Preparation56106 passage 22 ES cells were plated in 75 cm flasks and
medium was replaced 24 h later with 5 mM cisplatin or vehicle
control (PBS). After 4 h or 8 h incubation, lysis and fractionation
were performed as described [18]. Cells were washed four times in
the flask with 10 ml of ice cold 0.9% saline (isotonic) to separate
the cells from the cell medium; this was followed by one 10 ml
wash using 1.2% ammonium acetate (volatile salt) to eliminate
possible excess of non-volatile salt in later sample concentration
steps. Lysis was acchieved by osmotic shock in 3 ml of ice-cold
pure water after which the flask was scraped; this was repeated 3
times (total volume 9 ml; ice-cold heavy dilution to stop enzyme
activity). Lysed cell suspensions were then ultrasonicly treated at
4uC to further ensure cell disruption and protein denaturation.
1 ml of 1 M ammonium acetate was then added to ensure good
pelleting of membranes during centrifugation (Hereaus, Labofuge
400 R; 4uC for 60 minutes at 3000 rpm). The membrane-free
supernatant containing polar and semi-polar metabolites (polar
fraction) was frozen at 280uC and then freeze-dried for 2–3 days.
The pellet containing the lipid fraction was used as the apolar
fraction. As a further precaution to have sterility, protein
denaturation and removal of protein before LC-MS analysis, the
polar fraction was resuspended in 1 ml of pure methanol, dried
under N2 and then redissolved/resuspended again in 1 ml of 50%
methanol/50% pure water. This was then centrifuged for 15
minutes at 4500 g at 4uC to remove any pellet. In a final
precipitation step in the supernatant remaining gelatin (used as
adhesive for ES cells in the flasks) was removed by adding 4 ml of
ice-cold acetone for 10 minutes and then repeating the centrifuge
step at 13000 g for 15 minutes at 4uC. The supernatant is then
dried overnight under a gentle N2-flow at room temperature after
which it was stored at 280uC until use. The apolar fraction was
resuspended in 1 M NH4Ac (these counter-ions ensure better
extraction), freeze-dried, extracted with CDCl3, and the organic
solvent was evaporated under N2 flow. The dried extract was
stored at 280uC until use. Five independent biological replicates
were examined in each experiment. Metabolomics analysis was
performed on the apolar fraction, containing the membranes and
intracellular lipids (1H-NMR), and the polar fraction containing
the polar and semi-polar intracellular metabolites (U-HPLC-
Orbitrap-MS). This procedure for sample preparation (extraction,
washing efficiency, etc) has been optimized and monitored by 1H-
NMR previously [18].
Metabolomics – MeasurementsPrior to 1H-NMR analysis the dried apolar samples were
dissolved in 1 ml of CDCl3. of which 0.6 ml of was actually used
for 1H-NMR analysis. The 1H-NMR spectra were recorded at
400.13 MHz at 300.0 (60.02) K on a Bruker Avance 400 narrow
bore using a 5.0-mm probe. The spectrometer settings were the
same as described previously [18].
The polar samples were analyzed by ultra-high performance
liquid chromatography (U-HPLC)-Orbitrap-MS. For this the
dried samples were dissolved in 2 ml of H2O; formic acid was
added to a final concentration of 0.1%. The injection sequence
was randomized as described [19]. U-HPLC was performed on a
U-HPLC Accela system (Thermo Fisher Scientific, San Jose, CA,
USA), with a 150 mm62.1 mm UPLC BEH-C18 column with
1.7 mm particles (Waters). Chromatographic conditions were as
described [18]. The U-HPLC was directly interfaced to a single
stage Orbitrap mass spectrometer (Exactive, Thermo Fisher
Scientific). Settings of the Orbitrap mass spectrometer are
provided (see Material S1). Data were recorded using Xcalibur
software version 2.1.0.1139 (Thermo Fisher Scientific). When
identification of mass peaks was needed, samples were subjected to
LC-nanomate-Orbitrap-MS analysis using chromatography con-
ditions as described above. These identification procedures are as
previously described [18]. The raw data obtained in this study are
available on request ([email protected]).
Metabolomics - Data AnalysisNMR data analysis of apolar samples. A method for
normalization of data using phospholipid signals in apolar samples
was accessed as previously described [18]. The NMR data were
The Metabolic Response to Cisplatin
PLOS ONE | www.plosone.org 2 October 2013 | Volume 8 | Issue 10 | e76476
pre-processed and aligned as described using a for Windows
updated version of in-house developed software [20]. Based on
equal phospholipid content, normalization of data was not
required (see Results section). Subsequently, the spreadsheet
containing aligned data of the apolar samples was subjected to
statistical analysis using Genemaths XT (http://www.applied-
maths.com/genemaths/genemaths.htm). Standard initial analysis
entailed performing a 2Log transformation and a principal
component analysis (PCA) (average of rows and columns
subtracted). This was followed by a 2Log transformation, a pre-
selection of variables using an ANOVA (p,0.01), followed by a
PCA (average of rows and columns subtracted). The grouping in
the ANOVA was on the replicates (n = 5) per treatment (control
and 5 mM cisplatin) for each timepoint (4 and 8 hours) creating 4
groups with 5 replicates or on the treatments, creating 2 groups of
10 replicates.
LC-MS data analysis of polar samples. U-HPLC-Orbi-
trap-MS data were pre-processed, mass corrected to sub-ppm
precision [20] and aligned using MetAlign (http://www.metalign.
nl) [21]. In short, this software performs a baseline correction,
accurate mass calculation, data smoothing, and noise reduction,
followed by alignment between chromatograms. Since the NMR
data on apolar samples did not indicate a need for normalization
(see Results) and the polar samples were derived from the same cell
cultures no normalization was applied on U-HPLC-Orbitrap-MS
data. The generated spreadsheet of the dataset (21173 mass peaks)
was subjected to statistical analysis using Genemaths XT.
Standard initial analysis entailed performing a 2Log transforma-
tion and a PCA (average of rows and columns subtracted). This
was followed by a 2Log transformation, a pre-selection of variables
using an ANOVA (p,0.01; false discovery rate control by the
Benjamini & Hochberg procedure), followed by a PCA (average of
rows and columns subtracted). The grouping in the ANOVA was:
on the replicates for each time point and treatment (4 groups with
5 replicates), per treatment (2 groups of 10 replicates), on the
control samples at both time points (2 groups of 5 replicates), as
well as per treatment at each time point (2 groups of 5 replicates at
4 h and 2 groups of 5 replicates at 8 h). The peak loadings
responsible for the separation in the different PCAs were selected
and exported as described [21]. Only those signals with intensity
higher than 5 times noise and a fold change higher than 1.2 were
taken as candidates for further identification.
Identification of metabolites. To facilitate further analysis
and identification of the selected signals, GM2MS, an application
of MetAlign that re-creates ‘‘new chromatograms’’ only containing
the peaks exported from the PCA selection, was used [21]. Polar
metabolites were afterwards identified with commercially available
standards, using previously acquired identification information
[18], with FT-MS/MS analysis (using the LC-nanomate-Orbi-
trap-MS method described above), and using databases such as the
HMDB [http://www.hmdb.ca/] (see Table S1 for the identified
metabolites).
Transcriptomics Analysis and Integration ofMetabolomics and Transcriptomics DataTranscriptional microarray data have been published [12] and
are available from ArrayExpress. HM1 ES cells were treated with
10 mM cisplatin or vehicle control for 8 hours in three
independent experiments. Total RNA was isolated using the
RNAeasy kit (Qiagen) according to manufacturer’s instructions.
RNA quality and integrity was assessed with Agilent 2100
Bioanalyzer system (Agilent technologies). Gene expression was
measured using Affimetrix MG430 PM Array plates. All raw data
passed the affimetrix quality criteria. Normalization of raw data
using the robust multi-array average algorithm and statistical
analysis was performed using BRBarray tools (http://linus.nci.nih.
gov/BRB-ArrayTools.html). The 2269 genes whose expression
differed significantly (parametric p,0.0005) between control ES
cells and ES cells treated for 8 hours with 10 mM cisplatin were
used as input in Ingenuity pathway analysis (IPA) or the cytoscape
plug-in Metscape to identify metabolic enzymes [22,23]. Tran-
scriptional heatmaps were obtained using Multiple Array Viewer
(MEV) software. Differentially expressed genes encoding meta-
bolic enzymes and the metabolites that were differentially
regulated at 4 h or 8 h (p,0.01) were imported in IPA and
Metscape to form integrated metabolic signaling networks and
from those retrieve enriched metabolic pathways, based on the
criteria ‘‘at least three affected molecules, including at least one
affected metabolite’’.
RNAi ExperimentssiRNA Smartpools were purchased from ThermoFisher Scien-
tific. Cells were transfected with 50 nM Smartpool in 96 well
plates using Dharmafect1 transfection reagent (ThermoFisher
Scientific). The medium was refreshed after 24 h and cells were
exposed to indicated compounds or vehicle controls 48 h post-
transfection for 24 h. As readout, a cell viability assay using
ATPlite 1 Step kit (Perkin Elmer) was performed according to the
manufacturer’s instructions.
ROS Formation AssayFor probing intracellular ROS, cells were cultured in mClear 96
well plates to 70% confluence. Cells were washed twice with PBS
and incubated for 1 h with 40 mM 5-(and-6)-Carboxy-29,79-
Dichlorofluorescein Diacetate (DCF-DA, Invitrogen) in phenol-
red free culture medium. After washing with PBS, cells were
exposed to 5 mM cisplatin or 250 mM Hydrogen peroxide (H2O2)
in the presence or absence of 10 mM of the ROS scavenger N-
acetylcysteine (NAC). Fluorescence was measured at different time
points after exposure using a plate reader.
Results
Cisplatin-induced Changes on the Metabolome ofEmbryonic Stem CellsGeneral considerations - To explore intracellular metabolic changes
in response to genotoxic stress in pluripotent stem cells, ES cells
were treated with a sub-lethal dose of 5 mM cisplatin for 4 h and
8 h and lysates were prepared for metabolomics analysis (Fig.
S1A). At 8 h cells began to accumulate in the S/G2 phase of the
cell cycle but viability was not significantly affected at these early
timepoints while analysis of parallel control plates at later time
points confirmed induction of apoptosis by this concentration of
cisplatin (Fig. S1B–D). Apolar and polar fractions were collected
and used for 1H-NMR and U-HPLC-Orbitrap-MS analysis,
respectively. To assess whether data normalization was required to
correct for potential differences in cell numbers 1H-NMR data on
the apolar fraction of control and cisplatin-treated ES cells at both
time points were analyzed. Since no significant differences
(ANOVA p,0.01) in phospholipid content or other apolar
metabolites were detected (examples of overlaid spectra are given
in Fig. S2), normalization of metabolite data to correct for cell
numbers was not required. Fig. S3 shows for the UHPLC-
Orbitrap-MS data the PCA after ANOVA (p,0.01; false
discovery rate control by the Benjamini & Hochberg procedure);
a small subset of 293 mass peaks survive out of a potential of 21173
mass peaks and can be observed to separate the 4 groups in a
reproducible way.
The Metabolic Response to Cisplatin
PLOS ONE | www.plosone.org 3 October 2013 | Volume 8 | Issue 10 | e76476

Identification of metabolites significantly affected by cisplatin - Polar
fractions of control- and cisplatin-treated samples were compared
for each time point independently. Masses were identified that
significantly contributed to the observed separation between
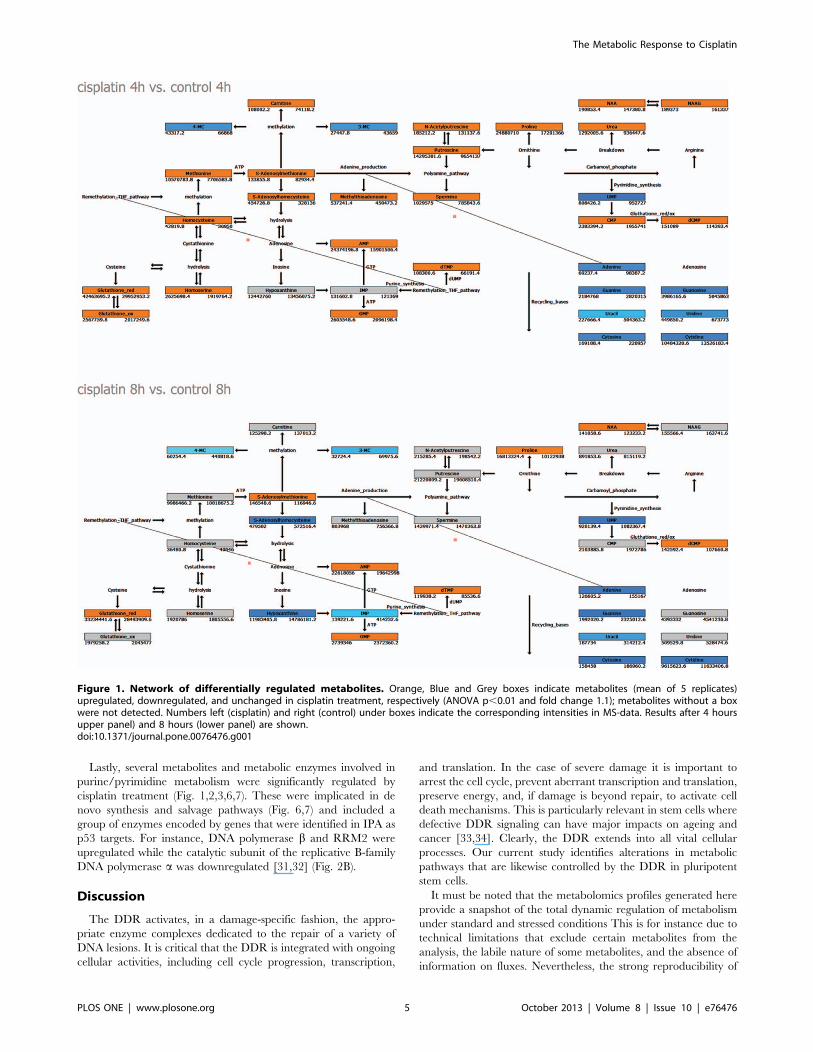
treatments at the different time points (Table S1). At 4 h,
metabolites that were differentially regulated between control
and cisplatin-treated samples were mainly involved in methionine
degradation pathways (including transmethylation, transsulfura-
tion/glutathione synthesis), as well as polyamine synthesis and
catabolism, urea cycle, proline and arginine metabolism, and
nucleotide metabolism (Fig. 1A). Furthermore, we detected
increased levels of the metabolite N-acetyl-aspartyl-glutamic acid
(NAAG), a common neuropeptide and its precursor N-acetyl-L-
aspartate (NAA) [24] (Fig. 1A). After 8 h of cisplatin treatment,
levels of reduced glutathione and proline remained increased,
while other differentially regulated metabolites were mainly
involved in nucleotide metabolism (Fig. 1 B, Table S1).
Expression of Metabolic Enzymes Significantly Affectedby CisplatinIn parallel to metabolomics, transcriptomics analysis was
performed to determine cisplatin-induced changes in metabolic
enzymes at 8 h. Cytoscape and IPA-based pathway analysis led to
the identification of a list of 144 metabolism-related enzymes
(Table S2, Fig. 2A). A large proportion of these metabolic enzymes
were involved in lipid metabolism; inositol phosphate metabolism
(mostly myo-Inositol), glycerophospholipid and sphingolipid me-
tabolism. We furthermore detected changes in the mRNA levels of
metabolic enzymes that are involved in sugar and fatty acid
metabolism (Fig. 2A). Next to those, a number of differentially
regulated metabolic enzymes correlated with the metabolic
pathways, which had been identified based on the changes in
metabolite levels, including urea cycle and arginine/proline
metabolism, polyamine metabolism and nucleotide metabolism
(Fig. 2A). Interestingly, several of the cisplatin-regulated metabolic
enzymes were identified as target genes of the transcription factor
p53 (Fig. 2B). p53 target genes implicated in lipid metabolism were
commonly suppressed while p53 target genes encoding enzymes
functioning in amino acid or nucleotide metabolism were mostly
enhanced.
Identification of Affected Metabolic Pathways throughIntegration of Metabolomics and TranscriptomicsIdentified changes in metabolites and metabolic enzymes were
combined to derive integrated signaling networks. For this, 144
regulated enzymes and 35 regulated metabolites were imported in
IPA and Metscape to form an integrated metabolic signaling
network (Fig. 3; Fig. S4). Clusters of significantly enriched
metabolic pathways were identified based on the criteria [.3
affected molecules including at least 1 affected metabolite and 1
affected enzyme]. Lipid metabolism, despite the observed changes
in expression of several enzymes in this process (Fig. 2A; Table S2),
was not selected since the sample analysis methodology (NMR)
used here for the apolar (lipid) fraction does not have the required
resolution for detection of lipd metabolites on the individual
species level (such as for instance PIP3 etc). Networks included a
purine and a pyrimidine metabolism cluster, a cluster of S-
adenosylmethionine (SAMe)-related pathways, a polyamine syn-
thesis cluster, and a urea cycle cluster, featuring pathways related
to the metabolism of proline, arginine and citrulline (Fig. 3, 4, 5,
Fig. 6, 7).
At 4 h of cisplatin treatment many metabolites linked to SAMe-
related pathways were increased (Fig. 1,3,4). SAMe is the methyl
donor in methylation of DNA, RNA and methylation of lysine
during biosynthesis of carnitine [25]. We detected cisplatin-
induced changes in the levels of the RNA nucleosides 3-
methylcytidine, 4-methylcytidine, and of carnitine, as well as
changes in mRNA levels of the methyltransferases MLL3, PCMT1
and TPMT (Fig. 2A, Fig. 3). We reinvestigated the list of
differentially regulated genes and identified regulation of several
other methylation enzymes that had been missed by IPA and
Metscape analysis, including histone methyltransferases and
demethlyases as well as RNA methyltransferases (Fig. S5A). This
additional list included the RNA methyltransferase METLL6,
which has been correlated to cisplatin sensitivity in lung cancer
patients [26]. SAMe is a critical hub between trans-sulfuration,
polyamine synthesis, and the folate cycle [25]. Multiple enzymes
and metabolites in these pathways were significantly regulated by
cisplatin (Fig. 4). This included an increase in cystathionine-beta-
synthase (CBS), an enzyme that is critical for the conversion of
homocysteine to cystathione [25]. Cystathione is a precursor for
glutathione and levels of oxidized and reduced glutathione were
increased after 4 h of cisplatin treatment, while after 8 h only the
reduced form persisted (Fig. 1, Table S1). Enzymes related to
tetrahydrofolate (THF) synthesis, which is a crucial part of the
folate cycle were also affected. THF is not only involved in
transmethylation, but is also crucial to pyrimidine and purine
synthesis. Amongst the regulated enzymes we found upregulation
of FPGS and DHFR, which are directly involved in THF
synthesis, and downregulation of MTHFD1L, which is involved in
the ATP/ADP-dependent interconversion of 10-formyl-THF
(needed for purine synthesis) (Fig. 4).
A cluster of reactions related to polyamine synthesis and
catabolism were identified based on cisplatin-regulation of
enzymes and metabolites (Fig. 4,5). After 4 h of cisplatin treatment
we identified increased levels of the polyamine metabolites
spermine and its precursor putrescine. At 8 h the concentrations
were normalized again, while at the same time spermine synthase
(SMS) mRNA levels were reduced and spermine oxidase (SMOX)
mRNA levels were increased. In addition, changes in metabolites
and enzymes related to urea cycle and proline/arginine metab-
olism were identified (Fig. 1,5). Arginine catabolism appeared to
be enhanced even though we did not observe transcriptional
changes in superoxide dismutase or NO-synthase. ADC was found
to be strongly increased, potentially resulting in a higher
conversion of arginine to agmatine, which itself is an inhibitor of
NO-synthase. Moreover, expression of GATM, which forms a
creatine precursor from arginine and glycine was enhanced (Fig. 5)
[27]. Enhanced levels of metabolic products of arginine catabolism
such as urea, putrescine (and spermine) and proline were also
detected [27] (Fig. 5). Next to increased proline levels at 4 h and
8 h of treatment, enzymes involved in reduction of P5C to proline
(PYCR2), as well as proline breakdown (PRODH, Aldh4a1) were
upregulated [28]. IPA analysis identified PRODH, Aldh4a1, and
GATM as known p53 target genes [29,30] (Fig. 2A). Interestingly,
altered proline metabolism appeared to act as an adaptive
response since knockdown of PYCR2 or PRODH, significantly
sensitized ES cells to cisplatin-induced cell death (Fig. 5B).
Since many of the enzymes and metabolites have been
previously implicated in anti- or prooxidant function (e.g.
glutathione, methionine, proline, PRODH, SMOX) we tested
whether cisplatin treatment, at the time points of our analysis, led
to an increase in reactive oxygen species (ROS) formation.
However, while hydrogen peroxide (H2O2) led to a strong increase
in ROS levels, no significant increase in intracellular ROS levels
was detected after cisplatin treatment, at any of the studied time
points (Fig. S5B).
The Metabolic Response to Cisplatin
PLOS ONE | www.plosone.org 4 October 2013 | Volume 8 | Issue 10 | e76476
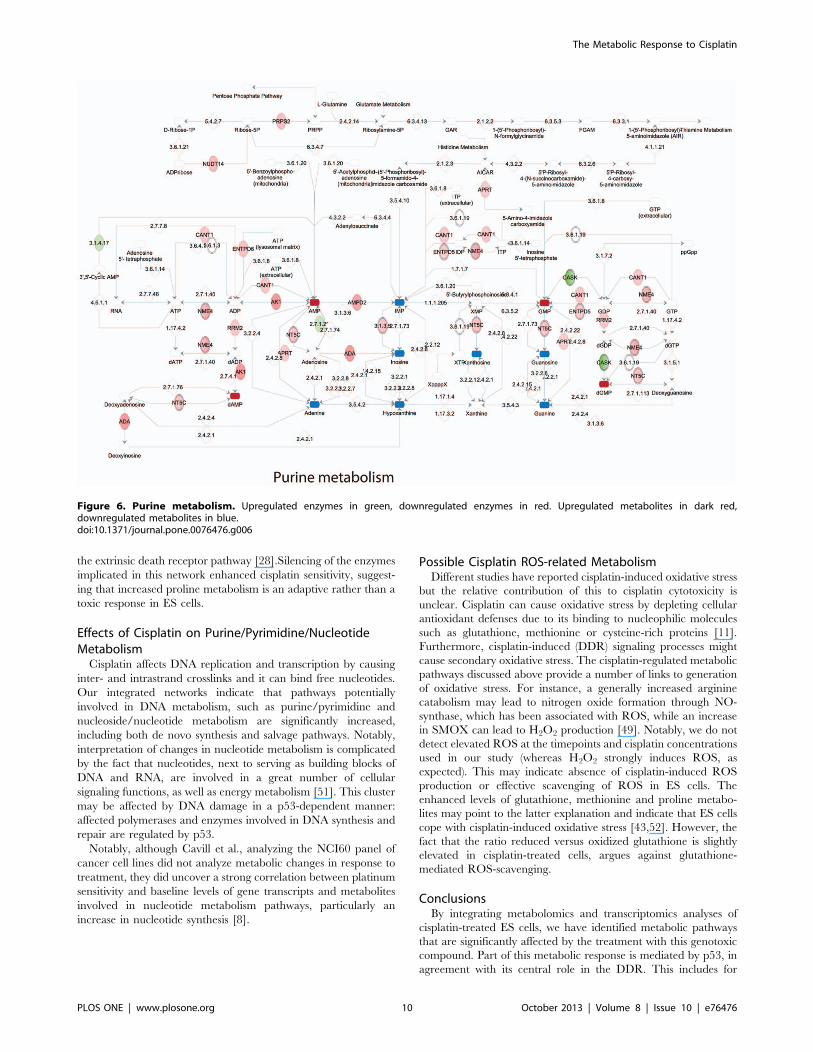
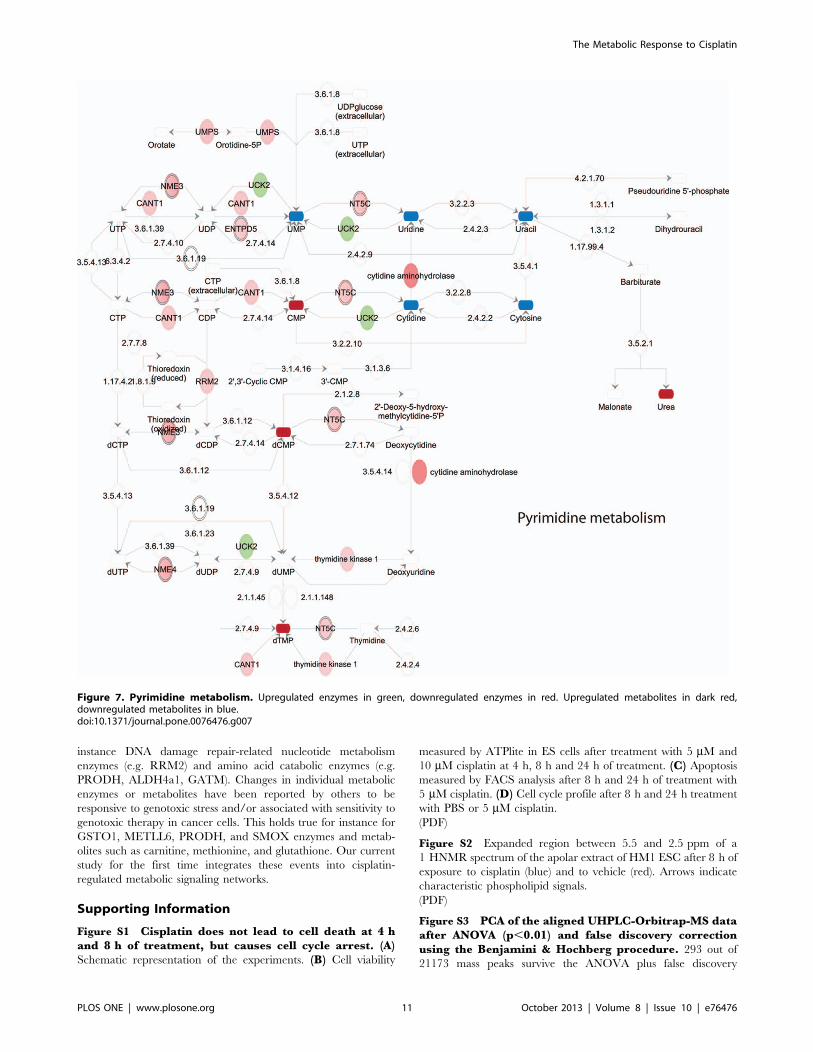
Lastly, several metabolites and metabolic enzymes involved in
purine/pyrimidine metabolism were significantly regulated by
cisplatin treatment (Fig. 1,2,3,6,7). These were implicated in de
novo synthesis and salvage pathways (Fig. 6,7) and included a
group of enzymes encoded by genes that were identified in IPA as
p53 targets. For instance, DNA polymerase b and RRM2 were
upregulated while the catalytic subunit of the replicative B-family
DNA polymerase a was downregulated [31,32] (Fig. 2B).
Discussion
The DDR activates, in a damage-specific fashion, the appro-
priate enzyme complexes dedicated to the repair of a variety of
DNA lesions. It is critical that the DDR is integrated with ongoing
cellular activities, including cell cycle progression, transcription,
and translation. In the case of severe damage it is important to
arrest the cell cycle, prevent aberrant transcription and translation,
preserve energy, and, if damage is beyond repair, to activate cell
death mechanisms. This is particularly relevant in stem cells where
defective DDR signaling can have major impacts on ageing and
cancer [33,34]. Clearly, the DDR extends into all vital cellular
processes. Our current study identifies alterations in metabolic
pathways that are likewise controlled by the DDR in pluripotent
stem cells.
It must be noted that the metabolomics profiles generated here
provide a snapshot of the total dynamic regulation of metabolism
under standard and stressed conditions This is for instance due to
technical limitations that exclude certain metabolites from the
analysis, the labile nature of some metabolites, and the absence of
information on fluxes. Nevertheless, the strong reproducibility of
Figure 1. Network of differentially regulated metabolites. Orange, Blue and Grey boxes indicate metabolites (mean of 5 replicates)upregulated, downregulated, and unchanged in cisplatin treatment, respectively (ANOVA p,0.01 and fold change 1.1); metabolites without a boxwere not detected. Numbers left (cisplatin) and right (control) under boxes indicate the corresponding intensities in MS-data. Results after 4 hoursupper panel) and 8 hours (lower panel) are shown.doi:10.1371/journal.pone.0076476.g001
The Metabolic Response to Cisplatin
PLOS ONE | www.plosone.org 5 October 2013 | Volume 8 | Issue 10 | e76476

the metabolomics and the connections with affected metabolic
enzymes provide high-confidence data on the metabolic response
of ES cells to genotoxic insult. Interestingly, a number of metabolic
enzymes we find to be transcriptionally modified by cisplatin are
target genes of the key DDR transcriptional regulator, p53. This is
in agreement with our recent finding that p53 is a major DDR
signaling hub in ES cells [12]. Moreover, the integration of
transcriptionally regulated metabolic enzymes and significantly
affected metabolites allows identification of integrated metabolic
networks that are responsive to genotoxic stress. These cluster in
pathways centered on purine/pyrimidine metabolism, SAMe-
related pathways, polyamine synthesis, and the urea cycle.
In a previous study we identified a p53-independent increase in
Wnt signaling as a prosurvival response in ES cells, treated with
cisplatin [12]. Interestingly, Wnt signaling has been shown to
regulate a number of metabolic processes, including glucose, fatty
acid, amino acid and nucleotide metabolism. Wnt-mediated
metabolic changes are important for a switch from ‘‘quiescent’’
to a ‘‘proliferating’’ metabolic state, which is important both for
developmental processes and the pathology of cancer [35]. Thus,
Wnt signaling, which acts as a pro-survival response, may regulate
some of the DNA damage-induced metabolic changes in
pluripotent stem cells. This possibile mode of cross talk warrants
further study.
Figure 2. Differentially regulated metabolic enzymes. (A) Heatmap indicating metabolic enzymes obtained from Cytoscape metabolicsignaling network (Fig. S4, highlighted in blue; Table S2), differentially regulated after 8 h of cisplatin treatment and enriched metabolic pathwayswithin the dataset. (B) Regulation of metabolic enzymes by the transcription factor p53 obtained with Ingenuity pathway analysis.doi:10.1371/journal.pone.0076476.g002
The Metabolic Response to Cisplatin
PLOS ONE | www.plosone.org 6 October 2013 | Volume 8 | Issue 10 | e76476

Figure 3. Integrated signaling network. (A) Schematic representation of metabolomics and transcriptomics data integration leading toidentification of common signaling networks related to nucleotide metabolism, SAMe pathways, polyamine pathways and urea cycle, and arginine &proline metabolism. (B) Integrated signaling network of metabolic enzymes and metabolites obtained with Ingenuity pathway analysis. Clusters ofsignificantly enriched canonical pathways and related enzymes and metabolites are highlighted. Upregulated enzymes in green, downregulatedenzymes in red. Upregulated metabolites in dark red, downregulated metabolites in blue.doi:10.1371/journal.pone.0076476.g003
The Metabolic Response to Cisplatin
PLOS ONE | www.plosone.org 7 October 2013 | Volume 8 | Issue 10 | e76476

Changes in Methylation PathwaysOur analysis shows an increase in SAMe-related metabolites in
response to cisplatin treatment. SAMe is formed from methionine
and ATP with the help of methionine adenosyltransferases (MATs)
and functions as a general methyl donor in almost all cellular
methylation reactions [25]. Methylation patterns (especially those
of DNA) change during embryonic development and neoplastic
transformation and can be affected by genotoxic stress [36]. RNA-
methylation has been associated with structural features, RNA
stability and function (e.g. tRNA codon specificity) [37]. Mam-
malian cells lack the necessary kinases to phosphorylate modified
nucleosides into nucleoside triphosphate, which prevents their
recycling and incorporation in mRNA [38]. Instead, modified
nucleosides are excreted. Enhanced urinary levels of modified
RNA nucleosides, including 3-methylcytidine have been suggested
as a potential biomarker for certain cancers [39,40]. We detect
changes in the expression of RNA- but not DNA-methyl
transferases and decreased levels of methylated RNA nucleosides
in response to cisplatin treatment, including 3- and 4-methylcy-
tidine.
Changes in Transsulfuration Pathways and Folate CycleAfter methyl transfer SAMe is converted into S-adenosylhomo-
cysteine (SAH), which in turn is hydrolyzed to form adenosine and
homocysteine. Homocysteine, can be either reduced to cysteine,
which functions as a crucial precursor for glutathione (Transsul-
furation pathway), or be remethylated to methionine (Folate cycle)
[25]. Our integrated metabolic network associated with SAMe
points to changes in these pathways. Glutathione - a cytoprotective
compound - has been reported to chelate cisplatin and to play a
role in copper transporter-mediated cisplatin efflux. Furthermore,
glutathione has a function in cellular redox regulation and can act
as a protective agent against cisplatin-induced oxidative stress
[41,42,43]. In accordance with this, GSTO1, a member of the
highly conserved omega class of glutathione transferases with
dehydroascorbate reductase activity, which has been implicated in
resistance to various genotoxic drugs and irradiation, shows
increased levels after cisplatin treatment [44,45]. In addition,
cisplatin treatment causes changes in the levels of enzymes
associated with folate synthesis and the folate cycle although
altered levels of relevant metabolites are not seen. Expression of
DHFR and FGPS is upregulated whereas MTHFD1L is
decreased, which could provide a connection to the observed
changes in purine metabolism through ATP/ADP-dependent
interconversion of 10-formyl-THF [46]. Interestingly, antifolates,
such as the DHFR interactor methotrexate are used as antineo-
plastic agents [47].
Changes in Polyamine Related PathwaysSAMe serves as a precursor for elongation of putrescine to
spermidine and from there to spermine [25]. Both putrescine and
spermine levels are enhanced in cisplatin-treated cells at 4 h. The
increase of putrescine, which can be derived from ornithine, could
also be explained by enhanced expression of ADC, an arginine
decarboxylase that converts arginine to agmatine, a precursor of
putrescine. Spermine is the substrate for SMOX, an enzyme that
is upregulated at 8 h by cisplatin and catalyzes the breakdown of
spermine to spermidine, 3-aminopropanal, and H2O2. Platinum
drugs have already been shown to regulate enzymes involved in
polyamine catabolism, including spermine N1-acetyltransferase
Figure 4. SAMe centered pathways. Upregulated enzymes in green, downregulated enzymes in red. Upregulated metabolites in dark red,downregulated metabolites in blue.doi:10.1371/journal.pone.0076476.g004
The Metabolic Response to Cisplatin
PLOS ONE | www.plosone.org 8 October 2013 | Volume 8 | Issue 10 | e76476

(which is not seen in our study) and SMOX [48,49]. Moreover,
SMOX-produced H2O2 is considered a major source of oxidative
stress after induction of polyamine catabolism [49]. Therefore it
appears that the initially increased levels of polyamines could later
be levelled out by oxidation potentially leading to an increased
production of H2O2.
Changes in Proline/Arginine Metabolism and Urea CycleWe show that cisplatin induces substantial changes in metab-
olites and enzymes related to urea cycle and proline/arginine
metabolism including an apparent increase in arginine catabolism.
Arginine, proline, glutamate and ornithine are all interconvertable
provided that glutamine is available as a precursor of carbamoyl
phosphate. This metabolism is the basis for synthesis of nitrogen-
containing compounds such as ureum, putrescine, agmatine,
creatine and even nitrogen oxide and is furthermore crucial for
pyrimidine synthesis. Interestingly, changes in pyrimidine metab-
olites are seen in response to cisplatin treatment, including an
decrease in the pyrimidine synthesis precursor, UMP [27,50]. The
breakdown of proline by PRODH provides electrons, which can
be used for ATP production, but also for ROS formation
contributing to apoptosis via intrinsic mitochondrial pathways or
Figure 5. Urea cycle and the metabolism of arginine and proline. (A) Upregulated enzymes in green, downregulated enzymes in red.Upregulated metabolites in dark red, downregulated metabolites in blue. (B) Cell viability after knockdown of GFP (negative control), PRODH, PYCR2or PARS2 in presence or absence of 5 mM cisplatin.doi:10.1371/journal.pone.0076476.g005
The Metabolic Response to Cisplatin
PLOS ONE | www.plosone.org 9 October 2013 | Volume 8 | Issue 10 | e76476
the extrinsic death receptor pathway [28].Silencing of the enzymes
implicated in this network enhanced cisplatin sensitivity, suggest-
ing that increased proline metabolism is an adaptive rather than a
toxic response in ES cells.
Effects of Cisplatin on Purine/Pyrimidine/NucleotideMetabolismCisplatin affects DNA replication and transcription by causing
inter- and intrastrand crosslinks and it can bind free nucleotides.
Our integrated networks indicate that pathways potentially
involved in DNA metabolism, such as purine/pyrimidine and
nucleoside/nucleotide metabolism are significantly increased,
including both de novo synthesis and salvage pathways. Notably,
interpretation of changes in nucleotide metabolism is complicated
by the fact that nucleotides, next to serving as building blocks of
DNA and RNA, are involved in a great number of cellular
signaling functions, as well as energy metabolism [51]. This cluster
may be affected by DNA damage in a p53-dependent manner:
affected polymerases and enzymes involved in DNA synthesis and
repair are regulated by p53.
Notably, although Cavill et al., analyzing the NCI60 panel of
cancer cell lines did not analyze metabolic changes in response to
treatment, they did uncover a strong correlation between platinum
sensitivity and baseline levels of gene transcripts and metabolites
involved in nucleotide metabolism pathways, particularly an
increase in nucleotide synthesis [8].
Possible Cisplatin ROS-related MetabolismDifferent studies have reported cisplatin-induced oxidative stress
but the relative contribution of this to cisplatin cytotoxicity is
unclear. Cisplatin can cause oxidative stress by depleting cellular
antioxidant defenses due to its binding to nucleophilic molecules
such as glutathione, methionine or cysteine-rich proteins [11].
Furthermore, cisplatin-induced (DDR) signaling processes might
cause secondary oxidative stress. The cisplatin-regulated metabolic
pathways discussed above provide a number of links to generation
of oxidative stress. For instance, a generally increased arginine
catabolism may lead to nitrogen oxide formation through NO-
synthase, which has been associated with ROS, while an increase
in SMOX can lead to H2O2 production [49]. Notably, we do not
detect elevated ROS at the timepoints and cisplatin concentrations
used in our study (whereas H2O2 strongly induces ROS, as
expected). This may indicate absence of cisplatin-induced ROS
production or effective scavenging of ROS in ES cells. The
enhanced levels of glutathione, methionine and proline metabo-
lites may point to the latter explanation and indicate that ES cells
cope with cisplatin-induced oxidative stress [43,52]. However, the
fact that the ratio reduced versus oxidized glutathione is slightly
elevated in cisplatin-treated cells, argues against glutathione-
mediated ROS-scavenging.
ConclusionsBy integrating metabolomics and transcriptomics analyses of
cisplatin-treated ES cells, we have identified metabolic pathways
that are significantly affected by the treatment with this genotoxic
compound. Part of this metabolic response is mediated by p53, in
agreement with its central role in the DDR. This includes for
Figure 6. Purine metabolism. Upregulated enzymes in green, downregulated enzymes in red. Upregulated metabolites in dark red,downregulated metabolites in blue.doi:10.1371/journal.pone.0076476.g006
The Metabolic Response to Cisplatin
PLOS ONE | www.plosone.org 10 October 2013 | Volume 8 | Issue 10 | e76476
instance DNA damage repair-related nucleotide metabolism
enzymes (e.g. RRM2) and amino acid catabolic enzymes (e.g.
PRODH, ALDH4a1, GATM). Changes in individual metabolic
enzymes or metabolites have been reported by others to be
responsive to genotoxic stress and/or associated with sensitivity to
genotoxic therapy in cancer cells. This holds true for instance for
GSTO1, METLL6, PRODH, and SMOX enzymes and metab-
olites such as carnitine, methionine, and glutathione. Our current
study for the first time integrates these events into cisplatin-
regulated metabolic signaling networks.
Supporting Information
Figure S1 Cisplatin does not lead to cell death at 4 hand 8 h of treatment, but causes cell cycle arrest. (A)Schematic representation of the experiments. (B) Cell viability
measured by ATPlite in ES cells after treatment with 5 mM and
10 mM cisplatin at 4 h, 8 h and 24 h of treatment. (C) Apoptosismeasured by FACS analysis after 8 h and 24 h of treatment with
5 mM cisplatin. (D) Cell cycle profile after 8 h and 24 h treatment
with PBS or 5 mM cisplatin.
(PDF)
Figure S2 Expanded region between 5.5 and 2.5 ppm of a
1 HNMR spectrum of the apolar extract of HM1 ESC after 8 h of
exposure to cisplatin (blue) and to vehicle (red). Arrows indicate
characteristic phospholipid signals.
(PDF)
Figure S3 PCA of the aligned UHPLC-Orbitrap-MS dataafter ANOVA (p,0.01) and false discovery correctionusing the Benjamini & Hochberg procedure. 293 out of
21173 mass peaks survive the ANOVA plus false discovery
Figure 7. Pyrimidine metabolism. Upregulated enzymes in green, downregulated enzymes in red. Upregulated metabolites in dark red,downregulated metabolites in blue.doi:10.1371/journal.pone.0076476.g007
The Metabolic Response to Cisplatin
PLOS ONE | www.plosone.org 11 October 2013 | Volume 8 | Issue 10 | e76476
correction. Green=Control 4 h; Purple =Control 8 h; Red= -
Cisplatin 4 h; Yellow=Cisplatin 8 h.
(PDF)
Figure S4 Metscape ‘‘gene-compound metabolic net-work’’. Highlighted in blue and red are compounds and genes
showing a significant regulation after 4 h cisplatin treatment.
Metabolic enzymes were retrieved from this network (Fig. 2A,
Suppl. Table 2). Figure is high resolution – zoom in to view details.
(PDF)
Figure S5 (A) Regulation of (de)methylases. Heatmap
showing regulation of methyltransferases and demethylases after
cisplatin treatment (B) ROS formation is caused byhydrogen peroxide but not cisplatin treatment. Bar graphshows normalized fluorescence indicating intracellular ROS levels
measured using 40 mM DCF-DA probe. Cells were preincubated
with DCF-DA for 1 h and exposed to 5 mM cisplatin or 250 mMH2O2 in the presence or absence of 10 mM of the ROS scavenger
NAC for the indicated times. Bars represent average and SEM of
at least 3 independent experiments.
(PDF)
Table S1 Identified metabolites. Identification of masses
found to be significantly different (p,0.01) between control and
cisplatin-treated samples.
(XLS)
Table S2 Significantly regulated metabolic enzymes.List of metabolic enzymes identified by Metscape and Ingenuity
pathway analysis from 2269 genes that are differentially regulated
by cisplatin.
(XLS)
Material S1 Orbitrap mass spectrometer settings.
(PDF)
Author Contributions
Conceived and designed the experiments: LvS ARA ED AL AP BvdW.
Performed the experiments: LvS ARA. Analyzed the data: LvS ARA AL.
Contributed reagents/materials/analysis tools: LvS ARA ED AL AP
BvdW. Wrote the paper: LvS ARA ED AL.
References
1. Patti GJ, Yanes O, Siuzdak G (2012) Innovation: Metabolomics: the apogee of
the omics trilogy. Nat Rev Mol Cell Biol 13: 263–269.
2. Suhre K, Shin SY, Petersen AK, Mohney RP, Meredith D, et al. (2011) Human
metabolic individuality in biomedical and pharmaceutical research. Nature 477:
54–60.
3. Dang CV (2012) Links between metabolism and cancer. Genes Dev 26: 877–
890.
4. Zhang GF, Sadhukhan S, Tochtrop GP, Brunengraber H (2011) Metabolomics,
pathway regulation, and pathway discovery. J Biol Chem 286: 23631–23635.
5. Duarte IF, Lamego I, Marques J, Marques MP, Blaise BJ, et al. (2010) Nuclear
magnetic resonance (NMR) study of the effect of cisplatin on the metabolicprofile of MG-63 osteosarcoma cells. J Proteome Res 9: 5877–5886.
6. Cano KE, Li YJ, Chen Y (2010) NMR metabolomic profiling reveals new rolesof SUMOylation in DNA damage response. J Proteome Res 9: 5382–5388.
7. Roodhart JM, Daenen LG, Stigter EC, Prins HJ, Gerrits J, et al. (2011)Mesenchymal stem cells induce resistance to chemotherapy through the release
of platinum-induced fatty acids. Cancer Cell 20: 370–383.
8. Cavill R, Kamburov A, Ellis JK, Athersuch TJ, Blagrove MS, et al. (2011)
Consensus-phenotype integration of transcriptomic and metabolomic dataimplies a role for metabolism in the chemosensitivity of tumour cells. PLoS
Comput Biol 7: e1001113.
9. Wang D, Lippard SJ (2005) Cellular processing of platinum anticancer drugs.
Nat Rev Drug Discov 4: 307–320.
10. Mandic A, Hansson J, Linder S, Shoshan MC (2003) Cisplatin induces
endoplasmic reticulum stress and nucleus-independent apoptotic signaling. J Biol
Chem 278: 9100–9106.
11. Galluzzi L, Senovilla L, Vitale I, Michels J, Martins I, et al. (2012) Molecular
mechanisms of cisplatin resistance. Oncogene 31: 1869–1883.
12. Carreras Puigvert J, von Stechow L, Siddappa R, Pines A, Bahjat M, et al.
(2013) Systems biology approach identifies the kinase csnk1a1 as a regulator ofthe DNA damage response in embryonic stem cells. Sci Signal 6: ra5.
13. Pines A, Kelstrup CD, Vrouwe MG, Puigvert JC, Typas D, et al. (2011) Globalphosphoproteome profiling reveals unanticipated networks responsive to
cisplatin treatment of embryonic stem cells. Mol Cell Biol 31: 4964–4977.
14. Lord CJ, Ashworth A (2012) The DNA damage response and cancer therapy.
Nature 481: 287–294.
15. Tichy ED (2011) Mechanisms maintaining genomic integrity in embryonic stem
cells and induced pluripotent stem cells. Exp Biol Med (Maywood) 236: 987–996.
16. Ben-David U, Benvenisty N (2011) The tumorigenicity of human embryonic andinduced pluripotent stem cells. Nat Rev Cancer 11: 268–277.
17. Magin TM, McWhir J, Melton DW (1992) A new mouse embryonic stem cellline with good germ line contribution and gene targeting frequency. Nucleic
Acids Res 20: 3795–3796.
18. Ruiz-Aracama A, Peijnenburg A, Kleinjans J, Jennen D, van Delft J, et al. (2011)
An untargeted multi-technique metabolomics approach to studying intracellular
metabolites of HepG2 cells exposed to 2,3,7,8-tetrachlorodibenzo-p-dioxin.BMC Genomics 12: 251.
19. De Vos RC, Moco S, Lommen A, Keurentjes JJ, Bino RJ, et al. (2007)Untargeted large-scale plant metabolomics using liquid chromatography
coupled to mass spectrometry. Nat Protoc 2: 778–791.
20. Lommen A, Gerssen A, Oosterink JE, Kools HJ, Ruiz-Aracama A, et al. (2011)
Ultra-fast searching assists in evaluating sub-ppm mass accuracy enhancement inU-HPLC/Orbitrap MS data. Metabolomics 7: 15–24.
21. Lommen A (2009) MetAlign: interface-driven, versatile metabolomics tool for
hyphenated full-scan mass spectrometry data preprocessing. Anal Chem 81:
3079–3086.
22. Gao J, Tarcea VG, Karnovsky A, Mirel BR, Weymouth TE, et al. (2010)
Metscape: a Cytoscape plug-in for visualizing and interpreting metabolomic data
in the context of human metabolic networks. Bioinformatics 26: 971–973.
23. Karnovsky A, Weymouth T, Hull T, Tarcea VG, Scardoni G, et al. (2012)
Metscape 2 bioinformatics tool for the analysis and visualization of metabo-
lomics and gene expression data. Bioinformatics 28: 373–380.
24. Pederzolli CD, Rockenbach FJ, Zanin FR, Henn NT, Romagna EC, et al.
(2009) Intracerebroventricular administration of N-acetylaspartic acid impairs
antioxidant defenses and promotes protein oxidation in cerebral cortex of rats.
Metab Brain Dis 24: 283–298.
25. Lu SC, Mato JM (2008) S-Adenosylmethionine in cell growth, apoptosis and
liver cancer. J Gastroenterol Hepatol 23 Suppl 1: S73–77.
26. Tan XL, Moyer AM, Fridley BL, Schaid DJ, Niu N, et al. (2011) Genetic
variation predicting cisplatin cytotoxicity associated with overall survival in lung
cancer patients receiving platinum-based chemotherapy. Clin Cancer Res 17:
5801–5811.
27. Morris SM, Jr. (2004) Enzymes of arginine metabolism. J Nutr 134: 2743S–
2747S; discussion 2765S–2767S.
28. Phang JM, Pandhare J, Liu Y (2008) The metabolism of proline as
microenvironmental stress substrate. J Nutr 138: 2008S–2015S.
29. Liu Y, Borchert GL, Surazynski A, Phang JM (2008) Proline oxidase, a p53-
induced gene, targets COX-2/PGE2 signaling to induce apoptosis and inhibit
tumor growth in colorectal cancers. Oncogene 27: 6729–6737.
30. Yoon KA, Nakamura Y, Arakawa H (2004) Identification of ALDH4 as a p53-
inducible gene and its protective role in cellular stresses. J Hum Genet 49: 134–
140.
31. Hubscher U, Maga G, Spadari S (2002) Eukaryotic DNA polymerases. Annu
Rev Biochem 71: 133–163.
32. Bourdon A, Minai L, Serre V, Jais JP, Sarzi E, et al. (2007) Mutation of
RRM2B, encoding p53-controlled ribonucleotide reductase (p53R2), causes
severe mitochondrial DNA depletion. Nat Genet 39: 776–780.
33. Jackson SP, Bartek J (2009) The DNA-damage response in human biology and
disease. Nature 461: 1071–1078.
34. Jones DL, Rando TA (2011) Emerging models and paradigms for stem cell
ageing. Nat Cell Biol 13: 506–512.
35. Sethi JK, Vidal-Puig A (2010) Wnt signalling and the control of cellular
metabolism. Biochem J 427: 1–17.
36. Niehrs C (2009) Active DNA demethylation and DNA repair. Differentiation 77:
1–11.
37. Motorin Y, Helm M (2011) RNA nucleotide methylation. Wiley Interdiscip Rev
RNA 2: 611–631.
38. Gehrke CW, Kuo KC, Waalkes TP, Borek E (1979) Patterns of urinary
excretion of modified nucleosides. Cancer Res 39: 1150–1153.
39. Hsu WY, Chen WT, Lin WD, Tsai FJ, Tsai Y, et al. (2009) Analysis of urinary
nucleosides as potential tumor markers in human colorectal cancer by high
performance liquid chromatography/electrospray ionization tandem mass
spectrometry. Clin Chim Acta 402: 31–37.
40. Seidel A, Brunner S, Seidel P, Fritz GI, Herbarth O (2006) Modified
nucleosides: an accurate tumour marker for clinical diagnosis of cancer, early
detection and therapy control. Br J Cancer 94: 1726–1733.
The Metabolic Response to Cisplatin
PLOS ONE | www.plosone.org 12 October 2013 | Volume 8 | Issue 10 | e76476
41. Jansen BA, Brouwer J, Reedijk J (2002) Glutathione induces cellular resistance
against cationic dinuclear platinum anticancer drugs. J Inorg Biochem 89: 197–202.
42. Chen HH, Kuo MT (2010) Role of glutathione in the regulation of Cisplatin
resistance in cancer chemotherapy. Met Based Drugs 2010.43. Wang, Guo Z (2007) The role of sulfur in platinum anticancer chemotherapy.
Anticancer Agents Med Chem 7: 19–34.44. Yan XD, Pan LY, Yuan Y, Lang JH, Mao N (2007) Identification of platinum-
resistance associated proteins through proteomic analysis of human ovarian
cancer cells and their platinum-resistant sublines. J Proteome Res 6: 772–780.45. Whitbread AK, Masoumi A, Tetlow N, Schmuck E, Coggan M, et al. (2005)
Characterization of the omega class of glutathione transferases. MethodsEnzymol 401: 78–99.
46. Christensen KE, Mackenzie RE (2008) Mitochondrial methylenetetrahydrofo-late dehydrogenase, methenyltetrahydrofolate cyclohydrolase, and formyltetra-
hydrofolate synthetases. Vitam Horm 79: 393–410.
47. Assaraf YG (2007) Molecular basis of antifolate resistance. Cancer Metastasis
Rev 26: 153–181.48. Hector S, Porter CW, Kramer DL, Clark K, Prey J, et al. (2004) Polyamine
catabolism in platinum drug action: Interactions between oxaliplatin and the
polyamine analogue N1,N11-diethylnorspermine at the level of spermidine/spermine N1-acetyltransferase. Mol Cancer Ther 3: 813–822.
49. Cervelli M, Amendola R, Polticelli F, Mariottini P (2012) Spermine oxidase: tenyears after. Amino Acids 42: 441–450.
50. Loffler M, Fairbanks LD, Zameitat E, Marinaki AM, Simmonds HA (2005)
Pyrimidine pathways in health and disease. Trends Mol Med 11: 430–437.51. Welin M, Nordlund P (2010) Understanding specificity in metabolic pathways–
structural biology of human nucleotide metabolism. Biochem Biophys ResCommun 396: 157–163.
52. Krishnan N, Dickman MB, Becker DF (2008) Proline modulates the intracellularredox environment and protects mammalian cells against oxidative stress. Free
Radic Biol Med 44: 671–681.
The Metabolic Response to Cisplatin
PLOS ONE | www.plosone.org 13 October 2013 | Volume 8 | Issue 10 | e76476
Copyright © 2022 FDOKUMEN