Post-emplacement melt flow induced by thermal stresses: Implications for differentiation in sills
15
Post-emplacement melt flow induced by thermal stresses: Implications for differentiation in sills Ingrid Aarnes ⁎, Yuri Y. Podladchikov, Else-Ragnhild Neumann Physics of Geological Processes, Postbox 1048 Blindern, N-0316 Oslo, Norway abstract article info Article history: Received 12 November 2007 Received in revised form 5 September 2008 Accepted 14 September 2008 Available online 28 October 2008 Editor: C.P. Jaupart Keywords: thermal stresses differentiation melt flow sill D-shape We present the first steps of a new explanation model for differentiation in sills, using a combination of geochemical data and field observations, numerical modeling and dimensional analysis. Geochemical data from a saucer-shaped dolerite sill intruded into the Karoo basin, South Africa reveal a differentiation process which causes D-shaped profiles. The geometry name is based on the variation in whole-rock Mg-number (Mg# = Mg/(Mg + Fe)) from floor to roof in a sill; the D-shaped geochemical profiles represent sheet-intrusions with the most primitive composition (i.e. high Mg#) in its center, and progressively more evolved composition (i.e. low Mg#) towards the upper and lower margins. The differentiation is reversed compared to the normal differentiation produced by fractional crystallization (C-shaped profiles). C-shaped profiles are believed to be formed by segregation of crystals from the magma. We propose that the opposite, the D-shaped profile, may result from melt segregation from the crystal mush. This is achieved by porous melt-flow through a consolidated crystal network after the main phase of emplacement, and before complete solidification. We show that a significant flow is feasible under natural occurring conditions. An underpressure of magnitude 10 8 Pa develops at the cooling margins due to volume reduction of the crystallizing porous melt. The resulting pressure gradient is the driving force for the melt-flow towards cooling margins considered in this work. As a result the margins will be enriched in the incompatible elements associated with the melt phase, while the center will be depleted. We show that the amount of flow is primarily a function of viscosity of the melt and permeability of the crystal network, which in turn is a transient phenomenon dependent on a number of parameters. Diagrams have been constructed to evaluate the feasibility of substantial melt extraction in terms of these poorly constrained parameters. Data from the Golden Valley Sill and many other natural occurrences of D- and I-shaped geochemical profiles show a reasonable agreement with our predictions of melt flow potential, and are thus well explained by the presented model. We conclude that in order to fully understand differentiation processes occurring in sheet intrusions, we need to account for post emplacement segregation of melt from crystals, and not only segregation of crystals from melt. © 2008 Elsevier B.V. All rights reserved. 1. Introduction Extensive sill and dyke complexes emplaced in sedimentary basins are common in large igneous provinces found in several places around the world, like the Karoo basin, South Africa, and the North Atlantic igneous province (e.g. Chevallier and Woodford, 1999; Du Toit, 1920; Planke et al., 2005). Detailed geochemical studies of such intrusive complexes reveal the complexity of the processes associated with cooling and crystallization of magmatic sheet-intrusions (Galerne et al., 2008). Profiles sampled from the floor to the roof of sills show variations in geochemistry which cannot be explained by the existing theories for the emplacement and crystallization processes of intrusive bodies. Some geochemical profile geometries are repeatedly observed in sills and referred to as D-, I and S-shaped profiles (Fig. 1) (e.g. Marsh, 1996; Latypov, 2003a and references therein). The geometry-notations are based on the variations in the whole-rock Mg-number (Mg# = 100 ⁎ Mg/(Mg + Fe total )) from floor to roof of a sill. The whole rock Mg# is used because magnesium is preferentially partitioned into early-forming crystals such as olivine and pyroxene as compared to iron. A C-shaped profile shows the most evolved composition (e.g. lowest Mg#) in the center of the sill (Fig. 1). A D-shaped profile, in contrast, shows the most evolved composition at the sill-margins and progressively less evolved compositions (e.g. increasing Mg#) towards the center of the sill. The I-shaped profile shows no variation throughout the sill and is in general believed to be a result of closed-system crystallization (e.g. Mangan and Marsh, 1992; Marsh, 1996). The S-shaped profile is an intermediate shape, with an I- or C-shaped upper part and a D-shaped lower part within the same sill, resembling a “beer belly”. One of the main problems with the formation mechanism of D-shaped profiles is that they cannot be explained by classical fractional crystallization theory as developed for large plutons. Plutons are known to have mafic margins and felsic cores (normal zoning), forming C-shaped geochemical profiles, like the Earth and Planetary Science Letters 276 (2008) 152–166 ⁎ Corresponding author. E-mail address: [email protected] (I. Aarnes). 0012-821X/$ – see front matter © 2008 Elsevier B.V. All rights reserved. doi:10.1016/j.epsl.2008.09.016 Contents lists available at ScienceDirect Earth and Planetary Science Letters journal homepage: www.elsevier.com/locate/epsl
-
Upload
independent -
Category
Documents
-
view
3 -
download
0
Transcript of Post-emplacement melt flow induced by thermal stresses: Implications for differentiation in sills

Earth and Planetary Science Letters 276 (2008) 152–166
Contents lists available at ScienceDirect
Earth and Planetary Science Letters
j ourna l homepage: www.e lsev ie r.com/ locate /eps l
Post-emplacement melt flow induced by thermal stresses: Implications fordifferentiation in sills
Ingrid Aarnes ⁎, Yuri Y. Podladchikov, Else-Ragnhild NeumannPhysics of Geological Processes, Postbox 1048 Blindern, N-0316 Oslo, Norway
⁎ Corresponding author.E-mail address: [email protected] (I. Aarnes).
0012-821X/$ – see front matter © 2008 Elsevier B.V. Adoi:10.1016/j.epsl.2008.09.016
a b s t r a c t
a r t i c l e i n f oArticle history:
We present the first steps Received 12 November 2007Received in revised form 5 September 2008Accepted 14 September 2008Available online 28 October 2008Editor: C.P. Jaupart
Keywords:thermal stressesdifferentiationmelt flowsillD-shape
of a new explanation model for differentiation in sills, using a combination ofgeochemical data and field observations, numerical modeling and dimensional analysis. Geochemical data from asaucer-shapeddolerite sill intruded into theKaroo basin, SouthAfrica reveal a differentiationprocesswhich causesD-shaped profiles. The geometry name is based on the variation inwhole-rock Mg-number (Mg#=Mg/(Mg+Fe))from floor to roof in a sill; the D-shaped geochemical profiles represent sheet-intrusions with the most primitivecomposition (i.e. highMg#) in its center, and progressively more evolved composition (i.e. lowMg#) towards theupper and lower margins. The differentiation is reversed compared to the normal differentiation produced byfractional crystallization (C-shaped profiles). C-shapedprofiles are believed to be formed by segregation of crystalsfrom the magma. We propose that the opposite, the D-shaped profile, may result frommelt segregation from thecrystalmush. This is achieved by porousmelt-flow through a consolidated crystal network after themainphase ofemplacement, and before complete solidification. We show that a significant flow is feasible under naturaloccurring conditions. An underpressure of magnitude 108 Pa develops at the cooling margins due to volumereduction of the crystallizing porous melt. The resulting pressure gradient is the driving force for the melt-flowtowards cooling margins considered in this work. As a result the margins will be enriched in the incompatibleelements associated with the melt phase, while the center will be depleted. We show that the amount of flow isprimarily a function of viscosity of the melt and permeability of the crystal network, which in turn is a transientphenomenondependent on anumberof parameters. Diagramshave been constructed to evaluate the feasibility ofsubstantial melt extraction in terms of these poorly constrained parameters. Data from the Golden Valley Sill andmany other natural occurrences of D- and I-shaped geochemical profiles show a reasonable agreement with ourpredictions ofmeltflow potential, and are thuswell explained by the presentedmodel.We conclude that in orderto fullyunderstanddifferentiationprocesses occurring in sheet intrusions,weneed to account for postemplacementsegregation of melt from crystals, and not only segregation of crystals from melt.
© 2008 Elsevier B.V. All rights reserved.
1. Introduction
Extensive sill and dyke complexes emplaced in sedimentary basinsare common in large igneous provinces found in several places aroundthe world, like the Karoo basin, South Africa, and the North Atlanticigneous province (e.g. Chevallier and Woodford, 1999; Du Toit, 1920;Planke et al., 2005). Detailed geochemical studies of such intrusivecomplexes reveal the complexity of the processes associated withcooling and crystallization of magmatic sheet-intrusions (Galerneet al., 2008). Profiles sampled from the floor to the roof of sillsshow variations in geochemistry which cannot be explained by theexisting theories for the emplacement and crystallization processes ofintrusive bodies. Some geochemical profile geometries arerepeatedly observed in sills and referred to as D-, I and S-shapedprofiles (Fig. 1) (e.g. Marsh, 1996; Latypov, 2003a and references
ll rights reserved.
therein). The geometry-notations are based on the variations in thewhole-rock Mg-number (Mg#=100⁎Mg/(Mg+Fetotal)) from floor toroof of a sill. The whole rock Mg# is used because magnesium ispreferentially partitioned into early-forming crystals such as olivineand pyroxene as compared to iron. A C-shaped profile shows the mostevolved composition (e.g. lowestMg#) in the center of the sill (Fig.1). AD-shaped profile, in contrast, shows the most evolved composition atthe sill-margins and progressively less evolved compositions (e.g.increasing Mg#) towards the center of the sill. The I-shaped profileshowsno variation throughout the sill and is in general believed to be aresult of closed-system crystallization (e.g. Mangan and Marsh, 1992;Marsh,1996). The S-shaped profile is an intermediate shape, with an I-or C-shaped upper part and a D-shaped lower partwithin the same sill,resembling a “beer belly”. One of the main problems with theformation mechanism of D-shaped profiles is that they cannot beexplained by classical fractional crystallization theory as developed forlarge plutons. Plutons are known to havemaficmargins and felsic cores(normal zoning), forming C-shaped geochemical profiles, like the

Fig. 1. A schematic drawing of a sill at one time-step during crystallization. The end- member geochemical profiles are I, D, C and S.
153I. Aarnes et al. / Earth and Planetary Science Letters 276 (2008) 152–166
Skaergaard intrusion (Wager and Brown, 1968; Naslund, 1984). Theformation of C-shaped profiles is interpreted as the result of magmaticdifferentiation by fractional crystallization (Wager and Brown, 1968).The presence of D-shaped profiles in many sills imply that we cannotdirectly apply theories developed for large magma chambers (3Dstructures of several kilometers thickness) to sheet-intrusions like sills(essentially 2D structures of commonly 10–200 m thickness).
Several models have been proposed for the formation of D-shapedprofiles, such as crystal settling and convection (e.g. Wager and Brown,
Fig. 2. The Karoo basin, South Africa. The Golden Valley Sill Complex chose
1968), multiple injections (e.g. Gibb and Henderson, 1992; Gibb andHenderson, 2006), flow differentiation causing phenocryst to concen-trate in the center of the sill (e.g. Simkin,1967; Richardson,1979;Marsh,1996), Soret fractionation in combination with in situ crystallization(Latypov, 2003a,b) or melt-flow into the margins (Cherepanov et al.,1982; this study). There is nogeneral agreement of oneparticularmodel.We will use our data to discuss the feasibility of these mechanisms.
We here present thefirst step in developing an alternative formationmechanism of D- shaped geochemical profiles. The model also explains
n for this study is located close to Queenstown in the Beaufort Group.

154 I. Aarnes et al. / Earth and Planetary Science Letters 276 (2008) 152–166
the formation of I- and S-shaped profiles, and has the potential ofexplaining other common phenomena observed in sills. Differentiationin a magmamay occur when crystals and melt are separated. C-shapedprofiles are believed to be formed by segregation of crystals from themagma.We propose that the opposite, the D-shaped profile, may resultfrommelt segregation fromthe crystalmush.Melt can segregate from itsequilibrium crystals by post-emplacement porous flow, thus causingdifferentiation by advection. We explore the possibility for such flow tobe induced by thermal stresses associated with cooling and crystal-lization of an intrusion. We have developed a numerical model toconstrain the conditions under which a substantial flowmay occur. Weassume that a stationary crystal network is formed during cooling andcrystallization, and thatmeltmayflow through this porous network.Wealso assume that the rigidity of the crystal network only allows anegligible volume change from the density change associated withcrystallization of the interstitial melt. The prevented volume change isaccommodated by an underpressure and subsequent flux of melt intothe zones of fastest crystallization along the sill margins.
This paper has three main sections: 1) Presentation of geochemicaland petrological data from a representative D-shaped profile, sampledfrom a tholeiitic sill in the Karoo igneous province, South Africa. Thedata are provided as a basis for the proposed differentiation modeland are, along with similar profiles reported in the literature, used toconstrain the validity of the numerical model. 2) Presentation of thenumerical model developed to evaluate the feasibility of post-emplacement flow under natural conditions. 3) Discussion of thepotential formation mechanisms of D- and I-shaped profiles based ondimensional analysis, numerical modeling and geochemical data.
2. Geochemistry and petrography of a D-shaped profile
2.1. Geological setting
A large volume of mafic magmawas emplaced as sills and dykes insedimentary strata during the Karoo volcanism (183±1 Ma ago;(Duncan et al., 1997). The Karoo intrusive event is a part of the Karoo–Ferrar large igneous province and has affected nearly two thirds ofsouthern Africa (e.g. Marsh et al., 1997; Chevallier and Woodford,1999; Le Gall et al., 2002). Extensive erosion has removed much of the
Fig. 3. a) The Golden Valley Sill with latitudinal and longitudinal coordinates. The Golden Vaon the west inclined sheet of the sill. b) The profile was sampled in an eroded gully. The uppsampled. Sampling points are shown with stars.
extrusives and revealed the underlying sill intrusions. The Karoo basinhas not been affected by major tectonic activity following emplace-ment and the sills have thus kept their original geometry.
The diameter and geometry of the sills are related to thestratigraphic level of intrusion. The sills forming the larger, sub-horizontal structures are intruded at the base of the Karoo sequence,while the smaller, sills (b10 km in diameter) intruded the upper partof the sequence (i.e. the Beaufort Group; Fig. 2) and they are alsocommonly saucer-shaped (Chevallier andWoodford, 1999). A group ofsaucer-shaped sills, the Golden Valley Sill Complex, located nearQueenstown, South Africa, was chosen for this study (Fig. 2).
2.2. Sampling
The Golden Valley Sill Complex was sampled in detail (Galerneet al., 2008). Geochemical profiles display varying shapes, includingD-, S- and I-shapes.We chose to focus on the profile showing themostprominent D-shape. This profile is sampled on the western inclinedsheet of the Golden Valley Sill (Fig. 3a). The Golden Valley Sill is themain sill of the complex. It is saucer-shaped, consisting of an inner,flat sill which continues into sheets that transgress radially upwardswith a 5–10° angle (Fig. 3a). The diameter across the shortest axis ofthe sill is ~10 km and the transgressive sheets are on average 100 mthick, but the thickness varies up to tens of meters along thetransgressive sheets. The sampling of a vertical wall ~100 m thickprovided some difficulties. The sampling of the profile was thereforedone in a gully, which made us able to climb and sample with fairlyuniform intervals (Fig. 3b). A sampling interval of 10–15 m wasjudged to be sufficient to display the general trend. The thickness ofthe inclined sheet in the gully was approximately 70m. The erosionallevel of the inclined sheet is on average less than 1m. However, at theprofile location some part of the sill roof (less than 10 m) was erodedaway due to the gully-effect. The upper sample of the profile istherefore located only 65m above the lower contact of the sill and thetotal number of samples is six.
The chemical variations of the presented profile from the GoldenValley Sill are identical to other reported D-shaped profiles (e.g.Richardson, 1979; Marsh, 1996; Gibb and Henderson, 1992 amongothers). We therefore regard the Golden Valley profile as representative
lley Sill is approximately 10 km across in the shortest direction. The profile was sampleder contact between the sill and the sediments has been eroded away and could not be

Table 1Whole-rock XRF data for the presented profile
K04AA-17
K04AA-16
K04AA-15
K04AA-14
K04AA-13
K04AA-12
%STD
Meter above contact 1 18 30 39 47 65
Major elements (wt.%)SiO2 51.82 52.03 51.57 51.44 52.02 52.31 0.09TiO2 1.01 0.96 0.95 0.93 0.92 0.97 0.08Al2O3 15.87 16.09 15.36 15.57 16.20 15.28 0.44Fe2O3 total 11.66 11.16 11.67 11.41 10.99 11.80 0.11MnO 0.18 0.18 0.18 0.18 0.17 0.19 0.00MgO 6.44 6.58 7.13 6.98 6.65 6.42 0.35CaO 10.64 10.76 10.81 10.89 10.86 10.37 0.15Na2O 2.18 2.26 2.12 2.14 2.23 2.18 0.40K2O 0.68 0.64 0.61 0.60 0.64 0.71 0.00P2O5 0.15 0.15 0.13 0.13 0.15 0.16 6.29L.O.I 0.15 0.09 0.02 0.00 0.11 0.19 0.00Sum 100.78 100.90 100.55 100.27 100.94 100.58 0.06
Trace elements (ppm)V 277 286 286 274 273 280 1.80Cr 296 341 384 362 346 269 1.70Co 45 46 49 48 45 48 1.20Ni 69 76 84 81 77 63 1.26Cu 102 91 95 92 83 98 0.86Zn 90 89 92 89 85 94 1.65Rb 17 15 16 15 14 16 4.09Sr 204 206 196 198 207 198 0.80Y 25 24 22 21 24 26 4.25Zr 96 88 87 89 90 101 1.68Nb 7 6 8 6 7 7 6.42
155I. Aarnes et al. / Earth and Planetary Science Letters 276 (2008) 152–166
of D-shaped profiles in general, although we were not able to samplethe very top of the sill. The profile is representative of the processwe want to study, i.e. the mechanism responsible for more primitivecomposition in the center of a sill relative to the margins. Furthermore,the Golden Valley profile makes a good basis for developing andconstraining the numerical model because we have access to acomplete set of information from mapping of the area, collecting thesamples and doing textural studies of thin-sections, along with thegeochemical data.
It is important to note that although D-shaped profiles have beenreported in the literature from sills in several areas, the study of theGolden Valley Sill Complex shows that a variety of different profileshapes occur in nature and may be found within a single sill.Furthermore, our data suggest that D- and I- shapes are less common(6 and 4 profiles, respectively) than S-shapes or other forms of“zigzag” profiles (N16 profiles) (data from Galerne et al., 2008).
2.3. Analytical methods
The samples discussed in this paper were analyzed for whole-rockmajor and trace element compositions by XRF at the University ofBergen. The XRF is a sequential spectrometer, Philips PW1404, withLIF200, LIF220, PE, GE, PX1 and PX5 crystals and a sample changerwith 12 positions, using the wavelength-dispersive system. Majorelement compositions are given in weight percent (wt.%) and traceelements are given in parts per million (ppm). The detection limit formost of the trace elements is approximately 5 ppm. The accuracy ofthe XRF analysis was measured using the USGS reference rockstandards W2 (a basaltic rock) and BCR1 (a monzonitic rock).
Electronmicroprobe (EMP) analyses of minerals were conducted atthe University of Oslo using a Cameca SX100 with integrated energydispersive spectrometer and 5 wavelength-dispersive crystal spectro-meters. The focused beam is 2 μm in diameter. Three measurementswere done within a small area at each point chosen for analysis, andthe average was used. For each analyzed mineral in each sample atleast two different grains were analyzed. The detection limit of theanalyses is on average 0.05 wt.%.
2.4. Geochemistry and petrography
The profile samples are medium to fine grained dolerite oftholeiitic composition. Themain phases are plagioclase, clinopyroxeneand orthopyroxene, with some olivine and late-stage oxides. Micro-scope analysis indicates that the profile has an overall homogeneousmodal composition through the profile. However, small differences inmodal compositions cannot be excluded. Plagioclase is found both aslarge crystal aggregates (~2 mm) and small groundmass laths(~0.5 mm). Olivine occurs as sub-hedral, single crystals (~0.5 mm)or clusters of generally smaller crystals (~0.2 mm). The pyroxenes arefound mostly as large oikicrysts (~2 mm), enveloping and filling thespaces between olivine and plagioclase laths. The oxides are onlyfound as oikicrysts (~0.5 mm). Olivine and plagioclase were the firstminerals on the liquidus, preceding the onset of crystallization ofpyroxenes; the oxides were latest. The textures and grain sizes areoverall homogeneous through the profile, although there is a slighttendency for larger plagioclase groundmass laths towards the center.
Compositional variations along the profile are presented in Tables 1and 2, and plotted for some elements (Fig. 4). Both stronglyincompatible (i.e. TiO2, K2O, V, Cu, Y and Zr) and strongly compatible(i.e. MgO, CaO, Cr and Ni) elements show the most primitivecomposition in the center and the most evolved compositions at thesill margins. Elements which are not favored by either the melt orcrystal phases show no particular trends. Mg# varies from 51.9 and52.2 at the upper and lower margins to 54.8 in the center, giving a D-shape (Fig. 4a). CaO (Fig. 4a) shows a similar trend. Na2O shows atendency for C-shape in the four central samples,while the twomargin
samples actually have slightly less content of Na2O (Fig. 4b). K2O showsa clear C-shape (Fig. 4b). The relative abundance of K2O compared toNa2O is higher at the margins than in the center. K2O behave like anincompatible element, while Na2O is preferred over K2O in theplagioclase structure. Ni and Cr, which are strongly compatibleelements with olivine and the pyroxenes, respectively, show identicalD-shaped profiles (Fig. 4c). Ni is ranging from 63 and 69 ppm at theupper and lowermargins, and 84 ppm in the center. Cr is ranging from269 and 296 ppm to 384 ppm. Zr is a strongly incompatible element,and thus shows the opposite curvature, with 101 and 96 ppm at theupper and lowermargins, and 87 ppm in the center (Fig. 4d). Y (Fig. 4d)is also strongly incompatible and shows the same curvature as Zr,although the curvature is sharper.
Olivine shows no zoning in individual crystals, suggesting thatthis mineral has re-equilibrated with the melt over time. The Mg# ofolivine shows a D-shape with the samples at the upper and lowermargins having Mg# of 33.5 and 33.0 respectively, and the centralsamples 39.3–41.5 (Fig. 4e). In the olivine profile the central sampleshave similar Mg# while the two margin samples deviate strongly.The pyroxenes show normal zoning from core to rim of individualcrystals although the average compositions vary little through theprofile. The plagioclase (measured in the core of the crystals) tendsto be more anorthitic in the center and more albitic at both margins(Fig. 4e).
3. Numerical modeling of post-emplacement melt flow
3.1. Presentation of the numerical model
Before we can start to argue whether post-emplacement flow cancause differentiation or not, we need to test the feasibility of such flowoccurring under natural conditions. In order to carry out the feasibilitystudy, we have developed a numerical model using the Finite ElementMethod in Matlab. The numerical model couples three mainprocesses: (1) Sill cooling and crystallization; (2) development ofpressure anomalies due to cooling; (3) melt flow driven by pressureanomalies (Fig. 5). We have chosen a simple case of sill cooling in

Table 2EMP analysis giving the composition of the main mineral phases through the presented profile
Sample K04 AA-17 K04 AA-16 K04 AA-15 K04 AA-14 K04 AA-13 K04 AA-12 K04 AA-17 K04 AA-16 K04 AA-15 K04 AA-14 K04 AA-13 K04 AA-12
Meter above contact 1 18 30 39 47 65 1 18 30 39 47 65
Orthopyroxene crystal-core (wt.%) Orthopyroxene crystal-rim (wt.%)
SiO2 51.67 49.73 34.65 52.41 50.36 51.42 50.85 49.19 50.03 50.93 49.52 49.74TiO2 0.33 0.30 0.18 0.25 0.43 0.34 0.31 0.27 0.39 0.42 0.32 0.18Al2O3 0.71 0.43 0.56 0.64 0.48 0.65 0.62 0.29 0.64 0.77 0.38 0.35FeO 24.73 31.50 15.18 25.58 30.04 25.05 28.02 33.25 29.59 26.44 32.74 32.23MnO 0.51 0.67 0.31 0.53 0.65 0.58 0.61 0.68 0.62 0.53 0.68 0.73MgO 18.16 14.58 12.97 18.86 15.23 17.91 15.88 13.22 14.67 16.02 13.27 14.01CaO 3.61 2.07 2.70 2.41 2.65 3.47 3.18 1.61 3.46 4.60 2.27 1.76Na2O 0.04 0.02 0.04 0.03 0.03 0.04 0.03 0.01 0.03 0.06 0.02 0.02K2O 0.01 0.01 0.00 0.00 0.00 0.01 0.00 0.02 0.00 0.00 0.01 0.01Cr2O3 0.02 0.01 0.02 0.02 0.02 0.02 0.01 0.00 0.01 0.02 0.01 0.01NiO 0.03 0.01 0.04 0.02 0.03 0.02 0.02 0.04 0.00 0.03 0.03 0.03Total 99.83 99.32 66.66 100.75 99.90 99.50 99.54 98.58 99.44 99.85 99.25 99.08
Clinopyroxene crystal-core (wt.%) Clinopyroxene crystal-rim (wt.%)
SiO2 52.76 47.18 51.34 52.64 52.49 51.92 50.56 49.99 50.08 51.07 50.32 49.78TiO2 0.27 0.67 0.50 0.33 0.37 0.38 0.79 0.63 0.66 0.55 0.84 0.77Al2O3 1.12 3.20 1.49 1.63 1.69 1.59 1.21 0.96 1.36 1.44 1.62 1.15FeO 10.01 13.44 10.98 8.47 8.90 9.31 18.34 17.68 15.52 15.21 16.20 17.44MnO 0.30 0.29 0.29 0.22 0.25 0.24 0.37 0.41 0.33 0.36 0.36 0.35MgO 15.58 12.52 15.39 17.24 16.83 16.89 11.89 11.58 13.21 13.29 12.93 12.30CaO 20.00 16.11 18.58 18.62 18.79 18.48 16.28 17.57 16.90 17.32 16.84 16.12Na2O 0.14 5.74 0.19 0.22 0.19 0.20 0.20 0.22 0.22 0.23 0.21 0.19K2O 0.01 0.03 0.01 0.01 0.01 0.00 0.00 0.02 0.00 0.00 0.01 0.00Cr2O3 0.08 0.21 0.19 0.47 0.29 0.13 0.01 0.01 0.14 0.16 0.04 0.03NiO 0.05 0.04 0.03 0.02 0.02 0.01 0.01 0.02 0.02 0.04 0.02 0.04Total 100.32 99.43 98.99 99.86 99.83 99.16 99.66 99.10 98.45 99.67 99.40 98.16
Olivine crystal-core (wt.%) Olivine crystal-rim (wt.%)
SiO2 32.49 32.55 32.86 33.14 33.84 32.21 32.53 32.68 32.99 32.94 33.62 32.41TiO2 0.03 0.02 0.03 0.02 0.02 0.02 0.03 0.01 0.04 0.03 0.02 0.03Al2O3 0.01 0.00 0.01 0.01 0.01 0.01 0.01 0.00 0.00 0.03 0.01 0.00FeO 51.36 47.56 48.17 48.26 47.19 52.01 52.30 46.71 48.09 48.26 47.28 51.91MnO 0.73 0.62 0.63 0.60 0.61 0.72 0.72 0.58 0.64 0.60 0.58 0.72MgO 14.47 18.19 17.53 17.56 18.76 14.38 13.81 18.42 17.33 17.52 18.24 14.51CaO 0.27 0.18 0.21 0.16 0.21 0.18 0.16 0.15 0.12 0.15 0.11 0.12Na2O 0.01 0.00 0.00 0.02 0.00 0.02 0.02 0.00 0.00 0.01 0.00 0.01K2O 0.00 0.00 0.01 0.00 0.01 0.00 0.01 0.01 0.00 0.01 0.00 0.00Cr2O3 0.01 0.01 0.00 0.01 0.00 0.01 0.02 0.02 0.00 0.02 0.00 0.01NiO 0.02 0.05 0.05 0.03 0.06 0.06 0.05 0.06 0.04 0.05 0.04 0.03Total 99.41 99.19 99.50 99.81 100.71 99.62 99.66 98.66 99.26 99.62 99.91 99.76
Plagioclase (wt.%)
SiO2 52.36 52.46 49.23 50.88 51.75 52.29TiO2 0.05 0.06 0.02 0.05 0.05 0.04Al2O3 29.04 28.61 30.87 30.19 29.76 29.53FeO 0.69 0.60 0.52 0.57 0.47 0.69MnO 0.01 0.01 0.02 0.01 0.02 0.02MgO 0.13 0.04 0.03 0.04 0.04 0.02CaO 12.71 12.60 15.10 13.98 13.66 13.09Na2O 4.13 4.29 2.94 3.58 3.72 4.08K2O 0.28 0.31 0.18 0.22 0.20 0.19Cr2O3 0.01 0.01 0.01 0.01 0.00 0.01NiO 0.01 0.03 0.02 0.01 0.00 0.01Total 99.43 99.02 98.93 99.56 99.66 99.97
Detection limit (wt.%)
opx cpx olivine plag
SiO2 0.02 0.02 0.03 0.02TiO2 0.02 0.02 0.02 0.02Al2O3 0.02 0.02 0.01 0.02FeO 0.06 0.07 0.06 0.06MnO 0.06 0.06 0.06 0.05MgO 0.03 0.03 0.03 0.02CaO 0.03 0.03 0.03 0.03Na2O 0.02 0.03 0.03 0.03K2O 0.02 0.02 0.02 0.02Cr2O3 0.05 0.05 0.05 0.06NiO 0.08 0.08 0.08 0.08
156 I. Aarnes et al. / Earth and Planetary Science Letters 276 (2008) 152–166

Fig. 4. Whole rock and olivine compositions showing the D-shaped profile. a) D-shape recognized by Mg#. CaO (5⁎wt.%) is superimposed to show that it follows approximately thesame trend. b) Na
2O (wt.%) and K2O (3.5⁎wt.%) show a similar trend for the central samples, but deviates at the margin samples where the relative amount of K
2O is higher. c) The
trace elements Ni (ppm) and Cr (ppm/4.5) show clear, and similar, D-shaped trends through the profile. d) The incompatible elements Zr (ppm) and Y (4⁎ppm) show opposite trendsof the D-shape, this is in agreement with less evolved melt in the center than at the margins. e) Mg# of olivine and Ca#/2 of plagioclase from the crystal cores. The olivinecompositions in the center are similar (Mg# around 40), but have a strong deviation at both margins (Mg# around 33). Plagioclase is more albitic at the margins and more anorthiticin the center. Both are following an approximate D-shaped trend.
157I. Aarnes et al. / Earth and Planetary Science Letters 276 (2008) 152–166
order to visualize and explain the key aspects of the model. Weconsider a 2D sill which may be infinitely long in the lateral direction.All physical properties are non-dimensionalized and the procedure isdescribed below. Description of physical parameters can be found inTable 3. The model and its applications are discussed further inSection 4 (Discussion).
The model is used to test whether melt displacement may arisefrom thermal stresses associated with melt-to-crystal transition, andto investigate factors controlling the maximum segregation of meltfrom crystals. In themodel, cooling progresses inwards from the upperand lower margins, causing a vertical melt-pressure gradient from thecenter to the margins. Thus the melt segregation is calculated forvertical flow in the sill. We would like to point out that in morecomplex systems, e.g. large sills, there can be several other possibilitiesfor melt to flow than just towards the margins, and that in a dynamicsystem there may be other driving forces like e.g. buoyancy promotinglateral or upward moving melt (e.g. Galerne, 2008; Tait and Jaupart,1992). Heat (step 1) and pressure (step 2) are solved using conductiontype equations for both sill and host-rock. Porous melt flow is solvedusing the Darcy equation, and is only solved for within the sill at the
Fig. 5. Schematic setup for the numerical model. Cooling and crystallization (1) is linked topartly crystallized network (3). The boxes illustrate the processes at one time- step during
condition of 55–90% crystals by volume (Fig. 1). The maximum meltsegregation potential, or cumulative displacement, is calculated byintegrating vertical melt flow velocity over total time (step 3). InSection 4 we present maximum melt displacements resulting fromseveral runs as a function of the most important parameters.
3.2. Equations and non-dimensionalization
The equations are solved on a 2D square grid with a resolution of100 by 400 elements. We solve the equations only before totalsolidification. The boundaries (no-flux condition) are located far awayfrom the intrusion to assure that they are not influencing our results.
Step 1 in the model is computed using the heat diffusion equation,
ATAt
¼ KeffT r2T; ð1aÞ
where T is the temperature and Keff is the thermal diffusivitycoefficient. The del-operator ▿ indicates that the equations can besolved for all spatial dimensions, however in this study we focus on
development of pressure anomalies (2) which in turn drives a porous flow through thecooling of the sill.

Table 3Description of physical parameters
Symbol Description Units
X System size md Sill thickness mP Pressure PaTm Initial temperature of melt KThr Initial temperature of host rock KTS Solidus temperature of melt KTL Liquidus temperature of melt KΔT Initial difference; Tm−Thr Kt Time sKT Thermal diffusivity (kheat/Cp/ρ) m2 s−1
kheat Thermal conductivity J m−1 K−1 s−1
Cp Specific heat capacity J kg−1 K−1
ρ Density kg m−3
KH Hydraulic diffusivity (χ/μ/β) m2 s−1
Χ Permeability of crystal network m2
µ Viscosity of melt Pa sβ Isothermal compressibility Pa−1
α Thermal expansion coefficient K−1
Utotal Total melt displacement mϕ Porosity (T−TS) / (TL−TS) %D Grain size mL Latent heat of crystallization J/m3
Ste Stefan number L/Cp/ρ / (TL−TS) –
Note that porosity is a linear function of temperature, where T=TL represents 100%melt,and correspondingly T=TS represents 100% crystals.
Fig. 6. Typical evolution of temperature in a 2D simulation in a dimensional version. Theboundary conditions are the same as in Fig. 8.
158 I. Aarnes et al. / Earth and Planetary Science Letters 276 (2008) 152–166
the vertical y-direction. The effective thermal diffusivity accounts forthe latent heat of fusion:
KeffT ¼ KT
1þ Stefor TsbTbTLð Þ
KeffT ¼ KT for TsNTð Þ
ð1bÞ
Non-dimensional ratio quantifying the effect of the latent heat isthe Stefan number, Ste, given by
Ste ¼ LTL−Tsð ÞρCP
ð1cÞ
where ρ is melt density, CP heat capacity and L the latent heat offusion per volume (note that KT also include ρ and CP). The initialconditions are: 1) The sill has an initial higher temperature, Tm, thanthe host rock, Thr. 2) The upper and lower margins of the sill (0.2% ofthe sill thickness) are initially set to a temperature intermediatebetween the initial temperature in the sill and that of the host-rock inorder to account for chilled margins formed during emplacement(Galushkin, 1997). 3) The thermal diffusivities are unequal for the silland the host-rock, due to their different thermal properties. In Fig. 6we show how the numerical model can be used to solve the heatconduction equation on the 2D grid for a dimensional case. The initialvalues used in this example are of little importance, as it is just one outof many possible scenarios.
In step 2, Eq. (1) is coupledwith pressure through thermal stresses,
dP ¼ αβdT ð2aÞ
as described by e.g. Turcotte and Schubert (2002), p. 172, assumingisochoric conditions for crystallization. Taking the partial derivative ofEq. (2a) with respect to time, our hydraulic equation becomes
APAt
¼ KHr2P þ αβATAt
ð2bÞ
where KH is the hydraulic diffusivity, P the pressure, α the volumetriccoefficient of thermal expansion and β the isothermal compressibility.The first part on the right hand side of Eq. (2b) describes the pressurediffusion (similar to heat conduction Eq. (1a)); the second partdescribes the development of pressure anomalies due to changes intemperature. The initial pressure is zero because the flow onlydepends on the developed pressure anomalies.
In step 3 we use the developed pressure gradients to calculate meltflow, following Darcy's law for flow in porous media,
Yvβ¼ −
χμβ
rP ¼ −KHrP ð3Þ
where v→
is the average velocity of the melt and β the isothermalcompressibility. Note that the standard equation is divided by β on bothsides to reduce the uncertainty of having permeability over viscosity (χ/μ) as a separate parameter in themodel. The Darcy velocity is integratedover time into total length of melt-displacement, U,
Uβ¼
Z t
0
jvyjβ
dt ð4Þ
As a consequence of Eq. (3), the left hand side of Eq. (4) is alsodivided by β.
The chosen values of physical parameters for Eqs. (1)–(4) (Table 3),along with initial conditions, will greatly influence the magnitude ofthe calculated flow. We introduce dimensional analysis to reduce thenumber of variables needed to solve the system of equations, andthus reduce the uncertainties of the model. The main goal of theanalysis is to identify the key parameters that influence the calculatedtotal displacement, Utotal.
To non-dimensionalize the equations we choose a set of indepen-dent new units (Table 4), ΔT=Tm−Thr, KH (hydraulic diffusion), d (sillthickness) and α/β (expansion coefficients). These independent para-meters are used to non-dimensionalize all other (dependent)parameters used in the following equations (Table 4). By introducing

Table 4Parameters used for non-dimensionalization, and the resulting non-dimensionalparameters
Scale Independent dimensional parameters
Temperature ΔT=Tm−Thr, initial temperature differenceDiffusion KH, hydraulic diffusion coefficientExpansion α/β, expansion coefficientsLength D, sill thicknessLatent heat⁎ Ste, ⁎already non-dimensional
Scale Dependent non-dimensional parameters
Temperature T′=T/ΔTSystem lengths ∇′=∇/d (i.e. x′=x/d, y′=y/d)Diffusion K′=KT/KH
Time t′= tKH/d2
Pressure P′=P/(α/βΔT)Velocity v′=v ·d/KH
Displacement U′=U /d
For symbol descriptions see Table 3.
Fig. 7. a) Varying the ratio KT/KH gives a linear relationship of KH/KT (note that the ratiois flipped) with displacement, resulting in Eq. (9a). The range of possible combinationsof parameters is wide, and does not necessarily correspond to conditions occurring innature. b) Plotting of Eq. (9a) for different values of Ste gives a data-collapse for valueswhere pressure (i.e. KH) is more dominant than temperature (i.e. KT). We get therelationship f(Ste)~0.06 (Eq. (9b)). Ste=0 corresponds to results with no latent heat.
159I. Aarnes et al. / Earth and Planetary Science Letters 276 (2008) 152–166
the non-dimensional parameters T′=T / ΔT, ∇′=∇/ d, K′=KT / KH andt′= tKH/d
2, Eq. (1a) becomes
AT0At0 ¼ K0r02T0 ð5Þ
Similarly, by introducing P′=P/(α/βΔT), Eq. (2) becomes
AP0At0 ¼ r02P0 þ AT0
At0 ð6Þ
and by introducing v′=v ·d/KH Eq. (3) becomes
v0 ¼ −r0P0 ð7Þ
Finally, the maximum total displacement is calculated by introdu-cing U′=U
→/d into Eq. (4)
U0 ¼Z t0
0jv0yjdt0 ð8Þ
The dimensional analysis gives that the only important parametersdetermining the system is K′=KT/KH and an unknown function of Ste.Thus, the total displacement becomes
Ud¼ KH
KTf Steð Þ ð9aÞ
Varying the ratioKT/KHwe find that displacement is a linear functionof KH/KT (i.e. flipped) in the pressure domain (KH dominates) (Fig. 7a).Flow is expectedwhen pressure build-up is dominating the system, andcooling is slow, i.e. the pressure domain. The Ste has an influence ondisplacement as long aswe are in the regimedominated by temperature(i.e. KT). Varying Ste corresponds to varying proportion of initial crystalcontent and thus varying release of latent heat of crystallization. At thecrossover, where pressure becomes the governing factor (and flow isexpected), the data collapses and the coefficient replacing f (Ste) isapproximately 0.06 (Fig. 7b). This gives us the formula,
UddKT
KH¼ f Steð Þ≈0:06 ð9bÞ
Or
U≈0:06KH
KTd ð9cÞ
which will be elaborated on in the discussion.
3.3. Assumptions
The numerical model is focused on the main processes associatedwith post-emplacement melt flow, and does not attempt to describethe full natural system. The model cannot predict the geochemical D-shape directly because it is not coupled to chemical evolution of thesystem.
The equations are based on well defined physical principles, andthe only major assumption in our model is isochoric condition. Inother words, we assume that thermal contraction or mechanicalcompaction of the crystal network is negligible for the area where wecalculate melt flow. The flow is calculated where the crystals form astationary, solid network with interstitial melt, i.e. 55–90% crystals byvolume. It is now recognized that magma chambers can be crystal-lized to a rigid, but not completely solid, crystal mush. A rheological“locking-point”, i.e. a stationary crystal network, forms when thevolume fraction of crystals exceeds 55% (Marsh, 1996), although for aplagioclase-rich system a considerable strength of the network can bereached with as low as 30% crystals (Philpotts and Carroll, 1996). Thestationary crystal network is an essential criterion for the geochemicaldifferentiation; if the crystals move along with the melt, nodifferentiation by flow occurs.
The Peclet number is set to 0, i.e. no feedback to the maintemperature profile due to advection of fluids in the contact aureole orinternal advection of melt. It would be interesting to investigatefurther implications of substantial melt-advection on the cooling and

Table 5Values used in numerical calculation (new basic parameters are all 1)
Nondimensional numbers Dimensional values assumed Values
(KT/KH)melt 1×10⁻⁶/2.0×10−6 0.5(KT/KH)host-rock 1×10⁻⁶/2.2×10−6 0.45(TS−Thr)/ΔT (900−100) /1100 0.72(TL−Thr)/ΔT (1200−100) /1100 1Length in y-direction 2.5×sill thickness 2.5×dLength in x-direction 5×sill thickness 5×dSte 300/(1200−900) 1Total time 1/2.0×10−6 1/KH
160 I. Aarnes et al. / Earth and Planetary Science Letters 276 (2008) 152–166
crystallization history of sills. However, this study is concentrated onthe implications of melt flow on chemical differentiation. Gravity isneglected because it is not a triggering mechanism for the flow.Gravity may, nevertheless, affect the flow pattern in natural systems.Eq. (1) assumes simplified linear dependency of melt fraction withtemperature in order to calculate the effect of the latent heat ofcrystallization. The effect of latent heat is important because it slowsdown the cooling and crystallization. Otherwise the cooling would beat least twice as fast, which would imply less time for melt flow tooccur. Nevertheless we show that for a realistic range of Ste, (whereSte=0 corresponds to no latent heat) the effect of latent heat (Ste=1)on calculated displacement is negligible (Fig. 7a). The effect of latentheat varies in the temperature domain where cooling dominates overflow (Fig. 7b). Ste has a constant value of ~0.06 in the pressure domainwhere dominant flow is expected. For simplicity we excludedtemperature dependency on thematerial properties, i.e. the diffusivityratio for the host-rock is constant with exception of the interval ofreleased latent heat. The validity of these assumptions is discussed inSection 4.1.
4. Discussion
4.1. Validity of model assumptions
The assumption of isochoric condition is obviously not true for allstages in the cooling process of a sill. Columnar jointing is, for
Fig. 8. Numerical results of a vertical cross-section of the sill intrusion. a) Temperature profilaccounting for latent heat of fusion. b) Melt percentage profile: the phase transition from munderpressure develops where the sill cools, while the heating of the host-rock results indisplacement profile: because the underpressure is larger at the margins (faster cooling) th
example, a strong indication of thermal contraction. The reasoningbehind the assumption of isochoric condition is that the densitychange due to temperature changes in a stationary, solid crystalnetwork is negligible compared to the density change caused bymelt-to-crystal transition in the interstitial melt due to the cooling. Ascrystallization continues in the interstitial melt, the latter “wants” tocontract much more that the rigid crystal network will allow, becauseno voids can develop. Since the volume is constant due to the rigidityof the network, an underpressure develops. To allow for the crystalnetwork to contract thermally will probably give a minor correction tothe developed underpressure, but would not change the main resultsof the calculations. The implication of the isochoric condition for thehost-rock is that pore-fluids want to expand much more than thesurrounding rock due to the increased temperature. The result will bea hydrostatic overpressure. Evidence for overpressure in the contactaureole of sills can be observed, for example in vent-structuresassociated with sill intrusions (Svensen et al., 2006; Svensen et al.,2007).
Linearity of Ste is a crude assumption, especially for eutecticcrystallization. However, the effect on cooling time by using a linearSte is negligible for melts of mafic composition in comparison withmore elaborated models for the Stefan number (Podladchikov andWickham, 1994; Turcotte and Schubert, 2002). Latent heat of crystal-lization is known to be one of themain processes related to sill coolingand crystallization. However, we show that processes like release oflatent heat, with only minor contributions compared to conduction,will have negligible influence on our final predictions. This strength-ens our assumption that we have included the most importantprocesses which will affect porous melt-flow by thermal stresses.
Constant diffusivity independent on temperature is obviously nottrue in nature. We could, for example, have made the permeabilityevolve with porosity (melt fraction). Melts tend to maintain aninterconnected network even though porosity decreases (e.g. Shirley,1986). Also, hot inflowofmelt may dissolve crystals on its way in orderto maintain local equilibrium thermodynamics, thus sustaining a localhigh permeability (Tait and Jaupart, 1992). Thus, the relationshipbetween permeability and porosity may not be trivial, and byincluding it we would have had to include additional assumptions.
e: the sill is cooling, while host-rock is heating according to the heat diffusion equation,elt to crystals is progressing inwards as the sill cools. c) Pressure anomaly profile: an
a positive pressure, according to the constitutive equation of thermal stresses. d) Meltan in the center (slower cooling), melt flows towards both margins.

161I. Aarnes et al. / Earth and Planetary Science Letters 276 (2008) 152–166
Likewise, the effective thermal expansion coefficient should vary,taking into account the density change of crystallization. Instead ofhaving parameters changing with temperature we solve the problemby varying our restricted set of key constants systematically by severalorders of magnitude to capture all possible combinations of e.g.permeabilities and expansion coefficients.
4.2. Application of the numerical model
The main aim of the numerical study is to find under whichconditions we can expect substantial flow and insignificant flow,respectively. D-shaped profiles can only result from a porous melt-flow if our calculations show that substantial flow in sills is possible.
The modeling of one case study uses the values listed in Table 5. Itis important to remember that the results for one chosen set ofparameters is not sufficient to decide whether or not this happened inthe Golden Valley Sill, because the details of the natural occurringparameters and their time evolution is not well enough constrained byour data.
The first stage of the modeling is characterized by cooling of the silland heating of the host rock as shown in Fig. 8a. With progressivecooling the crystallization frontmoves from the contacts towards the sillcenter (Fig. 8b). The second stage is characterized by the development ofpressure anomalies, P, due to changes in temperature (Fig. 8c).
Where the sill is cooling an underpressure develops. Where the hostrock is heated (in the contact aureole), an overpressure develops. Thenon-dimensional pressure P′=0.1 corresponds to a physical pressure ofP~108 Pa, for the chosen values of α=10−5 K−1, β=10−11 Pa−1 andΔT=103 K (see Section 3.2). The expansion coefficients used are typicalvalues for rocks (e.g. Turcotte and Schubert (Turcotte and Schubert, 2002,p.172). The pressure anomaly is of the samemagnitude as other studiesassociated with magmatic processes (Bachmann and Bergantz, 2006;Voight et al., 2006). The uniaxial compressive strength of fresh basaltexceeds 250MPawhich is sufficient to support our estimates of pressureanomalies (~100 MPa) (Hoek and Brown, 1997). This suggests that forthe system to re-equilibrate from the large developed thermal-stressanomalies, it is favorable to induce melt-flow as opposed to deform therigid network. However, we cannot exclude some degree of compactionin the partly crystallized regions.
There is a strong gradient going from the heated host-rock into thelow-pressurized sill margins, but we only consider flowwithin the sill.The cooling in the central parts of the sill is minor compared to that atthe margins, thus there is little or no anomaly developing in thecenter. The melt is “sucked” into the low-pressure margins from theless affected central parts as the cooling front moves inwards. Theresulting displacement, U/d, is shown in Fig. 8d. The maximum totaldisplacement corresponds to 20 m in a 100 m thick sill.
Twenty meters of displacement is a measure of the potentialchange in concentration. Advection can only change the compositionif there is a gradient in the melt composition, which is likely to bepresent due to the thermal gradient and different degrees ofcrystallization. We evaluate the instantaneous rate of melt extraction(Eq. (7)) and integrate over time in order to get maximum possiblemelt displacement from a given point (Eq. (8)). We therefore do nottrace the exact trajectories of themelt patches, but evaluate extractionpotential of melt at the given point. The sensitivity of extractionpotential to the variations in the input variables (e.g. the host-magmaheat diffusivity ratio) that vary within one order in magnitude is notconsidered here.
Commonly, in studies dealing with magma crystallization, meltpressure is assumed lithostatic and thermal stresses are notconsidered. There are exceptions, however, where non-lithostaticand coupled models for pressure evolution are used in e.g. numerousstudies of fluid circulation in contact aureoles (Delaney, 1982; Bartonet al., 1991; Podladchikov and Wickham, 1994; Ingebritsen andSandford, 1998) among others. Some studies document significant
transient pressure anomalies, which are comparable in magnitude tothe lithostatic pressure. In the specific context of dike or sill intrusionsthese were discussed by e.g. Litvinovski et al. (1990); Tommasini et al.(1997) and Jamtveit et al. (2004). Litvinovski et al. (1990) documentedquartz grain crushing and melting of the host-rock, combined withcontact melt injecting into intruded magma, as evidence for increasedpressure in the contact aureole. Tommasini and Davies (1997) alsoargue for pressure rise in order to explain contact melting. Jamtveitet al. (2004) focus on explaining vent overpressure associated with sillintrusions. All these previous studies are focused on transient pressureanomalies developing in the contact aureoles. In this study weexamine pressure anomalies developing within the crystallizingmagma.
4.3. Model feasibility using dimensional analysis
To test the feasibility of themodel, we have to relate the relationshipobtained in the dimensional analysis to physical parameters within afeasible range of values. Rewriting Eq. (9c), the relationship betweendisplacement and the diffusivity ratio becomes
Ud≈0:06
χμβKT
ð10Þ
Two of the least constrained parameters in Eq. (10) are thepermeability of the crystal network, χ, and the viscosity of the melt,μ (parts of KH, Table 3). These parameters indeed may vary byseveral orders of magnitude within one magmatic system, depend-ing on factors like temperature and crystal size. We choose thevalues for thermal diffusivity (K) of 10−6 ms2 s−1 (Delaney, 1988),isothermal compressibility (β) of 10−11 Pa−1, and put them into Eq.(10) to get
Ud¼ 6� 1015 χ
μ
� �ð11Þ
which shows how total melt displacement responds to differentvalues of viscosity (μ) and permeability (χ) in the calculations. Thisrelationship is plotted in Fig. 9, where the contours represent themagnitude of the displacement. We set a rough transition zonebetween the D-shape and I-shape regimes at above 10% of the sillthickness (U/dN0.1).
The results (Fig. 9) suggests that in a melt of basaltic viscosity (i.e.~102 Pa s), we have significant flow when the permeability of the crystalnetwork is above 10−14 m2, corresponding to ~99% crystallinity of abasaltic rock (Hersum et al., 2005) showing flow is feasible for naturaloccurring conditions.
S-shaped profiles, or other intermediate shapes, probably form in thetransition zone between the D-shape and the I-shape regime, requiringless melt flow than D-profiles. There is also a possibility that the S-shaped, or beer belly, profiles are a combination of porous meltsegregation with some other processes, like compaction. In general,other formation mechanisms for the S-shaped profile cannot beexcluded by the results in this study. However, only the classical andwell documented process for magma evolution in large plutons, that is,gravitational settling, is needed in addition to the process advocated inthis study to explain the formation of more complex shapes. Indeeddownward settling combinedwithD-shape-porousflowwould result ina beer belly-profile.
4.4. Formation mechanisms of D-shaped geochemical profiles
The D-shaped and I-shaped geochemical profiles are endmembersused to categorize observed profiles. The D-shaped profile represents

Fig. 9. The response in melt displacement for different viscosities and permeabilities. Amelt of basaltic viscosity requires a permeability of the crystallizing network having amagnitude above 10−14 m2 to be able to create a substantial flow.
162 I. Aarnes et al. / Earth and Planetary Science Letters 276 (2008) 152–166
the process we aim at understanding, i.e. why a sill can have the leastevolved composition in the center and the most evolved compositionat its upper and lower margins.
Petrographic observations from the Golden Valley Sill show noevidence for larger concentrations of phenocrysts in the center of thesill as compared to its margins. The occurrence of D-shaped profiles inphenocryst-poor melts has previously been pointed out as aweaknessof the flow differentiation model (e.g. Latypov, 2003a,b). In additionBarriere (1976) has shown that crystal segregation is practicallyinoperative for sills with thickness of 100 m or more. Olivine is only aminor phase, so the phenocryst assemblage consists mostly ofplagioclase. Plagioclase does not partition MgO from FeO and cantherefore not be responsible for the observed Mg# profile. Thus, flowsegregation is unlikely to be the major differentiation mechanism,although some variations in the phenocryst distribution cannot beexcluded.
There is no evidence for a second intrusion in the Golden ValleySill. The samples are all homogeneous, and the geochemical profilesshow no abrupt changes. The field observations strongly suggest oneintrusion causing the Golden Valley Sill. Where the Golden Valley Sill
Fig.10. a) A schematic drawing of the flowprocess at one time-step during crystallization. Earcentral parts and into the margins, thus depleting the center and enriching the margins in inThe resulting geochemical profile will be according to b).
is in direct contact with another sill there is clear evidence of twoseparate intrusions, both by observations and geochemistry (Galerne,in press). We cannot exclude the possibility of continuous infill,although this requires a source of continuouslymore primitivemagmain order to explain the D-shape. However, D-shapes are occurring inlava flows where there is clearly one single pulse (Latypov, 2003b andreferences therein).
Soret fractionation (thermal diffusion) is a process that causes theheavy components (e.g. Fe) to migrate toward the colder end of athermal gradient, and the lighter components (e.g. Mg) to migratetowards the hotter end. The geochemical data on the Golden Valley Sillshow strong evidence against Soret fractionation. If heavy elementsmigrate towards the coolingmargins, wewould expect the same trendfor all elements of differingmolecular weight. In contrast, Ca increasestowards the center of the sill and Na towards the margin, although Cais heavier than Na. Also Ni and Cr are enriched in the center althoughthe molecular weights are within the same range as Fe (Fig. 4).
The presented model of post-emplacement flow explains well thesymmetrical behavior of the geochemical data, and strengthens theassumption that gravity is not an important factor. Gravity settling isexpected to result in more asymmetric profiles (e.g. Gibb andHenderson, 1992). The overall efficiency of gravity settling as adifferentiation mechanism in sills is largely questioned (Shirley, 1987;Marsh, 1988, 1989). In large magma chambers, however, settling ofcrystals behaving as effective dense plumes may occur (Brandeis andJaupart, 1986).
It is widely recognized that the main cause of melt differentiationoccurs when melt and crystals are segregated, for example by crystalsettling, or by compositional convection (Kerr and Tait, 1986; Tait andJaupart, 1992; Jaupart and Tait, 1995). Post-emplacement melt-flowhas the potential of causing differentiation by advective transport(Fig.10a). An outwards flux ofmelt from the central parts of the sill canincrease the content of compatible elements in the center, and thecontent of incompatible elements in the distal parts. The resultingprofile of whole-rock geochemistry will be D-shaped (Fig. 10b).
Normal zoning observed in the pyroxenes suggests that fractiona-tion of the melt occurs continuously throughout the whole magmabody implying that melt becomes increasingly enriched in incompa-tible elements compared to the crystals. This favors the presence of acompositional melt-gradient from the center to the margins. Forexample, plagioclase is more anorthitic in the center and more albiticin themargins. The proportion of olivinemay be too small to influencethe whole-rock Mg# significantly, although the olivine crystals also
ly forming crystals aremainly plagioclase and do not affect theMg#. Melt flows from thecompatible and less incompatible elements, and vice versa for the compatible elements.

Fig. 11. Permeability as a function of grain size and viscosity as a function ofcomposition. The probability of getting a significant flow increases with longercooling time and lower silica content. For 10% porosity the various occurrences of D- andI-shaped profiles plot within the domains of significant and no flow, respectively,showing a good agreement with our predictions.
163I. Aarnes et al. / Earth and Planetary Science Letters 276 (2008) 152–166
show the D-shaped trend with the largest changes towards themargins. This is in agreement with the pressure gradients beinglargest at the margins where cooling is most rapid, thus giving thestrongest driving force for the melt flow. Assuming that we start witha homogeneous intrusion, no flow will result in an I-shaped profile(closed system crystallization).
Melt can ultimately be drawn from areas that have less than 55 vol.% crystals, and mechanical compaction or inflow from other parts ofthe sill will make sure no voids develop where the last melt extractionoccurs. If the entire sill, contemporaneously and in all directions, has acrystal-content above the limit of mechanical compaction, the sill willhave a relatively flat cooling gradient. Hence, there will be no stronginternal pressure gradients. In such settings post-emplacement flowshould not be expected.
There are several studies suggesting that reactive-advective melt-flow will cause changes in geochemistry (McKenzie, 1984; Navon andStolper, 1987; Spiegelman, 1996; Hauri, 1997; Spiegelman et al., 2001;Steefel et al., 2005). Weinberg (2006) stresses that segregationprocesses are very important for our understanding of the physicalprocesses that lead to chemical and mineralogical differentiation inmagmas. A study by Johnson et al. (2003) suggests that also thethermal, compositional and rheological gradients in the host-rocksmay influence directions of pluton expansion. Rabinowicz et al. (2001)ask for physical processes that are capable of inducing strongvariations in the melt/rock ratio.
4.5. Application to the Golden Valley Sill
The result of the numerical modeling (Fig. 9) can be applied to theGolden Valley Sill, and other natural systems in terms of measurablequantities. The permeability, χ, of the crystal network is a function ofgrain size and porosity (i.e. melt percentage), which in turn arefunctions of cooling time. To get a rough measure of permeabilityexpressed in average grain size we use the Carman (1956) relationship
χ ¼ D2
114/3
1−/ð Þ3ð12Þ
where 114 is a fit parameter (Hersum et al., 2005), D—
is mean crystallength in meters and ϕ is porosity of the crystal network (meltfraction). We set the porosity to 10%, i.e. 90% crystals. Viscosity is afunction of the chemical composition of themelt. We use themodel ofGiordano and Dingwell (2003) to describe the viscosity of multi-component silicate melts. Viscosity is linked to composition by
log10μ ¼ c1 þ c2c3c3 þ SM
ð13Þ
where SM=Σ(Na2O+K2O+CaO+MgO+MnO+FeOtot/2). Lower SMnumber corresponds to higher viscosity. c1, c2 and c3 representadjustable parameters,
c1 ¼ −17:80106þ 0:018708103T -Cð Þ1−2:2869� 10−3T -Cð Þ
c2 ¼ 0:02532þ 2:5124expð−6:3679� 10−3T -Cð Þþ40:4562� 10−6T -Cð Þ−1
c3 ¼ 1−1:6569� 10−3T -Cð Þ0:017954−63:90597� 10−6T -Cð Þ
:
The result of these conversions is plotted in Fig. 11, and can be useddirectly to comparewith natural cases. The samples in this studyhave anaverage grain size of 1 mm, and an average SM of ~31. Thus, the profileplots within the regime of significant flow where D-shape is feasible.
A representative I-shaped profile from another part of the GoldenValley Sill has an average grain size of ~0.5 mm and a SM number of~25 (Galerne et al., 2008). A D-shaped profile from a sill underlyingthe Golden Valley Sill has an average grain size of ~0.75 mm and anaverage SM number of ~32 (Galerne et al., 2008). The local variationsfrom sills that are overall homogeneous seem to be sufficient toseparate between substantial flow and insignificant flow. Thus, themodel can explain occurrences of different profiles within one sill byvarying degrees of flow.
In Fig. 11 we have also plotted examples of D- and I-shaped profilesreported in the literature. Richardson (1979) reports a D-shape fromthe Tandjiesberg sill (80–110 m thick), South Africa. The SM number~26 is calculated on basis of bulk compositions and average of solid(from Table 5 in the paper Richardson, 1979). Grain sizes vary from 0.2at the margins to 2–3 mm in the center. An average of ~1 mm is used.Gunn (1966) gives data from a D-shape (with some tendenciestowards S-shape) from the Lake Vanda sill (332 m thick), Antarctica.The SM number varies from ~25–32 (Table 8 in the paper of Gunn,1966), and the average is used. Reported grain sizes are 1–4 mm. Wehave used 1.25 mm. Gunn (1962) gives data for a profile with limitedvariation (I-shape) from the Peneplain sill (330 m thick), Antarctica.The SM number is ~23 (at the center). Crystal sizes vary from 0.4–1 mm. An average of 0.7 mm is used. Gibb and Henderson (2006)published data from the Shiant Isles Main Sill, Scotland, composed ofmultiple intrusions. One batch of crinanite shows an approximate I-shape, while a lower batch of picrite shows a nice D-shape. The SMnumbers of the two batches are clearly different, the I-shape having aSM number of ~27 and the D-shape having a SM number of ~41. Thecrinanite has an average grain size of b0.75 mm (Gibb and Henderson,1996). We have visualized the crinanite data for a grain size of~0.6 mm. The grain size for picrite is reported as “large”, hence adashed star is used at ~0.8 mm, as a conservative value.
The natural examples fit very well with the predictions of themodel. The examples were all from relatively low-viscosity melts ofmafic compositions. A viscous granitic melt with higher SiO2-content(lower SM) is less likely to segregate from the crystal network,although evidence for segregation in granitic bodies has been reported(Weinberg, 2006). It is not obvious that our transition zone betweensubstantial and insignificant flow is correct. The boundary betweenthe D- and I-regime should therefore be shifted if other observationsshow a significant misfit between observed data and our model. The
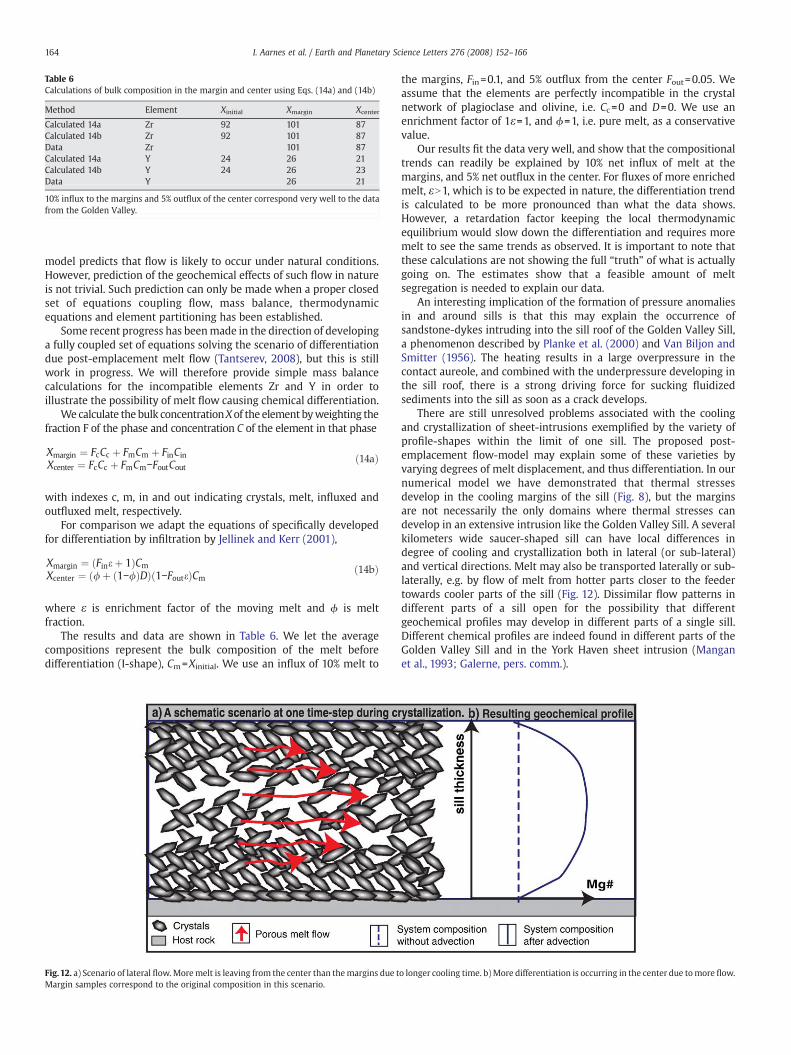
Table 6Calculations of bulk composition in the margin and center using Eqs. (14a) and (14b)
Method Element Xinitial Xmargin Xcenter
Calculated 14a Zr 92 101 87Calculated 14b Zr 92 101 87Data Zr 101 87Calculated 14a Y 24 26 21Calculated 14b Y 24 26 23Data Y 26 21
10% influx to the margins and 5% outflux of the center correspond very well to the datafrom the Golden Valley.
164 I. Aarnes et al. / Earth and Planetary Science Letters 276 (2008) 152–166
model predicts that flow is likely to occur under natural conditions.However, prediction of the geochemical effects of such flow in natureis not trivial. Such prediction can only be made when a proper closedset of equations coupling flow, mass balance, thermodynamicequations and element partitioning has been established.
Some recent progress has beenmade in the direction of developinga fully coupled set of equations solving the scenario of differentiationdue post-emplacement melt flow (Tantserev, 2008), but this is stillwork in progress. We will therefore provide simple mass balancecalculations for the incompatible elements Zr and Y in order toillustrate the possibility of melt flow causing chemical differentiation.
We calculate the bulk concentrationXof the element byweighting thefraction F of the phase and concentration C of the element in that phase
Xmargin ¼ FcCc þ FmCm þ FinCinXcenter ¼ FcCc þ FmCm−FoutCout
ð14aÞ
with indexes c, m, in and out indicating crystals, melt, influxed andoutfluxed melt, respectively.
For comparison we adapt the equations of specifically developedfor differentiation by infiltration by Jellinek and Kerr (2001),
Xmargin ¼ Fineþ 1ð ÞCmXcenter ¼ /þ 1−/ð ÞDð Þ 1−Fouteð ÞCm
ð14bÞ
where ε is enrichment factor of the moving melt and ϕ is meltfraction.
The results and data are shown in Table 6. We let the averagecompositions represent the bulk composition of the melt beforedifferentiation (I-shape), Cm=Xinitial. We use an influx of 10% melt to
Fig.12. a) Scenario of lateral flow.Moremelt is leaving from the center than themargins due tMargin samples correspond to the original composition in this scenario.
the margins, Fin=0.1, and 5% outflux from the center Fout=0.05. Weassume that the elements are perfectly incompatible in the crystalnetwork of plagioclase and olivine, i.e. Cc=0 and D=0. We use anenrichment factor of 1ε=1, and ϕ=1, i.e. pure melt, as a conservativevalue.
Our results fit the data very well, and show that the compositionaltrends can readily be explained by 10% net influx of melt at themargins, and 5% net outflux in the center. For fluxes of more enrichedmelt, εN1, which is to be expected in nature, the differentiation trendis calculated to be more pronounced than what the data shows.However, a retardation factor keeping the local thermodynamicequilibrium would slow down the differentiation and requires moremelt to see the same trends as observed. It is important to note thatthese calculations are not showing the full “truth” of what is actuallygoing on. The estimates show that a feasible amount of meltsegregation is needed to explain our data.
An interesting implication of the formation of pressure anomaliesin and around sills is that this may explain the occurrence ofsandstone-dykes intruding into the sill roof of the Golden Valley Sill,a phenomenon described by Planke et al. (2000) and Van Biljon andSmitter (1956). The heating results in a large overpressure in thecontact aureole, and combined with the underpressure developing inthe sill roof, there is a strong driving force for sucking fluidizedsediments into the sill as soon as a crack develops.
There are still unresolved problems associated with the coolingand crystallization of sheet-intrusions exemplified by the variety ofprofile-shapes within the limit of one sill. The proposed post-emplacement flow-model may explain some of these varieties byvarying degrees of melt displacement, and thus differentiation. In ournumerical model we have demonstrated that thermal stressesdevelop in the cooling margins of the sill (Fig. 8), but the marginsare not necessarily the only domains where thermal stresses candevelop in an extensive intrusion like the Golden Valley Sill. A severalkilometers wide saucer-shaped sill can have local differences indegree of cooling and crystallization both in lateral (or sub-lateral)and vertical directions. Melt may also be transported laterally or sub-laterally, e.g. by flow of melt from hotter parts closer to the feedertowards cooler parts of the sill (Fig. 12). Dissimilar flow patterns indifferent parts of a sill open for the possibility that differentgeochemical profiles may develop in different parts of a single sill.Different chemical profiles are indeed found in different parts of theGolden Valley Sill and in the York Haven sheet intrusion (Manganet al., 1993; Galerne, pers. comm.).
o longer cooling time. b)More differentiation is occurring in the center due tomore flow.

165I. Aarnes et al. / Earth and Planetary Science Letters 276 (2008) 152–166
Post-emplacement melt flow may explain geochemical variationsin several magmatic intrusions were former models have failed. Withvery few assumptions we have shown that post-emplacement flow isfeasible under natural conditions, and also compatible with geochem-ical observations from several sills and the formation of D-shapedprofiles.
4.6. Geological significance
Zones adjacent to the basal contact of large intrusions areexpected to be fully crystallized in situ before the onset ofcompositional convection. If negligible mass transport occurs, thesame final rock composition should be found at all levels (I-shape).The basal zone of the Stillwater Complex (Page, 78, Jaupart and Tait,1995) becomes progressively enriched in pyroxene and olivine upfrom the contact (D-shape). This progression may be interpreted asrecording the advection of fresh melt towards more crystallizedcooling margins (see Jaupart and Tait, 1995). For large-scaledifferentiation to be efficient a large amount of melt is expected to“flush” through the system. An extensive influx of melt towards themargins would require a corresponding outflux. Such outflow isexpected to be localized into narrow zones (Jaupart and Tait, 1995).Vertical or subvertical segregation veins, pegmatitic structures andevolved pipe-like bodies are indeed found to crosscut the horizontallayering in several sills, like the Bushveld intrusion, South Africa(McKenzie, 1984; Hauri, 1997), the Stillwater Complex, Montana(Navon and Stolper, 1987), the Peneplain Sill, Antarctica (Spiegelman,1996), and also in the upper and lower part of 1959 Kilauea Iki lavalake (Spiegelman et al., 2001; Steefel et al., 2005;Weinberg, 2006), oras “sandwich horizon” of incompatible elements in the Palisades Sill(Shirley, 1987). Flow induced by thermal stress, combined with localbuoyancy effects from either composition or thermal differences,may help to explain these occurrences in the ca.100 m basal zones oflarge intrusions. These are not directly linked to formation of D-shape, but confirm that segregation processes are highly present insills.
Modal mineral zoning is the ultimate degree of compositionalsegregation that can be achieved by reactive melt flow. Chromato-graphic columns are commonly found in sills (e.g. Jaupart and Tait,1995; Latypov, 2003b, and references therein), and can also display D-shaped geochemical profiles. The modal layers in such sills can beregarded as metasomatic columns where the chemical fronts areformed due to a differential movement of melt relative to crystals(Guy, 1993; Korzhinskii, 1973). Thermal stress induced by cooling is astrong driving force with the potential of segregating large amounts ofmelts from its equilibrium solids. Thus, post-emplacement flow canreadily explain D-shaped profiles in sheet-intrusions of variable typesand sizes.
5. Conclusions
D-shaped geochemical profiles in sills are formedby a differentiationprocess which causes the upper and lower margins to have a moreevolved composition than the center of the sill.Where nodifferentiationoccurs we get I-shaped profiles. We propose that the differentiation iscaused by a separation of melt from crystals by a porous melt flowthrough a rigid crystal network. Thermal stresses associated with thecooling and crystallization of the sill is a feasible driving force forsubstantial porous-flow. Numerical modeling and dimensional analysishave shown that 1) cooling of sills leads to large underpressure withinthe sill, while heating of the host-rock leads to large over-pressure in thecontact aureole; 2) the underpressure can drive a substantial melt flowafter the main emplacement episode of a sheet-intrusion and 3) asubstantial melt flow is feasible under natural occurring conditions, likethe case of theGoldenValley Sill; 4) themain factors controlling thefloware the viscosity of themelt (i.e. geochemistry) and the cooling time (i.e.
grain sizes); 5) data from this study combined with other studiescoincide well with the predicted conditions for substantial andinsignificant flow. Our results strongly suggest that post-emplacementmelt flow is an important, and previously overlooked, factor indifferentiation of sill intrusions.
Acknowledgements
This study was supported by the Norwegian Research Council(grant 159824/V30, “Emplacement mechanisms and magma flow insheet intrusions in sedimentary basins”) through PGP, a Center ofExcellence at the University of Oslo. We thank professor Julian(Goonie) Marsh, Rhodes University, Department of Geology inGrahamstown, South Africa, for supplying field equipment, thefarmers whose land we were accessing, and K. Haaberg, S. Polteauand C. Galerne for assistance and collaboration during and after fieldwork. H. Svensen, O. Galland, G. Gisler and B. Jamtveit are thanked forassistance and discussions. We would also like to thank Richard Kerrand two anonymous reviewers for constructive comments whichled to substantial improvement of the manuscript. Thanks toM. Erambert for electron microprobe analytical support and R. Latypovfor discussions and useful references.
References
Bachmann, O., Bergantz, G.W., 2006. Gas percolation inupper-crustal silicic crystalmushesas a mechanism for upward heat advection and rejuvenation of near-solidus magmabodies. J. Volcanol. Geotherm. Res. 149, 85–102.
Barriere, M., 1976. Flowage differentiation — limitation of Bagnold effect to narrowintrusions. Contrib. Mineral. Petrol. 55, 139–145.
Barton, M.D., Staude, J.M., Snow, E.A., Johnson, D.A., 1991. Aureole systematics. Rev.Miner. 26, 723–847.
Brandeis, G., Jaupart, C., 1986. On the interaction between convection and crystallizationin cooling magma chambers. Earth Planet. Sci. Lett. 77, 345–361.
Carman, P.Z., 1956. Flow of Gases Through Porous Media. Butterworths, London.Cherepanov, A.N., Sharapov, V.N., Krivenko, A.P., 1982. A possible mechanism of the
antidromic differentiation in the basic plutons. Dokl. Akad. Nauk SSSR 267,1204–1207.Chevallier, L., Woodford, A., 1999. Morpho-tectonics and mechanism of emplacement
of the dolerite rings and sills of theWestern Karoo, South Africa. S. Afr. J. Geol. 102,43–54.
Delaney, P.T., 1982. Rapid intrusion of magma into wet rock— groundwater-flow due topore pressure increases. J. Geophys. Res. 87, 7739–7756.
Delaney, P.T.,1988. Fortran-77 programs for conductive cooling of dikeswith temperature-dependent thermal-properties and heat of crystallization. Comput. Geosci. 14,181–212.
Duncan, R., Hooper, P., Rehacek, J., Marsh, J., Duncan, A.,1997. The timing and duration ofthe Karoo igneous event, southern Gondwana. J. Geophys. Res. 102, 18127–18138.
Du Toit, A.L., 1920. The Karoo dolerites of South Africa: a study in hypabyssal injection.Trans. Geol. Soc. S. Afr. 23, 1–42.
Galerne, C., in press. Emplacement mechanisms and magmatic differentiation inducedby magma flow in sill intrusions in sedimentary basins, University of Oslo.
Galerne, C., Neumann, E.R., Planke, S., 2008. Emplacement mechanisms of sillcomplexes: information from the geochemical architecture of the Golden ValleySill Complex, South Africa. J. Volcanol. Geotherm. Res. 177, 425–440.
Galushkin, Y.I., 1997. Thermal effects of igneous intrusions on maturity of organicmatter: a possible mechanism of intrusion. Org. Geochem. 26, 645–658.
Gibb, F., Henderson, C., 1992. Convection and crystal settling in sills. Contrib. Mineral.Petrol. 109, 538–545.
Gibb, F.G.F., Henderson, C.M.B., 1996. The Shiant Isles Main Sill: Structure and mineralfractionation trends. Mineral. Mag. 60, 67–97.
Gibb, F.G.F., Henderson, C.M.B., 2006. Chemistry of the Shiant Isles Main Sill, NW Scotland,and wider implications for the petrogenesis of mafic sills. J. Petrol. 47, 191–230.
Giordano, D., Dingwell, D.B., 2003. Non-Arrhenian multicomponent melt viscosity: amodel. Earth Planet. Sci. Lett. 208, 337–349.
Gunn, B.M., 1962. Differentiation in Ferrar Dolerites, Antarctica. Am. Mineral. 47 191-&.Gunn, B.M., 1966. Modal and element variation in Antarctic tholeiites. Geochim.
Cosmochim. Acta 30, 881–920.Guy, B., 1993. Mathematical revision of Korzhinskii theory of infiltration metasomatic
zoning. Eur. J. Mineral. 5, 317–339.Hauri, E.H., 1997. Melt migration and mantle chromatography, 1: simplified theory
and conditions for chemical and isotopic decoupling. Earth Planet. Sci. Lett. 153,1–19.
Hersum, T., Hilpert, M., Marsh, B., 2005. Permeability and melt flow in simulated andnatural partially molten basaltic magmas. Earth Planet. Sci. Lett. 237, 798–814.
Hoek, E., Brown, E.T., 1997. Practical estimates of rock mass strength. Int. J. Rock Mech.Min. Sci. 34, 1165–1186.
Ingebritsen, E., Sandford, W.E., 1998. Groundwater in Geological Processes. CambridgeUniversity Press. 340 pp.

166 I. Aarnes et al. / Earth and Planetary Science Letters 276 (2008) 152–166
Jamtveit, B., Svensen, H., Podladchikov, Y.Y., 2004. Hydrothermal vent complexesassociated with sill intrusions in sedimentary basins. In: Breitkreuz, C., Petford, N.(Eds.), Physical Geology of High-level Magmatic Systems 234, Geological Society.Special Publications, London.
Jaupart, C., Tait, S., 1995. Dynamics of differentiation in magma reservoirs. J. Geophys.Res.-Solid Earth 100, 17615–17636.
Jellinek, A.M., Kerr, R.C., 2001. Magma dynamics, crystallization, and chemical differentia-tion of the 1959 Kilauea Iki lava lake, Hawaii, revisited. J. Volcanol. Geotherm. Res.110,235–263.
Johnson, S.E., Fletcher, J.M., Fanning, C.M., Vernon, R.H., Paterson, S.R., Tate, M.C., 2003.Structure, emplacement and lateral expansion of the San Jose Tonalite pluton,Peninsular Ranges batholith, Baja California, Mexico. J. Struct. Geol. 25, 1933–1957.
Kerr, R.C., Tait, S.R.,1986.Crystallization and compositional convection inaporous-mediumwith application to layered igneous intrusions. J. Geophys. Res.-Solid Earth and Planets91, 3591–3608.
Korzhinskii, D.S., 1973. Theory of metasomatic zoning. A Reply to Hofmann, A., Dr. Am.J. Sci. 273, 958–959.
Latypov, R., 2003a. The origin of basic–ultrabasic sills with S-, D- and I-shapedcompositional profiles by in situ crystallization of a single input of phenocryst-poorparental magma. J. Petrol. 44, 1619–1656.
Latypov, R., 2003b. The origin of marginal compositional reversals in basic–ultrabasicsills and layered intrusions by Soret fractionation. J. Petrol. 44, 1579–1618.
Le Gall, B., Tshoso, G., Jourdan, F., Feraud, G., Bertrand, H., Tiercelin, J.J., Kampunzu, A.B.,Modisi, M.P., Dyment, J., Maia, M., 2002. Ar-40/Ar-39 geochronology and structuraldata from the giant Okavango and related mafic dyke swarms, Karoo igneousprovince, northern Botswana. Earth Planet. Sci. Lett. 202, 595–606.
Litvinovski, B.A., Podladchikov, Y.Y., Zanvilevitch, A.N., Dunitchev, V.M., 1990. On themeltingof acidicvolcanites in the contact of basicmagmaat shallowdepth.Geochimya6, 807–814.
Mangan, M.T., Marsh, B.D., 1992. Solidification front fractionation in phenocryst-freesheet-like magma bodies. J. Geol. 100, 605–620.
Mangan, M.T., Marsh, B.D., Froelich, A.J., Gottfried, D., 1993. Emplacement and differentia-tion of the York Haven diabase sheet, Pennsylvania. J. Petrol. 34, 1271–1302.
Marsh, B.D., 1996. Solidification fronts and magmatic evolution. Mineral. Mag. 60, 5–40.Marsh, B.D., 1988. Crystal capture, sorting, and retention in convecting magma. Geol.
Soc. Amer. Bull. 100, 1720–1737.Marsh, B.D., 1989. On convective style and vigor in sheet-like magma chambers. J. Petrol.
30, 479–530.Marsh, J., Hooper, P., Rehacek, J., Duncan, R., Duncan, A., 1997. Stratigraphy and age of
Karoo basalts of Lesotho and implications for correlations within the Karoo igneousprovince. In: Mahoney, J., Coffin, M. (Eds.), Large Provinces: Continental, Oceanicand Planetary Flood Volcanism 100. Geophysical Monograph, pp. 247–272.
McKenzie, D., 1984. The generation and compaction of partially molten rock. J. Petrol.25, 713–765.
Naslund, H.R., 1984. Petrology of the Upper Border Series of the Skaergaard intrusion.J. Petrol. 25, 185–212.
Navon, O., Stolper, E., 1987. Geochemical consequences of melt percolation — the uppermantle as a chromatographic column. J. Geol. 95, 285–307.
Philpotts, A.R., Carroll, M., 1996. Physical properties of partly melted tholeiitic basalt.Geology 24, 1029–1032.
Planke, S., Malthe-Sørenssen, A., Jamtveit, B., Petroleum implications of sill intrusions:an integrated study, VBPR/TGS-NOPEC Commercial Report, 2000, p. plates (A3).
Planke, S., Rassmussen, T., Rey, S.S., Myklebust, R., 2005. Seismic characteristics anddistribution of volcanic intrusions and hydrothermal vent complexes in the Vøringand Møre basins. In Petroleum Geology: North-West Europe and GlobalPerspectives. In: Dore, A., Vining, B. (Eds.), Petroleum Geology: North-West Europeand Global Perspectives, Proceedings of the 6th. Geology Conference, GeologicalSociety, London.
Podladchikov, Y.Y., Wickham, S.M., 1994. Crystallization of hydrous magmas— calculationof associated thermal effects, volatilefluxes, and isotopic alteration. J. Geol.102, 25–45.
Rabinowicz, M., Genthon, P., Ceuleneer, G., Hillairet, M., 2001. Compaction in a mantlemush with high melt concentrations and the generation of magma chambers. EarthPlanet. Sci. Lett. 188, 313–328.
Richardson, S.H., 1979. Chemical variation induced by flow differentiation in an extensiveKaroo dolerite sheet, southern Namibia. Geochim. Cosmochim. Acta 43, 1433–1441.
Shirley, D.N., 1986. Compaction of igneous cumulates. J. Geol. 94, 795–809.Shirley, D.N., 1987. Differentiation and compaction in the Palisades Sill, New-Jersey. J.
Petrol. 28, 835–865.Simkin, T., 1967. Flow differentiation in the picritic sills of north Skye. In: Wyllie, P.J.
(Ed.), Ultramafic and Related Rocks. Wiley, New York, pp. 64–69.Spiegelman, M., 1996. Geochemical consequences of melt transport in 2-D: the sensitivity
of trace elements to mantle dynamics. Earth Planet. Sci. Lett. 139, 115–132.Spiegelman, M., Kelemen, P.B., Aharonov, E., 2001. Causes and consequences of flow
organization during melt transport: the reaction infiltration instability incompactible media. J. Geophys. Res.-Solid Earth 106, 2061–2077.
Steefel, C.I., DePaolo, D.J., Lichtner, P.C., 2005. Reactive transport modeling: an essentialtool and a new research approach for the Earth sciences. Earth Planet. Sci. Lett. 240,539–558.
Svensen, H., Jamtveit, B., Planke, S., Chevallier, L., 2006. Structure and evolution ofhydrothermal vent complexes in the Karoo Basin, South Africa. J. Geol. Soc. 163,671–682.
Svensen, H., Planke, S., Chevallier, L., Malthe-Sorenssen, A., Corfu, F., Jamtveit, B., 2007.Hydrothermal venting of greenhouse gases triggering Early Jurassic globalwarming. Earth Planet. Sci. Lett. 256, 554–566.
Tait, S., Jaupart, C., 1992. Compositional convection in a reactive crystalline mush andmelt differentiation. J. Geophys. Res.-Solid Earth 97, 6735–6756.
Tantserev, E., 2008. Time reverse methods in modeling of diffusive. Convective andreactive transport. PhD-thesis, University of Oslo.
Tommasini, S., Davies, G.R., 1997. Isotope disequilibrium during anatexis: a case study ofcontact melting, Sierra Nevada, California. Earth Planet. Sci. Lett. 148, 273–285.
Turcotte, D., Schubert, G., 2002. Geodynamics. Cambridge.Van Biljon, W.J., Smitter, Y.H., 1956. A note on the occurrence of two sandstone dykes in
a Karoo dolerite sill near Devon, South-Eastern Transvaal. Trans. Geol. Soc. S. Afr. 59.Voight, B., Linde, A.T., Sacks, I.S., Mattioli, G.S., Sparks, R.S.J., Elsworth, D., Hidayat, D., Malin,
P.E., Shalev, E., Widiwijayanti, C., Young, S.R., Bass, V., Clarke, A., Dunkley, P., Johnston,W.,McWhorter, N., Neuberg, J.,Williams, P., 2006. Unprecedented pressure increase indeep magma reservoir triggered by lava-dome collapse. Geophys. Res. Lett. 33.
Wager, L.R., Brown, G.M., 1968. Layered Igneous Rocks. WH Freeman, San Francisco.Weinberg, R.F., 2006. Melt segregation structures in granitic plutons. Geology 34,
305–308.