Observations of Stresses and Strains in a Granular Material
17
Observations of Stresses and Strains in a Granular Material Danuta Lesniewska, Ph.D. 1 ; and David Muir Wood, Ph.D. 2 Abstract: The use of glass ballotini as a granular material provides the opportunity to simultaneously study internal stress fields and internal fields of deformation as a sample is submitted to boundary perturbations. Digital image correlation makes use of the visible fabric of the material to deduce a field of displacements from one digital photographic image to the next. If the glass granules are immersed in a fluid having the same refractive index, then observation with polarized light exploits the photoelastic properties of the glass to reveal information about the stresses. Again, comparison of digital photographs enables changes in stress conditions from one image to the next to be discovered. Tests performed in a simple loading device which forces rotation of principal axes in parts of the granular mass are presented to demonstrate the unique potential of this dual experimental configuration. DOI: 10.1061/ASCEEM.1943-7889.0000015 CE Database subject headings: Granular materials; Stress; Strain; Deformation; Digital techniques; Imaging techniques; Configuration. Introduction The validation of constitutive models of soil behavior has usually been achieved through the simulation of laboratory tests such as triaxial tests which are interpreted as single element tests on more or less uniform samples. The possibilities for such ideal element tests are limited and the paths followed in any geotech- nical prototype application will certainly explore regions of stress and strain space which are inaccessible in the laboratory tests. In fact, radiographic studies Desrues et al. 1996 have revealed complex patterns of density variation within triaxial tests on sand so that even in this familiar configuration the sample should be seen as a “system” rather than a single element. Validation of constitutive models in the context of reproducing the behavior of geotechnical boundary value problems has usually no choice but to work at the system level and attempt to predict integrated quantities such as overall boundary loads and displacements—there is little possibility of making comparisons against the local behavior of the soil inside the geotechnical sys- tem. Practically, this may not be a problem but there are some hypotheses concerning the behavior of soils which can only be tested with local knowledge of stresses and strains. One of the techniques available for discovering information about the stress state within a “soil” model makes use of the photoelastic properties of certain transparent materials as de- scribed in the next section. It is less problematic to obtain information about displace- ments in granular materials—with certain constraints. Radio- graphic techniques now provide much information about internal structure of geomaterials Desrues et al. 2006. The stereophoto- grammetric method Desrues and Viggiani 2004 pioneered by Butterfield et al. 1970 provided fields of displacement but could not easily be automated. Now, however, the wide availability of digital photography makes it easy to obtain digital images of high quality. Images of the sand fabric seen through the containing glass side of a test tank for plane models provide sufficiently varied detail to be used with image analysis software so that successive pictures can be compared automatically to calculate the field of displacements and thence strains within the sand a process known variously as digital image correlation DIC or particle image velocimetry PIV: Adrian 1991; White and Take 2002; White et al. 2003, 2005. We explore here a new experimental procedure of investigat- ing the behavior of granular materials, combining the classical photoelastic technique with digital photography and subsequent PIV. Some preliminary experiments are reported in which glass ballotini of diameter around 1 mm have been placed in a simple rig and subjected to various loading and boundary displacement histories. Examples are given of observed stress and strain incre- ment fields and certain relations deduced between them. Photoelastic Technique for Granular Materials Any transparent material, such as glass or certain polymers, when stressed, becomes birefringent to some extent, depending on its optical sensitivity. When viewed in a dark field of circularly po- larized light, we can observe the transmission through a continu- ous model of the internal stresses generated by forces imposed on the boundaries. This property has been extensively used in the past, mainly in structural engineering models, to visualize elastic stress distributions in small scale continuous models of complete structures for example, dams, bridges etc. or structural compo- nents in polarized light. However, the same technique can be used to observe the transmission of forces within a sample of a granu- lar material made of transparent particles for example, Dantu 1957; Wakabayashi 1957; Drescher and De Josselin de Jong 1 Associate Professor, Institute of Hydroengineering, Polish Academy of Sciences, ul. Koscierska 7, 80-328 Gdansk, Poland corresponding author. E-mail: [email protected] 2 Professor, Dept. of Civil Engineering, Univ. of Bristol, Queen’s Building, Univ. Walk, Bristol BS8 1TR, U.K. E-mail: d.muir-wood@ bristol.ac.uk Note. This manuscript was submitted on April 19, 2008; approved on December 10, 2008; published online on March 6, 2009. Discussion pe- riod open until February 1, 2010; separate discussions must be submitted for individual papers. This paper is part of the Journal of Engineering Mechanics, Vol. 135, No. 9, September 1, 2009. ©ASCE, ISSN 0733- 9399/2009/9-1038–1054/$25.00. 1038 / JOURNAL OF ENGINEERING MECHANICS © ASCE / SEPTEMBER 2009 Downloaded 01 Jan 2010 to 137.222.245.1. Redistribution subject to ASCE license or copyright; see http://pubs.asce.org/copyright
Transcript of Observations of Stresses and Strains in a Granular Material
Observations of Stresses and Strains in a Granular MaterialDanuta Lesniewska, Ph.D.1; and David Muir Wood, Ph.D.2
Abstract: The use of glass ballotini as a granular material provides the opportunity to simultaneously study internal stress fields andinternal fields of deformation as a sample is submitted to boundary perturbations. Digital image correlation makes use of the visible fabricof the material to deduce a field of displacements from one digital photographic image to the next. If the glass granules are immersed ina fluid having the same refractive index, then observation with polarized light exploits the photoelastic properties of the glass to revealinformation about the stresses. Again, comparison of digital photographs enables changes in stress conditions from one image to the nextto be discovered. Tests performed in a simple loading device which forces rotation of principal axes in parts of the granular mass arepresented to demonstrate the unique potential of this dual experimental configuration.
DOI: 10.1061/�ASCE�EM.1943-7889.0000015
CE Database subject headings: Granular materials; Stress; Strain; Deformation; Digital techniques; Imaging techniques;Configuration.
Introduction
The validation of constitutive models of soil behavior has usuallybeen achieved through the simulation of laboratory tests �such astriaxial tests� which are interpreted as single element tests onmore or less uniform samples. The possibilities for such idealelement tests are limited and the paths followed in any geotech-nical prototype application will certainly explore regions of stressand strain space which are inaccessible in the laboratory tests. Infact, radiographic studies �Desrues et al. 1996� have revealedcomplex patterns of density variation within triaxial tests on sandso that even in this familiar configuration the sample should beseen as a “system” rather than a single element.
Validation of constitutive models in the context of reproducingthe behavior of geotechnical boundary value problems has usuallyno choice but to work at the system level and attempt to predictintegrated quantities such as overall boundary loads anddisplacements—there is little possibility of making comparisonsagainst the local behavior of the soil inside the geotechnical sys-tem. Practically, this may not be a problem but there are somehypotheses concerning the behavior of soils which can only betested with local knowledge of stresses and strains.
One of the techniques available for discovering informationabout the stress state within a “soil” model makes use of thephotoelastic properties of certain transparent materials as de-scribed in the next section.
It is less problematic to obtain information about displace-
1Associate Professor, Institute of Hydroengineering, Polish Academyof Sciences, ul. Koscierska 7, 80-328 Gdansk, Poland �correspondingauthor�. E-mail: [email protected]
2Professor, Dept. of Civil Engineering, Univ. of Bristol, Queen’sBuilding, Univ. Walk, Bristol BS8 1TR, U.K. E-mail: [email protected]
Note. This manuscript was submitted on April 19, 2008; approved onDecember 10, 2008; published online on March 6, 2009. Discussion pe-riod open until February 1, 2010; separate discussions must be submittedfor individual papers. This paper is part of the Journal of EngineeringMechanics, Vol. 135, No. 9, September 1, 2009. ©ASCE, ISSN 0733-
9399/2009/9-1038–1054/$25.00.1038 / JOURNAL OF ENGINEERING MECHANICS © ASCE / SEPTEMBER
Downloaded 01 Jan 2010 to 137.222.245.1. Redistribution subject to
ments in granular materials—with certain constraints. Radio-graphic techniques now provide much information about internalstructure of geomaterials �Desrues et al. 2006�. The stereophoto-grammetric method �Desrues and Viggiani 2004� pioneered byButterfield et al. �1970� provided fields of displacement but couldnot easily be automated. Now, however, the wide availability ofdigital photography makes it easy to obtain digital images of highquality. Images of the sand fabric seen through the containingglass side of a test tank for plane models provide sufficientlyvaried detail to be used with image analysis software so thatsuccessive pictures can be compared automatically to calculatethe field of displacements and thence strains within the sand �aprocess known variously as digital image correlation �DIC� orparticle image velocimetry �PIV�: Adrian 1991; White and Take2002; White et al. 2003, 2005�.
We explore here a new experimental procedure of investigat-ing the behavior of granular materials, combining the classicalphotoelastic technique with digital photography and subsequentPIV. Some preliminary experiments are reported in which glassballotini of diameter around 1 mm have been placed in a simplerig and subjected to various loading and boundary displacementhistories. Examples are given of observed stress and strain incre-ment fields and certain relations deduced between them.
Photoelastic Technique for Granular Materials
Any transparent material, such as glass or certain polymers, whenstressed, becomes birefringent to some extent, depending on itsoptical sensitivity. When viewed in a dark field of circularly po-larized light, we can observe the transmission through a continu-ous model of the internal stresses generated by forces imposed onthe boundaries. This property has been extensively used in thepast, mainly in structural engineering models, to visualize elasticstress distributions in small scale continuous models of completestructures �for example, dams, bridges etc.� or structural compo-nents in polarized light. However, the same technique can be usedto observe the transmission of forces within a sample of a granu-lar material made of transparent particles �for example, Dantu
1957; Wakabayashi 1957; Drescher and De Josselin de Jong2009
ASCE license or copyright; see http://pubs.asce.org/copyright
1972; Drescher 1976; Dyer 1985; Allersma 1987; Dyer 1985;Geng et al. 2001�. If the number of particles is large enough�which is to say that the size of the particles is sufficiently smallwith respect to the typical dimensions of the test apparatus� thenthe observed distribution of forces has been interpreted to revealthe stress field within the granular material.
A mass of particles, even if each single one is transparent tolight, is generally entirely opaque because of the reflection anddiffraction of light at the particle faces. It is well known from theprinciples of optics that this opacity can be removed by immers-ing the grains in a liquid having the same refractive index as theparticles—light traversing the granular mass is not then deflectedat the boundaries between particles and liquid and the sample ofgranular material becomes transparent. Adopting this principle,Dantu �1957�, Wakabayashi �1957�, Drescher �1976�, Allersma�1987�, and Dyer �1985� �among others� extended the use ofthe photoelastic technique to granular materials. All of them usedcrushed glass particles in their tests. By direct observation ofphotographs made in circularly polarized light, they were ableto recognize characteristic light stripes, representing highlyloaded chains of crushed glass particles and concluded thatthese stripes coincided, although irregularly, with principal stresstrajectories.
Displacement fields have been determined experimentally ei-ther by directly tracing changes in the position of a number ofmarked �nontransparent� particles, placed in more or less regulararrays at some distance from the face of the sample �Allersma1987; Dyer 1985� or by stereophotogrammetric measurement ofthe position of opaque porcelain markers embedded randomly inthe crushed glass �Drescher 1976�. Characteristic dimensions ofthe arrays of markers �the distance between neighboring markers�were inevitably �much� greater than the typical particle sizes �forexample, Allersma used a grid of about 10 mm and crushed glasswith particle size about 3 mm�. There is a question whether theaccuracy of these previous studies was sufficient to draw decisiveconclusions concerning the relation between principal strain in-crement and stress axes that can be revisited in the future. Ourpresent intention is to present the new possibilities offered bycombining computer aided image analysis with classical photo-elastic investigations of granular materials.
It has been reported by previous researchers that because ofthe low optical sensitivity of glass, information concerning stressconditions in a granular photoelastic medium made of glass par-ticles only becomes visible once the stress level is reasonablyhigh. In a small laboratory model tested at single gravity andcontaining a free surface, the stress level would be too low.Drescher �1976�, using a sort of directional shear apparatus, wasable to reach an internal stress, sufficient to produce a visibleeffect, by rotation of the enclosing plates by about 5°, implying ashear strain of the order of 8%. Allersma �1987� reports that theexternal load applied to platens of his test box produced an aver-age stress around 0.1 MPa and Dyer �1985� used a load sufficientto generate a stress of about 0.2 MPa. Both Allersma and Dyerwere studying large displacement problems �shear box, cone pen-etration, and reinforcement pullout�.
PIV in Geomechanics
Particle image velocimetry or DIC �Rechenmacher and Medina-Cetina 2007� is a velocity-measuring procedure, originally devel-oped for fluid mechanics �Adrian 1991� and later, exploiting the
potential of digital photography, used for the analysis of displace-JOURNAL O
Downloaded 01 Jan 2010 to 137.222.245.1. Redistribution subject to
ments in tests on soil models �White et al. 2003, 2005�. PIVoperates by tracking the spatial variations of brightness within animage �divided up into a mesh of PIV patches� by comparingsuccessive images. It thus provides an automated route to theextraction of displacement data from sequences of digital images,captured during model or element tests in plane strain conditions.The principal constraints are thus that there must be a transparentboundary through which the granular material can be observed—for example, a glass or Perspex containing wall—and that thegranular material should have sufficient texture that the imageanalysis software can reliably detect and identify from one pho-tograph to the next.
We have used the GeoPIV software, developed by White andTake �2002� to analyze the tests presented in this paper. Accord-ing to White et al. �2003�, the precision of PIV is a strong func-tion of the size of the patch which is to be compared from imageto image and is also influenced by image content. If the size of thepatch is too small then the amount of information contained maybe insufficient for the software to recognize with confidence thedisplaced patch, and false values of displacement may emerge.The second quantity which must be chosen is the grid spacing tobe used for successive displacement estimates within each image.Calculation of strains requires differentiation of displacementinformation—a finer grid implies greater detail but also greaterprobability of erratic values. So the selection of an optimum patchsize in the PIV analysis requires two conflicting interests to bebalanced—larger patches offer improved precision, whereassmaller patches allow the image to contain a greater number ofmeasurement points, revealing detail in areas of high strain gra-dient. A compromise that appears to provide the best solution forthese two problems is to use relatively big, but overlappingpatches.
We have nevertheless explored the use of different patch sizesin our analyses. Most of the analyses used overlapping squarepatches of L=32 and L=64 pixels, placed at a spacing of 16 and8 pixels, respectively �thus somewhat less than the patch size�.�However, in some tests satisfactory strain fields could not beobtained with the use of the smaller spacings because of roundingerrors in very small incremental displacements.� White et al.�2003� proposed an empirical formula for an upper bound on thePIV precision error �pixel as a function of patch size L. Accordingto this formula the precision of our displacement PIV analysiswith L=32 pixels was about 2�10−4 maximum expected error�in pixels�, equivalent to �1.5�10−5-mm displacement.
The image analysis program obviously works best when themovements between images are not so large that the geometrychanges in the fabric make matching of patches difficult. The userneeds to use some trial and error to find the best mesh of patchesand the best area to be studied in terms both of the success of thePIV interpretation and of the geomechanical information that canbe extracted.
Experimental Configuration and Materials
Photoelastic and Photographic Procedures
A standard photoelastic polariscope set �Drescher 1976; Allersma1987; Dyer 1985; Geng et al. 2001� has been used for the pur-poses of observation of stress fields. Two monochromatic sodiumlamps have been used with a diffuser to encourage uniformity ofpolarized light. The light passes through a standard circular po-
lariscope set �Fig. 1� consisting of a polarizer and a quarter waveF ENGINEERING MECHANICS © ASCE / SEPTEMBER 2009 / 1039
ASCE license or copyright; see http://pubs.asce.org/copyright
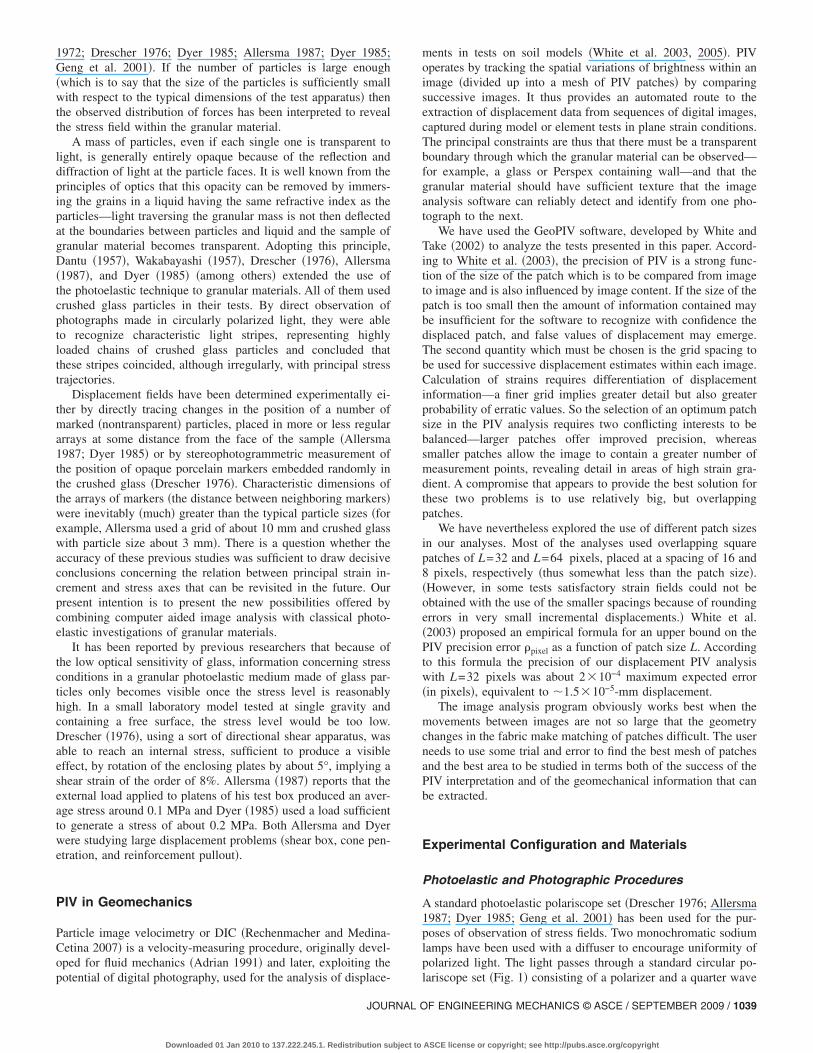
plate, then through the sample and then through a second quarterwave plate and polarizer �analyzer� with its axis at 90° to the firstone. An additional lamp which provides a source of white non-polarized light is placed at the side of the model �in order not todisturb the field of view of the sodium lamp� and directed almostparallel to it by means of a mirror to illuminate the model for thePIV photographs �Fig. 1�. Inevitably, such a configuration gives aslightly nonuniform illumination across the width of the modelbut the nonuniformity is the same for each picture and does notunduly influence the application of the PIV �the mirror helps toimprove uniformity of sample illumination�. The additional lampused for the PIV imagery has to give a sufficiently strong lightto produce a clear image of the fabric of the granular material:a 500-kW electric bulb was used. All photographs have to bemade with a fixed position for the digital camera so, when col-lecting data for PIV, the sample is illuminated by nonpolarizedlight, but the photographs are taken through the polariscope ana-lyzer set.
Evidently the photoelastic images �taken in circularly polar-ized light� do themselves record a lot of fabric in the granularmaterial and it would be tempting to use a single set of such
Fig. 1. Schematic view of the experimental setup—standard polari-scope with monochromatic light supplemented by additional unpolar-ized white light source
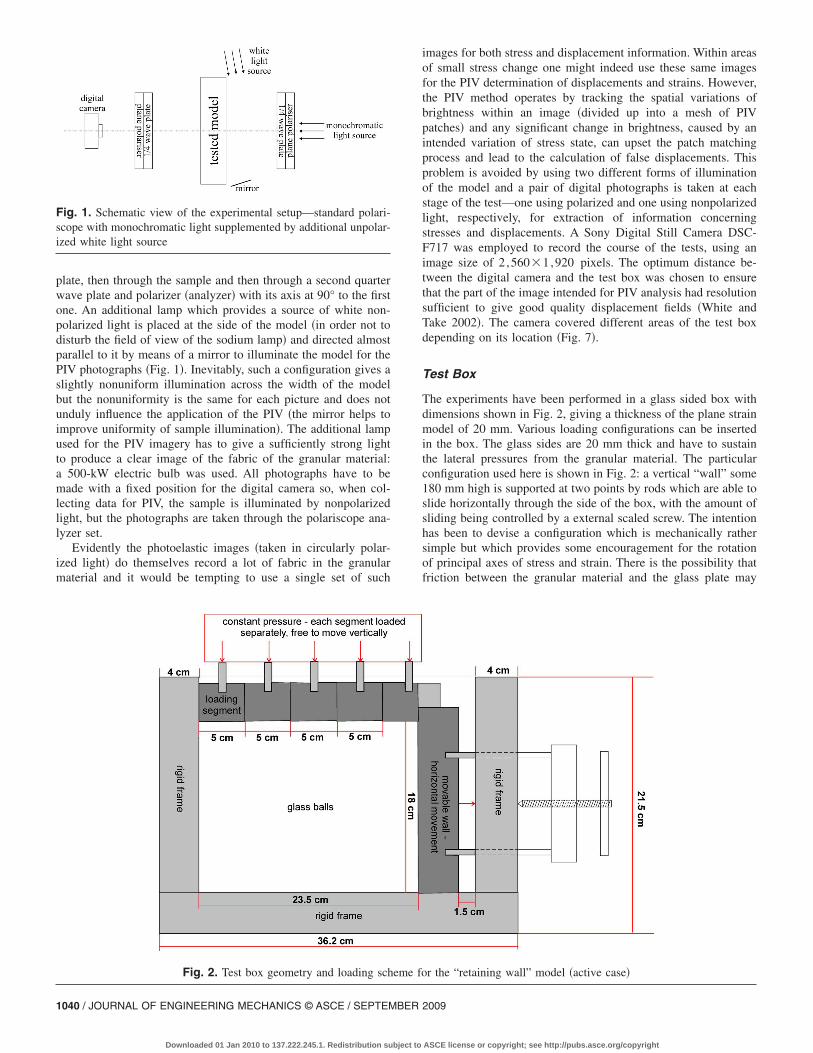
Fig. 2. Test box geometry and loading sch
1040 / JOURNAL OF ENGINEERING MECHANICS © ASCE / SEPTEMBER
Downloaded 01 Jan 2010 to 137.222.245.1. Redistribution subject to
images for both stress and displacement information. Within areasof small stress change one might indeed use these same imagesfor the PIV determination of displacements and strains. However,the PIV method operates by tracking the spatial variations ofbrightness within an image �divided up into a mesh of PIVpatches� and any significant change in brightness, caused by anintended variation of stress state, can upset the patch matchingprocess and lead to the calculation of false displacements. Thisproblem is avoided by using two different forms of illuminationof the model and a pair of digital photographs is taken at eachstage of the test—one using polarized and one using nonpolarizedlight, respectively, for extraction of information concerningstresses and displacements. A Sony Digital Still Camera DSC-F717 was employed to record the course of the tests, using animage size of 2 ,560�1,920 pixels. The optimum distance be-tween the digital camera and the test box was chosen to ensurethat the part of the image intended for PIV analysis had resolutionsufficient to give good quality displacement fields �White andTake 2002�. The camera covered different areas of the test boxdepending on its location �Fig. 7�.
Test Box
The experiments have been performed in a glass sided box withdimensions shown in Fig. 2, giving a thickness of the plane strainmodel of 20 mm. Various loading configurations can be insertedin the box. The glass sides are 20 mm thick and have to sustainthe lateral pressures from the granular material. The particularconfiguration used here is shown in Fig. 2: a vertical “wall” some180 mm high is supported at two points by rods which are able toslide horizontally through the side of the box, with the amount ofsliding being controlled by a external scaled screw. The intentionhas been to devise a configuration which is mechanically rathersimple but which provides some encouragement for the rotationof principal axes of stress and strain. There is the possibility thatfriction between the granular material and the glass plate may
r the “retaining wall” model �active case�
eme fo2009
ASCE license or copyright; see http://pubs.asce.org/copyright
have an influence on the uniformity of displacements through thethickness of the box but the kinematic constraint provided by theloading configuration should make this effect small.
Granular Material
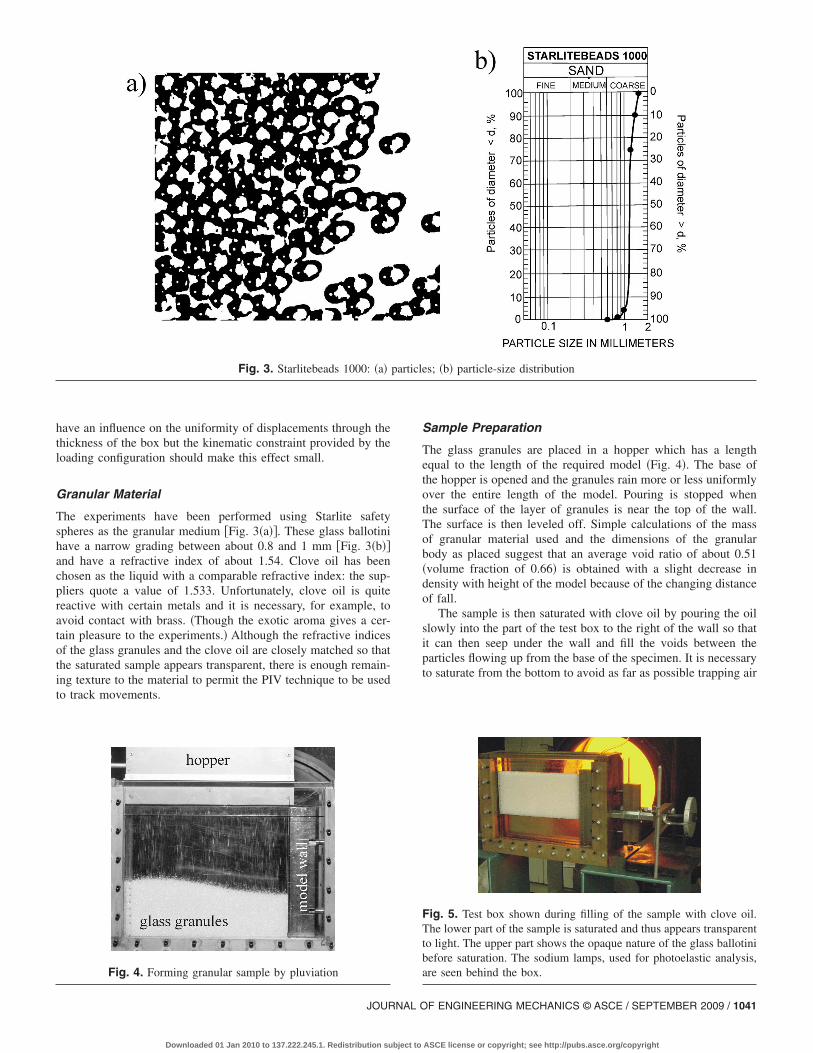
The experiments have been performed using Starlite safetyspheres as the granular medium �Fig. 3�a��. These glass ballotinihave a narrow grading between about 0.8 and 1 mm �Fig. 3�b��and have a refractive index of about 1.54. Clove oil has beenchosen as the liquid with a comparable refractive index: the sup-pliers quote a value of 1.533. Unfortunately, clove oil is quitereactive with certain metals and it is necessary, for example, toavoid contact with brass. �Though the exotic aroma gives a cer-tain pleasure to the experiments.� Although the refractive indicesof the glass granules and the clove oil are closely matched so thatthe saturated sample appears transparent, there is enough remain-ing texture to the material to permit the PIV technique to be usedto track movements.
Fig. 3. Starlitebeads 1000: �a�
Fig. 4. Forming granular sample by pluviation
JOURNAL O
Downloaded 01 Jan 2010 to 137.222.245.1. Redistribution subject to
Sample Preparation
The glass granules are placed in a hopper which has a lengthequal to the length of the required model �Fig. 4�. The base ofthe hopper is opened and the granules rain more or less uniformlyover the entire length of the model. Pouring is stopped whenthe surface of the layer of granules is near the top of the wall.The surface is then leveled off. Simple calculations of the massof granular material used and the dimensions of the granularbody as placed suggest that an average void ratio of about 0.51�volume fraction of 0.66� is obtained with a slight decrease indensity with height of the model because of the changing distanceof fall.
The sample is then saturated with clove oil by pouring the oilslowly into the part of the test box to the right of the wall so thatit can then seep under the wall and fill the voids between theparticles flowing up from the base of the specimen. It is necessaryto saturate from the bottom to avoid as far as possible trapping air
es; �b� particle-size distribution
Fig. 5. Test box shown during filling of the sample with clove oil.The lower part of the sample is saturated and thus appears transparentto light. The upper part shows the opaque nature of the glass ballotinibefore saturation. The sodium lamps, used for photoelastic analysis,are seen behind the box.
particl
F ENGINEERING MECHANICS © ASCE / SEPTEMBER 2009 / 1041
ASCE license or copyright; see http://pubs.asce.org/copyright
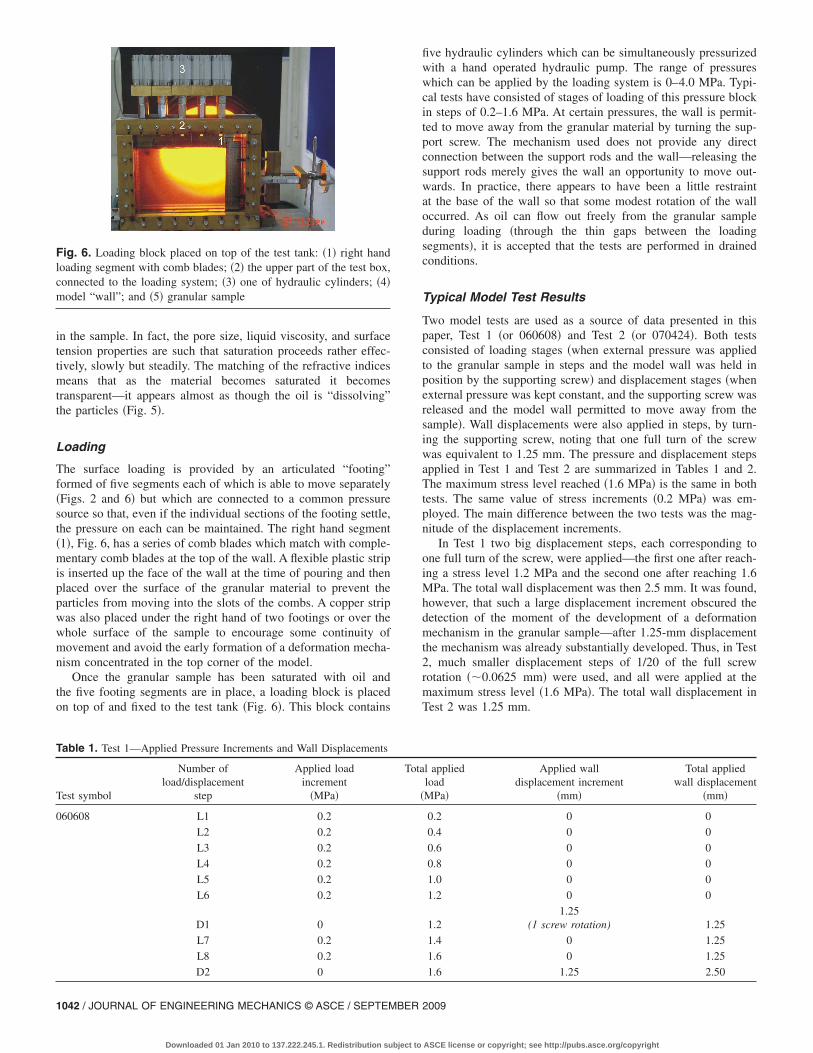
in the sample. In fact, the pore size, liquid viscosity, and surfacetension properties are such that saturation proceeds rather effec-tively, slowly but steadily. The matching of the refractive indicesmeans that as the material becomes saturated it becomestransparent—it appears almost as though the oil is “dissolving”the particles �Fig. 5�.
Loading
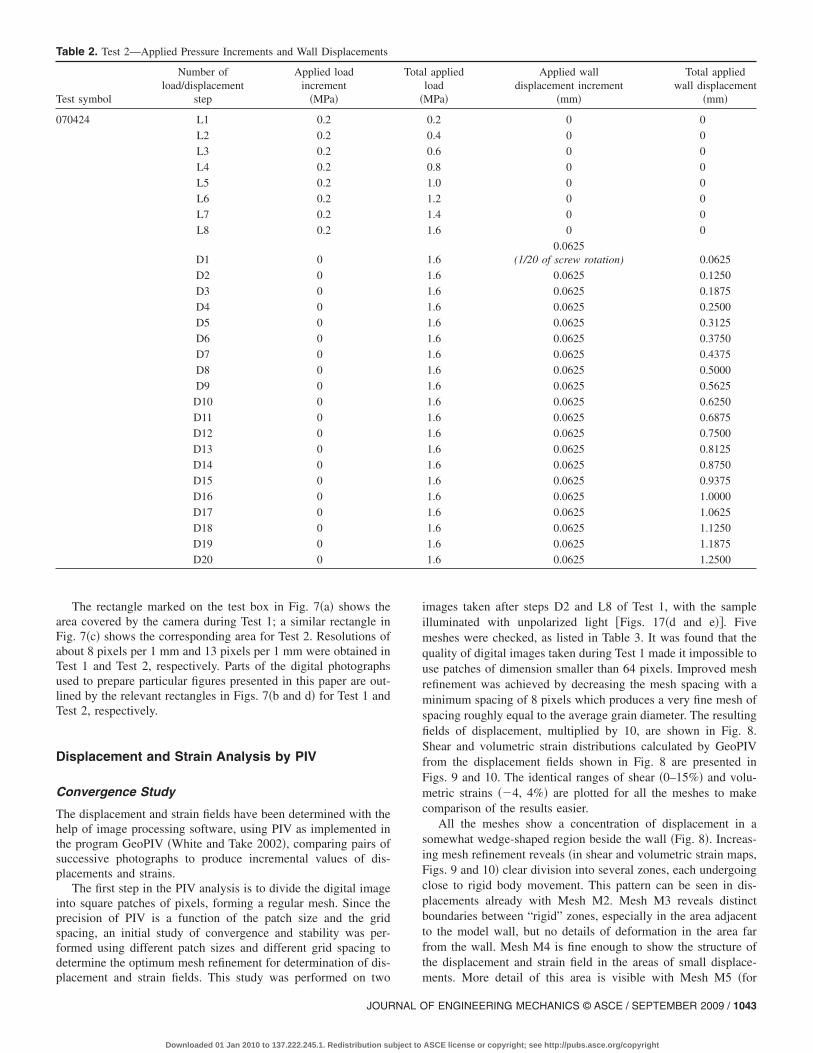
The surface loading is provided by an articulated “footing”formed of five segments each of which is able to move separately�Figs. 2 and 6� but which are connected to a common pressuresource so that, even if the individual sections of the footing settle,the pressure on each can be maintained. The right hand segment�1�, Fig. 6, has a series of comb blades which match with comple-mentary comb blades at the top of the wall. A flexible plastic stripis inserted up the face of the wall at the time of pouring and thenplaced over the surface of the granular material to prevent theparticles from moving into the slots of the combs. A copper stripwas also placed under the right hand of two footings or over thewhole surface of the sample to encourage some continuity ofmovement and avoid the early formation of a deformation mecha-nism concentrated in the top corner of the model.
Once the granular sample has been saturated with oil andthe five footing segments are in place, a loading block is placedon top of and fixed to the test tank �Fig. 6�. This block contains
Table 1. Test 1—Applied Pressure Increments and Wall Displacements
Test symbol
Number ofload/displacement
step
Applied loadincrement
�MPa�
060608 L1 0.2
L2 0.2
L3 0.2
L4 0.2
L5 0.2
L6 0.2
D1 0
L7 0.2
L8 0.2
D2 0
Fig. 6. Loading block placed on top of the test tank: �1� right handloading segment with comb blades; �2� the upper part of the test box,connected to the loading system; �3� one of hydraulic cylinders; �4�model “wall”; and �5� granular sample
1042 / JOURNAL OF ENGINEERING MECHANICS © ASCE / SEPTEMBER
Downloaded 01 Jan 2010 to 137.222.245.1. Redistribution subject to
five hydraulic cylinders which can be simultaneously pressurizedwith a hand operated hydraulic pump. The range of pressureswhich can be applied by the loading system is 0–4.0 MPa. Typi-cal tests have consisted of stages of loading of this pressure blockin steps of 0.2–1.6 MPa. At certain pressures, the wall is permit-ted to move away from the granular material by turning the sup-port screw. The mechanism used does not provide any directconnection between the support rods and the wall—releasing thesupport rods merely gives the wall an opportunity to move out-wards. In practice, there appears to have been a little restraintat the base of the wall so that some modest rotation of the walloccurred. As oil can flow out freely from the granular sampleduring loading �through the thin gaps between the loadingsegments�, it is accepted that the tests are performed in drainedconditions.
Typical Model Test Results
Two model tests are used as a source of data presented in thispaper, Test 1 �or 060608� and Test 2 �or 070424�. Both testsconsisted of loading stages �when external pressure was appliedto the granular sample in steps and the model wall was held inposition by the supporting screw� and displacement stages �whenexternal pressure was kept constant, and the supporting screw wasreleased and the model wall permitted to move away from thesample�. Wall displacements were also applied in steps, by turn-ing the supporting screw, noting that one full turn of the screwwas equivalent to 1.25 mm. The pressure and displacement stepsapplied in Test 1 and Test 2 are summarized in Tables 1 and 2.The maximum stress level reached �1.6 MPa� is the same in bothtests. The same value of stress increments �0.2 MPa� was em-ployed. The main difference between the two tests was the mag-nitude of the displacement increments.
In Test 1 two big displacement steps, each corresponding toone full turn of the screw, were applied—the first one after reach-ing a stress level 1.2 MPa and the second one after reaching 1.6MPa. The total wall displacement was then 2.5 mm. It was found,however, that such a large displacement increment obscured thedetection of the moment of the development of a deformationmechanism in the granular sample—after 1.25-mm displacementthe mechanism was already substantially developed. Thus, in Test2, much smaller displacement steps of 1/20 of the full screwrotation ��0.0625 mm� were used, and all were applied at themaximum stress level �1.6 MPa�. The total wall displacement inTest 2 was 1.25 mm.
l appliedloadMPa�
Applied walldisplacement increment
�mm�
Total appliedwall displacement
�mm�
0.2 0 0
0.4 0 0
0.6 0 0
0.8 0 0
1.0 0 0
1.2 0 0
1.21.25
(1 screw rotation) 1.25
1.4 0 1.25
1.6 0 1.25
1.6 1.25 2.50
Tota
�
2009
ASCE license or copyright; see http://pubs.asce.org/copyright
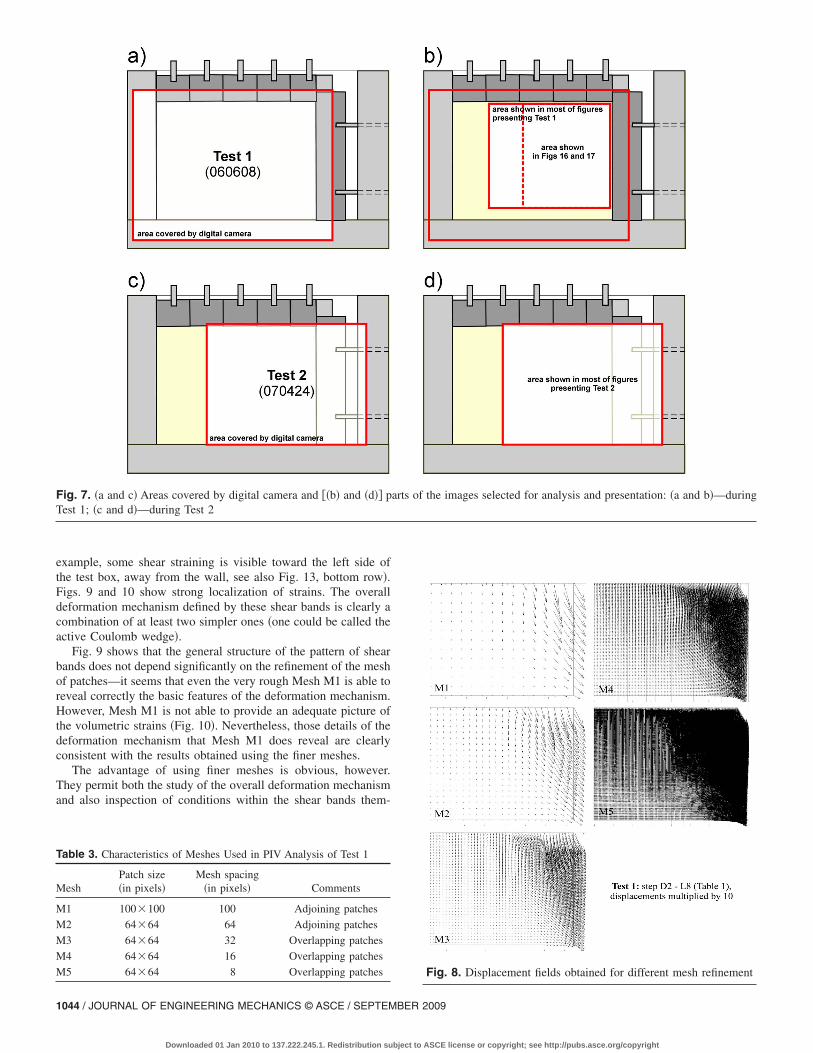
The rectangle marked on the test box in Fig. 7�a� shows thearea covered by the camera during Test 1; a similar rectangle inFig. 7�c� shows the corresponding area for Test 2. Resolutions ofabout 8 pixels per 1 mm and 13 pixels per 1 mm were obtained inTest 1 and Test 2, respectively. Parts of the digital photographsused to prepare particular figures presented in this paper are out-lined by the relevant rectangles in Figs. 7�b and d� for Test 1 andTest 2, respectively.
Displacement and Strain Analysis by PIV
Convergence Study
The displacement and strain fields have been determined with thehelp of image processing software, using PIV as implemented inthe program GeoPIV �White and Take 2002�, comparing pairs ofsuccessive photographs to produce incremental values of dis-placements and strains.
The first step in the PIV analysis is to divide the digital imageinto square patches of pixels, forming a regular mesh. Since theprecision of PIV is a function of the patch size and the gridspacing, an initial study of convergence and stability was per-formed using different patch sizes and different grid spacing todetermine the optimum mesh refinement for determination of dis-
Table 2. Test 2—Applied Pressure Increments and Wall Displacements
Test symbol
Number ofload/displacement
step
Applied loadincrement
�MPa�
070424 L1 0.2
L2 0.2
L3 0.2
L4 0.2
L5 0.2
L6 0.2
L7 0.2
L8 0.2
D1 0
D2 0
D3 0
D4 0
D5 0
D6 0
D7 0
D8 0
D9 0
D10 0
D11 0
D12 0
D13 0
D14 0
D15 0
D16 0
D17 0
D18 0
D19 0
D20 0
placement and strain fields. This study was performed on two
JOURNAL O
Downloaded 01 Jan 2010 to 137.222.245.1. Redistribution subject to
images taken after steps D2 and L8 of Test 1, with the sampleilluminated with unpolarized light �Figs. 17�d and e��. Fivemeshes were checked, as listed in Table 3. It was found that thequality of digital images taken during Test 1 made it impossible touse patches of dimension smaller than 64 pixels. Improved meshrefinement was achieved by decreasing the mesh spacing with aminimum spacing of 8 pixels which produces a very fine mesh ofspacing roughly equal to the average grain diameter. The resultingfields of displacement, multiplied by 10, are shown in Fig. 8.Shear and volumetric strain distributions calculated by GeoPIVfrom the displacement fields shown in Fig. 8 are presented inFigs. 9 and 10. The identical ranges of shear �0–15%� and volu-metric strains ��4, 4%� are plotted for all the meshes to makecomparison of the results easier.
All the meshes show a concentration of displacement in asomewhat wedge-shaped region beside the wall �Fig. 8�. Increas-ing mesh refinement reveals �in shear and volumetric strain maps,Figs. 9 and 10� clear division into several zones, each undergoingclose to rigid body movement. This pattern can be seen in dis-placements already with Mesh M2. Mesh M3 reveals distinctboundaries between “rigid” zones, especially in the area adjacentto the model wall, but no details of deformation in the area farfrom the wall. Mesh M4 is fine enough to show the structure ofthe displacement and strain field in the areas of small displace-
l appliedloadMPa�
Applied walldisplacement increment
�mm�
Total appliedwall displacement
�mm�
0.2 0 0
0.4 0 0
0.6 0 0
0.8 0 0
1.0 0 0
1.2 0 0
1.4 0 0
1.6 0 0
1.60.0625
(1/20 of screw rotation) 0.0625
1.6 0.0625 0.1250
1.6 0.0625 0.1875
1.6 0.0625 0.2500
1.6 0.0625 0.3125
1.6 0.0625 0.3750
1.6 0.0625 0.4375
1.6 0.0625 0.5000
1.6 0.0625 0.5625
1.6 0.0625 0.6250
1.6 0.0625 0.6875
1.6 0.0625 0.7500
1.6 0.0625 0.8125
1.6 0.0625 0.8750
1.6 0.0625 0.9375
1.6 0.0625 1.0000
1.6 0.0625 1.0625
1.6 0.0625 1.1250
1.6 0.0625 1.1875
1.6 0.0625 1.2500
Tota
�
ments. More detail of this area is visible with Mesh M5 �for
F ENGINEERING MECHANICS © ASCE / SEPTEMBER 2009 / 1043
ASCE license or copyright; see http://pubs.asce.org/copyright
example, some shear straining is visible toward the left side ofthe test box, away from the wall, see also Fig. 13, bottom row�.Figs. 9 and 10 show strong localization of strains. The overalldeformation mechanism defined by these shear bands is clearly acombination of at least two simpler ones �one could be called theactive Coulomb wedge�.
Fig. 9 shows that the general structure of the pattern of shearbands does not depend significantly on the refinement of the meshof patches—it seems that even the very rough Mesh M1 is able toreveal correctly the basic features of the deformation mechanism.However, Mesh M1 is not able to provide an adequate picture ofthe volumetric strains �Fig. 10�. Nevertheless, those details of thedeformation mechanism that Mesh M1 does reveal are clearlyconsistent with the results obtained using the finer meshes.
The advantage of using finer meshes is obvious, however.They permit both the study of the overall deformation mechanismand also inspection of conditions within the shear bands them-
Table 3. Characteristics of Meshes Used in PIV Analysis of Test 1
MeshPatch size�in pixels�
Mesh spacing�in pixels� Comments
M1 100�100 100 Adjoining patches
M2 64�64 64 Adjoining patches
M3 64�64 32 Overlapping patches
M4 64�64 16 Overlapping patches
M5 64�64 8 Overlapping patches
Fig. 7. �a and c� Areas covered by digital camera and ��b� and �d�� pTest 1; �c and d�—during Test 2
arts of the images selected for analysis and presentation: �a and b�—during
1044 / JOURNAL OF ENGINEERING MECHANICS © ASCE / SEPTEMBER
Downloaded 01 Jan 2010 to 137.222.245.1. Redistribution subject to
Fig. 8. Displacement fields obtained for different mesh refinement
2009
ASCE license or copyright; see http://pubs.asce.org/copyright
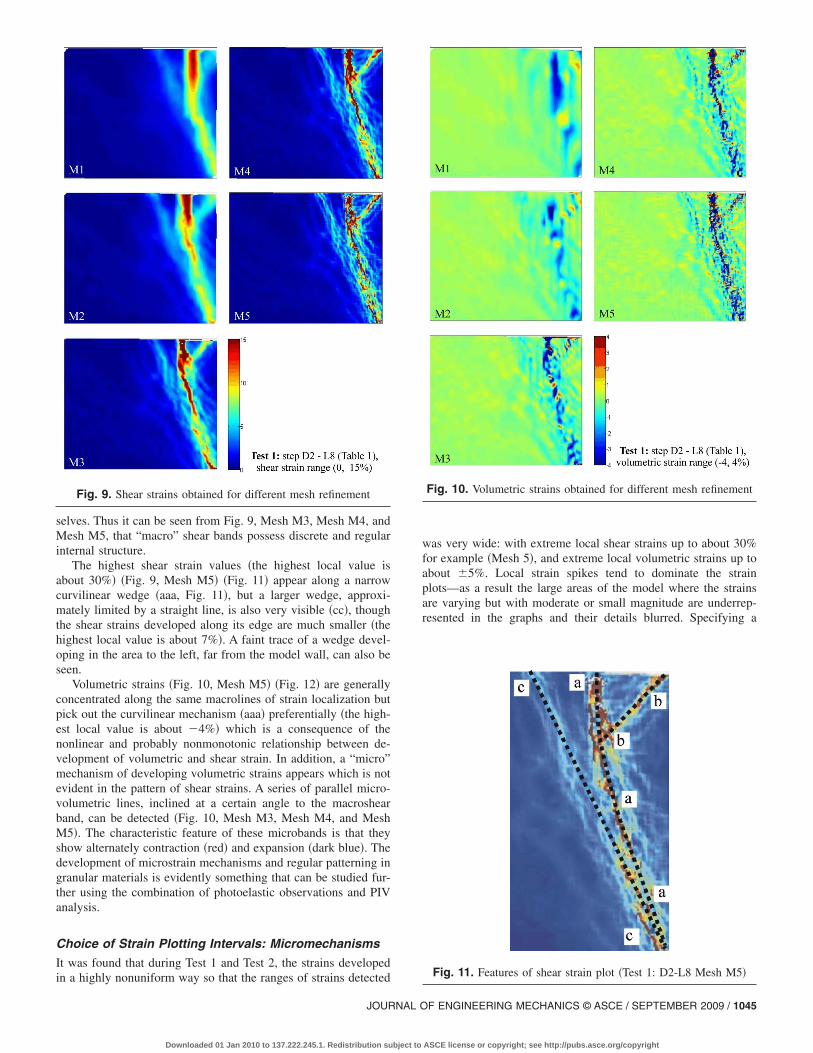
selves. Thus it can be seen from Fig. 9, Mesh M3, Mesh M4, andMesh M5, that “macro” shear bands possess discrete and regularinternal structure.
The highest shear strain values �the highest local value isabout 30%� �Fig. 9, Mesh M5� �Fig. 11� appear along a narrowcurvilinear wedge �aaa, Fig. 11�, but a larger wedge, approxi-mately limited by a straight line, is also very visible �cc�, thoughthe shear strains developed along its edge are much smaller �thehighest local value is about 7%�. A faint trace of a wedge devel-oping in the area to the left, far from the model wall, can also beseen.
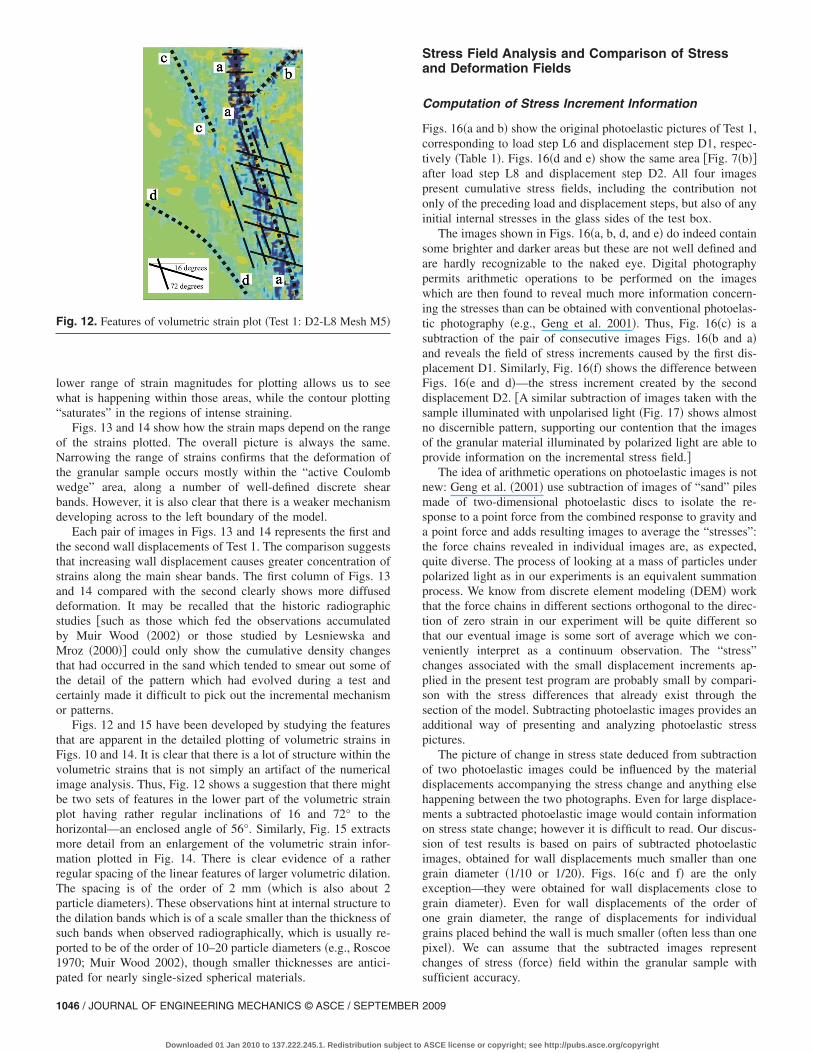
Volumetric strains �Fig. 10, Mesh M5� �Fig. 12� are generallyconcentrated along the same macrolines of strain localization butpick out the curvilinear mechanism �aaa� preferentially �the high-est local value is about �4%� which is a consequence of thenonlinear and probably nonmonotonic relationship between de-velopment of volumetric and shear strain. In addition, a “micro”mechanism of developing volumetric strains appears which is notevident in the pattern of shear strains. A series of parallel micro-volumetric lines, inclined at a certain angle to the macroshearband, can be detected �Fig. 10, Mesh M3, Mesh M4, and MeshM5�. The characteristic feature of these microbands is that theyshow alternately contraction �red� and expansion �dark blue�. Thedevelopment of microstrain mechanisms and regular patterning ingranular materials is evidently something that can be studied fur-ther using the combination of photoelastic observations and PIVanalysis.
Choice of Strain Plotting Intervals: Micromechanisms
It was found that during Test 1 and Test 2, the strains developed
Fig. 9. Shear strains obtained for different mesh refinement
in a highly nonuniform way so that the ranges of strains detected
JOURNAL O
Downloaded 01 Jan 2010 to 137.222.245.1. Redistribution subject to
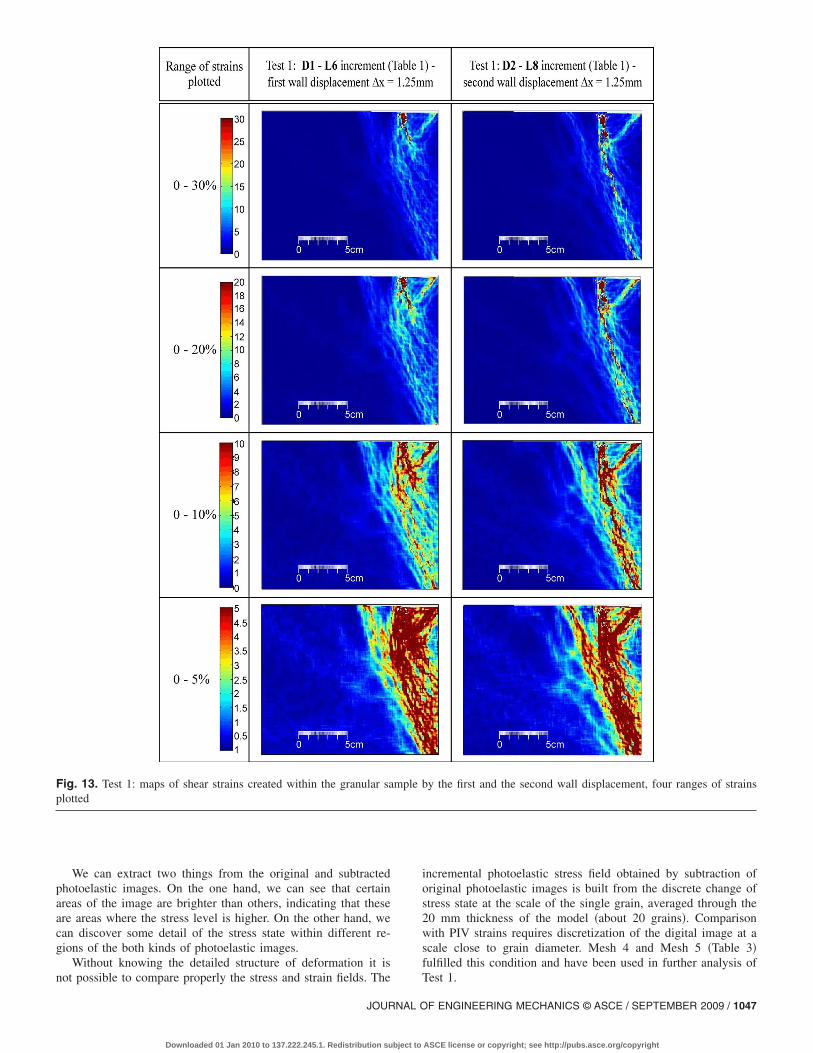
was very wide: with extreme local shear strains up to about 30%for example �Mesh 5�, and extreme local volumetric strains up toabout �5%. Local strain spikes tend to dominate the strainplots—as a result the large areas of the model where the strainsare varying but with moderate or small magnitude are underrep-resented in the graphs and their details blurred. Specifying a
Fig. 10. Volumetric strains obtained for different mesh refinement
Fig. 11. Features of shear strain plot �Test 1: D2-L8 Mesh M5�
F ENGINEERING MECHANICS © ASCE / SEPTEMBER 2009 / 1045
ASCE license or copyright; see http://pubs.asce.org/copyright
lower range of strain magnitudes for plotting allows us to seewhat is happening within those areas, while the contour plotting“saturates” in the regions of intense straining.
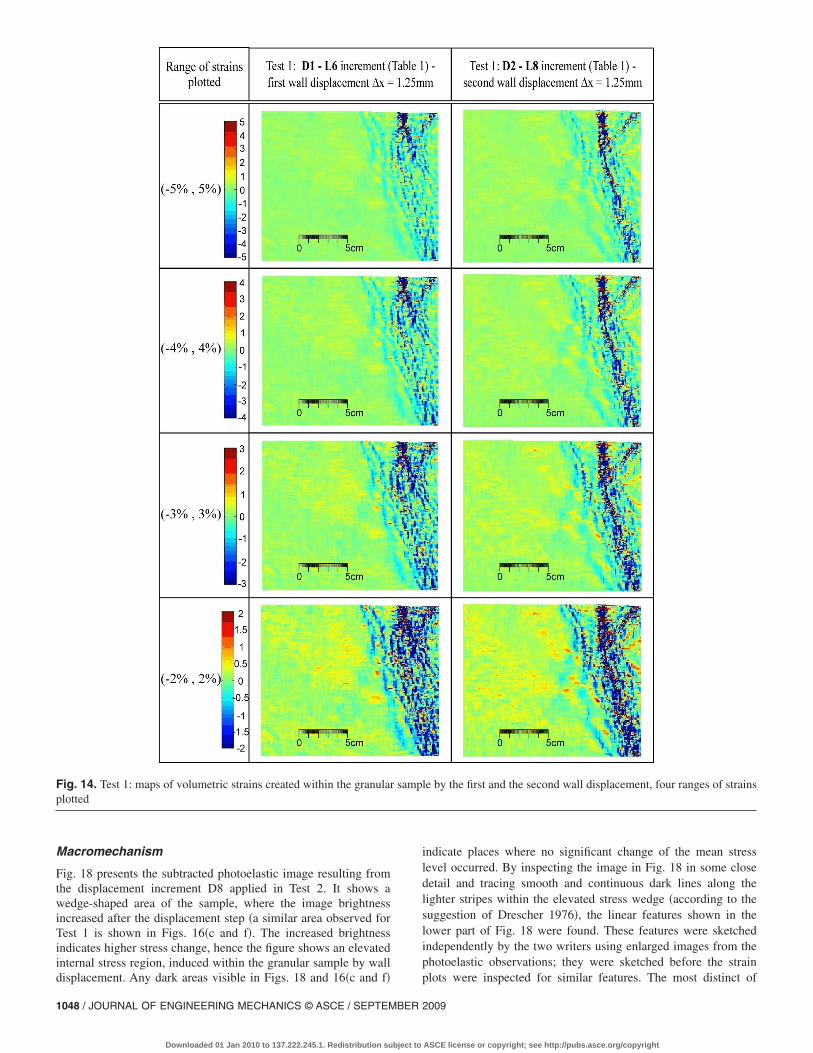
Figs. 13 and 14 show how the strain maps depend on the rangeof the strains plotted. The overall picture is always the same.Narrowing the range of strains confirms that the deformation ofthe granular sample occurs mostly within the “active Coulombwedge” area, along a number of well-defined discrete shearbands. However, it is also clear that there is a weaker mechanismdeveloping across to the left boundary of the model.
Each pair of images in Figs. 13 and 14 represents the first andthe second wall displacements of Test 1. The comparison suggeststhat increasing wall displacement causes greater concentration ofstrains along the main shear bands. The first column of Figs. 13and 14 compared with the second clearly shows more diffuseddeformation. It may be recalled that the historic radiographicstudies �such as those which fed the observations accumulatedby Muir Wood �2002� or those studied by Lesniewska andMroz �2000�� could only show the cumulative density changesthat had occurred in the sand which tended to smear out some ofthe detail of the pattern which had evolved during a test andcertainly made it difficult to pick out the incremental mechanismor patterns.
Figs. 12 and 15 have been developed by studying the featuresthat are apparent in the detailed plotting of volumetric strains inFigs. 10 and 14. It is clear that there is a lot of structure within thevolumetric strains that is not simply an artifact of the numericalimage analysis. Thus, Fig. 12 shows a suggestion that there mightbe two sets of features in the lower part of the volumetric strainplot having rather regular inclinations of 16 and 72° to thehorizontal—an enclosed angle of 56°. Similarly, Fig. 15 extractsmore detail from an enlargement of the volumetric strain infor-mation plotted in Fig. 14. There is clear evidence of a ratherregular spacing of the linear features of larger volumetric dilation.The spacing is of the order of 2 mm �which is also about 2particle diameters�. These observations hint at internal structure tothe dilation bands which is of a scale smaller than the thickness ofsuch bands when observed radiographically, which is usually re-ported to be of the order of 10–20 particle diameters �e.g., Roscoe1970; Muir Wood 2002�, though smaller thicknesses are antici-
Fig. 12. Features of volumetric strain plot �Test 1: D2-L8 Mesh M5�
pated for nearly single-sized spherical materials.
1046 / JOURNAL OF ENGINEERING MECHANICS © ASCE / SEPTEMBER
Downloaded 01 Jan 2010 to 137.222.245.1. Redistribution subject to
Stress Field Analysis and Comparison of Stressand Deformation Fields
Computation of Stress Increment Information
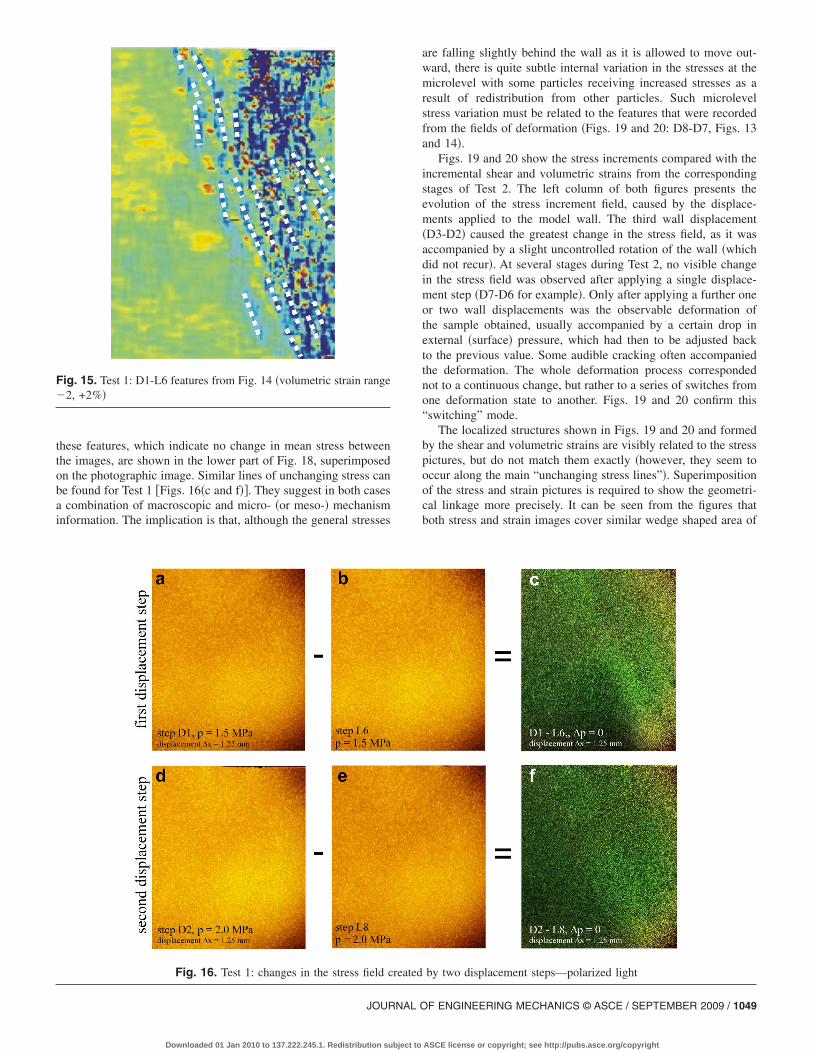
Figs. 16�a and b� show the original photoelastic pictures of Test 1,corresponding to load step L6 and displacement step D1, respec-tively �Table 1�. Figs. 16�d and e� show the same area �Fig. 7�b��after load step L8 and displacement step D2. All four imagespresent cumulative stress fields, including the contribution notonly of the preceding load and displacement steps, but also of anyinitial internal stresses in the glass sides of the test box.
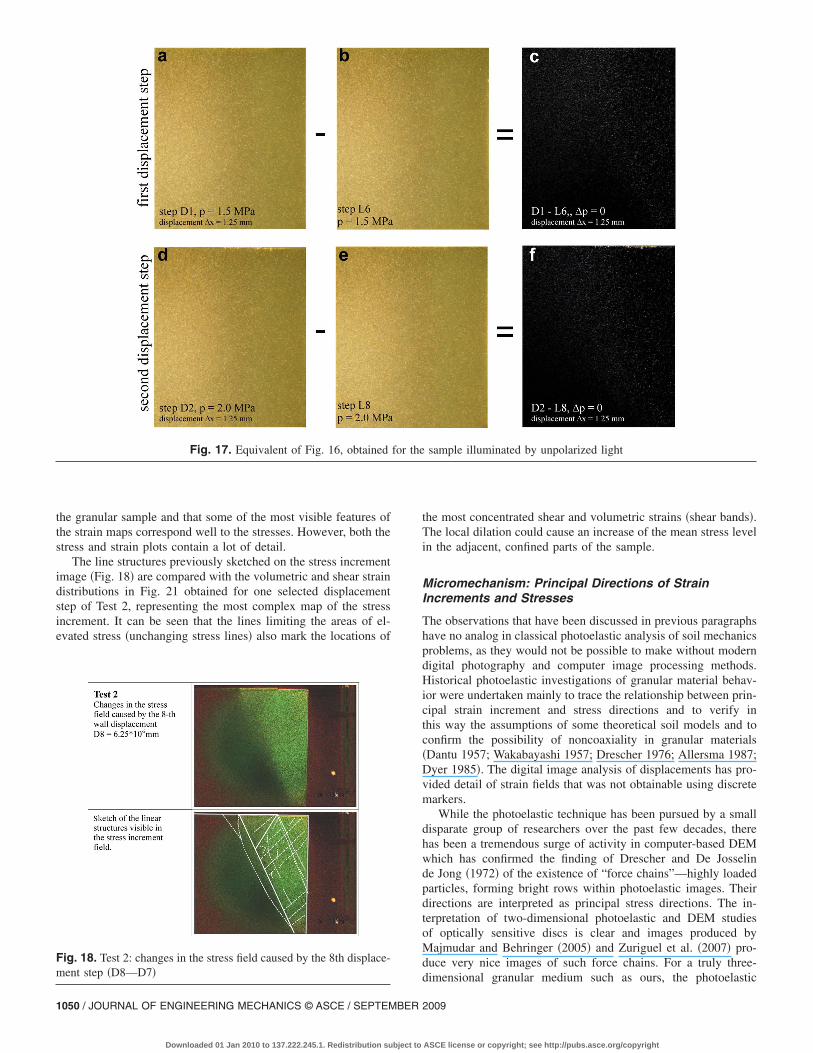
The images shown in Figs. 16�a, b, d, and e� do indeed containsome brighter and darker areas but these are not well defined andare hardly recognizable to the naked eye. Digital photographypermits arithmetic operations to be performed on the imageswhich are then found to reveal much more information concern-ing the stresses than can be obtained with conventional photoelas-tic photography �e.g., Geng et al. 2001�. Thus, Fig. 16�c� is asubtraction of the pair of consecutive images Figs. 16�b and a�and reveals the field of stress increments caused by the first dis-placement D1. Similarly, Fig. 16�f� shows the difference betweenFigs. 16�e and d�—the stress increment created by the seconddisplacement D2. �A similar subtraction of images taken with thesample illuminated with unpolarised light �Fig. 17� shows almostno discernible pattern, supporting our contention that the imagesof the granular material illuminated by polarized light are able toprovide information on the incremental stress field.�
The idea of arithmetic operations on photoelastic images is notnew: Geng et al. �2001� use subtraction of images of “sand” pilesmade of two-dimensional photoelastic discs to isolate the re-sponse to a point force from the combined response to gravity anda point force and adds resulting images to average the “stresses”:the force chains revealed in individual images are, as expected,quite diverse. The process of looking at a mass of particles underpolarized light as in our experiments is an equivalent summationprocess. We know from discrete element modeling �DEM� workthat the force chains in different sections orthogonal to the direc-tion of zero strain in our experiment will be quite different sothat our eventual image is some sort of average which we con-veniently interpret as a continuum observation. The “stress”changes associated with the small displacement increments ap-plied in the present test program are probably small by compari-son with the stress differences that already exist through thesection of the model. Subtracting photoelastic images provides anadditional way of presenting and analyzing photoelastic stresspictures.
The picture of change in stress state deduced from subtractionof two photoelastic images could be influenced by the materialdisplacements accompanying the stress change and anything elsehappening between the two photographs. Even for large displace-ments a subtracted photoelastic image would contain informationon stress state change; however it is difficult to read. Our discus-sion of test results is based on pairs of subtracted photoelasticimages, obtained for wall displacements much smaller than onegrain diameter �1/10 or 1/20�. Figs. 16�c and f� are the onlyexception—they were obtained for wall displacements close tograin diameter�. Even for wall displacements of the order ofone grain diameter, the range of displacements for individualgrains placed behind the wall is much smaller �often less than onepixel�. We can assume that the subtracted images representchanges of stress �force� field within the granular sample with
sufficient accuracy.2009
ASCE license or copyright; see http://pubs.asce.org/copyright
We can extract two things from the original and subtractedphotoelastic images. On the one hand, we can see that certainareas of the image are brighter than others, indicating that theseare areas where the stress level is higher. On the other hand, wecan discover some detail of the stress state within different re-gions of the both kinds of photoelastic images.
Without knowing the detailed structure of deformation it is
Fig. 13. Test 1: maps of shear strains created within the granular saplotted
not possible to compare properly the stress and strain fields. The
JOURNAL O
Downloaded 01 Jan 2010 to 137.222.245.1. Redistribution subject to
incremental photoelastic stress field obtained by subtraction oforiginal photoelastic images is built from the discrete change ofstress state at the scale of the single grain, averaged through the20 mm thickness of the model �about 20 grains�. Comparisonwith PIV strains requires discretization of the digital image at ascale close to grain diameter. Mesh 4 and Mesh 5 �Table 3�fulfilled this condition and have been used in further analysis of
by the first and the second wall displacement, four ranges of strains
mpleTest 1.
F ENGINEERING MECHANICS © ASCE / SEPTEMBER 2009 / 1047
ASCE license or copyright; see http://pubs.asce.org/copyright
Macromechanism
Fig. 18 presents the subtracted photoelastic image resulting fromthe displacement increment D8 applied in Test 2. It shows awedge-shaped area of the sample, where the image brightnessincreased after the displacement step �a similar area observed forTest 1 is shown in Figs. 16�c and f�. The increased brightnessindicates higher stress change, hence the figure shows an elevatedinternal stress region, induced within the granular sample by wall
Fig. 14. Test 1: maps of volumetric strains created within the granularplotted
displacement. Any dark areas visible in Figs. 18 and 16�c and f�
1048 / JOURNAL OF ENGINEERING MECHANICS © ASCE / SEPTEMBER
Downloaded 01 Jan 2010 to 137.222.245.1. Redistribution subject to
indicate places where no significant change of the mean stresslevel occurred. By inspecting the image in Fig. 18 in some closedetail and tracing smooth and continuous dark lines along thelighter stripes within the elevated stress wedge �according to thesuggestion of Drescher 1976�, the linear features shown in thelower part of Fig. 18 were found. These features were sketchedindependently by the two writers using enlarged images from thephotoelastic observations; they were sketched before the strain
le by the first and the second wall displacement, four ranges of strains
sampplots were inspected for similar features. The most distinct of
2009
ASCE license or copyright; see http://pubs.asce.org/copyright
these features, which indicate no change in mean stress betweenthe images, are shown in the lower part of Fig. 18, superimposedon the photographic image. Similar lines of unchanging stress canbe found for Test 1 �Figs. 16�c and f��. They suggest in both casesa combination of macroscopic and micro- �or meso-� mechanisminformation. The implication is that, although the general stresses
Fig. 15. Test 1: D1-L6 features from Fig. 14 �volumetric strain range�2, +2%�
Fig. 16. Test 1: changes in the stress field c
JOURNAL O
Downloaded 01 Jan 2010 to 137.222.245.1. Redistribution subject to
are falling slightly behind the wall as it is allowed to move out-ward, there is quite subtle internal variation in the stresses at themicrolevel with some particles receiving increased stresses as aresult of redistribution from other particles. Such microlevelstress variation must be related to the features that were recordedfrom the fields of deformation �Figs. 19 and 20: D8-D7, Figs. 13and 14�.
Figs. 19 and 20 show the stress increments compared with theincremental shear and volumetric strains from the correspondingstages of Test 2. The left column of both figures presents theevolution of the stress increment field, caused by the displace-ments applied to the model wall. The third wall displacement�D3-D2� caused the greatest change in the stress field, as it wasaccompanied by a slight uncontrolled rotation of the wall �whichdid not recur�. At several stages during Test 2, no visible changein the stress field was observed after applying a single displace-ment step �D7-D6 for example�. Only after applying a further oneor two wall displacements was the observable deformation ofthe sample obtained, usually accompanied by a certain drop inexternal �surface� pressure, which had then to be adjusted backto the previous value. Some audible cracking often accompaniedthe deformation. The whole deformation process correspondednot to a continuous change, but rather to a series of switches fromone deformation state to another. Figs. 19 and 20 confirm this“switching” mode.
The localized structures shown in Figs. 19 and 20 and formedby the shear and volumetric strains are visibly related to the stresspictures, but do not match them exactly �however, they seem tooccur along the main “unchanging stress lines”�. Superimpositionof the stress and strain pictures is required to show the geometri-cal linkage more precisely. It can be seen from the figures thatboth stress and strain images cover similar wedge shaped area of
by two displacement steps—polarized light
reatedF ENGINEERING MECHANICS © ASCE / SEPTEMBER 2009 / 1049
ASCE license or copyright; see http://pubs.asce.org/copyright
the granular sample and that some of the most visible features ofthe strain maps correspond well to the stresses. However, both thestress and strain plots contain a lot of detail.
The line structures previously sketched on the stress incrementimage �Fig. 18� are compared with the volumetric and shear straindistributions in Fig. 21 obtained for one selected displacementstep of Test 2, representing the most complex map of the stressincrement. It can be seen that the lines limiting the areas of el-evated stress �unchanging stress lines� also mark the locations of
Fig. 17. Equivalent of Fig. 16, obtained
Fig. 18. Test 2: changes in the stress field caused by the 8th displace-ment step �D8—D7�
1050 / JOURNAL OF ENGINEERING MECHANICS © ASCE / SEPTEMBER
Downloaded 01 Jan 2010 to 137.222.245.1. Redistribution subject to
the most concentrated shear and volumetric strains �shear bands�.The local dilation could cause an increase of the mean stress levelin the adjacent, confined parts of the sample.
Micromechanism: Principal Directions of StrainIncrements and Stresses
The observations that have been discussed in previous paragraphshave no analog in classical photoelastic analysis of soil mechanicsproblems, as they would not be possible to make without moderndigital photography and computer image processing methods.Historical photoelastic investigations of granular material behav-ior were undertaken mainly to trace the relationship between prin-cipal strain increment and stress directions and to verify inthis way the assumptions of some theoretical soil models and toconfirm the possibility of noncoaxiality in granular materials�Dantu 1957; Wakabayashi 1957; Drescher 1976; Allersma 1987;Dyer 1985�. The digital image analysis of displacements has pro-vided detail of strain fields that was not obtainable using discretemarkers.
While the photoelastic technique has been pursued by a smalldisparate group of researchers over the past few decades, therehas been a tremendous surge of activity in computer-based DEMwhich has confirmed the finding of Drescher and De Josselinde Jong �1972� of the existence of “force chains”—highly loadedparticles, forming bright rows within photoelastic images. Theirdirections are interpreted as principal stress directions. The in-terpretation of two-dimensional photoelastic and DEM studiesof optically sensitive discs is clear and images produced byMajmudar and Behringer �2005� and Zuriguel et al. �2007� pro-duce very nice images of such force chains. For a truly three-
sample illuminated by unpolarized light
for thedimensional granular medium such as ours, the photoelastic
2009
ASCE license or copyright; see http://pubs.asce.org/copyright
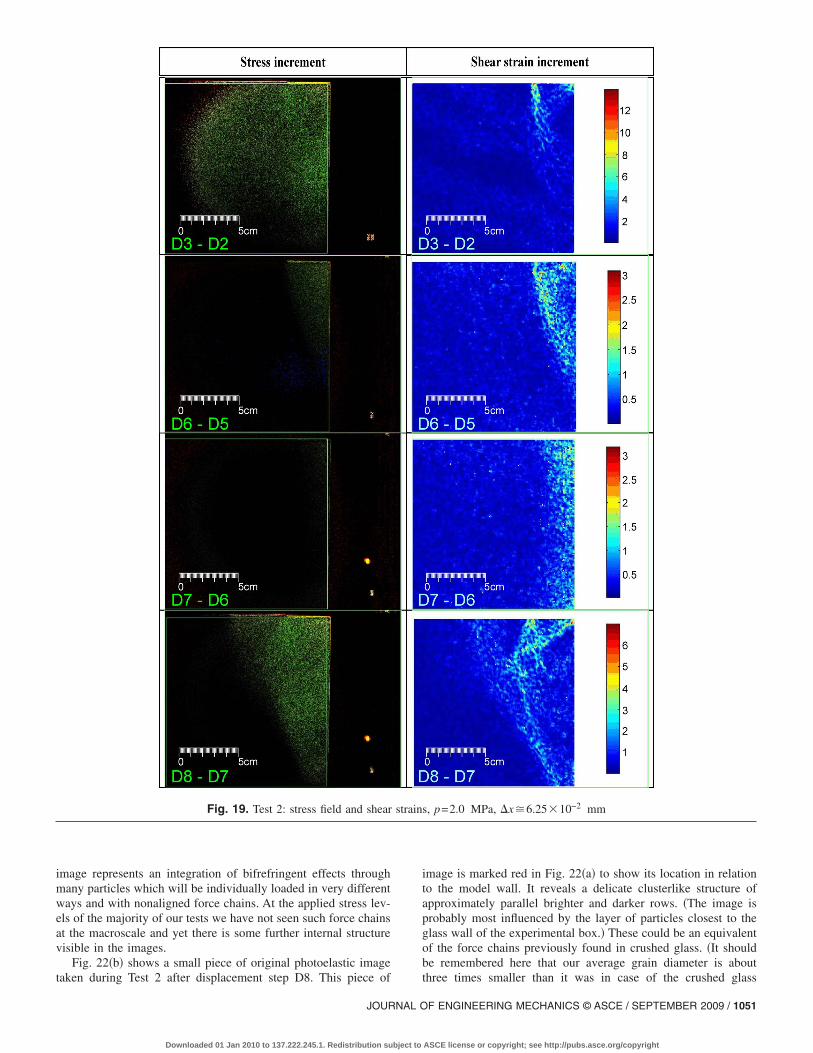
image represents an integration of bifrefringent effects throughmany particles which will be individually loaded in very differentways and with nonaligned force chains. At the applied stress lev-els of the majority of our tests we have not seen such force chainsat the macroscale and yet there is some further internal structurevisible in the images.
Fig. 22�b� shows a small piece of original photoelastic image
Fig. 19. Test 2: stress field and shear
taken during Test 2 after displacement step D8. This piece of
JOURNAL O
Downloaded 01 Jan 2010 to 137.222.245.1. Redistribution subject to
image is marked red in Fig. 22�a� to show its location in relationto the model wall. It reveals a delicate clusterlike structure ofapproximately parallel brighter and darker rows. �The image isprobably most influenced by the layer of particles closest to theglass wall of the experimental box.� These could be an equivalentof the force chains previously found in crushed glass. �It shouldbe remembered here that our average grain diameter is about
s, p=2.0 MPa, �x�6.25�10−2 mm
strainthree times smaller than it was in case of the crushed glass
F ENGINEERING MECHANICS © ASCE / SEPTEMBER 2009 / 1051
ASCE license or copyright; see http://pubs.asce.org/copyright
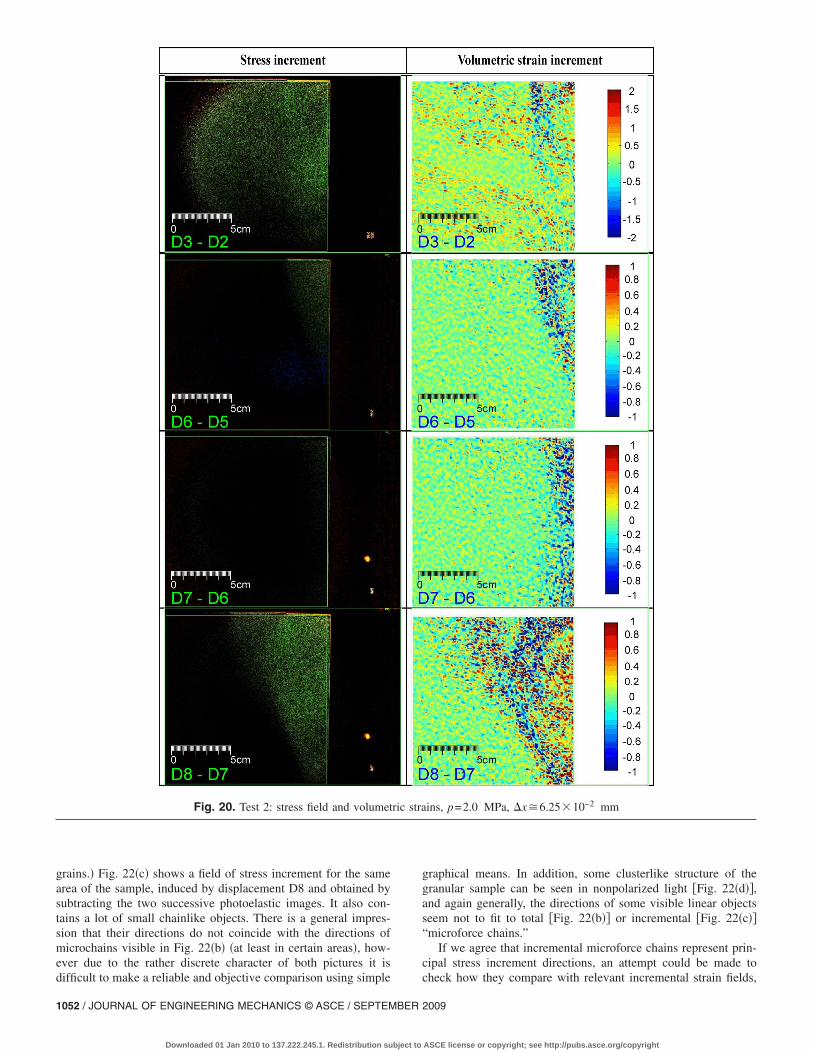
grains.� Fig. 22�c� shows a field of stress increment for the samearea of the sample, induced by displacement D8 and obtained bysubtracting the two successive photoelastic images. It also con-tains a lot of small chainlike objects. There is a general impres-sion that their directions do not coincide with the directions ofmicrochains visible in Fig. 22�b� �at least in certain areas�, how-ever due to the rather discrete character of both pictures it is
Fig. 20. Test 2: stress field and volumet
difficult to make a reliable and objective comparison using simple
1052 / JOURNAL OF ENGINEERING MECHANICS © ASCE / SEPTEMBER
Downloaded 01 Jan 2010 to 137.222.245.1. Redistribution subject to
graphical means. In addition, some clusterlike structure of thegranular sample can be seen in nonpolarized light �Fig. 22�d��,and again generally, the directions of some visible linear objectsseem not to fit to total �Fig. 22�b�� or incremental �Fig. 22�c��“microforce chains.”
If we agree that incremental microforce chains represent prin-cipal stress increment directions, an attempt could be made to
ins, p=2.0 MPa, �x�6.25�10−2 mm
ric stracheck how they compare with relevant incremental strain fields,
2009
ASCE license or copyright; see http://pubs.asce.org/copyright
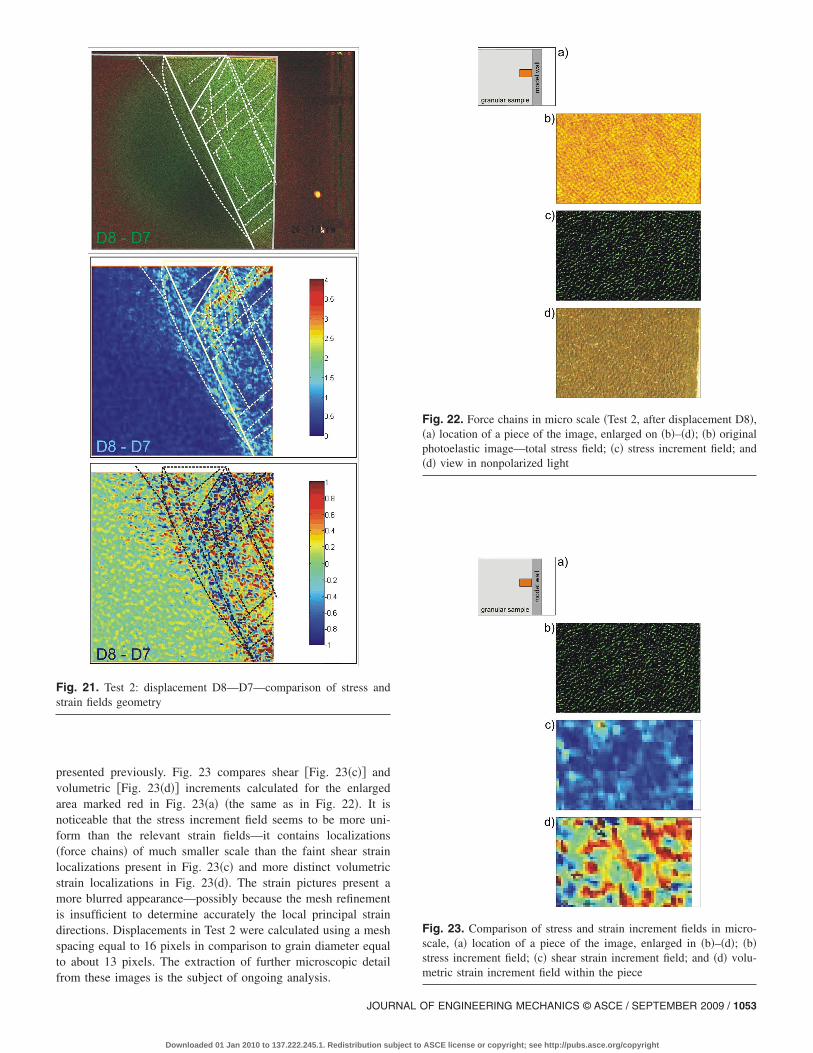
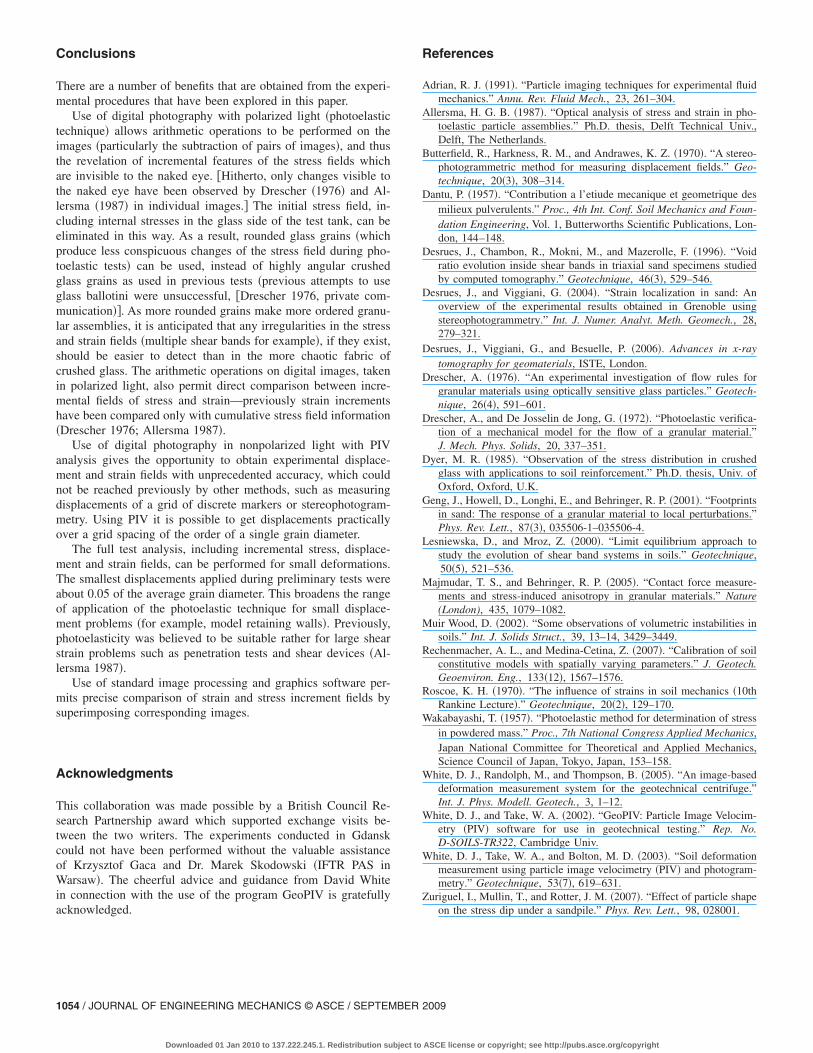
presented previously. Fig. 23 compares shear �Fig. 23�c�� andvolumetric �Fig. 23�d�� increments calculated for the enlargedarea marked red in Fig. 23�a� �the same as in Fig. 22�. It isnoticeable that the stress increment field seems to be more uni-form than the relevant strain fields—it contains localizations�force chains� of much smaller scale than the faint shear strainlocalizations present in Fig. 23�c� and more distinct volumetricstrain localizations in Fig. 23�d�. The strain pictures present amore blurred appearance—possibly because the mesh refinementis insufficient to determine accurately the local principal straindirections. Displacements in Test 2 were calculated using a meshspacing equal to 16 pixels in comparison to grain diameter equalto about 13 pixels. The extraction of further microscopic detail
Fig. 21. Test 2: displacement D8—D7—comparison of stress andstrain fields geometry
from these images is the subject of ongoing analysis.
JOURNAL O
Downloaded 01 Jan 2010 to 137.222.245.1. Redistribution subject to
Fig. 22. Force chains in micro scale �Test 2, after displacement D8�,�a� location of a piece of the image, enlarged on �b�–�d�; �b� originalphotoelastic image—total stress field; �c� stress increment field; and�d� view in nonpolarized light
Fig. 23. Comparison of stress and strain increment fields in micro-scale, �a� location of a piece of the image, enlarged in �b�–�d�; �b�stress increment field; �c� shear strain increment field; and �d� volu-metric strain increment field within the piece
F ENGINEERING MECHANICS © ASCE / SEPTEMBER 2009 / 1053
ASCE license or copyright; see http://pubs.asce.org/copyright
Conclusions
There are a number of benefits that are obtained from the experi-mental procedures that have been explored in this paper.
Use of digital photography with polarized light �photoelastictechnique� allows arithmetic operations to be performed on theimages �particularly the subtraction of pairs of images�, and thusthe revelation of incremental features of the stress fields whichare invisible to the naked eye. �Hitherto, only changes visible tothe naked eye have been observed by Drescher �1976� and Al-lersma �1987� in individual images.� The initial stress field, in-cluding internal stresses in the glass side of the test tank, can beeliminated in this way. As a result, rounded glass grains �whichproduce less conspicuous changes of the stress field during pho-toelastic tests� can be used, instead of highly angular crushedglass grains as used in previous tests �previous attempts to useglass ballotini were unsuccessful, �Drescher 1976, private com-munication��. As more rounded grains make more ordered granu-lar assemblies, it is anticipated that any irregularities in the stressand strain fields �multiple shear bands for example�, if they exist,should be easier to detect than in the more chaotic fabric ofcrushed glass. The arithmetic operations on digital images, takenin polarized light, also permit direct comparison between incre-mental fields of stress and strain—previously strain incrementshave been compared only with cumulative stress field information�Drescher 1976; Allersma 1987�.
Use of digital photography in nonpolarized light with PIVanalysis gives the opportunity to obtain experimental displace-ment and strain fields with unprecedented accuracy, which couldnot be reached previously by other methods, such as measuringdisplacements of a grid of discrete markers or stereophotogram-metry. Using PIV it is possible to get displacements practicallyover a grid spacing of the order of a single grain diameter.
The full test analysis, including incremental stress, displace-ment and strain fields, can be performed for small deformations.The smallest displacements applied during preliminary tests wereabout 0.05 of the average grain diameter. This broadens the rangeof application of the photoelastic technique for small displace-ment problems �for example, model retaining walls�. Previously,photoelasticity was believed to be suitable rather for large shearstrain problems such as penetration tests and shear devices �Al-lersma 1987�.
Use of standard image processing and graphics software per-mits precise comparison of strain and stress increment fields bysuperimposing corresponding images.
Acknowledgments
This collaboration was made possible by a British Council Re-search Partnership award which supported exchange visits be-tween the two writers. The experiments conducted in Gdanskcould not have been performed without the valuable assistanceof Krzysztof Gaca and Dr. Marek Skodowski �IFTR PAS inWarsaw�. The cheerful advice and guidance from David Whitein connection with the use of the program GeoPIV is gratefully
acknowledged.1054 / JOURNAL OF ENGINEERING MECHANICS © ASCE / SEPTEMBER
Downloaded 01 Jan 2010 to 137.222.245.1. Redistribution subject to
References
Adrian, R. J. �1991�. “Particle imaging techniques for experimental fluidmechanics.” Annu. Rev. Fluid Mech., 23, 261–304.
Allersma, H. G. B. �1987�. “Optical analysis of stress and strain in pho-toelastic particle assemblies.” Ph.D. thesis, Delft Technical Univ.,Delft, The Netherlands.
Butterfield, R., Harkness, R. M., and Andrawes, K. Z. �1970�. “A stereo-photogrammetric method for measuring displacement fields.” Geo-technique, 20�3�, 308–314.
Dantu, P. �1957�. “Contribution a l’etiude mecanique et geometrique desmilieux pulverulents.” Proc., 4th Int. Conf. Soil Mechanics and Foun-dation Engineering, Vol. 1, Butterworths Scientific Publications, Lon-don, 144–148.
Desrues, J., Chambon, R., Mokni, M., and Mazerolle, F. �1996�. “Voidratio evolution inside shear bands in triaxial sand specimens studiedby computed tomography.” Geotechnique, 46�3�, 529–546.
Desrues, J., and Viggiani, G. �2004�. “Strain localization in sand: Anoverview of the experimental results obtained in Grenoble usingstereophotogrammetry.” Int. J. Numer. Analyt. Meth. Geomech., 28,279–321.
Desrues, J., Viggiani, G., and Besuelle, P. �2006�. Advances in x-raytomography for geomaterials, ISTE, London.
Drescher, A. �1976�. “An experimental investigation of flow rules forgranular materials using optically sensitive glass particles.” Geotech-nique, 26�4�, 591–601.
Drescher, A., and De Josselin de Jong, G. �1972�. “Photoelastic verifica-tion of a mechanical model for the flow of a granular material.”J. Mech. Phys. Solids, 20, 337–351.
Dyer, M. R. �1985�. “Observation of the stress distribution in crushedglass with applications to soil reinforcement.” Ph.D. thesis, Univ. ofOxford, Oxford, U.K.
Geng, J., Howell, D., Longhi, E., and Behringer, R. P. �2001�. “Footprintsin sand: The response of a granular material to local perturbations.”Phys. Rev. Lett., 87�3�, 035506-1–035506-4.
Lesniewska, D., and Mroz, Z. �2000�. “Limit equilibrium approach tostudy the evolution of shear band systems in soils.” Geotechnique,50�5�, 521–536.
Majmudar, T. S., and Behringer, R. P. �2005�. “Contact force measure-ments and stress-induced anisotropy in granular materials.” Nature(London), 435, 1079–1082.
Muir Wood, D. �2002�. “Some observations of volumetric instabilities insoils.” Int. J. Solids Struct., 39, 13–14, 3429–3449.
Rechenmacher, A. L., and Medina-Cetina, Z. �2007�. “Calibration of soilconstitutive models with spatially varying parameters.” J. Geotech.Geoenviron. Eng., 133�12�, 1567–1576.
Roscoe, K. H. �1970�. “The influence of strains in soil mechanics �10thRankine Lecture�.” Geotechnique, 20�2�, 129–170.
Wakabayashi, T. �1957�. “Photoelastic method for determination of stressin powdered mass.” Proc., 7th National Congress Applied Mechanics,Japan National Committee for Theoretical and Applied Mechanics,Science Council of Japan, Tokyo, Japan, 153–158.
White, D. J., Randolph, M., and Thompson, B. �2005�. “An image-baseddeformation measurement system for the geotechnical centrifuge.”Int. J. Phys. Modell. Geotech., 3, 1–12.
White, D. J., and Take, W. A. �2002�. “GeoPIV: Particle Image Velocim-etry �PIV� software for use in geotechnical testing.” Rep. No.D-SOILS-TR322, Cambridge Univ.
White, D. J., Take, W. A., and Bolton, M. D. �2003�. “Soil deformationmeasurement using particle image velocimetry �PIV� and photogram-metry.” Geotechnique, 53�7�, 619–631.
Zuriguel, I., Mullin, T., and Rotter, J. M. �2007�. “Effect of particle shape
on the stress dip under a sandpile.” Phys. Rev. Lett., 98, 028001.2009
ASCE license or copyright; see http://pubs.asce.org/copyright