Progress in Thermomechanical Analysis of Friction Stir Welding

Journal of Materials Processing Technology 174 (2006) 195–203
Predicting residual thermal stresses in friction stir welded metals
Mir Zahedul H. Khandkar, Jamil A. Khan ∗, Anthony P. Reynolds, Michael A. SuttonDepartment of Mechanical Engineering, University of South Carolina, 300 S Main Street, Columbia, SC 29208, USA
Received 3 May 2005; received in revised form 1 November 2005; accepted 13 December 2005
Abstract
A sequentially coupled finite element model of the friction stir welding process has been utilized to study the residual stresses caused by thethermal cycles during friction stir welding of metals. This is a two step simulation process. In the first step, the thermal history is predictedfrom an input torque based thermal model. The temperature history generated by the thermal model is then sequentially coupled to a mechanicalmodel that predicts the residual thermal stresses. The model does not deal with the severe plastic deformations within the weld nugget and thethermo-mechanically affected regions, a fact that may cause modeled results to deviate from experimentally measured residual stresses. The modelis three-dimensional and uses temperature dependent material and thermo-physical properties. Three different materials, AA-2024, AA-6061 andSS 304 L, have been studied.© 2006 Elsevier B.V. All rights reserved.
K
1
wiajaoofpmtqacs
itgu
0d
eywords: Friction stir welding; AA-2024; AA-6061; SS 304 L; Thermal stress
. Introduction
Friction stir welding (FSW) has become a technology ofidespread interest because of its numerous advantages, most
mportant of which is its ability to weld otherwise unweld-ble alloys. Although originally perceived as a technology foroining conventionally unweldable materials, mostly alloys ofluminum, it is currently being investigated for a number ofther materials including ferrous alloys like stainless steels. Onef the reasons why academic and research interests are beingocused on the use of FSW for these materials is its capability ofroducing high quality solid-state joints. Due to the absence ofelting, the temperatures involved are considerably lower than
hose encountered in fusion welding techniques and the conse-uent residual thermal stresses are expected to be much lowers well. However, the motion constraints imposed by the rigidlamping of the weldpieces can lead to significant rise in residualtresses.
Residual stresses in welded metals play an important rolen understanding the response of a friction stir welded struc-ure subjected to general loading as well as its fatigue crack
tensile residual stresses have a detrimental accelerating effect.Sutton et al. [10] have reported experimental residual stresses forAA-2024-T3 friction stir butt welds. They used neutron diffrac-tion technique for strain measurements and from there computedthe residual stresses using an isotropic, homogeneous form ofHooke’s law. They found the longitudinal stress componentsto be the largest tensile residual stresses and reported a maxi-mum value of 105 MPa with the highest stresses occurring nearthe crown side of the specimen over the entire FSW region.The highest transverse stress was approximately 75 MPa withthe largest stresses occurring at mid-thickness. The through-thickness stress component was found to be compressive in theweld zone with a maximum of −40 MPa located near the rootside about 12 mm from weld centerline, with a rapid transitionto tensile stresses outside the shoulder diameter. Staron et al.[13] also reported the residual stresses observed in friction stirwelded AA-2024-T351 sheets using neutron diffraction mea-surements. Residual stresses were calculated from the measuredresidual strains with E = 70 GPa and ν = 0.345. Maximum longi-tudinal stress was reported to be about 65 MPa on the retreatingside and about 55 MPa on the advancing side. Inside the weld
rowth resistance [10]. It is well known that compressive resid-al stresses tend to retard the growth of fatigue crack while
∗
zone, the maximum of 50 MPa was reported to be close to thecenterline. Additional measurements at 1.5 mm below the topsurface and 1.5 mm from the bottom surface showed no varia-tion of transverse and normal stresses through the thickness ofthe sheet while the maximum longitudinal stress was reportedlyo
Corresponding author. Tel.: +1 803 777 1578; fax: +1 803 777 0106.E-mail address: [email protected] (J.A. Khan).
924-0136/$ – see front matter © 2006 Elsevier B.V. All rights reserved.oi:10.1016/j.jmatprotec.2005.12.013
nly 20 MPa at the bottom surface. Residual stress component

196 M.Z.H. Khandkar et al. / Journal of Materials Processing Technology 174 (2006) 195–203
in the normal direction was seemingly quite high. These obser-vations are significantly divergent from those of Sutton et al.[10] most likely because of the cooling that they used duringwelding.
Reynolds et al. [9] used similar techniques to report resid-ual stresses for friction stir welded SS 304 L specimens. Theyfound the residual longitudinal stresses to be close to the basemetal yield strength with negligible variation in the through-thickness direction. However, they reported significant variation(up to 150 MPa) in transverse stresses in the through-thicknessdirection that changed from tensile at the crown-side to com-pressive at the root side of the weld. The variation is likely dueto the faster cooling experienced by the root of the weld rela-tive to the crown because of the intimate contact between theroot side and the backing plate. They also noted that the mini-mum strength region occurs in the HAZ and suggested that theyield strength of the relatively weak HAZ might limit the resid-ual stress levels. In their study, the 300 rpm welds showed finergrain structure as compared with the 500 rpm welds. Both weldshad higher strengths than the base metal, but 300 rpm weld hadthe higher value of the two. 0.2% offset yield strengths for base,300 rpm weld and 500 rpm welds were reported to be 295, 430and 360 MPa, respectively. The tensile strengths were 667, 735and 678 MPa, respectively. They opined that the residual stressin the tensile specimens was relieved when the specimens werecut from the welded plate. They found that longitudinal stress(σ
ssee
oucstloept
smbts(
tfeatt
that are generated owing to the temperature changes within theconstrained metal plates. Aluminum alloys AA-2024, AA-6061and stainless steel 304 L, one of the most widely used of stainlesssteels, has been used as the materials of choice. Experimentaltemperature and stress measurements are also presented in orderto validate the numerically predicted results. A commerciallyavailable finite element package, ABAQUS, was used for thecomputations.
2. Model description
The sequentially coupled model consists of two parts: a ther-mal model followed by a mechanical model. For the thermalmodeling purposes, only one of the weldplates may be used inorder to expedite the model runtime. Since the temperature dis-tributions were found to be close to symmetric about the weldcenterline by previous researchers, this is a reasonable approachfor the sake of efficiency. However, in the mechanical model,such symmetry is interpreted as totally constrained displace-ment boundary conditions at the centerline plane of symmetryand leads to artificially high residual stresses. The followingsubsections explain the different models used for the presentstudy.
2.1. Thermal model
Kie
∇wca
twttt
q
wdpre
f1stb(
σyy) varied only slightly with depth. The maximum values ofyy were similar in both welds and close to the base metal yieldtrength. The region of high tensile, residual and longitudinaltress was found to be wider in the 500 rpm weld (20 mm onither side of centerline) than in the 300 rpm weld (15 mm onither side) due to the higher temperatures.
Oosterkamp et al. [12] reported residual stress measurementsn AA-7108-T79 alloy and observed that the texture and resid-al strains produced by thermo-mechanical FSW are not closelyoupled as non-uniform plastic deformation could lead to hightress gradients. Their longitudinal maps indicated a through-hickness tensile strain field which was not spread perpendicu-arly to the surface but was tapered with z (depth direction) andutside this region was a steep change of the strain field that lev-led out in compression. Transverse orientation peak positionatterns showed a smaller but more distinct variation betweenhe face and the root of the weld.
Ge [15] implemented an equilibrium-based weighted leastquare algorithm to reconstruct the residual stress tensors fromeasured residual stress data. Although she used stress-free
oundary conditions at the edges, her computations indicatedhe tensile and longitudinal stresses dipped to the compressiveide beyond the HAZ. She also came up with fluctuating normalthrough-thickness) stress profiles within the HAZ.
In the present study, an attempt has been made to predicthe thermal residual stresses developed in metal alloys uponriction stir welding by employing sequentially coupled finitelement analyses. In a sequentially coupled analysis, thermalnalysis is performed first to generate temperature histories forhe welding process which is then utilized as thermal input tohe mechanical analysis for the prediction of stresses and strains
The thermal model has been adapted from that proposed byhandkar et al. [1] which was used to successfully predict trends
n temperature history and thermal profiles. The energy balancequation for the thermal model is given by:
(k∇T ) + q − ρcT = 0 (1)
here T is the temperature, T is the rate of change of temperature,is the specific heat, ρ is the density, k is the thermal conductivitynd q is the rate of moving heat generation per unit volume.
The heat input is correlated to experimentally measuredorque data by assuming a uniform shear-stress working on theorkpiece–tool interfaces. The heat generated is attributed to
he tool interfaces in contact with the workpiece on the basis ofhe torques involved. The finite element heat flux can be relatedo the radial position, r, as follows:
˙(r) = Pavr
(2/3)πr3o + 2πr2
i h(2)
here q(r) is the local heat flux and is linearly related to the radialistance (r) from the tool center, Pav is the measured averageower input during the welding process, ro is the shoulder radius,i is the pin radius and h is the pin length. Details of this finitelement formulation can be found in ref. [1].
Newtonian boundary conditions were applied to the free sur-aces of the workpiece with a free convection coefficient of5 W/m2 K. The backing plate and the machine base had beenimplified by one thick plate with the addition of a thermal con-act resistance at the interface between the workpiece and theacking plate. The value of the thermal contact conductancethe inverse of contact resistance) used in the model was chosen

M.Z.H. Khandkar et al. / Journal of Materials Processing Technology 174 (2006) 195–203 197
based upon the results from Khandkar et al. [1] that showedthat 5000 W/m2 K was a reasonably good approximation foraluminum workpiece and plain carbon steel backing plate. Con-sequently a lower value of 3000 W/m2 K was used for the caseof stainless steel 304 L workpiece and plain carbon steel back-ing plate since stainless steel is much harder than aluminum andthe thermal contact between metals is affected, inter alia, by thehardness of the contacting metals.
At the bottom of the thick plate that represents the backingplate as well as part of the machine base, two different bound-ary conditions were tested: a Dirichlet boundary condition (Troom temperature) and a Newtonian boundary condition witha simplified convection coefficient simulating the heat transferscenario prevailing there. The Dirichlet boundary condition isquite intuitive since the welding machine is a huge thermal massand is expected to maintain its temperatures close to the roomtemperature a few centimeters below the workpiece. The useof the simplified convection coefficient is once again based onthe findings of Khandkar et al. [1]. A value of 1000 W/m2 Kwas used for the present analyses and the corresponding datapresented in Section 4.
2.2. Mechanical model
The second step of the current analysis involves the use oftaaretfsrv∫
t(
wstvot
mpn
d
w
i
the first two terms in Eq. (6) represents the total mechanicalstrain dεM
ij . In the current model, however, no mechanical forcesare considered and only the forces arising out of the volumet-ric thermal expansion are taken into account. As a result, it isonly the thermal strain increment that contributes to the resid-ual stresses. This thermal stress, however, can constitute bothelastic and plastic components. The constitutive equation of thethermal elastic–plastic continuum, arrived through the principleof virtual work, can be expressed as:
∫Ω
dσij δdεij dΩ −∫
Ω
dbi δdui dΩ −∫
Γt
dti δdui dΓ = 0 (7)
where dti is the boundary traction, dbi is the body force, dui isdisplacement, Ω is the domain of interest and Γ t is the boundaryon which boundary tractions are prescribed.
The sequentially coupled mechanical model eliminated thebacking plate/machine base part from the computational domainand used only the workpiece part from the thermal analysis.Since the current mechanical model deals only with residualthermal stresses, the only forces considered were those causedby the thermal expansion of the workpiece material plus thedownward force exerted by the tool shoulder. Constrained ther-mal expansion can cause significant stress. For typical structuralmetals, temperature changes of about 150 C can lead to yield-ing if the thermal expansion is fully constrained [14]. Therefore,ptpvcst
3
mrdcfrectecPisd
σ
ε
he thermal histories predicted by the previous thermal models an input for a mechanical model that ignores all other forcespart from those arising out of thermal expansion. Weld-inducedesidual stresses are typical macro residual stresses and can bestimated using continuum mechanics model without regard tohe polycrystalline nature of the material [11]. Additionally,riction stir welds are free of phase changes because of theirolid-state nature. Therefore, the force equilibrium can be rep-esented by the following differential equations in a Lagrangianiewpoint:
S
t dS +∫
V
f dV = 0 (3)
= n · (4)
∂
∂x
)· + f = 0 (5)
here V is volume of space occupied by the material at thepecific point in time, S is the surface bounding this volume,is surface traction per unit area, f is the body force per unitolume, σ is the true or Cauchy stress matrix and n is the unitutward normal to the surface S. A more elaborate treatment ofhese mechanical model equations is available in ref. [8].
The workpiece is assumed to be an elastic–plastic isotropicaterial. Additive strain decomposition can be used to decom-
ose the differential form of the total strain into three compo-ents:
εij = dεEij + dεP
ij + dεTij (6)
here dεEij is the elastic strain increment, dεP
ij is the plastic strain
ncrement, and dεTij is the thermal strain increment. The sum of
articular care must be exercised in defining boundary condi-ions to avoid overconstraining the thermal expansion. In theresent study, the workpiece is considered to be constrained ofertical motion at the bottom surface with totally rigid boundaryonditions applied at the clamping locations. The motion con-traints are gradually released 3–5 min after the completion ofhe welding process.
. Material properties
While temperature dependent thermo-physical and thermo-echanical properties are needed to appropriately compute the
esidual thermal stresses, it is rather unfortunate that very sparseata are available from non-proprietary literature. In an idealase, property values over the entire gamut of temperaturesrom room condition all the way up to the melting point areequired for an accurate simulation. The thermo-physical prop-rties required for the current models are specific heat, thermalonductivity and density while the thermo-mechanical proper-ies required for successful simulation of the material model arelastic modulii, Poisson’s ratio and thermal expansion coeffi-ients as well as the true stress versus plastic strain correlations.lastic strain values are required to define the strain harden-
ng behavior in classical metal plasticity. The true stress plastictrain relationships can be calculated from nominal stress strainata using the following formulae:
true = σnom(1 + εnom) (8)
plln = ln(1 + εnom) − σtrue
E(9)

198 M.Z.H. Khandkar et al. / Journal of Materials Processing Technology 174 (2006) 195–203
Fig. 1. Thermo-physical properties of SS 304 L (left panel), AA-2024 (middle panel) and AA-6061 (right panel).
where E is the Young’s modulus and εplln is the logarithmic plastic
strain.For the purpose of the current study, temperature-dependent
thermo-mechanical properties were used to the extent that theycould be mined from literature including, but not limited to,refs. [3–7]. It was most difficult to find stress strain behaviordata of the metals studied over the entire range of temperaturesconcerned. The following paragraphs present a summary of thedata culled and the methodology to estimate any unavailableproperty data.
3.1. Thermo-physical properties
Temperature-dependent thermo-physical properties for thematerials (304 L and plain carbon steel) were adapted from lit-erature [2–6]. Fig. 1 shows the most important thermo-physicalproperties used for the SS 304 L, AA-2024 and AA-6061.
3.2. Thermo-mechanical properties
The thermal expansion coefficient for 304 L was calculatedfrom the relationship cited by Mills [5] for SS 304 and isexpressed in Eq. (10):
α(T − 25 C) = [16 + 0.006T ] × 10−6 (10)
wt
os
Temperature dependent Poisson’s ratios were also unavail-able and room temperature values of 0.29, 0.35 and 0.35 wereused for SS 304 L, AA-2024 and AA-6061, respectively.
As for the true stress versus plastic strain relationships, only0.1% or 0.2% yield stresses were available at different tem-peratures and a strategy had to be devised in order to arrive atsome relationship for stress versus plastic strain over the entirerange of deformation. A piecewise linear interpolation schemewas used assuming that there is no plastic strain up to the 0.1%yield stress and that plastic strain equals the percent elongationat the ultimate stress for any specific temperature. Any interme-diate yield strengths, if reported, were incorporated in between.Fig. 2 shows the relationships for true stress versus plastic strainused in the present study.
The true stress versus plastic strain values for SS 304 Lat room temperature were calculated from experimental datawhereas the values at higher temperatures were adapted fromliterature. At any particular temperature, the maximum stressvalues available were assumed to remain unchanged for any fur-ther increase in plastic strains. This was done due to lack ofavailable data. As for AA-2024 and AA-6061, the temperaturedependent property values were adapted from the yield strength,ultimate strength and elongation values found at the ASM Mate-rials Info Database [7].
4
wAd
panel
here α(T − 25 C) represents the mean coefficient of linearhermal expansion from 25 C to the temperature T C.
For AA-2024 and AA-6061, constant expansion coefficientsf 2.32 × 10⁻⁵ and 2.36 × 10⁻⁵, respectively, had been usedince temperature dependent relationships could not be found.
Fig. 2. Stress vs. plastic strain curve for SS 304 L (left
. Results and discussion
The sequentially coupled thermal and mechanical modelsere implemented on a commercially available FEM codeBAQUS. The following subsections present the results for theifferent materials.
), AA-2024 (middle panel) and AA-6061 (right panel).
M.Z.H. Khandkar et al. / Journal of Materials Processing Technology 174 (2006) 195–203 199
Fig. 3. Top (left panel) and end (right panel) views of the calculation domain (not to scale).
4.1. SS 304 L
For the thermal analysis part, one of the two weldplates wastaken into consideration with an equal sized but thicker plateattached to its bottom representing the backing plate as well aspart of the machine base. A non uniform mesh with 18,564 nodesand 14,850 hexagonal brick elements was used to discretize thecomputational domain. The workpiece was discretized into 8100elements with 9996 nodes while the backing plate portion had6750 elements and 8568 nodes. Fig. 3 shows a snapshot of thediscretized domain (top and end views).
The experimental data used in this work have been takenfrom the work of Reynolds et al. [9] carried out at the sameuniversity as the current authors’. Reynolds et al. [9] presentedthe time–temperature history, weld structure and strengths, aswell as the residual stress distributions in two different weldsmade with 3.17 mm (0.125 in.) thick 304 L stainless steel sheetswith a welding speed of 1.7 mm/s (4 in./min) and two differenttool rotations of 300 and 500 rpm, respectively. The same con-ditions were used for the simulations performed in the presentwork with one exception—the length of weld used for the simu-lation was 250 mm instead of the 279 mm experimental length.However, this change in length does not affect the numericalresults or the comparison between the simulated results and theexperimental results since a quasi-steady state of thermal distri-bution is established around the tool vicinity soon after the starto
f
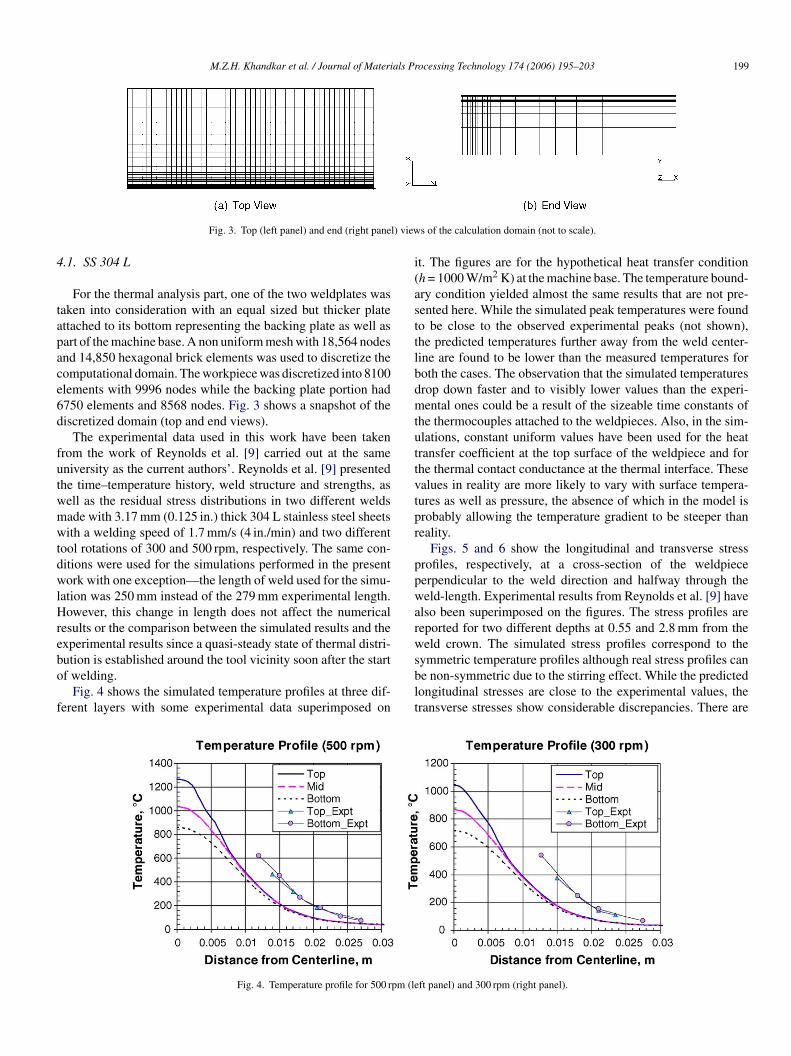
it. The figures are for the hypothetical heat transfer condition(h = 1000 W/m2 K) at the machine base. The temperature bound-ary condition yielded almost the same results that are not pre-sented here. While the simulated peak temperatures were foundto be close to the observed experimental peaks (not shown),the predicted temperatures further away from the weld center-line are found to be lower than the measured temperatures forboth the cases. The observation that the simulated temperaturesdrop down faster and to visibly lower values than the experi-mental ones could be a result of the sizeable time constants ofthe thermocouples attached to the weldpieces. Also, in the sim-ulations, constant uniform values have been used for the heattransfer coefficient at the top surface of the weldpiece and forthe thermal contact conductance at the thermal interface. Thesevalues in reality are more likely to vary with surface tempera-tures as well as pressure, the absence of which in the model isprobably allowing the temperature gradient to be steeper thanreality.
Figs. 5 and 6 show the longitudinal and transverse stressprofiles, respectively, at a cross-section of the weldpieceperpendicular to the weld direction and halfway through theweld-length. Experimental results from Reynolds et al. [9] havealso been superimposed on the figures. The stress profiles arereported for two different depths at 0.55 and 2.8 mm from theweld crown. The simulated stress profiles correspond to thesymmetric temperature profiles although real stress profiles canblt
pm (le
f welding.Fig. 4 shows the simulated temperature profiles at three dif-
erent layers with some experimental data superimposed on
Fig. 4. Temperature profile for 500 r
e non-symmetric due to the stirring effect. While the predictedongitudinal stresses are close to the experimental values, theransverse stresses show considerable discrepancies. There are
ft panel) and 300 rpm (right panel).

200 M.Z.H. Khandkar et al. / Journal of Materials Processing Technology 174 (2006) 195–203
Fig. 5. Longitudinal stress profiles for 500 rpm (left panel) and 300 rpm (right panel) welds.
three significant reasons behind the disparities: (i) steep dropat weld centerline followed by steep rises are believed to becaused by the assumptions of symmetry which impose motion-constrained boundary conditions at the plane of symmetry;(ii) the model did not consider the plastic work within thethermo-mechanically affected zone caused by the stirring of theFSW tool whereas the experimental results report total residualstresses; (iii) thermo-mechanical property values for thematerial in consideration were not available for the entire rangeof temperatures involved. In fact, for higher temperatures, only0.2% yield stress and 0.1% yield stress values were availablefor temperatures up to 750 C and were adapted for the modelas described in the material properties section. It is expectedthat incorporation of true thermo-mechanical properties into themodel can significantly improve the stress predictions. It shouldbe noted here that only one of the weldplates were used for themodeling and the full-field stress distributions were created bymirroring the data about the weld centerline. This is a deviationfrom the fact that within the thermo-mechanically affected zone,the stress distribution is not likely to be symmetric because of therotation of the tool. However, beyond this narrow zone, the restof the material is either only heat-affected or unaffected parentmetal. These are the regions that should demonstrate symmetri-cal residual stress patterns if the material were truly isotropic innature.
4.2. AA-2024
Figs. 7–9 show the transverse, longitudinal and through-thickness (normal) residual thermal stress profiles for AA-2024alloy. Here, however, both the plates are included in the compu-tational domain in order to avoid the unusually high transversestresses observed around the plane of symmetry in the case ofSS 304 L. The results are reported at five different layers –0.5 and 1.5 mm from the top surface, the mid-plate thicknessand 1.5 and 0.5 mm from the bottom surface – at two differ-ent locations. Each plate modeled was 6.35 mm thick, 304 mm(12 in.) long and 102 mm (4 in.) wide. In line with the obser-vations reported by Sutton et al. [10], we also see here thatthe longitudinal stresses have the highest values. However, theirvalues are much higher than what was reported by Sutton et al.[10] although the maximum values of the transverse stresses arecloser to the experimentally reported data. The magnitude ofthe highest longitudinal stress is around the yield strength of thematerial at room temperature. The longitudinal stresses level outin compression while the transverse stresses, much weaker thanlongitudinal stresses, show through-thickness variation and levelout to zero. Similar trends were also observed by Oosterkampet al. [12] in their experiments with AA-7108-T79. The normalstress components have fluctuating profiles that vary betweentensile and compressive.
m (le
Fig. 6. Transverse stress profiles for 500 rp ft panel) and 300 rpm (right panel) welds.
M.Z.H. Khandkar et al. / Journal of Materials Processing Technology 174 (2006) 195–203 201
Fig. 7. Transverse stress profiles for AA-2024 welds.
Fig. 8. Longitudinal stress profiles for AA-2024 welds.
One interesting aspect to note is how the stresses vary alongthe direction of weld as represented by the second set of plotsin Figs. 7–9 that give the stress profiles at the mid-distance ofthe weldlength. Tensile transverse stresses are lower here whiletensile longitudinal stresses are higher. This section was sub-ject to the clamping constraints and is marked by fluctuatinggradients in all three of the transverse, longitudinal and normalstress components in the regions under the clamp. Although
the values for longitudinal stresses are considerably higher, theshape and trends of the stress distributions are in excellent agree-ment with the reconstructed stress profiles reported by Ge [15].Ge also found compressive longitudinal stresses in the regionsbeyond the HAZ while fluctuating normal (through-thickness)stresses within the HAZ. The peak values for the tensile trans-verse stresses are also comparable with her reconstructed stressdata.
Fig. 9. Through-thickness (normal) stress profiles for AA-2024 welds.

202 M.Z.H. Khandkar et al. / Journal of Materials Processing Technology 174 (2006) 195–203
Fig. 10. Transverse stress profiles for AA-6061 welds.
Fig. 11. Longitudinal stress profiles for AA-6061 welds.
4.3. AA-6061
The different simulated stress profiles for AA-6061 alloy areshown in Figs. 10–12. As with AA-2024, both the plates wereincluded in the computational domain to avoid the artificiallyhigh transverse stresses at the weldline. The results are reported
at five different layers – 0.5 and 1.5 mm from the top surface, themid-plate thickness and 1.5 and 0.5 mm from the bottom surface– at two different locations. Each plate modeled were 8 mm thick250 mm long and 102 mm wide. Here, however, clamps were notpresent at the middle of the weld length and no added fluctua-tions are observed close to the outer edges in contrast to the
Fig. 12. Through-thickness (normal) stress profiles for AA-6061 welds.

M.Z.H. Khandkar et al. / Journal of Materials Processing Technology 174 (2006) 195–203 203
similar locations in the results for AA-2024. This suggests thatthe clamping constraints probably have some localized effectson the residual stress distributions directly underneath. Apartfrom this, the residual stresses follow similar trends where thetransverse stresses are almost entirely tensile and the longitudi-nal stresses are tensile at around the weldline and gradually levelout in compression beyond the heat affected zone. Here again,the longitudinal stress profiles correspond to the temperatureprofile across the weld cross-section and have little variation inthe through-thickness direction for the most part of the profile.The overall trends and shapes of the stress profiles are signifi-cantly similar to the AA-2024 profiles. The highest tensile stresscomponents are once again the longitudinal components whichare slightly lower than the room temperature yield strengths ofthe materials. This implies that friction stir welded structuresare more likely to fail in tension than in compression. However,it should be kept in mind that the magnitudes of the simulatedstresses can be significantly influenced by the simplified prop-erty assumptions as well as the exclusion of the plastic stirringwithin the simulated tool-zone.
5. Summary and conclusion
A mechanical model was sequentially coupled to a thermalmodel of the friction stir welding process in order to assessthe residual thermal stresses that develop during the weldingp
stitaohhwlia
mbnwa
le
While the orders of magnitude of the modeled results weregenerally acceptable, disparities still remained in some cases.The present model only takes into consideration the thermaleffects on residual stresses whereas the total residual stressespresent in friction stir welded specimens are caused by both ther-mal and deformational mechanical forces. The stirring effect ofthe tool is possibly responsible for relieving the stresses withinthe thermo-mechanically affected zone (TMAZ) to some extentthat can otherwise be very high owing to the higher temperaturesin that zone and the rigid clamping of the weldpieces. Incorpo-rating these aspects of the physics of the FSW process into themodel should improve upon the irregularities encountered. Thisis one avenue that is yet to be explored and will likely requiresignificant computational time and cost.
References
[1] M.Z.H. Khandkar, J.A. Khan, A.P. Reynolds, Prediction of temperaturedistribution and thermal history during friction stir welding: an inputtorque based model, Sci. Tech. Weld. Join. 8 (June (3)) (2003) 165–174.
[2] F.P. Incropera, D.P. DeWitt, Fundamentals of Heat and Mass Transfer,fourth ed., John Wiley, 1996.
[3] ASM Metals Handbook, vol. 1, 10th ed., 1990.[4] Alloy Digest, Data on World Wide Metals and Alloys, ASM Interna-
tional (multiple filings on 304 L and equivalent alloys including filingsSS-254, SS-722), 2002.
[
[
[
[
[
[
rocess.Longitudinal stress values were found to be the highest ten-
ile stress components in all the three cases and had values closeo their room temperature yield strengths. However, most exper-mental stress values reported in literature are much lower thanhese with significant disparities among the experimental resultss well. In the current work, the time frames for simulations weref the order of 10–30 min beyond the completion of the weld andence no natural aging of the welds were possible. On the otherand, weeks might have passed before the strain measurementsere taken in real experimental situations; however, it is not
ikely that natural ageing alone caused so much discrepancy. Its perhaps more likely that the finite element meshes need to bedaptive in nature to better simulate the residual stresses.
Shapes of the simulated stress profiles demonstrate very goodatch with stress profiles reconstructed through equilibrium-
ased weighted least square method by Ge [15]. The longitudi-al stress profile levels out into compression beyond the HAZhereas the through-thickness normal stresses display a fluctu-
ting trend within the HAZ.Clamping constraints and locations may have significant
ocalized effects on the stress components in the unaffected par-nt metal beyond the heat-affected zone.
[5] K.C. Mills, Recommended Values of Thermophysical Properties forSelected Commercial Alloys, Woodhead Publishing Ltd./ASM Interna-tional, 2002, pp.127–134.
[6] AST Data Sheets, AvestaPolarit Stainless Tube AB, http://www.ast.avestasheffield.com.
[7] ASM Materials Info Database http://www.asminternational.org/materialsinfo.
[8] ABAQUS Theory Manual, ver. 5.8, Hibbitt, Karlsson and Sorenssen Inc,1998.
[9] A.P. Reynolds, W. Tang, T. Gnaupel-Herold, H. Prask, Structure, proper-ties and residual stress of 304L stainless steel friction stir welds, ScriptaMater. 48 (9) (2003) 1289–1294.
10] M.A. Sutton, A.P. Reynolds, D-Q. Wang, C.R. Hubbard, A study ofresidual stresses and microstructure in 2024-T3 aluminum friction stirbutt welds, J. Eng. Mater. Technol. 124 (2002) 215–221.
11] P.J. Withers, H.K.D.H. Bhadeshia, Residual stress. Part 2. Nature andorigins, Mater. Sci. Technol. 17 (April) (2002) 366–375.
12] L.D. Oosterkamp, P.J. Webster, P.A. Browne, G.B.M. Vaughn, P.J. With-ers, Residual stress field in a friction stir welded aluminium extrusion,Mater. Sci. Forum 347–349 (2000) 678–683.
13] P. Staron, M. Kocak, S. Williams, Residual stresses in friction stirwelded Al sheets, Appl. Phys. A Mater. Sci. Process. 74 (Suppl.) (2002)S1161–S1162.
14] ABAQUS/Standard User’s Manual, ver. 5.8, vol. 1, Hibbitt, Karlssonand Sorenssen Inc., 1998 (Sections 11.1.1 and 12.1.2).
15] Y. Ge, A study of the effect of weld residual stress on the fatiguebehavior in friction stir welds of 2024-T3 aluminum alloy, Master’sThesis, University of South Carolina, Columbia, SC, USA, 2004.
Copyright © 2022 FDOKUMEN