Impact Evaluation Findings of STiR Education's Programme in ...
58
Impact Evaluation Findings of STiR Education’s Programme in Karnataka State, India November 2020 Year 1 Evaluation Report
-
Upload
khangminh22 -
Category
Documents
-
view
0 -
download
0
Transcript of Impact Evaluation Findings of STiR Education's Programme in ...

Impact Evaluation Findings of STiR Education’s Programme in Karnataka State, India
November 2020Year 1 Evaluation Report


Contents1. Executive Summary 1
2. Programme and Longitudinal Study Overview 5
3. Study Context 6
4. Report Structure 7
5. Programme Monitoring Data 8
6. Headline Findings 96.1. Intrinsic Motivation 96.2. Engagement 176.3. Learning Time and Intentional Teaching 216.4. Foundations of Curiosity and Critical Thinking 246.5. Safety 276.6. Self-Esteem 29
7. Measurement Approaches 307.1. Measuring Safety and Punishment 307.2. Measuring Intrinsic Motivation 307.3. Measuring Teacher Performance 317.4. Measuring the Quality of STiR Activities Using Rubrics 31
8. Conclusions and Recommendations 32
9. Annexes 33

Impact Evaluation Findings of STiR Education’s Programme in Karnataka State, Indiai
Tables, Graphs and Figures
Table 25: Teacher Actions to Support Student Achievement 29
13
5
14
Table 23: Self-Reported Corporal Punishment Practices by Teachers and Head Teachers 28
Table 24: Frequency of Physical and Verbal Abuse Reported by Students 28
11
Table 22: Classroom Observations of Critical Thinking Practices 26
Table 21: Teacher Application of Specific Teaching Practices 23
Table 15: Teacher Self-Reported Observations by Peer Teachers 19
Table 16: Teacher Opinions on Instructional Improvements from Peer Feedback 19
Table 19: Students’ Attendance on Day of Classroom Observation 21
Table 20: Teacher Self-Reported Understanding and Use of LIC Strategies 22
Table 17: Classroom Observation of Student Engagement 20
Table 18: Classroom Observations of Inclusive Teaching Methods 21
Table 11: ELs/ELMs Rating of Teacher Sharing Meetings 15
Table 12: Frequency of Self-Reported Teacher Observations from Head Teachers 17
Table 13: Frequency of Self-Reported Head Teacher Observations of Teachers 17
Table 14: Stages Head Teachers Follow in Giving Feedback to Teachers 18
Table 7: Teacher and Head Teacher Absence Frequency Over Two Weeks 10
Table 8: Reasons for Teacher and Head Teacher Absence from Work Over the Last Two Weeks 10
Table 9: Self-Reported Teacher Attendance of Sharing Meetings 14
Table 10: Teacher Rating of Teacher Sharing Meetings 15
Table 6: Teacher and Head Teacher Self-Reported Motivation 9
Table 5: Teacher, Head Teacher and ELs/ELMs Self-Reported Career Aspirations 9
Table 2: High Level Findings about ELs/ELMs Compared to STiR Progress Pathway Ambitions 8
7
Table 3: High Level Findings about Teachers/HTs Compared to STiR Progress Pathway Ambitions 8
Table 4: High Level Findings about Students to STiR Progress Pathway Ambitions 8
Graph 1: Teachers’ Daily Time Use
Graph 2: EL/ELM Overall Time Use by Task Category
Figure 1: STiR’s Theory of Change
Figure 2: Example of the Success Descriptor Rubric Used to Evaluate the Quality of a STiR Activity (Teacher Sharing Meetings)
Table 1: STiR’s 5-Year Progress Pathway Indicators

Impact Evaluation Findings of STiR Education’s Programme in Karnataka State, India ii
AcronymsBRP Block Resource Person
CRP Cluster Resource Person
EL Education Leader (includes CRPs)
ELM Education Leader Manager (includes BRPs)
LIC Learning Improvement Cycle

Impact Evaluation Findings of STiR Education’s Programme in Karnataka State, Indiaiii
Acknowledgements STiR’s programme in India is led by a team of highly passionate professionals who work tirelessly to coach and support government officials across the country. Karnataka, one of the two southern states where we implemented this study, moved to a system-led approach about a year and a half before this study started. This meant inclusion of all primary grade schools within a district in the programme and hence, also a significant change in terms of how STiR’s programme team supports their districts. The programme changed from being focused on direct implementation toward energising and coaching government officials at different levels of the system to role model the foundations of lifelong learning. This was a daunting task and required STiR’s programme team to be compassionate, entrepreneurial, and resilient.
The findings in this report indicate initial signs that STiR’s partnership with the Department of State Educational Research and Training, Karnataka, as part of the system-led approach can play an important role in creating a sense of shared purpose to support teachers and, ultimately, student learning. We’d like to acknowledge particularly the hard work among STiR’s programme leads who were leading the work in the study districts when data collection took place; namely, Biji Kochuveettil Pillai and Raghu Ramanujam, as well as all of the rest of STiR’s programme team who are leading similar efforts across Karnataka.
We’d also like to acknowledge Rein Terwindt, Viji Iyer, Safiya Husain, Perwinder Singh, Neha Drolia, Gunjjan Sharma, Sharath Jeevan, Mark Butcher, and John McIntosh for their support as part of this first year of the longitudinal study.

Impact Evaluation Findings of STiR Education’s Programme in Karnataka State, India 1
EXECUTIVE SUMMARY
Ichuli, an independent research organisation headquartered in Uganda, was commissioned by STiR Education to understand longitudinal trends and impacts from their programme over 4 years in eastern Uganda and two states – Karnataka and Tamil Nadu – in India. The study’s objective is to test STiR’s 5-year change hypothesis to understand how improvements in intrinsic motivation at different levels of the education system contribute to improved teaching practices and student learning.
The findings from Year 1 of the study are presented in this report to provide a lens on the progress made by Year 2 of STiR’s intervention in Karnataka. Results present linkages and outcomes between the data collected across three levels of stakeholders in the education system – students, teachers and head teachers, and education officials. Findings are organised by the key measurement areas STiR uses to evaluate behaviour change: engagement, safety, self-esteem, curiosity and critical thinking, and learning time and intentional teaching.
Throughout the report, findings from Year 1 of the longitudinal study are compared against the achievements STiR anticipated for each indicator by the completion of Year 2 of their progress pathway, which expects stakeholders to be establishing routines which they will later be expected to strengthen and improve during Years 3-5 of the programme.
Overall, the findings from Year 1 of the study demonstrated that STiR’s programme met their targets as outlined for Year 2 of the Progress Pathway. All findings showed that stakeholders within the education system have established routines within each of the foundations of lifelong learning, the overarching achievement expected by Year 2. Now that routines among stakeholders have been established, STiR must strive to ensure that Year 3 of the programme continues well along the Progress Pathway and strengthens a culture of improvement among all stakeholders.
Specifically, the evaluation found that the concepts of mentoring, role modelling and trying out new practices are beginning to happen with some regularity – key to this year’s focus of helping key stakeholders establish routines. But, the evaluation found that these practices currently often lack substance and depth. Additional efforts are needed to ensure that stakeholders are critically engaging within these processes and practices through deeper reflection on practice and driving school and system improvements in order to drive lifelong learning.
The evaluation has also shown that driving impact through intrinsic motivation is a process. Teachers and ELs/ELMs expressed positivity towards the STiR programme and reported high levels of self-reported motivation and professional gain from their involvement. These self-reported indicators are an important measure of personal opinions on motivation, and they show successful results at this stage of the journey. However, motivation must also be measured using externally verifiable behaviours and proxy measures, such as attendance and commitment to completing daily roles and programme activities. Currently, these measures show that motivational drive still needs to be improved across the education system for the intervention to be successful in embedding and sustaining motivation in stakeholders by the end of the five-year support cycle.
SPECIFIC HEADLINE FINDINGS Overall findings from the first year of the study were positive and illuminated where the programme is on track and performing to expectation according to Year 2 of STiR’s progress pathway metrics as well as which aspects of the programme need improvement in the coming years. The following findings were identified as key learnings from Year 1 of the study:
1

Impact Evaluation Findings of STiR Education’s Programme in Karnataka State, India2
Headline Finding 1: Teachers and head teachers overwhelmingly reported liking teaching and the majority of them would like to stay in their current positions in education. However, 44% of teachers, 36% of head teachers and 37% of ELs/ELMs reported being only “somewhat motivated” or “not motivated” at work on most days and 41% of teachers and head teachers and 61% of ELs/ELMs self-reported being absent at least one time in the past two weeks.
The study found that though the vast majority of teachers and head teachers enjoy teaching and are satisfied with their current positions, many also self-reported somewhat low levels of motivation. Their frequent absences and time off-task throughout their working days may also be indicative of lackluster motivation levels and possibly influenced by the frequent absences of their superiors, creating a possible negative role modelling effect. Although teachers are primarily on-task when in the classroom, their frequent absences and time off-task throughout the working day has a significant effect on learners because it reduces the learning time and quality of learning for pupils. Lost teaching and learning time in public Indian schools has been uncovered by other similar studies and represents a danger point which has the potential to undermine the STiR programme’s focus on building foundations of lifelong learning among students and within all levels of the education system.
Headline Finding 2: Between 79% and 84% of teachers reported participating in sharing meetings in 2018 and 2019, which is on target for the participation rate STiR expects. Teachers, ELs/ELMs and independent observers rated the quality of these meetings as a 3/5, on average.
STiR focuses on role-modelling and developing positive relationships amongst education system actors through Learning Improvement Cycles (LICs), which promote peer-to-peer linkages and provide learning opportunities. LICs are delivered to the teachers and head teachers by ELs during sharing meetings, which are now compulsory for 80% of teachers. According to teacher sharing attendance data collected during the study, STiR has already achieved this attendance target. Ichuli enumerators attended sharing meetings to observe their quality according to rubrics developed by STiR. These observations found that the quality of teacher sharing meetings scored an average of 3 out of 5, which is in line with STiR’s Progress Pathway ambition for Year 2 of the programme.
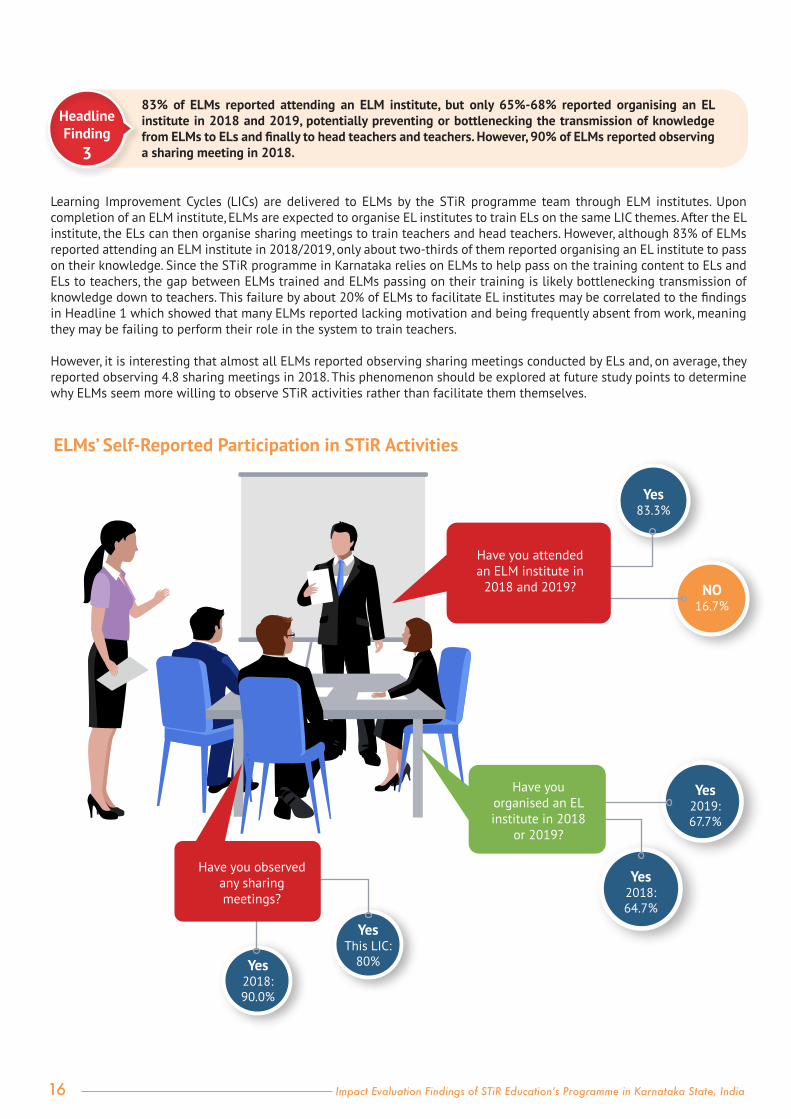
Headline Finding 3: 83% of ELMs reported attending an ELM institute, but only 65%-68% reported organising an EL institute in 2018 and 2019, potentially preventing or bottlenecking the transmission of knowledge from ELMs to ELs and finally to head teachers and teachers. However, 90% of ELMs reported observing a sharing meeting in 2018.
Learning Improvement Cycles (LICs) are delivered to ELMs by the STiR programme team through ELM institutes. Upon completion of an ELM institute, ELMs are expected to organise EL institutes to train ELs on the same LIC themes. After the EL institute, the ELs can then organise sharing meetings to train teachers and head teachers. Though most ELMs attended an ELM institute in 2018/2019, only around two-thirds of them reported organising an EL institute to pass on their knowledge, potentially bottlenecking the knowledge and skills they receive from STiR. However, most ELMs reported observing teacher sharing meetings frequently, indicating a willingness from them to engage in STiR programme activities.
Headline Finding 4: Head teachers reported frequently observing their teachers, and teachers reported that they are regularly observed by their superiors. Teachers and head teachers reported being routinely observed by both ELMs and ELs.
Most teachers reported being regularly observed by their head teacher or another school management actor as well as by their ELs/ELMs. Observation and feedback loops between ELs/ELMs, head teachers and teachers are a critical part of the process to strengthen the instructional and administrative capacities of school actors. Despite frequent absences by ELs/ELMs and bottlenecked transmission of knowledge between ELMs and ELs as explored in Headlines 1 and 3, it seems that ELs and ELMs manage to reach many teachers and head teachers throughout an LIC. This strength should be consolidated in the remaining years of the STiR programme. Overall, the consistency in observation visits reported across all education actors in the programme is encouraging and should be built upon going forward.
Headline Finding 5: Teachers and head teachers reported receiving useful feedback from observations. However, teachers and head teachers admitted that the coaching provided during feedback sessions is often positive and focused on offering praise, rather than constructive advice to improve instructional practice. Despite this, teachers reported that they feel they have developed as a result of the feedback they receive.
Teachers overwhelmingly reported that the coaching and feedback provided to them by their head teachers and ELs/ELMs was useful, however all actors also reported that feedback was mostly positive and focused on praise rather than constructive feedback to help them improve. Consistent observation and coaching is aligned to STiR’s progress pathway ambition of establishing routines in Year 2, but it should be geared more towards targeted, specific and corrective feedback during Year 3-5 moving forward.

Impact Evaluation Findings of STiR Education’s Programme in Karnataka State, India 3
Headline Finding 6: Teachers reported meeting other teachers from their school or block to learn from each other and expressed an interest in continuing to do so even after the STiR programme ends, indicating a self-reported willingness for professional growth. This willingness for professional growth corresponds to the high self-reported regularity of peer observations although improvement is still needed to ensure all teachers engage in it.
Teachers reported engaging in knowledge exchange activities with other teachers at their school or block. The vast majority of teachers and head teachers reported meeting with other teachers in order to learn from each other. Moreover, most of them also reported that they would continue meeting with other teachers from their school or block to learn from one another even after the STiR programme ends and that the feedback received from peers is useful. This highlights the positive experience teachers have had in their exchanges with other teachers, a major success for the STiR programme. However, almost half of the teachers who were observed reported that they had not actually improved at all as a result of the peer observations and feedback. This contradiction will have to be explored further in future evaluations.
Headline Finding 7: Students report liking school and were observed being positive in class and participating in classroom activities, though there is room for improvement in how they readily embark on assigned activities as well as how they collaborate with their peers. Teachers were observed greeting students and calling on them by name, thereby encouraging engagement, though they sometimes praised students unequally and treated boys and girls differently.
Teachers were found to have good rapport with their students, calling on them equally in class, calling them by name and greeting them at the start of the lesson; however, teachers can improve in terms of providing praise equally and not exhibiting gender bias so as to prevent any children from becoming disengaged. Students were observed actively participating in classroom activities and showed engagement and positivity with their teacher. However, students reported being frequently absent. While student absenteeism can be influenced by several factors – many of which may be outside of a students’ control, such as illness or family commitments – time out of class can lead to disengagement from learning and affect overall motivation and educational gains.
Headline Finding 8: Some teachers reported applying instructional methods promoted by STiR and trying them in their classrooms, however many reported not having learned some of the methods at all. The majority who had learned the teaching methods could not accurately describe how to apply them. However, teachers were observed frequently using other good teaching practices such as linking lesson content to students’ lives and checking students’ work.
Teachers learn new skills and practices through sharing meetings, which engage them in a structured Learning Improvement Cycle (LIC) delivered by the EL using materials developed by STiR. A high percentage of teachers reported having learnt new teaching practices from the STiR programme. However, only a few were able to correctly describe how to apply each practice. The reason why most teachers are failing to absorb the correct application of each method should be further explored in future evaluation points. Nevertheless, findings positively indicate that teachers are trying out new teaching strategies to some degree, which is a sign of some confidence and motivation, and in line with STiR’s progress pathway ambition for establishing routines in Year 2.
Headline Finding 9: Independent observations found that teachers are on task the majority of class time, however, they primarily engage students in teacher-centered activities such as lecturing or whole group work rather than student-centered activities such as hands-on work or small group work. This corresponds to observed limitations in teachers’ ability to develop the critical and creative thinking abilities of their students during lessons, despite their demonstrated ability to deliver relevant content and information through lecture-based learning techniques.
Teachers were observed in their classrooms to determine how they spend their time while teaching, including whether they stimulate students’ curiosity and critical thinking skills. Findings indicate that teachers were on-task almost 90% of the time, indicating that when teachers are in the classroom they demonstrate positive behaviours towards instruction and engage in relevant teaching and learning actions. However, teachers spent a significant amount of their time interacting with all students as a whole group; lecturing or demonstrating to students; and writing on the blackboard, leaving little time for students to work together or independently engage in critical and creative thinking skills.

Impact Evaluation Findings of STiR Education’s Programme in Karnataka State, India4
Headline Finding 10: Teachers self-reported and were observed being welcoming and friendly towards students and calling on them by name. Students reported liking school and feeling safe in their academic environment. But, conversely, both teachers and students reported that corporal punishment is a common method of discipline with a high percentage of students believing it is the best means of discipline, indicating a disconnect between purported feelings of safety at school and normalised physical punishment practices. Verbal punishment was identified by teachers and ELs/ELMs to a lesser extent than physical punishment, but it also contributes to an overall unsafe environment at school for children.
The majority of teachers were observed treating students respectfully, being positive and encouraging. Students overwhelmingly reported liking school and feeling safe at school and in their classroom, but the high reported rates of corporal punishment and verbal punishment indicate that schools likely do not actually create a safe and positive environment conducive to the foundations of lifelong learning. Although students do not seem to link feeling unsafe with physical punishment, it is important to attempt to change deep seated cultural and social beliefs about safety and punishment so students can learn in an environment that supports their physical and emotional health. Going forward, it is important to involve education stakeholders and students in targeted activities to promote positive discipline and improve the safety and emotional well-being of all learners.
Headline Finding 11: Students reported high levels of determination and grit related to their academic learning and also reported excitement to learn more when faced with a difficult problem and the ability to apply problem-solving strategies. Teachers were observed encouraging and role modelling behaviours that promote self-esteem such as providing students with corrective and specific feedback during lessons and having a positive attitude towards helping students address their learning challenges, although there is still room for improvement.
Students reported high levels of grit and determination when faced with difficult academic assignments and both students and teachers reported that teachers help students when they are struggling. Classroom observations of teachers indicated that they generally have a positive attitude towards students’ efforts and provide corrective feedback, indicating that students’ grit and determination is met with support from their teachers and likely helps to increase students’ confidence and self-esteem – one of the foundations of lifelong learning. However, there is still room for significant improvement, which teachers can hopefully work on in Year 3-5 of the STiR programme.

Impact Evaluation Findings of STiR Education’s Programme in Karnataka State, India 5
1.
PROGRAMME AND LONGITUDINAL
How does STiR’s approach, focused on strengthening intrinsic motivation, contribute to sustained improvements in the foundations of lifelong learning among ELs/ELMs, teachers, and students?
In line with the programme’s theory of change, the study explores results against three impact pathways STiR focuses on to reignite intrinsic motivation: 1) behaviour change among ELs/ELMs, teachers, and students through role-modelling; 2) strengthening of the education system; and 3) amplification of other programme technical interventions.
STiR understands role-modelling to be the demonstration and promotion of behaviours and attitudes one wishes to see in others. There is extensive evidence that the most powerful agent in the workplace for an individual is their direct line manager. In Karnataka, STiR supports state and district officials, and indirectly teachers, to understand their role in creating the right conditions for those they work with. STiR believes that this focus on role-modelling and relationships is overlooked in most education systems, and they have learned that promoting these in systems is their biggest organisational strength and source of success
The initial phase of the study was implemented in 2019 – a year and a half after STiR began implementing their programme in two of Karnataka’s districts – Kolar and Chikkabalapur. A total of 104 schools were representatively sampled across both districts to participate in the evaluation. Head teachers and primary 3, 4 and 7 teachers and students were selected to take part in data collection. The Block Resource Persons (BRPs), known as Education Leader Managers (ELMs) in STiR’s programme, and Cluster Resource Persons (CRPs), known as Education Leaders (ELs) in STiR’s programme, assigned to each district were also included in the study.
Tools for the study were developed in consultation with the STiR team. At the school level tools included teacher, head teacher and learner questionnaires; classroom observation and teacher time on task tools; a shadowing tool to track daily activities and actions on the part of head teachers and teachers; and a school climate survey. At the EL/ELM level, tools included a questionnaire and a shadowing tool to track their daily activities and actions. STiR’s internal monitoring rubrics for teacher sharing meetings and BRP/CRP institutes were utilised for observing programme activities, coupled with self-administered questionnaires.
STiR partners with Dr Rebecca Thornton, Associate Professor of Economics at the University of Illinois Urbana-Champaign and Ichuli Institute, an independent research organisation headquartered in Uganda and led by Victoria Brown, to understand longitudinal trends and impacts from the programme over 5 years in India and Uganda. The study takes place in eastern Uganda and Karnataka and Tamil Nadu States in India. The study’s objective is to test STiR’s 5-year change hypothesis to understand how improvements in intrinsic motivation at different levels of the education system contribute to improved teaching practices and student learning. The overarching question of the longitudinal study is:
2
Figure 1: STiR’s Theory of Change
STUDY OVERVIEW

Impact Evaluation Findings of STiR Education’s Programme in Karnataka State, India6
3. STUDY CONTEXT
STiR’s approach is based around the principles of peer networks, action and feedback, and reflection. Over the course of a 3-month period, teachers engage in a development process known as the Learning Improvement Cycle (LIC). This is where teachers engage in monthly sharing meetings and peer observation of their teaching, focused particularly on teaching strategies. The respective LICs of teachers, cluster officials and district officials are intertwined and designed deliberately – just like the teacher networks – to build the autonomy, mastery and purpose of the participants and to align with teachers around a shared purpose of improving learning at all levels.
The STiR programme District Lead (DL) along with the District officials (specifically identified as champions for the programme in their districts) conduct BRP (sub-district/ block level officials) institutes on the Learning Improvement Cycle (LIC). These focus on building the BRP’s capacity for providing high-quality training and developmental support for the CRPs. These institutes provide the opportunity for the BRPs to develop and sharpen their facilitation, coaching and mentoring skills to conduct training for CRPs on the LIC’s themes and strategies. The CRPs then facilitate sharing (network) meetings for the teachers on the same LIC and continue supporting them through the month by observing them as they implement these strategies in their classrooms. These classroom observations are followed by reflections and feedback discussions. The CRPs and BRPs both have monthly coaching and support along with regular alignment meetings at district and state levels. These provide an opportunity for all stakeholders to reflect on their actions using data, and share feedback and learnings in order to develop plans together to strengthen delivery. The relationships at every level are necessarily two-way, based on openness, honesty and a commitment to a common goal.
The STiR programme in Karnataka was introduced in 2018. Both teachers and BRPs (ELMs) and CRPs (ELs) had been exposed to the programme and were fully aware of STiR’s programme activities by the time of the Year 1 study. In the 2018/19 academic year, teacher attendance at the sharing meetings was optional while in the 2019/20 academic year, attendance at these meetings became compulsory for 80% of the teachers. By the time of the study, stakeholders in the Karnataka STiR programme were engaging in the second LIC of the year (4th LIC of STiR’s programme cycle).
It is important to note that in Karnataka, the STiR programme operates on a training model whereby, through the process of role-modelling, ELMs pass on their knowledge to ELs and ELs on to teachers, with very limited intervention between the STiR programme team and teachers or ELs.
The majority of schools that were sampled were primary schools which run from P1 - P7 grades. The school checklist tool showed that there is an average of 5 teachers per school and, though there are only a few teachers, the enrolment numbers are also small and manageable. However, teachers teach an average of 4 grades each, meaning that teachers have a heavy workload in terms of preparing to teach all four grades.
3

Impact Evaluation Findings of STiR Education’s Programme in Karnataka State, India 7
2. REPORT STRUCTURE
The findings from Year 1 of the study are presented in this report. Results are grouped according to headline findings which present linkages and outcomes between the data collected across three levels of stakeholders in the education system – students, teachers and head teachers, and ELs/ELMs. Headline findings are organised by the key measurement areas STiR uses to evaluate behaviour change in ELs/ELMs, teachers and students: engagement, safety, self-esteem, curiosity and critical thinking, and learning time and intentional teaching. A selection of tables and graphs are included to demonstrate results for each headline finding; additional data is presented in the Annex.
The report also includes findings from STiR’s internal monitoring data, which is compared to externally validated data from the study against the key performance indicators tracked by the programme learning framework. Finally, a short reflection on learnings regarding measurement tools and approaches as well as conclusions from Year 1 of the study in Karnataka is presented.
4
STAKEHOLDER / LEVEL INDICATOR YEAR 1 YEAR 2 YEAR 3 YEAR 4 YEAR 5
ELs/ELMs
% expected district alignment meetings taking place 60 - 80 70 - 90 80 - 100 90 - 100 90 - 100
District alignment meeting quality (DL scores) 2 to 3 2 to 3 3 to 4 3 to 4 4 to 5
% expected DL/ELM coaching meetings taking place 50 - 70 60 - 80 70 - 90 80 - 100 90 - 100
DL/ELM coaching meetings quality (DL scores) 2 to 3 2 to 3 3 to 4 3 to 4 4 to 5
% expected EL institutes taking place 70 - 90 70 - 90 80 - 90 85 - 100 90 - 100
% EL institute attendance 60 - 80 70 - 90 80 - 90 85 - 100 85 - 100
EL institutes quality (DL scores) 1 to 2 2 to 3 2 to 3 3 to 4 4 to 5
% expected network meetings taking place 50 - 70 60 - 80 70 - 90 80 - 100 85 - 100
Network meeting quality (DL scores) 1 to 2 2 to 3 2 to 3 3 to 4 4 to 5
TEACHERS
% teachers present at time of observation 40 - 60 50 - 70 60 - 80 70 - 90 80 - 100
% teachers observed who are trying out new practices 30 - 50 40 - 60 50 - 70 60 - 80 80 - 90
% of features that show professional development observed in teachers 10 - 30 25 - 50 40 - 60 50 - 70 60 - 80
CHILDREN
% of features that show engagement in learning observed in children 10 - 30 25 - 50 35 - 55 50 - 70 60 - 80
% of features that show trust in teachers observed in children 10 - 30 25 - 50 35 - 55 50 - 70 60 - 80
% of features that show a physically and emotionally safe environment observed in children 15 - 35 30 - 50 40 - 60 55 - 75 70 - 90
Table 1: STiR’s 5-Year Progress Pathway Indicators

Impact Evaluation Findings of STiR Education’s Programme in Karnataka State, India8
3. PROGRAMME MONITORING DATA
The figures in the tables below present findings from the longitudinal study in comparison with STiR’s internal monitoring data against the achievements STiR anticipated for each indicator by the completion of Year 2 of their Progress Pathway, which aligns to the first year of the evaluation in Karnataka. STiR adopted a ‘traffic light’ system to measure indicator progress: a green colour in the ‘Progress Pathway Ambition’ column indicates the indicator is at or above expectation; a yellow colour shows that progress is happening, but caution is needed to ensure progress continues; and a red colour shows that the indicator has not been adequately achieved according to expectation. Overall, the longitudinal study’s findings positively align with STiR’s results. Most indicators are either on track or exceed expectations for developing a shared purpose among stakeholders and changing mind sets (in Year 1) and establishing routines (in Year 2).
5
Indicator Longitudinal Study Finding
Progress Pathway Ambition
Quality of District Progress Check Meetings 3 2 to 3
% expected DL/ELM coaching meetings taking place 58% 60 – 80%
DL/ELM coaching meetings quality (DL scores) 3 2 to 3
% EL institute attendance 78% 70 – 90%
% expected sharing meetings taking place 82% 60 – 80%
Sharing meeting quality (DL scores) 3 2 to 3
EL institutes quality (DL scores) N/A 2 to 3
% of EL/ELMs who engaged in additional training 56% N/A
% of teachers being observed 87% N/A
% of teachers being provided with feedback after observations 100% N/A
Indicator Longitudinal Study Finding
Progress Pathway Ambition
% of students engaged in learning 38% 25 – 50%
% of students who trust their teacher 38% 25 – 50%
% of students who learn in a physically safe environment 57% 30-50%
% of students who learn in an emotionally safe environment 33% 30-50%
% of students who follow class rules 63% N/A
% of students who know what’s expected from them 43% N/A
Indicator Longitudinal Study Finding
Progress Pathway Ambition
% teachers present at time of observation 94% 50 – 70%
% teachers observed who are trying out new practices 43% 40 – 60%
% of teachers who report they are improving as professionals 54% 25 – 50%
% of teachers calling students in class equally 46% N/A
% of teachers providing praise to students equally 32% N/A
% of teachers pursuing additional training opportunities 79% N/A
Table 2: High Level Findings about ELs/ELMs Compared to STiR Progress Pathway Ambitions
Table 3: High Level Findings about Teachers/HTs Compared to STiR Progress Pathway Ambitions
Table 4: High Level Findings about Students to STiR Progress Pathway Ambitions

Impact Evaluation Findings of STiR Education’s Programme in Karnataka State, India 9
4. 6 6.1. INTRINSIC MOTIVATION
Teachers and head teachers overwhelmingly reported liking teaching and the majority of them would like to stay in their current positions in education. However, 44% of teachers, 36% of head teachers and 37% of ELs/ELMs reported being only “somewhat motivated” or “not motivated” at work on most days and 41% of teachers and head teachers and 61% of ELs/ELMs self-reported being absent at least one time in the past two weeks.
Headline Finding
1
The main goal of the STiR programme is to reignite intrinsic motivation in teachers, head teachers and ELs/ELMs in order to positively impact the learning outcomes of students. Intrinsic motivation of education stakeholders is measured by demonstrated improvements in autonomy, mastery and purpose, commitment to their roles and responsibilities; and engagement and participation in STiR programme activities.
The vast majority of teachers (98.7%) and all head teachers self-reported that they like teaching. Teachers and head teachers were also significantly more satisfied with their current positions than ELs/ELMs. In addition, 83% of teachers and head teachers and 95.3% of ELs/ELMs reported feeling “somewhat motivated” or “very motivated” by the STiR programme.
However, 44% of teachers, 36% of head teachers and 37% of ELs/ELMs self-reported feeling only “somewhat motivated” or “not motivated” at work on most days. Low levels of teachers’ motivations could be linked to heavy workloads, especially when the number of grades exceeds the number of teachers and teachers must prepare for, deliver content, discipline and assess multiple grade levels of students, making it hard for them to balance their tasks.
About three quarters of teachers and head teachers said that providing them with additional trainings and better teaching materials would increase their motivation at work. Only 2.6% of teachers and none of the head teachers requested for a salary increase as a way of increasing their motivation. This indicates that teachers and head teachers are not reporting extrinsic motivation factors such as pay as motivating factors. Instead, teachers and head teachers are indicating that they want to be better supported by the relevant authorities and given more training to help them teach better. This, coupled with their general appreciation for the STiR programme, is a positive finding for STiR since the programme’s focus is on intrinsic motivation factors such as delivering training and empowering ELs/ELMs to perform their roles and support head teachers and teachers.
HEADLINE FINDINGS
Table 6: Teacher and Head Teacher Self-Reported Motivation
How motivated do
you feel at work on most
days?
Teacher Head Teacher
Highly motivated Motivated Somewhat
motivatedNot at
all Not sure Highly motivated Motivated Somewhat
motivatedNot at
all Not sure
All teachers/HTs 17.8% 32% 35.1% 8.7% 6.5% 23.7% 39.2% 29.9% 6.2% 1%
Males 13.1% 34.5% 36.9% 9.5% 6% 28.6% 32.1% 30.4% 7.1% 1.8%
Females 20.4% 30.6% 34% 8.2% 6.8% 17.1% 48.8% 29.3% 4.9% 0%
Table 5: Teacher, Head Teacher and ELs/ELMs Self-Reported Career Aspirations
Think about your career goals over the next 3 years. What job would you most like to have? Teacher Head Teacher ELs/ELMs
Stay in current position 73.2% 72.2% 23.3%
Change position in education 19.1% 19.6% 53.5%
Change to another profession 4.3% 6.2% 23.3%
Move to another school 3.5% 2.1% 0.0%

Impact Evaluation Findings of STiR Education’s Programme in Karnataka State, India10
Table 7: Teacher and Head Teacher Absence Frequency Over Two Weeks
Table 8: Reasons for Teacher and Head Teacher Absence from Work Over the Last Two Weeks
Number of self-reported absences over two weeks
Teacher Head Teacher
1-2 3-4 5 5 or more 1-2 3-4 5 5 or more
All teachers/HTs 78.1% 9.6% 8.2% 4.1% 74.4% 10.3% 7.7% 7.7%
Males 76.2% 4.8% 9.5% 9.5% 76.2% 9.5% 4.8% 9.5%
Females 78.9% 11.5% 7.7% 1.9% 72.2% 11.1% 11.1% 5.6%
Number of self-reported absences over two weeks
Teacher Head Teacher
Sickness Personal issues*
External Training Sickness Personal
issues*External Training
All teachers/HTs 30% 52.5% 17.5% 18.5% 51.9% 29.6%
Males 26.7% 46.7% 26.7% 15.4% 53.9% 30.8%
Females 32% 56% 12% 21.4% 50% 28.6%
The low levels of motivation at work may be manifesting with high absenteeism rates. When asked about their absenteeism in the past two weeks, ELMs had the highest absenteeism rate at 66.7% followed by ELs at 59.5% and head teachers at 45.4% and finally teachers at 39%. In addition, 42.8% of learners reported that their teachers had missed school at least once in the last two weeks. This trend shows that there may be a negative role modelling effect whereby those in authority positions are frequently absent and inspire those below them to copy their behaviour. All EL/ELM absences and about half of teacher and head teacher absences were unauthorised, primarily for personal reasons.
These absenteeism rates likely follow a pattern found in other studies in India. Kremer et al found in a nationally representative study of government primary schools in India that an average of 25% of teachers were absent from school, and of those present, only about half were actually teaching.1 The study noted no association between higher pay and lower absence, but rather a correlation between daily incentives such as not engaging in multi-grade teaching, frequent school inspection and better infrastructure, and lower absenteeism. Another study found that 23.6% of teachers in public schools across rural India were absent, but that increased school monitoring was strongly correlated to reductions in teacher absence rates.2 Absence rates to this degree (seen in this study and others of its kind) have a significant effect on learners because it reduces the learning time and quality of learning for pupils.
Percent absent at least once in past two weeks
ELMs
ELs
Head teachers
Teachers
1Kremer, M., Muralidharan, K., Chaudhury, N., Hammer, J., and Rogers, F. H. (2005). ‘Teacher Absence in India: A Snapshot’, Journal of the European Economic Association, 3(2-3), pp. 658-667. 2Muralidharan, K., Das, J., Holla, A., and Mohpal, A. (2017). ‘The fiscal cost of weak governance: Evidence from teacher absence in India’, Journal of Public Economics, 145, pp. 116-135.
66.7%
59.5%
45.4%
39%
*Personal issues include visiting relatives/friends, casual leave, attending a marriage ceremony and attending a religious function.

Impact Evaluation Findings of STiR Education’s Programme in Karnataka State, India 11
38% ELs/ELMs
22% Head teachers
11% Teachers
Despite frequent absences, it is positive to note that when teachers are in school, they are on task the majority of the time. Teachers spent 90% of their daily time on active, instruction-related activities when in the classroom and only about 11% of their daily time doing activities unrelated to teaching and learning, including personal tasks and extended breaks and transitions between activities. Time spent on “other” activities was more frequent among head teachers (22%) and ELs/ELMs (38.4%). Although some of head teachers’ and ELs/ELMs’ time doing “other” activities was spent doing productive activities related to their job, much of this time was also spent on personal time, long transitions between activities and interacting with the independent enumerator. This once again demonstrates that stakeholders at the higher end of the education system may be absent or off task more frequently than teachers themselves, creating a potential negative role modelling effect.
Time Spent on Activities Unrelated to Their Work
Graph 1: Teachers’ Daily Time Use
Other 10.8
STiR Activities 0.1
Lateness/Tardiness/Absenteeism
Travelling
Activities Out of the School 0.4
Meetings 0.2
External Relations 0.1
Internal relations 10.2
Instructions/Support Supervision/Prof. Development
Percentage of Time Spent
Sub-
cate
gory
70.6
Organization-Management 1.2
Administration 6.5
Teachers spent
90% of their daily time on
active, instruction-related activities
1st Lesson 2nd Lesson

Impact Evaluation Findings of STiR Education’s Programme in Karnataka State, India12
Other
Travelling
Activities Out of School
Meetings
External Relations
Internal Relations
Instruction/Support Supervision
Organisation-Management
Administration
0.6
1.6 19.0
6.1
0.5
0.4
0.1Lateness/Tardiness/Absenteeism
22.0
STiR Activities 0.1
18.3
31.4
Head Teacher Overall Time Use by Task Sub-Category
How Teachers Spend Their Non-Teaching Time (10.8% of their Overall Daily Time)
OtherPersonal time Transition between activities
Resting Interacting with the researcher
Looking through files
Email/call/paperwork, topic is uncertain
Reading a newspaper/
book
Enumerator personal break
Browsing on school computers
37.1% 33.3% 11.9% 4.7% 4.5%
3.2% 2.8% 1.7% 0.6% 0.2%

Impact Evaluation Findings of STiR Education’s Programme in Karnataka State, India 13
Graph 2: EL/ELM Overall Time Use by Task Category
Lateness
Other)
2.3
38.4
STiR Activities 0.2
Travelling to and from education office 3.2
Activities out of education office 1.1
Meetings at district office 1.6
Meetings at education office 14.4
External Relations at school
15.3
External Relations
0.2
Internal Relations
Sub-
cate
gory
Percentage of Time Spent
0.2
Instructions/Support Supervision
4.4
2.3
Organisation-Management
Meetings at the school
Administration 8.2
8.2

Impact Evaluation Findings of STiR Education’s Programme in Karnataka State, India14
Between 79% and 84% of teachers reported participating in sharing meetings in 2018 and 2019, which is on target for the participation rate STiR expects. Teachers, ELs/ELMs and independent observers rated the quality of these meetings as a 3/5, on average.
Headline Finding
2
STiR focuses on role-modelling and developing positive relationships amongst education system actors through Learning Improvement Cycles (LICs), which promote peer-to-peer linkages and provide learning opportunities. LICs are delivered to the teachers and head teachers through sharing meetings. These sharing meeting are organised by the ELs at the block or cluster level. During these sharing meetings, teachers discuss implementation strategies under the current LIC theme.
At the start of the STiR programme, sharing meetings were not yet compulsory for teachers and head teachers. However, in the 2019/2020 academic year, these meetings became compulsory for 80% of teachers. Between 79% and 84% of teachers overall participated in sharing meetings, meaning that STiR met its target in this regard, although attendance rates were higher in Chikkaballapur district than in Kolar district.
Success descriptor rubrics developed by STiR were used to observe and rate the quality of these activities against expectations using a 5-point scale where 5 is the best score. Part of a rubric used to evaluate the quality of one type of STiR activity (teacher sharing meetings) is shown in Figure 2 as an example. Independent observers found that the quality of teacher sharing meetings scored an average of 3 out of 5, which is in line with STiR’s Progress Pathway ambition for Year 2 of the programme.
Figure 2: Example of the Success Descriptor Rubric Used to Evaluate the Quality of a STiR Activity (Teacher Sharing Meetings)
Table 9: Self-Reported Teacher Attendance of Sharing Meetings
Teachers
Chikkaballapur Kolar
Yes No Yes No
All teachers
Did you attend a sharing meeting in 2018? 88.7% 11.3% 79.3% 20.7%
Have you attended a teacher sharing meeting in 2019? 89.6% 10.4% 69.0% 31.0%
Have you attended a teacher sharing meeting this LIC? 86.1% 13.9% 78.5% 21.6%
Males
Did you attend a sharing meeting in 2018? 88.9% 11.1% 83.3% 16.7%
Have you attended a teacher sharing meeting in 2019? 83.3% 16.7% 70.0% 30.0%
Have you attended a teacher sharing meeting this LIC? 79.6% 20.4% 80.0% 20.0%
Females
Did you attend a sharing meeting in 2018? 88.5% 11.5% 77.9% 22.1%
Have you attended a teacher sharing meeting in 2019? 95.1% 4.9% 68.6% 31.4%
Have you attended a teacher sharing meeting this LIC? 91.8% 8.2% 77.9% 22.1%

Impact Evaluation Findings of STiR Education’s Programme in Karnataka State, India 15
Teachers and ELs/ELMs also rated the teacher sharing meetings with an average of 3 out of 5 on various factors such as content of the training material and facilitation by ELs. Positively, when asked at the end of a sharing meeting, 99.7% of teachers said that they felt prepared to apply the content from the sharing meeting in their day-to-day teaching practices.
Table 10: Teacher Rating of Teacher Sharing Meetings
Table 11: ELs/ELMs Rating of Teacher Sharing Meetings
Content Teacher portfolio quality
Presentation of materials
Facilitation of activities
Modelling of activities
All teachers 3.2 3.3 3.5 3 3
Males 3.1 3.3 3.2 2.9 3
Females 3.2 3.3 3.6 3 3
Content Teacher portfolio quality
Presentation of materials
Facilitation of activities
Modelling of activities
ELMs and ELs 3.3 3.1 3 3.1 3.3
Independent Rating of the
Quality Rubric for Teacher Sharing
Meetings
3
3
3
3
2
3
Linking to purpose
Recognition and celebration
Probing
Practicing
Developing action plans
Attitudes towards meeting
Impact Evaluation Findings of STiR Education’s Programme in Karnataka State, India16
NO16.7%
Yes 2019: 67.7%
83% of ELMs reported attending an ELM institute, but only 65%-68% reported organising an EL institute in 2018 and 2019, potentially preventing or bottlenecking the transmission of knowledge from ELMs to ELs and finally to head teachers and teachers. However, 90% of ELMs reported observing a sharing meeting in 2018.
Headline Finding
3
Learning Improvement Cycles (LICs) are delivered to ELMs by the STiR programme team through ELM institutes. Upon completion of an ELM institute, ELMs are expected to organise EL institutes to train ELs on the same LIC themes. After the EL institute, the ELs can then organise sharing meetings to train teachers and head teachers. However, although 83% of ELMs reported attending an ELM institute in 2018/2019, only about two-thirds of them reported organising an EL institute to pass on their knowledge. Since the STiR programme in Karnataka relies on ELMs to help pass on the training content to ELs and ELs to teachers, the gap between ELMs trained and ELMs passing on their training is likely bottlenecking transmission of knowledge down to teachers. This failure by about 20% of ELMs to facilitate EL institutes may be correlated to the findings in Headline 1 which showed that many ELMs reported lacking motivation and being frequently absent from work, meaning they may be failing to perform their role in the system to train teachers.
However, it is interesting that almost all ELMs reported observing sharing meetings conducted by ELs and, on average, they reported observing 4.8 sharing meetings in 2018. This phenomenon should be explored at future study points to determine why ELMs seem more willing to observe STiR activities rather than facilitate them themselves.
ELMs’ Self-Reported Participation in STiR Activities
Have you attended an ELM institute in
2018 and 2019?
Have you observed any sharing meetings?
Have you organised an EL institute in 2018
or 2019?
Yes83.3%
Yes2018: 64.7%
YesThis LIC:
80% Yes2018: 90.0%

Impact Evaluation Findings of STiR Education’s Programme in Karnataka State, India 17
6.2. ENGAGEMENT
Head teachers reported frequently observing their teachers, and teachers reported that they are regularly observed by their superiors. Teachers and head teachers reported being routinely observed by both ELMs and ELs.
Headline Finding
4
Developing a culture of improvement that helps educators thrive is a key goal of STiR’s programme. Observation and feedback loops between ELMs/ELs, head teachers and teachers is a critical part of this process to strengthen the instructional and administrative capacities of school actors.
Almost all head teachers (95.9%) reported observing, supporting, supervising and giving feedback to teachers in their classrooms, primarily weekly or monthly. Teachers corroborated this with 92.6% of them confirming that they are observed by their head teacher or someone else on the school’s management team either weekly, monthly or termly. In addition, 90.5% of teachers reported that their lesson plans are reviewed by their head teacher, mostly monthly. The review of lesson plans is an indicator that teachers are getting support from their head teachers in order to improve their teaching practices. However, head teachers should still be encouraged to offer this support more frequently in order to make it more efficient and beneficial.
The majority of teachers (87.5% of teachers and 83.5% of head teachers) surveyed reported that ELs observe them at least once per LIC. Teachers and head teachers actually reported an average of 4.1 visits by the EL per LIC, which indicates significant engagement from the EL. Most teachers (89.2% of teachers and 90.5% of head teachers) surveyed also reported that ELMs observe them at least once per LIC with an average of 3.2 visits per LIC. Despite frequent absences by ELs/ELMs and bottlenecked transmission of knowledge between ELMs and EL as explored in Headlines 1 and 3, it seems that ELs and ELMs manage to reach many teachers and head teachers throughout an LIC. This strength should be consolidated in the remaining years of the STiR programme.
These findings indicate that there has been substantial progress among stakeholders in terms of engaging in observations. According to the STiR team, by the time they started working in Karnataka, teacher observations were not happening at all, so the self-reported rate of observations is an achievement worth noting.
Table 12: Frequency of Self-Reported Teacher Observations from Head Teachers
Table 13: Frequency of Self-Reported Head Teacher Observations of Teachers
How frequently does the head teacher or someone else in the management team observe you?
Teachers
Never Weekly Monthly TermlyAll teachers 7.4% 44.6% 43.7% 4.3%
Males 9.5% 34.5% 50% 6%
Females 6.1% 50.3% 40.1% 3.4%
How frequently do you observe, support and give feedback to your teachers?
Head Teachers
Never Weekly Monthly TermlyAll head teachers 18.7% 36.3% 44% 1.1%
Males 17.3% 36.5% 46.2% 0%
Females 20.5% 35.9% 41% 2.6%
ELs visit teachers and HTs an average of
ELMs visit an average of
4.1 times per LIC
3.2 times
Every 3-4 months

Impact Evaluation Findings of STiR Education’s Programme in Karnataka State, India18
37.1%
48.3%
14.6%
Teachers and head teachers reported receiving useful feedback from observations. However, teachers and head teachers admitted that the coaching provided during feedback sessions is often positive and focused on offering praise, rather than constructive advice to improve instructional practice. Despite this, teachers reported that they feel they have developed as a result of the feedback they receive.
Headline Finding
5
Teachers and head teachers overwhelmingly reported that the coaching and feedback provided to them by ELs and ELMs was useful. This is a positive sign that they value the support they receive from their superiors. However, feedback provided to teachers on their lesson scheming and planning from their head teachers rarely focused on ways to improve their instruction, centring instead on praise, thanks and encouragement. About 15% of teachers reported not receiving any feedback at all. Only about 50% of all teachers reported receiving feedback that helped them improve their lesson schemes and plans. Head teachers also self-reported that most of the feedback they give to teachers is focused on what went well, what to take forward and additional improvement areas and often ignores giving specific concrete examples and setting clear action plans for implementation of the feedback. This makes it difficult to follow-up on whether the feedback is actually being implemented by the teachers. However, in a sharing meeting exit survey, 98.7% of teachers said they had developed as a result of the feedback they received, primarily in terms of their confidence or in their teaching methodology. This indicates that while additional improvement is needed to strengthen the ways in which head teachers give constructive feedback to teachers, teachers already feel as though they are gaining from the interaction with their superiors.
of teachers found feedback given by their head teacher useful
of teachers and head teachers found the feedback from their EL useful
of teachers and head teachers found the feedback from their ELM useful97%
98%
94.2%
Table 14: Stages Head Teachers Follow in Giving Feedback to Teachers
Different stages head teachers follow in giving feedback to teachers All head teachers Males Females
What went well/could have been better 45.4% 50% 39%
What to take forward 48.5% 48.2% 48.8%
Additional improvement areas 50.5% 57.1% 41.5%
Specific with concrete examples 20.6% 21.4% 19.5%
Clear agreed action items 24.7% 21.4% 29.2%
Other 4.1% 5.4% 2.4%
Feedback the Teachers
Received After Their Lesson Plans Were Reviewed
All teachersAppreciated/encouraged
Asked to make some corrections
No feedback X

Impact Evaluation Findings of STiR Education’s Programme in Karnataka State, India 19
Teachers reported engaging in knowledge exchange activities with other teachers at their school or block; 88.3% of teachers and 84.5% of head teachers reported meeting with other teachers in order to learn from each other. Additionally, 81.3% of teachers and 87.6% of head teachers reported that they would continue meeting with other teachers from their school or block to learn from one another even after the STiR programme ends. This highlights the positive experience teachers have had in their exchanges with other teachers, a major success for the STiR programme.
The majority of teachers (78.2%) reported that they are observed by a peer teacher, on average about once per month. 88.2% of those who reported being observed said that the feedback provided by peer teachers is useful. However, almost half of the teachers who were observed reported that they had not actually improved at all as a result of the peer observations and feedback. This contradiction will have to be explored further in future evaluations in order to reveal why teachers say peer observation feedback is useful, but many teachers say they do not actually improve from it, as well as if teachers need more support to provide each other with constructive and useful feedback.
All results on peer observation will need to be re-verified in Year 2 of the study because the STiR team in Karnataka suspects that teachers may have misinterpreted the question about peer observation (due to mistranslation) and that rates of peer observation may not be as high as teachers seem to have reported. This also may help explain the confounding data about the usefulness of peer observation.
Teachers reported meeting other teachers from their school or block to learn from each other and expressed an interest in continuing to do so even after the STiR programme ends, indicating a self-reported willingness for professional growth. This willingness for professional growth corresponds to the high self-reported regularity of peer observations although improvement is still needed to ensure all teachers engage in it.
Headline Finding
6
Table 15: Teacher Self-Reported Observations by Peer Teachers
How frequently does a peer teacher observe you teaching in class and give you feedback?
Never Weekly Monthly TermlyAll teachers 21.7% 33.3% 36.4% 8.7%
Males 23.8% 28.6% 39.3% 8.3%
Females 20.4% 36.1% 34.7% 8.8%
To be motivated by
my peers
10.2%
To get feedback and
advice
79.5%
To get new ideas
3.9%
Teachers Report on Reasons Why Being Observed by a Peer
Teacher is Important
Table 16: Teacher Opinions on Instructional Improvements from Peer Feedback
Do you feel you have improved as a result of peer observations and feedback?
Not at all Somewhat Very muchAll teachers 48.1% 35.9% 16.0%
Males 46.4% 34.5% 19.1%
Females 49.0% 36.7% 14.3%

Impact Evaluation Findings of STiR Education’s Programme in Karnataka State, India20
Student engagement in school is directly connected, in part, to quality teaching and the practices and attitudes teachers display in the classroom. Students overwhelmingly reported liking school and enjoying learning. The majority of students reported actively working on their assignments during class along with their peers and some students even reported continuing to work on their assignments even when their peers had left the classroom. Classroom observations demonstrated that students are positive and smile often in class as well as consistently follow the teacher’s instructions and directions. Most students were also found to often participate in class activities assigned by the teacher and to sometimes volunteer to participate in activities. However, there is still room for improvement in how students readily embark on assigned activities and student peer-to-peer collaboration.
Classroom observations also found that teachers call on the students in the class equally, call on them by name, and greet the students at the start of the lesson. These factors are essential in contributing towards students’ levels of engagement and therefore their frequency should be further increased in order to raise the student engagement in classes. However, there is still room for improvement in terms of teachers providing praise to students equally and in actively challenging references to gender stereotypes during lessons and ensuring not to exhibit gender bias. These kinds of teacher tendencies can contribute to disengagement of some children, although the goal of an effective teacher should always be to engage all children in the classroom.
Note: Classroom observations were measured on a 0-3 scale with 0 indicating the action was not observed at all and 3 indicating that the action was observed at the highest possible level of the scoring criteria. When reading the classroom observation tables in this report, it is important to look at the distribution of scores across 0-3, but also to look at the mean score, which shows the average score between 0-3 across all classroom observations.
Students report liking school and were observed being positive in class and participating in classroom activities, though there is room for improvement in how they readily embark on assigned activities as well as how they collaborate with their peers. Teachers were observed greeting students and calling on them by name, thereby encouraging engagement, though they sometimes praised students unequally and treated boys and girls differently.
Headline Finding
7
of students reported liking school 99.5%
Table 17: Classroom Observation of Student Engagement
Distribution of scores
Mean SD 0 1 2 3
Students are positive; they smile and follow the teacher’s instructions and directions 2.31 0.95 8.24% 9.7% 24.4% 57.7%
Most (at least 75% of) students participate in class activities assigned by the teacher 2.17 1.06 12.9% 10.6% 23.2% 53.2%
Students volunteer to participate in the classroom activities 1.82 0.83 44.7% 28.5% 26.8%
Most (at least 75% of) students embark on assigned activities or tasks readily 1.27 1.29 45.3% 10.6% 15.9% 28.2%
A range of students sitting in different parts of the room contribute to class discussions by trying to answer questions (even if they give the wrong answer)
1.22 1.19 34.1% 11.2% 20.0% 34.7%
Students collaborate with one another through peer interaction 1.12 1.27 51.8% 6.8% 18.8% 22.7%
Students ask their peers for clarification or help 0.91 1.12 54.1% 14.7% 17.4% 13.8%

Impact Evaluation Findings of STiR Education’s Programme in Karnataka State, India 21
Table 18: Classroom Observations of Inclusive Teaching Methods
Distribution of scores
Mean SD 0 1 2 3
Teacher provides praise to students equally, (instead of only some students) for positive responses, choices, or behaviour 1.51 1.25 33.5% 13.8% 20.6% 32.1%
The teacher does not exhibit gender bias and challenges gender stereotypes in the classroom 1.6 0.75 0% 56.2% 27.7% 16.2%
Teacher greets all students at the start of the lesson 1.91 1.29 26.8% 6.8% 14.7% 51.8%
Teacher calls on students by name during the lesson 1.96 1.16 19.1% 12.1% 22.4% 46.5%
Teacher calls on students in the class equally, instead of the same students repeatedly 2.03 1.23 22.4% 7.1% 16.2% 54.4%
Long-term impacts on student learning are critically affected by how teachers teach and whether they provide a positive learning environment for their students. For these impacts to grow over time, students and teachers need to be present in school and actively engaged in the teaching and learning process. Study findings also indicated, however, that students are frequently absent from school.
Almost half of the students reported missing school at least once in the last two weeks. Results from attendance data collected at the schools during site visits showed that absenteeism was about 12% for both genders, with girls only less than 1% more likely to be absent.
The majority of students reported that they were absent because of sickness, family emergencies or were needed at home to work. While student absenteeism can be influenced by some factors outside of a students’ control – time out of class can lead to disengagement from learning and affect overall motivation and educational gains. Student absenteeism should be explored further in subsequent evaluation points, as reducing both teacher and student absenteeism can have positive, important effects on their long-term growth and motivation.
Is there any day in the last 2 weeks that you did not come to school?
All students 46.1% 53.9%
YES NO
Table 19: Students’ Attendance on Day of Classroom Observation
Attendance on the Day of Classroom Observation
Girls Boys TotalAttendance 2601 2479 5080
Enrolment 2930 2833 5763
% Attendance 88.8% 87.5% 88.1%

Impact Evaluation Findings of STiR Education’s Programme in Karnataka State, India22
Some teachers reported applying instructional methods promoted by STiR and trying them in their classrooms, however many reported not having learned some of the methods at all. The majority who had learned the teaching methods could not accurately describe how to apply them. However, teachers were observed frequently using other good teaching practices such as linking lesson content to students’ lives and checking students’ work.
Headline Finding
8
STiR’s goal is for all children to be taught by teachers who are dedicated to improving their practice and spend most of their time in class maximising learning time for their students. Under the programme, teachers learn new skills and practices through sharing meetings, which engage them in a structured Learning Improvement Cycle (LIC) delivered by the EL using materials developed by STiR.
A high percentage of teachers reported having learnt new teaching practices from the STiR programme. Teachers are however very inconsistent in their attempt to use the practices taught with most teachers saying they only “somewhat” try to apply these practices while others say they use the practice “very often” or “all the time”. Only 15% or less say they “never” use them, highlighting that most teachers have integrated these practices into their routine instructional methods at varying degrees.
Despite the high percentage of teachers who reported learning the teaching practices from STiR and trying them out to some degree, only a few were able to correctly describe how to apply each practice. The reason why most teachers are failing to absorb the correct application of each method should be further explored in future evaluation points. One possible explanation may be STiR’s training model whereby, through the process of role-modelling, ELMs pass on their knowledge to ELs and ELs on to teachers, with very limited intervention between the STiR programme team and teachers or ELs. As shown in Headline 3, there may be some gaps in this model of execution which may negatively affect teachers’ final receipt of the LIC strategies. STiR should consider having more interactions/coaching with ELMs in order to ensure that they are in a better position to provide the requisite support to the ELs who in turn will provide support to head teachers and teachers to help ensure that teachers are correctly learning how to use the various LIC teaching practices. In addition, it might be useful for STiR to not only introduce new LIC strategies in the coming years, but to also integrate reviews of the previous LICs in order to enable teachers to improve on the previous practices they learnt during each sharing meeting.
6.3. LEARNING TIME AND INTENTIONAL TEACHING
Table 20: Teacher Self-Reported Understanding and Use of LIC Strategies
LIC Strategy
% of teachers reporting learning the strategy from
STiR
Frequency of Teachers Trying the Strategy
% of teachers who correctly described the
strategyNever Somewhat Very Often
All the Time
Graphic organisers 56.28% 13.08% 34.62% 24.62% 27.69% 39.2%
Do now 72.29% 11% 40.72% 19.16% 29.34% 18.0%
Worked examples 65.37% 13.91% 27.81% 27.15% 31.13% 13.8%
Effective questioning 71.86% 12.05% 33.73% 21.69% 32.53% 10.8%
Greeting at the door 80.09% 11.35% 30.27% 19.46% 38.92% 7.6%
Spaced practice 70.56% 12.27% 30.67% 22.70% 34.36% 5.5%
Question generator 74.03% 12.87% 36.84% 21.05% 29.24% 4.7%
No hands up 46.32% 14.02% 28.04% 27.10% 30.84% 3.7%
Mantle of the expert 64.07% 13.51% 40.54% 18.24% 27.70% 3.4%
Four corners 51.95% 15.83% 35.00% 21.67% 27.50% 2.5%
Elaboration 57.14% 10.61% 38.64% 26.52% 24.24% 2.3%
Hook 55.41% 16.41% 29.69% 25.00% 28.91% 0%

Impact Evaluation Findings of STiR Education’s Programme in Karnataka State, India 23
Classroom observations showed that teachers are adept at making connections in the lessons that relate to the students’ existing content knowledge or their daily lives; checking students’ work; articulating lesson objectives; breaking down information into easily understood parts; and modelling how to complete tasks. These results are a positive sign that if teachers are taught the correct application of STiR LIC strategies and have a chance to review them over time, they will likely demonstrate similar competence as they do when using these other instructional methods. Teachers were less frequently observed using spaced practice; marking students’ assignments during the lessons; using concept maps, think-pair-share, quizzes or tests; and using visual images or learning aids. STiR can consider including these instructional methods in future LICs in an effort to strengthen their application.
Overall, findings positively indicate that teachers are trying out new teaching strategies to some degree, which is a strong sign of their confidence and motivation, and in line with STiR’s progress pathway ambition for establishing routines in Year 2. But, additional effort is needed between Year 3 and Year 5 to ensure teachers’ confidence to try out new teaching strategies is also complemented by good practice because teachers must fully understand each teaching strategy and accurately apply it in class to maximise student learning and encourage higher level thinking skills.
Table 21: Teacher Application of Specific Teaching Practices
Distribution of scores
Mean SD 0 1 2 3
Teacher explicitly articulates the objectives of the lesson and relates classroom activities to the objectives 2.14 0.82 0% 27.6% 31.1% 41.1%
Teacher separates material/breaks down information into component parts so that the information can be easily understood by the students; the teacher’s explanation of content is clear
1.96 1.24 24.1% 7.06% 17.9% 50.8%
Teacher makes connections in the lesson that relate to students’ existing content knowledge or their daily lives 2.28 0.89 0% 29.4% 13.5% 57.0%
Teacher uses spaced practice (e.g. refers to previous lessons/materials with similar topics already taught to help students understand the new material)
1.03 1.21 52.3% 11.4% 17.0% 19.1%
Teacher models how to complete a task by demonstrating the task and/or explaining what they are doing or thinking as they do the task (e.g. thinking aloud)
1.96 0.9 0% 42.0% 19.4% 38.5%
Teacher summarizes key points of lesson at the end of lesson 1.52 1.23 33.5% 11.1% 25.2% 30.0%
The teacher uses questions, prompts or other strategies to check students’ level of understanding 1.79 1.11 17.0% 23.5% 22.9% 36.4%
Teacher gives students opportunities to demonstrate their understanding of a lesson (e.g. in front of class, by calling on them in their seat, etc.)
1.65 1.18 25.8% 14.7% 27.6% 31.7%
Teacher circulates/moves around the classroom during an exercise (from front, to the sides and to the back of the class) 1.7 1.1 17.3% 28.2% 21.4% 32.9%
Teacher monitors most students during independent/group work 1.81 1.26 27.6% 7.06% 21.4% 43.8%
Teacher adjusts their teaching to the level of student understanding (e.g. teacher responds to students’ level of understanding before moving on to the next step in the lesson)
1.65 1.21 28.2% 11.4% 27.0% 33.2%
Teacher checks/marks students’ assignments and homework during the lesson 1.1 1.26 51.4% 10.2% 15.2% 22.9%
% of students whose work was checked (0. 1-25%, 1. 26-50%, 2. 51-75%, 3. 76-100%) 2.81 1.11 16.9% 22.4% 23.6% 36.9%
Teacher uses visual images or learning aids to match their verbal explanations to increase students’ understanding or retention of information
1.42 1.31 40.2% 10.2% 16.4% 32.9%
Teacher uses concept maps, think pair share, quizzes or tests, to increase students’ understanding or retention of information 1.27 1.35 49.4% 5.29% 14.1% 31.1%

Impact Evaluation Findings of STiR Education’s Programme in Karnataka State, India24
Independent observations found that teachers are on task the majority of class time, however, they primarily engage students in teacher-centered activities such as lecturing or whole group work rather than student-centered activities such as hands-on work or small group work. This corresponds to observed limitations in teachers’ ability to develop the critical and creative thinking abilities of their students during lessons, despite their demonstrated ability to deliver relevant content and information through lecture-based learning techniques.
Headline Finding
9
Teachers must analyse, evaluate and contextualise their teaching strategies to support the development of student curiosity and critical thinking. Teachers were observed in their classrooms to record how often they were on-task and actively engaging with students or off-task, either in class but not actively engaging with their students or out of class entirely when they should have been teaching. Observations also recorded the types of activities teachers used to engage students to evaluate how they grow students’ curiosity and critical thinking skills.
Findings indicate that teachers were on-task almost 90% of the time, spending only 10% of class time in off-task activities. Despite the high teacher absenteeism rates (which was reported in Headline 1), when teachers are in the classroom they demonstrate positive behaviours towards instruction and engage in relevant teaching and learning actions
6.4. FOUNDATIONS OF CURIOSITY AND CRITICAL THINKING
of the time, class had ended early
of the time, the teacher was in class but not teaching
of the time, the teacher was not in class but a learning activity was on-going
of the time, the teacher was not in class and no learning activity was on-going
When in class, teachers were on-task 89.5% of the time.
4.4%
2.7%
1.6%
0.7%

Impact Evaluation Findings of STiR Education’s Programme in Karnataka State, India 25
Note: A breakdown of classroom activities by 3 minute snapshots is provided in the Annex.
Key findings from these snapshots show that time spent on whole class work, teacher writing on the blackboard and the teacher reading, lecturing or demonstrating to learners while they listen remains consistently high throughout the lesson while small group work, kinaesthetic (hands on) activities, students writing in their notebooks and pupils being assessed remains consistently low throughout.
Overall, teacher-led activities dominate most lessons and there is not a lot of time spent on students working in small groups. Positively, little time was spent on discipline and on the teacher doing paperwork.
Average Percentage of Time Spent on Teacher Actions in Class
Teacher reads, lectures or demonstrates
Teacher writing on blackboard
Teacher listening to learners read/recite
Teacher interacts with a small group
Teacher waiting for learners to complete
Teacher supervises learner(s) writing
Teacher leads kinaesthetic (hands-on)
Teacher dictates notes to learners
Teacher testing/assessing learners
Teacher leads learners in singing a song Teacher doing paperwork
Teacher interacts with learner one on one
Teacher maintaing discipline
Teacher interacts with all learners
27.7%
16.1%
9.1%
15.6%
6.5%
5.7%
5.1%
2.7%
2.2%
2%
2.2%
2% 1.7% 1.2%

Impact Evaluation Findings of STiR Education’s Programme in Karnataka State, India26
Teachers spent a significant amount of their time interacting with all students as a whole group; lecturing or demonstrating to students; and writing on the blackboard. These teacher-centred activities take up more than 50% of the lesson time. Less time was spent interacting with small groups of learners; engaging students in hands-on tasks; or assessing students on what they learned. These actions mean less class time is spent on tasks that could stimulate student’s curiosity and critical thinking skills, such as working in small groups or having students demonstrate their understanding. Very few teachers were observed asking their students open-ended questions and asking students careful/effective questions that enable students to think about things deeply. This lack of critical thinking skill development can be evidenced by the fact that only 32% of students reported using a concept they learnt in school to a situation outside of school.
Table 22: Classroom Observations of Critical Thinking Practices
Distribution of scores
Mean SD 0 1 2 3
Teacher asks students questions to enable them to recall basic facts and concepts 1.5 1.2 29.7% 13.5% 29.7% 27.1%
Teacher asks careful/effective questions that get students to really think about things deeply (beyond basic recall of facts or concepts – asking how or why questions)
1.2 1.2 41.5% 16.2% 21.2% 21.2%
Teacher asks open-ended questions (e.g. question requires more than a yes/no or single word answer) 1.4 1.2 33.8% 19.4% 21.2% 25.6%
Teacher gives students critical or creative thinking tasks during the lesson 1.6 0.8 0% 57.4% 25.3% 17.4%
Students ask open-ended questions or perform critical or creative thinking tasks 1 1.1 51.2% 15.3% 20.9% 12.7%
% of students who raised hands to ask questions (0. 1-25%, 1. 26-50%, 2. 51-75%, 3. 76-100%) 1.3 1.5 67.4% 8.5% 10.0% 14.1%
% of students who raised hands to answer questions (0. 1-25%, 1. 26-50%, 2. 51-75%, 3. 76-100%) 1.5 1.5 57.4% 12.7% 12.4% 17.7%
Teacher provides students with choices (students are given options about how a learning activity should be completed) 1.6 0.8 0% 58.5% 18.3% 23.3%
Teacher provides students with opportunities to take on roles in the classroom 1.9 0.8 0% 40.6% 30.0% 29.4%

Impact Evaluation Findings of STiR Education’s Programme in Karnataka State, India 27
Teachers self-reported and were observed being welcoming and friendly towards students and calling on them by name. Students reported liking school and feeling safe in their academic environment. But, conversely, both teachers and students reported that corporal punishment is a common method of discipline with a high percentage of students believing it is the best means of discipline, indicating a disconnect between purported feelings of safety at school and normalized physical punishment practices. Verbal punishment was identified by teachers and ELs/ELMs to a lesser extent than physical punishment, but it also contributes to an overall unsafe environment at school for children.
Headline Finding
10
The STiR programme aims to create school and classroom environments where children are physically and emotionally safe. Teachers and school leaders are morally and legally responsible for this outcome, and must be trained and empowered to implement positive discipline techniques.
Students overwhelmingly reported liking school and feeling safe at school and in their classroom. The majority of teachers were observed treating students respectfully, being positive and encouraging, greeting students, calling on students by name and having enjoyment/emotional connection with them. Most students said that their teachers call on them by name and that the head teacher knows their name, indicating a positive relationship between the students and teachers. Almost all teachers also reported praising students for good behaviour. Moreover, nearly all ELs observed that teachers smile and laugh with the students.
6.5. SAFETY
98% 98% of students reported feeling safe at school and in their classrooms“ “However, teachers and head teachers also self-reported that they use physical discipline on their students. About 25% of
teachers and head teachers indicated that physical punishment is the punishment of choice for various behavioural infractions and 27% of teachers and head teachers reported having exhibited anger towards students one to two times in the past week. In addition, 39% of teachers and head teachers said that physical punishment is needed to “some extent” when disciplining students.
Nearly half of the students (42.3%) reported to being beaten at school in the past 3-4 months, primarily by their teacher or head teacher. On average, students reported to having been beaten thrice in the last two weeks.
One quarter of teachers and head teachers reported that physical punishment is a preferred
method of discipline for various behavioural problems at school
of students reported being beaten at school in the last 3-4 months
42.3%

Impact Evaluation Findings of STiR Education’s Programme in Karnataka State, India28
Additionally, there appears to be a disconnect between students’ purported feelings of safety in school and their acceptance of physical discipline. When asked if they believed the best way to discipline a student who breaks the rules or disobeys a teacher was through caning or physical punishment, 70.3% of students agreed. These results suggest that students may not necessarily correlate being physically punished at school with feeling unsafe. It is possible that corporal punishment at home and school are normalised for many students, and that they are unaware that physical punishment is a characteristic of an unsafe school.
Verbal abuse was also found to occur, although at less frequent rates – 6.7% of students reported that they had been verbally abused in the last 2 weeks at school while 75% of students reported to never having seen students being verbally abused at school. However, 27% of teachers and head teachers said they have seen other teachers verbally abusing students, indicating that verbal abuse is likely higher than what students have reported. The majority of teachers said they have witnessed verbal abuse by other teachers between 1-5 times in the last week. In addition, 17% of ELs/ELMs also reported seeing a teacher verbally abuse a student in the past week.
Going forward, it is important to involve education stakeholders and students in targeted activities to promote positive discipline and improve the safety and emotional well-being of all learners.
When asked if they believed the best way to discipline a student who breaks the rules or disobeys a teacher was through caning or physical punishment,
of teachers and head teachers said they have seen other teachers verbally abusing students
of students agreed70.3% 70.3%
27% 27%
Table 23: Self-Reported Corporal Punishment Practices by Teachers and Head Teachers
Teacher Head Teacher
Yes No Yes No
All teachers and HTs
Have you seen other teachers in this school verbally abuse children when misbehaving? 30% 70% 20% 80%
Have you ever beaten a child in your class for misbehaving? 23.4% 76.6% 29.9% 70.1%
Have you ever beaten a child in your class this year for misbehaving? 77.8% 22.2% 75.9% 20.1%
In the last week, have you verbally abused a child for misbehaving? 15.2% 84.9% 18.6% 81.4%
Males
Have you seen other teachers in this school verbally abuse children when misbehaving? 37.5% 62.5% 12.5% 87.5%
Have you ever beaten a child in your class for misbehaving? 22.6% 77.4% 32.1% 67.9%
Have you ever beaten a child in your class this year for misbehaving? 68.4% 31.6% 72.2% 27.8%
In the last week, have you verbally abused a child for misbehaving? 15.5% 84.5% 14.3% 85.7%
Females
Have you seen other teachers in this school verbally abuse children when misbehaving? 28.9% 74.1% 30.8% 69.2%
Have you ever beaten a child in your class for misbehaving? 23.8% 76.2% 26.8% 73.2%
Have you ever beaten a child in your class this year for misbehaving? 82.9% 14.1% 81.8% 18.2%
In the last week, have you verbally abused a child for misbehaving? 15% 85% 24.4% 75.6%
Table 24: Frequency of Physical and Verbal Abuse Reported by Students
Daily Weekly Monthly Rarely Never Other
How often do you see your teacher or staff member physically punishing students? 10% 17.7% 5.2% 30% 36.7% 0.5%
How often do you see your teacher or staff member verbally abusing students? 5.6% 8.2% 2.3% 9.6% 74.3% 0%

Impact Evaluation Findings of STiR Education’s Programme in Karnataka State, India 29
Self-esteem is a critical factor in ensuring students have positive beliefs about their capacity to learn. Teachers are integral to this process, as they must support and encourage their students to work hard and achieve in school.
Students largely indicated that they are confident dealing with challenging academic tasks in the classroom. Only 32.2% of students reported feeling frustrated when an exercise was difficult while 87.8% of students were determined to learn how to solve difficult exercises. This shows determination and motivation on the part of the students as well as confidence in their ability to overcome challenges. However, 41% of students stated that they have never felt happy with their achievements at school. This highlights that while students report being determined to learn and confident solving difficult tasks, close to one half of students are dissatisfied with their academic achievements for some reason, which should be explored at future evaluation points.
A high percentage of students reported asking their teacher for help with difficult exercises and an almost equally high percentage reported working with fellow students to solve problems. Almost all students agreed that their teachers provide them with feedback on how to solve their exercises. However, during classroom observations, very few students were seen asking their teachers for help with an assignment and an even smaller number were seen asking for help from their peers. Thus, the independent observations do not match the self-reported claims by the students and will need to be further explored in future evaluations to determine exactly how frequently students seek and get help from their teacher and peers.
Classroom observations of teachers indicated that they generally have a positive attitude towards students’ efforts and provide corrective feedback based on written or assigned work that they have completed. However, there is still room for significant improvement, which teachers can hopefully work on in Year 3-5 of the STiR programme. In addition, teachers also need to significantly improve in acknowledging students’ efforts, encouraging both short- and long-term goal setting among students and providing specific feedback to students. Students also need to significantly improve their efforts in asking teachers for clarification and their peers for help.
6.6. SELF-ESTEEM Students reported high levels of determination and grit related to their academic learning and also reported excitement to learn more when faced with a difficult problem and the ability to apply problem-solving strategies. Teachers were observed encouraging and role modelling behaviours that promote self-esteem such as providing students with corrective and specific feedback during lessons and having a positive attitude towards helping students address their learning challenges, although there is still room for improvement.
Headline Finding
11
32.2% 32.2%
93% 93% 88% 88% 81.5% 81.5% 39.8% 39.8%
17.6% 17.6%
of students reported feeling frustrated by difficult exercises
Ask the teacher for help
Work with other students
Keep trying to solve it
Wait for someone to say the answer
Skip and move on to the next exercise
More than 87.8%87.8% said they were determined to solve the problem
Table 25: Teacher Actions to Support Student Achievement
Distribution of scores
Mean SD 0 1 2 3
The teacher acknowledges students’ efforts 1.3 1.2 38.8% 11.5% 29.7% 20%The teacher has a positive attitude towards students’ challenges 1.8 0.9 0% 53.2% 15.9% 30.9%The teacher encourages goal setting among students (both short- and long-term goals 1.4 0.73 0% 74.7% 10.9% 14.4%
Teacher provides corrective feedback to students based on their verbal answers to questions 1.7 1.3 32.1% 10% 17.7% 40.3%
Teacher provides corrective feedback to students based on written or assigned work completed 1.8 1.24 26.8% 10.3% 21.2% 41.8%
Teacher provides specific feedback that points out students’ successes or correct answers 1.4 1.3 40% 15.3% 12.7% 32.1%
Students ask the teacher for clarification or help with an assignment or task 1.2 1.2 41.8% 14.1% 24.4% 19.7%Students ask their peers for clarification or help 0.9 1.12 54.1% 14.7% 17.4% 13.8%
6
What Learners Did to Try and Solve a Difficult Exercise

Impact Evaluation Findings of STiR Education’s Programme in Karnataka State, India30
MEASUREMENT APPROACHES
7.1. MEASURING SAFETY AND PUNISHMENT
7.2. MEASURING INTRINSIC MOTIVATION
One of the most important findings of the first year of the study relates to student safety in classrooms and schools. While students nearly unanimously reported that they feel safe at school, they also reported frequent use of physical punishment by teachers, either towards themselves or other students. Teachers and head teachers themselves reported knowing that the use of physical punishment is wrong – and even illegal – but that it is also useful and appropriate at times to respond proportionately to student actions. These findings raise the question of whether students’ self-reported feelings of safety in the classroom are aligned to a (generally accepted) belief that a ‘safe’ school is one where punishment is not mediated physically by teachers.
The data collected during this evaluation, as well as previous studies conducted in India,3 indicate that corporal punishment is a common occurrence at schools in Karnataka, even though it is illegal according to Indian law. As such, students (and teachers) may not link corporal punishment with a lack of safety in their school and might, on the contrary, believe it should be an acceptable and normal practice. Changing these deep seated cultural and social beliefs about safety and punishment takes long-term behaviour change on the part of both teachers and students and is not cleanly resolved by a government policy’s ban on corporal punishment. This will be a key challenge for STiR to tackle in the future.
These findings also raise the question of whether we should explore alternative metrics to measure safety in the classroom and school environment during future evaluation points to assess progress on the STiR’s indicators related to physically and emotionally safe learning environments. Moreover, educating teachers about effective, non-physical ways to discipline students is a clear professional development area where further work is needed. Parents, communities and ELs/ELMs should also be brought on board to support this and address school-based violence.
Findings from Year 1 of the study indicates that key stakeholders positively report love for their jobs and high levels of satisfaction with the programme so far, stating that their participation in activities has brought about a positive mind set change. Findings also demonstrate that there is already a culture of sharing and learning among ELs/ELMs, teachers and head teachers. These are all very good positives to note from which the STiR programme can build on going forward.
However, while all stakeholders reported high levels of satisfaction with their participation in the STiR programme, there are other factors like lacklustre levels of daily motivation, poor teaching materials, the teaching workload, and desire for additional trainings and appreciation, which influence their motivation to perform their roles and to continue developing as professionals. In addition, the study found high self-reported levels of absenteeism amongst teachers, head teachers and ELs/ELMs, as well as observations during shadowing activities that as between 10%-20% of their time is spent doing tasks unrelated to learning or school improvement. These are significant findings, as reduced rates of time spent on tasks related to improving teaching and learning – coupled with reduced instructional time due to absenteeism from the workplace – mean that there is less than optimal effort and energy spent on actions that can improve learning outcomes and teacher effectiveness in general.
Further investigation of teachers’ self-efficacy is pertinent for later evaluation cycles. Evidence from other research on motivation shows that external factors related to feelings about pay, societal status and working conditions, as well as observable behaviours like absenteeism, are proxy measures for measuring motivation levels at work. Studies show that self-efficacy is central to motivation because “teachers who believe that they cannot achieve their goals – whether they attribute this to their personal shortcomings, to aspects of the environment, or some combination of the two – are unlikely to put much effort into working towards them.” (Stuart Cameron, 2015).
Although STiR does not focus its inputs on addressing extrinsic factors in stakeholder motivation, absenteeism and time spent off task are clearly areas that can affect the overall development of teachers, and programme impacts and sustainability at the end of five years. Through the system strengthening pathway of the programme, it might be worthwhile in the coming phase to work with local and national education officials as well as school leaders to confront these issues and find ways – through the system – to address factors related to extrinsic motivation and absenteeism. Tackling the challenges involved in addressing poor extrinsic motivation involves engaging stakeholders themselves in system level changes that can positively affect the external factors related to their jobs. STiR can participate in this by feeding back findings from Year 1 of the study (and continuing to collect relevant data about it in Year 2) and helping stakeholders determine ways to influence extrinsic motivation within the boundaries of their roles and positions within the education system.
5. 7
3Ogando Portela, M.J. and Pells, K. (2015). ‘Corporal Punishment in Schools: Longitudinal Evidence from Ethiopia, India, Peru and Vietnam’, Innocenti Discussion Paper No. 2015-02, UNICEF Office of Research, Florence.

Impact Evaluation Findings of STiR Education’s Programme in Karnataka State, India 31
7.4. MEASURING THE QUALITY OF STiR ACTIVITIES USING RUBRICS
7.3. MEASURING TEACHER PERFORMANCE
During Year 1 of the study, Ichuli used STiR’s internally developed rubrics to assess the quality of programme activities, including teacher sharing meetings, training institutes, midterm reflection and planning meetings, and district alignment meetings. The data collection team in India was trained first using the original rubrics used in the Uganda Year 1 study at the Master training of the GMI Project Managers and the Training of Trainers of the GMI project teams by the GMI Project Managers. The structure of the original rubrics meant that they lacked progress descriptions for each performance indicator, and that some of the descriptions provided were subjective. These limitations reduced the accuracy of ratings and limited enumerator inter-rater reliability.
Later on, the first versions of the Success Descriptor Rubrics were released by STiR to replace the original rubrics, which helped bridge the gaps that had been identified in the original rubrics. They were much more comprehensive with progress descriptions for each performance indicator. The challenge, however, was that they were released when the data collection teams were about to start data collection and there wasn’t enough time to train the trainers and then the enumerators on the new rubrics. This limitation reduced the accuracy of ratings and limited enumerator inter-rater reliability. Many of the activities evaluated with the tools received high scores during Year 1 of the study; it is important to investigate whether these scores persist after retraining enumerators to use them.
Going forward, it is strongly recommended that all activity quality rubrics to be used are released in time to ensure enumerators are sufficiently trained on how to use these tools to better ensure inter-rater reliability. We suggest that a group of only 10-20 enumerators are trained to use them prior to the actual general enumerator training, although this limited number of trained enumerators may pose a problem when observing the numerous teacher sharing meetings. We may decide that the same people trained on using the Quality of Teaching tool also conduct these observations, as both tools include quality judgements that only the most competent enumerators should be assigned to make.
For Year 1 of the study, Ichuli developed a tool for classroom observations derived from the World Bank’s internationally recognised TEACH tool. The TEACH tool includes 28 teacher and student behaviours within 9 areas that receive overall performance scores of 1-5. The World Bank recommends that enumerators using the TEACH tool undergo one full week of training to learn, in detail, how to utilise the tool and score findings according to TEACH guidelines. This is necessary because the TEACH tool (and tools modelled on it) are subjective and require enumerators to have a strict understanding of the tool’s rubric used to score the quality of each teaching and learning behaviour. At the end of the week of training, an exam is administered to ensure trainees have accurately grasped the TEACH tool rating system and to ensure their inter-rater reliability.
Our classroom observation tool was piloted during Year 1 of the study in Uganda and also in India during the Master Training by GMI Project Managers and Training of Trainers on the GMI project team. This contributed to valuable results about teacher and student classroom behaviour in STiR programme schools; however, we identified some key areas for improvement before utilising it again in Year 2 of the study. First, enumerators using the tool could be taken through an intensive week of training to thoroughly understand how to use it and ensure accurate results with inter-rater reliability. Ichuli’s staff are certified TEACH tool trainers and can use the principles and guidelines learned from their TEACH master training to achieve this. This would allow us to continue using the tool in the field at a large scale, but comes with trade-offs in terms of the time and resources necessary for conducting a large-scale training of enumerators on only one tool for a full week.
Another option is to train only a small number of enumerators on the tool for one week. While this would have the same implication in terms of time (one week of training), it would require fewer resources in terms of the number of enumerators trained. This option, however, would have implications for data collection. If Year 2 of the study were to target the same number of schools and classrooms as in Year 1, a reduced number of trained enumerators conducting classroom observations would have several logistical and time implications. This approach may work best if Year 2 of the study focuses on a smaller selection of schools and classrooms, but takes a ‘deeper dive’ by conducting several classroom observations over a longer school visit. A third option would be to send enumerators who have not received a TEACH tool-style training to the field to videotape lessons. These videos could be post-scored using the Quality of Teaching tool by Ichuli’s staff and a small group of enumerators who are trained to use it properly. This option could allow for the collection of a large number of observations while reducing inputs related to enumerator training. There are some limitations to not scoring the observations live in the classroom, but these could be justified to deliver accuracy in results and value for money.
Alternatively, the number of teaching practices that enumerators are required to observe when using the current tool are too numerous to ensure accuracy and reliability. The TEACH tool includes 28 teaching practices to observe, but our Quality of Teaching Tool includes 60 teaching practices. Additional practices were included in the tool (alongside TEACH practices), as STiR wanted to observe whether teachers were utilising their LIC strategies in the classroom and to track findings against STiR’s key performance indicators for teacher instruction. In practice, observing and rating 60 teaching practices while in the field is extremely difficult, even for well-trained and seasoned enumerators. It is recommended to reduce the number of teaching practices on the tool in the future, especially if we continue scoring live lessons in the field. If observations are videotaped and post-scored, it might be possible to keep a larger number of practices on the tool. However, reducing the number of teacher and student behaviours overall will ensure we focus on collecting the most important information for the evaluation.

Impact Evaluation Findings of STiR Education’s Programme in Karnataka State, India32
CONCLUSIONS AND RECOMMENDATIONS 6. 8
CONCLUSIONS ON PROGRAMME PROGRESS Much has been learned during this first evaluation round about how STiR’s approach, which is focused on strengthening intrinsic motivation, contributes to sustained improvements in the foundations of lifelong learning among education officials, teachers, and students.
Overall, the findings from Year 1 of the study demonstrated that STiR’s programme met their targets as outlined for Year 2 of the Progress Pathway. All findings showed that stakeholders within the education system have established routines within each of the foundations of lifelong learning, the overarching achievement expected by Year 2. The evaluation also primarily corroborated data collected internally previously by STiR.
Specifically, the evaluation found that the concepts of mentoring, role modelling and trying out new practices are beginning to happen with some regularity – key to this year’s focus of helping key stakeholders establish routines. But, the evaluation found that these practices currently often lack substance and depth. Additional efforts are needed to ensure that stakeholders are critically engaging within these processes and practices through deeper reflection on practice and driving school and system improvements in order to drive lifelong learning. In addition, motivational drive, exhibited through attendance, time on task and participation in assigned activities, still needs to be improved across the education system for the intervention to be successful in embedding and sustaining motivation in stakeholders by the end of the five-year support cycle
RECOMMENDATIONS FOR CONTINUED PROGRAMME PROGRESS Now that routines among stakeholders have been established, STiR must strive to ensure that Year 3 of the programme continues well along the Progress Pathway and strengthens a culture of improvement among all stakeholders. Key areas to watch include ensuring that teachers are both routinely and effectively implementing teaching strategies in their classrooms, and that feedback mechanisms between teachers, head teachers and ELs/ELMs improves and progresses from mainly positive praise to more constructive feedback for professional development. STiR should focus on helping stakeholders to create a feedback process and role modelling approach that combines content knowledge with an effective, repeated cycle for effective mentoring/observation/coaching. STiR can also do more to ensure that EL institutes are being organised by ELMs as frequently as planned to ensure that knowledge transmission does not get bottled-necked with ELMs and that it gets passed down to ELs and, subsequently, to teachers.
REFLECTIONS AND RECOMMENDATIONS ON MEASUREMENT
The evaluation has shown that driving impact through intrinsic motivation is a process. Teachers and ELs/ELMs expressed positivity towards the STiR programme and reported high levels of self-reported motivation and professional gain from their involvement. These self-reported indicators are an important measure of personal opinions on motivation, and they show successful results at this stage of the journey. However, motivation must also be measured using externally verifiable behaviours and proxy measures, such as attendance and commitment to completing daily roles and programme activities.
Recommendations on measurement approaches used in the study also include: 1) the need to find alternative metrics to measure safety in the classroom and school environment during future evaluation points to assess progress on STiR’s indicators related to physically and emotionally safe learning environments; 2) the need to work with local and national education officials as well as school leaders to confront the serious issues of absenteeism and time off task and find ways – through the system – to address factors that may be inhibiting motivation and causing unauthorised and unnecessary absenteeism; and 3) improvements needed in the design and/or training of enumerators on some measurement tools including the classroom observation tool and the Success Descriptor Rubrics to ensure objective, reliable measurement.

Impact Evaluation Findings of STiR Education’s Programme in Karnataka State, India 33
9ADDITIONAL DATA FOR HEADLINE 1
ANNEXES
Table A: Teachers and Head Teachers Self-Report on Their Motivation from the STIR Programme
Table B: Students Report on Their Teachers’ Absences
Teachers Self-Report about How Motivated They Feel by the STIR
Programme
Teacher Head Teacher
Highly motivated
Somewhat motivated Not at all Highly
motivatedSomewhat motivated Not at all
All teachers and HTs 21.7% 60.6% 17.8% 21.7% 62.9% 15.5%
Males 19.1% 63.1% 17.9% 26.8% 57.1% 16.1%
Females 23.1% 59.1% 17.7% 14.6% 70.7% 14.6%
Table C: Students Report on Their Teachers’ Absence Frequency
Number of Days Students Say Their Teacher Was Absent in the Past Two Weeks 1 2 3 4 5 or more
All students 47.9% 29.1% 10% 3.1% 10%
Is there any day that your teacher did not come to class in the last two weeks? Yes No
All students 42.8% 57.2%
Graph A: ELMs and ELs Self-Report on Their Motivation by the STiR Programme
How motivated are you by the STiR programme?
90.00%
100.00%
80.00%
70.00%
50.00%
40.00%
30.00%
20.00%
10.00%
60.00%
ELMsELs
0.00%Very
motivatedSomewhat motivated
Not motivated

Impact Evaluation Findings of STiR Education’s Programme in Karnataka State, India34
Graph B: ELMs and ELs Self-Report on Their Motivation at Work
How motivated do you feel at work on most days?
50.00%
60.00%
70.00%
80.00%
90.00%
100.00%
40.00%
20.00%
10.00%
30.00%
0.00%Highly
motivated Motivated Somewhat motivated Not motivated Not sure
Table D: ELMs and ELs Love for Working with Teachers
Do you like working with teachers? Yes No
ELM 100% 0%
EL 97.3% 2.7%
Table E: Self-Reported Lateness Rates
Teachers Head Teachers ELs/ELMs
Percent reporting that they have never been late to work in the last 2 weeks 88.3% 85.6% 81.4%
Table F: Teachers and Head Teachers Self-Reported Ways of Improving Their Motivations
What can be done to increase your motivation at work?
Teacher Head Teacher
All teachers Males Females All head teachers Males Females
Additional training 50.4% 53.9% 48.7% 49.2% 45.7% 54.2%
Change in teaching methods 2.6% 2.6% 2.6% 3.4% 2.9% 4.2%
Cooperation of parents 0.9% 2.6% 0% 1.7% 0% 4.2%
Increased staffing 1.7% 0% 2.6% 3.4% 2.9% 4.2%
Better teaching materials 23.9% 25.6% 23.1% 22.0% 25.7% 16.7%
Students’ cooperation 4.3% 2.6% 5.1% 5.1% 5.7% 4.2%
Salary 2.6% 5.1% 1.3% 0% 0% 0%
Other 13.7% 7.7% 16.7% 13.5% 14.3% 12.5%
ELMs ELs

Impact Evaluation Findings of STiR Education’s Programme in Karnataka State, India 35
Table G: Number of Sharing Meetings Attended
1 2 3 More than 3
All teachers
How many sharing meetings did you attend in 2019? 15.3% 21.9% 27.3% 35.5%
How many sharing meetings did you attend this LIC? 17.4% 27.9% 23.7% 31.1%
Males
How many sharing meetings did you attend in 2019? 16.7% 19.7% 30.3% 33.3%
How many sharing meetings did you attend this LIC? 17.9% 23.9% 28.4% 29.9%
Females
How many sharing meetings did you attend in 2019? 14.5% 23.1% 25.6% 36.8%
How many sharing meetings did you attend this LIC? 17.1% 30.1% 21.1% 31.7%
ADDITIONAL DATA FOR HEADLINE 2
Table H: Teachers’ Self-Reported Preparedness to Apply Content from Sharing Meetings
Table I: Teachers’ Self-Reported Motivations for Attending Sharing Meetings
Not prepared Not Sure Prepared Somewhat Prepared Very PreparedAll teachers 5.7% 4.6% 31.4% 35.1% 23.2%
Males 6.9% 5.5% 34.3% 35.6% 17.8%
Females 5.0% 4.1% 29.8% 34.7% 26.5%
To learn new skills To share ideas I am personally motivated It is compulsory
All teachers 74.8% 12.2% 2.7% 4.2%
Males 83.3% 12.5% 0% 10.8%
Females 70.7% 12.1% 4.0% 13.1%

Impact Evaluation Findings of STiR Education’s Programme in Karnataka State, India36
ADDITIONAL DATA FOR HEADLINE 3
Table J: ELs/ELMs’ Specific Actions after Institutes
Table M: Attendance of Trainings to Improve Professionally
Table L: Practices/Strategies that ELMs and ELs Learnt from STIR Institutes
Do you identify and commit to specific actions that you will undertake after these institutes? Yes No
ELM 80% 20%
EL 75% 25%
Have you attended any trainings or courses to improve professionally? Yes No
ELM 66.7% 33.3%
EL 94.6% 5.4%
Yes No
Positive view of the capacity of teachers (growth mindset) 70.6% 29.4%
Creating productive relationships and a positive working culture 61.8% 38.2%
Collecting and using data to drive improvement 76.5% 23.5%
Creating focused objectives and action plans to address areas of improvement 61.8% 38.2%
Demonstrating what great practice looks like 61.8% 38.2%
Identifying improvement when original changes don’t have desired effect 58.8% 41.2%
Feedback and coaching techniques 58.8% 41.2%
Empowering others to take ownership of school/cluster/block improvement 44.1% 55.9%
Table K: ELMs’ Rating of the ELM Institutes
Poor Fair Good Very Good Excellent
Overall institute content 0% 24% 40% 32% 4%
Handbook clarity 8% 16% 40% 28% 8%
Presentation of material by the STIR PL 4% 12% 48% 28% 8%
Facilitation of activities by the STIR PL 4% 12% 48% 28% 8%
Group activities engagement 4% 8% 52% 28% 8%

Impact Evaluation Findings of STiR Education’s Programme in Karnataka State, India 37
Table N: Meeting with other ELs/ELMs
Table O: Meeting with other ELs/ELMs After the STiR Programme Ends
Table P: Attendance of Non-STIR Trainings
Table Q: Use of Knowledge from these Trainings
Table R: Pursuit of Additional Training Opportunities at a Cost
Do you meet with other ELs/ELMs in your district to learn from each other and improve your practices? Yes No
ELM 83.3% 16.7%
EL 91.9% 8.1%
Will you continue meeting with other ELs/ELMs in your district to learn from each other after the STIR programme ends? Yes No
ELM 83.3% 16.7%
EL 91.7% 8.3%
Have you attended any other non-STIR trainings in 2018 and 2019? Yes No
ELM 50.0% 50.0%
EL 62.2% 37.8%
Are you using the knowledge from these trainings in your day to day work? Yes No
ELM 66.7% 33.3%
EL 78.4% 21.6%
Would you still pursue additional training opportunities for your own development if you had to pay for them? Yes No
ELM 33.3% 66.7%
EL 51.4% 48.7%

Impact Evaluation Findings of STiR Education’s Programme in Karnataka State, India38
ADDITIONAL DATA FOR HEADLINE 4
Table S: EL/ELMs Praise to Teachers
Table T: ELs/ELMs Praise to Head Teachers
Table U: Lesson Plan Review Occurrence
Have you ever praised a teacher? Yes No
ELM 83.3% 16.7%
EL 89.2% 10.8%
Have you ever praised a Head Teacher? Yes No
ELM 100% 0%
EL 93.9% 6.1%
Does anyone review your lesson plans? Yes No
All teachers 90.5% 9.5%
Males 88.1% 11.9%
Females 91.8% 8.2%
Table V: Lesson Plan Review Responsibilities
Table W: Lesson Plan Review Frequency
Table X: Last Time Lesson Plans were Reviewed
Who is responsible for reviewing your lesson plans?
No one Head teacher Deputy Head Teacher
Director of studies
Peer teacher Other
All teachers 7.8% 81.8% 5.6% 1.3% 0.9% 2.6%
Males 8.3% 83.3% 4.8% 1.2% 1.2% 1.2%
Females 7.5% 81% 6.1% 1.4% 0.7% 3.4%
How often are your lesson plans reviewed?
Never Daily Weekly 2 weeks Monthly 3 months Yearly
All teachers 5.2% 9.9% 37.1% 8% 31.5% 5.2% 3.3%
Males 7.8% 5.2% 33.8% 9.1% 36.4% 5.2% 2.6%
Females 3.7% 12.5% 39% 7.4% 28.7% 5.2% 3.7%
When was the last time your lesson plan was reviewed?
Last month Last term This week Two weeks ago
All teachers 33.8% 1.9% 39.9% 24.4%
Males 37.7% 2.6% 33.8% 26%
Females 31.6% 1.5% 43.8% 25.5%

Impact Evaluation Findings of STiR Education’s Programme in Karnataka State, India 39
Table Y: Ease of Approaching School Administration
Do you feel you can approach the head teacher or school administrators with concerns? Yes No
All teachers 95.1% 4.9%
Males 95.1% 4.9%
Females 95.2% 4.8%
ADDITIONAL DATA FOR HEADLINE 5

Impact Evaluation Findings of STiR Education’s Programme in Karnataka State, India40
ADDITIONAL DATA FOR HEADLINE 6Table Z: Students’ Self-Reported Lateness to School
Table AC: Students’ Self-Reported Revision Time
Table AD: Students’ Report on Teacher Praise
Never 1 day 2 days 3 days 4 days Everyday
How many days in the last 2 weeks were you late to school? 59.9% 18.5% 11.3% 5% 4.7% 0.6%
All Students
Never This week Last week Last Month More than a month ago
Think back to when you last revised for an exam. When was it? 16.2% 19.5% 31.8% 16.1% 16.5%
All students
Never Sometimes Most of the time All the time
How often does the teacher provide praise to students equally instead of some students?
12.9% 31.8% 28.8% 26.5%
Table AA: Students’ Self-Reported Reasons for Missing School
Reasons why children missed school in the last 2 weeks All students
Needed at home to work 15.9%
Has employment 4.0%
Lack of transport 1.7%
Family emergency 14.2%
Sickness 60.7%
Table AB: Students with Disabilities/Special Needs
Table AE: Homework for Students
Do you have any students with disabilities or who have special needs? Yes No
All teachers 36.4% 63.6%
Males 36.0% 64.0%
Females 38.9% 61.2%
Do you give the same homework to both fast and slow learners in your classroom? Yes No
All teachers 47.2% 52.8%
Males 48.8% 51.2%
Females 46.3% 53.7%

Impact Evaluation Findings of STiR Education’s Programme in Karnataka State, India 41
ADDITIONAL DATA FOR HEADLINE 7
Table AH: Changes in Learners and Teachers as a Result of Using STIR’s Teaching Practices
Not at all Some what Very much
Do you feel that there is a positive change in your learners ever since you started using these practices/strategies
Teachers
All teachers 13.9% 35.5% 50.7%
Males 14.3% 35.7% 50%
Females 13.6% 35.4% 51%
ELs/ELMs 0% 61.8% 38.2%
Do you feel there is a positive change in your classroom teaching practices ever since you started using these practices/strategies?
Teachers
All teachers 18.6% 35.93% 45.5%
Males 20.2% 35.7% 44.1%
Females 17.7% 36.1% 46.3%
ELs/ELMs 2.9% 64.7% 32.4%
Table AG: Teacher Behaviours/Practices During Lesson Time as Reported by ELs/ELMs
Have you observed teachers doing the following?ELs/ELMs
Yes No
Walk outside of class to answer a phone call 58.5% 41.5%
Ask students if they understood what is taught during lessons 100% 0%
Let students work with each other to complete tasks 100% 0%
Give examples or show how to do an activity during lessons 97.6% 2.4%
Table AF: Teacher Behaviours/Practices During Lesson Time as Reported by Learners
All Students
Does your teacher do the following? Not at all Sometimes Most of the time All the time
Walk outside of class to answer a phone call 35.2% 46.6% 6.4% 11.8%
Ask students if they understood what is taught during lessons 3.1% 27.3% 27.2% 42.5%
Let students work with each other to complete tasks 5.7% 48% 30.9% 15.4%
Give examples or show how to do an activity during lessons 2.3% 34.1% 29.5% 34.1%
Table AI: Confidence in Applying the STIR Strategies
How confident are you in applying the STIR strategies?
Very Confident Somewhat Confident Not Confident
All teachers 35.1% 55.3% 9.6%
Males 32.8% 62.7% 4.5%
Females 36.4% 51.2% 12.4%
Table AJ: Teacher Practices to Help Students Understand a Lesson
Do you do the following to try and help students understand the lesson more? Call on students
Ask a fellow teacher for
support
Reflect on how to reteach the
lesson differently next time
Reteach the lesson
All teachers 77.1% 77.5% 90.5% 93.9%
Males 70.2% 77.4% 86.9% 92.8%
Females 81% 77.6% 92.5% 94.6%

Impact Evaluation Findings of STiR Education’s Programme in Karnataka State, India42
Table AK: Teachers Self Report on Having Additional Trainings
Teachers Head teachers
Yes No Yes No
All teachers and HTs
Have you pursued additional development opportunities? 82.4% 17.6% NA NA
Have you had any education management training? 37.4% 62.6% 59.6% 40.5%
Have you attended any other non-STIR training in 2018 and 2019? 51.5% 48.5% 53.6% 46.4%
Males
Have you pursued additional development opportunities? 82.3% 17.2% NA NA
Have you had any education management training? 45.6% 54.4% 63.3% 36.7%
Have you attended any other non-STIR training in 2018 and 2019? 51.2% 48.8% 57.1% 42.9%
Females
Have you pursued additional development opportunities? 82.5% 17.5% NA NA
Have you had any education management training? 32.6% 67.4% 55% 45%
Have you attended any other non-STIR training in 2018 and 2019? 51.7% 48.3% 48.8% 51.2%
ADDITIONAL DATA FOR HEADLINE 8

Impact Evaluation Findings of STiR Education’s Programme in Karnataka State, India 43
ADDITIONAL DATA FOR HEADLINE 9
Table AM: Last Time Students used Knowledge Outside of School
When was the last time you used knowledge you learned from school and applied it
outside of school? This week Last week Last month More than a
month ago
All students 26.5% 51.9% 12.7% 8.9%
Table AL: Students use of Knowledge Outside of School
Have you used knowledge you learned in school to a situation outside of school? Yes No
All students 32.0% 68.0%

Impact Evaluation Findings of STiR Education’s Programme in Karnataka State, India
Tabl
e AN
: Bre
akdo
wn
of T
each
er A
ctio
ns in
Cla
ssq
Clas
sroo
m
Activ
itySn
1Sn
2Sn
3Sn
4Sn
5Sn
6Sn
7Sn
8Sn
9Sn
10
Sn 1
1Sn
12
Sn 1
3Sn
14
Sn 1
5Av
g.
2min
5min
8min
11m
in14
min
17m
in20
min
23m
in26
min
29m
in32
min
35m
in38
min
41m
in44
min
137
.021
.113
.714
.212
.08.
413
.013
.713
.512
.811
.214
.715
.015
.418
.315
.6
28.
711
.76.
56.
04.
34.
46.
54.
84.
44.
14.
24.
64.
26.
25.
25.
7
311
.812
.315
.618
.716
.416
.214
.919
.420
.116
.916
.317
.716
.115
.414
.016
.1
420
.830
.331
.230
.431
.529
.927
.926
.427
.024
.726
.527
.129
.726
.625
.827
.7
50.
30.
00.
61.
02.
22.
22.
82.
62.
21.
92.
93.
61.
84.
64.
82.
2
60.
32.
53.
42.
52.
23.
42.
22.
92.
53.
12.
22.
93.
92.
73.
92.
7
73.
42.
23.
12.
21.
93.
11.
61.
31.
62.
82.
91.
32.
11.
91.
82.
2
80.
04.
71.
60.
60.
90.
90.
90.
31.
60.
68.
67.
81.
10.
40.
42.
0
97.
56.
911
.211
.19.
010
.910
.59.
29.
111
.66.
45.
97.
311
.28.
79.
1
102.
53.
26.
56.
79.
910
.38.
79.
95.
75.
99.
37.
54.
93.
13.
16.
5
111.
23.
24.
13.
56.
55.
66.
25.
17.
68.
83.
52.
65.
96.
27.
05.
1
121.
20.
60.
61.
31.
21.
32.
52.
61.
62.
53.
52.
02.
84.
32.
62.
0
134.
00.
61.
30.
60.
91.
31.
91.
00.
61.
62.
62.
32.
51.
23.
91.
7
141.
20.
60.
61.
31.
22.
20.
61.
02.
52.
80.
00.
02.
80.
80.
41.
2
Tota
l10
0.00
100.
010
0.0
100.
010
0.0
100.
010
0.0
100.
010
0.0
100.
010
0.0
100.
010
0.0
100.
010
0.0
100.
0
Key:
Cla
ssro
om A
ctiv
ities
1.
Teac
her i
nter
acts
with
all
lear
ners
as
a gr
oup
2.
Teac
her i
nter
acts
with
a s
mal
l gro
up o
f lea
rner
s3.
Te
ache
r int
erac
ts w
ith a
lear
ner o
ne-o
n-on
e4.
Te
ache
r rea
ds, l
ectu
res
or d
emon
stra
tes
to le
arne
rs w
hile
they
list
en5.
Te
ache
r dic
tate
s no
tes
to th
e le
arne
rs a
s th
ey w
rite
in th
eir b
ooks
6.
Teac
her s
uper
vise
s le
arne
r(s)
writ
ing
on th
e bo
ard
7. Te
ache
r lea
ds k
inae
sthe
tic (h
ands
-on)
gro
up le
arni
ng a
ctiv
ity8.
Te
ache
r lea
ds le
arne
rs in
a s
ingi
ng a
son
g9.
Te
ache
r writ
es o
n bl
ackb
oard
10.
Teac
her l
iste
ns to
pup
ils re
ad/r
ecite
11.
Teac
her w
aits
for p
upils
to c
ompl
ete
task
12.
Teac
her t
ests
/ass
esse
s st
uden
ts in
cla
ss13
. Te
ache
r mai
ntai
ns d
isci
plin
e in
cla
ss14
. Te
ache
r doe
s pa
perw
ork
44

45Impact Evaluation Findings of STiR Education’s Programme in Karnataka State, India
ADDITIONAL DATA FOR HEADLINE 10Table AO: Students Report Liking and Feeling Safe at School
Table AS: Students Report on Their Feelings after Being Punished
Table AT: Students Report on Whether the Teacher Calls on them by Name
Yes No
Do you like school? 99.5% 0.5%
Do you feel safe at school? 98.0% 2.0%
Do you feel safe in the classroom? 97.7% 2.3%
When I received a punishment, I felt: Yes No
I deserved the punishment that I received 88.4% 11.6%
The punishment was harsher than it should have been 10.0% 90.0%
I regretted what I did and don’t want to do it again 69.4% 30.6%
Does the class teacher call on you by name? Yes No
98.7% 1.3%
Table AP: Students Report on Teacher Behaviour
How often does the teacher: Not at all Sometimes Most of the time All the time
Discipline a student with a cane, object or their hand 28.6% 58.6% 9.4% 3.4%
Smile and laugh with students 5.2% 38.4% 22.8% 33.6%
Name calling or tell a student they are stupid/shaming students 60.1% 25.8% 4.2% 9.9%
Call on students in the back of the classroom 23.3% 42.7% 17.9% 16.1%
Table AQ: Students Report who has Physically and Verbally Abused Them at School this LIC
Table AR: Frequency of Physical and Verbal Abuse Reported by Students
My teacher Another Teacher Head Teacher Another
StudentSMC/PTA Member
Support staff
Who has physically abused you at school this LIC? 76.8% 18.5% 24.6% 3.3% 2.3% 2.7%
Who has verbally abused you at school this LIC? 73.0% 23.4% 32.9% 6.6% 0% 1.5%
Daily Weekly Monthly Rarely Never Other
How often do you see your teacher or staff member physically punishing students?
10.0% 17.7% 5.2% 30.0% 36.7% 0.5%
How often do you see your teacher or staff member verbally abusing students?
5.6% 8.2% 2.3% 9.6% 74.3% 0%

Impact Evaluation Findings of STiR Education’s Programme in Karnataka State, India46
Table AX: Teachers and Head Teachers Self-Report on their Corporal Punishment Attitudes
Table AY: ELs/ELMs Report on Observed Teacher Behaviours
Table AZ: Teachers and Head Teachers Self-Report on Praising Students
Are there times when you believe it is appropriate to physically punish a child?
Teacher Head Teacher
Yes No Yes No
All teachers and HTs 15.6% 84.4% 18.6% 81.4%Males 10.7% 89.3% 19.6% 80.4%Females 18.4% 81.6% 17.1% 82.9%
In the past week, have you seen teachers do any of the following?
ELM EL
Yes No Yes No
Smile or laugh with students 100% 0% 97.2% 2.8%Call a student a name or tell them they are stupid 40% 60% 13.9% 86.1%
Call on students in the back of the classroom 40% 60% 63.9% 36.1%
Do you provide praise to a child for good behaviours/choices?
Teacher Head Teacher
Yes No Yes No
All teachers and HTs 98.7% 1.3% 96.9% 3.1%Males 97.6% 2.4% 98.2% 1.8%Females 99.3% 0.7% 95.1% 4.9%
Table AU: Students Report on the School Staff that Know their Names
Table AV: Students Report on Asking for Help at School
What other teacher or teaching staff knows your name? Yes No
Head teacher 64.9% 35.2%
Deputy head teacher 47.9% 52.1%
Teaching staff member 80.2% 19.8%
Non-teaching staff 27.6% 72.4%
None 4.5% 95.5%
Yes No
Have you ever asked a teacher or staff member for help with something that was bothering you? 13.6% 86.4%
Table AW: Students Report the Last Time They Asked an Adult at School to Help with a Personal Issue
Today This Week Last Week In the Last Month
More than a Month Ago
All students 10.6% 31.4% 39.4% 9.3% 9.3%

Impact Evaluation Findings of STiR Education’s Programme in Karnataka State, India 47
Tabl
e BA
: Tea
cher
s an
d He
ad T
each
ers
Repo
rt o
n Ho
w th
ey D
isci
plin
e Ch
ildre
n in
thei
r Cla
ss
How
do
you
usua
lly
disc
iplin
e ch
ildre
n in
yo
ur c
lass
for
mis
beha
ving
?
Teac
hers
Hea
d Te
ache
rs
Coun
selli
ngIn
form
ing
pare
nts
Mor
e w
ork
Phys
ical
pu
nish
men
tVe
rbal
pu
nish
men
tW
arni
ngCo
unse
lling
Info
rmin
g pa
rent
sM
ore
wor
kPh
ysic
al
puni
shm
ent
Verb
al
puni
shm
ent
War
ning
All t
each
ers
73.6
%2.
1%11
.4%
3.6%
3.6%
5.7%
83.1
%1.
5%10
.8%
1.5%
1.5%
1.5%
Mal
es78
.7%
0%14
.9%
0%2.
1%4.
3%83
.3%
0%13
.9%
0%0%
2.8%
Fem
ales
71.0
%3.
2%9.
7%5.
4%4.
3%6.
5%82
.8%
3.5%
6.9%
3.5%
3.5%
0%

Impact Evaluation Findings of STiR Education’s Programme in Karnataka State, India48
Table BD: Teacher Actions to Help Students Understand a Lesson
Teachers ELs/ELMs
Do you use this practice? Have you observed teachers use this practice in the past month?
All teachers Males Females Yes No
Repeat concepts 93.9% 90.5% 95.9% 90.2% 9.8%
Cover the material again another day 74.5% 77.4% 72.8% 78.1% 22.0%
Call on other students to explain 67.5% 72.6% 64.6% 82.9% 17.1%
Spend time after class/school helping students struggling
68.8% 76.2% 64.6% 85.4% 14.6%
Spend time after class/school helping students who need more difficult work
93.9% 70.2% 62.6% 90.2% 9.8%
ADDITIONAL DATA FOR HEADLINE 11
Table BB: Learners Report on Teacher Praise in the Last Week
Table BC: Learners Report on Teacher Praise
In the last week, how many times did your teacher give you praise for your good work?
Never Sometimes Most of the time All the time
All students 32.5% 46% 15.7% 5.8%
When was the last time your teacher gave you praise for good work?
Never This week Last week Last month More than a month ago
All students 1.1% 28.9% 42.1% 16.5% 11.5%

Impact Evaluation Findings of STiR Education’s Programme in Karnataka State, India 49
Impact Evaluation Findings of STiR Education’s Programme in Karnataka State, India50

Impact Evaluation Findings of STiR Education’s Programme in Karnataka State, India 51

Prepared and Designed by:
Ichuli Consulting
Plot 2690, Ntinda-Kigowa RoadPO Box 56, Ntinda, Kampala, Ugandawww.ichuli.africa