A Quantitative Weld Sizing Criterion for Welded Connections ...
203
A Quantitative Weld Sizing Criterion for Welded Connections in Lightweight Shipboard Structures: Modeling, Validation, and Structural Applications by Hanqing Lu A dissertation submitted in partial fulfillment of the requirements for the degree of Doctor of Philosophy (Naval Architecture and Marine Engineering) in the University of Michigan 2021 Doctoral Committee: Professor Pingsha Dong, Chair Associate Professor Matthew D. Collette Associate Professor Jason P. McCormick Associate Professor David J. Singer
-
Upload
khangminh22 -
Category
Documents
-
view
1 -
download
0
Transcript of A Quantitative Weld Sizing Criterion for Welded Connections ...

A Quantitative Weld Sizing Criterion for Welded Connections in Lightweight Shipboard Structures:
Modeling, Validation, and Structural Applications
by
Hanqing Lu
A dissertation submitted in partial fulfillment
of the requirements for the degree of
Doctor of Philosophy
(Naval Architecture and Marine Engineering)
in the University of Michigan
2021
Doctoral Committee:
Professor Pingsha Dong, Chair
Associate Professor Matthew D. Collette
Associate Professor Jason P. McCormick
Associate Professor David J. Singer

ii
Dedication
This dissertation is dedicated to my parents, my wife and all my family members, who have
always believed in me and supported me throughout my journey.
I am also infinitely grateful to my mentor, Prof. Pingsha Dong, who has gone beyond his
ways to help me both in my academic and personal life over the last 10 years.

iii
Acknowledgements
First and foremost, I would like to express my infinite gratitude to my advisor and mentor,
Prof. Pingsha Dong, for his continuous support and guidance throughout my Ph.D. program. His
knowledge helps me, and his work ethic motivates me every time when I have a hard time in
research.
In addition, I would like to sincerely appreciate the rest of my doctoral committee: Prof.
David J. Singer, Prof. Matthew D. Collette, and Prof. Jason P. McCormick. Their guidance and
advice help the completeness of this thesis.
Finally, I want to thank all my colleagues, including but limited to Shaopin Song, Shizhu
Xing, Xianjun Pei, Jifa Mei, Alina Shrestha, and Sandipp Ravi. I truly cherish all the testing,
modeling, and theory discussions that we have done and accomplished together.

iv
Table of Contents
Dedication ....................................................................................................................................... ii
Acknowledgements ........................................................................................................................ iii
List of Tables ............................................................................................................................... viii
List of Figures ................................................................................................................................ ix
List of Appendices ........................................................................................................................ xv
List of Symbols ............................................................................................................................ xvi
Abstract ........................................................................................................................................ xxi
Chapter 1 Introduction .................................................................................................................... 1
1.1 Research Background ............................................................................................................ 1
1.1.1 Challenges in Construction of Lightweight Structures .................................................. 1
1.1.2 Limitations in Traditional Weld Sizing Criteria ............................................................. 3
1.2 Representative Research Efforts on Quantitative Weld Sizing ............................................. 6
1.2.1 Past Experimental Findings ............................................................................................ 7
1.2.2 Past Theoretical Developments ...................................................................................... 9
1.2.3 “Directional Strength-Increase Factor” ........................................................................ 11
1.3 Research Objectives ............................................................................................................ 13
1.4 Dissertation Structure .......................................................................................................... 14
Chapter 2 Strength Analysis of Fillet Welds under Longitudinal and Transverse Shear Conditions
....................................................................................................................................................... 17
Abstract ..................................................................................................................................... 17
2.1 Introduction ......................................................................................................................... 18
v
2.2 Weld Throat Stress Characterization ................................................................................... 22
2.2.1 Traction Stress Method................................................................................................. 22
2.2.2 Calculation Procedure .................................................................................................. 23
2.2.3 Analysis of Test Specimens.......................................................................................... 27
2.3 Testing Procedure ................................................................................................................ 39
2.4 Analysis of Test Results ...................................................................................................... 43
2.4.1 Using Conventional Method......................................................................................... 44
2.4.2 Using Traction Stress Method ...................................................................................... 46
2.5 Conclusions ......................................................................................................................... 49
Acknowledgments ..................................................................................................................... 50
Chapter 3 An Analytical Shear Strength Model for Load-Carrying Fillet-Welded Connections
Incorporating Nonlinear Effects ................................................................................................... 51
Abstract ..................................................................................................................................... 51
3.1 Introduction ......................................................................................................................... 52
3.2 Analytical Weld Throat Stress Model ................................................................................. 57
3.2.1 Shear Failure Criterion ................................................................................................. 57
3.2.2 Treatment of Plate-to-Plate Contact ............................................................................. 61
3.2.3 Limit State Definition ................................................................................................... 64
3.3 Nonlinear Finite Element Analysis ..................................................................................... 66
3.3.1 FE Model Details .......................................................................................................... 67
3.3.2 FE Results ..................................................................................................................... 69
3.4 Analysis of Test Data .......................................................................................................... 73
3.4.1 Shear Strength Correlation ........................................................................................... 74
3.4.2 Critical Weld Throat Plane Angle Estimation .............................................................. 75
3.4.3 Applications for Combined Loading Conditions ......................................................... 76
3.5 Conclusions ......................................................................................................................... 77

vi
Acknowledgments ..................................................................................................................... 78
Chapter 4 A Quantitative Weld Sizing Criterion and Applications in Load Capacity Evaluation of
Hollow Structural Section Joints .................................................................................................. 79
Abstract ..................................................................................................................................... 79
4.1 Introduction ......................................................................................................................... 80
4.2 Assessment of Traditional Weld Sizing Approaches .......................................................... 82
4.2.1 Engineering Shear Stress .............................................................................................. 82
4.2.2 Directional Strength-Increase Factor ............................................................................ 84
4.3 Traction Stress based Weld Strength Criterion ................................................................... 87
4.4 Analysis of Fillet-Welded HSS Connections ...................................................................... 90
4.4.1 Finite Element Analysis using TSM............................................................................. 92
4.4.2 Weld Effective Length in HSS-to-HSS Joints............................................................ 105
4.4.3 Ultimate Load Capacity Estimation ........................................................................... 106
4.4.4 Weld Sizing Criterion ................................................................................................. 114
4.5 Conclusions ....................................................................................................................... 115
Chapter 5 Discussion .................................................................................................................. 116
5.1 Aluminum Alloys .............................................................................................................. 117
5.2 Titanium Alloys ................................................................................................................. 120
5.3 Weld Size Effects .............................................................................................................. 127
5.4 Generalized Quantitative Weld Sizing Criterion............................................................... 132
Chapter 6 Conclusions and Future Work .................................................................................... 138
6.1 Major Contributions .......................................................................................................... 138
6.2 Areas of Future Study ....................................................................................................... 140
Appendix A Shear Strength Correlation between Longitudinal and Transverse Shear Specimens
using Conventional Method ........................................................................................................ 142

vii
Appendix B Shear Strength Correlation between Longitudinal and Transverse Shear Specimens
using Traction Stress Method ..................................................................................................... 151
Appendix C Shear Strength Correlations by Traction Stress Method with and without Plate Contact
Effects ......................................................................................................................................... 160
Appendix D Shear Strength Correlations between Longitudinal and Transverse Specimens Made
of Aluminum Alloys ................................................................................................................... 165
Appendix E Shear Strength Correlations between Longitudinal and Transverse Specimens Made
of Titanium Alloys ...................................................................................................................... 170
References ................................................................................................................................... 176

viii
List of Tables
Table 2.1: Shear specimens tested in this study ............................................................................ 39
Table 4.1: Geometric properties of HSS-to-plate and HSS-to-HSS connections ....................... 106
Table 4.2: Mechanical properties of HSS-to-plate and HSS-to-HSS connections ..................... 107
Table 4.3: Weld size reduction from Eq. (4.2) by Eq. (4.22) ..................................................... 114
Table 5.1: Aluminum alloys shear specimens tested in this study ............................................. 117
Table 5.2: Titanium alloys shear specimens tested in this study ................................................ 121
Table 5.3: Weld size reduction from traditional approach (Eq. (1.2) )by proposed weld sizing
criterion (Eq. (5.7) for longitudinal shear specimens ................................................................. 135
Table 5.4: Weld size reduction from traditional approach (Eq. (1.2) )by proposed weld sizing
criterion Eq. (5.7) for transverse shear specimens ...................................................................... 136
Table 5.5: Weld size reduction from traditional approach (Eq. (1.2) )by proposed weld sizing
criterion Eq. (5.7) for HSS connections from literature .............................................................. 137

ix
List of Figures
Figure 1.1: Welding-induced distortion observed on a ship panel ................................................. 2
Figure 1.2: Standard fillet weld shear strength specimen: (a) longitudinal shear loaded; (b)
transverse shear loaded ................................................................................................................... 3
Figure 1.3: Theoretical weld throat 𝑎45 as failure plane for standard fillet welded shear testing
specimens ........................................................................................................................................ 4
Figure 1.4: Typical weld throat failure plane observed on transverse shear specimen .................. 5
Figure 1.5: Shear strength discrepancy between longitudinal and transverse shear specimens by
Eq. (1.1) .......................................................................................................................................... 6
Figure 1.6: Fillet weld under remote load 𝑃 with loading angle 𝛼 ................................................. 7
Figure 1.7: Classical wedge solution used by Kato and Morita (1974) ........................................ 10
Figure 1.8: Assumed force system in the study of Kamtekar (1982) ........................................... 10
Figure 2.1: AWS standard shear strength test specimens: (a) longitudinal shear; (b) transverse
shear .............................................................................................................................................. 19
Figure 2.2: Fillet weld leg and weld throat definition in AWS B4.0 ............................................ 20
Figure 2.3: Traction stress components acting on a weld throat plane at an angle of 𝜃 ............... 24
Figure 2.4: Linear representation and decomposition of weld throat traction stress components 24
Figure 2.5: Global coordinate system versus local coordinate system ......................................... 26
Figure 2.6: Transformation of nodal forces on a weld throat cut plane in 3D solid element model
into statically equivalent forces and moments with respect to weld throat mid-section along weld
line................................................................................................................................................. 27
Figure 2.7: A representative 3D solid finite element model used for longitudinal shear specimens
(1" = 25.4 mm) ............................................................................................................................ 29
Figure 2.8: Three cut planes through weld for calculating longitudinal shear stress along weld line
....................................................................................................................................................... 29
x
Figure 2.9: Normalized longitudinal shear stress distribution on three cut planes along weld line
....................................................................................................................................................... 30
Figure 2.10: Demonstration of mesh-insensitivity of traction stress method – longitudinal shear
specimen: (a) FE models with different element sizes; (b) comparison of normalized shear stress
along weld line obtained from each model shown in Figure 2.10a .............................................. 31
Figure 2.11: SCF for longitudinal shear specimens as a function of relative fillet weld leg size
(𝑠/𝑇1) ............................................................................................................................................ 33
Figure 2.12: A representative plane-strain finite element model for transverse shear specimen . 35
Figure 2.13: Comparison of analytical and finite element results for transverse shear stress and
normal stress as a function of cut angle 𝜃 ..................................................................................... 36
Figure 2.14: Free-body diagram for transverse shear specimen with equal weld leg size 𝑠 ........ 37
Figure 2.15: Shear strength test specimens prior to testing: (a) longitudinal shear; (b) transverse
shear .............................................................................................................................................. 41
Figure 2.16: Laser scan device for weld profile and weld size determination ............................. 41
Figure 2.17: Typical load-displacement curves: (a) longitudinal shear (b) transverse shear ....... 42
Figure 2.18: Shear failure angles: (a) longitudinal shear, about 45°; (b) transverse shear, about
22.5° .............................................................................................................................................. 43
Figure 2.19: Comparison of shear strengths between longitudinal and transverse shear specimens
using Eq. (2.1): (a) DH36 with FCAW; (b) HSLA80 with FCAW; (c) HSLA80 with GMAW .. 46
Figure 2.20: Comparison of shear strengths between longitudinal and transverse shear specimens
using traction stress method: (a) DH36 with FCAW; (b) HSLA80 with FCAW; (c) HSLA80 with
GMAW ......................................................................................................................................... 48
Figure 3.1: Fillet-welded specimen under transverse shear loading condition ............................. 52
Figure 3.2: Typical weld throat failure plane observed on transverse shear specimens, noticeably
smaller than 45° as assumed in Eq. (3.1) ...................................................................................... 54
Figure 3.3: Shear strength correlations between transverse and longitudinal shear specimens:
traditional method Eq. (3.1) versus traction stress method: (a) DH36, FCAW, and 71T1-C weld
wire; (b) HSLA80, FCAW, and 101T-C weld wire...................................................................... 55
Figure 3.4: Failure angles measured in transverse shear specimens after fracture ....................... 56
Figure 3.5: Traction stress components acting on a weld throat plane at an angle of 𝜃: (a) Fillet
weld between base and attachment plate; (b) Traction stress definition on weld throat plane at
angle 𝜃 .......................................................................................................................................... 58

xi
Figure 3.6: Linear representation and decomposition of weld throat traction stress components 59
Figure 3.7: Illustration of combined loading on a load-carrying fillet weld ................................. 59
Figure 3.8: Critical weld throat failure plane angle 𝜃𝑚𝑎𝑥 as a function of loading angle 𝛼 :
analytical versus experimental results .......................................................................................... 61
Figure 3.9: Analytical weld throat model incorporating resultant contact force 𝐶 ....................... 62
Figure 3.10: Effect of contact ratio on critical weld throat plane angle and maximum shear stress
reduction ....................................................................................................................................... 63
Figure 3.11: FE model and stress-strain relationship used for modeling transverse shear specimen:
(a) A representative FE model of transverse shear specimen; (b) Stress-strain curve representing
elastic-perfect-plastic material used in FEA calculations ............................................................. 68
Figure 3.12: FE results without contact effects: (a) Shear force on critical weld throat plane; (b)
Shear stress ratio 𝜏𝑏 𝜏𝑚⁄ on critical weld throat plane; (c) Membrane shear stress 𝜏𝑚 at
𝐷𝐹𝐸𝐴 𝐷𝑈⁄ = 1: analytical vs FE results ......................................................................................... 71
Figure 3.13: Computed contact ratio 𝐾 as a function of relative load point displacement 𝐷𝐹𝐸𝐴 𝐷𝑈⁄....................................................................................................................................................... 72
Figure 3.14: Critical weld throat plane as a function of contact ratio: analytical versus FE results
....................................................................................................................................................... 73
Figure 3.15: Shear strength correlations by traction stress method with and without contact effects:
(a) DH36, FCAW, and 71T1-C weld wire; (b) HSLA80, FCAW, and 101T-C weld wire .......... 75
Figure 3.16: Predicted failure angle versus measured failure angle ............................................. 75
Figure 4.1: Hollow structural sections: circular hollow sections and rectangular hollow sections
....................................................................................................................................................... 80
Figure 4.2: Standard fillet-welded shear testing specimens: (a) longitudinal shear loaded; (b)
transverse shear loaded ................................................................................................................. 83
Figure 4.3: Theoretical weld throat 𝑎45 as failure plane for standard fillet-welded shear testing
specimens ...................................................................................................................................... 84
Figure 4.4: Combined shear loaded fillet weld with loading angle 𝛼........................................... 85
Figure 4.5: Traction stress components acting on a weld throat plane at an angle of 𝜃 ............... 87
Figure 4.6: Linear representation and decompostion of weld throat traction stress components . 88
Figure 4.7: Fillet weld strength correlation comparison between traction stress method and
traditional approach ...................................................................................................................... 89

xii
Figure 4.8: Fillet weld strength correlation comparison between TSM and TSM with nonlinearity
....................................................................................................................................................... 89
Figure 4.9: Critical weld failure angle correlation between traction stress method and test data
measurement ................................................................................................................................. 90
Figure 4.10: Fillet-welded HSS connections: (a) HSS to rigid plate; (b) HSS to HSS ................ 91
Figure 4.11: Cross section A-A of branch member in Figure 4.10: (a) CHS; (b) RHS ................ 92
Figure 4.12: FE models for fillet-welded HSS connections: (a) CHS; (b) RHS .......................... 93
Figure 4.13: Normalized traction stress distribution along weld circumference on CHS connection
under 90° loading .......................................................................................................................... 95
Figure 4.14: 2D axisymmetrci FE modeling for CHS connections .............................................. 95
Figure 4.15: Ratio 𝐾 vs 𝑅𝑏 𝑡𝑏⁄ for CHS connections with different 𝑡𝑏 ........................................ 96
Figure 4.16: Normalized traction stress and ratio K distribution along weld circumference for RHS
connections ................................................................................................................................... 98
Figure 4.17: Ratio 𝐾 vs 𝐵𝑏 𝑡𝑏⁄ for RHS connections ................................................................. 100
Figure 4.18: Correlation of ratio 𝐾 vs 𝜆1 for both CHS and RHS connections by Eq. (4.10) ... 101
Figure 4.19: Normalized shear stress at 0° weld throat plane vs local radius effect for RHS .... 102
Figure 4.20: Normalized shear stress at 0° weld throat plane vs Cb,max/tb for RHS ................ 103
Figure 4.21: Normalized shear stress at 0° weld throat plane vs 𝜆2 for RHS ............................. 104
Figure 4.22: Load capacity correlations between test results and AISC .................................... 109
Figure 4.23: Load capacity correlations between test results and AISC with directional strength-
increase factor ............................................................................................................................. 110
Figure 4.24: Load capacity correlations between test results and CSA with directional strength-
increase factor ............................................................................................................................. 110
Figure 4.25: Load capacity correlations between test results and Eurocode 3 ........................... 111
Figure 4.26: Load capacity correlations between test results and TSM: (a) Nominal weld shear
strength is set to 60% of its tested ultimate tensile strength; (b) Nominal weld shear strength is set
to 67% of its tested ultimate tensile strength .............................................................................. 113
Figure 5.1: Comparison of shear strengths between longitudinal and transverse shear specimens of
AL 5456 with GMAW and 5556 weld wire: (a) AWS traditional equation; (b) traction stress
method; (c) traction stress method with nonlinear effects .......................................................... 119

xiii
Figure 5.2: Comparison of shear strengths between longitudinal and transverse shear specimens of
AL 6082 with GMAW and 5183 weld wire: (a) AWS traditional equation; (b) traction stress
method; (c) traction stress method with nonlinear effects .......................................................... 120
Figure 5.3: Comparison of shear strengths between longitudinal and transverse shear specimens of
Ti 6-4 with GTAW: (a) AWS traditional equation; (b) traction stress method; (c) traction stress
method with nonlinear effects ..................................................................................................... 123
Figure 5.4: Comparison of shear strengths between longitudinal and transverse shear specimens of
Ti CP with GMAW: (a) AWS traditional equation; (b) traction stress method; (c) traction stress
method with nonlinear effects ..................................................................................................... 125
Figure 5.5: Comparison of shear strengths between longitudinal and transverse shear specimens of
Ti 425 with GMAW: (a) AWS traditional equation; (b) traction stress method; (c) traction stress
method with nonlinear effects ..................................................................................................... 126
Figure 5.6: Weld penetration in load-carrying fillet weld .......................................................... 127
Figure 5.7: Weld penetration vs weld size .................................................................................. 128
Figure 5.8: Shear strength vs weld size ...................................................................................... 129
Figure 5.9: Hardness test for weld with different size: (a) hardness test procedure; (b) hardness test
results for DH36 with FCAW & 71T1-C; (c) hardness test results for HSLA80 with FCAW &
101T-C ........................................................................................................................................ 131
Figure A.1: Shear strength correlation between longitudinal and transverse shear specimens using
conventional method for DH36 with FCAW and 71T1-C weld wire ......................................... 145
Figure A.2: Shear strength correlation between longitudinal and transverse shear specimens using
conventional method for HSLA-80 with FCAW and 101T-C weld wire ................................... 148
Figure A.3: Shear strength correlation between longitudinal and transverse shear specimens using
conventional method for HSLA-80 with GMAW and MIL-100S weld wire ............................. 150
Figure B.1: Shear strength correlation between longitudinal and transverse shear specimens using
traction stress method for DH36 with FCAW and 71T1-C weld wire ....................................... 154
Figure B.2: Shear strength correlation between longitudinal and transverse shear specimens using
traction stress method for HSLA-80 with FCAW and 101T-C weld wire ................................. 157
Figure B.3: Shear strength correlation between longitudinal and transverse shear specimens using
traction stress method for HSLA-80 with GMAW and MIL-100S weld wire ........................... 159
Figure C.1: Shear strength correlations by traction stress method with and without contact effects
for DH36 with FCAW, and 71T1-C weld wire .......................................................................... 161

xiv
Figure C.2: Shear strength correlations by traction stress method with and without contact effects
for HSLA-80 with FCAW, and 101T-C weld wire .................................................................... 163
Figure C.3: Shear strength correlations by traction stress method with and without contact effects
for HSLA-80 with GMAW, and MIL-100S weld wire .............................................................. 164
Figure D.1: Shear strength correlations between longitudinal and transverse specimens made of
AL 5456 with GMAW and 5556 weld wire: a comparison between AWS traditional equation and
traction stress method with/without nonlinear effects ................................................................ 167
Figure D.2: Shear strength correlations between longitudinal and transverse specimens made of
AL 6082 with GMAW and 5183 weld wire: a comparison between AWS traditional equation and
traction stress method with/without nonlinear effects ................................................................ 169
Figure E.1: Shear strength correlations between longitudinal and transverse specimens made of Ti
6-4 with GMAW: a comparison between AWS traditional equation and traction stress method
with/without nonlinear effects .................................................................................................... 170
Figure E.2: Shear strength correlations between longitudinal and transverse specimens made of Ti
6-4 with GTAW: a comparison between AWS traditional equation and traction stress method
with/without nonlinear effects .................................................................................................... 171
Figure E.3: Shear strength correlations between longitudinal and transverse specimens made of Ti
CP with GMAW: a comparison between AWS traditional equation and traction stress method
with/without nonlinear effects .................................................................................................... 172
Figure E.4: Shear strength correlations between longitudinal and transverse specimens made of Ti
CP with GTAW: a comparison between AWS traditional equation and traction stress method
with/without nonlinear effects .................................................................................................... 173
Figure E.5: Shear strength correlations between longitudinal and transverse specimens made of Ti
425 with GMAW: a comparison between AWS traditional equation and traction stress method
with/without nonlinear effects .................................................................................................... 174
Figure E.6: Shear strength correlations between longitudinal and transverse specimens made of Ti
425 with GTAW: a comparison between AWS traditional equation and traction stress method
with/without nonlinear effects .................................................................................................... 175

xv
List of Appendices
Appendix A Shear Strength Correlation between Longitudinal and Transverse Shear Specimens
using Conventional Method ........................................................................................................ 142
Appendix B Shear Strength Correlation between Longitudinal and Transverse Shear Specimens
using Traction Stress Method ..................................................................................................... 151
Appendix C Shear Strength Correlations by Traction Stress Method with and without Plate Contact
Effects ......................................................................................................................................... 160
Appendix D Shear Strength Correlations between Longitudinal and Transverse Specimens Made
of Aluminum Alloys ................................................................................................................... 165
Appendix E Shear Strength Correlations between Longitudinal and Transverse Specimens Made
of Titanium Alloys ...................................................................................................................... 170

xvi
List of Symbols
𝑎45 Weld throat size along 45° angle from base plate
𝑎𝜃 Weld throat size along 𝜃 angle from base plate
𝐵 Nominal chord section width on RHS connections
𝐵𝑏 Nominal branch section width on RHS connections
𝐶 Contact force generated from plate-to-plate contact in transverse shear specimens
𝐶𝑏 Distance between weld toe and centroid of cross section
𝐶𝑏,𝑚𝑎𝑥 Max distance between weld toe and centroid of cross section along weld direction
𝐶𝑏,𝑚𝑖𝑛 Min distance between weld toe and centroid of cross section along weld direction
𝐷 Chord section width on CHS connections
𝐷𝑏 Branch section width on CHS connections
𝐷𝐹𝐸𝐴 Load point displacement obtained from finite element model
𝐹𝑛,𝑥′ Nodal force at the 𝑛th node along weld line with respect to local 𝑥′ direction
𝐹𝑛,𝑦′ Nodal force at the 𝑛th node along weld line with respect to local 𝑦′ direction
𝐹𝑛,𝑧′ Nodal force at the 𝑛th node along weld line with respect to local 𝑧′ direction
𝐹𝑥 Nodal force with respect to global 𝑥 axis
𝐹𝑦 Nodal force with respect to global 𝑦 axis
𝐹𝑧 Nodal force with respect to global 𝑧 axis
𝐹𝑥′ Nodal force with respect to global 𝑥′ axis
𝐹𝑦′ Nodal force with respect to global 𝑦′ axis
𝐹𝑧′ Nodal force with respect to global 𝑧′ axis

xvii
𝑓𝑛,𝑥′ Line force at the 𝑛th node along weld line with respect to local 𝑥′ direction
𝑓𝑛,𝑦′ Line force at the 𝑛th node along weld line with respect to local 𝑦′ direction
𝑓𝑛,𝑧′ Line force at the 𝑛th node along weld line with respect to local 𝑧′ direction
𝑓𝑢𝑡𝑠 UTS of test coupon from rigid endplate or chord on HSS connections
𝑓𝑢𝑡𝑠,𝑏 UTS of test coupon from hollow section plate on HSS connections
𝑓𝑢𝑡𝑠,𝑤 UTS of test coupon from as-laid weld on HSS connections
𝑓𝑥′ Line force with respect to local 𝑥′ axis
𝑓𝑦𝑠 Yield strength of test coupon from rigid endplate or chord on HSS connections
𝑓𝑦𝑠,𝑏 Yield strength of test coupon from hollow section plate on HSS connections
𝑓𝑦𝑠,𝑤 Yield strength of test coupon from as-laid weld on HSS connections
𝑓𝑦′ Line force with respect to local 𝑦′ axis
𝑓𝑧′ Line force with respect to local 𝑧′ axis
𝐾 Ratio of normal stress to shear stress on 0° weld throat plane
𝐿 Total measured weld length carrying load
𝐿𝑒 Effective weld length carrying load
𝑙𝑛−1 Element edge length along weld line at the 𝑛th node
𝑀𝑛,𝑥′ Nodal moment at the 𝑛th node along weld line with respect to local 𝑥′ direction
𝑀𝑛,𝑦′ Nodal moment at the 𝑛th node along weld line with respect to local 𝑦′ direction
𝑀𝑛,𝑧′ Nodal moment at the 𝑛th node along weld line with respect to local 𝑧′ direction
𝑚𝑛,𝑥′ Line moment at the 𝑛th node along weld line with respect to local 𝑥′ direction
𝑚𝑛,𝑦′ Line moment at the 𝑛th node along weld line with respect to local 𝑦′ direction
𝑚𝑛,𝑧′ Line moment at the 𝑛th node along weld line with respect to local 𝑧′ direction
𝑚𝑦′ Line moment with respect to local 𝑦′ axis
𝑚𝑧′ Line moment with respect to local 𝑧′ axis

xviii
𝑛 Total number of nodes defining weld line in finite element model
𝑃 Remotely applied load in shear specimen testing
𝑃𝐿 Remotely applied longitudinal force parallel to weld axis
𝑃𝑛,𝑤 Estimated ultimate load capacity of fillet welds on HSS connections
𝑃𝑇 Remotely applied transverse force perpendicular to weld axis
𝑃𝑢 Peak load obtained in load-displacement curve from a shear strength test
𝑅𝑏 Branch section radius on CHS connections
𝑟𝑐 Local radius at the RHS corner
𝑆 Shear force acting on a weld throat plane
𝑠 Fillet weld leg size
𝑠𝑝 Weld penetration
𝑇1 Base plate thickness of longitudinal or transverse shear specimen in a test program
𝑇2 Lap plate thickness of longitudinal or transverse shear specimen in a test program
𝑇𝑏 Base plate thickness of standard longitudinal or transverse shear specimen
𝑡 Base plate or chord plate thickness
𝑡𝑏 Branch plate thickness on HSS connections
𝛼 Loading angle between remotely applied load 𝑃 and weld axis
𝛽𝑤 Correlation factor for fillet welds in EN1993-1-8
𝜀𝑟𝑢𝑝,𝑏 Elongation of test coupon at rupture from hollow section plate on HSS connections
𝜀𝑟𝑢𝑝 Elong. of test coupon at rupture from rigid endplate or chord on HSS connections
𝜀𝑟𝑢𝑝,𝑤 Elongation of test coupon at rupture from as-laid weld on HSS connections
𝜃 Angle between weld throat plane and base plate
𝜃𝑚𝑎𝑥 Angle of critical weld throat plane
𝜆1 Parameter for ratio 𝐾 correlation
𝜆2 Parameter for 𝜏𝑇𝑚(0) correlation

xix
𝜆3 Parameter for 𝑃𝑢 estimation with different loading direction
𝜎 Normal stress
𝜎𝑏 Bending part of normal stress
𝜎𝑚 Membrane part of normal stress
𝜎𝑅 Resultant stress, i.e., 𝜎𝑅 = √𝜎𝑚2 + 𝜏𝑇𝑚2
𝜏𝑒 Effective shear stress for characterizing shear strength of fillet welds
𝜏𝑒,𝑚𝑎𝑥 Maximum effective shear stress for defining shear strength of fillet welds
𝜏𝐿 Longitudinal shear stress
𝜏𝐿𝑏 Bending part of longitudinal shear stress
𝜏𝐿𝑚 Membrane part of longitudinal shear stress
𝜏𝐿𝑚,𝑚𝑎𝑥 Maximum membrane part of longitudinal shear stress occurring at weld end
𝜏𝑛 Nominal shear traction stress at 0° weld throat plane
𝜏𝑇 Transverse shear stress
𝜏𝑇𝑏 Bending part of transverse shear stress
𝜏𝑇𝑚 Membrane part of transverse shear stress
𝜏𝑇𝑚,𝑚𝑎𝑥 Maximum membrane part of transverse shear stress
𝜎𝑢,𝑏 Ultimate tensile strength of base plate material
𝜏𝑢,𝑏 Shear strength of base plate material
𝜏𝑢,𝑤 Weld shear strength determined from a test
𝜏𝑢,𝑤0 Weld shear strength determined from a longitudinal shear test (0° loading angle)
𝜏𝑢,𝑤𝑎 Weld shear strength determined from a shear test with loading angle 𝛼
𝜏𝑢,𝑤𝐿 Weld shear strength determined from longitudinally loaded fillet weld
𝜏𝑢,𝑤𝑇 Weld shear strength determined from transversely loaded fillet weld
𝜏% Normalized weld shear strength by averaged value from the same test group

xx
𝜙 Design safety factor

xxi
Abstract
Rampant welding-induced distortions in construction of modern lightweight shipboard
structures not only increase production cost, but also cause structural integrity concerns in service.
Numerous recent studies have shown that overwelding in complying with the existing empirical-
based fillet weld sizing criteria is the key contributor. Fillet-welded connections are widely used
in the construction of marine structures. However, due to the complex stress state in fillet-welded
connections and the lack of an effective means to relate the stress state at a joint to failure
conditions observed in standardized component tests, existing weld sizing criteria in Codes and
Standards used today were largely based on design experiences and observations from limited test
data, dating back to decades ago. Therefore, a more quantitative mechanics-based weld sizing
criterion must be developed for not only enabling the cost-effective construction of lightweight
ship structures, but also ensuring structural safety in service.
In this study, a traction stress based mesh-insensitive method is introduced for
characterizing the complex stress state and its relationship to weld failure conditions in fillet-
welded components. The insights gained enable the development of a closed-form solution for
relating weld throat shear stress state to remotely applied loading conditions, which in turn leads
to an effective traction stress based failure criterion serving as a mechanics basis for achieving
quantitative weld sizing.
To support and validate the analytical developments, a comprehensive testing program
using over 200 standard longitudinal and transverse shear joint specimens was carried out. The test

xxii
results have proven the effectiveness of the closed-form failure criterion in predicting both failure
angle and correlating joint strength test data. A careful observation of the test data obtained in this
study suggests that certain nonlinear effects such as plate-to-plate contact can be important in
certain type of test configurations. This leads to the development of a new analytical formulation
for incorporating the nonlinear effects to further generalize the effective traction stress based weld
sizing failure criterion for a broader range of structural applications.
To further validate the effectiveness of the developed quantitative weld sizing failure
criterion, a large number of well-known full-scale test data available from past and recent literature
on hollow structural section (HSS) joints have been analyzed in detail. The results show that the
correlations between the predicted failure loads with the proposed failure criterion and the
measured loads offer as much as 60% improvement over those predicted by the existing Codes
and Standards, confirming the validity of the proposed failure criterion resulted from this study.
Finally, within the context of these standard shear test specimens and full-scale HSS
connections, it can be shown that the quantitative weld sizing criterion proposed in this study can
result in a weld size reduction as much as 40%, compared with the existing empirical-based weld
sizing criteria used today, which can be very beneficial for welding-induced distortion control in
the construction of lightweight shipboard structures.

1
Chapter 1 Introduction
1.1 Research Background
1.1.1 Challenges in Construction of Lightweight Structures
Fillet welded connections are widely used in the construction of modern ship and civil
structures for connecting secondary structures to main structures and transmitting loads from one
member to another. Therefore, one of the most important design considerations for these structures
is to ensure that load-carrying fillet welds possess a strength equal to or higher than those of
connected members, as described in various existing weld sizing criteria, such as MIL-STD-1628
(Department of Defense, 1974) for ship structures and AISC 360 (AISC, 2010) for civil structures.
It is well known that the stress state at fillet-welded connections can be very complex and difficult
for quantitative determination, even using today’s finite element computational tools. This is
mainly because of stress or strain singularity (or sharp notch effects) at weld locations, i.e., at weld
toe and weld root (Dong et al., 2010a). In addition, the difference in flexibility or compliance
between the connected members can make the stress determination more difficult (Packer &
Cassidy, 1995). As a result of lacking an effective means of quantitatively determining the weld
stress state, existing weld sizing criteria in current Codes and Standards are empirical and tend to
be excessively conservative in nature, which often result in significantly oversizing of fillet welds
(Packer et al., 2016; Nie & Dong, 2012).
In the past, some level of overwelding was not a major concern when dealing with
traditional shipboard structures mostly made of relatively thick plates. Things are much different
in recent years as there is an increasing demand for structural lightweighting in marine structures.

2
Thin and high-strength plates have been more and more used in modern ship structures to improve
fuel economy and operational performance. For example, from 1990 to 2000s, the usage ratio of
thin steel (10 mm or less) to thick plate structures for naval vessels built at Northrop Grumman
Ship Systems (NGSS) has risen from less than 10% to over 90% (Huang et al., 2004; Huang et al.,
2007). In addition to thin steel, other materials with high strength-to-weight ratio, such as
aluminum alloys (Paik et al., 2006) and titanium alloys (Dong et al., 2013) are also being
considered for achieving effective lightweighting in marine structures to meet the tightened
lightweight requirements. However, due to the fact that thin plates possess less ability to resist
welding-induced residual stress, the use of oversized fillet welds in lightweight structures not only
increases unnecessary structural weight and construction cost, but also, more importantly,
introduces significant welding-induced distortions during construction, and incurs correction cost,
as shown in Figure 1.1. In fact, as the structural lightweight demands intensify over the last decade
or so, overwelding has been identified as the most significant contributor to widespread distortions
in ship and offshore constructions (Huang et al., 2014; Huang et al., 2016) and one of the major
obstacles to overcome to achieve the lightweighting goal.
Figure 1.1: Welding-induced distortion observed on a ship panel

3
1.1.2 Limitations in Traditional Weld Sizing Criteria
As discussed above, due to lack an effective means of quantitatively determining the
complex stress state in weld, existing traditional weld sizing criteria in current Codes and
Standards, such as MIT-STD-1628 (Department of Defense, 1974), ABS 96 (ABS, 2000), AWS
D1.1 (AWS, 2015), and other design specifications, such as Eurocode 3 (CEN, 2005), AISC 360
(AISC, 2010) and CSA S16 (CSA, 2014), have been empirical in nature since 1970s and they were
developed based on static shear strength testing of standard longitudinal and transverse shear
specimens, of which fillet welds are parallel (0°) and perpendicular (90°) to the remote loading
direction (𝑃) respectively, as depicted in AWS B4.0 (AWS, 2007) in Figure 1.2.
(a)
(b)
Figure 1.2: Standard fillet weld shear strength specimen: (a) longitudinal shear loaded; (b) transverse shear loaded
A nominal weld throat stress defined by Eq. (1.1), also referred to as an “engineering shear
stress” in DNV-RP-C203 (DNV, 2012), has been used as the mechanics basis in these weld sizing

4
criteria since 1950s (AWS B4.0, 2007) for determining fillet weld strengths from both standard
longitudinal and transverse shear specimens, i.e., 𝜏𝑢,𝑤𝐿 and 𝜏𝑢,𝑤𝑇 respectively.
𝜏𝑢,𝑤 =𝑃𝑢
𝑎45 × 𝐿 (1.1)
Figure 1.3: Theoretical weld throat 𝑎45 as failure plane for standard fillet welded shear testing specimens
As illustrated in Figure 1.3, the major assumptions in Eq. (1.1) are: (1) weld failure plane
is assumed along the shortest weld throat size 𝑎45, i.e., with a weld failure angle of 45°; (2) weld
throat stress distribution along weld length (Y-axis) is uniform. Although these assumptions make
Eq. (1.1) simple to use for processing test data, it has been shown to exhibit some serious
limitations in correlating test data as demonstrated by investigations both in the past and recent
years. Firstly, it has been well established that failure angle of transver shear specimens tends to
occur at an angle much smaller than 45°, but more close to 22.5°, as illustrated in Figure 1.4, for
various weldment made of mild steel (Kato & Morita, 1974; McClellan, 1990; Lu et al., 2015),
high strength steel (Björk et al., 2012; Khurshid et al., 2012), aluminum alloys (Krumpen & Jordan,
1984; Marsh, 1985 & 1988), as well as titanium alloys (Dong et al., 2013; Nie & Dong, 2012). It
should be noted that any effective stress definition used in a failure criterion should have the ability

5
to predict the correct failure path. Clearly, the engineering shear stress defined by Eq. (1.1) fails
in this regard. Secondly, under longitudinal shear loading conditions, although weld failure angle
of about 45° has been observed, weld throat stress distribution along weld length is far from being
uniform in this type of test specimens, unlike the conditions assumed in arriving at Eq. (1.1). The
test results from McClellan (1990) and Dong et al. (2013) showed that longitudinal shear
specimens tend to exhibit weld failure initiated at weld ends (near the machined slot locations in
Figure 1.2a). Finite element analysis (FEA) performed by Nie and Dong (2012), as well as by Lu
et al. (2015) also demonstrated that severe stress concentration at weld ends of longitudinal shear
specimens must be properly taken into account in analyzing the test data. As a result, it can be
concluded that Eq. (1.1) produces significant discrepancies in analyzing weld strengths from the
standard fillet-welded shear test specimens, resulting in a shear strength in longitudinal shear
specimens, which can be 30% to 80% lower than that in transverse shear specimens. Such
discrepancies in shear strength interpretation are illustrated in Figure 1.5 for the case with a fillet
weld size of 6 mm, conducted in this study.
Figure 1.4: Typical weld throat failure plane observed on transverse shear specimen

6
Figure 1.5: Shear strength discrepancy between longitudinal and transverse shear specimens by Eq. (1.1)
Due to its inability in reconciling the significant differences between the longitudinal and
transverse shear strengths, the weld sizing equation according to Eq. (1.1) has been used in practice
by factoring in a conservative margin based on experience to avoid weld failures in structural
connections. In doing so, the longitudinal shear strength 𝜏𝑢,𝑤𝐿 is typically used for sizing fillet
welds in various existing traditional criteria, as expressed by Eq. (1.2), often leading to
significantly oversized fillet welds, as pointed out by various researchers recently (Lu et al., 2015;
Nie & Dong, 2012).
𝑠
𝑇𝑏= 0.7071 ×
𝜎𝑢,𝑏𝜏𝑢,𝑤𝐿
(1.2)
1.2 Representative Research Efforts on Quantitative Weld Sizing
In pursuing an improved weld sizing criterion that can eliminate the excessive
conservatism in the existing empirical-based weld sizing criteria, numerous research efforts have

7
been carried out both experimentally and theoretically in the past and recent years. One of the
major findings was that load-carrying capacity of fillet weld is a function of loading angle, i.e.,
angle 𝛼 between the applied remote load 𝑃 and the weld direction, as shown in Figure 1.6. This is
consistent with the discrepancies in the shear strengths obtained from the longitudinal (𝛼 = 0°)
versus transverse (𝛼 = 90°) shear test specimens when Eq. (1.1) is used, as discussed in Sec. 1.1.
Figure 1.6: Fillet weld under remote load 𝑃 with loading angle 𝛼
1.2.1 Past Experimental Findings
The needs for resolving the discrepancies in shear strengths obtained from longitudinal and
transverse shear tests were discussed as early as 1930s, by Spraragen and Claussen (1942) in a
literature review of 423 fillet weld static tests conducted during 1932 to 1940. They found: (1) the
fracture loads obtained from standard longitudinal shear specimens were about 60% to 100% of
those obtained from standard transverse shear specimens; (2) shear strength data were more
scattered in transverse shear specimens. In 1959, Archer et al. (1959) performed a series of fillet

8
weld tests and reported that transverse-to-longitudinal shear strength ratior was 1.59 and the failure
angle of transverse shear specimens were far smaller than 45°. Similarly, Ligtenberg (1968) did a
statistical analysis over a large series of weldment tests (conducted by an international research
program) with tensile strength from 450 to 580 MPa and obtained a transverse-to-longitudinal
shear strength ratio of 1.59. In addition, Higgins and Preece (1968) conducted 168 tests to
determine fillet weld strength of standard longitudinal and transverse shear specimens and reported
that the transverse loaded fillet welds were about 1.41 to 1.54 times stronger than the longitudinal
loaded fillet welds. The test data published by IIW (1980) suggested that transverse-to-longitudinal
shear strength ratio was equal to 1.22 and the observed higher strength ratio in their testing efforts
was caused by the friction and supporting effects between the connected plates. McClellan (1990)
focused on testing 96 shear specimens with flux cored arc (FCAW) welding electrodes for both
mild and high strength steel and showed that transverse shear strength was about 1.3 to 1.5 times
stronger than longitudinal shear strength. More recent studies done by Nie and Dong (2012), as
well as by Lu et al. (2015) demonstraed almost doubled transverse shear strength compared to
longitudinal shear strength when Eq. (1.1) was used.
In addition, Butler and Kulak (1971 & 1972) conducted testing of 23 fillet-welded
specimens with loading angle 𝛼 varying from 0° to 90° (see Figure 1.6) and empirically
determined weld strength as a function of loading angle, showing a 44% load-carrying capacity
increase in transverse shear speciments compared over longitudinal shear specimens. Later,
Krumpen and Jordan (1984) utilized the findings from Butler and Kulak (1971 & 1972), i.e.,
transverse-to-longitudinal shear strength ratio of 1.44, and proposed a series of equations for
reducing fillet weld size. Their equations later have been adopted by AWS (AWS, 2007). A similar
experimental study by Miazga and Kennedy (1989), including 42 fillet-welded specimens loaded

9
from 0° to 90°, demonstrated a weld sizing effect that load-carrying capacity ratios between the
transverse and longitudinal shear specimens were 1.28 and 1.60 corresponding to 5 mm and 9 mm
weld sizes, respectively. In their study, Miazga and Kennedy (1989) also developed a simplified
semi-analytical solution based on the maximum shear stress theory with an empirical coefficient,
showing weld strength increased up to 50% when the loading angle increased from 0° to 90°.
1.2.2 Past Theoretical Developments
In the area of theoretical developments for supporting quantitative weld sizing, an in-depth
study done by Kato and Morita (1974) should be noted, in which they adopted a classical wedge
solution from theory of elasticity (Timoshenko, 1951). They derived an analytical solution,
yielding a weld throat failure angle of 22.5° for transverse shear specimens and a transverse-to-
longitudinal shear strength ratio of 1.46. Although the predicted failure angle seemed in an
agreement with their test retuls, there were some limitations in their study: (1) the shear strength
definition was based on a local stress definition, which is not suited for design engineer in practice;
(2) the maximum shear stress value used in their proposed failure criterion was not the actual
maximum but the minimum value along the 22.5° plane, as shown in Figure 1.7; (3) the inherent
assumption of uniform stress distribution along the edge of the wedge geometry is not consistent
with the stress distribution in fillet-welded specimens. Therefore, the effective stress definition
proposed by Kato and Morita has not attracted much attention in the literature since.

10
Figure 1.7: Classical wedge solution used by Kato and Morita (1974)
Furthermore, Kamtekar (1982 & 1987) developed a theoretical model using principal stress
approach and von Mises yield criterion and proposed load-carrying capacity of transverse loaded
fillet welds was 1.41 and 1.22 times that of longitudinal loaded fillet welds with and without
considering residual stress, respectively. However, the force systems in his study subjectively
added a vertical shear force (𝑃′) and a normal force (𝑃′) on the weld legs, and treated them equal
to the applied force 𝑃, as shown in Figure 1.8, leading to a weld failure angle of 0° or 90°, which
was clearly not consistent with the testing results documented in the literature discussed above.
Figure 1.8: Assumed force system in the study of Kamtekar (1982)

11
The loading angle dependency was also observed when limit state analysis theorems were
applied for analysis of failure load of a fillet weld. For example, using von Mises yield criterion
by assuming elastic perfectly plastic material behavior, Jensen (1988) developed lower and upper
bounds of load-carrying capacity of fillet weld in the state of yielding and their dependency to the
direction of loading. In addition, using static and kinematic theorems of limit analysis, Picón and
Cañas (2009) developed lower and upper bounds of failure load and rapture angle of fillet weld
with Tresca and von Mises criteria and found they were functions of loading angle.
Last but not least, using the results of De Bruyne (1944), Swannell (1967 & 1972)
developed an analytical solution showing that stress non-uniformly distributed along weld length
in longitudinal fillet-welded specimen with the highest stress concentration at both weld ends.
However, his analytical expression suggested that shear stress distribution was symmetircal with
regard to weld length, which is not consistent with the results of finite element analysis (FEA)
recently done by Nie and Dong (2012) and Lu et al. (2015).
1.2.3 “Directional Strength-Increase Factor”
Both the experimental and theoretical results described above on the load-carrying capacity
variation in the fillet welded components as a function of loading angles have led to the
development of a “directional strength-increase factor” (Kennedy et al., 1985), which was
empirically formulated in the form of Eq. (1.3) by Lesik and Kennedy (1988 & 1990). It has been
adopted by major design standards or specifications, such as AISC (AISC, 2010) and CSA (CSA,
2014). Note that 𝜏𝑢,𝑤0 in Eq. (1.3) is the same as the longitudinal shear strength 𝜏𝑢,𝑤𝐿 in Eq. (1.2).
𝜏𝑢,𝑤𝛼𝜏𝑢,𝑤0
= 1.00 + 0.50 sin1.5 𝛼 (1.3)

12
However, major limitations exist in this empirical approach when dealing with structural
applications. Firstly, it has been shown that the directional strength-increase factors determined
from Eq. (1.3) produce a significant scatter in interpreting the experimental test data available in
literature. For example, transverse-to-longitudinal shear strength ratio varied from 1.0 to 2.0
among different testing programs discussed in the previous section, which suggests that there
might be other factors at play, such as the weld size effects that were clearly present in the study
of Miazga and Kennedy (1989). Secondly, in the previous studies, the assumption of uniform weld
throat stress distribution along the weld direction was only appropriate for the standard simple
transverse shear specimens but not at all for the standard longitudinal shear specimens. As
demonstrated by Nie and Dong (2012) as well as by Lu et al. (2015), severe weld throat stress
concentration occurs at the ends of longitudinal weld and cannot be ignored for weld strength
determination. In addition, the stress distribution along a weld can be much more complex than
being uniform in the structural applications even if the fillet welds are only transversely loaded,
which will be investigated in the context of hollow structural section (HSS) connections.
Furthermore, a limit state approach by Lu and Dong (2020) demonstrated contact force between
the overlapped plates has a significant effect on the weld throat stress state, which had been ignored
or inadequately considered in the force systems from the previous theoretical models. Lastly, a
correct failure criterion used for weld strength determination should be consistent for fillet-welded
components regardless of loading angle, as discussed by Nie and Dong (2012) and Lu et al. (2015).
However, this was clearly not the case with the approach incorporating a directional strength-
increase factor, e.g., in the form of Eq. (1.3).
Based on the above discussions, it seems reasonable to state that an effective stress
definition used for both determining weld strength and developing weld failure criterion has not

13
resolved to date. Both the engineering shear stress (Eq. (1.1)) and the directional strength-increase
factor (Eq. (1.3)) lack of a rigorous mechanics underpinning for supporting the development of a
more generalized weld sizing criterion for lightweight ship structures.
1.3 Research Objectives
The main objective of this research is to establish quantitative weld sizing criteria that are
built upon sound structural mechanics principles through an in-depth understanding of weld throat
stress state and its relationship with joint configurations and loading conditions. As such, the
premise of this research is that the shear strength derived from a fillet-welded component should
serve as a joint strength property which should not be dependent upon test specimen configurations
and loading conditions. In doing so, a new effective stress parameter must be formulated through
an improved understanding of weld throat stress state and its effects on joint failure and validated
through comprehensive experimental testing at both simple joint specimen and large-scale
structural connection levels. To achieve this overarching goal, the following specific objectives
and associated research areas are planned:
• Establish a new effective stress formulation for characterizing weld throat stress
state in fillet-welded test specimens.
• Develop a new failure criterion based on the effective stress formulation so that a
unified fillet weld shear strength can be extracted consistently from standard test
specimens of welded conditions.
• Validate the effectiveness of the proposed failure criterion by conducting shear
strength tests using standard longitudinal and transverse shear specimens, covering
various combinations of plate thicknesses, base metal types, welding processes, and
filler metals.

14
• Further refine the failure criterion incorporating geometric nonlinear effects, which
may exist both in simple joint specimen testing and complex structural applications.
• Extend the findings obtained from small-scale joint specimens to large-scale
structural connections and prove the effectiveness by correlating the predicted and
actual failure loads of fillet-welded connections.
• Propose a quantitative fillet weld sizing criterion that can lead to a significant weld
size reduction from those determined using the traditional empirical-based weld
sizing criteria used today for supporting a cost-effective construction of lightweight
ship structures while ensuring structures’ safe operation.
1.4 Dissertation Structure
This dissertation is structured in a multi-manuscript format. After an integrated
introduction (Chapter 1), three manuscripts (two published and one submitted) are presented in
Chapters 2 through 4. Chapter 5 provides an integrated discussion, which is then followed by an
integrated conclusion in Chapter 6.
In Chapter 1, the needs in quantitative weld sizing criteria are presented, based on a detailed
critical assessment of the relevant publications in the literature. Representative experimental
investigations and theoretical developments, as well as numerical approaches are highlighted, with
an emphasis on their key findings and limitations. Then, the main research objectives are stated
along with an outline of the specific areas of investigation to be performed in this study.
In Chapter 2, a mesh-insensitive traction stress method is introduced to define an effective
stress for characterizing weld throat stress state in fillet weld. Both numerical calculation
procedure and closed-form analytical solution of the proposed effective stress are demonstrated in
detail. Then, a failure criterion is proposed for determination of fillet weld shear strength. The

15
effectiveness of the failure criterion is verified by carrying out a comprehensive static strength test
program using standard longitudinal and transverse shear specimens relevant to ship structure
applications.
In Chapter 3, a limit state based analytical formulation of weld throat stress model
incorporating nonlinear effects is presented for load-carrying fillet-welded connections. The
validity of the resulting analytical solution is verified by finite element computation incorporating
nonlinear material, nonlinear geometry, and nonlinear boundary condition effects. In addition, its
effectiveness in correlating shear strengths obtained from standard longitudinal and transverse
shear specimens has been proven through the re-analysis of over 100 shear tests performed earlier
by Lu et al. (2015).
In Chapter 4, to verify the generality of the proposed effective stress and failure criterion,
traction stress method is introduced to evaluate the strength of large-scale structural level fillet-
welded connections, i.e., HSS joints. The results are then generalized into a closed-form expression
with a clearly defined mechanics basis. This expression relates weld throat stress to fillet weld size
and remote load, with its dimensional geometric parameters being determined through a detailed
parametric finite element analysis (FEA). The effectiveness of the closed-form expression is
demonstrated by comparing the predicted failure loads with those measured from HSS test data
available from literature.
In Chapter 5, the generality of the results developed in Chapter 2 and 3 for weldment made
of mild and high strength steel are verified by correlating the test data of weldment made of
different materials, such as aluminum alloys and titanium alloys. As a result, in conjunction with
all the developments presented in Chapter 2, 3 and 4, a quantitative weld sizing criterion is
proposed for eliminating overwelding in the construction of lightweight ship structures. The

16
effectiveness of the weld sizing criterion is proven by providing significant weld size reduction
from those determined using traditional existing empirical-based weld sizing criteria for both
standard test lab specimens and actual structural applications. In the end, the weld penetration
effect is also integrated into the proposed weld sizing criterion for further weld size reduction.

17
Chapter 2 Strength Analysis of Fillet Welds under Longitudinal and Transverse Shear
Conditions
Abstract
In support of the development of improved fillet weld sizing criteria for lightweight ship
structures, a comprehensive static strength test program using longitudinal and transverse shear
specimens according to AWS B4.0 Standards has been conducted. This test program covers base
material with strength ranging from 71 ksi (490 MPa) to 96 ksi (660 MPa) and weld size ranging
from 1/8” (3 mm) to 3/8” (10 mm). This chapter focuses on a traction stress based analysis of the
test data as an effort to establish a unified shear strength definition for load-carrying fillet welded
specimens regardless of shear loading conditions. The proposed shear strength definition proves
to be effective in correlating fillet weld strength test data of the longitudinal and transverse shear
specimens. The results of this investigation demonstrate that existing shear strength definitions
used by various weld sizing criteria such as those given by Class Societies have two major
limitations: (1) it cannot be related to a critical stress state on experimentally observed failure plane
in transverse shear specimens; (2) it underestimates shear stress at failure due to severe stress
concentration at weld end in typical longitudinal shear specimens. These two limitations have been
shown to be the major cause for having two significantly different shear strength values: one is
transverse shear strength obtained from transverse shear specimens and the other is longitudinal
shear strength obtained from longitudinal shear specimens.

18
Keywords: load carrying fillet welds, shear strength, strength testing, traction stress
method, finite element analysis, failure criterion
2.1 Introduction
In ship and offshore structures, fillet welds are commonly used for transmitting loads from
one part to another. In fact, most structural connections in ship structures are fillet welded.
Therefore, one of the most important design considerations for ship and offshore structures is to
ensure that load-carrying fillet welds possess a strength equal to or higher than that of nearby base
plates, as described in US Navy’s weld sizing criteria, such as MIL-STD-1628 (Department of
Defense, 1974) and further refined by Krumpen (1984) for meeting weld sizing needs as high
strength steels and modern welding processes were being introduced. Today, there are numerous
fillet weld design guidance documents available, such as ABS 96 (ABS, 2000) for naval vessel
applications, Eurocode 3 (CEN, 2005) and IIW (IIW, 1976) for general structural applications, as
recently discussed by Picón and Cañas (2009) in which a limit analysis based strength evaluation
procedure was also presented in the context of elastic-plastic finite element analysis. However, the
basic assumptions in calculating fillet weld throat stress for strength characterization purpose
remain the same as those given in AWS B4.0 (AWS, 2007), i.e., by assuming a failure angle of
45° from base plate and a uniform throat stress distribution along weld line. Such assumptions
often lead to the use of much lower fillet weld strengths seen in longitudinal shear specimens than
those in transverse shear specimens for fillet weld sizing purpose in order to be conservative,
resulting in oversized welds. The use of oversized welds had been attributed, at least in part, to the
development of severe welding-induced distortions in lightweight shipboard structures during
construction of some naval surface combatants, as recently discussed by Huang et al (2014).
Therefore, there is a growing interest in developing an improved weld sizing method for both

19
satisfying weld strength requirements and eliminating overwelding for facilitating distortion
control during construction.
Almost all existing weld sizing criteria are based on either an averaged shear stress or
averaged stress resultant across fillet weld throat plane at 45° from base plate under given loading
conditions and compare it with fillet weld strengths obtained using standard longitudinal and
transverse shear specimens.
(a)
(b)
Figure 2.1: AWS standard shear strength test specimens: (a) longitudinal shear; (b) transverse shear
Commonly used standard longitudinal and transverse shear specimens in fillet weld
strength testing are typical of those stipulated in AWS B4.0 (AWS, 2007), as illustrated in Figure
2.1. The resulting shear strength is calculated by using the following formula given in AWS B4.0
(2007) for both the longitudinal and transverse shear specimens:

20
𝜏𝑢,𝑤 =𝑃𝑢
𝑎45 × 𝐿 (2.1)
In Eq. (2.1), 𝑃𝑢 represents the peak load prior to failure obtained from strength test, 𝐿 the
total load-carrying weld length, and 𝜏𝑢,𝑤 the resulting shear strength; in addition, as shown in
Figure 2.2, 𝑠 is the fillet weld leg size, and 𝑎45 is the shortest length across weld, i.e., 𝑎45 =
𝑠 × cos 𝜃 where 𝜃 = 45° is assumed in AWS B4.0 (AWS, 2007), also known as weld throat size.
Figure 2.2: Fillet weld leg and weld throat definition in AWS B4.0
Eq. (2.1) is used as a basis in developing various fillet weld sizing criteria, such as in MIL-
STD-1628 (Department of Defense, 1974), Krumpen (1984), and others (ABS, 2000; CEN, 2005).
Although it is simple to use for processing test data, Eq. (2.1) has been shown to exhibit some
serious limitations in correlating test data as demonstrated by investigations both in the past and
recent years. Firstly, it has been well established in literature that failure angle of transver shear
specimens tends to occur at about 22.5° rather than at 45° as assumed in Eq. (2.1); Secondly, shear
stress distribution along weld line direction in longitudinal shear specimens is far from being
uniform as assumed in Eq. (2.1). The former was repeatedly confirmed experimentally on
transverse shear specimens by various researchers for weldment made of mild steel (Kato &

21
Morita, 1974; McClellan, 1990), high strength steel (Björk et al., 2012; Khurshid et al., 2012),
aluminum alloys (Krumpen & Jordan, 1984; Marsh, 1985 & 1988), as well as titanium alloys
(Dong et al., 2013; Nie & Dong, 2012). The latter has recently been illustrated by using a finite
element based traction stress method by Nie and Dong (2012) in their re-evaluation of some
existing test data reported in literature. Their results showed that significant shear stress
concentration exists at weld ends (at the “machined slot” positions in longitudinal shear specimens
as shown in Figure 2.1a), which can be attributed to typically lower shear strengths in longitudinal
shear specimens compared with those in transverse shear specimens, as reported in the literature
(Nie & Dong, 2012). However, more test data are needed in order to both validate the findings
given by Nie and Dong and develop correction schemes for using Eq. (2.1) for fillet weld strength
determination.
In this chapter, we first outline the traction stress approach for shear strength analysis
proposed by Nie and Dong (2012) with a focus upon its specific implementation in analyzing
specimens of interest in this study. After demonstrating its finite element mesh-insensitivity, the
traction stress method is used to compute peak shear stresses on specimens under longitudinal and
transverse shear conditions involved in a companion strength test program as outlined in Huang et
al. (2014 & 2016). The analysis results are then presented in a form that can be used as a correction
coefficient to Eq. (2.1) for performing test data analyzing, depending upon if longitudinal or
transverse shear specimens are involved. After that, a large amount of shear strength test data
obtained as a part of this study is analyzed using the proposed correction scheme with respect to
Eq. (2.1). For comparison purpose, data interpretation using the conventional method represented
by Eq. (2.1) is also presented. To facilitate the data correlation process, some of the experimental
details such as fillet weld leg size measurement procedure are also discussed. Finally, the

22
implication of the analysis results from this study for achieving a quantitative weld sizing criterion
is discussed.
2.2 Weld Throat Stress Characterization
Encouraged by an earlier investigation by Nie and Dong (2012), this study further extends
the traction stress method for investigating its ability for correlating a large amount of fillet weld
shear strength test data recently completed in a companion experimental testing program outlined
by Huang et al. (2014 &2016). For completeness, a brief discussion is provided here on the relevant
elements of the traction stress method to the current investigation. For more detailed discussions
on traction stress method, readers can consult some recent publications, e.g., by Dong (2001) for
weld fatigue related applications and by Nie and Dong (2012) for shear strength correlations.
2.2.1 Traction Stress Method
Traction-based structural stress method and its basic concept for fatigue evaluation of
welded joints were first introduced by Dong (2001) and was then shown to enable the formulation
of a master S-N curve method given by Dong (2005), which since has been adopted by the 2007
ASME Div 2 Code (Dong et al., 2010). As demonstrated by Nie and Dong (2012), the traction
stress method has several advantages for applications in fillet weld shear strength evaluations:
(1) Traction stress method is a nodal force based method in which equilibrium conditions
are enforced in stress calculation process with respect to a hypothetical cut plane, resulting in good
mesh-insensitivity at stress concentration locations.
(2) In fatigue applications (Dong, 2001 & 2005), the method is implemented for extracting
through-thickness membrane and bending parts of three traction stress components. For static
shear strength analysis in a fillet-welded component, it is only the membrane parts of shear traction
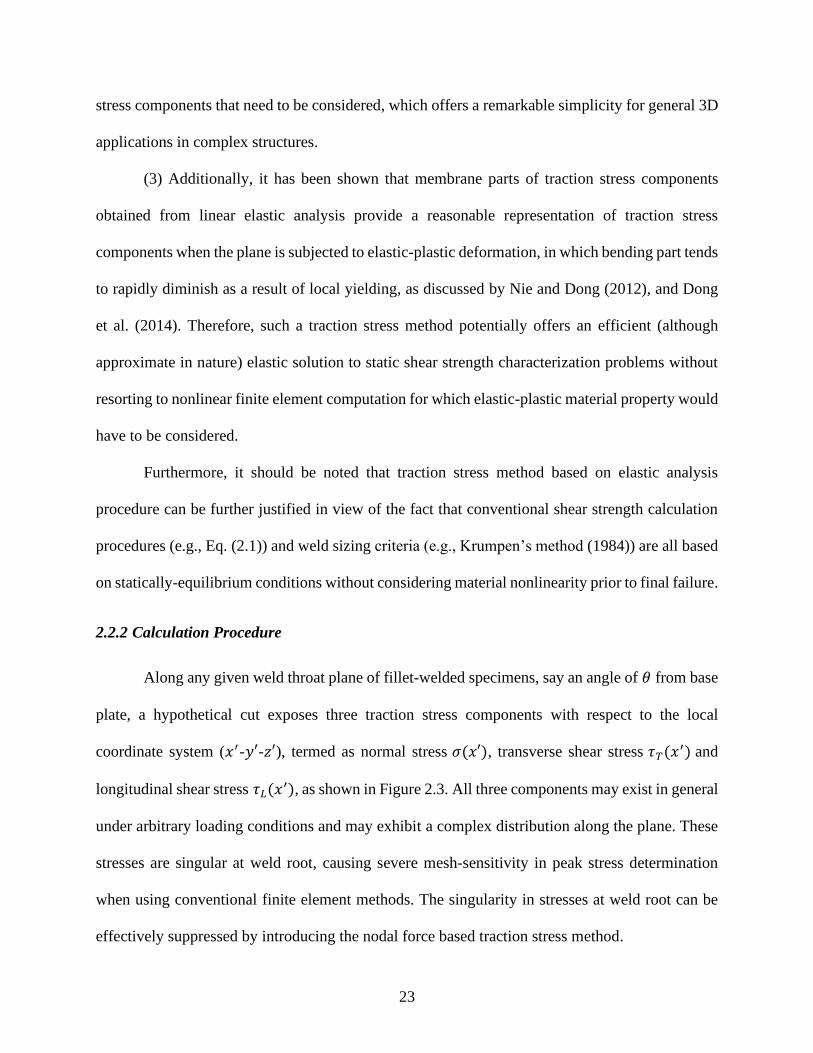
23
stress components that need to be considered, which offers a remarkable simplicity for general 3D
applications in complex structures.
(3) Additionally, it has been shown that membrane parts of traction stress components
obtained from linear elastic analysis provide a reasonable representation of traction stress
components when the plane is subjected to elastic-plastic deformation, in which bending part tends
to rapidly diminish as a result of local yielding, as discussed by Nie and Dong (2012), and Dong
et al. (2014). Therefore, such a traction stress method potentially offers an efficient (although
approximate in nature) elastic solution to static shear strength characterization problems without
resorting to nonlinear finite element computation for which elastic-plastic material property would
have to be considered.
Furthermore, it should be noted that traction stress method based on elastic analysis
procedure can be further justified in view of the fact that conventional shear strength calculation
procedures (e.g., Eq. (2.1)) and weld sizing criteria (e.g., Krumpen’s method (1984)) are all based
on statically-equilibrium conditions without considering material nonlinearity prior to final failure.
2.2.2 Calculation Procedure
Along any given weld throat plane of fillet-welded specimens, say an angle of 𝜃 from base
plate, a hypothetical cut exposes three traction stress components with respect to the local
coordinate system (𝑥′-𝑦′-𝑧′), termed as normal stress 𝜎(𝑥′), transverse shear stress 𝜏𝑇(𝑥′) and
longitudinal shear stress 𝜏𝐿(𝑥′), as shown in Figure 2.3. All three components may exist in general
under arbitrary loading conditions and may exhibit a complex distribution along the plane. These
stresses are singular at weld root, causing severe mesh-sensitivity in peak stress determination
when using conventional finite element methods. The singularity in stresses at weld root can be
effectively suppressed by introducing the nodal force based traction stress method.

24
Figure 2.3: Traction stress components acting on a weld throat plane at an angle of 𝜃
Figure 2.4: Linear representation and decomposition of weld throat traction stress components
With this traction stress method, the linear forms of the three traction stress components
(𝜎(𝑥′), 𝜏𝑇(𝑥′), 𝜏𝐿(𝑥
′)) with respect to the local coordinate system (i.e., (𝑥′-𝑦′-𝑧′) in Figure 2.3)
can be decomposed, in a statically equivalent manner, into their membrane and bending parts as
seen in Figure 2.4 and expressed in terms of line forces and line moments with respect to the mid-
distance of the weld throat cut cross-section A-A along 𝑎𝜃:
𝜎 = 𝜎𝑚 + 𝜎𝑏 =𝑓𝑧′
𝑎𝜃+6𝑚𝑦′
𝑎𝜃2
𝜏𝐿 = 𝜏𝐿𝑚 + 𝜏𝐿𝑏 =𝑓𝑦′
𝑎𝜃+6𝑚𝑧′
𝑎𝜃2
𝜏𝑇 = 𝜏𝑇𝑚 =𝑓𝑥′
𝑎𝜃
(2.2)

25
Where 𝑎𝜃 is weld throat dimension at an angle of 𝜃 from base plate and 𝑓𝑥′, 𝑓𝑦′, 𝑓𝑧′ and
𝑚𝑦′, 𝑚𝑧′ are line forces and line moments with respect to the local coordinate system. Note that
the transverse shear traction stress in Eq. (2.2) is represented by its membrane component,
consistent with transverse shear stress definition in plate and shell theory, in which transverse shear
stress exhibits a parabolic distribution through plate thickness direction.
The line forces/moments in Eq. (2.2) can be related to nodal forces/moments that are
available from finite element calculations after being rotated into the same local coordinate system
(𝑥′-𝑦′-𝑧′) through a system of simultaneous equations, as expressed by Eq. (2.3) (Dong, 2005). For
example, with the hypothetical cut “A-A” along the weld line (i.e., along 𝑦 axis) as shown in
Figure 2.3, line forces in 𝑧’ direction (normal to cut plane) can be directly obtained by solving the
following system of simultaneous linear equations (Dong, 2005 & 2010):
{
𝐹1𝐹2𝐹3⋮
𝐹𝑛−1𝐹𝑛 }
𝑧′
=
[ 𝑙13
𝑙16
0 0 ⋯ 0
𝑙16
(𝑙1 + 𝑙2)
3
𝑙26
0 ⋯ 0
0𝑙26
(𝑙2 + 𝑙3)
3
𝑙36
0 0
0 0 ⋱ ⋱ ⋱ 0
⋮ ⋱ ⋱ ⋱(𝑙𝑛−2 + 𝑙𝑛−1)
3
𝑙𝑛−16
0 ⋯ ⋯ 0𝑙𝑛−16
𝑙𝑛−13 ]
{
𝑓1𝑓2𝑓3⋮
𝑓𝑛−1𝑓𝑛 }
𝑧′
(2.3)
In the above equation, 𝑛 is the total number of the nodes (𝑛 − 1 is the total number of the
element edges if linear elements are considered) defining the weld line in 𝑦 direction in Figure 2.3.
In Eq. (2.3), 𝐹1, 𝐹2, …, 𝐹𝑛 represent nodal forces at Node 1, 2, …, 𝑛 on the weld line for each node
with respect to the 𝑧′ direction after being rotated from the global coordinate system (𝑥-𝑦-𝑧) into
the local coordinate system (𝑥′-𝑦′-𝑧′), as shown in Figure 2.5.

26
Figure 2.5: Global coordinate system versus local coordinate system
This transformation process is illustrated by Eq. (2.4), where 𝐹𝑥 , 𝐹𝑧 , 𝑀𝑥 , 𝑀𝑧 are nodal
forces and nodal moments with respect to the global coordinate system. By inverting Eq. (2.3),
line forces 𝑓1, 𝑓2, …, 𝑓𝑛 can be calculated for insertion into Eq. (2.2) so that membrane part of
normal traction stress component can be calculated at each position along weld line. In the same
manner, submitting nodal moments (𝑀1, 𝑀2, …, 𝑀𝑛) with respect to 𝑦′ axis into Eq. (2.3), the
corresponding line moments (𝑚1, 𝑚2, …, 𝑚𝑛) can be calculated for insertion into Eq. (2.2) for
computing bending part of normal traction stress component.
𝐹𝑥′ = 𝐹𝑥 cos 𝜃𝑥𝑥′ + 𝐹𝑧 cos 𝜃𝑧𝑥′
𝐹𝑧′ = 𝐹𝑥 cos 𝜃𝑥𝑧′ + 𝐹𝑧 cos 𝜃𝑧𝑧′
𝑀𝑥′ = 𝑀𝑥 cos 𝜃𝑥𝑥′ +𝑀𝑧 cos 𝜃𝑧𝑥′
𝑀𝑧′ = 𝑀𝑥 cos 𝜃𝑥𝑧′ +𝑀𝑧 cos 𝜃𝑧𝑧′
(2.4)
The calculation procedure above is directly applicable if plate and shell element models
are used since relevant nodal forces and nodal moments are directly available from finite element
calculations. When using three dimensional (3D) solid element models such as those used in this
study, the following pre-processing procedure is needed to transform nodal forces at nodes situated
on the cross-section cut A-A into equivalent nodal forces and nodal moments acting on its mid-
section (i.e., at half of distance 𝑎𝜃 from weld root), as shown in Figure 2.6:

27
Figure 2.6: Transformation of nodal forces on a weld throat cut plane in 3D solid element model into statically
equivalent forces and moments with respect to weld throat mid-section along weld line
2.2.3 Analysis of Test Specimens
After examining various effective strength failure criteria, Nie and Dong (2012) have
shown that an effective stress expressed in terms of membrane parts of shear traction stress
components (Figure 2.3 & Figure 2.4) can be used for characterizing shear strength of fillet-welded
specimens under either longitudinal or transverse shear loading conditions. In this study, an
effective shear stress definition postulated for specimens of interest under general loading
conditions can be expressed as:
𝜏𝑒 = √𝜏𝐿𝑚2 + 𝜏𝑇𝑚
2 (2.5)
Note that Eq. (2.5) makes use of stress resultant definition in terms of membrane parts of
the two orthogonal shear traction stress components on a hypothetical cut plane. For shear strength
characterization of the specimens in Figure 2.1, the critical values of 𝜏𝐿𝑚 and 𝜏𝑇𝑚 are to be
calculated at ultimate failure load obtained from shear strength test. If there is only one shear stress
component dominating (either longitudinal or transverse shear stress), Eq. (2.5) reduces to the one
proposed by Nie and Dong (2012). In what follows, both the specific procedure for calculating the
effective shear stress given in Eq. (2.5) and calculation results of the shear specimens tested in this
study are presented.

28
2.2.3.1 Longitudinal Shear Specimen
For longitudinal shear specimens, as shown in Figure 2.1a, only the membrane part of the
longitudinal shear stress needs to be considered since the transverse shear stress proves to be
negligible. Therefore, according to Eq. (2.5), the effective shear stress definition simply becomes:
𝜏𝑒 = 𝜏𝐿𝑚 (2.6)
For calculating the longitudinal shear stress distribution along a weld throat plane, 3D solid
finite element model like the one shown in Figure 2.7 is used. Based on the specimen geometry
given in AWS B4.0 (2007) (also shown in Figure 2.1a), three symmetry planes are considered,
resulting in a one-eighth of the longitudinal shear specimen being modeled. Both the symmetry
conditions and applied load (force 𝑃 representing a uniform stress acting on the base plate end
cross section) are illustrated in Figure 2.7. Parabolic solid elements (“C3D20R”: 20 node solid
element with reduced integration scheme in ABAQUS (Dassault Systemes, 2018)) are used and
linear elastic behavior is assumed. By following the procedure of the traction stress method
described in Sec. 2.2.2, weld throat membrane shear stress along the weld line (local 𝑦′ direction
in Figure 2.8) can be calculated.

29
Figure 2.7: A representative 3D solid finite element model used for longitudinal shear specimens (1" = 25.4 mm)
Figure 2.8: Three cut planes through weld for calculating longitudinal shear stress along weld line
The calculated longitudinal shear stress distributions (normalized by 𝑃/(𝑎 × 𝐿) )
corresponding to the three cut planes (see Figure 2.8) along weld line are plotted in Figure 2.9.
The following can be observed:

30
(1) Longitudinal shear stress along 45° cut plane has the maximum stress value along the
entire weld line, comparing with planes at 0° and 90°, confirming that the weld throat plane at 45°
is the weakest plane. This agrees with both the experimental findings of this study (to be discussed
in the next section) and what was demonstrated by Nie and Dong (2012).
(2) Unlike stress in transverse shear specimens, longitudinal shear stress is non-uniformly
distributed along the 45° weld throat cut plane and its largest value occurs at the weld end near the
machined slot (indicated in Figure 2.1a). At this position (see Figure 2.9), the maximum
normalized shear stress value is about 1.2, indicating that shear stress value is 20% higher than
that calculated by the conventional shear stress equation (Eq. (2.1)) where no stress concentration
effect is considered. It is important to note that an averaged shear stress of unity at the 45° cut
plane can be identified in Figure 2.9, which is the basic assumption of Eq. (2.1).
Figure 2.9: Normalized longitudinal shear stress distribution on three cut planes along weld line
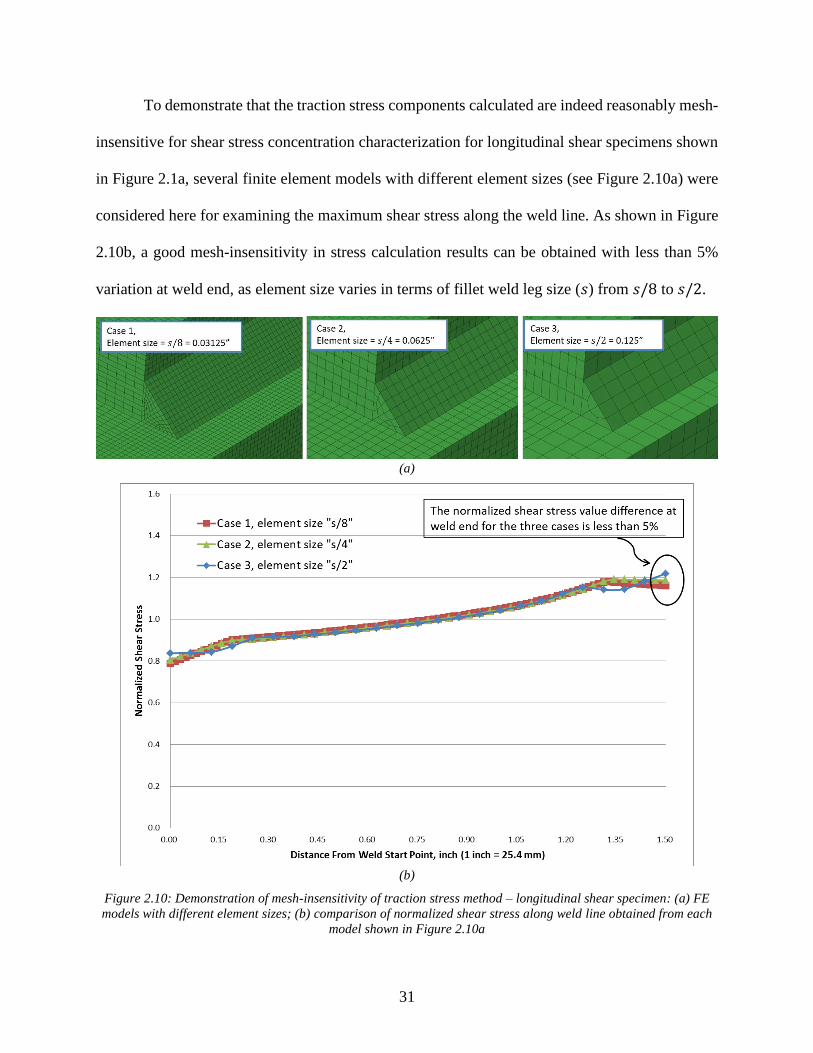
31
To demonstrate that the traction stress components calculated are indeed reasonably mesh-
insensitive for shear stress concentration characterization for longitudinal shear specimens shown
in Figure 2.1a, several finite element models with different element sizes (see Figure 2.10a) were
considered here for examining the maximum shear stress along the weld line. As shown in Figure
2.10b, a good mesh-insensitivity in stress calculation results can be obtained with less than 5%
variation at weld end, as element size varies in terms of fillet weld leg size (𝑠) from 𝑠/8 to 𝑠/2.
(a)
(b)
Figure 2.10: Demonstration of mesh-insensitivity of traction stress method – longitudinal shear specimen: (a) FE
models with different element sizes; (b) comparison of normalized shear stress along weld line obtained from each
model shown in Figure 2.10a

32
With the confirmation of its good mesh-insensitivity, the traction stress method is then used
to determine stress concentration factor (SCF), defined as the peak longitudinal shear stress at weld
end normalized by 𝑃/(𝑎 × 𝐿) given in Eq. (2.1), for longitudinal shear specimen configurations
tested in the experimental study. The final SCF results are presented in Figure 2.11 as a function
of normalized fillet weld leg size (𝑠/𝑇1) for two base plate thicknesses (𝑇1 = 12 mm and 25 mm)
considered in this study. It can be seen that SCF decreases as relative weld leg size (𝑠/𝑇1) increases
and SCF results also show a strong dependency on base plate thickness (𝑇1), which cannot be taken
into account in traditional shear stress calculation procedure, such as Eq. (2.1) given in AWS B4.0.

33
Figure 2.11: SCF for longitudinal shear specimens as a function of relative fillet weld leg size (𝑠 𝑇1⁄ )
With the SCF results in Figure 2.11, the maximum longitudinal shear stress occurring at
weld end corresponding to failure load, i.e., peak load measured during a test, can be expressed as:
𝜏𝐿𝑚,max = 𝜏𝑢,𝑤𝐿 = 𝑆𝐶𝐹 × (𝑃𝑢
𝑎45 × 𝐿) (2.7)

34
in which the term within the parenthesis represents the AWS shear strength determination
formula given in Eq. (2.1). Note that Eq. (2.7) assumes that elastically calculated maximum
membrane stress concentration factor (SCF) continues to serve as a characteristic stress scaling
parameter in nonlinear regime leading up to final failure. This assumption will be validated in
Section 2.4 when test data are analyzed. Since all SCF values in Figure 2.11 are larger than unity,
the traction stress based shear strength (𝜏𝑢,𝑤𝐿) is larger than that determined by AWS formula,
suggesting that the shear stress definition given in Eq. (2.1) of AWS B4.0 (2007) underestimates
actual shear stress acting on the weld throat plane for longitudinal shear specimens, e.g., by as
much as 60% if a base plate thickness 𝑇1 of 0.5” (12 mm) is considered.
2.2.3.2 Transverse Shear Specimen
Transverse shear specimen can be analyzed in the same manner as demonstrated in the
previous section of longitudinal shear specimen. Due to the two-dimensional nature of stress state
involved (see Figure 2.1b), 2D cross-section model under plane strain conditions (element type:
“CPE8R” in ABAQUS (Dassault Systemes, 2018)) are used in this study for simplicity. From Eq.
(2.5), the corresponding effective shear stress simply becomes:
𝜏𝑒 = 𝜏𝑇𝑚 (2.8)

35
Figure 2.12: A representative plane-strain finite element model for transverse shear specimen
A representative plane-strain finite element model with quarter symmetry conditions is
shown in Figure 2.12. Similar to the calculations performed for longitudinal shear specimen, a
theoretical failure plane is postulated as the plane on which transverse shear traction stress reaches
its maximum value among all planes searched. A total of five planes (from angle of 0° to 90°
shown in Figure 2.12) are searched by calculating traction stresses on all cut planes. The FE-based
traction stress results are shown as symbols in Figure 2.13. It is important to note that the maximum
transverse shear stress occurs at 22.5° cut plane in Figure 2.13, rather than at 45°, as assumed in
traditional shear stress calculation method as described by Eq. (2.1).

36
Figure 2.13: Comparison of analytical and finite element results for transverse shear stress and normal stress as a
function of cut angle 𝜃
To facilitate the interpretation of the FE results in Figure 2.13, it should be useful to
introduce the closed-form analytical solution developed by Nie and Dong (2012) for transverse
shear specimen by considering a problem definition shown in Figure 2.14. For fillet weld with
equal leg size (𝑠), weld throat dimension 𝑎𝜃 with any given angle 𝜃 can be obtained as:
𝑎𝜃 =𝑠
sin 𝜃 + cos 𝜃 (2.9)

37
Figure 2.14: Free-body diagram for transverse shear specimen with equal weld leg size 𝑠
Then, the membrane parts of normal stress (𝜎𝑚) and transverse shear stress (𝜏𝑇𝑚) on the
cut plane become:
𝜏𝑇𝑚(𝜃) =𝑃 × cos 𝜃
𝑎𝜃 × 𝐿= (
√2(sin 2𝜃 + cos 2𝜃 + 1)
4) × (
𝑃
𝑎45 × 𝐿) (2.10)
𝜎𝑚(𝜃) =𝑃 × sin 𝜃
𝑎𝜃 × 𝐿= (
√2(sin 2𝜃 − cos 2𝜃 + 1)
4) × (
𝑃
𝑎45 × 𝐿) (2.11)
The analytical results given in Eqs. (2.10) and (2.11) are also plotted in Figure 2.13 as lines.
The results from both analytical and finite element solutions coincide exactly with each other,
proving the validity of the finite element traction stress method used in this study. This is as
expected since both FE based traction stress method and the analytical solution deal with the same
stress definitions, and both satisfy equilibrium conditions. Additionally, Figure 2.13 clearly
indicates that transverse shear stress (𝜏𝑇𝑚) reaches its maximum value at exactly 𝜃 = 22.5°. This
is consistent with the experimental observations discussed both in an earlier publication
(McClellan, 1990) and recent experimental investigation (Huang et al., 2014) in which typical
failure plane was consistently found at about 22.5° in transverse shear specimens.

38
The exact angle of plane that yields the maximum transverse shear stress can be readily
demonstrated by equating the first derivative of Eq. (2.10) with respect to angle 𝜃 to zero, i.e.,
(cos 2𝜃 − sin 2𝜃
√2) × (
𝑃
𝑎45 × 𝐿) = 0 (2.12)
which leads to 𝜃 = 𝜋/8 (or 22.5°) exactly. This maximum transverse shear traction stress
at angle of 𝜃 = 𝜋/8 can now be expressed in terms of the shear stress definition in AWS B4.0 (i.e.,
Eq. (2.1)) by substituting 𝜃 = 𝜋/8 into Eq. (2.10), yielding:
𝜏𝑇𝑚,max = 𝜏𝑢,𝑤𝑇 = (2 + √2
4) × (
𝑃𝑢𝑎45 × 𝐿
) (2.13)
Eq. (2.13) can be used to calculate the traction stress based shear strength (𝜏𝑢,𝑤𝑇 ) for
transverse shear specimens if failure load 𝑃𝑢 is known from transverse shear specimen testing.
Note that the term (2 + √2)/4 in Eq. (2.13) becomes a multiplier of about 0.854 against the
conventional shear stress definition in Eq. (2.1) for conversion to the present traction stress based
shear strength definition, suggesting an overestimation of about 15% in shear strength for
transverse shear specimens if the conventional AWS B4.0 (AWS, 2007) procedure is used.
Furthermore, it is worth noting that the conventional shear strength definition given in Eq.
(2.1) can be recovered as the maximum value of stress resultant by taking advantage of the closed-
form analytical solutions given by Eqs. (2.10) and (2.11) at 𝜃 = 45°, i.e.,
𝜎𝑅,𝜃=45° = √(𝜎𝑚,𝜃=45°)2+ (𝜏𝑇𝑚,𝜃=45°)
2=
𝑃
𝑎 × 𝐿 (2.14)
as shown in Figure 2.13 (dotted line at the top). As demonstrated both in literature
(McClellan, 1990; Björk et al., 2012; Dong et al., 2013) and the next section, a failure angle of
about 22.5° has been consistently observed in test data from transverse shear specimens. As a

39
result, the stress resultant based shear stress definition in Eq. (2.14) (also Eq. (2.1)) is inadequate
for characterizing shear strength in this type of specimens.
With the above developments, Eq. (2.7) along with the SCF results in Figure 2.11 for
longitudinal shear specimens and Eq. (2.13) for transverse shear specimens can now be directly
used for analyzing fillet weld shear strength test data from standard specimens, such as those
performed in this study, as discussed in the next section.
2.3 Testing Procedure
Both longitudinal and transverse shear specimens in this study were designed according to
AWS B4.0 (AWS, 2007). Major ship hull steel grades with matching filler materials and associated
welding processes were considered. Nominal or design fillet weld leg size varied from 1/8” (3 mm)
to 3/8” (10 mm). A summary of test specimens used in this study is given in Table 2.1. Further
details of the test specimens and justifications can be found in Huang et al. (2014 & 2016).
Table 2.1: Shear specimens tested in this study
Representative longitudinal and transverse shear specimens prior to strength test are shown
in Figure 2.15 for illustration purpose. Fillet weld leg size was measured using a laser scan device

40
(known as Wiki-Scan1) before test, as illustrated in Figure 2.16, which provides a consistent
determination of fillet weld leg size. In addition, weld leg size was also measured by a digital
caliper after test by examining fracture surfaces and failure paths, referred here as post-fracture
measurement. These laser and post-fracture measurements are used to facilitate shear strength test
data correlations in addition to the use of nominal weld leg sizes. Furthermore, both types of weld
leg size measurements are also used to establish typical variation in weld size in shop floor practice.
As found during the strength test, actual measured weld sizes can be as much as 30% to 50%
different from the nominal weld sizes specified by design, which would have significant effects
on shear strength characterization in view of Eq. (2.7) and Eq. (2.13). Therefore, to better fillet
weld shear strength, all strength calculation results reported from this point on in this study are
based on post-fracture measurements rather than the nominal ones. Note that these post-fracture
weld size measurements take into account of weld penetration status. Detailed fillet weld leg size
and weld quality effects on shear strength characterization will be discussed in a separate
publication due to the space limitation here.
(a)
1 Wiki-ScanTM: Welding Inspection System, a product of SERVO ROBOT INC.

41
(b)
Figure 2.15: Shear strength test specimens prior to testing: (a) longitudinal shear; (b) transverse shear
Figure 2.16: Laser scan device for weld profile and weld size determination
All specimens were tested using MTS 200-kip machine. Load and crosshead displacement
curves were documented for identifying peak load at failure, i.e., 𝑃𝑢 . Representative load-
displacement curves for the two types of shear specimens are shown in Figure 2.17, in which peak
load 𝑃𝑢 at failure for each specimen is also indicated. In addition, fracture surfaces after strength
test were carefully examined, such as failure angles and any anomalies involved. As shown in
Figure 2.18, failure angles are indeed consistent with the traction stress based shear strength

42
analysis results discussed in the previous sections, i.e., at 45° in longitudinal shear specimens
(Figure 2.9) and at 22.5° in transverse shear specimens (Figure 2.13).
(a)
(b)
Figure 2.17: Typical load-displacement curves: (a) longitudinal shear (b) transverse shear
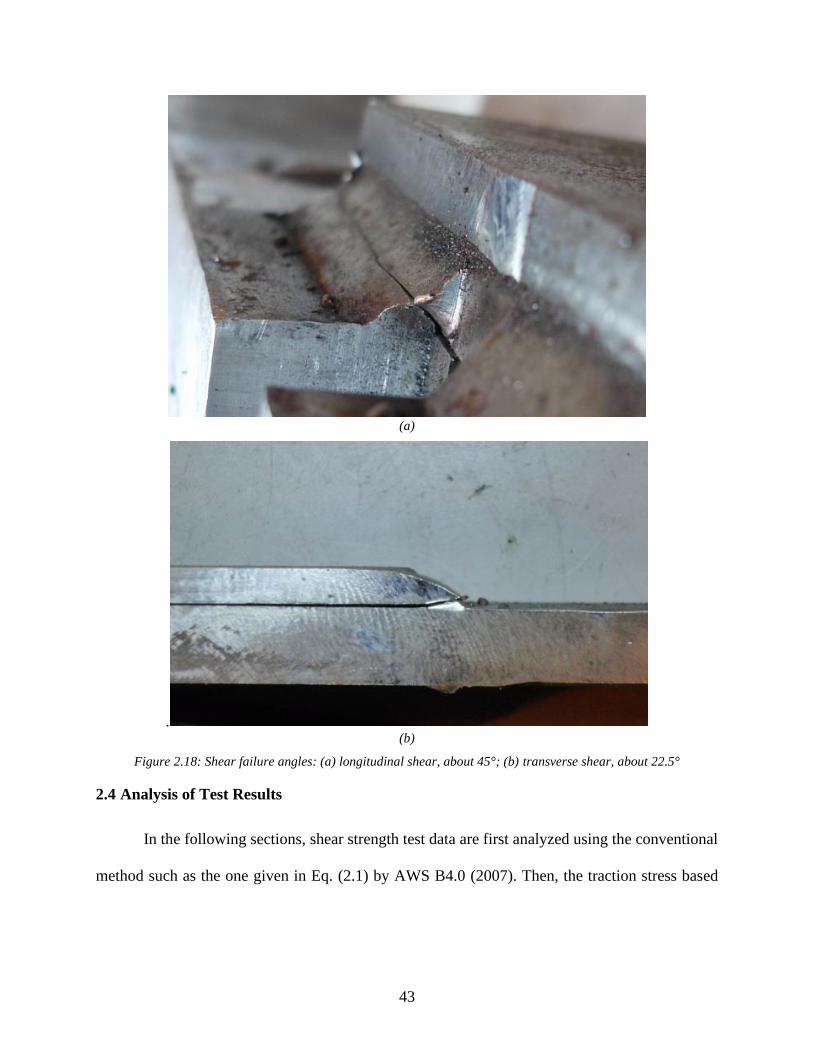
43
(a)
. (b)
Figure 2.18: Shear failure angles: (a) longitudinal shear, about 45°; (b) transverse shear, about 22.5°
2.4 Analysis of Test Results
In the following sections, shear strength test data are first analyzed using the conventional
method such as the one given in Eq. (2.1) by AWS B4.0 (2007). Then, the traction stress based

44
shear strength characterization method (Eq. (2.7) & Eq. (2.13)) are used to correlate the test data
collected from both longitudinal and transverse shear specimens conducted in this study.
2.4.1 Using Conventional Method
Consistent with the general trend observed by Nie and Dong (2012), Figure 2.19 clearly
shows that shear strengths from longitudinal shear specimens are significantly lower than those
from transverse shear specimens in each of the three test groups when Eq. (2.1) is used. Figure
2.19a shows the results from specimens made of DH36 steel welded with FCAW process, 71T1-
C weld wire, and a nominal weld leg size of 3/16” (5 mm); while Figure 2.19b shows the results
from specimens made of HSLA80 steel welded with FCAW process, 101T-C weld wire, and a
nominal weld leg size of 1/4” (6 mm); Figure 2.19c summarizes test results from specimens made
of HSLA80 steel welded with GMAW process, MIL-100S weld wire, and a nominal weld leg size
of 3/8” (10 mm). In all cases shown in Figure 2.19, the averaged discrepancy in shear strengths
between longitudinal and transverse shear specimens is as large as about 44 ksi (303 MPa) for
DH36 (FCAW) specimens with a nominal weld leg size of 3/16” (5 mm), about 44 ksi (303 MPa)
for HSLA80 (FCAW) with a nominal weld leg size of 1/4” (6 mm), and 33 ksi (228 MPa) for
HSLA80 (GMAW) with a nominal weld leg size of 3/8” (10 mm), respectively. A similar trend is
consistently observed for other test groups in Table 2.1 and will be demonstrated in Appendix A.
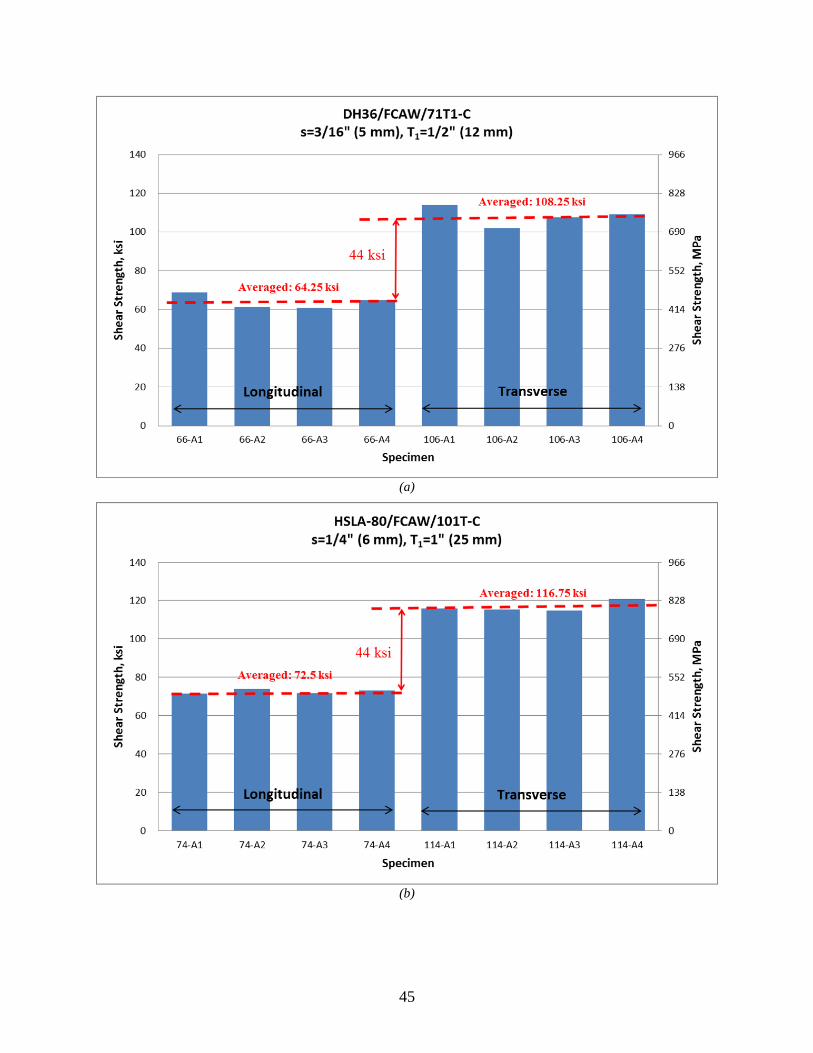
45
(a)
(b)
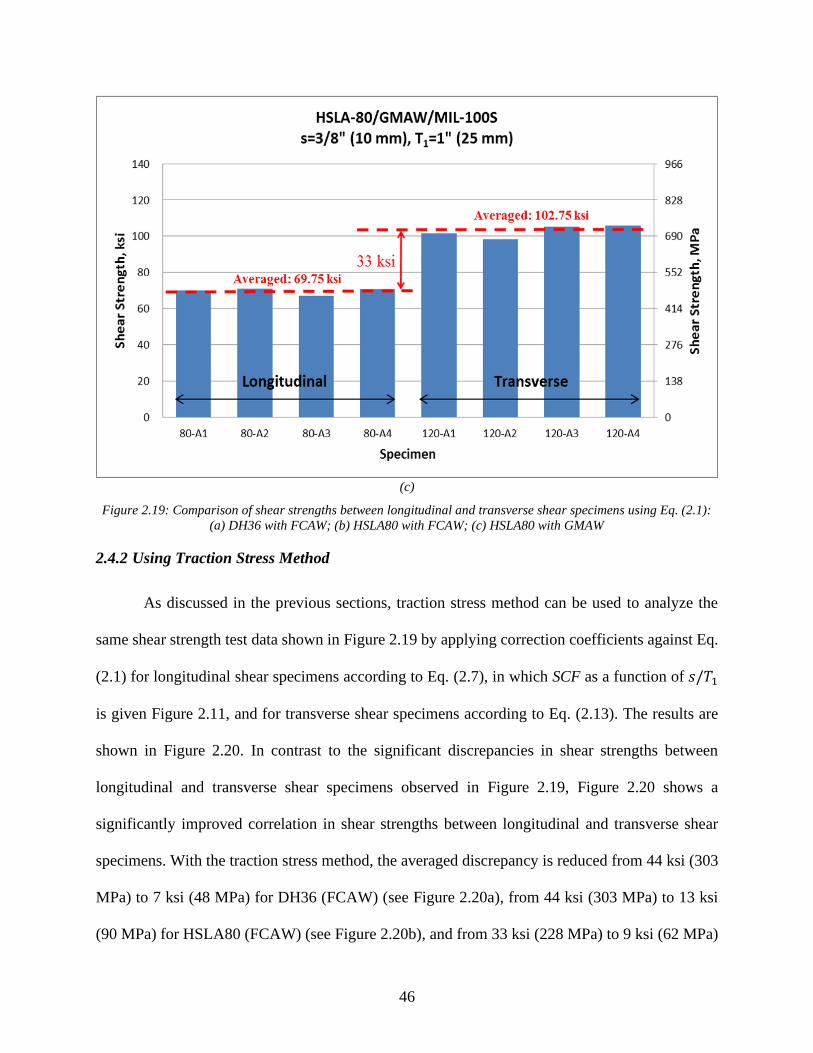
46
(c)
Figure 2.19: Comparison of shear strengths between longitudinal and transverse shear specimens using Eq. (2.1):
(a) DH36 with FCAW; (b) HSLA80 with FCAW; (c) HSLA80 with GMAW
2.4.2 Using Traction Stress Method
As discussed in the previous sections, traction stress method can be used to analyze the
same shear strength test data shown in Figure 2.19 by applying correction coefficients against Eq.
(2.1) for longitudinal shear specimens according to Eq. (2.7), in which SCF as a function of 𝑠/𝑇1
is given Figure 2.11, and for transverse shear specimens according to Eq. (2.13). The results are
shown in Figure 2.20. In contrast to the significant discrepancies in shear strengths between
longitudinal and transverse shear specimens observed in Figure 2.19, Figure 2.20 shows a
significantly improved correlation in shear strengths between longitudinal and transverse shear
specimens. With the traction stress method, the averaged discrepancy is reduced from 44 ksi (303
MPa) to 7 ksi (48 MPa) for DH36 (FCAW) (see Figure 2.20a), from 44 ksi (303 MPa) to 13 ksi
(90 MPa) for HSLA80 (FCAW) (see Figure 2.20b), and from 33 ksi (228 MPa) to 9 ksi (62 MPa)

47
for HSLA80 (GMAW) (see Figure 2.20c). A similar trend is also observed for the rest of test
groups listed in Table 2.1 and will be presented in Appendix B.
It is important to note that shear strength of fillet-welded specimens should not be
dependent upon shear loading conditions or specimen types. In this regard, the general agreement
between shear strengths tested using longitudinal and transverse shear specimens clearly shows
the effectiveness of the traction stress method in extracting a unified shear strength regardless of
loading conditions or specimen types. Note that there still exist some noticeable differences
between the two testing type specimens in Figure 2.20, in which longitudinal shear specimens tend
to give a lower averaged shear strength than that from transverse shear specimens. This may be
attributed to the non-uniformity in shear stress distribution along weld line in longitudinal shear
specimens, which can introduce localized damage initially at weld end leading to final shear failure.
This is an area of further study in the near future.
(a)

48
(b)
(c)
Figure 2.20: Comparison of shear strengths between longitudinal and transverse shear specimens using traction
stress method: (a) DH36 with FCAW; (b) HSLA80 with FCAW; (c) HSLA80 with GMAW

49
2.5 Conclusions
After carrying out a comprehensive static strength test program on standard longitudinal
and transverse shear specimens relevant to shipboard structure applications, a traction stress based
shear strength definition has been proven effective for correlating shear strength test data. The
following major conclusions can be drawn:
1. Weld strengths of standard longitudinal and transverse shear specimens, such as those
stipulated in AWS B4.0, can be reliably determined by calculating the critical
membrane shear stress at failure on critical weld throat plane. The critical weld throat
failure plane for longitudinal shear specimens is at 45° (𝜋/4) from base plate while for
transverse shear specimens at 22.5° (𝜋/8), as determined by the traction stress method
presented and validated by the large amount of tests performed in this study.
2. Conventional shear stress formula (Eq. (2.1)), shown as a form of stress resultant
definition in this chapter, has two major limitations: (1) incorrectly predicting the
failure plane at 45° in transverse shear specimens; (2) incapable of capturing shear
stress concentration (Figure 2.9) near weld end in longitudinal shear specimens. These
limitations have been shown to have contributed to the presence of two types of shear
strengths (one from transverse shear specimen testing and the other from longitudinal
shear specimen testing), of which one allowable shear strength value must be chosen
for fillet weld sizing purpose.
3. With the traction stress based shear strength definition, both the maximum shear stress
plane (i.e., failure plane) and shear stress concentration at weld end can be correctly
captured, resulting in a unified shear strength definition regardless of shear loading
conditions or specimen types. A correction scheme has been proposed with respect to

50
the conventional shear stress formula (Eq. (2.1)) for analyzing test data collected from
standard longitudinal and transverse shear specimens, such as those given in AWS B4.0
as shown in Figure 2.1. Furthermore, since both longitudinal and transverse shear
specimens yield approximately the same shear strength value with the proposed traction
stress method, the use of transverse shear specimens is highly recommended for
determining in-situ fillet weld shear strength. Therefore, the analytical equation given
in Eq. (2.10) can be conveniently used in practice for achieving a quantitative fillet
weld sizing in design for lightweight ship structures.
Acknowledgments
The publication is made possible by the financial support by the National Research
Foundation of Korea (NRF) Gant funded by the Korea government (MEST) through GCRC-SOP
at University of Michigan under Project 2-1: Reliability and Strength Assessment of Core Parts
and Material System. The authors are grateful to the encouragement and oversight by Project PI
Professor M. H. Kim during the preparation of this report.

51
Chapter 3 An Analytical Shear Strength Model for Load-Carrying Fillet-Welded
Connections Incorporating Nonlinear Effects
Abstract
In this chapter, an analytical formulation of weld throat stress model is presented for
defining limit state condition of fillet-welded connections incorporating plate-to-plate contact
conditions. The validity of the resulting analytical solution is verified by finite element
computation incorporating nonlinear material and nonlinear geometry effects. In addition, its
effectiveness in correlating shear strengths obtained from transverse and longitudinal shear
specimens has been demonstrated through the re-analysis of over 100 shear tests performed by the
same authors as an early part of the same study. As a result, a unified fillet weld shear strength can
be demonstrated regardless of test specimen configurations and shear loading conditions, while
conventional shear strength equation is incapable of reconciling the differences in shear strengths
between those obtained from transverse and longitudinal shear specimens. Furthermore, the
present developments provide a basis for achieving a quantitative fillet weld sizing criterion for
design and construction of fillet-welded structures under complex loading conditions, for which a
unified shear strength and robust weld throat stress calculation procedure are prerequisites.
Keywords: fillet welds, shear strength, weld sizing, traction stress method, finite element
method, contact force, limit state, stress concentration, weld throat stress

52
3.1 Introduction
Existing fillet weld sizing criteria for design and construction of fillet-welded structures
have been empirical, e.g. the MIL-STD-1628 (Department of Defense, 1974), AISC 360 (AISC
2010), Eurocode 3 (CEN 2005), and others (AWS 2015 & CSA 2014). Due to their inherent
conservatisms built in, these weld sizing criteria often lead to oversized welds, which tend to cause
significant distortions in modern lightweight structures (Huang et al., 2004 & 2007). The empirical
nature of these weld sizing criteria can be attributed to the fact that weld throat stress determination
is difficult due to stress/strain singularity at weld root. As a result, a nominal weld throat shear
stress definition, often referred to as an “engineering shear stress” in DNV-RP-C203 (DNV, 2012),
is widely adopted for calculating weld shear strengths from standard fillet weld specimen tests (see
Figure 3.1), e.g. by AWS B4.0 (AWS, 2007), as shown in Eq. (3.1) below:
𝜏𝑢,𝑤 =𝑃𝑢
𝑎45 × 𝐿 (3.1)
Figure 3.1: Fillet-welded specimen under transverse shear loading condition

53
As shown analytically by Nie and Dong (2012), even under simple transverse shear
conditions shown in Figure 3.1, the critical weld throat plane on which shear stress attains its
maximum is in fact not at 45° (or 𝜋 4⁄ ) as assumed in Eq. (3.1), but at 22.5° (or 𝜋 8⁄ ) instead. The
analytical solution was also further confirmed by their mesh-insensitive traction structural stress
results (Nie & Dong, 2012), which were formulated based on a working-equivalent argument in
terms of nodal forces available from finite element (FE) analysis results. The mesh-insensitive
method can be used for more general loading conditions and complex connection geometries, e.g.
standard longitudinal shear specimens stipulated by AWS B4.0 (AWS, 2007), in which shear stress
tends to exhibit stress concentration at weld ends in addition to stress singularity at weld root and
weld toe locations. Furthermore, the predicted failure angle of 22.5° is, to a large extent, consistent
with the experimental observations by numerous researchers decades ago, such as Butler and
Kulak (1971), Kato and Morita (1974), Kennedy et al. (1985), and by the same authors of this
study more recently (Lu et al., 2015) for structural steel, as illustrated in Figure 3.2. It is worth
noting that a recent study (Yang et al., 2019) regarding to stainless steel fillet weld has also showed
a much smaller failure angle than 45° in transverse shear specimens.

54
Figure 3.2: Typical weld throat failure plane observed on transverse shear specimens, noticeably smaller than 45°
as assumed in Eq. (3.1)
By considering a large amount of test results from a comprehensive experimental testing
program, Lu et al. (2015) have demonstrated that an improved correlation of fillet weld shear
strengths between transverse and longitudinal shear specimens can be achieved when the traction
stress method was used, as shown in Figure 3.3. In contrast, the conventional shear stress definition
in Eq. (3.1) results in significant discrepancies in fillet weld shear strengths. In fact, the inability
of Eq. (3.1) in correlating shear strength test data between transverse and longitudinal shear
specimens has been long established, as discussed by numerous previous studies (Miazga &
Kennedy, 1989; Kamtekar, 1982; Kato & Morita, 1974) for structural steel. Most recently, a 1.5
transverse-to-longitudinal weld shear strength ratio has been found by Yang et al. (2019) for
stainless steel weldments when Eq. (3.1) was used. Two major factors can be attributed to the
improved shear strength correlations when using the traction stress method: one is the use of the
correct weld throat plane of 22.5° on which maximum shear stress is calculated for transverse
shear specimens; the other is a consistent determination of the maximum shear stress at weld end
in longitudinal shear specimens by means of the mesh-insensitive traction stress method.

55
(a)
(b)
Figure 3.3: Shear strength correlations between transverse and longitudinal shear specimens: traditional method
Eq. (3.1) versus traction stress method: (a) DH36, FCAW, and 71T1-C weld wire; (b) HSLA80, FCAW, and 101T-C
weld wire
However, some of the test data (Lu et al., 2015) still exhibit some noticeable discrepancies
in weld shear strengths between transverse and longitudinal shear specimens, as shown on the left-
hand side of Figure 3.3, which warrants further investigation. Upon a further examination of
measurement data of over 100 tests (Lu et al., 2015) conducted as a part of the same study, one
possible reason may be attributed to the fact that actual weld throat failure planes measured in
transverse shear specimens are consistently lower than 22.5° which was analytically determined
by Nie and Dong (2012) under statically determinate conditions, as shown in Figure 3.4. The
reduced weld throat failure angles seen from the tests (see Figure 3.4) could be attributed to the

56
presence of plate-to-plate contact in these transverse shear specimens, although some earlier
studies such as those (Nie & Dong, 2012; Lu et al., 2015) have stated such contact effects should
be negligible. However, a more recent study in load-carrying cruciform fillet-welded by Xing et
al. (2016) showed that the presence of any resultant force in 𝑧 axis (see Figure 3.1) would cause a
reduction in critical weld throat plane angle in fatigue.
Another aspect that requires further investigation is if material nonlinearity has effects on
the maximum shear stress development on the critical weld throat plane. In the aforementioned
investigations, it was assumed that shear stress distribution should attain essentially a uniform state
along critical weld throat plane, when a peak load capacity is reached. This assumption stems from
the hypothesis that any local plastic deformation caused by stress concentration at weld root tend
to reduce stress gradient to such an extent that an approximately uniform shear stress distribution
along the critical weld throat plane can be assumed when failure load is reached, as demonstrated
in an elastic-plastic structural stress analysis of a tubular joint by Dong and Hong (2004), and in
weld low-cycle fatigue evaluations by a structural strain method by Pei et al. (2019 & 2020).
Figure 3.4: Failure angles measured in transverse shear specimens after fracture

57
With above considerations in mind, this chapter starts with an analytical fillet weld throat
stress model construct by incorporating a contact-induced resultant force. As a result, it is found
that the presence of such a resultant force significantly reduces the critical weld throat plane angle.
Then, a limit state based approach is introduced for determining critical contact ratio expressed as
a ratio of resultant contact force over remotely applied force. With this critical contact ratio, critical
weld throat plane angle can be determined, along which the maximum shear stress can be related
to peak load measured in shear specimen tests for determining shear strength of fillet welds.
Nonlinear finite element analyses (FEA) incorporating both plate-to-plate contact and material
nonlinearity are also presented for validating the findings from the analytical fillet weld throat
stress model. Finally, shear strength test data obtained from a large number of transverse and
longitudinal fillet-welded specimens as a part of the same study (Lu et al., 2015) are re-evaluated
by using the refined weld throat stress model incorporating contact effects. The results show that
a significantly improved correlation in shear strengths can now be achieved between transverse
and longitudinal shear specimens, implying that unified shear strength exists regardless of test
specimen configurations or shear loading conditions.
3.2 Analytical Weld Throat Stress Model
3.2.1 Shear Failure Criterion
As previously discussed by Nie and Dong (2012), Lu et al. (2015) and Xing et al. (2016),
a hypothetical cut along any weld throat plane of a fillet weld, say at an angle of 𝜃 from base plate,
exposes three traction stress components with respect to the local coordinate system (𝑥′-𝑦′-𝑧′) as
illustrated in Figure 3.5. These traction stresses are referred to as normal stress 𝜎(𝑥′), transverse
shear stress 𝜏𝑇(𝑥′), and longitudinal shear stress 𝜏𝐿(𝑥′), respectively.

58
Figure 3.5: Traction stress components acting on a weld throat plane at an angle of 𝜃: (a) Fillet weld between base
and attachment plate; (b) Traction stress definition on weld throat plane at angle 𝜃
By following the nodal force based traction stress method (Dong et al, 2010a), the three
weld throat traction stresses can be presented in a statically equivalent linear forms, each of which
consists its membrane and bending parts with respect to the mid-distance of the weld throat cut
cross-section A-A along 𝑎𝜃, as shown in Figure 3.6. The linear forms of the three traction stress
components are expressed by Eq. (3.2):
𝜎 = 𝜎𝑚 + 𝜎𝑏
𝜏𝐿 = 𝜏𝐿𝑚 + 𝜏𝐿𝑏
𝜏𝑇 = 𝜏𝑇𝑚
(3.2)
Detailed derivations on how to calculate the membrane and bending parts of the weld throat
traction stresses in a mesh-insensitive manner can be found in Chapter 2, Nie and Dong (2012), as
well as Lu et al. (2015), which will not be repeated here. The use of the three traction stress
components for multiaxial fatigue evaluation can be found by Dong and Hong (2006), Wei and
Dong (2010), as well as Dong et al. (2010b) under proportional loading conditions, and by Mei
and Dong (2017a & 2017b) for arbitrary non-proportional loading conditions.

59
Figure 3.6: Linear representation and decomposition of weld throat traction stress components
For static shear strength analysis of load-carrying fillet welds, only membrane shear
traction stresses need to be considered (Nie & Dong, 2012; Lu et al., 2015). Then, as previously
discussed by Lu et al. (2015), the maximum resultant membrane shear traction stress can be used
as a shear failure criterion for fillet welds under combined transverse and longitudinal shear
loading conditions (see Figure 3.7), i.e.,
𝜏𝑒,𝑚𝑎𝑥 = Max {√𝜏𝐿𝑚(𝜃)2 + 𝜏𝑇𝑚(𝜃)2} ≤ 𝜏𝑢,𝑤 (3.3)
Figure 3.7: Illustration of combined loading on a load-carrying fillet weld

60
Both components in Eq. (3.3) can be computed by means of the mesh-insensitive traction
stress method for a given structural component using a system of simultaneous equations given in
Chapter 2 (also in Nie & Dong, 2012; Lu et al., 2015). When dealing with simple lab test specimens
such as those discussed in the preceding section for which applied transverse and longitudinal
forces (𝑃𝑇 and 𝑃𝐿) are directly available from shear specimen testing, 𝜏𝑇𝑚(𝜃) and 𝜏𝐿𝑚(𝜃) can be
analytically expressed as:
𝜏𝑇𝑚(𝜃) =𝑃𝑇 × cos 𝜃 × (cos 𝜃 + sin 𝜃)
𝑠 × 𝐿
𝜏𝐿𝑚(𝜃) =𝑃𝐿 × (cos 𝜃 + sin 𝜃)
𝑠 × 𝐿
(3.4)
Then, 𝜏𝑒,𝑚𝑎𝑥 under combined loading conditions can be written as:
𝜏𝑒,𝑚𝑎𝑥 =𝑃
𝑠 × 𝐿× (cos 𝜃𝑚𝑎𝑥 + sin 𝜃𝑚𝑎𝑥) × √(sin 𝛼 × cos 𝜃𝑚𝑎𝑥)2 + (cos𝛼)2 (3.5)
where 𝛼 = tan−1(𝑃𝑇 𝑃𝐿⁄ ) as shown in Figure 3.7. Then the critical weld throat plane angle
𝜃𝑚𝑎𝑥 on which 𝜏𝑒,𝑚𝑎𝑥 attains its maximum can be calculated by setting the first derivative of Eq.
(3.5) with respect to 𝜃 to 0, i.e.,
(cos 𝜃𝑚𝑎𝑥 − sin 𝜃𝑚𝑎𝑥) × √(sin 𝛼 × cos 𝜃𝑚𝑎𝑥)2 + (cos 𝛼)2
= (cos 𝜃𝑚𝑎𝑥 + sin 𝜃𝑚𝑎𝑥) ×sin 𝛼2 × cos 𝜃𝑚𝑎𝑥 × sin 𝜃𝑚𝑎𝑥
√(sin𝛼 × cos 𝜃𝑚𝑎𝑥)2 + (cos𝛼)2
(3.6)

61
Figure 3.8: Critical weld throat failure plane angle 𝜃𝑚𝑎𝑥 as a function of loading angle 𝛼: analytical versus
experimental results
As shown in Eq. (3.6), critical weld throat plane angle 𝜃𝑚𝑎𝑥 is now a function of loading
angle 𝛼 . For example, under pure longitudinal shear condition (i.e., 𝛼 = 0), 𝜏𝑒,𝑚𝑎𝑥 occurs at
𝜃𝑚𝑎𝑥 = 𝜋 4⁄ ; and under pure transverse shear condition (i.e., 𝛼 = 𝜋 2⁄ ), 𝜏𝑒,𝑚𝑎𝑥 occurs at 𝜃𝑚𝑎𝑥 =
𝜋 8⁄ without considering any contact effects. As 𝛼 varies from 0 to 𝜋 2⁄ , the curve of 𝜃𝑚𝑎𝑥
analytically satisfying Eq. (3.6) is shown in Figure 3.8 as a dash line, which seems to provide a
reasonable upper bound estimate of failure angles observed in experiments (Miazga, & Kennedy,
1989) (shown as symbols). A further improvement in formulating Eq. (3.6) will be discussed in
the next section.
3.2.2 Treatment of Plate-to-Plate Contact
Based on findings from past investigations (Kato & Morita, 1974; IIW, 1980; Picón &
Cañas, 2009), including those using the traction stress method (Nie & Dong, 2012; Lu et al., 2015),

62
any potential plate-to-plate contact is more likely to occur in transverse shear specimens than in
longitudinal shear specimens. This can be attributed to the fact that shear deformation mechanism
involved in transverse shear specimens is different from that in longitudinal shear specimens. In
the former, any plastic slip along weld throat plane would result in a movement which has a
directional component potentially leading to plate-to-plate contact, while in the latter there exists
no such a component. This indeed has been confirmed by finite element analysis performed as a
part of this study. Therefore, only transverse shear conditions are considered hereafter.
Figure 3.9: Analytical weld throat model incorporating resultant contact force 𝐶
Consider a loading system shown Figure 3.9, in which 𝑃 and 𝐶 represent remotely applied
load and resultant contact force generated from plate-to-plate contact in transverse shear
specimens, respectively. Then a closed-form solution of 𝜏𝑇𝑚(𝜃) acting on a weld throat plane at
any angle 𝜃 can be expressed be Eq. (3.7):
𝜏𝑇𝑚(𝜃) =𝑃 × cos 𝜃 − 𝐶 × sin 𝜃
𝑎𝜃 × 𝐿=(𝑃 × cos 𝜃 − 𝐶 × sin 𝜃) × (cos 𝜃 + sin 𝜃)
𝑠 × 𝐿 (3.7)
where the first derivative with respect to 𝜃 gives the maximum shear plane angle 𝜃𝑚𝑎𝑥 as
𝜃𝑚𝑎𝑥 =1
2× tan−1 (
1 − 𝐾
1 + 𝐾) , 𝐾 =
𝐶
𝑃 (3.8)

63
Eq. (3.8) indicates that 𝜃𝑚𝑎𝑥 is a function of contact ratio 𝐾, which is not known at this
stage. It should be noted that if setting 𝐶 = 0 as a special case, Eq. (3.7) becomes:
𝜏𝑇𝑚(𝜃) =𝑃 × cos 𝜃
𝑎𝜃 × 𝐿= (
√2(sin 2𝜃 + cos 2𝜃 + 1)
4) × (
𝑃
𝑎45 × 𝐿) (3.9)
leading to 𝜃𝑚𝑎𝑥 = 𝜋 8⁄ or 22.5°, as expected when plate-to-plate contact force 𝐶 is not
considered (Nie & Dong, 2012; Lu et al., 2015).
The relationship between 𝜃𝑚𝑎𝑥 and 𝐾 is plotted in Figure 3.10. It can be seen that 𝜃𝑚𝑎𝑥
decreases monotonically to 0 as 𝐾 reaches unity. This suggests that any presence of plate-to-plate
contact in a transverse shear specimen reduces 𝜃𝑚𝑎𝑥 to a value less than 22.5°. For instance, at a
contact ratio 𝐾 of 0.4, the maximum shear stress plane occurs at about 12°, resulting in about 12%
reduction in maximum shear stress, as shown in Figure 3.10. Note that the ordinate on the right in
Figure 3.10 represents the ratio of the maximum weld throat shear stresses between with and
without considering contact ratio 𝐾 described by Eq. (3.7) and Eq. (3.9), respectively.
Figure 3.10: Effect of contact ratio on critical weld throat plane angle and maximum shear stress reduction

64
Furthermore, Figure 3.10 implies that a limit load definition corresponding to large plastic
deformation effects, i.e., local necking along a fillet weld throat plane, could only occur when
𝜃𝑚𝑎𝑥 reaches to 0 (i.e., contact ratio 𝐾 monotonically increases from 0 to 1), which contradicts the
experimental findings as shown in Figure 3.4. Indeed, finite element analysis incorporating
nonlinear geometry and nonlinear material property effects performed in this study is only able to
produce a well-defined limit load through weld necking mechanism when 𝜃𝑚𝑎𝑥 = 0, not relevant
for interpreting the experimental data involved in this study. This also means that maximum shear
stress reaches its strength limit long before weld necking develops at 𝜃𝑚𝑎𝑥 = 0 due to the presence
of the contact force 𝐶. As a result, an analytical approach for defining limit state for incorporating
the resultant contact force 𝐶 will be examined next.
3.2.3 Limit State Definition
As is well known, a simple smooth bar specimen subjected to a remote tension load 𝑃
develops maximum normal stress (or UTS) as 𝑃 reaches to its maximum, i.e., ∆𝑃 = 0, at which
point cross-section necking begins. Within the context of shear dominated deformation process, it
can be postulated that a load-carrying fillet-welded specimen subjected to transverse shear loading
conditions develops maximum shear stress (i.e., at shear strength) along critical weld throat plane
(𝜃𝑚𝑎𝑥) when resultant shear force reaches to maximum, i.e., ∆𝑆 = 0 on the same plane, at which
point a shear force limit state is realized.
Considering a simple case with 𝐶 = 0 in Figure 3.9, shear force 𝑆(𝜃) on any weld throat
plane at angle 𝜃 can be simply expressed as
𝑆(𝜃) = 𝑃 × cos 𝜃 (3.10)

65
The corresponding critical weld throat plane angle is shown to be a constant value 22.5° or
𝜋 8⁄ , as derived in Section 3.2.2, leading to shear force increment ∆𝑆 expressed as
∆𝑆 (𝜋
8) = ∆𝑃 × cos
𝜋
8 (3.11)
Therefore, the corresponding limit state in terms of shear force 𝑆, defined as ∆𝑆 = 0 also
occurs at 22.5° weld throat plane on which ∆𝑃 = 0 is also satisfied.
For the case of fillet weld with contact force (𝐶 ≠ 0 in Figure 3.9), shear force 𝑆 and shear
force increment ∆𝑆 on any weld throat plane at angle 𝜃 can be expressed as:
𝑆(𝜃) = 𝑃 × cos 𝜃 − 𝐶 × sin 𝜃 (3.12)
∆𝑆(𝜃) = ∆𝑃 × cos 𝜃 − ∆𝐶 × sin 𝜃 − 𝑃 × sin 𝜃 × ∆𝜃 − 𝐶 × cos 𝜃 × ∆𝜃 (3.13)
Because the limit state in shear force is defined as ∆𝑆 = 0 on the maximum shear stress
plane, Eq. (3.13) can be re-written as:
∆𝑆(𝜃) = ∆𝑃 × cos (1
2× tan−1 (
1 − 𝐾
1 + 𝐾)) − ∆𝐶 × sin (
1
2× tan−1 (
1 − 𝐾
1 + 𝐾))
−𝑃 × sin (1
2× tan−1 (
1 − 𝐾
1 + 𝐾)) × (
−(𝑃 × ∆𝐶 − 𝐶 × ∆𝑃)
(2𝐾2 + 2) × 𝑃2)
−𝐶 × cos (1
2× tan−1 (
1 − 𝐾
1 + 𝐾)) × (
−(𝑃 ∗ ∆𝐶 − 𝐶 ∗ ∆𝑃)
(2𝐾2 + 2) × 𝑃2)
(3.14)
by substituting 𝜃 with the maximum shear stress angle 𝜃𝑚𝑎𝑥 (Eq. (3.8)) and ∆𝜃 with
∆𝜃𝑚𝑎𝑥 which can be expressed as, according to Eq. (3.8):
∆𝜃𝑚𝑎𝑥 =−∆𝐾
2𝐾2 + 2 (3.15)
∆𝐾 =𝑃 × ∆𝐶 − 𝐶 × ∆𝑃
𝑃2 (3.16)
66
In seeking the limit state conditions corresponding to both ∆𝑆 = 0 and ∆𝑃 = 0, Eq. (3.14)
becomes:
∆𝐶 × {− sin (1
2× tan−1 (
1 − 𝐾
1 + 𝐾)) + sin (
1
2× tan−1 (
1 − 𝐾
1 + 𝐾)) × (
1
2𝐾2 + 2)
+ cos (1
2× tan−1 (
1 − 𝐾
1 + 𝐾)) × (
𝐾
2𝐾2 + 2)} = 0
(3.17)
Note that ∆𝐶 = 0 is a trivial solution to Eq. (3.17). The non-trivial solution to Eq. (3.17)
can be obtained by setting the term within “{}” being 0, i.e.,
−sin (1
2× tan−1 (
1 − 𝐾
1 + 𝐾)) + sin (
1
2× tan−1 (
1 − 𝐾
1 + 𝐾)) × (
1
2𝐾2 + 2)
+cos (1
2× tan−1 (
1 − 𝐾
1 + 𝐾)) × (
𝐾
2𝐾2 + 2) = 0
(3.18)
It can be shown that 𝐾 ≈ 0.3 is the solution to Eq. (3.18), which leads to a weld throat
failure plane angle 𝜃𝑚𝑎𝑥 = 14°, according to Eq. (3.8). It is important to note that a critical weld
throat plane angle of 14° estimated here is in a reasonable agreement with the measurements of
weld throat failure angle from test specimens, as shown in Figure 3.4. As presented in a later
section, shear strengths calculated using such a 𝐾 value lead to an improved agreement between
transverse and longitudinal shear specimens.
3.3 Nonlinear Finite Element Analysis
Nonlinear finite element analyses reported here were performed for two purposes: (1) to
verify the early assumption made in Eq. (3.3) that as plastic deformation becomes increasingly
dominant, 𝜏𝑚 + 𝜏𝑏 on the critical weld throat plane (i.e., 𝜃 = 𝜃𝑚𝑎𝑥) approaches to 𝜏𝑚, i.e., 𝜏𝑏 →
0, as assumed in some recent studies (Nie & Dong, 2012; Lu et al., 2015; Pei et al., 2019); (2) to
verify the analytical limit state formulation presented in the previous section, particularly the
validity of the maximum shear stress plane angle as a function of 𝐾, as shown in Figure 3.10.

67
3.3.1 FE Model Details
A representative FE model for transverse shear specimen depicted in Figure 3.1 is shown
in Figure 3.11a by taking advantage of the quarter symmetry conditions in the transverse shear
specimens with displacement control at one end. Refined elements (with element size in order of
0.008 𝑡) were used for representing the fillet weld and its surrounding area, as shown in the zoomed
view. Second order plane strain elements with reduced integration, i.e., CPE8R, have been used
since the weld is relatively long compared to its leg size that out-of-plane normal and shear strains
are considered to be zero. The same model was used to examine nonlinear deformation behaviors
with and without plate-to-plate contact including nonlinear geometry effects through ABAQUS
“NLGEOM” (Dassault Systemes, 2018) for dealing with large displacements and large distortions.
Newton’s method and ABAQUS default automatic increment size control algorithm are used in
this study for efficiently solving the nonlinear problems. In addition, nonlinear material behavior
for both base plate and weld metal is assumed to follow elastic-perfect-plastic stress-strain curve
(see Figure 3.11b), in which Young’s modulus (224769 MPa) and yield strength (550 MPa) are
based upon stress-strain curve obtained from weldment material’s tensile tests. The use of elastic-
perfect-plastic material model eliminates the difference between true stress-strain curve and
engineering stress-strain curve, and most importantly it stems from the following principle
considerations: (1) providing an upper bound estimation of any plate-to-plate contact effects as
plastic deformation develops within fillet weld; (2) being consistent with the lower bound
definition of the limit state conditions discussed in the previous section; (3) tested yield strength
550 MPa and ultimate tensile strength 610 MPa (Huang et al., 2014 & 2016) showed that strain
hardening effects were not significant.

68
(a)
(b)
Figure 3.11: FE model and stress-strain relationship used for modeling transverse shear specimen: (a) A
representative FE model of transverse shear specimen; (b) Stress-strain curve representing elastic-perfect-plastic
material used in FEA calculations

69
As shown in Figure 3.11a, the use of fine mesh allows a detailed search of maximum shear
stress plane for validating the analytical solutions discussed in Sec. 3.2. For convenience, 𝜏𝑚 and
𝜏𝑏 acting on any weld throat plane at an arbitrary angle 𝜃 are calculated using the following
equations:
𝜏𝑚(𝜃) =1
𝑎𝜃∫ 𝜏(𝑥′) × 𝑑𝑥′𝑎𝜃
0
(3.19)
𝜏𝑏(𝜃) =6
𝑎𝜃2∫ 𝜏(𝑥′) × (
𝑎𝜃2− 𝑥′) × 𝑑𝑥′
𝑎𝜃
0
(3.20)
which are equivalent to nodal force based traction stress method for 2D problems as
demonstrated by Dong et al. (2010a). In addition, the equations above are more convenient for the
present case since 𝜏𝑚 and 𝜏𝑏 on a weld throat plane can be calculated without needing to place
nodal positions along each plane to be searched.
Given weld throat plane shear stress 𝜏𝑚(𝜃) from Eq. (3.19), shear force 𝑆 acting on the
same weld throat can be obtained as:
𝑆(𝜃) = 𝜏𝑚(𝜃) × 𝑎𝜃 (3.21)
which can then be plotted against load point displacement for identifying limit load position
according to the limit state definition derived in the previous section.
3.3.2 FE Results
3.3.2.1 Results without Considering Contact Effects
Without considering plate-to-plate contact (i.e., 𝐶 = 0 in Figure 3.9), the computed shear
force acting on the critical weld throat plane, i.e., 𝑆(𝜃𝑚𝑎𝑥) = 𝜏𝑚(𝜃𝑚𝑎𝑥) × 𝑎𝜃𝑚𝑎𝑥 according to Eq.
(3.19), is plotted against load point displacement 𝐷𝐹𝐸𝐴 in Figure 3.12a, which shows that the shear
force 𝑆 reaches its maximum 𝑆𝑈 at 𝐷𝐹𝐸𝐴 = 𝐷𝑈 . In a similar manner, shear traction stress

70
components 𝜏𝑚 and 𝜏𝑏 on the critical weld throat plane according to Eq. (3.19) and Eq. (3.20) are
plotted in Figure 3.12b in terms of 𝜏𝑏/𝜏𝑚 ratio as a function of relative load point displacement
𝐷𝐹𝐸𝐴/𝐷𝑈. As can be seen, during the initial stage of loading or elastic deformation stage, 𝜏𝑏 is
significant due to the severe stress concentration at weld root. As remote load increases and plastic
deformation develops, 𝜏𝑏 diminishes rapidly and becomes negligible as 𝐷𝐹𝐸𝐴/𝐷𝑈 ≈ 0.8. Upon
further loading, 𝜏𝑚 becomes the only dominant shear stress component, i.e., 𝜏𝑚 + 𝜏𝑏 → 𝜏𝑚 ,
agreed with the results from Pei and Dong (2019). Therefore, the validity of the analytical fillet
weld throat stress model depicted in Figure 3.9 can now be quantitatively justified when both
nonlinear material behavior and nonlinear geometry effects are taken into account. Furthermore,
at 𝐷𝐹𝐸𝐴 𝐷𝑈⁄ = 1, 𝜏𝑚(𝜃) predicted by the analytical model in Sec. 3.2 and by the nonlinear finite
element model in Figure 3.11 are compared in Figure 3.12c, which demonstrates an excellent
agreement, representing the first such validation to the authors’ best knowledge.
(a)
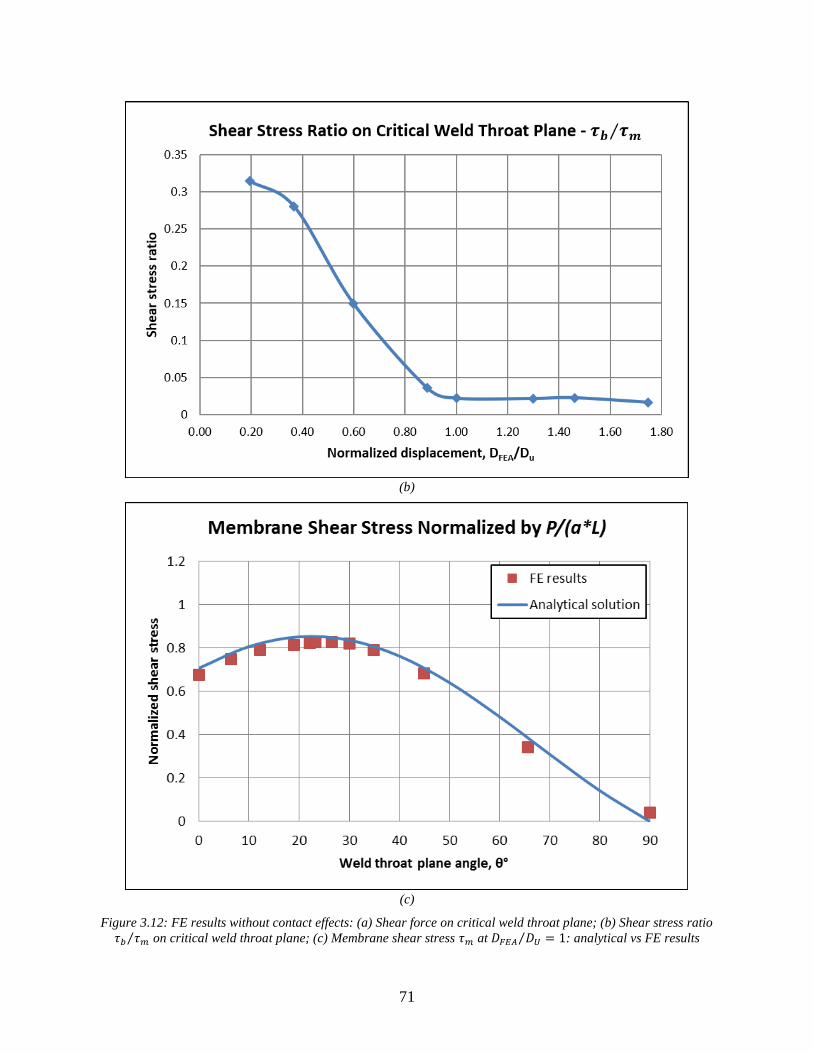
71
(b)
(c)
Figure 3.12: FE results without contact effects: (a) Shear force on critical weld throat plane; (b) Shear stress ratio
𝜏𝑏 𝜏𝑚⁄ on critical weld throat plane; (c) Membrane shear stress 𝜏𝑚 at 𝐷𝐹𝐸𝐴 𝐷𝑈⁄ = 1: analytical vs FE results

72
3.3.2.2 Results with Considering Contact Effects
When considering plate-to-plate contact, nodal forces at the contact interface between the
lap and base plates in Figure 3.11a are collected and summed for calculating the resultant contact
force 𝐶. The resulting contact ratio 𝐾 = 𝐶 𝑃⁄ as a function of normalized load point displacement
𝐷𝐹𝐸𝐴 𝐷𝑈⁄ is shown in Figure 3.13.
Figure 3.13: Computed contact ratio 𝐾 as a function of relative load point displacement 𝐷𝐹𝐸𝐴 𝐷𝑈⁄

73
Figure 3.14: Critical weld throat plane as a function of contact ratio: analytical versus FE results
To examine the validity of Eq. (3.8) for determining critical weld throat plane, on which
maximum transverse shear stress acts, a total of six positions (indicated by symbols) spanning the
entire contact ratio curve shown in Figure 3.13 are considered for determining the critical weld
throat plane angle as a function of contact ratio 𝐶 𝑃⁄ from the nonlinear FE results. The critical
weld throat plane results are shown in Figure 3.14 and compared with the analytical solution taken
from Figure 3.10. A good agreement can be seen in Figure 3.14, proving the validity of the
analytical developments presented in Sec 3.2.3 for determining the limit state of interest in this
study.
3.4 Analysis of Test Data
With the new developments discussed in Sec. 3.2, particularly on the effect of plate-to-
plate contact on critical weld throat plane angle, as confirmed by nonlinear FE results in Sec. 3.3,
the shear strength test data reported by the authors recently (Lu et al., 2015) can now be re-analyzed

74
for demonstrating an improved correlation in shear strengths of fillet welds between transverse
and longitudinal shear conditions. Note that all the transverse and longitudinal shear specimens
analyzed in this chapter were manufactured and delivered according to MIL-STD-1689A
(Department of Defense, 1990).
3.4.1 Shear Strength Correlation
By taking 𝐾 = 0.3, i.e., assuming that plate-to-plate contact existed in all transverse shear
specimens in the testing program (Lu et al., 2015), transverse shear test results can be re-calculated
according to Eq. (3.7) and Eq. (3.8) and then compared with longitudinal shear test results. As can
be seen in Figure 3.15, for both combinations of base metal and weld wire, the improvement in
shear strength correlations between the transverse and longitudinal shear tests is evident once
contact effects are considered. It should be noted that such an improvement in shear strength data
correlation can be observed in all test groups in Lu et al. (2015), which are given in Appendix C
for completeness.
(a)

75
(b)
Figure 3.15: Shear strength correlations by traction stress method with and without contact effects: (a) DH36,
FCAW, and 71T1-C weld wire; (b) HSLA80, FCAW, and 101T-C weld wire
3.4.2 Critical Weld Throat Plane Angle Estimation
In addition, critical weld throat plane angle of transverse shear specimens can now be more
reasonably estimated by Eq. (3.8) by setting 𝐾 = 0.3, which yields 𝜃𝑚𝑎𝑥 ≈ 14°. A significantly
improved agreement with the experimental measurements can be clearly seen in Figure 3.16.
Figure 3.16: Predicted failure angle versus measured failure angle

76
3.4.3 Applications for Combined Loading Conditions
As a further validation for the new analytical development regarding treatment of contact
effects, the test results obtained under various combined loading conditions shown in Figure 3.8
can now be re-analyzed by introducing 𝐾 = 0.3 into Eq. (3.5), which can be re-written as:
𝜏𝑒,𝑚𝑎𝑥 =𝑃
𝑠 × 𝐿× (cos 𝜃𝑚𝑎𝑥 + sin 𝜃𝑚𝑎𝑥)
× √{sin 𝛼 × (cos 𝜃𝑚𝑎𝑥 − 0.3 sin 𝜃𝑚𝑎𝑥)}2 + (cos 𝛼)2
(3.22)
By setting the first derivative of Eq. (3.22) with respect to 𝜃 equal to 0, the critical weld
throat plane angle 𝜃𝑚𝑎𝑥 can be obtained by solving the equation below iteratively:
cos 𝜃𝑚𝑎𝑥 − sin 𝜃𝑚𝑎𝑥cos 𝜃𝑚𝑎𝑥 + sin 𝜃𝑚𝑎𝑥
× √{sin 𝛼 × (cos 𝜃𝑚𝑎𝑥 − 0.3 sin 𝜃𝑚𝑎𝑥)}2 + (cos 𝛼)2
=2 sin 𝛼2 × (cos 𝜃𝑚𝑎𝑥 − 0.3 sin 𝜃𝑚𝑎𝑥) × (sin 𝜃𝑚𝑎𝑥 + 0.3 cos 𝜃𝑚𝑎𝑥)
√{sin 𝛼 × (cos 𝜃𝑚𝑎𝑥 − 0.3 sin 𝜃𝑚𝑎𝑥)}2 + (cos 𝛼)2
(3.23)
The theoretically estimated critical weld throat plane angle (Eq. (3.23)) is plotted as a
function of loading angle 𝛼 (see the solid line in Figure 3.8). Again, the present approach shows a
marked improvement, particularly for the test data from the study of Miazga and Kennedy (1989)
when the loading angle 𝛼 ≥ 45°, for which transverse shear conditions become more dominant,
so does the contact effects.
Note that some discrepancies between analytical and test results can still be observed,
especially for loading angle at about 30°. The reasons are not clear at this point. Some possible
contributors to the discrepancies could be variations in fillet weld sizes, weld quality, and test
conditions. More controlled test data would be needed for understanding the causes of these
discrepancies, which will be reported at a later date when results become available. Nevertheless,

77
the correlation between the analytical results of this study and the test results shown in Figure 3.8
still represents the best correlation to date, to the authors’ best knowledge.
3.5 Conclusions
In this chapter, an analytical formulation is presented for defining limit state condition in
fillet-welded connections incorporating plate-to-plate contact effects. The analytical solution is
then validated by finite element computation incorporating nonlinear material and nonlinear
geometry conditions. In addition, its effectiveness in correlating shear strengths obtained from
transverse and longitudinal shear specimens has been proven through the re-analysis of over 100
shear tests obtained by the same authors in an early part of the same study (Lu et al., 2015). As a
result, a unified fillet weld shear strength can be established regardless of test specimen
configurations and shear loading conditions, while conventional shear strength equation is
incapable of reconciling the differences in shear strengths by as much as 50% as seen in this study
and in the literature (Butler & Kulak, 1971; Kato & Morita, 1974; Yang et al., 2019) between
transverse and longitudinal shear specimens.
Additional specific findings include:
1. Membrane shear stress is shown dominating the shear strength behavior in fillet-welded
test specimens stipulated by widely used Codes and Standards, proving the validity of
the analytical weld throat stress model adopted here and presented earlier in Chapter 2.
2. The presence of plate-to-plate contact causes a noticeable reduction of weld throat
failure angle in transverse shear specimen from the theoretical value of 22.5°, which
must be considered in order to avoid an over-estimation of shear strength from tests.
78
3. The unified fillet weld shear strength can be used to predict load capacity of complex
fillet-welded connections under combined shear loading conditions, as demonstrated
in Figure 3.8.
4. The present developments provide a basis for achieving a quantitative fillet weld sizing
criterion for design and construction of fillet-welded structures, for which unified shear
strength and robust weld throat stress calculation procedure are prerequisites.
Acknowledgments
The authors acknowledge the support of this work through a grant from CRRC Qiqihar
Rolling Stock Co., Ltd.

79
Chapter 4 A Quantitative Weld Sizing Criterion and Applications in Load Capacity
Evaluation of Hollow Structural Section Joints
Abstract
Existing weld sizing procedures for hollow structural section (HSS) joints in Codes and
Standards are empirical in nature, often resulting in oversized welds. There is a growing interest
in quantitative weld sizing for ensuring both structural safety and cost-effective construction of
lightweight hollow section structures. In this chapter, a mesh-insensitive traction stress method is
introduced for evaluating strength of fillet-welded HSS joints. The results are then generalized into
a closed-form expression with a clearly defined mechanics basis. This expression relates weld
throat shear stress to fillet weld size and remote load, with its dimensional geometric parameters
being determined through a detailed parametric finite element analysis (FEA) of circular hollow
section (CHS) and rectangular hollow section (RHS) joints with various dimensions. The
effectiveness of the closed-form expression is demonstrated by comparing the predicted failure
loads with those measured from a large number of HSS test data available from literature.
Furthermore, the proposed quantitative weld sizing criterion can lead to as much as 20% weld size
reduction from those determined using existing empirical-based weld sizing criteria, which can be
very beneficial for welding-induced distortion control in construction of lightweight thin-walled
structures.
Keywords: fillet weld, shear strength, traction stress method, hollow structural section,
weld sizing, finite element analysis, lightweight

80
4.1 Introduction
Hollow structural sections (HSS) are widely used in civil and marine structures due to their
high section stiffness, load-bearing ability and lightweight attributes. The most common HSS
forms are circular hollow sections (CHS) and rectangular hollow sections (RHS), as illustrated in
Figure 4.1. Both their lightweight and friendliness for field construction increasingly make the
hollow structural sections a desirable choice (Wardenier et al., 2002).
Figure 4.1: Hollow structural sections: circular hollow sections and rectangular hollow sections
Various forms of frame structures can be readily constructed by performing fillet welding
between HSS intersections, which serve as load transfer joints from one member to another.
However, although overall frame structure can be designed in such a way that each HSS is
subjected to relatively simple loading conditions, the stress state at joints can be very complex and
difficult for quantitative determination. This is mainly because of stress or strain singularity (notch
effects) at weld locations, i.e., at weld toe and weld root (Dong et al., 2010a). In addition, the
difference in flexibility between the HSS and transition plates which are often used as fillet weld
landing surfaces, makes the weld stress singularity even more severe (Packer & Cassidy, 1995).
As a result of lacking an effective means for quantitatively determining the weld stress state,

81
engineers have been relying on empirical design rules in current codes and standards, which often
oversize the fillet welds for preventing premature failures under anticipated loading conditions
(Packer et al., 2016). However, the use of oversized fillet welds in modern lightweight structures
not only increases structural weight and construction cost, but also introduces severe welding-
induced distortions during construction (Huang et al., 2004 & 2007). As structural lightweight
demands intensify, over-welding has been identified as the major contributor to widespread
distortions in shipbuilding and offshore construction over the last decade or so (Huang et al., 2014
& 2016). Therefore, a quantitative weld sizing criterion is needed for both ensuring structural
safety and reducing construction cost for taking advantage of HSS in modern lightweight ship
structures.
In this chapter, after briefly examining traditional weld sizing criteria (e.g., empirical based
“engineering shear stress” definition and “directional strength-increase factor”) in Sec. 4.2, authors
then introduce the mesh-insensitive traction stress method (TSM), which has been used for
determining weld strength in load-carrying fillet-welded plate joints, as a means of quantitatively
determining fillet weld shear strength in HSS connections in Sec 4.3. It should be noted that TSM
has shown effective both in fatigue evaluation of welded joints (Dong et al., 2010a; Xing et al.,
2016; Mei & Dong, 2017a & 2017b) and static weld strength characterization at simple specimen
level (Nie & Dong, 2012; Lu et al., 2015; Lu & Dong, 2020). In Sec. 4.4, detailed traction stress
states at typical CHS and RHS joints will be examined for establishing transferability between the
shear strength determined in simple plate joints and load capacity in HSS connections. Through a
careful examination of detailed finite element analysis (FEA) results, a set of key parameters have
been identified for determining critical locations governing the load capacity in HSS connections,
leading to a much-improved load capacity correlation compared to the existing traditional weld

82
sizing approaches. Finally, those parameters are incorporated into a proposed TSM based weld
sizing criterion, which gives a significant weld size reduction without compromising joint load
capacity.
4.2 Assessment of Traditional Weld Sizing Approaches
4.2.1 Engineering Shear Stress
Due to the failure of capturing the weld stress singularity, existing traditional fillet weld
sizing criteria, such as MIT-STD-1628 (Department of Defense, 1974), ABS 96 (ABS, 2000),
AWS D1.1 (AWS, 2015), and other design specifications, such as Eurocode 3 (CEN, 2005), AISC
360 (AISC, 2010) and CSA S16 (CSA, 2014), have been taking a conservative approach to ensure
the fillet welds possessing higher strength than those of the connected branch members. A nominal
weld throat stress defined by Eq. (4.1), also referred to as an “engineering shear stress” in DNV-
RP-C203 (DNV, 2012), has been used in these criteria for calculating fillet weld strengths from
both standard longitudinal and transverse shear specimens, of which fillet welds are parallel (0°)
and perpendicular (90°) to the remote loading direction (𝑃) respectively, as depicted by AWS B4.0
(AWS, 2007) in Figure 4.2.
𝜏𝑢,𝑤 =𝑃𝑢
𝑎45 × 𝐿 (4.1)

83
(a)
(b)
Figure 4.2: Standard fillet-welded shear testing specimens: (a) longitudinal shear loaded; (b) transverse shear
loaded
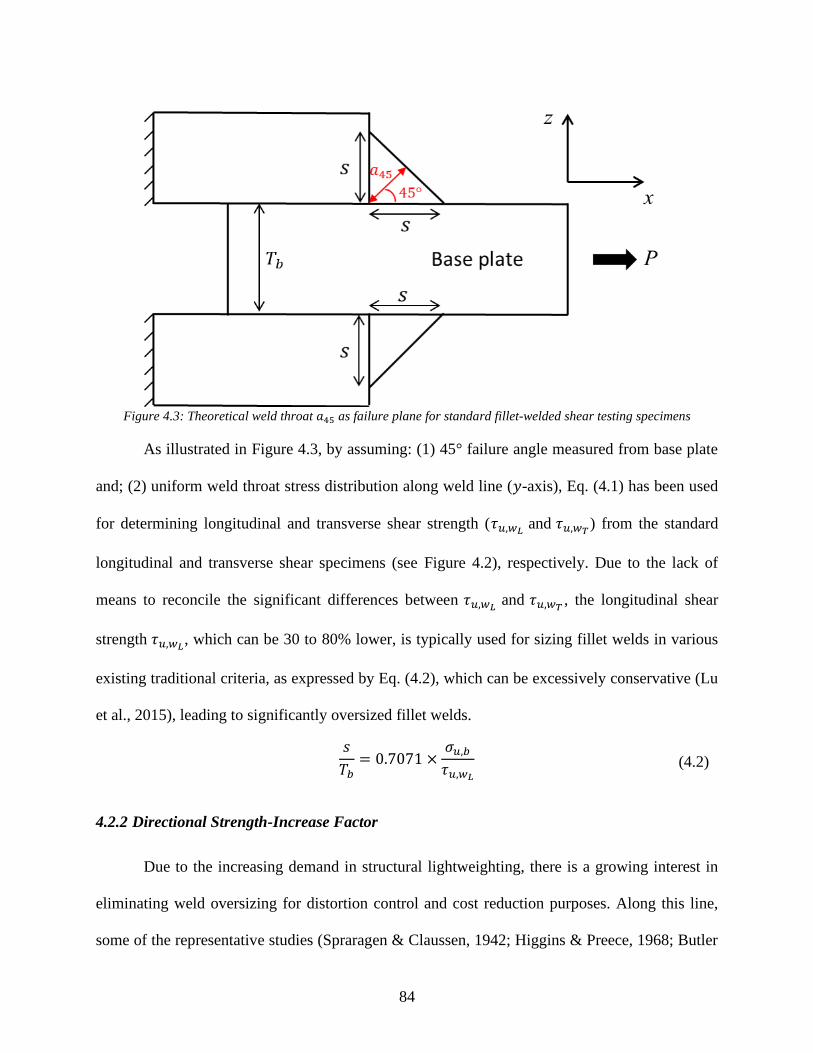
84
Figure 4.3: Theoretical weld throat 𝑎45 as failure plane for standard fillet-welded shear testing specimens
As illustrated in Figure 4.3, by assuming: (1) 45° failure angle measured from base plate
and; (2) uniform weld throat stress distribution along weld line (𝑦-axis), Eq. (4.1) has been used
for determining longitudinal and transverse shear strength (𝜏𝑢,𝑤𝐿 and 𝜏𝑢,𝑤𝑇) from the standard
longitudinal and transverse shear specimens (see Figure 4.2), respectively. Due to the lack of
means to reconcile the significant differences between 𝜏𝑢,𝑤𝐿 and 𝜏𝑢,𝑤𝑇 , the longitudinal shear
strength 𝜏𝑢,𝑤𝐿, which can be 30 to 80% lower, is typically used for sizing fillet welds in various
existing traditional criteria, as expressed by Eq. (4.2), which can be excessively conservative (Lu
et al., 2015), leading to significantly oversized fillet welds.
𝑠
𝑇𝑏= 0.7071 ×
𝜎𝑢,𝑏𝜏𝑢,𝑤𝐿
(4.2)
4.2.2 Directional Strength-Increase Factor
Due to the increasing demand in structural lightweighting, there is a growing interest in
eliminating weld oversizing for distortion control and cost reduction purposes. Along this line,
some of the representative studies (Spraragen & Claussen, 1942; Higgins & Preece, 1968; Butler

85
& Kulak, 1971; Kato & Morita, 1974; Kamtekar, 1982 & 1987; Miazga & Kennedy, 1989) have
shown that the load-carrying capacity of fillet welds is a function of loading angle, i.e., the angle
𝛼 between the remotely applied load 𝑃 and the weld axis as shown in Figure 4.4. For instance, an
experimental study by Miazga and Kennedy (1989), including 42 fillet-welded shear specimens
loaded from 0° to 90°, showed that load-carrying capacity ratios between the transverse and
longitudinal shear specimens were 1.28 and 1.60 for 5 mm and 9 mm weld sizes, respectively. In
the same study, Miazga and Kennedy (1989) also developed an analytical model based on the
maximum shear stress theory with parameters empirically obtained from the experimental results,
showing load-carrying capacity of fillet weld increased up to 50% when the loading angle 𝛼
increased from 0° to 90°.
Figure 4.4: Combined shear loaded fillet weld with loading angle 𝛼
These observations on the load-carrying capacity variation in the fillet welded components
subjected to different loading angles have led to the development of a directional strength-increase
factor, as empirically formulated in the form of Eq. (4.3) by Lesik and Kennedy (1990), which has
been adopted by some design specifications such as CSA S16 (CSA, 2014) and AISC 360 (AISC,

86
2010) for reducing fillet weld sizes. Note that 𝜏𝑢,𝑤0 in Eq. (4.3) is the same as the longitudinal
shear strength 𝜏𝑢,𝑤𝐿 in Eq. (4.2).
𝜏𝑢,𝑤𝛼𝜏𝑢,𝑤0
= 1.00 + 0.50 sin1.5 𝛼 (4.3)
However, there exist some major limitations in the empirical approach described by Eq.
(4.3) for structural applications. First, it has been shown that the directional strength-increase
factors determined from Eq. (4.3) have shown a significant scatter in interpreting the experimental
test data available in literature, which suggests that there might be other factors at play. For
example, the weld size effect was clearly present in the study of Miazga and Kennedy (1989).
Secondly, in the previous studies, the assumption of uniform weld throat stress distribution along
weld direction was only appropriate for the standard simple transverse shear specimens but not at
all for the standard longitudinal shear specimens. As demonstrated by Nie and Dong (2012) as
well as by Lu et al. (2015), severe weld throat stress concentration occurs at the end of longitudinal
weld axis and should not be ignored for weld strength determination. In addition, the stress
distribution along weld direction could be much more complex than being uniform in the structural
applications even if the fillet welds are transversely loaded, which will be demonstrated for the
HSS connections in the later part of this study. Furthermore, a limit state approach by Lu and Dong
(2020) demonstrated contact force between the overlapped plates has a significant effect on the
weld throat stress state, which had been ignored or inadequately considered in the force systems
from the previous theoretical models. Lastly, the failure criterion used for weld strength
determination should be consistent for a fillet welded component regardless of loading angle as
discussed by Nie and Dong (2012) and Lu et al. (2015). However, this was not the case as implied
by introducing a directional strength-increase factor, e.g., in the form of Eq. (4.3).

87
Based on the above discussions, it seems reasonable to state that both the engineering shear
stress and directional strength-increase factor lack of a rigorous mechanics underpinning for
supporting the development of a more generalized weld sizing criterion.
4.3 Traction Stress based Weld Strength Criterion
To address the inconsistencies in fillet weld strength characterizations discussed in the
previous section, the mesh-insensitive traction stress method has been shown effective (Nie &
Dong, 2012; Lu et al., 2015). For completeness, a brief description of the method is given below,
with an emphasis on applications in analyzing HSS joints for facilitating the discussions in the
later sections of this chapter.
To deal with the weld throat failure, three traction stress components with respect to the
local coordinate system (𝑥′-𝑦′-𝑧′), referred to as normal stress 𝜎(𝑥′), transverse shear stress
𝜏𝑇(𝑥′), and longitudinal shear stress 𝜏𝐿(𝑥
′) as seen in Figure 4.5, are exposed on any fillet weld
throat plane at an angle of 𝜃 from base plate and are presented in a work-equivalent linear form as
in Eq. (4.4), each of which consists of its membrane and bending parts with respect to the mid-
distance of the weld throat cut cross section A-A along 𝑎𝜃, as shown in Figure 4.6.
Figure 4.5: Traction stress components acting on a weld throat plane at an angle of 𝜃

88
Figure 4.6: Linear representation and decompostion of weld throat traction stress components
𝜎 = 𝜎𝑚 + 𝜎𝑏
𝜏𝑇 = 𝜏𝑇𝑚 + 𝜏𝑇𝑏
𝜏𝐿 = 𝜏𝐿𝑚 + 𝜏𝐿𝑏
(4.4)
Through the experimental and analytical studies (Nie & Dong, 2012; Lu et al., 2015), the
TSM based weld failure criterion, for fillet welds under combined longitudinal and transverse
shear loading conditions, has been defined as the maximum resultant membrane shear stress on
the critical weld throat plane as expressed by Eq. (4.5), following which great weld strength
correlations improvement compared to using the traditional approach (Eq. (4.1)) have been
achieved for over 200 pieces of testing specimens configured with the most commonly used base
and weld filler materials (steel, titanium alloy, and aluminum alloy, etc.), welding processes
(GTAW, FCAW, and GMAW, etc.), and dimensions (plate thickness, weld length, and weld size,
etc.), such as the example shown in Figure 4.7.

89
Figure 4.7: Fillet weld strength correlation comparison between traction stress method and traditional approach
𝜏𝑒,𝑚𝑎𝑥 = Max {√𝜏𝐿𝑚(𝜃)2 + 𝜏𝑇𝑚(𝜃)2} ≤ 𝜏𝑢,𝑤 (4.5)
An additional important improvement to the TSM failure criterion has been developed to
include the effects of nonlinear mechanical properties and contact conditions on the weld throat
stress state (Lu & Dong, 2020). As a result, the new procedure not only provides more effective
data correlation between longitudinal and transverse shear tests as shown in Figure 4.8, but also
enables a significantly improved failure angle prediction for the fillet-welded specimens subjected
to loading direction varying from 0° to 90° with respect to weld line direction as shown Figure 4.9.
Detailed formulation and calculation procedures can be found in Lu and Dong (2020), which will
not be repeated here due to space limit.
Figure 4.8: Fillet weld strength correlation comparison between TSM and TSM with nonlinearity

90
Figure 4.9: Critical weld failure angle correlation between traction stress method and test data measurement
Then, the question becomes how the quantitative failure criterion given in Eq. (4.5), proven
effective as seen in Figure 4.9, can be implemented for determining critical fillet weld sizing or
estimating load capacity of a HSS joint. The following section provides the detailed developments
in this regard.
4.4 Analysis of Fillet-Welded HSS Connections
Without losing generality, we consider two representative HSS joint configurations as
shown in Figure 4.10, on which there exist an sufficient amount of test data for a validation purpose
(Packer & Cassidy, 1995; Tousignant, 2017). These are HSS joint with an inset rigid plate (see
Figure 4.10a) and HSS to HSS cruciform joint (see Figure 4.10b). Two most common cross-section
geometries (section A-A) of branch member, i.e., circular and rectangular hollow section, are
considered in this study, as shown in Figure 4.11.

91
(a)
(b)
Figure 4.10: Fillet-welded HSS connections: (a) HSS to rigid plate; (b) HSS to HSS

92
Figure 4.11: Cross section A-A of branch member in Figure 4.10: (a) CHS; (b) RHS
4.4.1 Finite Element Analysis using TSM
Three-dimensional (3D) solid element models were developed using ABAQUS (Dassault
Systemes, 2018), with various geometric parameters, such as branch member width 𝐷𝑏 or 𝐵𝑏
varying from 40 to 200 mm, branch member thickness 𝑡𝑏 from 2 to 80 mm, and fillet weld size 𝑠
from 4 to 12 mm. Both CHS and RHS are modeled being welded to the fixed rigid endplate to
remove the landing surface flexibility effect for the time being, as depicted in Figure 4.10a.
Sufficiently fine linear 3D brick elements (2 mm and C3D8) are chosen to mesh the fillet weld and
its surrounding area for both the CHS and RHS connections. Nominal structural steel elastic
material properties are assigned, and nonlinear material and geometric (large deformation)
behaviors are not considered according to the results from the previous studies (Lu et al., 2015; Lu
& Dong, 2020). Remote tension load 𝑃 perpendicular to the weld toe surface is incrementally
applied at the far end of the branch member. Representative FE models for CHS and RHS joints
are shown in Figure 4.12. The mesh-insensitive traction stresses acting on the selected weld throat
cut plane (angle 𝜃 plane in Figure 4.12) are then computed using the nodal force based procedure
for 3D solid element models given in Nie and Dong (2012) and Lu et al. (2015), which will not be
repeated here due to space limit.
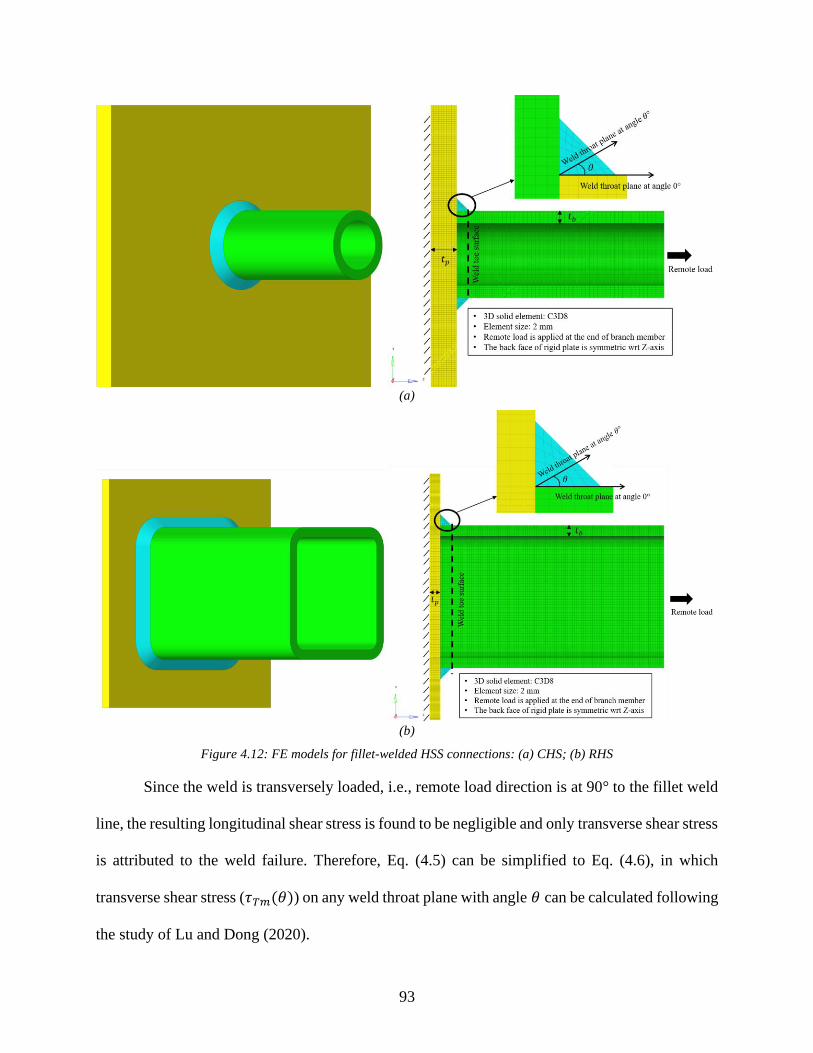
93
(a)
(b)
Figure 4.12: FE models for fillet-welded HSS connections: (a) CHS; (b) RHS
Since the weld is transversely loaded, i.e., remote load direction is at 90° to the fillet weld
line, the resulting longitudinal shear stress is found to be negligible and only transverse shear stress
is attributed to the weld failure. Therefore, Eq. (4.5) can be simplified to Eq. (4.6), in which
transverse shear stress (𝜏𝑇𝑚(𝜃)) on any weld throat plane with angle 𝜃 can be calculated following
the study of Lu and Dong (2020).

94
𝜏𝑒,𝑚𝑎𝑥 = max{𝜏𝑇𝑚(𝜃)} = max{𝜏𝑇𝑚(0) × (cos 𝜃 − 𝐾 sin 𝜃) × (cos 𝜃 + sin 𝜃)}
𝐾 =𝜎𝑚(0)
𝜏𝑇𝑚(0)
(4.6)
However, unlike the transversely loaded open fillet welds on the standard plate specimens,
of which both 𝜏𝑇𝑚(0) and 𝐾 can be analytically derived following a traction stress based limit
state approach, it is expected that 𝜏𝑇𝑚(0) and 𝐾 are not uniform along the weld line, particularly
at the corner locations in RHS, and vary for different sized HSS connections. Therefore, the main
objective of the FE base parametric study here is to elucidate the behaviors of 𝜏𝑇𝑚(0) and 𝐾 and
their governing parameters so that 𝜏𝑒,𝑚𝑎𝑥 can be analytically obtained.
4.4.1.1 Results – CHS Connections
Starting with CHS connections, shear stress 𝜏𝑇𝑚(0) and normal stress 𝜎𝑚(0) at the 0°
weld throat plane along the circumference from a 3D CHS FE model, normalized by nominal shear
stress defined as 𝜏𝑛 = 𝑃 (𝑠 × 𝐿)⁄ , are plotted in Figure 4.13, from which a few findings can be
summarized: (1) both the shear and normal stresses uniformly distribute along the weld, i.e., the
structural constraint on the weld is uniform for CHS connections; (2) shear stress 𝜏𝑇𝑚(0) is equal
to the nominal shear stress 𝜏𝑛 = 𝑃 (𝑠 × 𝐿)⁄ , meaning there is no stress concentration caused by
geometric singularity; (3) significant self-equilibrium normal stress acts on the 0° face due to the
structural constraint even though no external load parallel to the weld toe surface is applied.

95
Figure 4.13: Normalized traction stress distribution along weld circumference on CHS connection under 90°
loading
Figure 4.14: 2D axisymmetrci FE modeling for CHS connections

96
The 3D FE model results shown in Figure 4.13 confirm that axisymmetric model, as
illustrated in Figure 4.14, can be directly used to represent the CHS connections, although the base
plate is square-shaped. As such, with the axisymmetric traction stress results obtained from various
CHS connections with combinations of geometric parameters (𝑅𝑏, 𝑡𝑏, 𝑠, etc.), ratio 𝐾 are shown
to be a function of branch member radius 𝑅𝑏 (i.e., 𝐷𝑏 2⁄ ) and thickness 𝑡𝑏, as shown in Figure
4.15. It can be summarized that: (1) the ratio 𝐾 decreases when 𝑅𝑏 𝑡𝑏⁄ increases; (2) when 𝑅𝑏 𝑡𝑏⁄
equal to 1, the ratio 𝐾 data scatters a bit, i.e., thicker 𝑡𝑏 having larger 𝐾 value; (3) however, the
ratio 𝐾 (𝑅𝑏 𝑡𝑏⁄ = 1) reaches to 0.5 and becomes stable when 𝑡𝑏 is thick enough, i.e., upper bound
of ratio 𝐾 being 0.5. (4) noting that the ratio 𝐾 variance between different weld sizes for the same
𝑅𝑏 𝑡𝑏⁄ is minimum, it is considered negligible in this study.
Figure 4.15: Ratio 𝐾 vs 𝑅𝑏 𝑡𝑏⁄ for CHS connections with different 𝑡𝑏
A careful examination of Figure 4.15 indicates that a logarithmic equation can be used to
provide the best fit of the correlation between 𝐾 and 𝑅𝑏 𝑡𝑏⁄ , as expressed by Eq. (4.7), of which

97
the upper bound represent solid circular section (i.e., 𝑅𝑏 𝑡𝑏⁄ = 1 and 𝐾𝑢𝑝𝑝𝑒𝑟 = 0.5). In addition,
Eq. (4.7) indicates that normal stress effect can be negligible when 𝑅𝑏 𝑡𝑏⁄ is large enough. By
substituting Eq. (4.7) into Eq. (4.6), both shear strength and failure angle of fillet welds on the 90°
loaded CHS connections can be obtained by the closed-form expression as shown in Eq. (4.8):
𝐾 = −0.1089 ln𝑅𝑏𝑡𝑏+ 0.5 (4.7)
𝜏𝑢,𝑤 =𝑃𝑢𝑠 × 𝐿
× (cos 𝜃𝑚𝑎𝑥 − 𝐾 × sin 𝜃𝑚𝑎𝑥) × (cos 𝜃𝑚𝑎𝑥 + sin 𝜃𝑚𝑎𝑥)
𝜃𝑚𝑎𝑥 =1
2× tan−1(
0.5 + 0.1089 ln𝑅𝑏𝑡𝑏
1.5 − 0.1089 ln𝑅𝑏𝑡𝑏
)
(4.8)
4.4.1.2 Results – RHS Connections
Unlike the CHS connections, shear stress 𝜏𝑇𝑚(0), normal stress 𝜎𝑚(0) and ratio 𝐾 from
the 3D RHS FE models are non-uniformly distributed along the weld circumference, as shown in
Figure 4.16. It can be observed that: (1) both stress and ratio 𝐾 distributions are concentrated at
the corners of the section, i.e., the weld toe locations with the max distance to the cross-section
centroid (𝐶𝑏 = 𝐶𝑏,𝑚𝑎𝑥 in Figure 4.11b) along weld; (2) the value of normal stress or ratio 𝐾 hits
the valley at the locations of 𝐶𝑏 = 𝐶𝑏,𝑚𝑖𝑛 along weld.

98
(a)
(b)
Figure 4.16: Normalized traction stress and ratio K distribution along weld circumference for RHS connections

99
The non-uniform variations in Figure 4.16 along weld axis exhibit a quarter symmetry,
consistent with the component geometry and loading condition given in Figure 4.12b, as expected.
The reason for using a full 3D FE model is for consideration of other non-symmetrical loading
conditions in a future study. Note that the weld strength evaluation requires the determination of
weld throat stress at the critical failure locations, which are situated at the RHS corners in this case.
Therefore, in order to use Eq. (4.6) to compute the maximum weld throat shear stress in the RHS
connections, a closed-form expression is needed to relate the ratio 𝐾 to the traction stresses at the
locations of 𝐶𝑏 = 𝐶𝑏,𝑚𝑎𝑥.
To do so, one possible scenario is to simply substitute the size ratio parameter 𝑅𝑏 𝑡𝑏⁄ from
the CHS connections with 𝐵𝑏 𝑡𝑏⁄ from the RHS connections into Eq. (4.7), by assuming that the
parameters 𝐷𝑏 (= 2𝑅𝑏 ) and 𝐵𝑏 serve as the same size parameter for the HSS. Then, the 𝐾
parameter obtained from the RHS FE models should have a similar relationship to that observed
in the CHS connections. However, this is not the case, as shown in Figure 4.17. There seems no
clear correlation between the 𝐾 ratio and 𝐵𝑏 𝑡𝑏⁄ as a size ratio parameter for the RHS connections.

100
Figure 4.17: Ratio 𝐾 vs 𝐵𝑏 𝑡𝑏⁄ for RHS connections
Upon further examination on the detailed behavior of 𝐾 ratio at the RHS corner locations,
it is found that the local radius 𝑟𝑐 at 𝐶𝑏 = 𝐶𝑏,𝑚𝑎𝑥 (see Figure 4.11b) must be considered in a
dimensionless size ratio parameter (𝜆1) defined as:
𝜆1 =𝑟𝑐𝑡𝑏×𝐶𝑏,𝑚𝑖𝑛𝐶𝑏,𝑚𝑎𝑥
(4.9)
Note that the CHS connections have constant 𝑟𝑐 and 𝐶𝑏 (both equal to 𝑅𝑏). Then, Eq. (4.9)
becomes simply 𝜆1 = 𝑅𝑏 𝑡𝑏⁄ , which is the same parameter used in Eq. (4.7) for CHS connections.
Therefore, a generalized closed-form logarithmic equation can be developed in terms of the
parameter 𝜆1 for ratio 𝐾 calculation for both CHS and RHS connections, as expressed in Eq.
(4.10), by which an excellent correlation of FEA results can be demonstrated in Figure 4.18. It is
certainly plausible that other parameters such as weld size 𝑠 may also have some effects on ratio
𝐾, which can be argued as higher order effects and assumed negligible in this study.

101
Figure 4.18: Correlation of ratio 𝐾 vs 𝜆1 for both CHS and RHS connections by Eq. (4.10)
𝐾 = −0.1089 ln 𝜆1 + 0.5 (4.10)
Encouraged by the development shown in Figure 4.18, a similar parametric study is
performed to examine the shear traction stress at the 0° weld throat plane, i.e., 𝜏𝑇𝑚(0), to complete
the development of the closed-form expression for weld shear strength calculation. Again, only
the critical failure locations (RHS corners) are of interest here. Taken from the ratio 𝐾 calculations,
the first parameter investigated is the local radius at the RHS corners, i.e., 𝑟𝑐 𝑡𝑏⁄ . It can be seen
that the normalized shear stress 𝜏𝑇𝑚(0) 𝜏𝑛⁄ reduces when 𝑟𝑐 𝑡𝑏⁄ increases, but exhibits a
significant scatter as shown in Figure 4.19. The results in Figure 4.19 suggest that other
dimensional parameters need to be considered.

102
Figure 4.19: Normalized shear stress at 0° weld throat plane vs local radius effect for RHS
One such a parameter can be defined as the ratio of the maximum distance from the fillet
weld toe to the cross-section centroid and the cross-section plate thickness, i.e., 𝐶𝑏,𝑚𝑎𝑥 𝑡𝑏⁄ , as
shown in Figure 4.11. The normalized shear stress 𝜏𝑇𝑚(0) 𝜏𝑛⁄ has higher values when the RHS
connection has larger 𝐶𝑏,𝑚𝑎𝑥 𝑡𝑏⁄ at the section corner, as shown in Figure 4.20.

103
Figure 4.20: Normalized shear stress at 0° weld throat plane vs 𝐶𝑏,𝑚𝑎𝑥/𝑡𝑏 for RHS
The two parameters, 𝑟𝑐 𝑡𝑏⁄ and 𝐶𝑏,𝑚𝑎𝑥/𝑡𝑏, have the opposite effect on 𝜏𝑇𝑚(0) at the RHS
corners. Therefore, a combination of the two could potentially provide a further improved
correlation. Indeed, an excellent correlation of 𝜏𝑇𝑚(0) can be obtained, as demonstrated in Figure
4.21, where the dimensionless parameter 𝜆2 as expressed in Eq. (4.11) is used. The corresponding
linear relationship between 𝜏𝑇𝑚(0) 𝜏𝑛⁄ and 𝜆2 can be expressed in Eq. (4.12).
𝜆2 =𝐶𝑏,𝑚𝑎𝑥 − 𝑟𝑐
𝑡𝑏 (4.11)
𝜏𝑇𝑚(0)
𝜏𝑛= 0.0225 × 𝜆2 + 1.0 (4.12)

104
Figure 4.21: Normalized shear stress at 0° weld throat plane vs 𝜆2 for RHS
A number of points are worth noting: (1) other parameters besides 𝜆2 such as weld size
effect are considered to be higher order and negligible in the above development; (2) parameter 𝜆2
is equal to 0 for the CHS connections (𝐶𝑏,𝑚𝑎𝑥 = 𝑟𝑐), leading to 𝜏𝑇𝑚(0) 𝜏𝑛⁄ = 1.0 according to Eq.
(4.12) as its lower bound, meaning that traction stress is uniformly distributed along weld in CHS,
which is in a good agreement with both the testing observations and FEA results (see Figure 4.13).
Therefore, similar to 𝜆1 and Eq. (4.10), both the parameter 𝜆2 and the closed-form expression
given by Eq. (4.12) possess a sufficient degree of generality and are applicable to both CHS and
RHS connections.
Finally, by placing Eqs. (4.10) and (4.12) into Eq. (4.6), the resulting closed-form
expression is given in Eq. (4.13), which can be used to calculate the maximum weld throat shear
stress (𝜏𝑢,𝑤) at the critical locations in either CHS-to-plate or RHS-to-plate structural joints under

105
remote load 𝑃𝑢 or to determine the minimum weld size 𝑠 required if weld shear strength 𝜏𝑢,𝑤 is
given.
𝜏𝑢,𝑤 =𝑃𝑢
𝑠×𝐿× (0.0225 × 𝜆2 + 1.0) × {cos 𝜃𝑚𝑎𝑥 − (−0.1089 ln 𝜆1 +
0.5) × sin 𝜃𝑚𝑎𝑥} × (cos 𝜃𝑚𝑎𝑥 + sin 𝜃𝑚𝑎𝑥)
𝜃𝑚𝑎𝑥 =1
2× tan−1 (
0.5 + 0.1089 ln 𝜆11.5 − 0.1089 ln 𝜆1
)
(4.13)
in which 𝐿 represents the total weld length carrying load.
4.4.2 Weld Effective Length in HSS-to-HSS Joints
To take full advantages of the analytical expression given in Eq. (4.13), weld length 𝐿
needs to be estimated for HSS-to-HSS welded joints, in which weld landing surface flexibility of
the chord member (see Figure 4.10b) has been shown to have a major effect on weld stress state
(Packer & Cassidy, 1995). Based on our evaluations of available methods, the authors of this study
propose to adopt “Weld Effective Lengths Method” used in AISC 360 (2010) for HSS-to-HSS
joints. The weld effective lengths method (WELM), which had been first recommended by Frater
& Packer (1992a, 1992b) and Packer & Cassidy (1995), is adopted by AISC 360 (2010) for taking
account of the weld landing surface flexibility effect in weld design for various HSS-to-HSS
connections. According to Packer and Henderson (1997), the effective load-carrying weld length,
𝐿𝑒, can be calculated by Eq. (4.14) for the HSS-to-HSS joints:
𝐿𝑒 =2𝐵𝑏sin 𝛼
(4.14)
Replacing the measured weld length 𝐿 in Eq. (4.13) by the effective weld length 𝐿𝑒 in Eq.
(4.14), Eq. (4.15) can be derived to calculate the maximum weld throat stress at the critical
locations for HSS-to-HSS joints.

106
𝜏𝑢,𝑤 =𝑃𝑢
𝑠×𝐿𝑒× (0.0225 × 𝜆2 + 1.0) × {cos 𝜃𝑚𝑎𝑥 − (−0.1089 ln 𝜆1 +
0.5) × sin 𝜃𝑚𝑎𝑥} × (cos 𝜃𝑚𝑎𝑥 + sin 𝜃𝑚𝑎𝑥)
𝜃𝑚𝑎𝑥 =1
2× tan−1 (
0.5 + 0.1089 ln 𝜆11.5 − 0.1089 ln 𝜆1
)
(4.15)
4.4.3 Ultimate Load Capacity Estimation
To validate the FEA results from the above sections, the estimated ultimate load capacity
(𝑃𝑛,𝑤) of the fillet welded HSS connections obtained from the generalized closed-form equations,
i.e., Eq. (4.13) for HSS-to-rigid-plate joints and Eq. (4.15) for HSS-to-HSS joints, are compared
to the actual failure loads (𝑃𝑢) obtained from the weld strength tests. In addition, Eqs. (4.13) and
(4.15) are compared to the traditional weld strength equations from the existing design
specifications, such as AISC 360 (AISC, 2010), CSA S16 (CSA, 2014), and Eurocode 3 (CEN,
2005), to demonstrate how much improvement they can provide. Note that the derivations of the
traditional weld strength equations can be found in the corresponding design specifications, thus
will not be demonstrated in this section due to space limit.
The test results of the CHS and RHS connections evaluated in this section are obtained
from the studies of Frater (1986), Packer and Cassidy (1995), Oatway (2014), and Tousignant
(2017), which attain various combinations of geometric properties (such as plate thickness and
cross section profile) and material properties (such as yield strength 𝑓𝑦𝑠 and ultimate strength 𝑓𝑢𝑡𝑠)
designed specifically for weld connection failure, as summarized in Table 4.1 and Table 4.2,
respectively.
Table 4.1: Geometric properties of HSS-to-plate and HSS-to-HSS connections
No. Type 𝑫 or 𝑩
mm
𝑫𝒃 or 𝑩𝒃
mm
𝒕
mm
𝒕𝒃
mm
𝒔
mm
𝑪𝒃,𝒎𝒂𝒙
mm
𝒓𝒄
mm
𝑷𝒖
kN
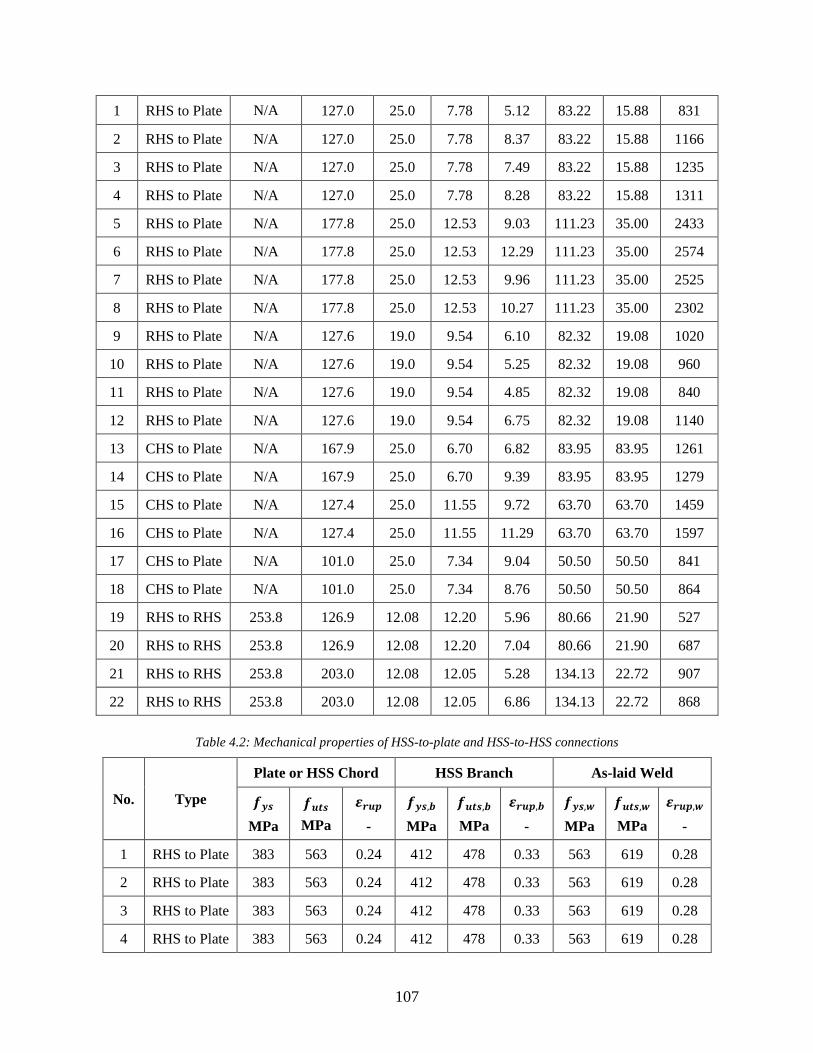
107
1 RHS to Plate N/A 127.0 25.0 7.78 5.12 83.22 15.88 831
2 RHS to Plate N/A 127.0 25.0 7.78 8.37 83.22 15.88 1166
3 RHS to Plate N/A 127.0 25.0 7.78 7.49 83.22 15.88 1235
4 RHS to Plate N/A 127.0 25.0 7.78 8.28 83.22 15.88 1311
5 RHS to Plate N/A 177.8 25.0 12.53 9.03 111.23 35.00 2433
6 RHS to Plate N/A 177.8 25.0 12.53 12.29 111.23 35.00 2574
7 RHS to Plate N/A 177.8 25.0 12.53 9.96 111.23 35.00 2525
8 RHS to Plate N/A 177.8 25.0 12.53 10.27 111.23 35.00 2302
9 RHS to Plate N/A 127.6 19.0 9.54 6.10 82.32 19.08 1020
10 RHS to Plate N/A 127.6 19.0 9.54 5.25 82.32 19.08 960
11 RHS to Plate N/A 127.6 19.0 9.54 4.85 82.32 19.08 840
12 RHS to Plate N/A 127.6 19.0 9.54 6.75 82.32 19.08 1140
13 CHS to Plate N/A 167.9 25.0 6.70 6.82 83.95 83.95 1261
14 CHS to Plate N/A 167.9 25.0 6.70 9.39 83.95 83.95 1279
15 CHS to Plate N/A 127.4 25.0 11.55 9.72 63.70 63.70 1459
16 CHS to Plate N/A 127.4 25.0 11.55 11.29 63.70 63.70 1597
17 CHS to Plate N/A 101.0 25.0 7.34 9.04 50.50 50.50 841
18 CHS to Plate N/A 101.0 25.0 7.34 8.76 50.50 50.50 864
19 RHS to RHS 253.8 126.9 12.08 12.20 5.96 80.66 21.90 527
20 RHS to RHS 253.8 126.9 12.08 12.20 7.04 80.66 21.90 687
21 RHS to RHS 253.8 203.0 12.08 12.05 5.28 134.13 22.72 907
22 RHS to RHS 253.8 203.0 12.08 12.05 6.86 134.13 22.72 868
Table 4.2: Mechanical properties of HSS-to-plate and HSS-to-HSS connections
No. Type
Plate or HSS Chord HSS Branch As-laid Weld
𝒇𝒚𝒔
MPa
𝒇𝒖𝒕𝒔
MPa
𝜺𝒓𝒖𝒑
-
𝒇𝒚𝒔,𝒃
MPa
𝒇𝒖𝒕𝒔,𝒃
MPa
𝜺𝒓𝒖𝒑,𝒃
-
𝒇𝒚𝒔,𝒘
MPa
𝒇𝒖𝒕𝒔,𝒘
MPa
𝜺𝒓𝒖𝒑,𝒘
-
1 RHS to Plate 383 563 0.24 412 478 0.33 563 619 0.28
2 RHS to Plate 383 563 0.24 412 478 0.33 563 619 0.28
3 RHS to Plate 383 563 0.24 412 478 0.33 563 619 0.28
4 RHS to Plate 383 563 0.24 412 478 0.33 563 619 0.28

108
5 RHS to Plate 383 563 0.24 380 489 0.33 563 619 0.28
6 RHS to Plate 383 563 0.24 380 489 0.33 563 619 0.28
7 RHS to Plate 383 563 0.24 380 489 0.33 563 619 0.28
8 RHS to Plate 383 563 0.24 380 489 0.33 563 619 0.28
9 RHS to Plate 351 558 0.36 426 500 N/A 634 687 0.24
10 RHS to Plate 351 558 0.36 426 500 N/A 634 687 0.24
11 RHS to Plate 351 558 0.36 426 500 N/A 634 687 0.24
12 RHS to Plate 351 558 0.36 426 500 N/A 641 739 0.24
13 CHS to Plate 409 566 0.24 421 501 0.31 501 571 0.26
14 CHS to Plate 409 566 0.24 421 501 0.31 501 571 0.26
15 CHS to Plate 409 566 0.24 431 488 0.35 501 571 0.26
16 CHS to Plate 409 566 0.24 431 488 0.35 501 571 0.26
17 CHS to Plate 409 566 0.24 385 450 0.35 501 571 0.26
18 CHS to Plate 409 566 0.24 385 450 0.35 501 571 0.26
19 RHS to RHS 410 - - 545 - - 471 574 0.30
20 RHS to RHS 410 - - 545 - - 471 574 0.30
21 RHS to RHS 410 - - 445 - - 471 574 0.30
22 RHS to RHS 410 - - 445 - - 471 574 0.30
4.4.3.1 AISC without Directional Strength-Increase Factor
Eq. (4.16), derived based on engineering shear stress (Eq. (4.1)), is used in AISC 360
(AISC, 2010) for calculating nominal load capacity (𝑃𝑛,𝑤) of fillet welds, in which the weld shear
strength is set as 𝜏𝑢,𝑤 = 0.60 × 𝑓𝑢𝑡𝑠,𝑤.
𝑃𝑛,𝑤 = 0.60 × 𝑓𝑢𝑡𝑠,𝑤 × (0.7071 × 𝑠 × 𝐿), for HSS-to-plate
𝑃𝑛,𝑤 = 0.60 × 𝑓𝑢𝑡𝑠,𝑤 × (0.7071 × 𝑠 × 𝐿𝑒), for HSS-to-HSS
(4.16)
The load capacity correlations between the AISC 360 (AISC, 2010) nominal value and test
results are summarized in Figure 4.22. It clearly shows that the predicted nominal loads poorly fit
the test data with coefficient of determination 𝑅2 = 0.58 and they are consistently under-predicted

109
by as much as 47% without even adding the design safety factor (𝜙 = 0.75) into consideration.
Therefore, following AISC (AISC, 2010) will cause the HSS connections severely over-welded.
Figure 4.22: Load capacity correlations between test results and AISC
4.4.3.2 CSA and AISC with Directional Strength-Increase Factor
Alternatively, both AISC 360 (AISC, 2010) and CSA S16 (CSA, 2014) permits the use of
directional strength-increase factor for the calculation of the nominal load capacity, as shown in
Eq. (4.17) and Eq. (4.18), respectively. Note that the weld shear strength is assumed as 𝜏𝑢,𝑤 =
0.67 × 𝑓𝑢𝑡𝑠,𝑤 in CSA S16 (CSA, 2014).
𝑃𝑛,𝑤 = 0.60𝑓𝑢𝑡𝑠,𝑤(0.7071 × 𝑠 × 𝐿) × (1.0 + 0.50 sin1.5 𝛼), for HSS-to-plate
𝑃𝑛,𝑤 = 0.60𝑓𝑢𝑡𝑠,𝑤(0.7071 × 𝑠 × 𝐿𝑒) × (1.0 + 0.50 sin1.5 𝛼), for HSS-to-HSS
(4.17)
𝑃𝑛,𝑤 = 0.67𝑓𝑢𝑡𝑠,𝑤(0.7071 × 𝑠 × 𝐿) × (1.0 + 0.50 sin1.5 𝛼), for HSS-to-plate
𝑃𝑛,𝑤 = 0.67𝑓𝑢𝑡𝑠,𝑤(0.7071 × 𝑠 × 𝐿𝑒) × (1.0 + 0.50 sin1.5 𝛼), for HSS-to-HSS
(4.18)
The correlation results of the equations above are shown in Figure 4.23 and Figure 4.24,
respectively, where load capacities are consistently over-estimated. The over-estimation will lead

110
to insufficient weld size causing immature connection fracture, and therefore should not be
accepted for design safety perspective.
Figure 4.23: Load capacity correlations between test results and AISC with directional strength-increase factor
Figure 4.24: Load capacity correlations between test results and CSA with directional strength-increase factor

111
4.4.3.3 Eurocode 3 CEN 1993-1-8
Following Eurocode 3 (CEN, 2005), the nominal load capacity can be calculated by Eq.
(4.19), in which the correlation factor for fillet welds, 𝛽𝑤, is taken as 0.9 according to Eurocode 3
(CEN, 2005).
𝑃𝑛,𝑤 =𝑓𝑢𝑡𝑠,𝑏
𝛽𝑤× (0.7071 × 𝑠 × 𝐿) , for HSS-to-plate
𝑃𝑛,𝑤 =𝑓𝑢𝑡𝑠,𝑏
𝛽𝑤× (0.7071 × 𝑠 × 𝐿𝑒) , for HSS-to-HSS
(4.19)
Similar to AISC 360 (AISC, 2010), Figure 4.25 clearly shows that Eurocode 3 also
consistently under-predicted the nominal load capacity even before adding the design safety factor
into consideration and the coefficient of determination is equal to 0.69 only.
Figure 4.25: Load capacity correlations between test results and Eurocode 3
4.4.3.4 TSM Estimated Load Capacity
Above all, the traditional weld failure criteria do not provide good load capacity
correlations between the estimated and test results. To improve the situation, authors in this study

112
follow the traction stress based weld strength criterion, take the FEA results into account, and
convert the generalized weld strength equation (i.e., Eqs. (4.13) & (4.15)) to Eq. (4.20) or Eq.
(4.21) for calculating HSS joints’ nominal load capacity, in which the nominal weld shear strength
is taken as 60% or 67% of its ultimate tensile strength (UTS) carried over from AISC 360 (AISC,
2010) or CSA S16 (CSA, 2014) respectively. Note that 𝜃𝑚𝑎𝑥 is a function of the parameter 𝜆1 (see
Eq. (4.13)).
𝑃𝑛,𝑤
=0.60 × 𝑓𝑢𝑡𝑠,𝑤 × 𝑠 × 𝐿
(0.0225 × 𝜆2 + 1.0)
×1
{cos 𝜃𝑚𝑎𝑥 − (−0.1089 ln 𝜆1 + 0.5) × sin 𝜃𝑚𝑎𝑥} × (cos 𝜃𝑚𝑎𝑥 + sin 𝜃𝑚𝑎𝑥)
𝑃𝑛,𝑤
=0.60 × 𝑓𝑢𝑡𝑠,𝑤 × 𝑠 × 𝐿𝑒(0.0225 × 𝜆2 + 1.0)
×1
{cos 𝜃𝑚𝑎𝑥 − (−0.1089 ln 𝜆1 + 0.5) × sin 𝜃𝑚𝑎𝑥} × (cos 𝜃𝑚𝑎𝑥 + sin 𝜃𝑚𝑎𝑥)
(4.20)
𝑃𝑛,𝑤
=0.67 × 𝑓𝑢𝑡𝑠,𝑤 × 𝑠 × 𝐿
(0.0225 × 𝜆2 + 1.0)
×1
{cos 𝜃𝑚𝑎𝑥 − (−0.1089 ln 𝜆1 + 0.5) × sin 𝜃𝑚𝑎𝑥} × (cos 𝜃𝑚𝑎𝑥 + sin 𝜃𝑚𝑎𝑥)
𝑃𝑛,𝑤
=0.67 × 𝑓𝑢𝑡𝑠,𝑤 × 𝑠 × 𝐿𝑒(0.0225 × 𝜆2 + 1.0)
×1
{cos 𝜃𝑚𝑎𝑥 − (−0.1089 ln 𝜆1 + 0.5) × sin 𝜃𝑚𝑎𝑥} × (cos 𝜃𝑚𝑎𝑥 + sin 𝜃𝑚𝑎𝑥)
(4.21)

113
(a)
(b)
Figure 4.26: Load capacity correlations between test results and TSM: (a) Nominal weld shear strength is set to
60% of its tested ultimate tensile strength; (b) Nominal weld shear strength is set to 67% of its tested ultimate tensile
strength

114
The load correlation results are present in Figure 4.26. By setting the nominal weld shear
strength to 60% (Figure 4.26a) and 67% (Figure 4.26b) of the tested UTS, the coefficient of
determination 𝑅2 is increased from 0.58 obtained from AISC 360 to 0.87 and 0.92 obtained from
Eq. (4.20) and Eq. (4.21), respectively. The load correlation improvement by TSM is as much as
60% compared to the traditional weld failure criteria, which can significantly reduce the design
fillet weld size for the lightweight HSS connections.
4.4.4 Weld Sizing Criterion
The proposed weld sizing criterion for the HSS connections, as expressed in Eq. (4.22), is
derived from both the traction stress method approach and the FEA study as described in the
previous sections.
𝑠
𝑡𝑏=𝑓𝑢𝑡𝑠,𝑏𝜏𝑢,𝑤
× (0.0225 × 𝜆2 + 1.0) × (cos 𝜃𝑚𝑎𝑥 + sin 𝜃𝑚𝑎𝑥)
× {cos 𝜃𝑚𝑎𝑥 − (−0.1089 ln 𝜆1 + 0.5) × sin 𝜃𝑚𝑎𝑥}
(4.22)
The weld sizing comparison for the HSS joints tested in the studies of Frater (1986), Packer
and Cassidy (1995), Oatway (2014), and Tousignant (2017) shows that Eq. (4.22) can provide a
weld size reduction up to about 23% compared to Eq. (4.2), as shown in Table 4.3.
Table 4.3: Weld size reduction from Eq. (4.2) by Eq. (4.22)
No. Type 𝑫 or 𝑩
mm
𝑫𝒃 or 𝑩𝒃
mm
𝒕
mm
𝒕𝒃
mm
𝑪𝒃,𝒎𝒂𝒙
mm
𝒓𝒄
mm
Weld size
reduction, %
1 RHS to Plate N/A 127.0 25.0 7.78 83.22 15.88 11%
2 RHS to Plate N/A 177.8 25.0 12.53 111.23 35.00 15%
3 RHS to Plate N/A 127.6 19.0 9.54 82.32 19.08 15%
4 CHS to Plate N/A 167.9 25.0 6.70 83.95 83.95 21%
5 CHS to Plate N/A 127.4 25.0 11.55 63.70 63.70 23%
6 CHS to Plate N/A 101.0 25.0 7.34 50.50 50.50 23%

115
7 RHS to RHS 253.8 126.9 12.08 12.20 80.66 21.90 18%
8 RHS to RHS 253.8 203.0 12.08 12.05 134.13 22.72 10%
4.5 Conclusions
The major conclusions and key findings of this chapter are summarized as follows:
1. A closed-form expression (Eq. (4.13)) with a clear mechanics underpinning has been
developed to relate weld throat stress to weld size and remote loading for CHS and
RHS structural joints, which can be conveniently used to estimate load capacity under
a given weld shear strength or perform quantitative weld sizing under a specified
remote load.
2. Ultimate load capacity correlations of available CHS and RHS test data show that the
proposed method provides up to about 60% improvement over existing methods in
Codes and Standards.
3. With the proposed weld sizing criterion given in Eq. (4.22), the results show that a
reduction of weld size can be as much as about 23% from those determined by using
existing weld sizing criteria, which can be very beneficial for control of welding-
induced distortions in construction of thin-wall HSS structures.

116
Chapter 5 Discussion
A traction stress based analytical shear strength model for load-carrying fillet-welded
connections has been proposed in Chapter 2 and is further completed by incorporating nonlinear
effects in Chapter 3. Its effectiveness has been proven through the great correlation of both shear
strength and failure angle between the analytical and test results obtained from a comprehensive
test program of standard fillet-welded longitudinal and transverse shear specimens made of steel.
In Chapter 4, the structural-level application of the analytical shear strength model has been
demonstrated by successfully correlating the predicted failure load and those measured from test
data of large-scale steel hollow structural section connections available from literature. Note that
all the theoretical developments in the previous chapters are solely dependent on joint geometry
and independent of materials. Therefore, it is worth further validating the findings by test data
obtained from different materials, such as aluminum alloys and titanium alloys.
In addition, some important factors observed from the test data, such as weld size and weld
penetration, are showing effects on the analytical shear strength model and being discussed about
how to incorporate them in this chapter.
Finally, a generalized quantitative weld sizing criterion is proposed here and proven
effective for a significant weld size reduction without compromising structural safety, which is
very beneficial for welding-induced distortion control in the construction of lightweight ship
structures.

117
5.1 Aluminum Alloys
To verify the generality of the proposed theoretical developments with respect to different
materials other than steel, a total of 80 standard longitudinal and transverse shear specimens made
of aluminum alloys designed and fabricated according to AWS B4.0 (AWS, 2007) (refer to Figure
2.1) have been tested in this study. Major ship hull aluminum grades with matching filler materials
and associated welding processes were considered. Nominal fillet weld leg size varied from 1/8”
(3 mm) to 3/8” (10 mm). A summary of the tested aluminum alloys specimens used in this study
is given in Table 5.1.
Table 5.1: Aluminum alloys shear specimens tested in this study
Shear strength test data are calculated using conventional method (Eq. (1.1)), traction stress
method (Eq. (2.7) & Eq. (2.13)), and traction stress method incorporating nonlinear effects (Eq.
(3.7) & Eq. (3.8)), respectively, as seen in Figure 5.1 and Figure 5.2. Figure 5.1 shows that: (1) the
averaged weld strength discrepancy of AL 5456 (GMAW with 5556 weld wire) is about 14 ksi,
i.e., longitudinal shear strength is only about 62% of transverse shear strength when using the
traditional AWS shear strength equation; (2) the weld strength correlation is much improved by
traction stress method that longitudinal shear strength is about 88% of transverse shear strength;
and (3) further reduction of the discrepancy, i.e., unified shear strength, can be achieved by
incorporating the nonlinear effects into traction stress method. Similarly, Figure 5.2 shows that the

118
averaged weld strength discrepancy of AL 6082 (GMAW with 5183 weld wire) is reduced from
35% when using traditional AWS shear strength equation to 12% by traction stress method, and
eventually improved down to less than 3% when nonlinear effects are considered in traction stress
based shear strength equations (Eqs. (3.7) & (3.8)). The same trend can be observed in the rest of
test groups given in Table 5.1 and will be demonstrated in Appendix D.
(a)
(b)

119
(c)
Figure 5.1: Comparison of shear strengths between longitudinal and transverse shear specimens of AL 5456 with
GMAW and 5556 weld wire: (a) AWS traditional equation; (b) traction stress method; (c) traction stress method
with nonlinear effects
(a)

120
(b)
(c)
Figure 5.2: Comparison of shear strengths between longitudinal and transverse shear specimens of AL 6082 with
GMAW and 5183 weld wire: (a) AWS traditional equation; (b) traction stress method; (c) traction stress method
with nonlinear effects
5.2 Titanium Alloys
To complete the generality verification of the proposed theoretical developments with
respect to different materials, a total of 72 standard longitudinal and transverse shear specimens
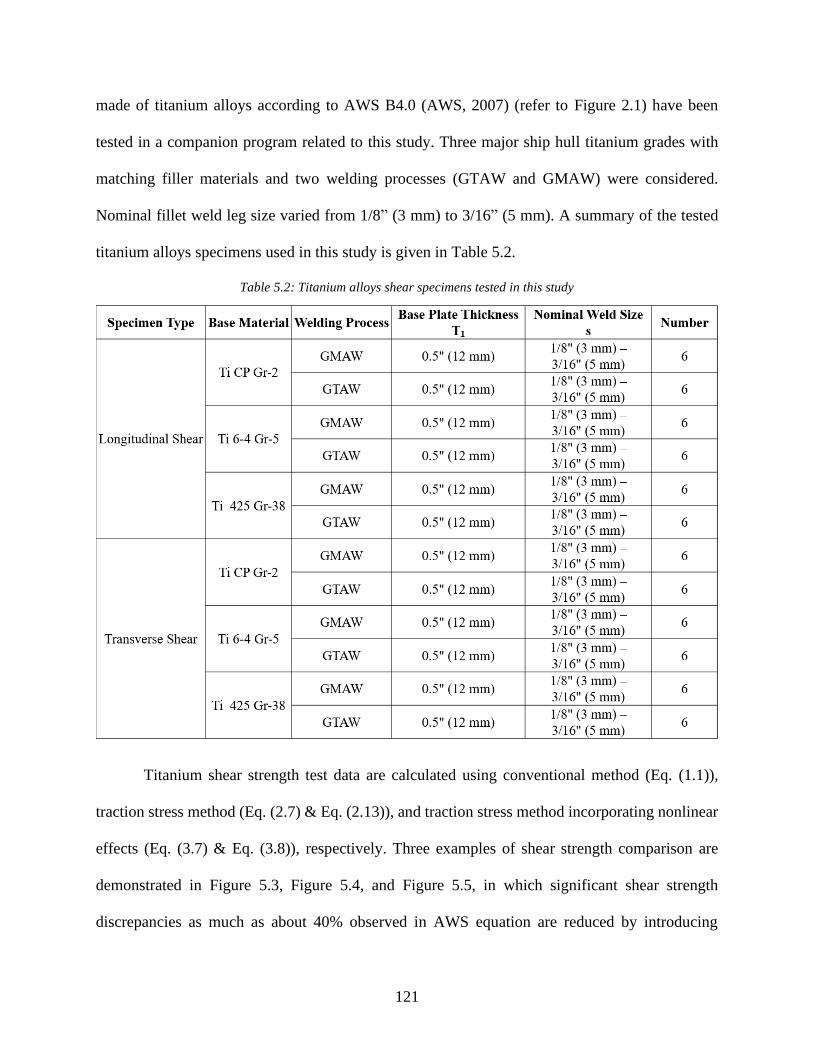
121
made of titanium alloys according to AWS B4.0 (AWS, 2007) (refer to Figure 2.1) have been
tested in a companion program related to this study. Three major ship hull titanium grades with
matching filler materials and two welding processes (GTAW and GMAW) were considered.
Nominal fillet weld leg size varied from 1/8” (3 mm) to 3/16” (5 mm). A summary of the tested
titanium alloys specimens used in this study is given in Table 5.2.
Table 5.2: Titanium alloys shear specimens tested in this study
Titanium shear strength test data are calculated using conventional method (Eq. (1.1)),
traction stress method (Eq. (2.7) & Eq. (2.13)), and traction stress method incorporating nonlinear
effects (Eq. (3.7) & Eq. (3.8)), respectively. Three examples of shear strength comparison are
demonstrated in Figure 5.3, Figure 5.4, and Figure 5.5, in which significant shear strength
discrepancies as much as about 40% observed in AWS equation are reduced by introducing

122
traction stress based shear strength definition and unified strength values can be obtained when
nonlinear effects are considered for all Ti 6-4, Ti CP and Ti 425 materials. The full test data are
shown in Appendix E.
Above all, through these comprehensive static strength testing programs, traction stress
based shear strength definition and weld failure criterion have been proven effective among all
common materials used in ship structures such as mild steel, high strength steel, aluminum alloys
and titanium alloys.
(a)

123
(b)
(c)
Figure 5.3: Comparison of shear strengths between longitudinal and transverse shear specimens of Ti 6-4 with
GTAW: (a) AWS traditional equation; (b) traction stress method; (c) traction stress method with nonlinear effects

124
(a)
(b)

125
(c)
Figure 5.4: Comparison of shear strengths between longitudinal and transverse shear specimens of Ti CP with
GMAW: (a) AWS traditional equation; (b) traction stress method; (c) traction stress method with nonlinear effects
(a)
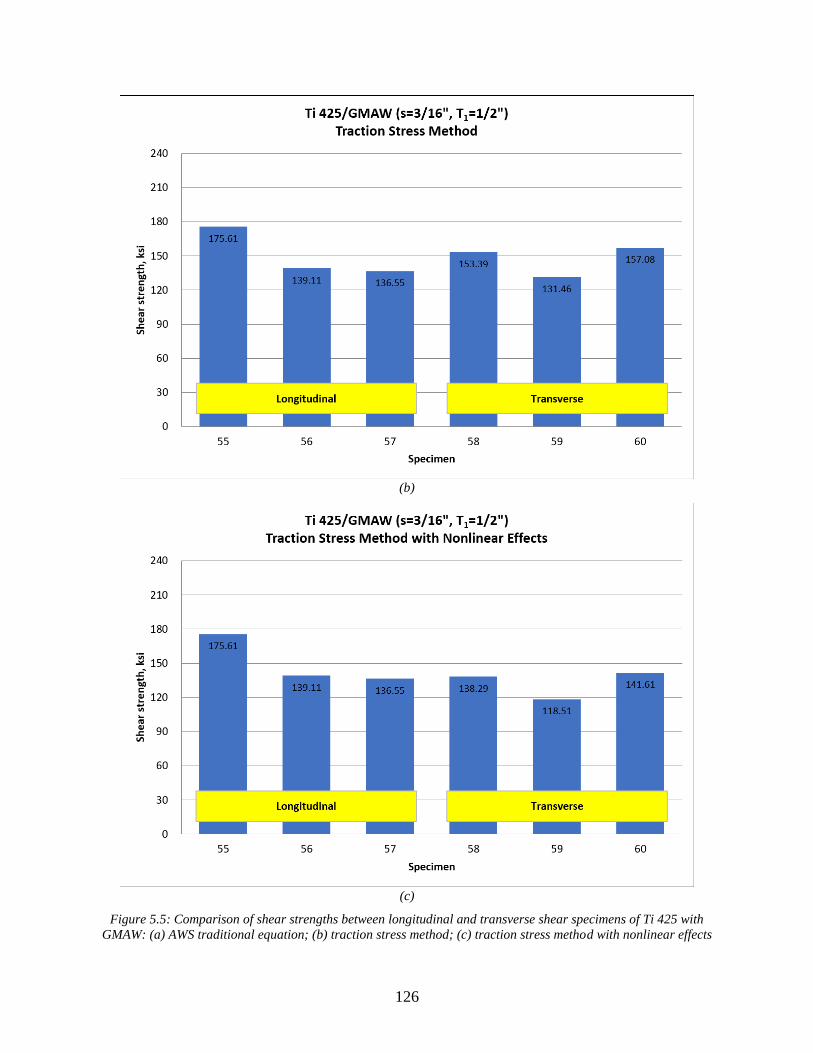
126
(b)
(c)
Figure 5.5: Comparison of shear strengths between longitudinal and transverse shear specimens of Ti 425 with
GMAW: (a) AWS traditional equation; (b) traction stress method; (c) traction stress method with nonlinear effects

127
5.3 Weld Size Effects
Further examinations are done for the fractured shear specimens. Some major weld size
effects are observed: (1) weld penetrations, 𝑠𝑝 as shown in Figure 5.6, are present in the shear
strength specimens tested in this study and have a clear dependency to the weld size 𝑠; (2) weld
shear strengths are also affected by weld size, i.e., shear strengths have higher values in smaller
weld sizes than those of larger weld sizes given the same base material and welding process.
Figure 5.6: Weld penetration in load-carrying fillet weld
As seen in Figure 5.7, over 180 specimens with five combinations of base material and
welding process, normalized weld penetration percent, defined as 𝑠𝑝 𝑠⁄ , increases when weld size
gets smaller. For quantitatively including this effect into weld sizing criterion, a linear regression
equation is derived as expressed in Eq. (5.1).
𝑠𝑝
𝑠= −0.025𝑠 + 0.311 (5.1)
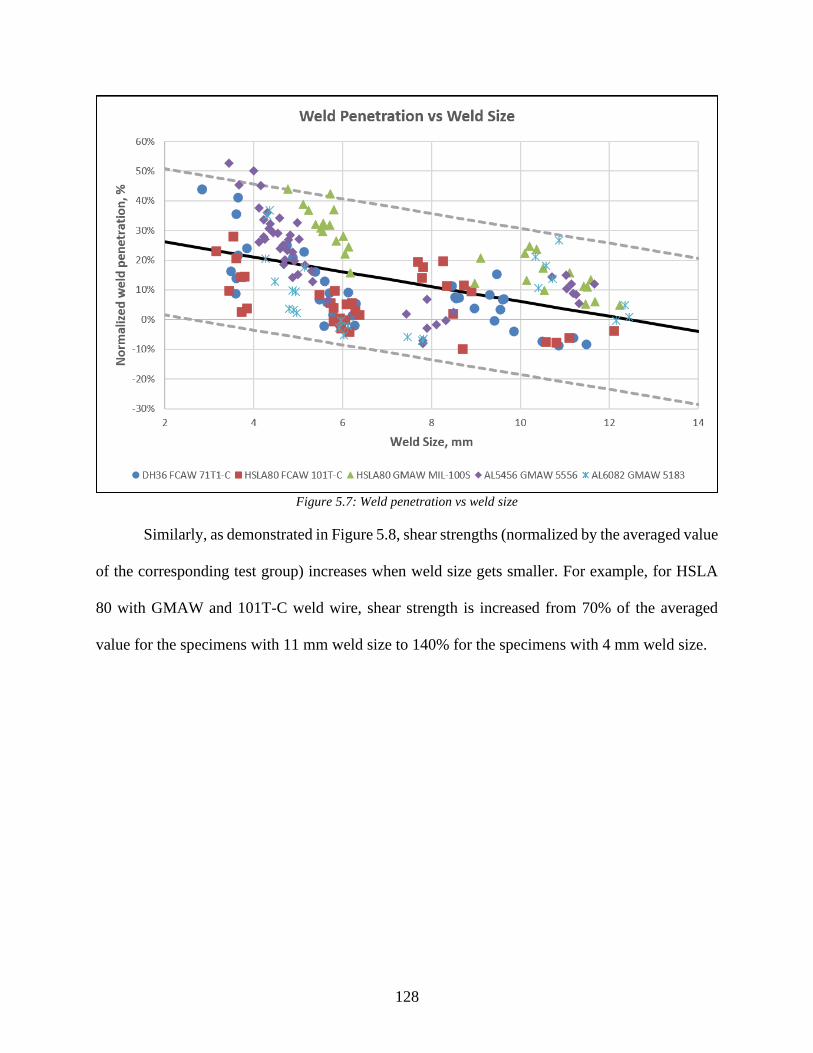
128
Figure 5.7: Weld penetration vs weld size
Similarly, as demonstrated in Figure 5.8, shear strengths (normalized by the averaged value
of the corresponding test group) increases when weld size gets smaller. For example, for HSLA
80 with GMAW and 101T-C weld wire, shear strength is increased from 70% of the averaged
value for the specimens with 11 mm weld size to 140% for the specimens with 4 mm weld size.

129
Figure 5.8: Shear strength vs weld size
A further investigation shows that the weld size effect on the shear strength is possibly
caused by the material hardening and tempering process. Smaller weld leg size specimens cooled
down very quickly causing hardening process, while larger weld leg size specimens were often
multi-pass welded which required re-heating the specimens causing tempering process. Hardness
tests have conducted for 1/8” (3 mm) and 3/8’ (10 mm) welds to validate the hypothesis above,
which indeed demonstrated that 1/8’ weld has higher Vickers hardness number than 3/8” weld, as
shown in Figure 5.9.
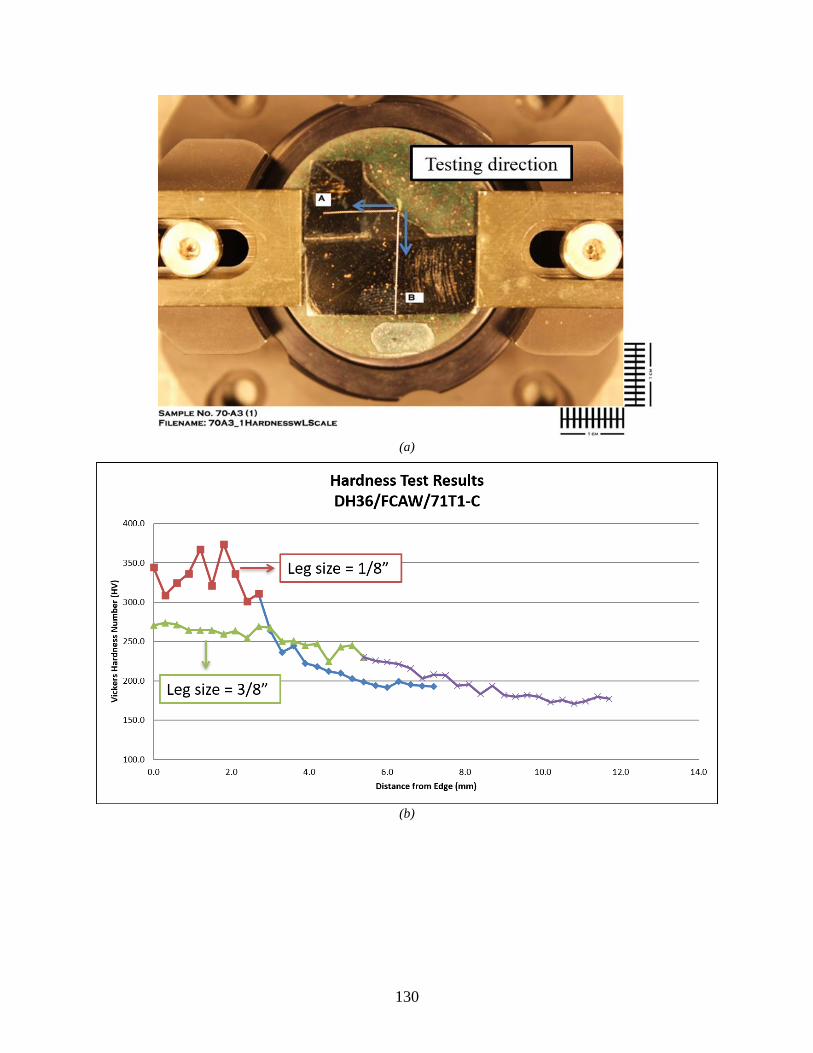
130
(a)
(b)

131
(c)
Figure 5.9: Hardness test for weld with different size: (a) hardness test procedure; (b) hardness test results for
DH36 with FCAW & 71T1-C; (c) hardness test results for HSLA80 with FCAW & 101T-C
A linear regression equation is derived based over 180 specimens with five combinations
of base material and welding process, as expressed in Eq. (5.2), for including this strength increase
effect into weld sizing criterion.
𝜏% = −0.0263𝑠 + 1.1935 (5.2)
Note that both Eqs. (5.1) and (5.2) are derived based on the results of design weld size from
1/8” (3 mm) to 3/8” (10 mm) in this study , which are made strictly according to AWS D1.1 (AWS,
2015). Further investigation and more data correlation are needed to prove their effectiveness. For
the time being, one should pay extra attention when implementing them into weld sizing.
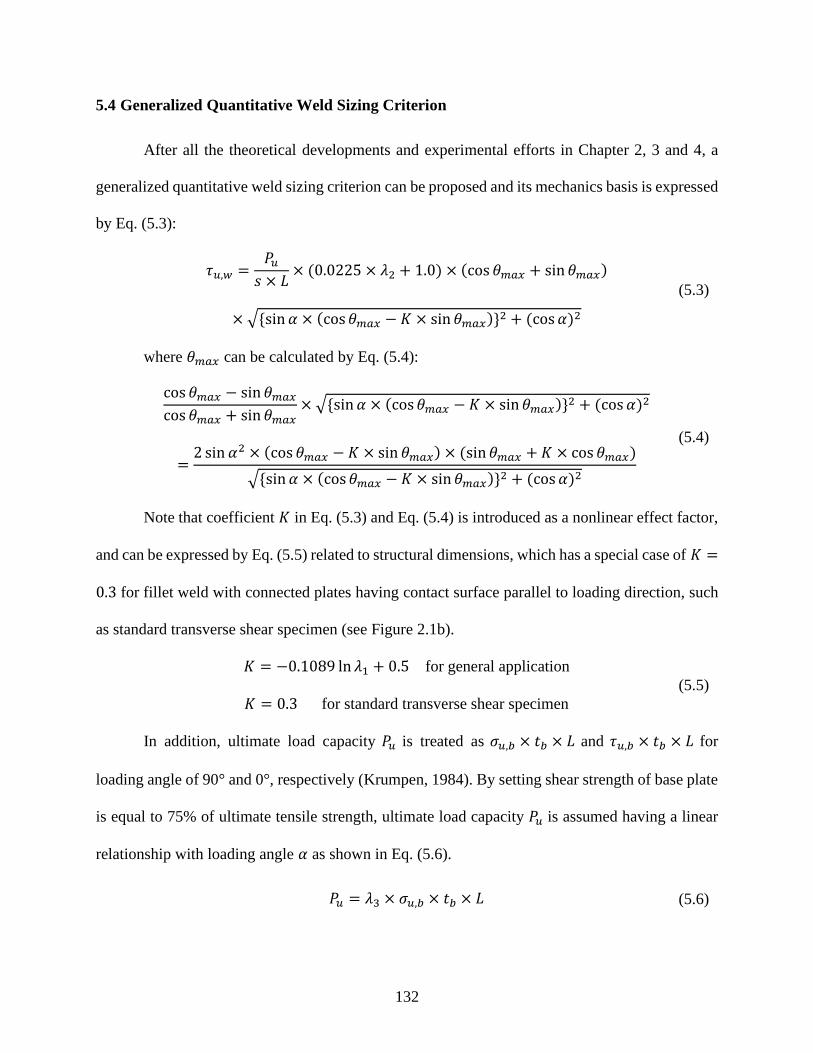
132
5.4 Generalized Quantitative Weld Sizing Criterion
After all the theoretical developments and experimental efforts in Chapter 2, 3 and 4, a
generalized quantitative weld sizing criterion can be proposed and its mechanics basis is expressed
by Eq. (5.3):
𝜏𝑢,𝑤 =𝑃𝑢𝑠 × 𝐿
× (0.0225 × 𝜆2 + 1.0) × (cos 𝜃𝑚𝑎𝑥 + sin 𝜃𝑚𝑎𝑥)
× √{sin 𝛼 × (cos 𝜃𝑚𝑎𝑥 − 𝐾 × sin 𝜃𝑚𝑎𝑥)}2 + (cos𝛼)2
(5.3)
where 𝜃𝑚𝑎𝑥 can be calculated by Eq. (5.4):
cos 𝜃𝑚𝑎𝑥 − sin 𝜃𝑚𝑎𝑥cos 𝜃𝑚𝑎𝑥 + sin 𝜃𝑚𝑎𝑥
× √{sin 𝛼 × (cos 𝜃𝑚𝑎𝑥 − 𝐾 × sin 𝜃𝑚𝑎𝑥)}2 + (cos 𝛼)2
=2 sin 𝛼2 × (cos 𝜃𝑚𝑎𝑥 − 𝐾 × sin 𝜃𝑚𝑎𝑥) × (sin 𝜃𝑚𝑎𝑥 +𝐾 × cos 𝜃𝑚𝑎𝑥)
√{sin 𝛼 × (cos 𝜃𝑚𝑎𝑥 − 𝐾 × sin 𝜃𝑚𝑎𝑥)}2 + (cos𝛼)2
(5.4)
Note that coefficient 𝐾 in Eq. (5.3) and Eq. (5.4) is introduced as a nonlinear effect factor,
and can be expressed by Eq. (5.5) related to structural dimensions, which has a special case of 𝐾 =
0.3 for fillet weld with connected plates having contact surface parallel to loading direction, such
as standard transverse shear specimen (see Figure 2.1b).
𝐾 = −0.1089 ln 𝜆1 + 0.5 for general application
𝐾 = 0.3 for standard transverse shear specimen
(5.5)
In addition, ultimate load capacity 𝑃𝑢 is treated as 𝜎𝑢,𝑏 × 𝑡𝑏 × 𝐿 and 𝜏𝑢,𝑏 × 𝑡𝑏 × 𝐿 for
loading angle of 90° and 0°, respectively (Krumpen, 1984). By setting shear strength of base plate
is equal to 75% of ultimate tensile strength, ultimate load capacity 𝑃𝑢 is assumed having a linear
relationship with loading angle 𝛼 as shown in Eq. (5.6).
𝑃𝑢 = 𝜆3 × 𝜎𝑢,𝑏 × 𝑡𝑏 × 𝐿 (5.6)
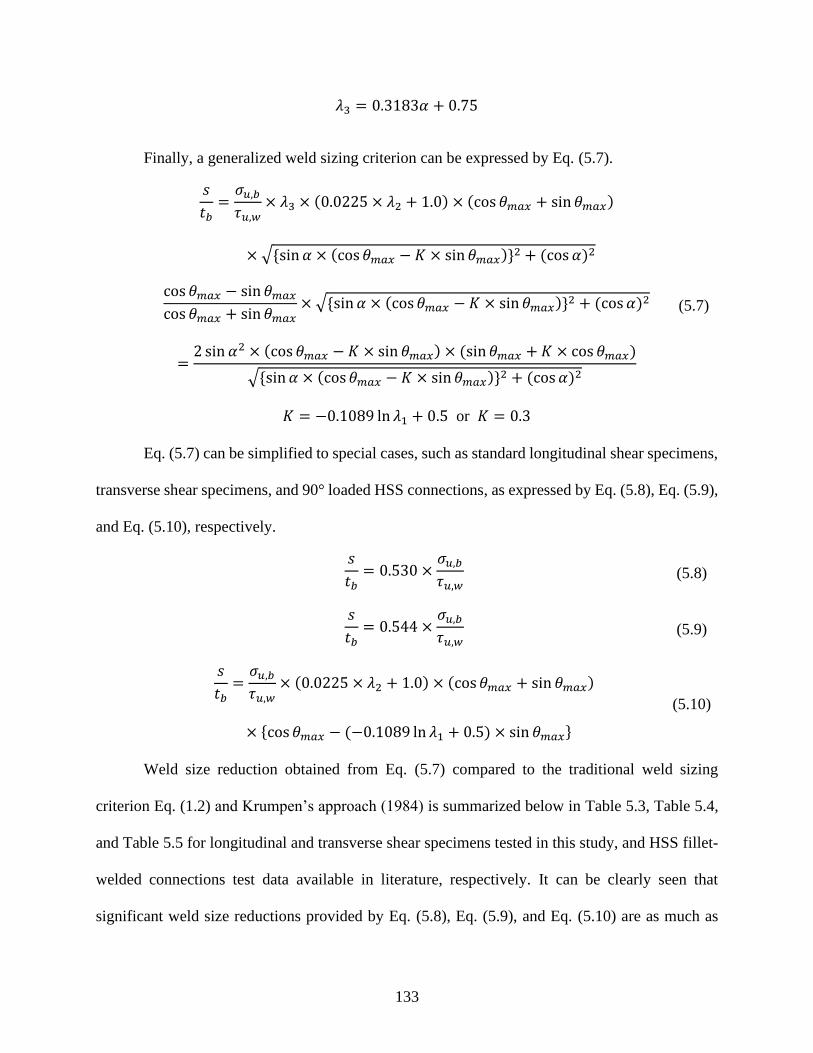
133
𝜆3 = 0.3183𝛼 + 0.75
Finally, a generalized weld sizing criterion can be expressed by Eq. (5.7).
𝑠
𝑡𝑏=𝜎𝑢,𝑏𝜏𝑢,𝑤
× 𝜆3 × (0.0225 × 𝜆2 + 1.0) × (cos 𝜃𝑚𝑎𝑥 + sin 𝜃𝑚𝑎𝑥)
× √{sin 𝛼 × (cos 𝜃𝑚𝑎𝑥 − 𝐾 × sin 𝜃𝑚𝑎𝑥)}2 + (cos 𝛼)2
cos 𝜃𝑚𝑎𝑥 − sin 𝜃𝑚𝑎𝑥cos 𝜃𝑚𝑎𝑥 + sin 𝜃𝑚𝑎𝑥
× √{sin 𝛼 × (cos 𝜃𝑚𝑎𝑥 − 𝐾 × sin 𝜃𝑚𝑎𝑥)}2 + (cos 𝛼)2
=2 sin 𝛼2 × (cos 𝜃𝑚𝑎𝑥 − 𝐾 × sin 𝜃𝑚𝑎𝑥) × (sin 𝜃𝑚𝑎𝑥 +𝐾 × cos 𝜃𝑚𝑎𝑥)
√{sin 𝛼 × (cos 𝜃𝑚𝑎𝑥 − 𝐾 × sin 𝜃𝑚𝑎𝑥)}2 + (cos𝛼)2
𝐾 = −0.1089 ln 𝜆1 + 0.5 or 𝐾 = 0.3
(5.7)
Eq. (5.7) can be simplified to special cases, such as standard longitudinal shear specimens,
transverse shear specimens, and 90° loaded HSS connections, as expressed by Eq. (5.8), Eq. (5.9),
and Eq. (5.10), respectively.
𝑠
𝑡𝑏= 0.530 ×
𝜎𝑢,𝑏𝜏𝑢,𝑤
(5.8)
𝑠
𝑡𝑏= 0.544 ×
𝜎𝑢,𝑏𝜏𝑢,𝑤
(5.9)
𝑠
𝑡𝑏=𝜎𝑢,𝑏𝜏𝑢,𝑤
× (0.0225 × 𝜆2 + 1.0) × (cos 𝜃𝑚𝑎𝑥 + sin 𝜃𝑚𝑎𝑥)
× {cos 𝜃𝑚𝑎𝑥 − (−0.1089 ln 𝜆1 + 0.5) × sin 𝜃𝑚𝑎𝑥}
(5.10)
Weld size reduction obtained from Eq. (5.7) compared to the traditional weld sizing
criterion Eq. (1.2) and Krumpen’s approach (1984) is summarized below in Table 5.3, Table 5.4,
and Table 5.5 for longitudinal and transverse shear specimens tested in this study, and HSS fillet-
welded connections test data available in literature, respectively. It can be clearly seen that
significant weld size reductions provided by Eq. (5.8), Eq. (5.9), and Eq. (5.10) are as much as

134
about 40% for standard longitudinal and transverse shear specimens tested in this study, and about
20% for HSS fillet-welded connections test data available from literature. Note that weld size
effect on weld penetration could further reduce design fillet weld size, i.e., including Eq. (5.1) to
Eq. (5.7), as expressed by Eq. (5.11). Further investigation will be conduct on this area. Overall,
the proposed generalized weld sizing criterion would be very beneficial for welding-induced
distortion control in the construction of lightweight ship structures.
𝑠 + 𝑠𝑝
𝑡𝑏=𝜎𝑢,𝑏𝜏𝑢,𝑤
× 𝜆3 × (0.0225 × 𝜆2 + 1.0) × (cos 𝜃𝑚𝑎𝑥 + sin 𝜃𝑚𝑎𝑥)
× √{sin 𝛼 × (cos 𝜃𝑚𝑎𝑥 − 𝐾 × sin 𝜃𝑚𝑎𝑥)}2 + (cos 𝛼)2
cos 𝜃𝑚𝑎𝑥 − sin 𝜃𝑚𝑎𝑥cos 𝜃𝑚𝑎𝑥 + sin 𝜃𝑚𝑎𝑥
× √{sin 𝛼 × (cos 𝜃𝑚𝑎𝑥 − 𝐾 × sin 𝜃𝑚𝑎𝑥)}2 + (cos 𝛼)2
=2 sin 𝛼2 × (cos 𝜃𝑚𝑎𝑥 − 𝐾 × sin 𝜃𝑚𝑎𝑥) × (sin 𝜃𝑚𝑎𝑥 + 𝐾 × cos 𝜃𝑚𝑎𝑥)
√{sin 𝛼 × (cos 𝜃𝑚𝑎𝑥 − 𝐾 × sin 𝜃𝑚𝑎𝑥)}2 + (cos 𝛼)2
𝐾 = −0.1089 ln 𝜆1 + 0.5 or 𝐾 = 0.3
(5.11)

135
Table 5.3: Weld size reduction from traditional approach (Eq. (1.2) )by proposed weld sizing criterion (Eq. (5.7) for longitudinal shear specimens
Sp
ecim
en T
yp
e
Base
Mate
rial
Base
Mate
rial
UT
S, 𝝈𝒖,𝒃
Wel
din
g P
roce
ss
Fil
ler
Mate
rial
Sh
ear
Str
ength
by A
WS
, 𝝉𝒖,𝒘𝑳
Sh
ear
Str
ength
b
y T
SM
, 𝝉𝒖,𝒘
Wel
d S
ize 𝒔 𝒕 𝒃
by E
q. (1
.2)
Wel
d S
ize 𝒔 𝒕 𝒃
by K
rum
pen
Wel
d S
ize 𝒔 𝒕 𝒃
by T
SM
Eq
. (5
.7)
Wel
d S
ize
Red
uct
ion
from
Eq
. (1
.2)
Wel
d S
ize
Red
uct
ion
from
Kru
mp
en
Longitudinal
DH36 71 ksi
(490 MPa) FCAW 71T1-C 65 ksi 86 ksi 0.772 0.579 0.438 43% 24%
HSLA80 96 ksi
(660 MPa) FCAW 101T-C 76 ksi 96 ksi 0.893 0.670 0.530 41% 21%
HSLA80 96 ksi
(660 MPa) GMAW MIL-100S 78 ksi 93 ksi 0.870 0.653 0.547 37% 16%
AL 5456 51 ksi
(350 MPa) GMAW AL 5556 23 ksi 27 ksi 1.568 1.176 1.001 36% 15%
AL 6082 45 ksi
(450 MPa) GMAW AL 5183 20 ksi 23 ksi 1.591 1.193 1.037 35% 13%
Ti-64 Gr-2 138 ksi
(950 MPa) GTAW Ti-64 94 ksi 106 ksi 1.038 0.779 0.690 34% 11%
Ti-CP Gr-5 62 ksi
(430 MPa) GMAW Ti-CP 61 ksi 67 ksi 0.719 0.539 0.490 32% 9%
Ti-CP Gr-5 62 ksi
(430 MPa) GTAW Ti-CP 54 ksi 61 ksi 0.812 0.609 0.539 34% 12%
Ti-425 Gr-38 146 ksi
(1010 MPa) GMAW Ti-425 115 ksi 122 ksi 0.898 0.673 0.634 29% 6%
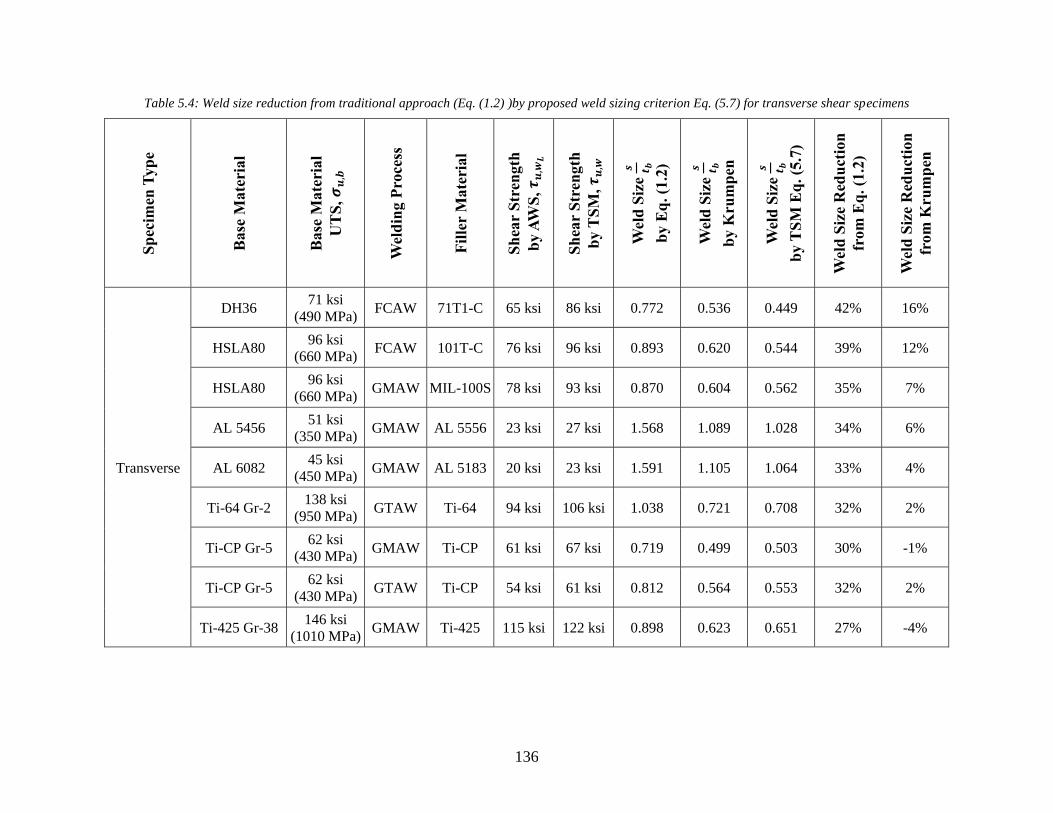
136
Table 5.4: Weld size reduction from traditional approach (Eq. (1.2) )by proposed weld sizing criterion Eq. (5.7) for transverse shear specimens
Sp
ecim
en T
yp
e
Base
Mate
rial
Base
Mate
rial
UT
S, 𝝈𝒖,𝒃
Wel
din
g P
roce
ss
Fil
ler
Mate
rial
Sh
ear
Str
ength
by A
WS
, 𝝉𝒖,𝒘𝑳
Sh
ear
Str
ength
b
y T
SM
, 𝝉𝒖,𝒘
Wel
d S
ize 𝒔 𝒕 𝒃
by E
q. (1
.2)
Wel
d S
ize 𝒔 𝒕 𝒃
by K
rum
pen
Wel
d S
ize 𝒔 𝒕 𝒃
by T
SM
Eq
. (5
.7)
Wel
d S
ize
Red
uct
ion
from
Eq
. (1
.2)
Wel
d S
ize
Red
uct
ion
from
Kru
mp
en
Transverse
DH36 71 ksi
(490 MPa) FCAW 71T1-C 65 ksi 86 ksi 0.772 0.536 0.449 42% 16%
HSLA80 96 ksi
(660 MPa) FCAW 101T-C 76 ksi 96 ksi 0.893 0.620 0.544 39% 12%
HSLA80 96 ksi
(660 MPa) GMAW MIL-100S 78 ksi 93 ksi 0.870 0.604 0.562 35% 7%
AL 5456 51 ksi
(350 MPa) GMAW AL 5556 23 ksi 27 ksi 1.568 1.089 1.028 34% 6%
AL 6082 45 ksi
(450 MPa) GMAW AL 5183 20 ksi 23 ksi 1.591 1.105 1.064 33% 4%
Ti-64 Gr-2 138 ksi
(950 MPa) GTAW Ti-64 94 ksi 106 ksi 1.038 0.721 0.708 32% 2%
Ti-CP Gr-5 62 ksi
(430 MPa) GMAW Ti-CP 61 ksi 67 ksi 0.719 0.499 0.503 30% -1%
Ti-CP Gr-5 62 ksi
(430 MPa) GTAW Ti-CP 54 ksi 61 ksi 0.812 0.564 0.553 32% 2%
Ti-425 Gr-38 146 ksi
(1010 MPa) GMAW Ti-425 115 ksi 122 ksi 0.898 0.623 0.651 27% -4%

137
Table 5.5: Weld size reduction from traditional approach (Eq. (1.2) )by proposed weld sizing criterion Eq. (5.7) for HSS connections from literature
No. Type 𝑫 or 𝑩
mm
𝑫𝒃 or 𝑩𝒃
mm
𝒕
mm
𝒕𝒃
mm
𝑪𝒃,𝒎𝒂𝒙
mm
𝒓𝒄
mm
Weld Size Reduction
from Eq. (1.2) by Eq. (5.7), %
1 RHS to Plate N/A 127.0 25.0 7.78 83.22 15.88 11%
2 RHS to Plate N/A 177.8 25.0 12.53 111.23 35.00 15%
3 RHS to Plate N/A 127.6 19.0 9.54 82.32 19.08 15%
4 CHS to Plate N/A 167.9 25.0 6.70 83.95 83.95 21%
5 CHS to Plate N/A 127.4 25.0 11.55 63.70 63.70 23%
6 CHS to Plate N/A 101.0 25.0 7.34 50.50 50.50 23%
7 RHS to RHS 253.8 126.9 12.08 12.20 80.66 21.90 18%
8 RHS to RHS 253.8 203.0 12.08 12.05 134.13 22.72 10%

138
Chapter 6 Conclusions and Future Work
6.1 Major Contributions
To enable an effective connection design and construction of lightweight ship structures, a
quantitative weld sizing criterion has been established through analytical and computational
modeling, and detailed experimental validations. The major contributions resulted from this study
can be summarized as follows:
1. A new effective traction shear stress based failure criterion has been analytically
formulated for fillet-welded components without needing differentiating longitudinal
versus transverse shear loading conditions. The new failure criterion not only predicts
the correct weld throat failure plane, but also provides an effective means for a unified
shear strength definition regardless of joint specimen types used (i.e., longitudinal
versus transverse shear specimens), as proven by a large number of fillet-welded
specimen tests performed within this study.
2. The developed failure criterion and its mechanics underpinning can now reconcile the
discrepancies between the test results obtained from standardized longitudinal and
transverse shear specimens (e.g., by AWS B4.0 used by class societies), which have
puzzled researchers and engineers for decades. Furthermore, the new failure criterion
can significantly simplify the existing test requirements for establishing fillet weld
shear strengths through standardized fillet-welded specimen testing. As such, the
standard transverse shear specimens are the only specimen type that is needed,

139
potentially reducing test cost by at least 60%-70% by eliminating the high fabrication
and testing costs associated with the longitudinal shear specimens for joint design.
3. In addition to support the validation of various aspects of the new failure criterion
developed, a comprehensive fillet weld strength database has been established through
a systematic experimental testing of welded connections with a wide range of base
metals (mild steel, high strength steel, aluminum alloys, and titanium alloys), welding
processes (FCAW, GMAW, and GTAW), and weld wires (71T1-C, 101T-C, and MIL-
100S, etc.). Furthermore, longitudinal and transverse shear specimens tested in this
study considered base plate thickness varying from 0.5” (12 mm) to 1” (25 mm), and
weld sizes from 1/8” (3 mm) to 3/8” (10 mm) to cover a wide range of structural
lightweighting applications. In doing so, over 200 fillet-welded longitudinal and
transverse shear specimens have been tested in this study.
4. A new analytical method is also developed for incorporating geometrical nonlinear
effects, e.g., those due to contact between two plates, for a broader applicability of the
proposed failure criterion, which have been shown important for performing test data
analysis of transverse shear specimens. The effectiveness of the combined failure
criterion has been validated by finite element computation incorporating nonlinear
material and nonlinear geometry conditions. In addition, its effectiveness in correlating
shear strengths obtained from transverse shear specimens has been proven through the
experimental test data obtained in this study.
5. To further prove the broad applicability of the developed failure criterion in load
capacity evaluation of full-scale complex welded components, it has been applied for
analyzing a large number of well-recognized full-scale test data on hollow structural

140
section joint components. The traction stress based weld failure criterion has again been
proven effective. The correlations obtained by the traction stress based failure criterion
between the predicted and actual failure loads of various HSS fillet-welded connections
show as much as 60% improvement over those predicted by existing Codes and
Standards used today.
6. Finally, the proposed closed-form weld sizing criterion in the form of Eq. (5.7) has
been shown to result in reducing fillet weld sizes by as much as 40% compared to the
traditional empirical-based weld sizing criterion (Eq. (1.2)), as demonstrated in Chapter
5 in the context of these standard shear test specimens and full-scale HSS connections.
Thus, the quantitative weld sizing criterion developed in this study should enable the
elimination of the widespread weld over-sizing resulted from the existing empirical-
based weld sizing rules in Codes and Standards, which has been the root cause of severe
welding-induced distortions experienced today in the construction of lightweight
shipboard structures.
6.2 Areas of Future Study
Based on the investigations conducted in this study, the following areas are recommended
for future work to address additional fundamental issues and engineering applications:
1. The testing results obtained in this study have revealed weld quality issues for certain
aluminum alloys and titanium alloys, in which noticeable welding-induced defects are
present. These defects are believed to have contributed to not only lower joint strengths,
but also a larger than usual data scatter. This suggests that more appropriate weld
quality acceptance criteria need to be developed for supporting the use of these
lightweight structural metals in future ship platforms.

141
2. To further reduce weld size for meeting today’s lightweight requirements nowadays,
equivalent weld size incorporating weld penetration which can be achieved consistently
by advanced welding processes, e.g. hybrid laser-arc welding (HLAW), should be
investigated for incorporation in the quantitative weld sizing criterion developed in this
study. Such considerations could lead to another 10% to 20% weld size reduction based
on the insights gained from available test results obtained in this study.
3. Although the proposed weld sizing criterion has yielded a very good correlation
between predicted and actual failure angle of fillet welds in various joint configurations
and loading conditions, joint strength test data scatter band needs to be established for
defining an appropriate design safety factor for application in practice to take full
advantage of the quantitative weld sizing criterion developed in this study.
4. New joint types produced by more advanced welding and joining processes, such as
friction stir welding and hybrid laser-arc welding, etc., need to be considered for
adapting the developed weld sizing criterion.

142
Appendix A Shear Strength Correlation between Longitudinal and Transverse Shear
Specimens using Conventional Method
(a)

143
(b)
(c)
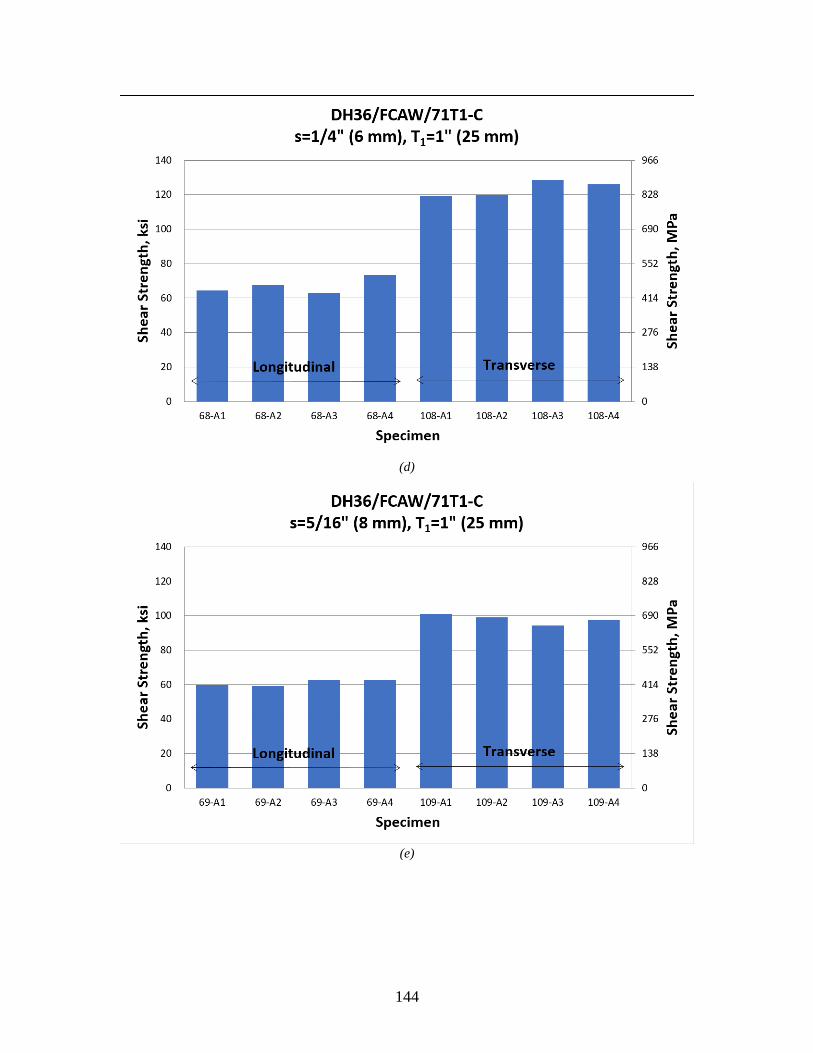
144
(d)
(e)

145
(f)
Figure A.1: Shear strength correlation between longitudinal and transverse shear specimens using conventional
method for DH36 with FCAW and 71T1-C weld wire
(a)

146
(b)
(c)

147
(d)
(e)

148
(f)
Figure A.2: Shear strength correlation between longitudinal and transverse shear specimens using conventional
method for HSLA-80 with FCAW and 101T-C weld wire
(a)

149
(b)
(c)

150
(d)
Figure A.3: Shear strength correlation between longitudinal and transverse shear specimens using conventional
method for HSLA-80 with GMAW and MIL-100S weld wire

151
Appendix B Shear Strength Correlation between Longitudinal and Transverse Shear
Specimens using Traction Stress Method
(a)

152
(b)
(c)
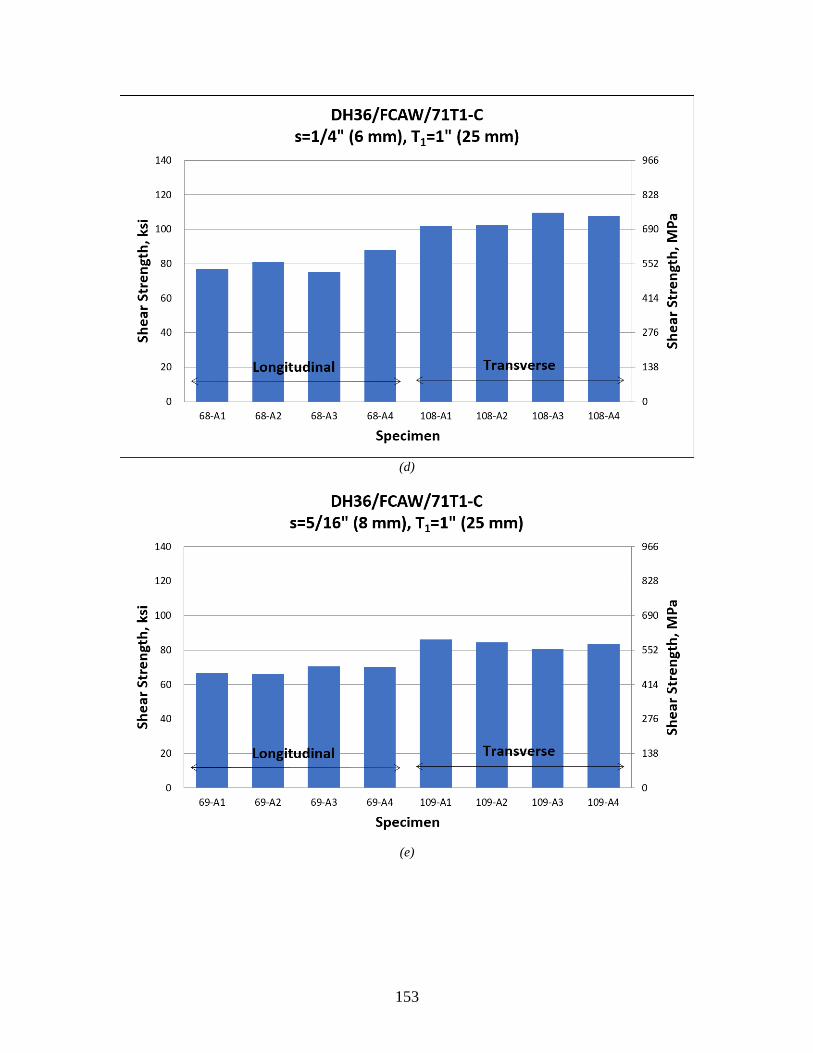
153
(d)
(e)

154
(f)
Figure B.1: Shear strength correlation between longitudinal and transverse shear specimens using traction stress
method for DH36 with FCAW and 71T1-C weld wire
(a)

155
(b)
(c)

156
(d)
(e)

157
(f)
Figure B.2: Shear strength correlation between longitudinal and transverse shear specimens using traction stress
method for HSLA-80 with FCAW and 101T-C weld wire
(a)
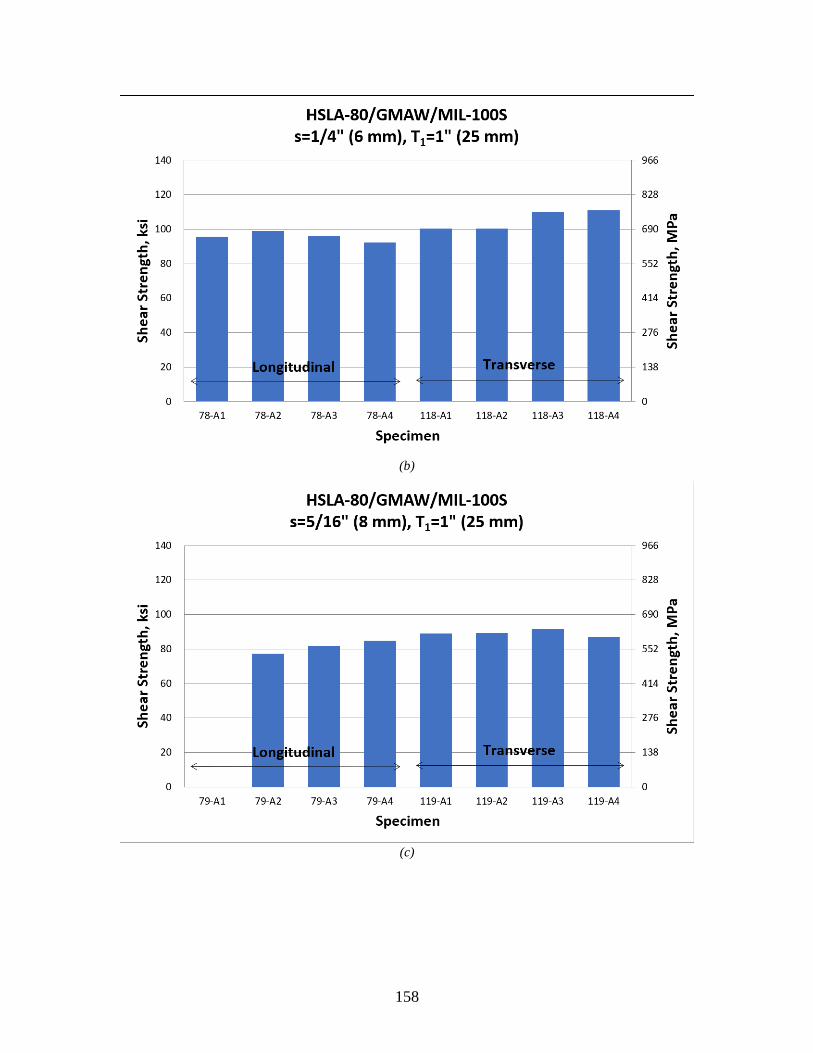
158
(b)
(c)

159
(d)
Figure B.3: Shear strength correlation between longitudinal and transverse shear specimens using traction stress
method for HSLA-80 with GMAW and MIL-100S weld wire

160
Appendix C Shear Strength Correlations by Traction Stress Method with and without
Plate Contact Effects
(a)
(b)
(c)

161
(d)
(e)
(f)
Figure C.1: Shear strength correlations by traction stress method with and without contact effects for DH36 with
FCAW, and 71T1-C weld wire

162
(a)
(b)
(c)

163
(d)
(e)
(f)
Figure C.2: Shear strength correlations by traction stress method with and without contact effects for HSLA-80 with
FCAW, and 101T-C weld wire
(a)

164
(b)
(c)
(d)
Figure C.3: Shear strength correlations by traction stress method with and without contact effects for HSLA-80 with
GMAW, and MIL-100S weld wire

165
Appendix D Shear Strength Correlations between Longitudinal and Transverse Specimens Made of Aluminum Alloys
(a)
(b)

166
(c)
(d)
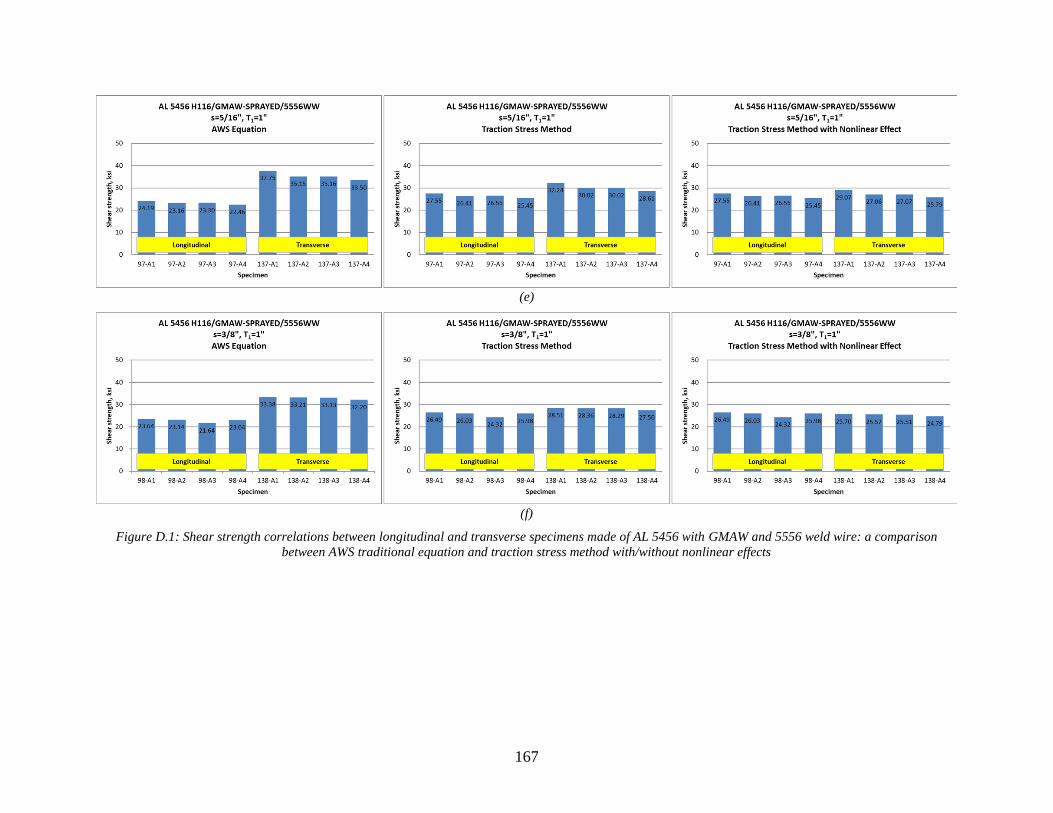
167
(e)
(f)
Figure D.1: Shear strength correlations between longitudinal and transverse specimens made of AL 5456 with GMAW and 5556 weld wire: a comparison
between AWS traditional equation and traction stress method with/without nonlinear effects

168
(a)
(b)

169
(c)
Figure D.2: Shear strength correlations between longitudinal and transverse specimens made of AL 6082 with GMAW and 5183 weld wire: a comparison
between AWS traditional equation and traction stress method with/without nonlinear effects

170
Appendix E Shear Strength Correlations between Longitudinal and Transverse Specimens Made of Titanium Alloys
(a)
(b)
Figure E.1: Shear strength correlations between longitudinal and transverse specimens made of Ti 6-4 with GMAW: a comparison between AWS traditional
equation and traction stress method with/without nonlinear effects

171
(a)
(b)
Figure E.2: Shear strength correlations between longitudinal and transverse specimens made of Ti 6-4 with GTAW: a comparison between AWS traditional
equation and traction stress method with/without nonlinear effects

172
(a)
(b)
Figure E.3: Shear strength correlations between longitudinal and transverse specimens made of Ti CP with GMAW: a comparison between AWS traditional
equation and traction stress method with/without nonlinear effects

173
(a)
(b)
Figure E.4: Shear strength correlations between longitudinal and transverse specimens made of Ti CP with GTAW: a comparison between AWS traditional
equation and traction stress method with/without nonlinear effects

174
(a)
(b)
Figure E.5: Shear strength correlations between longitudinal and transverse specimens made of Ti 425 with GMAW: a comparison between AWS traditional
equation and traction stress method with/without nonlinear effects

175
Figure E.6: Shear strength correlations between longitudinal and transverse specimens made of Ti 425 with GTAW: a comparison between AWS traditional
equation and traction stress method with/without nonlinear effects

176
References
ABS. (2000). Rule requirements for materials and welding – supplementary requirements for
naval vessels. ABS.
AISC. (2010). Specification for structural steel buildings. Chicago: AISC.
Archer, F. E., et al. (1959). Fillet welds subjected to bending and shear. Civil Engineering and
Public Works Review, 54(634), 455-458.
AWS (American Welding Society). (2007). AWS B4.0. Standard methods for mechanical testing
of welds. Miami: AWS.
AWS (American Welding Society). (2015). AWS D1.1. Structural welding code - Steel. Miami:
AWS.
Björk, T., et al. (2012). Capacity of fillet welded joints made of ultra high-strength steel. Welding
in the World, 56(3), 71-84.
Butler, L. J., & Kulak, G. L. (1971). Strength of fillet welds as a function of direction of load.
Welding Journal, 50(5), 231-234.
Butler, L. J., et al. (1972). Eccentrically loaded welded connections. Journal of the Structural
Division, 98(5), 989-1005.
CEN (European Committee for Standardization). (2005). Eurocode 3: Design of steel structures -
Part 1-8 Design of joints. CEN 1993-1-8. Brussels: CEN.
CSA (Canadian Standards Association). (2014). CSA S16. Design of steel structures. Rexdale, ON:
CSA.
Dassault Systemes SIMULIA Abaqus CAE (2018).
De Bruyne, N. A. (1944). The strength of glued joints. Aircraft engineering and aerospace
technology.
Department of Defense. (1974). Fillet weld size, strength and efficiency determination. MIL-STD-
1628. Arlington, VA: Department of Defense.

177
Department of Defense. (1990). Fabrication, welding, and inspection of ship structure. MIL-STD-
1689A. Arlington, VA: Department of Defense.
DNV-RP-203. (2012). Fatigue design of offshore steel structures. DNV-RP-203. Oslo: Det Norske
Veritas Germanischer Lloyd.
Dong, P. (2001). A structural stress definition and numerical implementation for fatigue analysis
of welded joints. International Journal of Fatigue, 23(10), 865-876.
Dong, P. (2005). A robust structural stress method for fatigue analysis of offshore/marine
structures. Journal of offshore mechanics and arctic engineering, 127(1), 68-74.
Dong, P., & Hong, J. K. (2004). The master SN curve approach to fatigue evaluation of offshore
and marine structures. In International Conference on Offshore Mechanics and Arctic
Engineering, 37440, 847-855.
Dong, P., & Hong, J. K. (2006). A robust structural stress parameter for evaluation of multiaxial
fatigue of weldments. Journal of ASTM International, 3(7), 1-17.
Dong, P., et al. (2010a). The master S-N curve method: an implementation for fatigue evaluation
of welded components in the 2007 ASME B&PV code, section VIII, division 2 and API 579-
1/ASME FFS-1. WRC Bulletin 523. New York: Welding Research Council.
Dong, P., et al. (2010b). A path-dependent cycle counting method for variable-amplitude multi-
axial loading. International Journal of Fatigue, 32(4), 720-734.
Dong, P., et al. (2013). A math-based design-for-produceability evaluation of titanium applications
in ship hull structures. Transactions-Society of Naval Architects and Marine Engineers, 120(1),
299-305.
Dong, P., et al. (2014). A structural strain method for low-cycle fatigue evaluation of welded
components. International Journal of Pressure Vessels and Piping, 119, 39-51.
Frater, G. S. (1986). Weldment design for hollow structural section joints. (Doctoral dissertation,
Toronto, Canada: University of Toronto).
Frater, G. S., & Packer, J. A. (1992a). Weldment design for RHS truss connections. I: Applications.
Journal of Structural Engineering, 118(10), 2784-2803.
Frater, G. S., & Packer, J. A. (1992b). Weldment design for RHS truss connections. II.
Experimentation. Journal of Structural Engineering, 118(10), 2804-2819.
Higgins, T. R., & Preece, F. R. (1968). Proposed working stresses for fillet welds in building
construction. Welding Journal, 15(10), 429-432.

178
Huang, T. D., et al. (2004). Fabrication and engineering technology for lightweight ship structures,
part 1: distortions and residual stresses in panel fabrication. Journal of Ship Production, 20(1), 43-
59.
Huang, T. D., et al. (2007). Engineering and production technology for lightweight ship structures,
Part II: distortion mitigation technique and implementation. Journal of ship production, 23(2), 82-
93.
Huang, T. D., et al. (2014). Reduction of overwelding and distortion for naval surface combatants,
Part 1: Optimized weld sizing for lightweight ship structures. Journal of Ship Production and
Design, 30(4), 184-193.
Huang, T. D., et al. (2016). Reduction of overwelding and distortion for naval surface combatants.
Part 2: weld sizing effects on shear and fatigue performance. Journal of Ship Production and
Design, 32(1), 21-36.
IIW (International Institute of Welding). (1976). Design rules for arc welded connections in steel
submitted to static loads. Doc. No. XV-358-74. Commission XV. IIW.
IIW (International Institute of Welding). (1980). Deformation curves of fillet welds. Doc. No. XV-
467-80. Commission XV. Paris: IIW.
Jensen, A. P. (1988). Limit analysis of welds. Journal of Constructional Steel Research, 11(3),
205-235.
Kamtekar, A. G. (1982). A new analysis of the strength of some simple fillet welded connections.
Journal of Constructional Steel Research, 2(2), 33-45.
Kamtekar, A. G. (1987). The strength of inclined fillet welds. Journal of Constructional Steel
Research, 7(1), 43-54.
Kato, B., & Morita, K. (1974). Strength of transverse fillet welded joints. Welding journal, 53(2),
59-64.
Kennedy, D. L., et al. (1985). The strength of fillet welds under longitudinal and transverse shear:
a paradox. Canadian Journal of Civil Engineering, 12(1), 226-231.
Khurshid, M., et al. (2012). Ultimate strength and failure modes for fillet welds in high strength
steels. Materials & Design, 40, 36-42.
Krumpen, R. P., & Jordan, C. R. (1984). Reduced fillet weld sizes for naval ships. Welding journal,
63(4), 34-41.
Lesik, D. F., & Kennedy, D. J. (1988). Ultimate strength of eccentrically loaded fillet welded
connections. Structural Engineering Report No. 159, University of Alberta.

179
Lesik, D. F., & Kennedy, D. L. (1990). Ultimate strength of fillet welded connections loaded in
plane. Canadian Journal of Civil Engineering, 17(1), 55-67.
Ligtenberg, F. K. (1968). International Test Series Final Report, IIW Doc XV-242-68.
International Institute of Welding.
Lu, H., & Dong, P. (2020). An Analytical Shear Strength Model for Load-Carrying Fillet-Welded
Connections Incorporating Nonlinear Effects. Journal of Structural Engineering, 146(3),
04019224.
Lu, H., et al. (2015). Strength analysis of fillet welds under longitudinal and transverse shear
conditions. Marine Structures, 43, 87-106.
Marsh, C. (1985). Strength of aluminum fillet welds. Welding Journal, Welding Research
Supplement, 335-338.
Marsh, C. (1988). Strength of aluminum T-joint fillet welds. Welding Journal, Welding Research
Supplement, 171-176.
McClellan, R. W. (1990). An Evaluation of the Fillet Weld Shear Strength of Flux Cored Arc
Welding Electrodes. In National Shipbuilding Research Program (NSRP) 1990 Ship Production
Symposium.
Mei, J., & Dong, P. (2017a). An equivalent stress parameter for multi-axial fatigue evaluation of
welded components including non-proportional loading effects. International Journal of Fatigue,
101, 297-311.
Mei, J., & Dong, P. (2017b). A new path-dependent fatigue damage model for non-proportional
multi-axial loading. International Journal of Fatigue, 90, 210-221.
Miazga, G. S., & Kennedy, D. L. (1989). Behaviour of fillet welds as a function of the angle of
loading. Canadian Journal of Civil Engineering, 16(4), 583-599.
Nie, C., & Dong, P. (2012). A traction stress based shear strength definition for fillet welds. The
Journal of Strain Analysis for Engineering Design, 47(8), 562-575.
Oatway, P. (2014). Fillet-welded end-plate connections to square and rectangular HSS. (M Eng.
thesis. Toronto, Canada: University of Toronto).
Packer, J. A., & Cassidy, C. E. (1995). Effective weld length for HSS T, Y, and X connections.
Journal of Structural Engineering, 121(10), 1402-1408.
Packer, J. A., & Henderson, J. E. (1997). Hollow structural section connections and trusses: a
design guide. Canadian Institute of Steel Construction.

180
Packer, J. A., et al. (2016). Experimental evaluation of design procedures for fillet welds to hollow
structural sections. Journal of Structural Engineering, 142(5), 04016007.
Paik, J., et al. (2006). Ultimate limit state design technology for aluminum multi-hull ship
structures. Transactions-Society of Naval Architects and Marine Engineers, 113, 270-305.
Pei, X., & Dong, P. (2019). An analytically formulated structural strain method for fatigue
evaluation of welded components incorporating nonlinear hardening effects. Fatigue & Fracture
of Engineering Materials & Structures, 42(1), 239-255.
Pei, X., et al. (2019). A structural strain parameter for a unified treatment of fatigue behaviors of
welded components. International Journal of Fatigue, 124, 444-460.
Pei, X., et al. (2020). A simplified structural strain method for low-cycle fatigue evaluation of
girth-welded pipe components. International Journal of fatigue, 139, 105732.
Picón, R., & Cañas, J. (2009). On strength criteria of fillet welds. International Journal of
Mechanical Sciences, 51(8), 609-618.
Spraragen, W., & Claussen, G. E. (1942). Static tests of fillet and plug welds: a review of the
literature from 1932 to January 1, 1940. Welding Journal, 21(4), 161-197.
Swannell, P. (1967). The load-carrying capacity of two thin lapped plates joined by an intermittent
run of bond. British Welding Journal, 153-156.
Swannell, P. (1972). Primary stress and strain distributions in longitudinal fillet welds. Australian
Welding Journal, 117-123.
Timoshenko, S. P. (1951). Theory of elasticity. New York: McGraw-Hill Book.
Tousignant, K. J. (2017). Weld Effective Lengths for Hollow Structural Section Connections.
(Doctoral dissertation, Toronto, Canada: University of Toronto).
Wardenier, J., et al. (2002). Hollow sections in structural applications. The Netherlands: Bouwen
met staal.
Wei, Z., & Dong, P. (2010). Multiaxial fatigue life assessment of welded structures. Engineering
Fracture Mechanics, 77(15), 3011-3021.
Xing, S., et al. (2016). Analysis of fatigue failure mode transition in load-carrying fillet-welded
connections. Marine Structures, 46, 102-126.
Yang, L., et al. (2019). Strength of duplex stainless steel fillet welded connections. Journal of
Constructional Steel Research, 152, 246-260.