podium session #1 - pathologic gait i. (focus on cp)
512
JEGM2010_ProceedingsBook:JEGM2010_ProceedingsBook 4/23/2010 5:33 PM Page 1
-
Upload
khangminh22 -
Category
Documents
-
view
1 -
download
0
Transcript of podium session #1 - pathologic gait i. (focus on cp)

JEGM2010_ProceedingsBook:JEGM2010_ProceedingsBook 4/23/2010 5:33 PM Page 1

26

PODIUM SESSION #1
PATHOLOGIC GAIT I. (FOCUS ON CP)
Moderated by: Diane Damiano, PT, Ph.D., National Institutes of Health, Bethesda, MD, USA
Nicky Thompson, PT, Ph.D., Nuffield Orthopaedic Hospital, Oxford, UK
PATHOLOGIC GAIT I. (FOCUS ON CP) 1. How Can Changes in Walking Speed Influence the Contribution of Spasticity to Gait
Pathology in Children with Cerebral Palsy? Severijns Deborah 2. Simulating Muscle Weakness to Unravel the Complex Relationship Between Primary
Deficits and Gait in Children with Cerebral Palsy (CP) Van Gestel Leen 3. Relationships between Inter-Segmental Coordination and Gait Performance in Children
with Spastic Cerebral Palsy and Stiff Knee Gait Joanne Valvano 4. The Unstable Knee Joint Kinematics Seen in the Crouch Gait Max Kurz 5. Development of Knee Function Following Hamstring Lengthening in Spastic Diplegia: A
Lon-Term Outcome Study Thomas Dreher 6. Relationship between Body Fat, Strength, and Oxygen Cost in Children with Cerebral
Palsy Mitell Sison-Williamson 7. Differences in Movement Patterns of the Assisting Hand During a Multi-Component
Bimanual Task in Typically Developing Children and Children with Hemiplegic Cerebral Palsy Nancy L Denniston
27

How can changes in walking speed influence the contribution of spasticity to gait pathology in children with Cerebral Palsy?
Severijns D1, Aertbeliën E 2, Wambacq H2, Dan B 3, Janssens L 4, Van Campenhout A. 5, Bruyninckx H.2, Desloovere K1,6
1Clinical Motion Analysis Laboratory, University Hospital, Pellenberg, Belgium; 2Dept of Mechanical Engineering, KULeuven, Belgium; 3Dept of Neurology, University Children’s Hospital Queen Fabiola, Brussels, Belgium; 4Groep T, Leuven Engineering School, Belgium; 5Dept of Pediatric Orthopaedics, Belgium; 6Dept of Rehabilitation Sciences, KULeuven, Belgium Introduction: Clinically, spasticity is assumed to influence gait of children with Cerebral Palsy (CP), but the development of direct objective measures of spasticity during gait is still a challenge. As spasticity is velocity dependent1, changes in gait speed may influence the contribution of spasticity to gait pathology. However, spontaneous gait speed is different for children with CP and Typically Developing (TD) children. More-over, gait speed has an influence on gait characteristics in TD children even in absence of spasticity 2. So, in order to decompose pure speed effects and spasticity effects, gait characteristics of children with spastic CP and TD children were modeled and compared at similar walking speeds. The objective of the study was to explore differences between TD and CP children in adaptation strategies to higher gait speeds, by studying changes in kinematics, kinetics, muscle lengths and lengthening velocity, and to highlight spasticity related gait deviations. Clinical significance: Spasticity treatment could be more selective when it can be demonstrated which differences in gait between TD children and CP children are due to dynamic effects of spasticity. Methods: 25 ambulant children with spastic CP (age 10.8±2.4 years, GMFCS I-II, 16 with hemi- and 9 with diplegia) as well as 22 TD children, comparable in age, height and weight (age 9.5±2.1 years) were evaluated. The CP group was characterized by Modified Ashworth scores (MAS) of 1 to 3 in the lower limb muscles. Children were asked to walk at self selected comfortable walking speed, at self selected faster speed and as fast as possible without running on a 10-m long walkway. All children received full gait analysis (8 camera Vicon system, PlugInGait model, 2AMTI force plates). Nine trials with full kinematics and kinetics of one random side for each patient with diplegia and the hemiplegic side for the other patients (3 at each walking velocity) were analyzed. TD children walk faster than CP children, in all walking conditions. For each individual subject, a linear regression was used to model the velocity dependence of each gait parameter (e.g. Figure 1). This allows us to focus on comparable walking speeds for both groups. Non-dimensional gait velocities3 of 0.4 and 0.6 were then chosen at which a gait/muscle parameters (kinematics,
Figure 1: Example of the linear regression for hip flexion for one child
28

kinetics and muscle lengths/lengthening velocities) for both CP and TD children were compared using a difference score. CP children were grouped in three groups according to the MAS of gastrocnemius and hamstrings, to allow a more detailed analysis of subgroups with different spasticity levels. Statistical between-groups comparison (TD vs. CP groups ) was done with a Kruskal-Wallis test with post hoc tests. Results: Several parameters were significantly different at low velocity and high velocity between CP en TD children as well as between spasticity groups, such as maximal hip extension at terminal stance (p<0.01) and maximal ankle plantar flexion moment at pre-swing
(p<0.01). Difference scores between the two modeled velocities highlighted some significantly different effects of walking speed on gait between the groups. Difference score of the ankle angle in mid-swing (median TD: 1.59° vs. CP: -0.53°) and terminal swing and of the angular velocity at initial contact (median TD: -14.8°/sec vs. CP:
51,9°/sec) were significantly different between TD and CP with gastrocnemius MAS 2 and 3 (p<0.01). Difference scores of the ankle angle in mid-swing also differentiated TD and CP children with CP with MAS 1+ in the gastrocnemius (p<0.01). For children with MAS 2 and 3 in the hamstrings, range of motion of the pelvis in the sagittal plane was already higher compared to TD children (median: 9,5° vs. 3,9°) at low velocity and they enlarged this difference at higher walking speed (median difference score CP: 2.6° vs TD 1,1°) (p<0.01). Discussion: The results highlighted that differences in grade of pathology according to MAS are clearly recognizable in gait, but the velocity dependent characteristic of spasticity in children with CP does not influence gait as much as presumed. It should be noted that more involved children with CP were excluded to be able to collect full kinetic data. Furthermore, although we asked to raise walking velocity, detailed study of the results indicated that children with CP achieved the selected gait speeds with different angular velocities compared to TD children and they may not always reach critical velocities of muscle lengthening to elicit reflex activity. It was also obvious that children with CP within one spasticity group differ largely from each other in adaptation to higher walking velocity. The limited number of significant differences found between the different groups could be related to the low sample size of subgroups or the insufficient validity of the MAS 4. Current research focuses on the study of the EMG data to distinct pathologic reflex activity from the influence of muscle contractures. References and Acknowledgments [1] Lance (1980); in Spasticity: Disordered Motor Control; [2] Schwartz et al. (2008), J Biomech; [3] Hof AL et al. (1996) Gait Posture;[ 4] Fleuren et al. (2009) J. Neurol. Neurosurg. Psychiatry This research is funded by IWT Flanders. (IWT-TBM project number: IWT 060799)
Figure 2. Median and interquartile ranges of ankle angular velocity at initial contact for all groups.
29

Simulating muscle weakness to unravel the complex relationship between primary deficits and gait in children with Cerebral Palsy (CP).
Van Gestel L MSc1,2, Meyns P MSc2, De Cock P MD PhD3, Bruyninckx H Ir PhD4, Wambacq H MSc4, Molenaers G MD PhD5, Severijns D MSc5, Desloovere K PhD2,5
1Research assistant of the Research Foundation – Flanders, Belgium 2Department of Rehabilitation Sciences, Faculty of Kinesiology and Rehabilitation Sciences, KULeuven, Heverlee, Belgium 3Department of Neuropaediatrics, University Hospital Gasthuisberg, Leuven, Belgium 4Department of Mechanical Engineering, Production Engineering, Machine Design and Automation, KULeuven, Heverlee, Belgium 5Clinical Motion Analysis Laboratory, CERM, University Hospital Leuven, Leuven, Belgium
30

INTRODUCTION Cerebral Palsy (CP) is characterized by several motor deficits like spasticity, balance problems, impaired selectivity and decreased muscle strength. All these deficits interact and play an important role in the gait pattern of children with CP. It is not easy to distinguish the unique role of each and every individual primary deficit. Muscle strength training is often part of the rehabilitation program in CP but it is still not clear how and to what extent this primary deficit influences the CP gait pathology.1
CLINICAL SIGNIFICANCE If the unique role of muscle weakness in CP gait is defined, then key gait parameters indicating underlying muscle weakness can be used to identify children with CP whose gait pattern is mainly determined by this motor deficit. These children’s gait pattern might then drastically improve by targeted strength training. METHODS A group of 20 children with CP was selected for gait analysis in the Pellenberg Clinical Motion Analysis Laboratory. Inclusion criteria were: diagnosis of CP, 5-12 years of age, no history of surgery or recent BTX-A treatment. Their mean age was 9 yrs 6 months ± 2 months, there were 8 children with hemiplegia and 12 children with diplegia. All children first received full barefoot gait analysis (lower limb kinematics and kinetics, 8 camera vicon system, 2 AMTI force plates, PlugInGait markerset). Subsequently, extra gait trials were collected after indirectly enlarging the impact of weakness on the gait pattern. Muscle strength was therefore relatively reduced by adding 10% of the body weight at the waist by means of a weight belt (lead was fixed to the belt). To avoid asymmetry, the weight was evenly distributed around the waist, close to S-2, which is considered to be the approximate location of the centre of mass. For every walking condition at least two trials with kinematics and corresponding kinetics were registered. A control group of 15 age-matched typically developing (TD) children without any gait impairments was recruited as well. Their mean age was 9 yrs 1 month ± 4 months. These children underwent the same full barefoot gait analysis with the extra walking condition described above. 118 gait parameters per gait trial were extracted from the gait curves and compared between and within TD and CP gait for both the baseline and the simulated muscle weakness condition by a MANOVA (with posthoc Tukey). RESULTS Adding 10% of the body weight to the waist of TD children resulted in a significantly increased walking velocity and stride length (p= 0.01 and p= 0.002 resp.). Furthermore, an increase was seen for the sagittal and transverse range of motion of the hip (p=0.009& p=0.001 resp.), the sagittal range of motion of the ankle in swing (p=0.008), the maximal hip extension moment after loading response (p=0.03), the maximal power generation at the knee (p=0.005) and the maximal hip power generation at toe-off (p= 0.03). Children with CP on the other hand decreased their walking velocity, step and stride length with a delayed toe-off and an increased step width. A decreased pelvic range of motion was observed in the coronal and
Maximal hip extension moment in stance0,71,7
Baseline Weightadded
Mo
me nt
(Nm
HealthyCPHealthyCP
Maximal hip abduction moment in stance
0,620,640,660,68
0,70,720,740,76
Baseline Weightadded
Mom
ent (
Nm
/Kg)
TDCP
Figure 1: Adaptation of the hip abduction moment in stance in TD and CP children in response to added weight. (means +/_ SE)
31

transverse plane combined with a decreased maximal hip abduction angle and more externally rotated feet. Apart from the significantly lower hip abduction and extension moment, they also had a reduced hip power generation around toe-off. (Table 1 & Figure 1) Table 1: Mean (SE) of significantly changed gait parameters in CP gait when walking with added weight.Gait Parameters Baseline Weight added P-value Step width 0.11 (0.003) 0.13 (0.005) <.0001 Step length 0.51 (0.006) 0.49 (0.008) 0.001 Stride length 1.02 (0.01) 0.99 (0.02) <.0001 Walking velocity 1.11 (0.01) 1.03 (0.02) <.0001 Timing of toe-off 58.55 (0.31) 60.63 (0.33) <.0001 Coronal ROM pelvis 11.10 (0.37) 9.24 (0.42) <.0001 Transversal ROM pelvis 18.05 (0.49) 14.59 (0.62) <.0001 Max hip abduction 8.31 (0.36) 6.51 (0.48) 0.001 Max foot rotation -3.53 (0.97) -6.68 (1.10) 0.022Max hip abduction mom stance 0.734 (0.015) 0.662 ( 0.021) 0.004 Max hip extension mom stance 1.102 (0.037) 0.953 (0.037) 0.007 Hip power generation toe-off 1.494 (0.062) 1.326 (0.068) 0.030 ROM: range of motion, max: maximal, mom: moment
DISCUSSION TD children increased their stride length and walking velocity in response to the addition of extra weight to their waist. This resulted in larger range of motions at the hip and ankle. Furthermore, increased moment- and power generations were observed at several joint levels. These children thus seem to be able to (over)compensate for the added weight. A relatively small decrease of muscle strength did not deteriorate the typical gait pattern. An opposite response was observed in children with CP. Pelvic range of motion deteriorated in several planes as a direct consequence of the weight added at the waist. Furthermore, the significant increase in external foot rotation resulted from already externally orientated feet that collapsed under the increased weight. The observed decrease in hip extension moment confirms previously reported results by Eek et al. where a strength training program resulted in a significantly increased hip extension moment.1 A clear indication of underlying muscle weakness was found in the hip abduction angle and moment. As a result of the weight belt around the waist, the load on the hip abductors increased. However, these muscles failed to create the required hip abduction moment. (Figure 1) In general, CP children tried to move the ground reaction force closer to their joint centers, thereby decreasing the moments created around the joints which in turn decreased the demand that was placed on the various muscles. This study provides first evidence for potential key gait parameters that might be used for identifying children with underlying major muscle weakness problems.
REFERENCES 1. Eek MN, Tranberg R, Zügner R, Alkema K, Beckung E. Muscle strength training to
improve gait function in children with cerebral palsy. Dev Med Child Neurol 2008 Oct;50 (10):759-64.
AKNOWLEDGEMENTS LVG received a PhD-fellowship of the Research Foundation Flanders.
32

Relationships between Inter-Segmental Coordination and Gait Performance in Children with Spastic Cerebral Palsy and Stiff Knee Gait
Joanne Valvano, Kate Worster, Katherine Flynn, Zhaoxing Pan, Frank Chang, James J Carollo
Center for Gait and Movement Analysis, The Children’s Hospital, Aurora, CO
INTRODUCTION: From a dynamic systems perspective, normal gait performance (GP) depends upon the elegant coordination between the thigh and shank as they oscillate on their independent trajectories of flexion and extension 1. Normal motor control mediates the selective recruitment and appropriate timing of muscle activity enabling leg segments to achieve critical gait events. In stiff knee gait, critical gait events during swing are not achieved and it is therefore one of the most common gait patterns that limit functional GP in children with cerebral palsy (CP). Inadequate dynamic range of knee flexion and reduced rate of knee flexion affect the clearance of the advancing foot 2. Stiff knee gait is associated with a shortened biarticular rectus femoris muscle (RF) and abnormal firing patterns in the muscle. The standard surgical treatment for stiff knee gait is transfer of the RF muscle (RFT) posterior to the knee axis of rotation to reduce knee extensor moment in swing and a concomitant hamstring lengthening to preserve knee extension in stance. Although surgical transfer of the RF muscle reliably increases the knee’s passive range of motion, improvement in GP after surgery is variable2, 3. We proposed that children with stiff knee gait have motor control deficits limiting inter-segmental coordination required to perform swing period events and that postoperative changes are influenced by the extent to which the motor control system can exploit the biomechanical advantage of the lengthened RF muscle to improve lower extremity coordination. We hypothesized: 1) measures of inter-segmental coordination change after RFT; 2) measures of GP are related to measures of inter-segmental coordination; and 3) change in GP measures has a greater association with change in inter-segmental coordination than does change in RF range of motion, as measured by the Duncan Ely test.
CLINICAL SIGNIFICANCE: Findings regarding inter-segmental coordination can enhance our understanding of stiff knee gait mechanisms and may lead to physical therapy interventions that improve functional outcomes after the RFT procedure.
METHODS: This retrospective study accessed pre and postoperative data from clinical gait analyses performed on 62 subjects (104 legs), ages 5 – 20years, with spastic CP who had the RFT procedure (with and without hamstring lengthening and other concomitant procedures) and were independent ambulators preoperatively. A typical reference population consisted of 35 subjects of the same age range. A custom Matlab program (version 7.9) used Vicon 3D motion capture data from a gait analyses to generate the GP and inter-segmental coordination outcomes. GP was quantified by dynamic knee flexion range and rate of knee flexion; both descriptors of stiff knee gait and walking speed. Sagittal plane coordination between the thigh and shank during a gait cycle was measured by events on a continuous relative phase (CRP) curve 1. Using principles of dynamic systems theory, the Matlab program calculated the thigh-shank CRP primary outcomes: a) the minimum CRP value corresponding to a leading thigh trajectory in the pre-swing phase of gait and b) the maximum CRP value corresponding to a leading shank trajectory in the swing period of gait. Secondary CRP measures were c) pre-swing slope preceding the CRP maximum and d) slope during swing between the primary outcome’s extrema. Paired t-tests were applied to identify postoperative change in the
33

primary CRP variables. Pearson r correlation analysis was used to test associations between GP measures and CRP variables preoperatively. The R2 statistic was used to test the association of postoperative change in CRP variables with change in GP measures and the
sociation of change in Duncan Ely with change in GP measures. as
RESULTS: There were significant differences between pre and postoperative CRP minimum (p <.0001) and CRP maximum (p < .0001) values, as depicted in Figure 1. Correlations between preoperative CRP and GP variables were robust (Table 1). R2 calculations indicate that change in Duncan Ely accounted for about 3% of the variance in knee flexion range change and 5 % of flexion rate change. On the other hand, CRP minimum change accounted for 44 % of the variance in knee flexion range change and 48% of flexion rate change. CRP maximum change accounted for 44 % of the variance in knee flexion range change and 48 % of the variance in flexion rate change.
Figure 1: Thigh-Shank Continuous Relative Phase plots, pre & post-surgery, for a representative subject referenced to a mean ensemble curve of typical subjects.
Minimum CRP point: thigh trajectory is leading shank; Maximum CRP point: shank
trajectory is leading thigh.
Figure 2: Pearson r probability values for correlations between pre-surgery GP and CRP measures.
DISCUSSION: Relative phase is a low dimensional variable that embodies displacement and acceleration of the thigh and shank to describe inter-segmental coordination during gait. Its correlations with performance measures and ability to detect change after surgery demonstrate potential for use as a measure of inter-segmental coordination. The strong association of change in CRP with change in GP after RFT suggests that further study of motor control mechanisms in stiff knee gait is warranted.
REFERENCES: 1. Kurz M & Stergio N. In, N Stergio Innovative Analysis of Human Movement. 2004; 91-120 2. Muthasamy K et al., Journal of Pediatric Orthopedics. 2008; 28 (6): 674-8. 3. Reinbolt JA et al. Gait and Posture. 2009; 28: 351-357.
34

The Unstable Knee Joint Kinematics Seen in the Crouch Gait
Max J. Kurz, Wayne Stuberg, Brad Corr & Glen Ginsburg Munroe-Meyer Institute for Genetics and Rehabilitation, University of Nebraska Medical Center,
Omaha, Nebraska E-mail: [email protected] Web: http://www.unmc.edu/mmi/
Introduction Musculoskeletal modeling has shown that the crouch gait pattern that is often seen in children with cerebral palsy (CP) is related to an impaired ability to control the rate that the hamstrings lengthen during the terminal swing phase of the gait cycle [1, 2]. This impaired muscular control has been speculated to be due to spasticity of the hamstrings musculature [1, 2]. Furthermore, it has been suggested that the impaired muscular control may create disturbances in the voluntary knee joint kinematics [3]. Although this seems plausible, the relationship between the impaired control of the hamstrings and the disturbances present in the knee joint kinematics has not been verified. Floquet analysis has previously been used to quantify the ability of the neuromuscular system to dissipate disturbances that arise from the interaction of the mechanical components that comprise the joint and errors in the motor command [4, 5]. A lower extremity joint is considered to have greater dynamic stability if the disturbances are dissipated over a fewer number of strides. The feasibility of using floquet analysis for the assessment of the disturbances present in the knee joint kinematics of the crouch gait pattern has not been explored. Furthermore, it is currently unknown if the rate of dissipation of the disturbances present in the knee joint is influenced by the ability to voluntarily control the hamstrings. The purpose of this investigation is to determine if the rate that the hamstrings are lengthening during the terminal swing is related to the ability to dissipate the disturbances that are present in the knee joint kinematics of the crouch gait. Statement of Clinical Significance The inability to properly control the rate that the hamstrings lengthen during the terminal swing is related to the disturbances seen in the knee joint kinematics of the crouch gait pattern. Therapeutic interventions that are directed at improving the voluntary control of the hamstrings may improve the dynamic stability of the knee joint. Methods Eight children with spastic diplegic CP (Age= 9.6 + 2 yrs.), and six typically developing (TD) children (Age = 8.8 + 2 yrs.) participated in this investigation. The children with CP had Gross Motor Function Classification levels of 1 or 2. Additionally, they had a knee joint angle of 30.6 + 8 degrees at heel-contact, and a popliteal angle of 43 + 9 degrees. The participants walked on a treadmill for two minutes (CP = 0.78 + 0.07 m/s; TD = 0.81 + 0.03 m/s), and a three-dimensional motion capture system (120Hz) was used to determine the lower extremity joint kinematics. The positional data for all the markers were filtered using a zero-lag Butterworth filter with a 6 Hz cut-off. A state vector that consisted of the knee joint’s sagittal plane angular position and velocity was used to define the knee joint’s attractor dynamics. The state space data were partitioned into their respective strides and were normalized to 51 samples. Poincare maps were created for every sample of the normalized stride, and the Floquet multipliers (FM) were calculated for each map [4, 5]. The FM quantified the
35

rate of dissipation of small disturbances that were present in the walking pattern. A FM that was further away from zero signified that it took more strides to dissipate the disturbances in the knee joint kinematics. Furthermore, a larger FM indicated that the knee joint kinematics were less stable [4, 5]. We assumed that the semimembranosus (SEM) adequately represented the lengthening properties of the hamstrings musculature [1, 2]. The open SIMM musculoskeletal modeling software was used to calculate the SEM’s muscle-tendon length based on the collected gait kinematic data [1, 2]. The calculated muscle-tendon lengths were filtered using a zero-lag Butterworth filter with an 8 Hz cut-off, and were differentiated to calculate the rate that the SEM lengthened. We normalized the SEM musculo-tendon length velocity based on the averaged rate of lengthening [1, 2]. The absolute maximum of the SEM velocity was used to quantify the rate that the SEM was lengthening. Independent t-tests were used to discern difference between the respective groups for the FM, and rate that the SEM lengthened. A Pearson product moment was used to determine if the FM for the children with CP was significantly correlated with the rate that the SEM lengthened. Results There was a significant difference in the rate that the SEM lengthened (CP = 0.49 + 0.09; TD = 0.66 + 0.05; p<0.0001), and the largest FM (CP = 0.68 + 0.14; TD = 0.51 + 0.14; p<0.02) of the respective groups. Furthermore, there was a significant positive correlation between the rate that the SEM was lengthening, and the FM calculated for the knee joints of the children with CP (r= 0.62; p<0.05). Discussion Our results show that the crouch gait pattern requires more strides to dissipate the disturbances that are present in the sagittal plane knee joint kinematics. This result confirms the notion that the knee is less stable while walking with a crouch gait [3]. Similar to previous investigations, we found that the hamstrings of the children with a crouch gait were lengthening at a slower rate during the terminal swing [1, 2]. Potentially the slower lengthening may be due to musculo-tendon stiffness and spasticity, which can hinder the ability to control the hamstring’s performance during gait [1, 2]. Our results also indicated that the ability to dissipate the disturbances that are present in the knee joint kinematics is related to the voluntary control of the rate that the hamstrings lengthen. This suggests that instabilities seen in the knee joint of the crouch gait may be partially due to a lack of neuromuscular control of the antagonist muscles during the terminal portion of the swing. The results presented here are the first to provide insight on what neuromuscular factors may be promoting instabilities in the knee joint kinematics of children with a crouch gait. Potentially therapeutic interventions such as gait training or botox therapy may improve the control of the hamstring’s performance and the dynamic stability of the knee joint. References [1] Arnold et al. (2006). Gait & Posture 23 :273-781; [2] van der Krogt et al. (2009). Gait & Posture 29 :640-644 ; [3] Sutherland & Davids (1993). Clin Orthop Rel Res 288 :139-147 ; [4] Arellano et al. (2009). J Exp Biol 212 :1965-1970 ; [5] Kang & Dingwell (2008). Gait & Posture 41 :2899-2905.
36

������������� ����������������������������������������������������� ���������������������
Thomas Dreher, Dóra Vegvari, Sebastian Wolf, Andreas Geisbüsch, Petra Armbrust,Waltraut Schuster, Wolfram Wenz, Frank Braatz.
Dept. of Orthopaedic Surgery and Gait Analysis, University of Heidelberg, Germany
������� �!��Increased knee flexion (crouch gait) during stance phase of gait is one of the mostcommon gait abnormalities in ambulatory patients with spastic diplegia.[1] Hamstringtightness was accused to be one main factor leading to crouch gait. Newer investigationsindentified other factors like increased external tibial torsion [2], quadriceps weakness orinstability of the foot which can cause or aggravate crouch gait. For the correction ofincreased knee flexion during stance phase hamstring lengthening is considered as astandard procedure in an open or percutaneous technique [3,4]. Satisfactory short term-results after hamstring lengthening could be achieved in different studies with improvedknee extension during stance phase.[3,4] Problems in treatment are increased pelvic tiltand high incidence of genu recurvatum.[3] Therefore, surgical strategy for the correctionof crouch gait is seen controversial.
��"�#$#����%��&!�! "&��!'�!%! "� #There are no studies existing, which report long-term results of adult patients who weretreated in childhood by hamstring lengthening. The knowledge about recurrence ofcrouch gait or persistence of correction in these patients is of greatest clinicalsignificance. It is important for planning of initial surgical correction and for prognosis.
�#�(��)A total of 39 children (age at surgery: 10y±3y) with spastic diplegia and functionaldisturbing increased knee flexion during stance phase or crouch gait were treated withmedial (77 legs) or combined medial and lateral (18 legs) hamstring lengthening in thecontext of multilevel surgery. Intra-operative amount of correction was controlled bypopliteal angle with concomitant Thomas test at the contralateral side. All subjects wereevaluated by a standardized protocol with clinical exam and instrumented three-dimensional gait analysis pre- (E0), 1 year (1.0±0.2, E1), 2-4 years (3.1±1.0, E2) and 6-12 years (8.1±1.8, E3) post-operatively. All patients were at least 16 years old at E3 andgrowth plates was closed in all patients. Recurrence was defined as a loss ofimprovement between the one-year and the 8 year follow-up. P values of <0.05 wereconsidered significant for all statistical methods.
�#)�&�)The results of three-dimensional gait analysis and clinical examination are summarized intable 1. All specific parameters (gait analysis and popliteal angle) showed initialsignificant improvement in E1 compared to the pre-operative values. These parametersdeteriorated significantly in the long-term follow-up, while the GGI did not change overthe years. The popliteal angle nearly reached the pre-operative value. The development ofpopliteal angle and minimum knee flexion during stance are illustrated in Fig. 1. Genurecurvatum (knee flexion in mid-stance < 0 degrees) was found in 38 legs at E1. At E3only in 14 of these 38 legs recurvation remained.
37

Tab1. Mean (SEM) values (in degrees) and statistical results for selected parameters.
ParametersE0
(pre-op)E1
(1 y post)E2
(3 y post)E3
(8 y post)Imp
(0-E1)Recurr(E1-E3)
Knee flexion at initial contact 39 (15) 17 (11)* 22 (11) 24 (11)# 22 7Mean knee flexion in stance 31 (19) 11 (12)* 18 (12) 21 (12)# 20 10Min knee flexion in stance 21 (22) 1 (13)* 9 (13) 13 (13)# 20 12Mean pelvic tilt 16 (9) 21 (8)* 17 (8) 19 (8)Normalcy Index (GGI) 429 (393) 248 (202)* 222 (187) 227 (137)Popliteal angle 51 (18) 30 (19) 38 (16) 49 (16) 21 19Legend: IMP (improvement): difference between pre- (E0) and 1 year post-op (E1); Recurr(ence):difference between 1 year (E1) and 8 years after surgery (E8). One-way ANOVA with significantdifferences between E0 and E1: *; significant differences between E1 and E8: #.
Fig1. (A): Development of minimum knee flexion in stance. (B): Development of popliteal angle.* indicates significant improvement 1 year after sugery; # indicates significant deterioration comparing theE1 (1 year after surgery) and E3 (8 years after surgery).
DiscussionThe results of this study show that recurrence of crouch gait is a problem seen in long-term follow-up, whereas the incidence of genu recurvatum decreased over the years.Deterioration of popliteal angle and dynamic parameters was found. It seems thatintramuscular hamstring lenghtening does not lead to persistent correction of crouch gait.Different factors like increased pelvic tilt, quadriceps weakness and progressive mid-foot-break should also be taken into consideration for the explanation of recurrent crouchgait. Further analysis of the individual data should identify those patients who are proneto recurrence. Newer investigations address the femoral extension osteotomy incombination with patellar advancement as an alternative surgical strategy.[5] Futurestudies should compare this strategy with hamstring lengthening.
References[1] Wren TA., et al. 2005, J Peditar Orthop, 25:79-83.[2] Hicks J., et al. 2007, Gait Posture, 26:546-52.[3] Gordon AB et al., 2008, J Pediatr Orthop, 28:324-9.[4] Park MS., et al., 2009, Gait & Posture, 30:487-91.[5] Stout JL., et al. 2008, J Bone Joint Surg Am, 90:2470-84.
A B
38

Relationship between body fat, strength, and oxygen cost in children with Cerebral Palsy Mitell Sison-Williamson1, Anita Bagley1, George Gorton2, Alina Nicorici1, Mark Abel5, Sahar Hassani6, Diane Nicholson3, Mark Romness5, Chester Tylkowski4, Donna Oeffinger4 1Shriners Hospitals for Children (SHC), Sacramento, CA; 2SHC, Springfield, MA; 3SHC, Salt Lake City, UT; 4SHC, Lexington, KY, 5University of Virginia Children's Hospital, Charlottesville, VA; 6SHC Chicago, IL Introduction: Oxygen cost during level walking is higher in children with Cerebral Palsy (CP) than in typically developing children (1). This increased energy demand for ambulation may lead to reduced participation in physical activities for children with CP. Decreased activity could increase the risk of obesity which has been reported to be rising in children with CP (2). Oxygen cost increases with GMFCS level (3-5), but the relationship to strength and body composition has not been reported. The purpose of this investigation was to determine the relationships between body fat and strength to oxygen cost, and to examine whether these relationships differ between children with diplegia and hemiplegia. Clinical significance: Optimizing walking ability and decreasing oxygen cost to improve endurance and function in children with CP is a common clinical goal. It may be expected that children with CP who are weaker and have increased body fat will require more energy to walk than those who are leaner and stronger. If this is true, clinicians should focus on strength and nutrition programs to help with endurance and function. Methods: Gross Motor Function Classification System levels (GMFCS), Tanner Stage, height, weight, body composition measured as Body Mass Index (BMI) and percent body fat, lower extremity muscle strength, Pediatric Outcomes Data Collection Instrument (PODCI), Gross Motor Function Measure (GMFM66), one minute walk test (1MWT) and oxygen cost were recorded for one hundred twenty seven children with CP from three pediatric orthopedic hospitals (GMFCS levels I – III, aged 8-19 years). Eighty-eight had a diagnosis of diplegia (58 males; 30 females), and 39 had a diagnosis of hemiplegia (16 males; 23 females). Body Fat was measured using a Body Stat Quadscan Bioelectrical Impedance device. Strength of 8 lower extremity muscles were measured bilaterally using a standard protocol and a JTech Commander II Hand Held Dynamometer. The maximum of three efforts was used to calculate the strength scores. Strength scores were averaged across both limbs and normalized to the participant’s weight (Normalized). Strength scores were adjusted to GMFCS levels, Age, CP type, Gender, and Tanner Stage (Normalized Adjusted). Body fat was measured on both sides and averaged to obtain the mean body fat. Pearson correlation coefficients between measures and oxygen cost were calculated. Results: Table 1 displays correlations for the participants grouped by type of CP. Normalized strength was significantly correlated to oxygen cost for those with diplegia (p<0.01; Figure 1). There were no significant correlations between oxygen cost and BMI, fat percentage, or lean percentage. Oxygen cost was significantly correlated to 1MWT time, GMFM66 and PODCI Upper Extremity, Transfers and Sports scores, walking speed, and Gillette Gait Index (GGI) values (p<0.01). Children with hemiplegia showed no significant correlations between oxygen cost and body composition or strength measures. Oxygen cost was significantly correlated to GMFM66 score in this group (p<0.01). Discussion: Results showed that body composition had little to no correlation to oxygen cost in both the diplegic and hemiplegic groups. For children with diplegia, normalized strength had a fair correlation (6) with oxygen cost, indicating that there are other factors that contribute to
39

increased oxygen cost. 1MWT time, GMFM66 and PODCI Transfer scores and GGI values showed moderate to good association with oxygen cost for the diplegic group, similar to previous findings (5). Future research should investigate whether the strength of specific muscles, such as hip and knee extensors, are related to oxygen cost. Further inquiry will study the longitudinal effects of body composition on function and endurance in children with CP. Table 1. Correlation Coefficients with Energy Cost of Walking Diplegia Group n=88 Hemiplegia Group n=39 BMI -.08 .03 Fat Percentage Mean .10 -.21 Lean Percentage Mean -.10 .21 Normalized Strength Right **.31 Normalized Adjusted Strength Right -.001 Normalized Strength Affected Side .06 Normalized Adjusted Affected Strength .18 1MWT **-.65 -.15 GMFM66 **-.69 **-.47 PODCI: Upper Extremity *-.26 -.29 PODCI: Transfers Basic Mobility **-.60 -.17 PODCI: Sports Physical Function **-.43 -.11 Walking Speed **-.44 -.15 GGI **-.56 .29 ** p = 0.01; * p = 0.05
Figure 1. Oxygen Cost vs. Strength Scatter plot
Diplegic Group: Oxygen Cost and Strength
R2 = 0.0942
0.00
0.20
0.40
0.60
0.80
1.00
0.00 1.00 2.00 3.00 4.00 5.00 6.00 7.00
Normalized Strength
Oxy
gen
Cos
t
References: 1. Campbell and Ball. Orthop Clin N Am 1978;9:374-377 2. Rogozinksi et al. J Bone Joint Surg Am, 2007;89:2421-6 3. Johnston et al. Developmental Medicine & Child Neurology 2004; 46:34-38 4. Oeffinger et al. Developmental Medicine & Child Neurology 2004; 46:311-319 5. Sullivan et al. Developmental Medicine & Child Neurology 2007;49:338-344 6. Portney and Watkins, Foundations of Clinical Research 2000 Acknowledgements: Funding for this study was provided by SHC research grant #79158.
40

DIFFERENCES IN MOVEMENT PATTERNS OF THE ASSISTING HAND DURING
A MULTI-COMPONENT BIMANUAL TASK IN TYPICALLY DEVELOPING
CHILDREN AND CHILDREN WITH HEMIPLEGIC CEREBRAL PALSY
Nancy Denniston1, Jessica Davis
1, Mark Hotchkiss
1, and Joanne Valvano
1
1Center for Gait and Movement Analysis (CGMA) The Children’s Hospital, Aurora, CO USA
INTRODUCTION: Children with hemiplegic cerebral palsy (HCP) have poor coordination
of upper extremity (UE) movements on the affected side. Kinematic evaluation of these
disorders has progressed with advances in motion capture technology and modeling strategies,
allowing for more quantifiable analyses of daily living activities. Previous kinematics studies
have evaluated reaching in combination with grasping, transporting and releasing objects
(RGTR). 1,2, 3
Most kinematic studies of subjects with HCP have focused on the affected hand
as the prime mover during uni-manual tasks.1,2,3
However, using the affected hand as an
assist in bimanual tasks is emphasized in physical and occupational therapy. The purpose of
this study was to compare upper extremity kinematics of the affected hand as an assist during
a bimanual task between children with HCP and typically developing children (TD). The
basic RGTR task was expanded to include a component that required stabilization of the
object by the affected hand (RGTSR). We hypothesized that a significant difference in
movement patterns would exist between the two groups.
CLINICAL SIGNIFICANCE: Current intervention strategies for children with HCP are
primarily directed towards improving the ability of the affected hand to assist in bimanual
tasks. Kinematics of the affected upper extremity acting as an assist will aid in clinical
decision-making and in monitoring treatment outcomes.
METHODS: Bilateral UE kinematic data were collected from twelve children with typical
development 5 to12 years of age (8.93 ±2.16) and thirteen children with HCP 5 to 12 years
(8.85 ±2.17) who demonstrated at least minimal voluntary grip and release and no significant
joint limitations. The study was approved by the local institutional review board and informed
consent was obtained. A 13-camera Vicon® Mx™ Motion Capture system was used for data
capture. The kinematic UE model used 20 markers placed on the head (4), trunk (4),
bilaterally on the upper arm (1), elbow lateral epicondyle (1), forearm (1), ulnar and styloid
processes (2) and dorsum of the hand. It was based on the Vicon® Upper Limb Model™ with
in-lab adaptations using information from other models2, 3
to calculate forearm rotation. The
UE model followed guidelines of the International Society of Biomechanics4.
All subjects sat at a table on an armless, backless bench with their feet on the floor and
their knees at right angles. Maximum forward reach was standardized relative to affected arm
length. The RGTSR task required the subject’s non-dominant/affected hand to reach forward
for a vertically oriented “cup” set at arm’s length on the table, grip and transport it back near
the dominant hand, stabilize it as the dominant hand placed three tiny objects (6.5x 6.5 x 2.0
mm) into the cup’s well, place the cup down, then release it. The plastic “cup” was
rectangular (5.0 x 8.0 x 2.5 cm), weighing 0.25 kg, with a top shallow well (1.1 cm x 0.5 cm x
0.9 cm). The shallow well of the cup constrained the subjects to keep it near vertical
throughout the task, facilitating observation of forearm rotation and proximal compensations
for limitations in forearm supination. Each subject performed five trials of the RGTSR task.
41

UE joint angles were calculated for reach, transfer and stabilization phases of the task for
both groups. Variables for movement patterns in the HCP and the TD groups were quantified
by discrete angles, timing variables and ratios between joint ranges. Based on previously
reported limitations in HCP and task-required movement patterns, seven variables were
selected for statistical analysis (Table 1). Variables were analyzed using trimmed averages of
all trials. The normality of the data distribution was examined and independent t-tests were
used to identify differences between the two groups with p ≤ 0.05.
RESULTS: Table 1 shows the variables selected and analyzed to compare the HCP and TD
groups. Transport variables were consistent with the reach results and not reported here. All
measures were statistically different between the two groups except elbow/ shoulder range
ratio and mean supination. Children with HCP had significant reduction in both shoulder and
elbow ranges relative to trunk flexion range, although the ratio of elbow to shoulder
movement was not significantly different. Increased variability existed in support-phase
mean supination of the HCP group.
Table 1: Kinematic and Timing Measures for typical (TD) and hemiplegic cerebral palsy (HCP) Variables Group N Mean LCL* UCL* Minimum Maximum p value
HCP 13 0.85 0.69 1.01 0.42 1.36 0.0985
Reach Phase
Elbow extension range/ Shoulder flexion range
TD 11 1.01 0.90 1.12 0.74 1.23
HCP 13 -0.61 -1.08 -0.13 -2.45 0.18 0.0247 Time (s) maximum elbow extension –Time(s) max shoulder flexion TD 11 -0.05 -0.10 0.01 -0.24 0.02
HCP 13 3.14 2.04 4.24 0.84 8.01 0.0124 Elbow extension range/ Trunk flexion range
TD 11 14.60 6.22 22.98 1.64 44.03
HCP 13 23.52 12.41 34.63 -11.52 47.46 0.0077 Minimum Forearm Supination (deg)† TD 12 5.98 -0.44 12.41 -17.80 17.74
HCP 13 3.81 2.80 4.82 1.18 7.04 0.0112 Shoulder flexion range/ Trunk flexion range TD 11 14.05 6.70 21.40 2.60 39.11
HCP 13 5.33 3.63 7.04 2.51 11.24 0.0003 Support Phase
Trunk Lateral Flexion (deg) TD 12 1.49 1.19 1.79 0.51 2.22
Mean Supination (deg) † HCP 8 20.80 5.08 36.53 -3.60 51.01 .1327
TD 12 10.41 3.53 17.28 -17.82 19.99
*LCL=Lower Confidence Limit, UCL= Upper Confidence Limit † Supination = 00
DISCUSSION: The children with HCP adapted a proximal strategy as found in the
literature1 to accommodate distal limitations of the affected side as shown by increased
anterior trunk movement compensating for reduced elbow extension and forearm supination
when compared to the typical group. Differences in reach coordination between HCP and TD
appeared in the timing variable of shoulder and elbow movement. The stabilization
requirement with the supination constraint during the support phase produced proximal
compensations of increased lateral trunk flexion, but increased variability in mean supination.
This paradigm provides information not previously available to the clinical community.
REFERENCES:
1. Mackey, A.H., Walt, S.E., et al. (2005). Gait & Posture, 22:1-9
2. Rab, G., Petuskey, K., Bagley, A. (2002). Gait & Posture, 15:113-19
3. Kreulen, M., Smeulders, M.J.C., et al. (2005). Gait & Posture, 25:485-492.
4. Wu, G., van der Helmb, F.C.T., et al. (2005). Journal of Biomechanics, 38:981-992
42

PODIUM SESSION #2A
OUTCOMES I. (TREATMENT DECISION MAKING & QUALITY ASSURANCE)
Moderated by:
Donna Oeffinger, Ph.D., Shriners Hospital, Lexington, KY, USA Małgorzata Syczewska, Ir, Ph.D., Children's Memorial Health Institute, Warsaw, Poland
OUTCOMES I. (TREATMENT DECISION MAKING & QUALITY ASSURANCE) 1. Inter-rater Reliability of Strength and Selective Motor Control: Demonstration of Need for
Continued Quality Assurance within a Clinical Motion Laboratory Jean Stout 2. Influence of Gait Analysis on Decision Making for Orthopedic Surgery Tishya Wren 3. Effect of the Rectus Femoris Transfer on Gait and on the "Virtual" Rectus Femoris
Kinematics in Children with Cerebral Palsy Eric Desailly 4. MIS versus Standard TKR: A Prospective Randomized Double Blinded Study Comparing
Postoperative Strength and Functional Recovery Sherry I. Backus 5. Real World Walking Behaviors as an Outcome Measure: Bout Duration Distributions for
Typically Developing Adolescents Michael S. Orendurff 6. Two Year Follow-up of Single Stage Multi-level Surgery in Diplegic Cerebral Palsy Using
Minimally Invasive Techniques Nicky Thompson 7. Ponseti Treatment in the Older Child Jennifer McCahill
43

Inter-rater Reliability of Strength and Selective Motor Control: Demonstration of Need for Continued Quality Assurance within a Clinical Motion Laboratory
Jean Stout, PT,MS, Cammie Beattie, PT, Michael Schwartz, Ph.D., Tom Novacheck, MD
Gillette Children’s Specialty Healthcare, St. Paul, MN USA
Introduction: Attention to quality assurance is an integral aspect of optimal health care. The Commission for Motion Laboratory Accreditation (CMLA) devotes15 of 87 criteria to assessment of quality assurance programs, consistency and competency of personnel in motion laboratory services1. As part of on-going quality assurance and to assess consistency among clinical evaluators per CMLA guidelines, a reliability study of strength and selective motor control assessments used in our laboratory was undertaken. Manual muscle testing (MMT) using a 0-5 Kendall scale (including + and – grading)2 and a 3-level scale of selective motor control developed at our Laboratory3 are used in combination for each muscle assessed. Inter-rater reliability for MMT has been previously reported in the poor to fair range.4-5 Reliability for the selective motor control (SMC) scale has not been previously established. Clinical Significance: Understanding the reliability of physical exam measurements among clinical evaluators within a laboratory is critical to accurate interpretation of data for decision-making, and for assessing changes noted between sessions. Methods: This study received approval from the Institutional Review Board and all subjects gave voluntary consent. A convenience sample of 58 individuals referred for clinical gait analysis was studied. A MMT and SMC score for each of 9 selected muscles (gluteus maximus (GM), hip flexors (HF), hip abductors (Abd), hip adductors (Add), knee flexors (KF), knee extensors (KE), anterior tibialis (AT), posterior tibialis (PT), plantarflexors (PF)) were measured by 2 of 4 physical therapists in the laboratory. All measurements are part of the routine physical examination. The therapist pairings were randomized to provide equal distribution to all possible therapist pairs. The order of the measurements was not controlled. The side of testing was randomized to avoid bias. Inter-rater reliability was assessed using Cohen’s kappa coefficient. Mean inter-rater differences were calculated for MMT scores only. MMT scores were recoded into a numerical scale as reported by Kendall2 for statistical purposes. Original scores were compressed into full grade scores for calculation of Cohen’s kappa only (i.e. 2+ and 2- scores recoded as 2, etc.). Results: Reliability for SMC and MMT scores ranged from poor to good depending on test level (Figure 1). Mean differences were computed to estimate the size of expected errors in MMT data (Figure 2). Data demonstrate moderate reliability or better in 4 of 9 muscles tested for SMC but only 2 of 9 muscles for MMT. Mean strength differences vary from muscle to muscle from less than1/3 grade for the hip flexors to more than 2/3 to a full grade for the gluteus maximus, hip adductors and hip abductors. Discussion: The Cohen’s kappa and mean difference for MMT in the various muscles are consistent with previously reported data for some muscles and less than anticipated in others.1,2 Data for the SMC scale are less than reported using a similar scale with slightly different procedures.6 Further work is planned to stratify by functional level to determine if this is a covariate. This data represents the first stage of a process to assess and review reliability. Stage 2 will be an educational phase. Stage 3 will involve repeat reliability assessment. Despite the general agreement, the difficulty in achieving reliability among a
44

group of physical therapists with >15 years of clinical experience demonstrates that a better means of strength assessment is needed. One option may be handheld dynamometry which has been shown to exhibit better reliability than MMT. The need for continued assessment of consistency among all components of gait analysis testing as suggested by CMLA is also demonstrated.
0
5
10
15
20
25
GM Add Abd AT PT KF KE PF HF
References: 1. Commission for Motion Laboratory Accreditation: Application Review Criteria. from http://www.cmlainc.org/Portal.html 2. Kendall HO, et al. Muscles Testing and Function (Second Edition). 1971. 3. Trost JP. In Gage JR, et al. The Identification and Treatment of Gait Problems in Cerebral Palsy. 2009. 4. Mahoney K, et al. Physical & Occupational Therapy in Pediatrics 29:44-59, 2009 5. Frese E, et al. Physical Therapy 67:1072-1076, 1987 6. Fowler EG et al. Developmental Medicine & Child Neurology 51:607-614, 2009
0
0.2
0.4
0.6
0.8
1
Abd HF PT GM Add AT KF PF KE
SMC Kappa Values
0
0.2
0.4
0.6
0.8
1
GM Abd Add AT KF HF PT KE PF
MMT Kappa Values
5 100 5- 95 4+ 90 4 80 4- 70 3+ 60 3 50 3- 40 2+ 30 2 20 2- 10 1+ 10 1 5 0 0
Figure 1: Cohen’s kappa values for SMC and MMT of 9 different muscles
Figure 2: Mean differences for MMT scores and the transformation to a numerical scale. One full grade difference would be equivalent to 20 or greater depending on actual grades.
Mean Differences
45

INFLUENCE OF GAIT ANALYSIS ON DECISION MAKING FOR ORTHOPEDIC SURGERY
Tishya A. L. Wren, Norman Y. Otsuka, Anthony A. Scaduto, Richard E. Bowen,
Linda S. Chan, Minya Sheng, Reiko Hara, Robert M. Kay Childrens Hospital Los Angeles & Shriners Hospital for Children, Los Angeles, CA
INTRODUCTION Several studies have shown that surgical decision making is altered when gait analysis data are included in the decision making process1-4. However, these studies used observational cohorts, making it difficult to determine how much of the change was due to gait analysis. This study used data from a randomized, controlled trial (RCT) to examine the influence of gait analysis data on surgical decision making. The RCT provides a control group showing how often surgical decisions change, for the same surgeons, without gait analysis. CLINICAL SIGNIFICANCE These results from a randomized, controlled trial provide a stronger level of evidence demonstrating the impact of clinical gait analysis on surgical decision making. This impact includes reinforcement of the surgical plan when gait analysis agrees with a proposed procedure, as well as changes in decision making when gait analysis recommendations differ from the initial plan. METHODS This study included 178 ambulatory children with cerebral palsy (CP), age 3-18 yr, who were candidates for lower extremity orthopaedic surgery to improve gait. All subjects underwent pre-operative gait analysis including physical examination, computerized gait analysis, and electromyography, and standard clinical gait reports were produced. The subjects were randomized to two groups: 1) Gait Report group (N=90), where the referring surgeon received the patient’s gait analysis report and 2) Control group (N=88), where the referring surgeon did not receive the gait report. Data on specific surgical procedures were collected at three time points: 1) referral by treating surgeon before gait analysis, 2) recommendations by gait laboratory surgeon after gait analysis, and 3) actual surgery performed. The procedures studied included psoas lengthening, hip adductor lengthening (ADD), hamstring lengthening (HSL), rectus femoris transfer, tendo-achilles lengthening or gastrocnemius recession (TAL/GR), anterior tibialis tendon transfer, posterior tibialis tendon transfer, posterior tibialis tendon lengthening, foot osteotomy, tibial derotational osteotomy (TDRO), femoral derotational osteotomy (FDRO), and varus derotational osteotomy. The unit of analysis was patient-side. For unilaterally involved subjects, only the affected side was included. The main outcome measure was the relative agreement (RA) between the Gait Report and Control groups, where agreement is defined as the percent agreement between the actual treatment and the gait analysis recommendations and RA is the ratio of the percent agreement of the Gait Report and Control groups. Statistical significance was determined using the 2-sided Fisher’s exact test. Results are shown for the procedures most commonly recommended or done in the study sample.
46

RESULTS When a procedure was planned initially and also recommended by gait analysis, it was performed more often in the Gait Report group, except for TAL/GR which was almost always performed regardless of group (Table 1). When the gait analysis recommendation differed from the initial plan, the surgical plan was changed more often in the Gait Report group, except for derotational osteotomies (Table 2). Procedures were dropped more often than they were added. Overall, 34/68 (50%) of procedures were dropped in the Gait Report group compared with 19/68 (28%) in the Control group (RA: 1.79; 95% CI: 1.14, 2.81; p = 0.01). Only 36/290 (12%) of procedures were added in the Gait Report group compared with 16/228 (7%) in the Control group (RA: 1.77; 95% CI: 1.01, 3.11; p=0.06). The procedure most frequently dropped was TAL/GR, 18/45 (40%) vs. 4/34 (12%) (RA: 3.40; 95% CI:1.27, 9.13; p = 0.006). The procedure most often added was HSL, 8/68 (12%) vs. 0/42 (0%) (p = 0.02). Table 1: Reinforcement of treatment when gait analysis agreed with a planned procedure Procedures done Relative agreement P-value Gait Report Control (95% CI) ADD 100% (36/36) 84% (21/25) 1.19 (1.00, 1.41) 0.02 HSL 89% (34/38) 75% (33/44) 1.19 (0.97, 1.46) 0.15 TAL/GR 94% (15/16) 100% (16/16) 0.94 (0.83, 1.06) 1.00 FDRO+TDRO 80% (12/15) 42% (11/26) 1.89 (1.13, 3.17) 0.03 All Procedures 91% (110/121) 67% (91/133) 1.33 (1.17, 1.51) <0.001 Table 2: Change in treatment when gait analysis disagreed with plan for procedure Procedures added or cancelled Relative agreement P-value Gait Report Control (95% CI) ADD 14% (6/42) 8% (4/48) 1.71 (0.52, 5.67) 0.51 HSL 14% (10/70) 0% (0/46) Undefined 0.006 TAL/GR 40% (21/53) 10% (4/41) 4.06 (1.51, 10.91) 0.002 FDRO+TDRO 18% (14/77) 24% (13/54) 0.76 (0.39, 1.48) 0.51 All Procedures 20% (70/358) 12% (35/296) 1.61 (1.11, 2.34) 0.008 DISCUSSION This RCT shows that gait analysis not only alters decision making as previously reported1-4, it also reinforces decision making when it agrees with the surgeon’s original plan. Without gait analysis, only two-thirds of the planned procedures were actually done. In contrast, over 90% were done when the surgeon received a gait report agreeing that the procedure was needed. When the surgeon received a gait report recommending that surgeries be added to or dropped from the initial plan, 20% of these recommendations were adopted. This rate of accepting gait analysis recommendations is lower than the 86-92% reported in previous studies3,5, but was still significantly greater than the baseline rate of change in the control group. REFERENCES: [1] DeLuca et al., J Pediatr Orthop 17:601-14, 1997. [2] Kay et al., Clin Orthop 372:217-22, 2000. [3] Lofterod et al., Acta Orthop 78:74-80, 2007. [4] Cook et al., J Pediatr Orthop 23:292-5, 2003. [5] Wren et al., J Pediatr Orthop B 14:202-5, 2005. Support provided by AHRQ grant # 5 R01 HS014169.
47

Effect of the rectus femoris transfer on gait and on the "virtual" rectus femoris kinematics in children with cerebral palsy Eric Desailly a,b , Nejib Khouri c, Philippe Sardain b, Farid Hareb a, Lionel Lejeune a, Djilali Bouchakour a, Patrick Lacouture b, Daniel Yepremian a
aFondation Ellen Poidatz, 77310 St Fargeau-Ponthierry, France bLaboratoire de Mécanique des Solides, Université de Poitiers, UMR-6610, CNRS, SP2MI, BP-30179, 86962 Futuroscope-Chasseneuil Cedex, France cHopital Armand Trousseau, AP-HP, 75571 Paris Cedex 12,France Introduction Spasticity of the rectus femoris (RF) is considered as the main cause of stiff knee gait in cerebral palsy 1. The transfer of the rectus RF is one of its most common and validated treatments 2-5 . The transferred muscle, although always spastic, remains flexor of the hip, and would become flexor of the knee rather than extensor 6,7. Nevertheless, this knee flexor mechanical effect is controversial 8-10. And dynamic perturbations occurring before swing phase are also implicated in the stiff knee 11-14. Musculoskeletal studies showed that in stiff knee gait, length and speed of the RF are altered 15,16. No evaluation as been realized to quantify the modifications of those parameters after surgery as it has been done with hamstrings lengthening 17. This one produced useful help to hamstrings surgery indications. Studying the modifications of RF kinematics parameters could provide predictive parameters to the indications of RF transfer which remains an actual question 18. We chose to compare the RF kinematics before surgery to the “virtual” postoperative one meaning "as if it hadn’t been transferred". Clinical significance The objective of this study is triple:
� Study the global effect of the surgical transfer of the RF; � Study the effect of this surgery on the muscular kinematics of the “virtual” RF muscle; � Search for possible kinematic behavior which would contribute to surgical indications.
Methods Sixteen children took part in this study totalizing 26 transfers conducted during multisite surgery. All these subjects were clinically examined before the surgical operation and had a complete gait analysis in pre and post-surgery (>1 year) conditions. The decision criteria having led to the RF transfer were based on a clinical examination (Duncan/Ely test), on an EMG examination (pathological activity during the oscillation), and on a kinematic examination with in particular the criterion of a delayed peak of maximal knee flexion and a deficit of maximum knee flexion during swing. Pre and post surgery clinical gait analysis was used retrospectively to compute the Gait Deviation Index (GDI) 19 and the Goldberg Score 20. A musculoskeletal model was specifically developed to simulate the patella location and the RF path during gait 21. Patients RF kinematics was compared among the two conditions before and after surgery with respect to normative one. This one was computed from our asymptomatic gait database.
48

� A RF was considered as “short” if its maximum length was lower than the normal average maximum length minus two standard deviations.
� The timing of the maximum length peak was considered as “early” if it occurs earlier than the instant of the normal average maximum length peak minus two standard deviations.
� A RF muscle is considered as “slow” if its maximal lengthening speed is lower than the normal average maximal speed minus two standard deviations.
� Finally the timing of the peak of maximal speed is considered as “early” if it occurs earlier than the instant of the normal average peak of maximal speed minus two standard deviations.
The times of the peaks of maximal length and maximal speed were measured from the instants of beginning of the oscillation phases. Results The gait quality is improved (+18±12 GDI) (Student T-test: F=2.06; p<0.05) with a negative interaction between the pre operative GDI and its improvement (Coefficient of Pearson= -0.81; p<0.05). The Golberg score is improved in 88% of the cases (Fisher exact test: p < 0.05). The surgery had a significant effect (Fisher exact test: p < 0.05) on the normalization of the timings of maximum length and speed of the RF. The improvement of the stiff knee is correlated with the normalization of the timing of maximum length of the RF (Fisher exact test: p < 0.05). Discussion The improvement of the gait quality is all the more important that it was degraded with a risk not to improve it if its GDI is higher than 75. The standardization of the RF peak length timing is correlated with the improvement of the knee oscillation. The presence of this early timing would sign a possible improvement of the stiff knee by the surgery. The precocity of the peak lengthening speed of the RF can explain an early release of the spasticity during the stance which would then limit the lengthening velocity of the RF. The global improvement of the gait quality and of the stiff knee was shown. Certain parameters of muscular kinematics were standardized, showing an effect of the transfer during the swing but also during the stance. Although the stiff knee is a complex phenomenon not reducible to the only RF kinematics it seems that the precocity of the RF peak length timing could be a prognostic factor of surgical success. References 1. Perry, J. Gait analysis. (Slack: 1992). 2. Chambers, H. et al. J Pediatr Orthop (1998). 3. Ounpuu, S. et al. J Pediatr Orthop (1993). 4. Ounpuu, S. et al. J Pediatr Orthop (1993). 5. Sutherland, D.H. et al. J Pediatr Orthop (1990). 6. Gage, J.R. et al. Dev Med Child Neurol (1987). 7. Perry, J. Dev Med Child Neurol (1987). 8. Asakawa, D.S. et al. J. Bone Jt. Surg. Ser. A (2004). 9. Asakawa, D.S. et al. Journal of biomechanics (2002). 10. Riewald, S.A. & Delp, S.L. DMCN (1997). 11. Anderson, F.C. et al. Journal of biomechanics (2004).
12. Goldberg, S.R. et al. Journal of biomechanics (2004). 13. Jonkers, I. et al.Gait Posture (2003). 14. Piazza, S.J. et al. Journal of Biomechanics (2004). 15. Jonkers, I. et al. Gait & posture (2006). 16. Stewart, C. et al. Gait Posture (1999). 17. Arnold, A.S. et al. Gait & posture (2006). 18. Reinbolt, J.A. et al. Gait & Posture (2009). 19. Schwartz, M.H. & Rozumalski, A.Gait Posture (2008). 20. Goldberg, S.R. et al. Journal of biomechanics (2006). 21. Desailly, E. PhD Thesis (2008).
49

MIS versus Standard TKR: A prospective randomized double blinded study comparing postoperative strength and functional recovery. SI Backus, PT, DPT, MA, B Nestor, MD; K Foote, MEd; M Neuman, B Chow, PT, MS; S Lyman, PhD; HJ Hillstrom, PhD; C Toulson MD; R Windsor, MD
Introduction: Previously documented advantages of minimally invasive surgery (MIS) for total knee replacement (TKR) include less postoperative pain and improved early range of motion (ROM).(1) However, prospective studies to date only use matched controls and fail to control for patient expectations, the placebo effect, and selection bias of the surgeon.(2) The purpose of this study was to determine, in a prospective randomized double-blinded study, whether the MIS midvastus approach compared to the standard surgical approach for TKR resulted in differences in knee strength; clinical, gait and radiographic measures; outcome scores; and tourniquet time. Clinical Significance: These results provide data about short-term recovery following TKR with respect to the impact of surgical approach. This gives healthcare providers and patients additional information for the pre-surgical decision making process. Methods: Twenty-seven individuals (18F, 9M), 66±10 years old, scheduled to have primary bilateral TKR for osteoarthritis were enrolled in this IRB approved study. Subjects had a MIS midvastus approach on one knee and a standard quadriceps-splitting approach on the other knee. Within a subject, the side selected for each surgical approach was randomized. Incision lengths were standardized between sides to ensure blinding for both patients and assessors; only the surgeon was unblinded. The primary outcomes were postoperative knee extensor (KE) and flexor (KF) peak torques during isometric (KE at 60°; KF at 30° of knee flexion) and isokinetic (60°/sec and 180°/sec) contractions. In addition to the absolute changes in torque, the ratios of postoperative to preoperative values were calculated at each visit. Secondary outcome measures included goniometric measurements of active knee ROM, thigh circumference, pain on visual analog scales, and selected time-distance gait parameters (step length and single limb stance time while walking over an instrumented walkway) as well as Knee Society, SF-12, or WOMAC scores; radiographic alignment; and tourniquet time. All outcomes were assessed preoperatively and at postoperative week 3, 6 and 12. In addition, ROM, thigh circumference and pain were recorded postoperative day 1, 2, 3. Paired t-tests, with Bonferoni correction (alpha of 0.05) were used for statistical analysis. Results: Despite randomization, a single preoperative parameter, KE isometric peak torque (at 30° only) was greater for the MIS knee, (69 ± 29 vs 64 ± 26 Nm, p=.026).
Table1. KE Torque (Nm) Means MIS Standard sd of difference p Value
Preop Isometric KE 30° 69.4 63.5 12.9 .026 3 week Isometric KE 60° 66.4 49.3 24.3 .001 3 week Isometric KE 30° 55.3 45.6 18.5 .015 3 week Isokinetic KE @ 60°/sec 36.4 28.4 15.1 .014 3 week Isokinetic KE @ 180°/sec 22.9 17.8 10.7 .026
Only at the 3 week postoperative visit was there a significant increase in KE isometric and isokinetic torques for the MIS knee as compared to the standard approach. By 6 weeks, these differences were no longer present. At 6 weeks, the only difference seen was that the KF
50

were stronger isometrically for the side with the MIS approach. There were no other strength differences between approaches. When the ratios of postoperative to preoperative strength were compared, there were no differences at any of the time points (Table 2).
Table 2. KE Torque Mean Ratios ConditionPosition or
speed MIS Standard
sd of paired difference
p Value
60° .65 .53 .26 .030 *Isometric 30° .85 .72 .30 .045 *
60°/sec .60 .57 .55 .756 Ratio 3 week/Preop
Isokinetic180°/sec .65 .50 .39 .072
60° .82 .81 .27 .845 Isometric
30° .99 1.04 .38 .494 60°/sec .77 .87 .60 .409
Ratio 6 week/Preop Isokinetic
180°/sec .86 1.03 .66 .210 60° .99 1.00 .37 .881
Isometric30° 1.28 1.20 .51 .440
60°/sec 1.11 1.13 .72 .869 Ratio 12 week/Preop
Isokinetic180°/sec 1.18 1.23 .84 .753
For the secondary outcome measures, the only difference was increased knee flexion for MIS knees compared to the standard knees on postoperative day 3, (89° ± 15° vs 85° ± 13°, p=0.001). There was no difference in flexion at any other time points and no differences for thigh circumference, pain on visual analog scales, and gait parameters, Knee Society, SF-12, or WOMAC scores, and radiographic alignment at any time point. While there were no differences for tibial component alignment in the coronal plane (0 ± 2° varus for MIS and 1 ± 1° varus for standard approach), there were two outliers (4° valgus, 4° varus) in the MIS knee, and none in the standard knee. Tourniquet times in the MIS knee were significantly longer, 47 ± 9 minutes vs. 39 ±7 (p<0.0001). Discussion: The observed increased KE in the MIS knee at 3 weeks postoperatively is consistent with other studies that have shown improved KE at 1 week and 2 weeks postoperatively.(3) However, the KE strength advantage observed at three weeks in this study for the MIS approach was lost by six weeks with no significant differences observed at 6 and 12 weeks postoperatively. Unlike previous studies, with the exception of postoperative day 3 flexion, we did not document less postoperative pain and increased ROM for the MIS approach.(4) There appears to be limited benefit of the MIS midvastus approach compared to the standard approach for TKR for pain, clinical measures, alignment and gait with consistent differences noted for knee extensor strength only at a single point (3 weeks postop) during the early recovery period (0–12 weeks). During the immediate postoperative phase (≤1 week) and by 12 weeks postoperatively, there were no differences between the two surgical approaches. References: 1. Kolisek FR. J Arthroplasty 2007 January; 22:8-13. 2. Chang CH. Clin Orthop Relat Res 2002 May;(398)(398):189-95. 3. Tashiro Y. Clin Orthop Relat Res 2007 Oct; 463:144-150. 4. Schroer WC. J Arthroplasty 2008 January; 23:19-25. Acknowledgements: The Knee Society
51

REAL WORLD WALKING BEHAVIOR IN CHILDREN TREATED FOR CLUBFOOT
Michael S. Orendurff, Vy K. Do, Kelly Jeans, Lori A. Karol
Movement Science Laboratory, Texas Scottish Rite Hospital for Children, Dallas, TX, USA [email protected]
INTRODUCTION Treatment for congenital talpes equinovarus (clubfoot) can include surgical posteriomedial releases, Ponseti serial casting or French functional (physical therapy) methods. Several studies have evaluated the efficacy of these treatments using computerized gait analysis[1-3]. However, limited data exists on how technical metrics of joint function observed in the gait laboratory translate to performance on typical locomotor behavior in real world settings. CLINICAL SIGNIFICANCE Quantifying the real world locomotor behavior of children treated for clubfoot will improve our understanding of the relationship between ankle kinetics and functional performance. METHODS This initial cohort of seven children treated for club foot is part of a larger study of club foot treatment outcomes. The protocol was approved by the Institutional Review Board governing this institution. Parents signed informed consent to participate in the study and freely chose their child’s initial treatment option and ongoing care. For this group initial treatment was the French functional physical therapy method, and five children went on to have posteriomedial releases before their fourth birthday. All children are now over 10 years of age. The children each wore a StepWatch Activity Monitor (OrthoCare Innovations, Mountlake Terrace, Washington, USA) on their ankle for one week. The StepWatch was programmed to record all steps in each 10 second time interval. The data was processed using custom code that summed sequential steps. A frequency analysis divided sequential steps into nine categories: 10 steps in a row; 20 steps in a row; 50 steps in a row; 100 steps in a row; 200 steps in a row; 300 steps in a row; 500 steps in a row; 1000 steps in a row and 2000+ steps in a row. The total number of daily steps was also recorded. ANOVAs and Scheffe’s tests post-hoc were utilized to compare sequential step distributions to age-matched typically developing children. RESULTS The ten year old children treated for clubfoot had significantly fewer total daily steps compared to the typically developing ten year old children (13,168 ± 5081 versus 15,204 ± 5681; p < 0.0158). The clubfoot treated children had no significant differences in the number of steps at 10, 20, 50 or 100 steps in a row (p >0.141) or at longer durations of 500 and 1000 steps in a row (p > 0.129). However they did have a significantly lower number of steps in walking bouts of 200 and 300 steps in a row (p< 0.0435 and p< 0.0073 respectively). Bouts of 2000+ steps in a row were not observed in either group of ten year old children.
52

DISCUSSION Despite failing non-operative treatment and progressing to posteriomedial release surgery by about 3 years of age this cohort of children diagnosed with clubfoot show minimal disturbances to performance on typical walking durations by their 10th year of life. They appear able to achieve the walking bout durations needed for transport during their day: the short duration walking to move about at school, at home and in the community. Moderate walking durations, those with 200 to 300 steps in a row generally occur just a few times each day and represent walking from classroom to auto or bus transport. This may be the only walking for transport that elicits a feeling of weakness or pain for these children in their affected foot or ankle. Despite the apparent limitations on moderate length walking bouts, these children treated for club foot appear able to participate fully in the long duration locomotor behaviors (500-1000 steps in a row) that are typically associated with play behavior during recess, physical education classes, playground games and after school activities. These data suggest that these children are active enough to receive adequate stimulus for general musculoskeletal development at this time. However, the treated children may not be as fast at running as their peers due to their reduced ankle power[1]. None of the participants had bouts of 2000+ steps in a row, a behavior that generally appears at age 11 in typically developing children. With the expected onset of these longer bout durations in the next year of life, children treated for clubfoot may not be able to participate fully in exercise-level activity with their peers. REFERENCES 1. Karol, L.A., et al, J Pediatr Orthop, 1997. 17(6): p. 790-5. 2. Karol, L.A., et al, J Pediatr Orthop, 2005. 25(2): p. 236-40. 3. Karol, L.A., et al, Clin Orthop Relat Res, 2009. 467(5):1206-13
0
500
1000
1500
2000
2500
3000
3500
4000
10 20 50 100 200 300 500 1000 2000+
10 Yr Club Foot10 Yr Norms
**
Locomotor Behavior for Play:Exercise-level Activity
Walking for Transport:The Gait of Daily Living
Number of Steps in a Row
Num
ber o
f Ste
ps
1299 15
68
1426
1903
p< 0.0435
p< 0.0073
0
500
1000
1500
2000
2500
3000
3500
4000
10 20 50 100 200 300 500 1000 2000+
10 Yr Club Foot10 Yr Norms
**
Locomotor Behavior for Play:Exercise-level Activity
Walking for Transport:The Gait of Daily Living
Number of Steps in a Row
Num
ber o
f Ste
ps
1299 15
68
1426
1903
0
500
1000
1500
2000
2500
3000
3500
4000
10 20 50 100 200 300 500 1000 2000+
10 Yr Club Foot10 Yr Norms
**
Locomotor Behavior for Play:Exercise-level Activity
Walking for Transport:The Gait of Daily Living
Number of Steps in a Row
Num
ber o
f Ste
ps
1299 15
68
1426
1903
p< 0.0435
p< 0.0073
53

Two year follow-up of single stage multi-level surgery in diplegic cerebral palsy using minimally invasive techniques
N.THOMPSON MCSP MSc1,3, J.STEBBINS DPhil1, M.SENIOROU MD, DPhil1 D.J. NEWHAM FCSP, PhD3, T.N THEOLOGIS FRCS MSc PhD1,2 1Oxford Gait Laboratory & 2Nuffield Department of Orthopaedic Surgery, Nuffield Orthopaedic Centre, Oxford, 3Division of Applied Biomedical Research, King’s College London, UK.
INTRODUCTION Muscle weakness is a recognised problem in children with cerebral palsy (CP). We have previously shown that one year after single-stage multi-level surgery (SSMLS), muscle strength and motor function do not return to pre-operative levels, despite significant gait improvements. We have therefore combined minimally invasive surgical techniques that allow earlier mobilisation, with strength training. This includes performing derotation osteotomies using closed corticotomy and intramedullary stable elastic nail fixation (ISEN), and replacing open muscle lengthening with percutaneous lengthening where possible. Our previous work demonstrated that SSMLS using minimally invasive techniques achieved comparable results to conventional SSMLS at one year of follow-up, with the additional benefits of improved muscle strength, faster mobilisation and reduced operative time and blood loss(1). The present study presents the results of this type of treatment at two years of follow-up. CLINICAL SIGNIFICANCE Performing multi-level surgery can safely and effectively be achieved with minimally invasive techniques. Kinematic improvements are maintained at two years of follow-up, while muscle strength and function gradually return to pre-operative levels by 12 months and are maintained at 2 years post-operatively. METHODS 10 children with diplegic CP (mean age 11.1 years) underwent minimally invasive SSMLS (n=19 operated limbs) combined with resisted strength training at 3 months after surgery. The same surgeon performed all operations in an Orthopaedic Hospital setting. Clinical examination, gait kinematics (Vicon MX) and Gillette Gait Index, isometric muscle strength (MIE digital dynamometry) and motor function (GMFM 88) were assessed pre-operatively and 6, 12 and 24 months after surgery. Differences in the pre-operative data and the 6, 12 and 24 month measurements were compared using ANOVA and Tukey post hoc testing. Significance was set at p<0.05. RESULTS Gait Data Significant improvement in hip rotation was observed at 6 months only (p<0.01), while foot progression angles were significantly improved at 6, 12 and 24 months post-operatively (p<0.01). In the sagittal plane, pelvic tilt significantly increased at 6 months (p<0.001) but improved again by 12 months and was maintained at 24 months. Knee flexion at initial contact and maximum knee extension in stance significantly improved at 6 months and were maintained at 12 and 24 months(p<0.05).
54

Muscle Strength All 6 tested muscle groups lost strength at 6 months but this was only significant in the knee flexors (p<0.001), knee extensors tested at 90° of flexion (p<0.01) and the hip flexors (p<0.05). Muscle strength went on to improve at 12 and 24 months, and no significant difference was found in strength compared with pre-op, except in the knee flexors which remained significantly weaker at 12 and 24 months (p<0.001). GMFM A trend to loss of function in GMFM dimensions III, IV & V and total GMFM score was observed at 6 months. There was a trend towards subsequent improvement at 12 and 24 months but no significant differences were found when compared to pre-op. DISCUSSION Kinematic improvements were overall maintained at two years of follow-up. Some loss of hip rotation correction was seen and this has been reported before following femoral derotation osteotomy(2). It may be that a degree of overcorrection during surgery would be desirable. The preservation of sagittal kinematic improvements is encouraging and indicates that the minimally invasive soft tissue lengthening was sufficient to provide lasting correction. The early increase in pelvic tilt was probably the result of hamstrings post-surgical weakness and this improved at 12 and 24 months. It is also encouraging that muscle strength in all groups, except the knee flexors, was not significantly different to pre-op at 12 and 24 months. We previously found significant loss of muscle strength at 12 months of follow-up in patients who had undergone conventional SSMLS(3). The present results would therefore indicate an improvement over conventional techniques of surgery. The GMFM variation followed the expected course. It is widely accepted that functional recovery from SSMLS requires prolonged rehabilitation and the drop in GMFM at 6 months post-operatively was not surprising. We observed a similar pattern in patients who had undergone conventional SSMLS. The return of the GMFM scores to the pre-operative levels at 12 and 24 months of follow-up indicates adequate functional recovery and represents an improvement over conventional SSMLS. REFERENCES
(1) Thompson et al., 2009. The use of minimally invasive techniques in multi-level surgery for children with cerebral palsy: Preliminary results. Dev. Med. Child Neurol. 51, S5, 4-5
(2) Dreher et al., 2007. Internal rotation gait in spastic diplegia – Critical considerations for the femoral derotation osteotomy. Gait & Posture, 26, 25-31.
(3) Seniorou et al, 2007. Recovery of muscle strength following multi-level diplegic cerebral palsy. Gait & Posture, 26, 485-471.
55

Ponseti treatment in the older child 1J. McCahill, 2C.Naylor, 2C.Calderon, 1,2R.Buckingham
1Oxford Gait Laboratory, Nuffield Orthopaedic Centre, Oxford, UK, 2Royal Berkshire Hospital, Reading, UK
INTRODUCTION The Ponseti method of clubfoot correction has been shown in the literature to be beneficial in children up to 6 months of age at the initiation of treatment. Less is known about the success of the Ponseti method in older children with residual deformity following their initial treatment. This study looks at the early results of the Ponseti method in 15 children (19 feet) aged between 2 and 14 years at the initiation of treatment. CLINICAL SIGNIFICANCE Our results suggest the Ponseti method is successful in treatment of the under-corrected or relapsed clubfoot in children aged between 2 and 14 years, including those with previous surgical intervention. METHODS 15 children (19 feet) aged between 2 and 14 years presented with relapsed or under-corrected clubfeet. All had previous treatment from birth with strapping and Bebax or Piedro boots. 9 had subsequently undergone posterior release of the Achilles tendon, ankle and subtalar joint through a longitudinal posterior incision. One underwent bilateral posteromedial releases at the age of 10 weeks followed by tibial de-rotations at 2 ½ years old. Comparison was made of their presenting and post treatment Pirani Scores and weight bearing foot posture. In the 11 younger children, observational gait analysis was compared pre and post treatment. In the 4 older children, 3-Dimensional gait analysis pre and post treatment was completed including lower limb kinematics, OFM [1] kinematics and plantar pressure. Kinematic data was collected with a 12 camera Vicon 612 system (Oxford, UK). Plantar pressure data were collected with a Novel Emed system (Germany). RESULTS All patients presented with absent heel strike, walking on the lateral border of their foot. 16 feet had a varus heel and 17 had an internal foot progression. Mean Pirani score was 2.14. Photographs and videos were taken. Ponseti casting was implemented. 15 feet required an Achilles tenotomy, and 15 feet had a tibialis anterior transfer to help maintain the correction. Pirani scores improved from a mean of 2.64 to 0.21 in the group that had had previous surgery, and 1.64 to 0.07 in those that had had previous conservative treatment. All patients achieved a heel strike and ceased to walk on the lateral border of the foot. Heel varus corrected in 13/16 feet and partially corrected in 3 feet. Internal foot progression resolved in 14/17 feet and improved in
56

3 feet. At latest follow up (16 months- 20 months), all transfers were working and all patients walked with heel strike and a plantargrade foot. 2 patients required further casting for relapse in forefoot adductus, and one for recurrent posterior tightness. In the 4 older patients (5 feet), pre and post treatment comparison of the multi-segment foot kinematics revealed improvement of the reduced hindfoot range of motion in the sagittal plane in all 5 feet. One patient had fixed hindfoot equinus of ~35� pre treatment which was corrected to normal limits post treatment. In the coronal plane hindfoot varus was improved or corrected in 4/5 feet and forefoot supination in relation to the hindfoot was corrected in 2/2 feet. In the transverse plane hindfoot internal rotation was improved or corrected in 4/5 feet and forefoot adduction in relation to the hindfoot was improved or corrected in all 5 feet. Plantar pressure comparison pre and post treatment showed improved distribution of the force pattern including reduction of the ‘bean-shape’ deformity. The heel contact improved in all 5 feet with reduction in the force through the metatarsal heads.
Figure 1: Plantar pressure pre and post treatment DISCUSSION Our results suggest that Ponseti casting is successful in minimizing residual clubfoot deformity in older children, including children initially treated with surgery. Following the casting, additional procedures such as an Achilles tenotomy or lengthening may be needed to improve dorsiflexion range. In addition, an anterior tibialis tendon transfer may be beneficial to maintain the correction achieved with casting. Preliminary gait analysis results demonstrates improved hindfoot and forefoot kinematics post treatment, especially in the coronal and transverse planes. Plantar pressure improves post treatment with a more normal distribution of force. REFERENCES
1. Stebbins J, et al. Gait & Posture, 23(4), 401-10, 2006.
57

PODIUM SESSION #2B
PROSTHETICS AND ORTHOTICS & MUSCLES AND EMG
Moderated by: Mark McMulkin, Ph.D., Shriners Hospital, Spokane, WA
Julie Stebbins, Ph.D., Nuffield Orthopaedic Hospital, Oxford, UK.
PROSTHETICS AND ORTHOTICS & MUSCLES AND EMG 1. The African Disability Scooter: Efficiency Testing in Malawi Amputees Jennifer McCahill 2. Biomechanical Effects of a Controlled Energy Storage and Return Prosthetic Foot Ava
Segal 3. Does the Anatomical Foot and Ankle Motion Really Change Following Orthotic
Intervention in Children with Spastic CP? Xue-Cheng Liu 4. Weight Transfer Analysis in Adults with Hemiplegia Using Ankle Foot Orthotics Karen J.
Nolan 5. An EMG-driven Muscle-skeletal Model to Estimate Energy Consumption During
Movement Maria Cristina Bisi 6. Electromyographic Comparison of Overground Walking, Treadmill Walking, Stationary
Cycling, and Elliptical Stepping Laura A. Prosser 7. A Novel Index to Quantify Velocity-dependent Muscle Activation During Gait Oren Tirosh
58

The African Disability Scooter: Efficiency testing in Malawi Amputees1V.Beckles, 2 J. Stebbins , 2J McCahill, 3J. Church, 4,5C. Lavy
1Barking Havering & Redbridge Hospitals NHS Trust, Romford, UK2Oxford Gait Laboratory, Nuffield Orthopaedic Centre, Oxford UK
3 Wycombe General Hospital, High Wycombe UK4 Nuffield Department of Orthopaedic Surgery, Nuffield Orthopaedic Centre, Oxford UK
5London School of Hygiene and Tropical Medicine, London UK
INTRODUCTIONThe African Disability Scooter (ADS) was developed to improve independent mobility andprovide functional access to a range of terrains and conditions, for people with an amputated lower limb, where prosthetic services are not easily accessible. When tested in healthy subjects, the ADS was found to be significantly faster and more energy efficient compared to crutch walking over a fixed distance at a self selected speed [1]. The aim of this study was to test the efficiency of the ADS in an African environment with a population of amputees.
CLINICAL SIGNIFICANCEThe ADS is more energy efficient than crutch walking in young individual with amputations.This study showed subjects using the ADS demonstrate a learning effect with a significant reduction in oxygen cost and a trend to increasing speed over the first week of daily use.
METHODSEight subjects (6 female and 2 male) with a mean age of 12 years participated. Two had above-knee amputations and 6 had below knee amputations. The cause of amputation was eithercongenital or traumatic . The time since amputation was between 2-10 years, and all participants were regular prosthesis users. The subjects participated in the trial over a 10 day period. Energyexpenditure and speed were calculated with the COSMED K4b2 system for the following conditions: Walking with their prosthetic limb, walking with crutches, using the ADS over level ground with and without their prosthetic limb, and using the ADS over grass. Repeated testing was completed on the scooter over level ground on days 1, 2 and 9 to assess the learning effect.
RESULTSUsing repeated measures ANOVA (p<0.05) with post hoc Tukey test, there was a significant difference in the oxygen cost between repeated trials over level ground (p=0.03) (Figure 1). The difference in speed was not quite significant (p=0.05), but showed a trend towards increasing speed (Figure 2). There were no significant differences in oxygen consumption (VO2) or heart rate. Testing between different conditions was also performed with a repeated measures ANOVA with post hoc Tukey test (p<0.05). There was no difference in oxygen cost between conditions (p=0.07) but this was almost double for crutch walking compared to using the scooter over level ground (Figure 3). Speed was significantly different (p=0.004) between the scooter on a level surface and crutch walking (Figure 4), with the scooter being significantly faster.
59

Figure 1: O2 cost between trials Figure 2: Mean speed between trials
Figure 3: Mean O2 cost between conditions Figure 4: Mean speed between conditions
DISCUSSIONOur results confirm a learning effect with continued use of the ADS. As in the healthy population, the ADS shows a trend to be more energy efficient to use than crutches, even when using the scooter on uneven terrain. Therefore, the ADS looks promising as an alternative to crutches for amputees in countries without access to a prosthetics service.
REFERENCESMcCahill, Jennifer, Stebbins, Julie, Bates, Joanne, Batchelor, Andrew, Church, John and Lavy, Chris (2009) 'The African Disability Scooter: Preliminary analysis of a new mobility aid',Disability and Rehabilitation: Assistive Technology,4:5,353 —356.
60

BIOMECHANICAL EFFECTS OF A CONTROLLED ENERGY STORAGE AND RETURN PROSTHETIC FOOT
Ava Segal, MS1, Karl Zelik, MS5, Steve Collins, PhD6,7, Peter Adamczyk, PhD5,7, Glenn Klute, PhD1-3, Michael Hahn, PhD1,2, Michael Orendurff, MS8, David Morgenroth, MD1,4, Arthur Kuo, PhD5, Joseph Czerniecki, MD1,4
1Dept. of Veterans Affairs, RR&D Center, Seattle, WA; Depts. of 2Mech. Eng., 3Electrical Eng., & 4Rehab Med., U. of WA, Seattle, WA, USA; 5Dept. Of Mech. Eng., U. of MI, Ann Arbor, MI, USA; 6Bio-robotics Laboratory, Delft
University of Technology, Delft, The Netherlands; 7Intelligent Prosthetic Systems, LLC, Ann Arbor, MI, USA. 8Movement Science Laboratory, Texas Scottish Rite Hospital for Children, Dallas, Texas, USA.
INTRODUCTION Amputee ankle function remains limited due to a lack of plantar-flexor musculature that leads to reduced ankle push-off and compensations at other joints compared to non-amputees [1]. Energy storage and return (ESR) feet attempt to address this problem by returning mechanical energy absorbed through mid-stance, rather than dissipating it through viscoelastic deformation as with conventional prosthetic feet. However, these feet have not demonstrated significant improvements in biomechanical measurements [2], possibly because the timing of stored energy release is not controlled or optimized. A quasi-passive foot that can more precisely control the capture and return of elastic energy may address this issue. The aim of this study was to test the efficacy of a microprocessor-controlled prosthetic foot designed to capture some of the energy dissipated at foot contact, store it in a spring in the heel with a locking mechanism and transfer it to the toe by releasing the spring just prior to push-off.
r
CLINICAL RELEVANCE A controlled energy storage and return (CESR) foot (Figure 1) that increases prosthetic limb push-off power and work through recycled negative energy may improve mobility by reducing the mechanical work required of both limbs, leading to improved gait symmetry and educed collision on the contralateral intact limb. Figure 1: CESR foot design
with energy storing spring METHODS Seven unilateral transtibial amputees (52.3 ± 12 yrs, 1.85 ± 0.05 m, 80.9 ± 9.9 kg) gave informed consent to participate in this IRB approved study. Each subject was fit with our prototype CESR foot, a weight-matched conventional (CONV) foot (Seattle Lightfoot2TM,Seattle Systems, Poulsbo, WA), and their prescribed (PRES) foot. Each foot was optimally aligned by the same experienced prosthetist and subjects were given at least 10 minutes of practice with each foot on a previous day. Subjects wore each foot in random order and walked at a controlled walking speed (1.14 ± 0.11 m/s) along a 10 m walkway with four embedded force plates (2 Bertec, Columbus, OH; 2 AMTI, Watertown, MA). Thirty-five 14 mm reflective markers were placed on each participant at locations consistent with Vicon’s Plug-in-Gait full-body model (Oxford Metrics, Oxford, England). Data were collected with a 12-camera Vicon MX System and gait biomechanics were calculated using the Plug-in-Gait model. Peak sagittal plane ankle power and the first peak of the vertical ground reaction force (vGRF) were extracted for each condition
61

using Event Analyzer (Vaquita Software, Zaragoza, Spain). Push-off work at the ankle was calculated as the integral of positive ankle power generated. Center of mass (COM) work rate was calculated as the dot product of the GRF and COM velocity [3]. Push-off and collision work were then calculated as the positive and negative integrals, respectively, of COM work rate during the push-off and collision phases of gait. Differences across condition were determined using linear mixed effects models with foot condition (CESR, CONV, PRES) as the fixed effect and subject as the random effect. Statistical significance was set at p < 0.05.
RESULTSCESR ankle power and positive work increased for the prosthetic limb compared to CONV and PRES and decreased for the intact limb compared to CONV (Table1, Fig 2). A decrease in intact limb initial peak vGRF was also found for CESR compared to CONV. CESR also showed an increase in COM push-off work for the prosthetic limb with a concomitant decrease in intact limb COM collision work as compared to CONV and PRES (Table 1). Subjects walked at an equivalent stride length of 1.4 ± 0.05 m for all conditions.
Figure 2: The effect of foot type on average (n=7) ankle power (W/kg) for the intact and prosthetic limbs.
DISCUSSION The CESR foot demonstrated increased prosthetic limb push-off power and work compared to CONV and PRES, although it appeared less than the intact limb. By demonstrating increased prosthetic limb COM push-off work and decreased collision on the intact limb, these results are consistent with dynamic walking model predictions [3]. Amputees wearing the CESR foot walked with increased ankle push-off symmetry and reduced compensation during constant speed gait.
TABLE 1: Sample Means ± SD CESR CONV PRES p-valuePros. Peak Ankle Power Gen (W/kg) 2.49 ± 0.64 0.90 ± 0.18 1.55 ±0.47 0.0004abc
Intact Peak Ankle Power Gen (W/kg) 2.70 ± 0.67 3.17 ± 0.88 2.97 ±0.47 0.0023a
Pros. Ankle Work (J/kg/m) 0.14 ± 0.013 0.056 ± 0.021 0.082 ± 0.024 <0.0001abc
Intact Vertical GRF (First Peak, N/kg) 9.74 ± 0.63 11.23 ± 0.91 10.48 ± 0.68 0.019ac
Pros. COM Push-off Work (J/kg/m) 0.152 ± 0.015 0.070 ± 0.014 0.096 ± 0.016 <0.0001ab
Intact COM Collision Work (J/kg/m) -0.056 ± 0.012 -0.147 ± 0.069 -0.103 ± 0.021 0.0011ab
Significant difference between aCESR - CONV, bCESR - PRES, cCONV - PRES (all paired comparisons p<0.017).
REFERENCES [1] Gitter, A. et al., (1991) Am J Phys Med Rehabil. 70(3): 142-8. [2] Versluys, R. et al., (2009) Disability and Rehab: Assistive Tech. 4(2): 65-75. [3] Donelan, JM. et al., (2002) J Biomech. 35: 117-124.
ACKNOWLEDGEMENTS This work was supported by the Department of Veterans Affairs, RR&D Service (A4372R).
62

Does the Anatomical Foot and Ankle Motion Really Change Following Orthotic Intervention in Children with Spastic CP?
XC. Liu, 1D. Embrey, R. Lyon, C. Tassone, 2F. Klingbeil, 1BA. Brandsma, C. Marquez, 3S.Tarima, J.Thometz, and 4E.Dabrowski
Dept. of Ortho Surg., 2PMR, Children’s Hospital of WI;3Medical College of Wisconsin, WI; 1Therapy Unit, Good Samaritan Hospital, WA; 4PMR, Children's Hospital of Michigan, MI.
Introduction: Most studies have shown that the use of solid ankle foot orthoses (SAFO) reduces equinus. Hinged ankle foot orthoses (HAFO) prevent equinus in the stance and swing phase. Supramalleolar orthoses (SMO) have very little measurable effect (1, 2). However, all of the measurements in the studies were taken using external shoe markers which measure the orthotics motion rather than underlying anatomical foot motion. This study applied a six-segment-foot model to measure foot and ankle joint motion while patients were wearing orthoses. The goals of this study were: 1) to determine inter-observer and intra-observer reliability of the 6-segment foot model in children with CP; 2) to measure how HAFO, SAFO, and SMO affect foot and ankle joint motion in children with spastic CP. Clinical Significance: This new foot model directly measures the anatomical foot and ankle movement when children are walking, with and without the children wearing orthoses. By directly measuring foot motion, the efficacy of orthoses can be examined more accurately than measurements taken from outside the orthoses and shoes. Methods: Twenty-three children with spastic CP were recruited from two different centers. The children’s average age was 8.4 years (4 to16). The children were divided into three groups. The first group consisted of seven patients using 12 SAFO. The second group consisted of eight patients wearing 14 HAFO. The third group consisted of nine patients using 12 SMO. One patient wore a left SMO and a right HAFO and was included in two groups. Children were tested using a StarTrak long-range Electromagnetic Motion Tracking System (EMTS) (Polhemus Inc., Colchester,VT) at both centers. Sensors were placed on the anatomical landmarks of the following bones: Tibia, Calcaneus, Navicular, Cuboid, 1st Metatarsal, and Hallux. Each orthotic’s sole was modified by fixing tread to it so that the children could walk using the orthoses without shoes. Instead of placing external markers on the orthoses, holes were cut so that markers could be placed on the anatomical landmarks of the Calcaneus, the Cuboid and Navicular. The neutral position was established by having the patient stand erect in the center of the laboratory. In order to ensure consistency between trials, the neutral position was recorded by tracing the patients foot position on poster board. Peak values in the stance (ST) and swing phase (SW) were compared between the barefoot and orthotics groups using the Paired Student T-testing. Results: There were moderate to high intrarater (ICC ranging from 0.36 to 0.94) and interrater (ICC ranging from 0.50 to 0.86) reliability for the ankle and 1st Metatarsal-Hallux in the sagittal and coronal plane when testing children with and without orthotics. However, there were low intrarater and interrater (ICC <0.30) in the transversal plane. For the ankle joint, no significant changes were found during stance phase after the use of SAFO and SMO, while HAFO significantly increased ankle dorsiflexion during the ST and SW (P<0.003). During the SW SMO increased ankle dorsiflexion (P=0.01). At the Calcaneal-Cuboid
63

64

Weight Transfer Analysis in Adults with Hemiplegia Using Ankle Foot Orthotics Karen J. Nolan 1,2, Mathew Yarossi,1
Kessler Foundation Research Center, West Orange, NJ, USA1 UMDNJ - New Jersey Medical School, Newark, NJ, USA2
E-mail: [email protected] Web: http://www.kesslerfoundation.org Introduction Assistive technology devices such as ankle foot orthotics (AFOs) are often prescribed to individuals with motor deficits as a result of stroke.1, 2 While research addressing hemplegic gait and orthotic interventions does exist, this research has consistently been limited by the research methodology.3 Specifically, functional ambulation measures such as walking speed, step length and cadence have been used as the key determinants of orthotic effectiveness and the mechanisms underlying these functional outcomes have not been clearly identified.3 Increased walking speed is a measure of walking performance while improved transfer of momentum during hemiplegic gait is a marker of functional recovery.2 Evaluating the mechanism of transfer of momentum during hemiplegic gait would help explain the decrements in gait efficiency and walking speed associated with hemiplegic gait.3 Clinical Significance This research aims to improve the clinician’s ability to create more individualized options in rehabilitation. Measuring outcomes that can directly correlate to real life function will provide meaningful information about the potential effectiveness of an orthotic device. The proposed novel objective analytical methods will help to provide the needed clinical evidence to incorporate new assessment techniques when selecting the most effective orthotic interventions to efficiently maximize functional recovery and create an improved standard of care for individuals with hemiplegia secondary to stroke. Methods Twenty-five adults with stroke related hemiplegia (age 52 ± 10 y, height 1.72 ± 12.7 m, mass 88 ± 23 kg), with symptoms lasting more than 6 months currently using a prescribed AFO during ambulation and twelve age matched healthy controls (age 55 ± 15 y, height 1.68 ± 10.2 m, mass 69 ± 13 kg). Wireless pedobarography data was collected bilaterally using the pedar-X (Novel Electronics, Munich, Germany) at 100 Hz for all participants during walking trials at a self-selected pace. Individuals with stroke completed walking trials in two conditions, with and without AFO. The order of conditions was randomly assigned. The main outcome measures were the weight transfer point timing (WTP, %DS), maximum total force timing (MTF, %DS), timing difference between WTP and MTF (MTF-WTP, %DS) and the linearity of loading (LOL, R2) during the DS phase of the gait cycle.
65

Figure 1. Weight transfer outcome variables: a. Weight Transfer Point (WTP), and Maximum Total Force
(MTF); b. Linearity of Loading (LOL). Results The WTP and LOL were significantly different between conditions with and without AFO for the affected and healthy limb in post stroke individuals, p�0.01. The MTF timing and difference in timing between MTF-WTP was significantly different during affected limb loading with and without AFO in the stroke group, p�0.0001 and p=0.03 respectively. MTF timing, MTF-WTP and LOL were significantly different between individuals with stroke during affected limb loading and healthy controls during right limb loading.
Discussion Weight transfer analysis provides information about the transfer of momentum during gait and can offers valuable insight into changes in functional ambulation after orthotic intervention. Objectively quantifying the weight transfer mechanism after orthotic intervention is a key factor in understanding the mechanism of improving walking speed during hemiplegic gait. This research established a systematic method for analyzing weight transfer during walking to evaluate the affect of an AFO on loading during double support in hemiplegic gait.
References 1. Jutai J, et al. Arch Phys Med Rehabil. 88(10):1268-1275. 2. Gok H, et al. Clin Rehabil. 17(2), 137-139,2003. 3. Leung J, et al. Physiotherapy.89(1):39-55.
Acknowledgements: NIDRR Mary E. Switzer Fellowship Grant #H133F070028 and the Kessler Foundation.
Weight Transfer Outcome Variables Affected Limb –
Stroke Group Healthy Limb – Stroke Group
Healthy Control Group
With AFO Without AFO With AFO Without AFO Right Limb WTP (%DS) 65.4 ± 9.8 60.1 ± 12.2 46.5 ± 9.5 42.9 ± 9.0 57.8 ± 13.9 MTF (%DS) 43.1 ± 20.5 25.5 ± 14.0 38.3 ± 11.8 35.1 ± 17.2 45.4 ± 10.3 MTF - WTP 28.0 ± 17.0 36.8 ± 17.2 14.1 ± 11.5 16.6 ± 11.8 12.5 ± 13.6
LOL (R2) .967 ± .025 .935 ±.032 .979 ± .014 .965 ± .031 .985 ± .014
WTP
MTFLOL
a. b.
Table 1. Weight transfer outcome variables during affected and healthy limb loading in individuals with stroke, and right limb loading in the healthy control group.
66

An EMG-driven muscle-skeletal model to estimate energy consumption during movement
Bisi M.C. 1*, Houdijk H.2*, Stagni R. 1*, Gnudi G.1*
1* DEIS, University of Bologna, Italy, [email protected] 2* Research Institute MOVE, VU University of Amsterdam, The Netherland, [email protected]
Introduction The relationship between mechanical work and metabolic energy cost during movement is not yet clear. Many studies demonstrated the utility of forward dynamic musculoskeletal models combined with experimental data to address such question [1].The aim of this study was to evaluate the applicability of a muscle energy expenditure model [2] at whole body level, using an hybrid dynamics approach [3].
Clinical Significance Energy consumption associated with human movement has a fundamental relevance in the functional evaluations of how a motor tasks is executed in healthy and pathologic patients. Usually biomechanical quantitative analysis are evaluated for characterizing motor disabilities and supporting decisions in therapy and rehabilitation of patients. In addition analysis of energy consumption is another relevant aspect that can improve treatment efficiency. The ultimate goal of therapy and rehabilitation is the health of the patient both from a physical and a psychological point of view and reducing energy expenditure can be a functional optimization criterion that brings to patients immediate high beneficial improvements.
Materials and methodsFour participants [28.5±6.0y, 1.8±0.1m, 76.4±4.1Kg] performed a 5 minute squat exercise on unilateral leg press at two different frequencies (25, 45 mpm) and two different load levels (5, 15 Kg). Data collected were kinematics (Optotrak 3020, NDI, Canada), EMG (Porti, TMSi, NL), ground reaction under the foot (multi component transducer, MC3A-6-1000, Amti, MA) and gas exchange data (Quarkb2, Cosmed, Italy). EMG was rectified, filtered and normalized to maximal voluntary contraction (MVC) [4]. Net joint flexion/extension moments were obtained using inverse dynamics and mechanical power output was calculated from force and kinematics data. This same task was simulated using a musculoskeletal multilink model [2], which took experimental EMG and kinematics as inputs and gave muscle forces and muscle energetics as outputs. Model parameters were taken from literature [2], while maximal isometric muscle forces were optimized in order to match predicted joint moments with experimentally estimated ones [3]. Whole body energy consumption was calculated summing the energy expended by each muscle.
ResultsResults after optimization of maximal muscle isometric forces are shown in Figure 1 and 2.
67

Fig. 1. Joint flexion/extension moments estimated by the model (red lines), and by inverse dynamics (blue lines) for a single representative test.
100150200250300350400
20 25 30 35 40 45 50
mpm
mod
el p
redi
ctio
n (W
)
5 Kg15 Kg
100150200250300350400
20 25 30 35 40 45 50
mpm
cosm
ed (W
)
Fig. 2. Mean and standard deviation of total muscular mass energy consumption predicted by the model (model prediction); Mean and standard deviation of energy cost measured with indirect calorimetry (cosmed).
Model results on metabolic energy consumption were close to the values obtained through indirect calorimetry. However, at the higher frequency level, the model underestimated measured energy consumption.
DiscussionPreliminary results obtained in comparing model predictions with experimental data are promising. The underestimation of energy consumption at higher frequency can be explained with an increase in energy consumption of the non muscular mass with movement velocity [6]. More research is needed to evaluate this way of computing mechanical and metabolic work and to understand the possible new information provided by this approach about the relationship between mechanical and metabolic cost of movement.
References [1] Neptune R.R., et al. J. Biomech., 31:239-45, 1998 [2] Umberger B.R., et al. Comput. Methods. Biomech. Biomed. Engin., 6:99-111, 2003 [3] Buchanan T. et al. J Appl Biomech. 20:367-395, 2004 [4] ISEK emg standards [5] Nagano A. et al. J Appl Biomech., 17:113-128, 2001 [6] Poole DC. et al. J Applied Phys, 72: 805-810, 1992
20 40 60 80 100
0
50
100
Hip moment
M (N
m)
% cycle20 40 60 80 100
0
50
100
Knee moment
M (N
m)
% cycle20 40 60 80 100
0
50
100
Ankle momentM
(Nm
)
% cycle
68

Electromyographic comparison of overground walking, treadmill walking, stationary cycling,
and elliptical stepping
Prosser LA, Stanley CJ, Norman T, Park HS, Damiano DL
Functional and Applied Biomechanics Section, Rehabilitative Medicine Department,
Clinical Center, National Institutes of Health, Bethesda, MD 20892
Introduction
The most common functional motor goal of lower extremity rehabilitation is to improve
walking ability. For reasons of feasibility, safety or intensity, devices are frequently used to
facilitate or augment gait training. The choice of a particular device and the amount of support
it can provide may be influenced by the therapeutic goals, e.g. to strengthen muscles, improve
reciprocal muscle activation, or simulate muscle activity patterns during overground walking.
Muscle activation patterns during overground walking have been compared to treadmill
walking,[1] but not to other rehabilitation devices. The objective of this study was to compare
the muscle activity patterns of the quadriceps and hamstring muscles during four conditions:
overground walking, treadmill walking, stationary cycling, and elliptical stepping.
Clinical Significance
Knowing how muscle activation differs among these conditions should guide clinicians and
researchers in choosing the most appropriate training device for specific patients and goals.
Methods
Data Collection. Ten healthy adults (5 male, 5 female; mean = 22.7 ± 2.9 yrs, range 20-29)
participated. Surface electromyographic (EMG) electrodes (Motion Lab Systems; Baton
Rouge, LA) were placed on the rectus femoris and semitendinosus bilaterally (only right side
reported here) according to SENIAM recommendations.[2] Raw data were collected at 960
Hz. A 10-camera Vicon system (Lake Forest, CA) captured concurrent 3D lower extremity
kinematics at 120 Hz. A two-second standing static trial was collected prior to the test
conditions. Overground walking (W) was performed first at a self-selected speed. Kinematic
data from these trials were immediately reviewed to calculate a mean velocity and cadence for
each participant. Treadmill speed was then matched to the W speed. Participants matched the
pace of the elliptical stepping and cycling tasks to the W cadence with the aid of a
metronome. After familiarization with the device and pace, participants performed 1-2
minutes each on the treadmill (T), cycle (C), and elliptical stepper (E) in a randomized order.
Data analysis. Five cycles were selected from each condition, with the most anterior point of
the revolution chosen as the start of the cycle for C and E. EMG data were processed with
Visual 3D (C-Motion, Germantown, MD) to generate linear envelope curves, time normalized
from 0-100% cycle. The mean plus three standard deviations from the static trial was used as
the threshold for muscle activity.[3] (Fig. 1) Activation time was reported as a percent of the
cycle. Coactivation was calculated as the percent time both muscles were simultaneously
active. Magnitude of muscle activity was represented by peak amplitude during the cycle and
by calculating the total area of the linear envelope that exceeded the threshold. Analysis of
variance (ANOVA) procedures were used to detect differences between conditions (p<0.05).
69

���������������������� ���������� ���������������������������������������������������������������������������� ����������������������������������������������������� ��������������� ���������������������������������!"������������������������#��"�$�%��&�$� ��'����
������������������ �(�������$�)���������������������������������������������*�������������������������������� ������������������������������������������������*�� ��������������� ������������������� $� �������������������������������������"����*���
��������+��,�����������������������-.��������������������#/��$�%/���$� /�����$��/0��$���������/0��*$����������/������0��*���
���������-�������������������������������������������0�����������������������������
������ ��1���������������������������������������������������������������02����0���� ��������0����������������������� ��������3�����-.����������������� ��������/�������������������4� ��$�������������������������������������������������������������������$�������������-.�������������� ��,�����������������������������������)�����������������������������������������������������������������������������������������������������������������������������������������������������5����$������������������������0�������������������)�������$�0����������������$�������������� ��������������������%��������0������0���������� ������������������������� ������������0����������������5��0������5���������������$�������������������� ��������������������������� ��*����������0�������/ ����0�������-���������������������������� ��*���� �������������������������������� ��*���$�������������0������0��������������������� ��*�������������������������6�����������*����������������������*�������������0��������$��������������������0��������������-.����������
������ �����+��7�89$�4�����9����������������::;<+:"���=!"!/>>�����4�����49�����������������������������:::<+:�>�=�'+/�!"�����4�����?#$�@���@4�����������������������������������+&&'<+:+�'�=>++/>+&��
��� ��������� ����%���������� ������������0�����A����������,�����?�������������BA4� ������� �����
70

Title: A novel index to quantify velocity-dependent muscle activation during gait of children with Cerebral Palsy. Authors: Tirosh Oren, PhD 1, Wong Matthew, M Eng 1, Rutz Erich, MD 1,2,3
1 Murdoch Childrens Research Institute, Royal Children’s Hospital, Victoria, Australia2 Pediatric orthopeadics University Children’s Hospital Basle UKBB, Switzerland 3 Laboratory for Gait Analysis, University Children’s Hospital Basle UKBB, Switzerland
Introduction: Spasticity is a motor disorder characterized by a velocity-dependent increase of muscle activation upon lengthening [1]. The Ashworth Scale (AS) and the Tardieu Scale are ordinal scales commonly used for spasticity assessment [2, 3]. These tests, however, are restricted to the application of passive movements in a resting position, which alone has been shown to be insufficient as an assessment method for spasticity [4]. Hence, the evaluation of spastic locomotor disorders needs to incorporate voluntary movement and be performed during locomotion [4, 5, 6]. The Lengthening Velocity Threshold was proposed as an objective method to detect dynamic spasticity during gait, by coupling kinematics and surface electromyography (sEMG) [7]. This method, however, does not acknowledge the degree of spasticity, and identification of the ‘on’ time of muscle activation is problematic in spastic muscles that are mostly activated during the gait cycle. Recently, time–frequency characteristics of muscle activation quantified by instantaneous mean frequency (IMNF) have been suggested to be more reflective of the resultant changes in gait kinematics [8]. Our goal was to evaluate a quantitative method coupling gait kinematics and IMNF analysis to quantify the velocity-dependent muscle activation patterns in rectus femoris (RF) and medial gastrocnemius (MG) during walking, and to demonstrate how this measurement correlates with the AS. Clinical Significance: The novel method may allow further insight into the functional effects of spasticity on gait in children with cerebral palsy (CP). It may open new frontiers to the outcome assessment of spasticity management and intervention studies. Methods: Eleven children (age 14.1±3.7 years) with a diagnosis of hemiplegic CP (GMFCS classification I and II) and 11 typically developing (TD) children (age 12.5±3.1 years) without any significant musculoskeletal disorders participated in the study. Three-dimensional gait analysis (3DGA) of the lower limb was recorded simultaneously with sEMG from the rectus femoris (RF) and medial gastrocnemius (MG) and expressed in percentage of the gait cycle. sEMG signals were pre-amplified, band-pass filtered (10–700 Hz) at a sampling rate of 2520 Hz. Ashworth Scale scores were recorded from the knee extensors and calf dorsiflexors by an experienced physiotherapist. The methodology to assess the velocity-dependent muscle activation patterns in gait followed several steps (See figure):
1.Calculation of the peak joint angular velocity (Vmax) measured from the initial swing phase when muscle lengthening occur (ankle for MG, knee for RF).
2.sEMG processing to generate the IMNF curve [see 8]. 3.Calculation of the IMNF value (IMNFVmax) at the time where Vmax occurred. 4.Calculation of the velocity-dependent muscle activation Index defined as the
ratio of IMNFVmax and Vmax; Indx= IMNFVmax / Vmax. Analysis of Variance was used to indicate any significant differences between the Indx values obtained at different AS using Bonfferoni correction as the Post Hoc test. The Spearman rank order R was performed to assess the relationship between Indx and AS.
71

†, ‡, *, p < .01
0
40
80
120
0% 10% 20% 30% 40% 50% 60% 70% 80% 90%
-600
-200
200
600
-35
-15
5
25
MG
IMN
F (H
z)
Ank
le
Velo
city
(d
eg/s
ec)
Gait Cycle (%)
Ank
le
Dis
plac
emen
t (d
eg)
Lengthening
Vmax
IMNFVmax
Results: Greater Indx values for both MG and RF muscles were associated with greater AS (p<.05) (table to right). Post hoc analysis for the MG muscle revealed significant lower Indx means in the TD group compared with AS-1, AS-3, and AS-5 (p<.05). Similarly for the RF muscle, Indx means in the TD group were significantly lower than for AS-0 and AS-2 (p<.05). Furthermore, post hoc analysis for MG showed that AS-0, AS-1, and AS-2 were significantly lower than AS-3 and AS-5 (p<.05), and AS-3 was significantly lower than AS-5 ( p<.05). Spearman analysis showed significant correlation between Indx and AS (r = 0.72, p<.01). Discussion: A novel method was introduced to quantify velocity-dependent muscle activation from routine clinical 3DGA data of children with CP. The calculated Indx values were found to be greater in muscles with greater spasticity as indicated by the AS. This methodological approach might be relevant for the assessment of spastic muscle behaviour during functional tasks such as walking. Future work should focus on using muscle lengthening velocity to calculate Indx, and investigating the reliability of Indx. This methodology may open new frontiers to the outcome assessment of spasticity management such as Botulinum toxin A intervention.
References 1. P. Crenna, CF, in: Delwaide PJ, Young RR (Eds.), Elsevier, Amsterdam, 1985, pp. 109–124. 2. Bohannon RW, Smith MB. Phys Ther 1987; 67: 206-7. 3. Tardieu G, et al. Rev Neurol (Paris) 1954; 91: 143-4. 4. Fleuren JF, et al.. J Electromyogr Kinesiol 2008. 5. Fung J, Barbeau H. Electroencephalogr Clin Neurophysiol 1989; 73: 233-44. 6. Crenna P. Neuroscience and Biobehavioral Reviews, 1998, 22(4): 571–578. 7. Crenna P. Pathophysiology 1999; 5: 283-297. 8. Lauer RT, et al. Gait Posture 2007; 26: 420-7.
Indx
MG RF TD 0.18±0.05 (44) † 0.13±0.01 (44) † AS 0 0.22±0.04 (16) ‡ 0.16±0.01 (24) † AS 1 0.29±0.09 (35) † 0.15±0.01 (50) ‡ AS 2 0.29±0.10 (12) * 0.21±0.01 (12) †‡ AS 3 0.59±0.15 (16) †‡* AS 5 1.00±0.32 (7) †‡*
72

GCMAS KEYNOTE ADDRESS
Insights from Modeling Gait Dynamics and Disorders
Scott L. Delp, James H. Clark Professor, Stanford University
Scott Delp received his Ph.D. degree from Stanford in 1990 and then joined the faculty of Northwestern University, where he was jointly appointed in the departments of biomedical engineering and physical medicine and rehabilitation. He returned to Stanford in 1999, and in 2002 became the founding ChaStanford’s Bioengineering Department. Scott’s work draws on physics, imaging, and neuroscience to improve treatments for individuals with physical disabilities. He has received many awards for his work, including a National Young Investigator Award, Faculty Fellowships from the Baxter Foundation and Powell Foundation, and a Technology Reinvestment Award for which he was honored at the White House. At Stanford he is the first holder of the James H. Clark Professorship.
irman of
PRESENTATION SUMMARY The outcomes of treatments performed to correct movement abnormalities are variable. This problem exists, in part, because the biomechanical causes of the abnormal movement patterns are unclear, and the effects of common treatments are not understood. I believe that the design of treatments will improve if computer models are developed that complement experimental movement analysis and help explain the causes of movement abnormalities and predict the functional consequences of interventions. This presentation will describe a range of computer simulations that provide insights into the mechanics of common movement abnormality among persons with cerebral palsy.
73

PODIUM SESSION #3
FOOT & ANKLE
Moderated by: Maria Grazia Benedetti, M.D., Rizzoli Institute, Bologna, Italy
Roy Davis, Ph.D., Shriners Hospital, Greenville, SC, USA
FOOT & ANKLE 1. Segmental Foot and Ankle Kinematics of the Equinovarus Foot During Gait Joseph J
Krzak 2. Reliability of Center of Pressure Quantification and Relation to Medial Longitudinal Arch
of the Foot Jesper Bencke 3. Influence of Musculoskeletal Architectural Parameters on Gait Velocity in Elderly
Subjects Stephen J. Piazza 4. Quantifying Pediatric Foot Deformities Using Multi-Segment Foot Kinematics Kirsten
Tulchin 5. An Automated and Anatomically Based Method for Defining Plantar Pressure Masks in
Foot Deformity Julie Stebbins 6. Validity of a Simple Kinetic Multi-segment Foot Model Dustin A. Bruening 7. A Musculoskeletal Foot Model for Clinical Gait Analysis Prabhav Saraswat
74

Segmental Foot and Ankle Kinematics of the Equinovarus Foot During Gait J. Krzak, PT¹, A. Graf, MS¹, P.A. Smith, MD¹, S. Hassani, MS¹, G. Harris, Ph.D¹ ² ¹Shriners Hospital for Children (Chicago) ²Orthopaedic & Rehabilitation Engineering Center (OREC) Marquette University/Medical College of Wisconsin, Milwaukee, IL
Introduction: The equinovarus foot is a commonly found, yet not completely understood, phenomenon that causes functional limitation and disability in children with hemiplegic CP. A currently accepted approach to quantifying foot and ankle kinematics during gait is to represent the entire foot as a single rigid body with a revolute ankle joint. However, the foot and ankle are really highly complex structural systems with components that function independently yet synergistically. Thus, to understand the complexities of the equinovarus foot in children with hemiplegic CP, a more sophisticated model that describes segmental foot and ankle motion would provide improved quantitative data and more insight into its etiology. The Milwaukee Foot Model is a validated, pediatric, biomechanical model that divides the foot and ankle into four segments (tibia, hindfoot, forefoot and hallux) with the use of passive surface markers and radiographic offsets to establish neutral alignment[1]. The output data results in a tri-planar graphical representation of distal segment orientation in relation to its more proximal segment from heel strike to ipsilateral heel strike. Methods: Segmental foot and ankle kinematics were preoperatively evaluated on 10 Children with hemiplegic CP (4 M, 6 F, Average Age: 9.2 ± 2.7 yrs). All subjects had no prior history of orthopedic surgery and had not received botox injections within 1 year prior to evaluation. This group was compared to 15 children without history of or orthopedic or neurologic disease. Results: The equinovarus group demonstrated alterations in gait kinematics at each segment as compared to the Control Group (see figure 1). In the sagittal plane, the equinovarus group demonstrated a plantarflexion shift at the hindfoot coupled to a dorsiflexion shift at the forefoot. In the coronal plane, as stance phase progressed, the tibia of the equinovarus group advanced into further adduction, and the hindfoot shifted into inversion relative to the tibia. Peak forefoot varus occurred later in the gait cycle. In the transverse plane, the tibia was internally rotated, and the forefoot was shifted into adduction throughout the gait cycle. The hindfoot exhibited an increased peak external rotation at the end of stance phase.
75

Figure 1
Discussion: These findings confirm that the equinovarus deformity commonly found in hemiplegic CP is multi-segmental and multi-planar. These components can be detected using the Milwaukee Foot Model. In certain segments, such as the tibia, the coronal plane motion is unique. For the majority of the segments, the motion is similar to that of the Control Group; however, the curves are offset. References: Kidder SM, A.F., Harris GF, Johnson JE, A system for the analysis of foot and ankle
kinematics during gait. IEEE Trans Rehabil Eng, 1996. 4(1): p. 25-32.
76

Reliability of Center of Pressure Quantification and Relation to Medial Longitudinal Arch of the Foot Bencke J, Lauridsen HB, Bandholm T. Gait Analysis Laboratory, Dep Orthopedic Surgery, Hvidovre University Hospital, Denmark.
Introduction In the recent years, different approaches for quantification of valgus foot deformities have been used. Previously, manual measurements of e.g. navicular drop or calcaneus eversion/inversion during unloaded/loaded standing have been implemented for quantification of valgus pathology. Kinematic measurements of the medial longitudinal arch (MLA), hindfoot inversion/eversion, or forefoot supination/pronation using 3-dimensional kinematic models have been used as dynamic measures of degree of valgus in the foot. Furthermore, pedobarography may offer a kinetic examination of the medial and lateral loading of the foot during dynamic conditions like gait, by looking at the medialization of the propagation of the Center of Pressure (CoP) or the lateral to medial force indices. It has been theorized, that the COP path is a direct result of foot pronation and supination during walking, and as such a measure of foot deformation 1. The purpose of this study was to determine the reliability of two CoP quantification methods, and furthermore to relate the pedobarography measurements to kinematic measurements of the MLA of the foot. Clinical Significance Quantification of deviations from normal in foot anatomical structure and loading patterns in valgus foot pathology may be important for clinical decision making and evaluation of treatment effects. Therefore, developments of reliable, clinically relevant and valid methods for measuring these deviations are necessary. MethodsTwenty-three male participants aged 20-51 yrs with no lower leg or foot pathologies volunteered as participants in the study, and the left foot of each subject was studied twice, approximately one week apart. The subjects walked 5 times across a plantar pressure mat (EMED, Novel, Germany) for obtaining pedobarography data, and for kinematic measure-ments of the deformation of the medial longitudinal arch retroflective markers were attached over the navicular tubercle, the medial aspect of the 1st metatarsal head, and the medial side of the calcaneus 2, and the 3D coordinates of the three markers was recorded using a 612 Vicon Motion Analysis System, and the angle between them in the vertical plane during mid-stance was calculated using a custom-made Matlab macro and used as a kinematic measure of MLA angle. Two pedobarography parameters of loading pattern were calculated using Novel inherent software; 1) the CoP area index (COPI) expressed as the area on the lateral side of the CoP divided by the area on the medial side, and 2) the lateral-medial force index (LMFI), expressed as the force on the lateral side of a longitudinal, bisectional line divided by the force on the medial side. Between session reliability of the two pedobarography measurements and the kinematic measurement of MLA was assessed using intraclass correlation coefficients (ICC2.1). Pearson correlation coefficients were then calculated between the two pedobarography indices and the magnitude of the MLA angle obtained from each subject during walking.
77

ResultsMean value of COPI was 1.4 (SD: 0.12), i.e. the area on the lateral side of the CoP line was on average 1.4 times greater than the area on the medial side. The Mean LMFI was 0.98 (SD: 0.29), and the MLA angle was on average 159 (SD: 11) degrees. The reliability of the three parameters ranged from substantial to excellent (see table 1), but there were no significant correlation between the kinematic measure of foot deformation and the kinetic measures of pressure distribution during gait (see table 2). The two pedobarography measures showed a significant correlation.
Table 1. Reliability of analyzed parameters Parameter ICC2.1 95% Confidence interval
COPI 0.80 0.58 – 0.91 LMFI 0.87 0.72 – 0.94 MLA 0.95 0.87 – 0-95
Table 2. Correlation matrix of analyzed parameters
Pearson’s r COPI LMFI MLA
COPI 1 -0.62 (p= 0.002) 0.24 (p=0.27)
LMFI -0.62 (p= 0.002) 1 -0.18 (p=0.41)
MLA 0.24 (p=0.27) -0.18 (p=0.41) 1
DiscussionThe COPI and the LMFI may have substantial between-session reliability but are not related to the magnitude of MLA deformation during the stance phase of walking. Although face-validity of COP-measures has been implied in the literature by using these parameters to assess the effectiveness of foot orthoses 1, the results of this study shows no correlation of foot posture expressed by MLA and the propagation of CoP. This is in concurrence with other studies of the correlation of calcaneus eversion and CoP measures 3. It may be, that assumption of the COP pattern being of dynamic foot posture is too simple, since the pattern of the COP during walking is in fact a combination of movements of the trunk and lower extremity during walking. It is also possible that the use of healthy, asymptomatic individuals as subjects did not yield a sufficiently large range of foot deformation patterns to allow accurate differentiation by the use of the CoP parameters. This needs elucidation in future studies, but the present results does not indicate the use of CoP indices as measure of foot posture.
References 1. McPoil TG, Jr., Adrian M, Pidcoe P. Effects of foot orthoses on center-of-pressure
patterns in women. Phys Ther 1989; 69(2):149-154. 2. Bandholm T, Boysen L, Haugaard S, Zebis MK, Bencke J. Foot medial longitudinal-arch
deformation during quiet standing and gait in subjects with medial tibial stress syndrome. J Foot Ankle Surg 2008; 47(2):89-95.
3. Cornwall MW, McPoil TG. Reliability and Validity of Center-of-Pressure Quantification. J Am Podiatr Med Assoc 2003; 93(2):142-149.
78

Influence of Musculoskeletal Architectural Parameters on Gait Velocity in Elderly Subjects
Sabrina S.M. Lee and Stephen J. Piazza The Pennsylvania State University, University Park, PA, USA
Introduction
The ability to walk is a crucial determinant of independence in daily activities. It is well established that lower extremity muscle strength and power are positively associated with gait velocity [e.g., 1]. With advancing age, decrease in gait velocity is accompanied with decreased ankle plantarflexion angle, moment, and power [e.g., 1,2]. Differences in plantarflexor muscle architecture between young and elderly individuals have been found, but the influence of plantarflexor architecture on kinetics and kinematics of gait have not been explored. The purpose of this study was to determine whether musculoskeletal architecture of the lateral gastrocnemius (moment arm, fascicle length, pennation angle, and muscle thickness) correlates with locomotor function in elderly individuals as measured by Six-Minute Walk Test velocity and ankle joint kinetics and kinematics. Clinical Significance
Determination of the relationship between changes in musculoskeletal architecture and reduced mobility permits understanding of the mechanisms of reduced gait velocity in the elderly.. Such understanding may lead to training programs specifically designed to counteract potentially disabling changes in muscle and joint architecture. Methods
Moment arm, fascicle length, pennation angle, and muscle thickness of the lateral gastrocnemius muscle were measured in 20 healthy elderly males (75.5 ± 5.6 years, 1.74 ± 0.05 m, 85.8 kg, 28.1 ± 3.5 kg/m2). All subjects gave informed consent prior to testing and procedures were approved by the University’s Institutional Review Board. Fascicle length, pennation angle, and muscle thickness were determined from images captured using B-mode ultrasonography (Aloka 1100; transducer: SSD-625, 7.5 MHz) of the central region of the muscle while subjects stood in anatomical position. To estimate moment arm, the ankle was manually rotated by the experimenter from approximately 10° dorsiflexion to 15° plantarflexion using a potentiometer-instrumented rotating foot platform while ultrasound images of the musculotendinous junction were captured. Moment arm was estimated using the tendon excursion method by taking the derivative of the line fit to the tendon excursion versus ankle angle data.
Preferred walking speed was determined using the Six Minute Walk Test, during which the subject was instructed to walk at a preferred pace for six minutes. Joint kinetics and kinematics and gait parameters were calculated (Visual 3D software, C-Motion, Inc.; Germantown, MD) following a second session in which subjects were asked to walk at their preferred gait velocity along a 25 m walkway with two embedded force plates (Kistler Instrument Corporation, Amherst, NY) in the gait laboratory while 8 cameras (Eagle Digital Real Time, Motion Analysis Corporation, Santa Rosa, CA, 100 Hz) tracked markers on their lower extremities.
79

Results
A strong association between plantarflexor moment arm and preferred walking velocity was found, but only for subjects with the slowest preferred velocities (Figure 1). For the slowest 10 subjects, there was a significant positive correlation between preferred gait velocity and moment arm (R2 = 0.669, p = 0.004), but for the fast group, there were no significant relationships between preferred gait velocity and musculoskeletal architectural parameters. Regression analysis revealed that only fascicle length was significantly correlated with peak plantarflexion angle (R2 = 0.609, p = 0.008) among the other musculoskeletal architectural parameters and ankle joint kinetics and kinematics. Discussion
Reduced step length is strongly associated with decreased gait velocity in elderly individuals [5] and our findings suggest that reductions in step length may follow in part from insufficient plantarflexor moment arm, although this was apparent only after post hoc partitioning of our subjects according to gait velocity. It may be the case that those individuals with large plantarflexor moment arms are more able to compensate for age-related decreases in muscle mass relative to body mass and thus maintain gait velocity. The mechanism by which longer moment arms increase walking speed requires further investigation. Longer fascicles, may permit greater change in plantarflexor fiber length and result in greater plantarflexion during terminal stance. However, the lack of correlation between other musculoskeletal architectural parameters and joint moment and power suggest that other factors such as fiber composition and motor unit recruitment patterns may be greater determinants of gait performance in elderly individuals. Finally, a prospective study is need to confirm the relationship between velocity and plantarflexor moment arms in mobility-limited elderly adults.
References
1. Kerrigan, D.C. et al. (1998). Arch Phys Med Rehabil 79, 317-22.
2. Winter, D.A. (1990). Biomechanics and Motor Control of Human Movement. John Wiley, Chichester
3. Morse, C.I. et al. (2005). J Appl Physiol 99, 1050-5.
4. Thom, J.M. et al. (2005). J Gerontol A Biol Sci Med Sci 60, 1111-7.
5. Crowninshield, R.D. et al. (1978). Clinical Orthopaedics 132, 140-144.
1
1.2
1.4
1.6
1.8
25 30 35 40 45
Moment Arm (mm)
6-M
inut
e W
alk
Test
Vel
ocity
(m/s
)
Figure 1. Linear regression of Six Minute Walk Test Velocity on Achilles’ tendon moment arm for the slowest 10 subjects (open circles, R2 = 0.669, p = 0.004) and for the fastest 10 subjects (filled circles, R2 = 0.048, p = 0.543).
80

QUANTIFYING PEDIATRIC FOOT DEFORMITIES USING MULTI-SEGMENT FOOT KINEMATICS K Tulchin, MS, M Orendurff, MS and L Karol, MD
Texas Scottish Rite Hospital for Children, Dallas, TX, USA [email protected]
Introduction Due to the methodology incorporated in single-rigid body foot models, traditional lower extremity kinematics lack the detail needed to gain a strong understanding of the biomechanics within the foot. Multi-segment models have been increasingly used over the last several years, primarily in understanding the mechanisms and outcomes of surgery in adults with foot pathology.[1] However the literature on the application of these models in children with disabilities is limited.[2] The purpose of this study was to employ a multi-segment foot model to detect differences in foot motion that are missed using a single-rigid body model in children with foot pathology. Clinical Significance The application of multi-segment foot models can be used to detect variations in complex, 3D foot mechanics in children with pathology. The additional information gained can be used to aid clinical decision making and for treatment outcomes assessment. Methods Nineteen pediatric patients were enrolled in this prospective, IRB-approved study. Subjects were divided into two groups based on clinical notes from their recent orthopedic office visits: Varus/Cavovarus (CV group, N=11) and Planovalgus (PV group, N=8). There were more neurologically involved subjects in the CV group (N=4 CMT, N=3 cerebral palsy, N=3 clubfoot, N=1 other) compared to the PV group (N=1 cerebral palsy, N=3 coalition, N=4 other). Each subject was instrumented with the modified Helen Hayes marker set and a multi-segment foot kinematic (MSF) marker set bilaterally. Typical lower extremity kinematics (LE) were determined using Plug-in-Gait (VICON, Denver, CO) and MSF kinematics were calculated using a custom model written in BodyBuilder for Biomechanics (VICON, Denver, CO). Descriptive statistics (min, max, range, mean) were determined for sagittal ankle motion and foot rotation using the LE kinematics and each MSF variable across the gait cycle as well as during specific phases of the gait cycle, i.e. the three rockers and dorsiflexion during swing phase. A one-way ANOVA was used to determine significant differences in these measures between groups, with alpha set to 0.05. Results The mean age at testing was 14.7 ± 2.0 yrs for the CV group and 13.5 ± 2.1 yrs for PV group (no significant difference). There were no significant differences in cadence parameters between groups. LE kinematics identified a significant difference only in ankle angle at initial contact (reduced in the CV group), while swing phase dorsiflexion (DF) showed a trend for less mean DF in the CV group. (Table 1). Multi-segment foot kinematics demonstrated several significant differences in both hindfoot and forefoot motion (Figure 2). Overall the PV group was in slightly more Hindfoot DF throughout the gait cycle compared to the CV
81

group. Timing of minimum hindfoot DF during 1st rocker illustrated foot drop in the CV group, which was also seen in the swing phase hindfoot motion. Mean coronal plane hindfoot motion showed valgus in the PV group and varus in the CV group, as expected. The PV group demonstrated forefoot inversion and abduction compared to the CV group. Table 1: MSF kine- matics were able to detect more differences in foot motion between PV and CV groups than the LE model Figure 1: Average MSF kinematics of the CV group (N=11, solid) and PV group (N=8,dash.) Discussion The multi-segment foot model was able to precisely quantify differences in foot motion between children with cavovarus and those with planovalgus feet. The use of such models can aid physicians in treatment decisions and provide valuable outcomes assessment in pediatric patients. While substantial information is gained through the use of the multisegment foot model, it is important to recognize that it should be used in conjunction with lower extremity (and perhaps full body) kinematic analysis. Examination of proximal joints indicated that there were also significant differences at the hip, with slightly more hip abduction and transverse plane hip range of motion in the CV group compared to the PV group. The detection of detailed motion at the foot is intended to complete the kinematic assessment since abnormalities in foot motion can clearly have an impact on the hip and knee, and vice versa. Therefore the functional gait assessment of pediatric patients, specifically those with foot involvement should consist of both lower extremity and multi-segment foot kinematics. References [1]Benedetti, et al., Proc of I-FAB 2008; 96. [2] Theologis, et al., JBJS-Br 2003; 85:575-7.
LE Ankle Kinematics MSF Kinematics
Ankle at IC
Pk Ankle DF-Sw
Mean Sag HF
(GC)
Mean Sag HF (swing)
Mean Cor HF
Mean Cor FF
Mean Trans
FF PV N=8
-0.5 (6.2)
5.8 (5.0)
5.4 (3.9)
5.3 (4.5)
-6.9 (5.0)
11.8 (4.6)
-27.4 (6.1)
CV N=11
-7.2 (4.9)
0.2 (6.3)
0.7 (4.4)
-3.0 (7.3)
3.4 (5.8)
1.5 (8.0)
9.6 (7.3)
p-value 0.018 0.052 0.027 0.011 0.001 0.005 <0.001
deg
HF DF / PF HF Varus / Valgus FF Inver / Ever
DF
PF
Var
us
Val
gus
deg
Inve
rEv
erde
g
Ad
Ab
deg
0 25 50 10075 0 25 50 10075 0 25 50 10075 0 25 50 10075
0
-30
30
0
-30
30
0
-30
30
0
-30
30
% Gait Cycle % Gait Cycle% Gait Cycle% Gait Cycle
FF Adduct / Abduct
82

AN AUTOMATED AND ANATOMICALLY BASED METHOD FOR DEFINING
PLANTAR PRESSURE MASKS IN FOOT DEFORMITY
Stebbins J. DPhil1, Giacomozzi, C.PhD
2, Tsvetkova, T. PhD
3
1 Oxford Gait Laboratory, Nuffield Orthopaedic Centre, Oxford, UK
2 Dept of Technology and Health, Istituto Superiore di Sanità, Rome, Italy
3 Novel SPb LLC, St.Petersburg, Russia
INTRODUCTION
The standard method for assessing dynamic plantar pressure measurements involves dividing
the foot into two or more sub-areas. This is typically performed by geometrically partitioning
the foot into pre-defined sections. The reliability of this method has been well documented in
cases where the complete plantar surface of the foot is in contact with the pressure mat.
However, this method becomes invalid when only a partial area of the foot is loaded (for
example, a subject that walks up on their toes). In these cases, the foot must be manually
divided into relevant sub-areas, which introduces operator error. Giacomozzi et al1 proposed
a method of automatically dividing the foot based on anatomical marker positions. This was
trialled using a prototype, piezo-electric pressure mat, with encouraging results2. The aim of
this study was to implement this method using a commercially available pressure plate
(Emed, Novel Gmbh) and compare the results to a conventional method of sub-area selection.
CLINICAL SIGNIFICANCE
The ability to automatically sub-divide a pedobarograph into anatomically-based areas, in the
presence of foot deformity, allows improved accuracy and repeatability of dynamic foot
assessment, which may enhance treatment planning and evaluation of treatment outcomes.
METHODS
Nineteen children (5 male and 14 female, age range 6 – 16 years, height 1.48 + 0.16m, weight
40.6 + 13.5kg) were recruited for this study. All participants were screened for lower limb
problems, and excluded if they had any history of lower limb surgery, deformity or significant
problems. In addition, a further 3 subjects with significant foot deformity were assessed.
These included a 7 year old boy with developmental delay and planovalgus feet, a 13 year old
girl with hemiplegic cerebral palsy, and a 9 year old boy with a clubfoot deformity. A 12
camera, Vicon MX (Vicon, Oxford) system was used to collect data from markers placed on
the both feet, according to the Oxford Foot Model protocol3. Data were sampled at 100Hz.
An Emed pressure plate (Novel Gmbh) was used to collect simultaneous plantar pressure
data, sampling at 50 Hz (Figure 1). The 2-step method was used to collect the data.
Anatomical marker positions were projected onto the overall pressure map at a time
corresponding to midstance. Five areas were selected (medial heel, lateral heel, midfoot,
medial forefoot, lateral forefoot). The geometric method was based on five comparable
subareas. Comparison between the methods was performed by analysing the following
parameters - duration of contact, pressure-time-integral and force-time-integral, contact area,
maximum force, and peak pressure. In addition, the intra-session repeatability of peak
pressure was assessed by comparing the standard Novel 10 area mask to a mask with the
same sub-areas but based on marker positions, using within-subject standard deviations.
83

RESULTS There were significant percentage differences between methods of sub-area selection, even when assessing footprints from healthy feet with total foot contact with the ground. These differences were least in contact area, along with peak and force time integrals (ranging from 0% to 6% difference). The greatest difference was in the timing of peak pressure, with a maximum difference of 135% averaged across subjects. When assessing pathologic feet, where the whole foot is not in contact with the ground, the average differences between methods were significantly greater. An example is displayed (Figure 1) for the clubfoot subject, where the dividing line between medial and lateral forefoot differs between methods due to a lack of contact in the medial forefoot region. This resulted in a 34% difference in peak pressure and 15% difference in contact area for the lateral forefoot for this subject.
Mask Area % Similar or
Improved hindfoot 100 midfoot 29 MH1 63 MH2 53 MH3 55 MH4 26 MH5 53 big toe 68 second toe 63 toes 345 74
The within subject-standard deviation was compared for all 10 sub-areas of the standard Novel mask, using both a geometric and a marker-based approach. Table 1 shows the number of cases where the marker-based approach had the same or improved repeatability in peak pressure measurement over 3 trials when compared to the standard, geometric approach. DISCUSSION Even when the geometrical definition is very similar to the anatomical one, there is still variation in sub-area selection. This variability seems to be related to two major factors - foot shape (essentially the presence or absence of significant loading in the midfoot), and toe-off angle (which influences the geometric but not the anatomical selection). Using markers to define sub-areas in healthy feet showed a similar repeatability of peak pressure measurement as the standard, geometric approach. Intra-subject variability in plantar pressure poses a significant challenge when assessing results, so it is vital that any new approach provide at least comparable repeatability to the standard method. REFERENCES 1. Giacomozzi, C., et al (2000). Integrated pressureforce-kinematics measuring system for the characterisation of plantar foot loading during locomotion. Med Biol Eng Comput 38,156–63. 2. Stebbins, J., et al (2005). Assessment of sub-division of plantar pressure measurement in children. Gait Posture 22, 372–6. 3. Stebbins, J., et al (2006). Repeatability of a model for measuring foot kinematics in children. Gait and Posture, 23, 401-410.
Figure 1 green lines = geometrical selection; black lines = anatomical selection
84

VALIDITY OF A SIMPLE KINETIC MULTI-SEGMENT FOOT MODEL
1Dustin A. Bruening, 1Kevin M. Cooney, 1,2Frank L. Buczek 1Shriners Hospitals for Children, Erie PA
2National Institute for Occupational Safety & Health, Morgantown WV
Introduction: Kinematic multi-segment foot models have been increasingly used in clinical gait analysis and human movement research; however, the addition of kinetics has been hampered by measurement difficulties, and previous models are too complex for use in routine analysis [1, 2]. While anatomically meaningful reference frames are sufficient for kinematics, kinetic models also require joint centers, inertial properties, subarea ground reaction forces, and characterization of segment rigidity. In this paper, a simple 6DOF, three-segment kinetic foot model is presented and its kinematic performance, or validity, is thoroughly evaluated. Clinical Significance: The addition of kinetics to multi-segment foot modeling may increase understanding of the forces within the foot and ankle as well as identify those motion parameters that are important to diagnosis and treatment of foot and ankle pathologies. Methods: Nineteen 4-mm diameter markers were used to define Shank, Rearfoot, Forefoot, and Hallux segments separated by the following joint centers: ankle (AJC), midfoot (MJC), and 1st metatarsophalangeal (MPC) (Figure 1). Masses and inertia tensors for each segment (used for kinetics beyond the scope of this abstract) were calculated from simple geometric solids. A Vicon 612 motion capture system was used to track marker positions at 120 Hz.
The right feet of ten pediatric subjects were tested. Model repeatability tests began with the first of two testers applying all markers. Three walking trials were collected followed by a static pose trial (SP1). The subject remained in place while the first tester removed all of the markers and wiped off any markings. While the subject continued to remain in place, the second tester then placed all markers on the subject and a second static pose trial (SP2) was collected. Three more walking trials were collected followed by a third static pose trial (SP3). Again, without the subject moving, the second tester removed all markers and markings, then re-applied the markers, and a fourth static pose trial (SP4) was collected followed by three final walking trials. For the static pose trials, between-tester (SP1 and SP2) and within-tester (SP3 and SP4) differences were analyzed using: 1) global joint center positions, 2) global segment orientation angles (helical angles with respect to laboratory), and 3) static pose joint angles (Euler rotation sequence). For the walking trials, between and within-testers differences were defined by offsets in mean joint angles (mean across gait cycle and three trials).
A representative walking trial was chosen for each subject to calculate the following variables in Visual 3D (C-motion, Inc.): 1) joint translations, calculated as the Euclidean distance between adjacent segment endpoints, 2) segment rigidity, assessed using the residual from the segment tracking algorithm [3], and 3) ensemble joint angles (Euler rotation sequence).
85

86

A Musculoskeletal Foot Model for Clinical Gait Analysis
Prabhav Saraswat1,3, Michael S. Andersen2, Bruce A. MacWilliams1,3
University of Utah, Salt Lake City, UT, USA1, Aalborg University, Aalborg, Denmark2 Shriners Hospitals for Children, Salt Lake City, UT, USA3
Introduction: Several musculoskeletal models exist for full-body gait analysis but these treat the foot as a single segment and ignore the motion of intrinsic joints. This assumption limits the use of such models in clinical cases with significant foot deformities. Multi-segment kinematic foot models exist which measure the motions of intrinsic joints. These models have been validated and are being used to research pathological conditions. To date, no multi-segment kinematic foot model has been used as part of a musculoskeletal model. We propose to develop a three segment musculoskeletal foot model. We hypothesize that a multi-segment foot model can be constructed, scaled to match a subject, and driven with subject data from an existing kinematic model to estimate internal muscle activation patterns.
Clinical Significance: A musculoskeletal foot model driven by motion analysis data has the potential to be developed into a useful clinical tool to assess foot pathologies. Model outcomes can be used to study how specific muscles contribute to movement coordination and suggest or assess interventions to correct pathologic walking patterns.
Methods: A three segment musculoskeletal foot model was developed using commercial software (AnyBody Technology, Aalborg, DEN) to match the segmentation (hindfoot, forefoot and toes) of a recently developed kinematic foot model1. A base model was developed by defining basic foot geometry (segment, muscle & ligament pathways) and model parameters (muscle properties [maximum force, fiber length, pennation angle, fiber ratio] and ligament properties [yield force, yield strain & initial length]) by following anatomical texts and published cadaver studies. The geometric configuration of the base model was adjusted by optimizing the ankle muscle flexion-extension moment arms. Initially defined muscle insertion points locations were allowed to move within a small range (± 1 cm) to minimize the difference between muscle moment arms generated by the model and moment arms reported from cadaver testing2.
Subject-specific adaptation of the base model was applied to five normal pediatric subjects (age 10.6 ± 1.57 years). Initial base model geometry and parameters were uniformly scaled by subject height and weight. Then an optimization routine was constructed to scale each segment length and marker positions to minimize the total sum of squared differences between segment fixed markers on the model and the maker trajectories measured by a motion capture system (Vicon MX, Vicon Motion Systems) over the whole walking trial.
A calibration analysis was carried out for each subject to calculate optimal tendon and ligament length. The range of ligament and tendon length was computed throughout a gait cycle, and then optimal length was set to the mean of this range. Ground reaction forces for three foot segments were derived by combining data from a coupled six axis force plate and
87

pedobarograph 3. Finally muscle forces were computed by using an algorithm which minimizes the maximum muscle force activity.
Results:The moment arm optimization process resulted in more anatomically accurate model. Muscle via points were initially defined by following anatomical text using bone surface landmarks. Therefore, the effect of tendon and soft tissue thickness were not initially included, but are adjusted for with optimization.
Maker position and segment scaling optimization was observed to be very effective in converging model marker positions with marker trajectories recorded by camera system. Muscle activation patterns for each subject were compared to EMG activation pattern from the literature4 during walking and were observed to be similar.
Figure 1: EMG-measured muscle activation pattern4 (shaded) compared with model generated muscle activation patterns for n=5 pediatric subjects (lines).
Discussion:The model results demonstrate that multi-segment musculoskeletal models can be adapted for subject-specific gait application. The model can be used to compute the contributions of intrinsic foot muscles during various lower extremity tasks and represents the first step toward development of a validated musculoskeletal foot model.
References: 1. Saraswat P et al. Repeatability of Virtual marker Based Foot Model in adolescent Feet. Annual Proceedings of GCMAS, Denver 2009, 222-223. 2. Spoor CW et al. An Estimation of instantaneous moment arms of lower-leg muscles. Journal of Biomechanics 1990; 23: 1247-1259. 3. MacWilliams BA et al., Foot kinematics and kinetics during adolescent gait. Gait & Posture 2003; 17: 214-224. 4. Perry J. Gait Analysis: Normal and Pathologic Function, 1992, 51-88.
88

Friday, May 14, 2010
TIME PROGRAM/ ACTIVITY ROOM 7:00-8:00am Breakfast/ Exhibits Brickell 8:00-8:45am Keynote #3 –Baumann Lecture
Kaat Desloovere, Ph.D. “A Hybrid Approach to Reveal the Interference
of Musculoskeletal Impairments with Pathological Gait”
Monroe/Tuttle
8:45-10:00am Podium #4 PATHOLOGIC GAIT II
Moderators: Jaap Harlaar, Ph.D. and Michael Schwartz, Ph.D.
Monroe/Tuttle
PATHOLOGIC GAIT II. (TECHNICAL FOCUS) 1. Applying Center of Mass Motion Analysis in Assessing Gait Changes Following
Hamstring Surgeries in Children with Spastic Cerebral Palsy Jing Feng 2. The GDI-Kinetic: A New Index for Quantifying Kinetic Deviations from Normal Gait Adam
Rozumalski 3. Passive Mechanical Properties of Muscle in Hamstring Contractures of Children with
Spastic Cerebral Palsy Richard Lieber 4. Do Elliptical Training Kinematics More Closely Resemble Walking or Cycling? Diane
Damiano 5. A Position Measurement Method using Inertial Sensors for Clinical Spasticity
Assessment. Erwin Aertbelien 6. Single Event Multilevel Surgery in Children with Cerebral Palsy - Five Years Follow-up
using the Movement Analysis Profile and the Gait Profile Score Erich Rutz 7. Functional Metatarsal Length in Patients with Midfoot Arthritis Smita Rao
10:00-10:45am Break/ Exhibits Brickell
10:45am-12:00pm
Podium #5a CASE PRESENTATIONS
Moderators: Kaat Desloovere, Ph.D. and Sylvia Ounpuu, M.Sc.
Monroe
CASE PRESENTATIONS 1. Youth Pitcher: Elbow at Risk Melany Westwell 2. Using Gait Analysis for Treatment Decision-Making in an Adult Post Cerebrovascular
Accident: A Case Study Sylvia Ounpuu 3. Gait Analysis with Dynamic EMG for Surgical Decision-Making with a Patient Post-Polio:
A Case Study Valerie Eberly 4. Gait Analysis with Dynamic EMG: Can it Assist in the Diagnosis of Runner’s Dystonia?
Diane Serfling 5. Gait Analysis with Dynamic EMG for Surgical Planning for a Person with a Traumatic
Brain Injury: A Case Study Valerie Eberly 6. Small Incisions, Large Results: Development of Genu Recurvatum Post-Percutaneous
Medial Hamstring Lengthening: A Case Study Andrea Dennis 7. Upper Extremity Motion Analysis for Treatment Decision-Making of Rehabilitation in
Person with Post-Cerebral Arteriovenous Malformation Shigehito Matsubara
89

Friday, May 14, 2010 (continued)
TIME PROGRAM/ ACTIVITY ROOM 10:45am-12:00pm
Podium #5b SIMULATION AND MODELING I
Moderators: Scott Delp, Ph.D. and Ilse Jonkers, Ph.D.
Tuttle
SIMULATION AND MODELING I. (TECHNICAL FOCUS) 1. Creation of a Pelvis Model when Landmarks are Missing Alexander Hooke 2. Reliability of Hip and Knee Curves in Clinical Gait Analysis Morgan Sangeux 3. Determining the Best Hip Joint Centre Localization Method for Normal Subjects
Compared to 3-D Ultrasound Morgan Sangeux 4. Joint Coordinates of the Knee: Bony Landmarks Compared to Functional Calibration
Jaap Harlaar 5. Energetics of Movement: Comparison of Two Different Models for the Estimation of
Muscular Energy Consumption Maria Cristina Bisi 6. How Robust is Human Gait to Muscle Weakness? Marjolein M. van der Krogt 7. Contributions of the Tibialis Anterior, Soleus, and Gastrocnemius to Lower Extremity
Joints in Presence of the Subtalar Inversion and Eversion during the Stance Phase Ruoli Wang
12:00-1:00pm Lunch on your own 1:00-1:45pm Keynote #4
Randy Ellis, Ph.D. “Image, Models, and Motion: Problems and Prospects for Computational Orthopedics”
Monroe/Tuttle
1:45- 3:00pm Podium #6 SIMULATION AND MODELING II
Moderators: Richard Baker, Ph.D. and Steve Piazza, Ph.D.
Monroe/Tuttle
SIMULATION AND MODELING II. (CLINICAL FOCUS) 1. Contributions from Muscles and Passive Dynamics to Swing Initiation at Different
Walking Speeds Melanie Fox 2. Determining the Best Hip Joint Centre Location Method for Patients Compared to 3-DUS
Alana Peters 3. Dynamic Loading Situation of the Knee and Hip Joint in Children with Varus
Malalignment Felix Stief 4. An Alternative Technical Marker Set to Improve Pelvis Tracking in Clinical Gait Analysis
Ugo Dimanico 5. Kinematic Compensation Strategies in Patients with Medial Compartment Knee
Osteoarthritis Michael Pohl 6. Age-Related Changes in Joint Kinematics for Deep Squats Pius Wong 7. Kinematic Gait Deviations, Step-to-Step Transitions, and Metabolic Power Demand in the
Gait of Subjects with Cerebral Palsy Michael H. Schwartz
90

Friday, May 14, 2010 (continued)
TIME PROGRAM/ ACTIVITY ROOM 3:00- 3:30pm Break Monroe/Tuttle- Foyer 3:30-4:30pm Podium #7
OUTCOMES II Moderators: Mr. Tim Theologis, M.D. and
Tishya Wren, Ph.D.
Monroe/Tuttle
OUTCOMES II. (CLINICAL OUTCOMES ANALYSIS) 1. Real World Walking Behavior in Children Treated for Clubfoot Michael S. Orendurff 2. Short Term Outcome of Patients Undergoing a Selective Dorsal Rhizotomy: Comparison
to a Matched Control Group Michael H. Schwartz 3. How do Strength and Body Composition Relate to Function in Ambulatory Children with
Cerebral Palsy? Donna J. Oeffinger 4. Application of the Gillette Gait Index, Gait Deviation Index and Gait Profile Score to
Several Clinical Pediatric Populations Mark McMulkin 5. Evaluation of the Loss in Spinal Motion from Inclusion of a Single Mid-Lumbar Level in
Posterior Fusion for Adolescent Idiopathic Scoliosis Sylvia Ounpuu 6. Pre to Post-TKA Effects on Sit-to-Stand Kinetics and Function among Prehabbed and
Non-Prehabbed Patients Peter M. Quesada
4:30-6:00pm Unattended Poster Viewing Orchid 6:00-7:00pm Reception Monroe/Tuttle/Flagler-
Foyer 7:00-11:00pm Dinner Monroe/Tuttle/Flagler
91

92

PODIUM SESSION #4
PATHOLOGIC GAIT II. (TECHNICAL FOCUS)
Moderated by: Jaap Harlaar, Ph.D., VU Amsterdam, The Netherlands
Michael Schwartz, Ph.D., Gillette Childrens Hospital, Minneapolis, MN, USA
PATHOLOGIC GAIT II. (TECHNICAL FOCUS) 1. Applying Center of Mass Motion Analysis in Assessing Gait Changes Following
Hamstring Surgeries in Children with Spastic Cerebral Palsy Jing Feng 2. The GDI-Kinetic: A New Index for Quantifying Kinetic Deviations from Normal Gait Adam
Rozumalski 3. Passive Mechanical Properties of Muscle in Hamstring Contractures of Children with
Spastic Cerebral Palsy Richard Lieber 4. Do Elliptical Training Kinematics More Closely Resemble Walking or Cycling? Diane
Damiano 5. A Position Measurement Method using Inertial Sensors for Clinical Spasticity
Assessment. Erwin Aertbelien 6. Single Event Multilevel Surgery in Children with Cerebral Palsy - Five Years Follow-up
using the Movement Analysis Profile and the Gait Profile Score Erich Rutz 7. Functional Metatarsal Length in Patients with Midfoot Arthritis Smita Rao
93

Applying Center of Mass Motion Analysis in Assessing Gait Changes Following Hamstring Surgeries in Children with Spastic Cerebral Palsy
Jing Feng, Rosemary Pierce, K. Patrick Do and Michael Aiona Motion Analysis Lab, Shriners Hospitals for Children – Portland, Oregon, U.S.A.
Introduction
Gait analysis documents changes in joint kinematics and kinetics after surgical intervention. However, assessment of intra-limb coordination and the motion of whole-body center of mass (COM) are not currently included in most clinical gait studies. Parameters of COM excursion have been shown to be sensitive measurements in distinguishing elderly individuals with balance problems from healthy elderly adults [1] and assessing balance during gait of children with cerebral palsy (CP) [2]. The movement of COM has also been shown to reflect energy efficiency during gait in children with CP [3]. The purpose of this study was to investigate the changes in balance and energy transfer by quantitative analysis of the motion of COM in patients with CP following hamstring surgeries.
Clinical Significance
The application of the COM parameters in clinical gait analysis provides quantitative assessment of balance control, whole body coordination, and energy efficiency. This additional measure of impairment provides a better understanding of the underlying deficits present. This will lead to more objective understanding of the potential improvements with interventions.
Methods
22 limbs (4 subjects had unilateral surgery) in 13 patients with CP (11 male and 2 female; average age 11.8±2.2 years) who had hamstring surgeries were identified. All subjects had gait analysis pre and 1 year post operatively between 2004 and 2009. The CP group included: 10 diplegia, 2 triplegia and 1 hemiplegia; all were Gross Motor Function Classification System levels 1 and 2. Patients who had bony procedures or foot and ankle surgeries were excluded. Data from an age matched group of 25 children with normal development (15 male and 10 female, average age 11.0±3.1 years) served as a comparison.
Regression equations developed by Jensen [4] were used to define segment mass and position of COM for children 15 years of age or younger, and Dempster’s anthropometric data [5] were used for subjects over the age of 15 years. The position of full body COM was calculated as the weighed sum of all body segments. The position of Center of Pressure (COP) was calculated using data from two AMTI force plates. Sagittal and frontal COM-COP inclination angles are defined as the angle formed by the intersection of the line connecting the COP and COM with a vertical line through COP [1]. COM potential energy (PE) and kinetic energy (KE) (Fig. 1) were calculated based on the COM vertical location relative to its mean position and the magnitude of COM velocity [3]. Energy recovery factor and percent gait cycle with PE and KE being in-phase (increase or decrease at the same time) were also calculated. The gait deviation index (GDI) [6] was calculated for preop and postop data of each patient, and Pearson’s correlation coefficient was calculated between the energy recovery factor and GDI. Two tail t-test was used to detect significant (p<0.05) differences between patients and normal subjects and between preop and postop data.
94

(a) (b)
Figure 1. PE (dashed line) and KE (solid line) relative to their means respectively for (a) a normal subject and
(b) a subject with CP. Horizontal bars indicate the periods with PE and KE in-phase (changing in the same direction, thus no energy transfer). Ideally, PE and KE should be equal in amplitude and opposite in phase.
ResultsThe greatest change in COP-COM inclination angles after surgery was found in the peak COP-COM posterior inclination angle (Table 1). Compared with the age matched controls, the children with CP had a greater COM vertical excursion, a poorer phasic relation between PE and KE (Fig. 1 and Table 1), and a lower energy recovery factor (Table 1), indicating inefficient gait. The values of these parameters were improved following surgery. The GDI of these patients changed significantly (p<0.005) from 63±15 to 74±13 (index �100 is normal) after the surgery. The energy recovery factor correlated with the GDI (r=0.485, n=44, p<0.01, two tails), suggesting that energy recovery factor is related to the overall improvement of gait. Table 1. Preop and postop data (N=22) in comparison to normal data (N=25). * = p< 0.05, ** = p<0.005 when
compared to normal values; † = p<0.05, †† = p<0.005 when compared to preop.
Preop Postop Normal Gait velocity (m/s) 0.98±0.20 1.07±0.20 1.05±0.18 COP-COM max. lateral inclination angle (deg) 6.0±1.7 ** 5.6±1.7 ** 3.7±1.3COP-COM max. posterior inclination angle (deg) 6.8±2.5 ** 9.3±1.9 * †† 10.3±1.5 COP-COM max. anterior inclination angle (deg) 14.0±4.0 14.3±3.6 12.7±2.4 COM vertical excursion normalized by height (%) 3.1±0.9 ** 2.6±0.6 ** † 1.8±0.4% gait cycle with in-phase (inefficient) energy transfer 52±17 ** 45±15 ** † 15±7 Energy recovery factor (%) 22±9 ** 30±12 ** † 63±11
DiscussionThe results of this study show that the parameters of COM that measure balance and energy transfer are sensitive to the differences in gait between normal subjects and subjects with CP and between preop and postop. There is also a correlation between GDI and energy recovery factor. The method utilized in this study provides a quantitative measure of the “coordination” deficit present in patients with CP. As a tool of quantitative assessment of overall gait quality, the COM parameters can aid in objectively evaluating the severity of gait pathology and intervention outcome. References [1] Lee et al. 2006 Arch Phys Med Rehabil, 87, 569-575. [2] Cherng et al. 2007 J. Med. Biol. Eng., 27(3), 150-155. [3] Bennett et al. 2005 Arch Phys Med Rehabil, 86, 2189-2194. [4] Jensen 1986 J. Biomechanics 19(5), 359-368. [5] Winter 1990 Biomechanics and motor control of human movement. [6] Schwartz et al. 2008 Gait Posture, 28: 351-357.
Acknowledgements: Dr. Frank Buczek, Dustin Bruening, and Kevin Cooney for sharing data; Dr. Bradford Bennett and Dr. Li-Shan Chou for discussion of data analysis, and Catherine Nixon and Robert Poljak for assistance with this project.
95

96

97

Passive mechanical properties of muscle in hamstring contractures of children with spastic cerebral palsy Lucas Smith1, Ki Lee2, Henry Chambers3, Richard Lieber2 1Department of Bioengineering, University of California San Diego, La Jolla, California, USA; 2Department of Orthopaedic Surgery, University of California San Diego, La Jolla, California, USA; 3Department of Orthopaedic Surgery, Rady Children's Hospital San Diego, San Diego, California, USA Introduction: Children with spastic cerebral palsy (CP) often develop hamstring contractures. Contractures develop in patients with spasticity, however, the mechanism of contracture is still not known. Contractures represent a resistance of muscle to increased length. The elements that are responsible for this stiffness are also not known [1]. Previous work has shown that single fibers from “contractured” muscle tissue have increased passive stiffness that could lead to the overall increased stiffness of the muscle [2]. Interestingly the opposite result is observed when scaled to muscle fiber bundles as bundles from typically developing (TD) children are more stiff than contractured bundles [3]. These samples were compared across a variety of muscles. To avoid potential complications associated with comparing among numerous different muscles, the current study investigates these effects in specific hamstring muscles involved in gait, gracilis (GR) and semitendinosus (ST). Clinical Significance: Hamstring contractures limit knee extension and are known as a possible contributing factor of crouch gait in patients with CP [4]. Despite new therapies, current best practices are unable to prevent contractures. Further understanding of the mechanism of contracture and the elements responsible could lead to new therapies to prevent contracture development and improve muscle function. Methods: Biopsies were obtained during hamstring lengthening surgeries for patients with CP and from the hamstring autograft used in ACL reconstruction surgeries for control patients. Biopsies were removed and placed directly into a glycerol relaxing solution. Single fibers were dissected in chilled relaxing solution and transferred to the loading chamber at room temperature. The fiber was attached via suture to a force transducer on one end and a motor arm on the other end. The sarcomere length of the fiber was measured by laser diffraction and monitored using a photodiode. Fiber length was set to the minimum length that produced measurable force. The motor stretched the fiber in approximately 0.25 µm sarcomere length increments. Force was continuously measured over 2 minute time interval while the fiber underwent stress relaxation. The stretch was repeated approximately 10 times or over an approximately 2.5 µm sarcomere length range. Data were fit to a viscoelastic model containing a spring in parallel with a series spring and dashpot. Bundles were measured as fibers but with a strain dependent parallel spring creating a quadratic stress strain fit.
98

99

100

Figure 1. Sagittal plane kinematics across four conditions: Overground walking (W), treadmill walking (T), Elliptical (E) & Cycling (C).
GDI Principal Components Analysis by Modality. Mean GDI was not different between T (96.0) & W (100.0±10SD); whereas E (2.46) & C (-46.1) differed from each other and T & W (p< 0.001). The radar plot (Fig 2) of individual GDI scores for all 10 participants illustrates relative distances and further demonstrates the strong similarity in W & T kinematics.
Discussion While there is evidence of shared neural circuitry in cycling and walking, substantial kinematic differences may limit transfer across tasks. E is closer to W & T than C is, but shifts the entire extremity into more flexion similar to C. The vertical loading and associated reciprocal arm movements may make elliptical training a more effective alternative to cycling and a more feasible (less need for therapist assistance), longer term option than treadmills for improving gait in multiple disorders.
References 1. Lee SJ, Hidler J. J Appl Physiol 2008;104(3):747-55. 2. Lu TW, Chien HL, Chen HL. Med Sci Sports Exerc. 2007 Sep;39(9):1651-8. 3. Schwartz MH, Rozumalski A. Gait Posture. 2008 Oct;28(3):351-7.
Acknowledgements: This work was funded by the intramural program, NIH Clinical Center
Figure 2. Radar plot of individual GDI scores
101

������������� ����������� ����������������������
����������������������������
����������� ���������� ����������������������� ����� ����!���" ��#������ $%��&������'�����'�!�(�)��������'���*+,������% �� �������)�� ��� ���(��������� �#�����-�������'����'���*"��#������ $.�&��������� ��������!�(�)��������'����
�������������������������� �!��"�����#
/ ��#� �� �#�����������������0�10"1��� �����2�����##����������'����2������&�����2���� #�2� ��������'����'������� �����$ ����2���$��������� �� '��#&�3��%45�/&����������$ ����� �&�# ���� �������������& 2�����2�6 ��0 1�& 7���� ��2�$$������ �������2��������&��'�� $����&3�8,5�8#���������������2�$$����� � ��� �# �2 &��� ���������� #� �����0 1� /&���$ ��� ������� ��� �� 7��� ���2�� 7��������������� ���& 2����������� �� �2&���'� #�����&���� ������������7��&���#���� �&���� �������$�����$�������� 2����&�# ���� ������������& ��2���������� � ��$ ������9������������������ ������ $ � �&�&�'&����� �������2���������� � ������'2���'�#������������������/&�# ���� �������� ���& 2�2�&�2��������� $��������������#����������& ��2 ���� ���2����#�����2#� ���������& ��2��������27��&����'����2���& 2�/&����������#� # ����2����2���������������& 2� � ����&��� ��#� ������ /&�����& 2� ������&�# ���� �������� 7��&� ��2������2� 7��2'� ��&�$ �� $������������ 2�� $�&��#������������������ �� �$#�%��
/&� ���'����2 ���������� ������ ���2 " ��� ' ������� ��:� ;"<= ;92 $ ���������������������3:%(�57&��&� ���� �&������� �������2'�� �� #��� /&�:%(�7���#����2 �&�$ ���&���2�&�'&� �2��� ������$���� >������ $�&�����2�&�#�����>2 ����$���� $�&�����2���'��������#������������������/&��������������& 2��� 7�����������#������� $�&���� ��7��&���#���� �&���� �������$�����$����� $�&���'�����/&���� � � ���� 7�� #����?�2� �����?�� $�����������$�����2$ ������� �������� $ �&����������������&��$ ��� �2 ��%4� /&� �������� � 2�� $ �&� �#������������������ �� ���������� 2���'�&�����2����� ��� �����#��&�'�� ��� 7��&��� ��'����� ��'� �#����/&��������#�� ����#��$��&����������� ����#����� 2��� @�'��� �& 7��&�� 2�����2$ � �&�����'������������������7��$����2�&� �'&�&���7'�� �� #������������ 7��& ��& ' �� ��'����� � /&������ ����# 2�� �&�� ���� ���� $�&���'����7&��&���&�$���� >������ � ���� ����$ �� �&�����2����/&�������&�# ���� $�&�#��� $� �� 7��&���#���� ���& $�&���� ��7��2�������2�.�$�����# ���� $�&������2���7����������2���'�&�29&��2' � ��������&������ $�&�������/&����������� #� ��2������ 7���� #������� ��$ �� 7�'�&�� ������� $�������#���������2���$���� �2����'� $�&�#� # ��2���& 2� �!������ �&��0=10<1�7���##���2�
�������
102

������ ������������ ������������� �������������������������������� �������������� ����������� ������ ���� ����������������� ������ ����������������������������������� �������������������������������� ��������������������������������������������������������������������������������������������������������������������������������������������������������������������������������������������� ������ ������������
������������� ������ �������� ����������������������������� �������������������!"#� ������ ����������������������$#$��!%&'��������������� ������� � ��� � ������� � ������ ���� � �� � ��� � ������ ���������� � ��� � ���������� � ���� � ��� � �� � � ����� � ��� ������������������������������������������� ��������� � ������� � �� � �� � �������� � ��� � ��� � ��� � �������������� � ��� � ���� � ��� � ������� � ������ � �����������������������������������()**����+�,������%"-��� � ��� ����������� ���� �*�& ����� ����� � � � �.� � �������������������������������������������� ���������������������� ����������������������������� ���������� ������ �����������/����������������� ��������������%"-������������������������&���������������������)�������������� ���������� ������������������������������������ ����������01��� ������������������� ������(%0",�������
�������� ������������� �������������.�������� �������������������������������������������������������� ������� ������� ����� ������������������� ����������� ���������������������������� ������������������������������������������������������������������� ����� !������ ����������������������������� ������ �������� ���������������������������������������������������������� ����������������� ��������������������������������������������������������� ��������� ��������������������������������������������������������������������������.��������������������������������������������������������� �����������������0�������������������������������2������������� ����� � ����� ��� ��� � ��������� ����� ����� ������ � ���� � ���������� ����� ���������� ������������������������������������������������3"4� ������ �������� �������� ��
��������������������������!5�� ��������(!5�6�"����������� ���7�!5��*'*899,������� ���
:�;���������<�����=�1���-��������/������>�������=���3�������������������������������������� ���������������������������������������������4����?�@��������)**9�������&*�������&A6�B&�
:);���������%5��- ����"��!�������������������������� �������������������������� �����������������@����������9A8��'8(),7)*'C8�
:&; ��������4���-��������-���D������%�������������������E����������2������ ���������������������F���%����<�������9����9GB��������B&6�BB�
:B;���6-���� �H���I��J���3��� ��������������������@�����������������2��������-���������������>������<��������"����99&�����&A)C&AA�
:G;�%�����>�3�������� ���-��������1�����"�.� � ���������������� ������������������ ������� ����!���=�������&���9'G�������A�������BBGC�BG*�
�������
103

Title: Single event multilevel surgery in children with Cerebral Palsy - Five years follow up using the Movement Analysis Profile and the Gait Profile Score Authors: Erich Rutz 1,2,3, Richard Baker 2, Oren Tirosh 2, Reinald Brunner 1,3
1 Pediatric Orthopedic Department, University Children’s Hospital Basle UKBB, Switzerland 2 Murdoch Childrens Research Institute, The Royal Children’s Hospital, Victoria, Australia 3 Laboratory for Gait Analysis, University Children’s Hospital Basle UKBB, Switzerland Introduction: Without treatment, mobility in children with bilateral spastic cerebral palsy (CP) deteriorates with time 1. Single event multilevel surgery (SEMLS) is performed in order to prevent deterioration and to improve gait in patients with bilateral involvement of the lower extremities. The SEMLS approach was first described in the 1980’s 2,3. A favourable outcome after multilevel surgery was described for independent 4-6 and assisted walkers 7,8. The aim of this study is to evaluate the functional and technical short- and mid-term outcomes of SEMLS for gait correction in children with spastic CP using the Movement Analysis Profile 9 (MAP) and the Gait Profile Score 9 (GPS). Clinical Significance: Gait problems in children with bilateral spastic CP can be corrected successfully in one major operative session with the SEMLS approach consisting of correction of bony deformities and surgery of tendons including agonist lengthening and antagonist shortening. The short-term results last at least till mid-term (5 years follow-up). Methods: A total of 14 diplegic patients (4 girls/10 boys; mean age 12.8 ± 3.3 years (median = 12.5y, range 7 – 18y at time of preoperative gait analysis)) had 90 surgical interventions. The mean number of interventions per SEMLS session was 6.43 ± 2.28 (median: 6.0, range: 4-10). One patient had GMFCS level I, 10 patients had GMFCS level II and 3 patients had GMFCS level III. Patients with GMFCS level IV or V were not included in this study. All participants had pre- and postoperative 3D gait analysis including a thorough clinical assessment and collection of 3D gait data. From the 3D gait data temporal parameters (cadence, stride length, and walking speed), the Gillette Gait Index (GGI) 10, the Gait Deviation Index (GDI) 11, the MAP and GPS were calculated. Results: The mean interval between the first gait analysis and surgery was 0.8 years. 3D data were collected preoperatively for all (n = 14) patients. At short-term (mean 1.85 yrs postoperative) follow-up MAP for knee flexion, ankle dorsiflexion, and foot progression, and the GPS, GGI, and GDI improved statistically significantly (see table 1). Between the short and mid term follow-up 9 patients (= 64.3%) had additional minor surgical procedures (soft tissue or bony interventions). For this period no statistical significance was found for all of the investigated gait parameters (walking speed, cadence, stride length; neither all of the MAP’s nor the GPS, the GGI, and the GDI). The favourable results from short-term were maintained to the mid-term follow-up (mean 5.0 yrs postoperatively) and even MAP for hip flexion, walking speed and stride length improved statistically significantly.
104

Table 1: preoperative results compared to short-term preoperative short-term p-value walking speed (m/sec) 0.83±0.26 0.90±0.27 0.3200 cadence (steps/min x 100) 1.86±0.34 1.83±0.39 0.8059 stride length (m) 0.88±0.19 0.98±0.20 0.0744 MAP pelvic tilt 9.30±4.75 11.53±8.14 0.2330 MAP pelvic obliquity 5.60±3.40 4.61±1.41 0.8388 MAP pelvic rotation 10.72±5.91 8.01±3.79 0.0549 MAP hip flexion 18.83±10.12 17.98±8.51 0.7456 MAP hip abduction 6.71±2.67 6.13±2.00 0.3818 MAP hip rotation 15.60±10.10 11.97±5.15 0.1086 MAP knee flexion 29.28±16.94 18.49±7.52 0.0045 # MAP ankle dorsiflexion 13.27±14.17 8.00±2.74 0.0005 # MAP foot progression 29.34±24.36 14.17±6.97 0.0036 # GPS 20.00±8.67 12.92±3.57 0.0003 # GGI 659.37±537.64 255.82±124.53 0.0004 # GDI 56.03±9.38 66.50±8.73 0.0001 # # statistically significant Surgical complications: One patient required surgical revision of tendo Achilles lengthening for an infection (two months after SEMLS, overall infection rate 1.1 %). Discussion: Outcome measurement of surgery in CP is difficult. To our knowledge this is the first study using the MAP and GPS to assess gait pathologies and the results of SEMLS treatment in children with CP. Other factors, such as motivation of each child and their ability to participate in the postoperative rehabilitation program, are likely to be important, although these are more difficult to quantify. Our study has a number of limitations such as including a small sample size, retrospective data analysis, missing of a non-operative control group and we did not assess the effect of SEMLS on the functional abilities and health-related quality of life for each child. References: 1. Bell KJ et al., J Pediatr Orthop 2002;22-5:677-82. 2. Norlin R et al., J Pediatr Orthop 1985;5-2:208-11. 3. Browne AO et al., J Pediatr Orthop 1987;7-3:259-61. 4. Schwartz MH et al., J Pediatr Orthop 2004;24-1:45-53. 5. Saraph V et al., J Pediatr Orthop 2005;25-3:263-7. 6. Gough M et al., J Bone Joint Surg Br 2008;90-7:946-51. 7. Ma FY et al., J Bone Joint Surg Br 2006;88-2:248-54. 8. Yngve DA et al., J Pediatr Orthop 2002;22-5:672-6. 9. Baker R et al., Gait Posture 2009;30-3:265-9. 10. Schutte LM et al., Gait Posture 2000;11-1:25-31. 11. Schwartz MH et al., Gait Posture 2008;28-3:351-7. Acknowledgments: This study has been financially supported by the Swiss Society for Orthopaedic and Trauma Surgery (SGO).
105

Functional metatarsal length in patients with midfoot arthritis
Smita Rao1, Judith F. Baumhauer
2, Deborah A. Nawoczenski
3
1: Department of Physical Therapy, New York University; 2: Department of Orthopedics,
University of Rochester Medical Center; Department of Physical Therapy, 3: Ithaca College –
Rochester Center, New York
Introduction
Previous studies have suggested that patients with atraumatic midfoot arthritis have a
Morton’s foot structure, reflected in a functionally shorter 1st metatarsal.[1] In asymptomatic
subjects, Morton’s foot structure has been linked with overloading of the head of the 2nd
Metatarsal, reflected as increased average pressure.[2] However no objective evidence exists
to substantiate the mechanisms by which Morton’s foot structure may contribute to symptoms
in patients with midfoot arthritis. The purpose of our study was to examine functional 1st
metatarsal length in patients with midfoot arthritis, and to compare regional plantar loading
sustained during walking in patients with midfoot arthritis compared to asymptomatic control
subjects.
Methods
50 subjects, 30 patients with midfoot arthritis and 20 asymptomatic control subjects, matched
in age, gender and BMI, participated in this study. Functional metatarsal length was
quantified on antero-posterior weight bearing radiographs, as the ratio of the length of the 1st
metatarsal to the length of the 2nd
metatarsal.[1] Plantar loading data during barefoot walking
were acquired using an EMED pedobarograph (Novel Inc, St Paul, MN), as patients walked at
self-selected speed, monitored to ±5% using an infra-red timing system (Brower Inc, UT).
Control subjects’ speed was matched to patients’ walking speed. Plantar loading data was
analyzed using Novel Win software (St Paul, MN) and a standard 10 region “mask”
defining the following areas: heel, midfoot, metatarsals 1-5, hallux. Plantar loading was
characterized using average pressure, contact time and pressure time integral. Independent t-
tests were used to assess differences in average pressure between the two groups.
Results
In patients with midfoot arthritis, the first metatarsal was 82% the length of the second
metatarsal. Patients with midfoot arthritis sustained significantly higher pressure time integral
at the heel (52%), midfoot (39%), and 1st metatarsal (38%). (Figure 1)
Patients with midfoot arthritis also showed increased average pressure at the heel (Table 1)
and increased contact time at the heel and midfoot (Table 2).
115
75
142
132
118
83 77
152
317
76
54 1
03 1
39
121
84
71
126
246
0
100
200
300
400
HEEL MID 1MET 2MET 3MET 4MET 5MET HALX Total
Figure 1. Pressure time integral
in patients with midfoot
arthritis (white columns) and
asymptomatic control subjects
(grey columns), expressed in
kPa.s. Error bars indicate
standard deviation, asterisk
indicates P<0.05.
106

MFA (SD) Control (SD) P value
HEEL 115.6 63.3 90.3 30.6 0.058
MID 66.6 28.2 58.2 29.6 0.171
1MET 145.8 72.2 125.8 60.7 0.168
2MET 134.4 77.4 172.1 77.9 0.059
3MET 119.2 65.5 147.4 42.1 0.055
4MET 81.4 48.4 99.7 29.4 0.076
5MET 78.4 55.8 87.9 45.2 0.274
HALX 149.2 124.3 152.4 105.4 0.465
Table 1. Average pressure, expressed in kPa (Mean (SD))
MFA (SD) Control (SD) P value
HEEL 64.5 10.0 56.6 11.4 0.010
MID 70.2 7.8 61.4 11.6 0.002
1MET 77.6 6.3 77.5 4.9 0.477
2MET 80.7 5.5 81.3 3.1 0.323
3MET 82.3 5.4 83.0 3.1 0.324
4MET 80.6 4.9 80.9 3.2 0.422
5MET 75.5 6.3 73.8 4.7 0.169
HALX 70.3 15.1 65.1 16.4 0.138
Table 2. Contact time, expressed in percent stance (Mean (SD))
Discussion
Patients with midfoot arthritis showed a functionally shorter 1st metatarsal, confirming
the prevalence of Morton’s foot structure in this population. In contrast to the 77% shorter 1st
metatarsal reported by Davitt et al.,[1] our cohort of patients with midfoot arthritis showed an
82% shorter 1st metatarsal, similar to the control group in the study by Davitt et al.[1]
Our findings related to regional plantar loading (specifically, pressure time integral) in
the control group are in close agreement to those reported previously.[3] Previous reports, in
individuals with Morton’s foot structure as well as in asymptomatic control subjects, suggest
that the central metatarsals (2 and 3) sustain the highest loads. In contrast, the findings of our
study indicate that patients with midfoot arthritis may overload the 1st metatarsal, midfoot and
heel, compared to control subjects. The ratio of pressure time integral sustained under the 1st
metatarsal to the 2nd
metatarsal was 1.1 in individuals with midfoot arthritis, and 0.7 in the
control group, consistent with the 0.7-0.8 reported by previously. [3]
Our study confirms that a Morton foot structure, in conjunction with regional plantar
loading and segmental mobility, may play a modest role in contributing to symptoms in
patients with midfoot arthritis.
References
1. Davitt, J.S., et al., J Bone Joint Surg Am, 2005. 87(4): p. 795-800.
2. Rodgers, M.M. and P.R. Cavanagh, Med Sci Sports Exerc, 1989. 21(1): p. 23-8.
3. Putti, A.B., et al., Gait Posture, 2008. 27(3): p. 501-5.
4. Rao, S., et al., J Biomech, 2009. 42(8): p. 1054-60.
Acknowledgements. This study was funded in part by the American Orthopedic Foot and
Ankle Society and the Arthritis Foundation.
107

PODIUM SESSION #5A
CASE PRESENTATIONS
Moderated by: Kaat Desloovere, Ph.D., K.U. Leuven, Belgium
Sylvia Õunpuu, M.Sc., Connecticut Children’s Medical Center, Farmington, CT, USA
CASE PRESENTATIONS 1. Youth Pitcher: Elbow at Risk Melany Westwell 2. Using Gait Analysis for Treatment Decision-Making in an Adult Post Cerebrovascular
Accident: A Case Study Sylvia Ounpuu 3. Gait Analysis with Dynamic EMG for Surgical Decision-Making with a Patient Post-Polio:
A Case Study Valerie Eberly 4. Gait Analysis with Dynamic EMG: Can it Assist in the Diagnosis of Runner’s Dystonia?
Diane Serfling 5. Gait Analysis with Dynamic EMG for Surgical Planning for a Person with a Traumatic
Brain Injury: A Case Study Valerie Eberly 6. Small Incisions, Large Results: Development of Genu Recurvatum Post-Percutaneous
Medial Hamstring Lengthening: A Case Study Andrea Dennis 7. Upper Extremity Motion Analysis for Treatment Decision-Making of Rehabilitation in
Person with Post-Cerebral Arteriovenous Malformation Shigehito Matsubara
108

Youth Pitcher: Elbow at Risk Melany Westwell, MS, PT, Sylvia Õunpuu, MSc, and Carl Nissen, MD
Center for Motion Analysis, CT Children’s Medical Center, Farmington, CT, USA E-mail: [email protected] Web: www.ccmckids.org
Patient History & Clinical Data 11.8 year old pitcher with 2 years of pitching experience. He occasionally experienced medial elbow pain after pitching which he treated with ice and rest. His shoulder rotation range of motion had an external bias typically found in pitchers (internal = 50°, external =100°). The elbow joint was stable and pain free at the time of the examination. There was no pain on varus/valgus stressing, a negative milking maneuver, and no pain on valgus extension overload. He had full elbow flexion/extension and wrist pronation/supination range of motion.
Pitching Data: The data in the following section is presented as (parameter:X,Y). The X value represents the pitcher’s average value (average of 3 trials) for the relevant parameter. The Y value represents the average youth value for this same parameter. The average youth value was calculated from a database of 27 youth pitchers ages 8.1to 14.8 years of age.
Ball Velocity: The pitcher’s ball velocity was slightly below average (X= 21.5 ± 0.8 m/s, Y=23.0± 3.3 m/s).
Kinematics: The pitcher’s upper extremity kinematics (glenohumeral, elbow and wrist) during the pitching cycle were within normal limits with the exception of mildly excessive external glenohumeral rotation and elbow flexion. His core kinematics (pelvis, thorax, spine kinematics) however were very atypical (Figure 1A & B). He demonstrated a much greater than normal spine obliquity in the coronal plane from foot contact (FC) through ball release(BR) (peak spine obliquity: X= 48 ± 2°, Y= 23 ± 11°). This was generated by an excessive thorax lateral lean (leaning away from the throwing arm) (peak lateral thorax lean: X= 41 ± 7°, Y= 25 ± 10°), combined with greater than normal pelvic drop on the throwing side (peak pelvic drop: X = 8 ± 5°, Y= 3 ± 8°). He also had a much greater than normal posterior spine tilt (lordosis) in the sagittal plane (peak posterior spine tilt: X= 67 ± 5°, Y= 39 ± 9°), due to a combination of excessive posterior tilt of the thorax (peak posterior thorax tilt: X = 30 ± 7°, Y = 12 ± 9°) and anterior tilt of the pelvis (peak anterior tilt: X = 55 ± 2°, Y = 38 ± 8°).
Kinetics: His coronal plane peak varus elbow moment was greater than normal (peak varus elbow moment: X= 0.64 ± 0.03 Nm/kg, Y = 0.54 ± 0.11 Nm/kg) (Figure 2).
Treatment Decision Previous research on youth pitchers has identified associations between the varus elbow moment and excessive posterior spine tilt and excessive lateral thorax lean[1, 2]. Therefore coaching intervention was advised to modify the pitcher’s thorax and pelvis position in an effort to reduce the lateral thorax lean and posterior spine tilt (lordosis).
Summary The peak varus elbow moment is an objective measurement of the injury potential for the ulnar collateral ligament (UCL). Previous research has shown that the load on UCL
109

during pitching is near its maximum capacity [3, 4]. Thus, concern is warranted and intervention advised even in those pitchers with minimally excessive elbow moments, particularly if there are associated overuse symptoms (pain and inflammation).
Figure 1A: 3D thorax, pelvis and spine angles for 3 pitching trials. The pitching cycle is time normalized fromFC of the lead le(0%) to max GH internal rotation (100%). Thedashed verticline represents max GH exterotation, and the solid line represents BR. The wide grey band is the normal band equal to the mean
g
al
rnal
itcher at maximal GH external rotation. Figure 2: Elbow Moment.
1.
t injury mechanisms. The American Journal of Sports Medicine, 1995. 23(2): p. 233-239.
±1std dev.
Figure 1B: PReferences
Pierz, K., M. Westwell, et al., Evaluation of the impact of elbow drop on coronal plane elbow loads in adolescent pitchers. 2007 Annual Conference of the Pediatric Orthopaedic Society of North America Patel, M., S. Õunpuu, et al., Peak elbow varus load and upper body kine2. matics in adolescent pitching. 2006 Annual Conference Canadian Society of Biomechanics. Dillman, C., P. Smutz, et al., Val3. gus extension overload in baseball pitching. Med Sci Sports Exerc. 23(Suppl 4): p. S135. Fleisig, G., J. Andrews, et al., Kinetics of baseball pitching with implications abou4.
110

USING GAIT ANALYSIS FOR TREATMENT DECISION-MAKING IN AN ADULT POST CEREBROVASCULAR ACCIDENT: A CASE STUDY
Sylvia Õunpuu, MSc, Melany Westwell, MS, PT and Kristan Pierz, MD
Center for Motion Analysis, CT Children’s Medical Center, Farmington, CT, USA E-mail: [email protected] Web: www.ccmckids.org
PATIENT HISTORY This patient was a 52 year old female with a diagnosis of left hemiparesis secondary to a cerebrovascular accident two years and 3 months prior to gait analysis. She currently ambulates with a left hinged AFO and a right quad cane. She is unable to ambulate barefoot. Her primary complaints were left sided instability and clearance problems. She has had no previous lower extremity surgery but has undergone multiple Botox injections for both the left upper and lower extremities; the most recent injections two months prior to the gait analysis. The patient reported limited benefit of Botox. The purpose of the motion analysis was to: 1) advise on optimal injection sites for future Botox treatment of spasticity, 2) consider surgical interventions at the level of the foot and ankle and 3) provide AFO recommendations for the left ankle. CLINICAL DATA Minimal spasticity was present in the left hamstrings and rectus femoris at rest. Moderate spasticity was noted in the left lateral gastrocnemius and posterior tibialis at rest. Sustained clonus was noted in the left plantar flexors. The patient presented more predominantly with a flaccid pattern. Her isolated motor control of the left lower extremity was completely absent at the ankle and knee flexion and hip extension. She had 1/5 hip flexion and 3/5 knee extension in synergy on the left. Peak left ankle dorsiflexion measured -15 degrees with knee extended and 20 degrees with the knee flexed. The left forefoot eversion was neutral and inversion was full. The left knee had 5 degrees of hyper extension (hip at 0 degrees) and -40 degrees extension (hip at 90 degrees) and 90 degrees of knee flexion. Left straight leg raise was 55 and left hip extension and flexion were full. No contractures were noted on the right with good muscle strength. GAIT DATA Dynamic EMG data showed minimal contractile activity during gait on the left side (Figure 1). This would suggest that limited range of motion of the left lower extremity is not a function of spasticity or "over" activity of the primary lower extremity muscle groups. The joint kinematics for the pelvis and bilateral hips, knees and ankles during walking with the left hinged AFO, show fixed left ankle plantar flexion of
Left Side EMGLeft Gastrocnemius
% Gait Cycle
5
-5
V
Left Anterior Tibialis
% Gait Cycle
5
-5
V
Left Hamstrings
% Gait Cycle
5
-5
V
Left Vastus Medialis
% Gait Cycle
5
-5
V
Left Vastus Lateralis
% Gait Cycle
5
-5
V
Left Rectus Femoris
% Gait Cycle
5
-5
V
Left Gastrocnemius*
% Gait Cycle
5
-5
V
Left Anterior Tibialis*
% Gait Cycle
5
-5
V
Left Hamstrings*
% Gait Cycle
5
-5
V
Left Vastus Medialis*
% Gait Cycle
5
-5
V
Left Vastus Lateralis*
% Gait Cycle
5
-5
V
Left Rectus Femoris*
% Gait Cycle
5
-5
V
Left Gastrocnemius**
% Gait Cycle
5
-5
V
Left Anterior Tibialis**
% Gait Cycle
5
-5
V
Left Hamstrings**
% Gait Cycle
5
-5
V
Left Vastus Medialis**
% Gait Cycle
5
-5
V
Left Vastus Lateralis**
% Gait Cycle
5
-5
V
Left Rectus Femoris**
% Gait Cycle
5
-5
V
Figure 1: Surface EMG for the gastrocnemius, anterior tibialis, hamstrings, vastus medialis and lateralis and rectus femoris for the left side.
111

about 5 to 10 degrees through out the gait cycle (Figure 2). Reduced peak knee flexion in swing on the left confirms the location of her clearance issue.
TREATMENT DECISIONS AND INDICATIONS 1) Botox is not indicated at this time for the left lower extremity. Dynamic EMG data suggests that there is minimal muscle activity of the major muscle groups on the left side during gait indicating that spasticity is not the likely cause of reduced range of motion. The EMG data and her tone assessment which indicates more of a flaccid presentation may explain her lack of response to previous Botox injections. 2) No surgical intervention is recommended at the level of the foot and ankle. She is well maintained in her hinged AFO and shows no evidence of skin breakdown. Her left ankle plantar flexor contracture assists in providing left knee stability in stance through hyperextension (Figure 2) which is necessary due to significant quadriceps weakness and lack of motor control. However, her left ankle plantar flexor contracture should be monitored. 3) She should continue to wear her left hinged AFO. However, she does not use the hinged component as documented in the left ankle sagittal plane kinematics (Figure 2).Although the hinged AFO may facilitate other activities such as stair descent, a solid AFO could also be considered for the next orthosis. The solid AFO may give her more stability in stance on the left side by preventing uncontrolled knee flexion in stance and providing more support at the level of the ankle.4) Her clearance issues on the left side are a result of reduced peak knee flexion in swing(Figure 2). This may be due in part to rectus femoris activity in swing on the left (Figure 1). However, the rectus femoris was not consistently active during swing phase and her reduced sagittal plane knee flexion may more likely be related to left lower extremity weakness.5) This patient should continue to work on muscle strengthening where possible and gait training to optimize her gait function.
SUMMARYThe proposed treatment for this patient from the referring physician was a series of ongoing Botox injections to treat spasticity. This treatment decision was not supported by the gait analysis data since there was no evidence of significant spasticity on dynamic EMG or on clinical assessment. As a result of the gait analysis, the patient did not undergo unnecessary Botox treatment at this time.
Pelvic Obliquity20
-20
Up
Dn
deg
Hip Ab-Adduction20
-20
Add
Abd
deg
Knee Varus-Valgus
Gait Cycle
30
-30
Var
Val
deg
25% 50% 75%
Pelvic Tilt40
-20
Ant
Pos
Hip Flexion-Extension60
-20
Flx
Ext
Knee Flexion-Extension80
-20
Flx
Ext
Plantar-Dorsiflexion
Gait Cycle
40
-40
Dor
Pla
deg
25% 50% 75%
Pelvic Rotation40
-40
Int
Ext
Hip Rotation40
-40
Int
Ext
Knee Rotation40
-40
Int
Ext
Foot Progression
Gait Cycle
40
-40
Int
Ext
25% 50% 75%
Figure 2: Kinematics for the left (solid red line) and right (green dashed) lower extremities.
112

Gait Analysis with Dynamic EMG for Surgical Decision-Making with a Patient Post-Polio: A Case Study
Valerie J. Eberly, Sara J. Mulroy, Vance C. Eberly, Jacquelin Perry Pathokinesiology Laboratory, Rancho Los Amigos National Rehabilitation Center,
Contact: [email protected] Patient History
The patient is a 60-year-old man with a history of polio at 2 years of age affecting primarily his right lower extremity. About 20 years ago he began tripping and falling due to dysfunction of his right foot. He began wearing a short ankle foot orthosis (AFO) at that time which was lengthened over the years to just below the fibular head. He had been an avid hiker walking 6 miles a day but during the last year was only able to walk no more than 2 miles. At the time of testing he used a poly articulated AFO with free dorsiflexion and plantar flexion to provide medial/lateral support of his ankle for all community mobility. He reported that the AFO caused pain on the lateral side of his foot, but that he also had lateral ankle pain when walking without the orthosis. He also reported if he walked around his house without his brace for more than a couple of hours, he would become fatigued for the rest of the day. He was referred for gait testing to evaluate his right equinovarus gait for possible surgical candidacy for posterior tibialis tendon transfer. Clinical Data
Clinical examination identified a mild ankle plantarflexion contracture reaching neutral (0 degrees dorsiflexion) with both full knee extension and knee flexion. Eversion in the forefoot was available to 25 degrees indicating that his varus had a dynamic component. Plantar flexion occurred primarily in his midfoot with his calcaneus remaining at neutral. He had marked weakness in his ankle plantar flexor (0/0) and eversion (3/0) muscle groups. His long toe flexors were also graded Zero while the short toe flexors were graded 4/5. Ankle dorsiflexion and inversion were the strongest muscle groups in his right ankle with manual muscle test grades of 5/5. Knee extension was graded 4/5. Gait Data
His self selected free walking velocity was mildly limited at 64 meters/min (78% of normal) primarily due to a decrease in stride length (82% of normal). Footswitch recording demonstrated delayed contact of the 1st metatarsal until terminal stance indicating prolonged varus in stance. Heel-off was delayed until preswing consistent with marked plantar flexion weakness. Walking with his AFO increased his velocity minimally to 68 meters/minute or 83% normal by increasing stride length to 93% normal. Heel off was delayed until preswing in both conditions.
Quantitated motion analysis of his right lower extremity during barefoot walking identified primary gait deviations including equinovarus with excessive inversion of the rearfoot (10 degrees) and excessive plantarflexion, particularly in the first ray resulting in a cavus foot. Dorsiflexion in swing was inadequate at 10 degrees of plantar flexion until terminal swing. (Fig.1) Excessive toe extension was noted throughout but was particularly evident in swing. Excessive external rotation was recorded at all joints with 30 degrees at the ankle, 25 to 30 degrees at the knee (external tibial torsion) and 20 degrees at the hip. At the knee, extension in terminal swing was inadequate at 20 degrees of flexion resulting in initial contact in knee flexion. Knee flexion was excessive in loading, increasing further to 30 degrees. (Fig. 2)
113

% Gait Cycle
Fig. 2 Knee kinematics in the sagittal, frontal and transverse planes. Shaded area is normal reference.
% Gait Cycle Fig. 1 Ankle kinematics in the sagittal, frontal and transverse planes. Shaded area is normal reference.
Dynamic EMG recording during walking identified premature, high intensity activity in
both peroneus longus and peroneus brevis from terminal swing through terminal stance. Posterior tibialis had low-level activity in both stance and a second packet in early swing. No significant electric activity was recorded in gastrocnemius during walking. Anterior tibialis was biphasic with high intensity activity in stance and swing. Treatment Decisions and Indications His excessive hindfoot inversion was primarily a static deformity resulting from his excessive external tibial torsion. The posterior tibialis muscle was not a primary deforming force and thus a transfer of this muscle would not likely correct his deformity. To provide a more stable foot in stance and swing, the inversion and external tibial torsion needed to be reduced. A supramalleolar derotational osteotomy was indicated to turn the foot in and eliminate the external torsion deformity. In addition a triple arthrodesis was recommended to stabilize the subtalar joint. After the deformity is corrected we recommended a poly articulated AFO with a dorsiflexion stop to provide stance phase support at the ankle and knee in the sagittal plane and decrease the work load on his quadriceps muscles. He should also limit his hiking and hill climbing so that he does not fatigue his weak residual muscles. Summary The gait analysis study with EMG activity allowed us to identify that inappropriate or unbalanced muscle activity was not the primary cause of the patient’s gait dysfunction and make appropriate recommendations.
114

115

demonstrated an extremely consistent and reproducible abnormal pattern(Figure 1). The patient spent equal time on both lower extremities with equal stride lengths, and the kinematics demonstrated that the patient was leading with the right side and leaning forward with the trunk. She demonstrated excessive hip flexion on the left in swing, mildly increased hip internal rotation bilaterally, and increased hip adduction on the left in mid stance. Left knee flexion increased with swing. Left ankle sagittal motion demonstrated no plantar flexion. Kinetics demonstrated increased knee extension moment in mid stance on the right and decreased power generation in mid to late stance at the knee and ankle on the left. Dynamic EMG demonstrated that bilateral iliopsoas and rectus femoris were continuously active. Bilateral gluteus maximus demonstrated an unusual pattern of increased activation in mid swing(Figure 2). The biceps femoris on the left had an extended activation period in swing. The left gastrocnemius was continuously active.
Treatment Decisions and Indications: The gait study demonstrated a highly reproducible abnormal running pattern in terms of kinematics, kinetics, and dynamic EMG, along with the abnormal firing pattern demonstrated on dynamic EMG. This led to a preliminary diagnosis of task specific dystonia versus early Parkinson’s disease versus a dopa-responsive dystonia. The patient began carbidopa/levodopa 25/100, two tablets twice daily and supplemental carbidopa 25 mg twice daily with marked improvement. At a 4 month follow-up, the patient reported that she was able to walk quickly or jog up to 6 blocks without symptoms, and recently was in a race where she was able to go almost 2 miles with some intermittent walking. She has not had any falls, and she has not been tripping. Her neurological evaluation was negative for bradykinesia, postural instability, resting tremor or cogwheel rigidity. There were no detectable Parkinsonian features to her gait or overall appearance.
Summary:The patient’s final diagnosis was task-specific dystonia, dopa responsive. The gait study demonstrated a highly repeatable abnormal muscle activation pattern that was present both with walking and running, but predominant with running. The consistently abnormal kinematics, kinetics, and dynamic EMG findings, coupled with a previous largely negative neurological evaluation and negative diagnostic EMG led to this diagnosis. The gait study was instrumental in the diagnosis of task specific dystonia. The patient received appropriate pharmaceutical intervention and is now demonstrating a return of normal running for limited distances.
Figure 1: Sagittal Plane hip kinematics with highly repeatable abnormal prolonged flexion in early stance and excessive hip flexion in swing. The solid lines represent the initial three trials, and the dotted lines represent the subsequent 3 trails,
Figure 2: Highly repeatable abnormal activation pattern of hip extensors. Error bars represent one standard deviation.
Left Gluteus Maximus
0
0.2
0.4
0.6
0.8
1
0 20 40 60 80 100
Normalized % Gait
Nor
mal
ized
Mus
cle
Act
ivat
ion
(%M
ax)
Left Hip Sagittal Motion
-20
0
20
40
60
80
0 20 40 60 80 100
% Gait Cycle
Deg
rees
116

Gait Analysis with Dynamic EMG for Surgical Planning for a Person With a Traumatic Brain Injury: A Case Study
Valerie J. Eberly, Lisa Haubert, Patricia Pate, Sara J. Mulroy, Vance C. Eberly, Jacquelin Perry
Pathokinesiology Laboratory, Rancho Los Amigos National Rehabilitation Center, Contact: [email protected]
Patient History The patient is a 31-year-old male with a history of traumatic brain injury secondary to gun shot wound in 1998 resulting in left side hemiplegia. He had participated in both in-patient (1998) and out-patient rehabilitation (2005, 2006) to address his spasticity and improve his walking function. He was able to ambulate with a forearm trough walker and a semi-rigid poly ankle-foot-orthosis (AFO) but used a power wheelchair as his primary means of mobility in the community. He had a history of falls and expressed great fear of falling which resulted in walking only in the home. He was referred to the Pathokinesiology Laboratory prior to possible surgery for his equinovarus and stiff legged gait. Clinical Data
Relevant clinical findings included limited passive range of motion into dorsiflexion with the knee extended (-10 degrees), eversion (0 degrees), and hip extension (-15 degrees). He had marked weakness in patterned movement in all muscles of the ankle and hip, and Moderate patterned strength in the knee extensors. Spasticity was present in his hip adductors and flexors, and knee extensors. Spasticity was not present in any of the muscles of the foot and ankle. Gait Data
During attempted barefoot walking, he was only able to ambulate for a few steps and required manual assistance that precluded motion analysis. Barefoot walking was limited due to severe inversion, ankle plantar flexion and toe clawing throughout. (Fig. 2) Quantitated motion analysis during walking with the AFO identified primary gait deviations including equinovarus, knee hyperextension in stance and absent knee flexion in swing. His ankle was in 10 degrees of plantar flexion at initial contact and reversed to 15 degrees of plantar flexion in single limb stance. He had reduced plantar flexion in preswing (10 degrees) indicating poor push-off and remained in 10 degrees plantar flexion throughout swing phase. Both his rearfoot and forefoot were in 10 degrees of inversion despite the AFO. At the knee he had 18 degrees of hyperextension in stance and flexed to only 20 degrees in swing. (Fig.1) His hip was excessively flexed in stance (5 degrees) and inadequately flexed in swing (18 degrees). His inadequate hip flexion posture related partially to excessive posterior pelvic tilt from mid swing through loading.
His free walking velocity in the AFO was moderately limited at 29 m/min (33% of normal) owing to reductions in both cadence (64% normal) and stride length (52% of normal). He was not able to increase his velocity for fast walking.
Dynamic EMG recording (normalized to % maximum muscle test) identified very high intensity continuous activity in both flexor hallucis longus (FHL, mn=45%) and flexor digitorum longus (FDL, mn=43%), continuous activity in anterior tibialis (mn=17%), and continuous, but sparse, activity in gastrocnemius. Soleus and both peroneous brevis and
117

longus displayed no activity during walking and posterior tibialis (PT) had very low level activity in late stance.
At the knee, vastus medialis and vastus lateralis displayed moderate intensity activity that was prolonged until early swing. Rectus femoris (RF) had low level, normally phased activity in pre and initial swing. The other hip flexors were inadequate with very low level activity in iliacus and no functionally significant activity in adductor longus. Of the hip extensors studied (gluteus maximus, semimembranosus, long head of bicps femoris), only biceps femoris displayed any activity. Treatment Decisions and Indications Anterior tibialis was the primary dynamic contributor to his inversion, gastrocnemius was the dynamic cause of the equinus and both long toe flexors produced the toe clawing. Prolonged activity of the vasti muscles combined with the equinus and plantar flexion contracture contributed to the knee hyperextension in stance and delayed knee flexion in swing. The dominant pattern at the hip was weakness with inadequate muscle activity for both hip flexors and extensors. Recommended surgeries were a split anterior tibialis tendon transfer (SPLATT), a mild tendoachilles lengthening, FDL and FHL releases, and PT checked in surgery and lengthened if tight. At the knee a rectus femoris release was not indicated. Providing a stable, plantigrade foot with dorsiflexion mobility would likely reduce his tendency for knee hyperextension in stance and facilitate some increase in knee flexion in swing.
The patient underwent the surgeries recommended above and returned 1½ years after surgery for a follow up gait study without EMG. He was a community ambulatory with an AFO and a single point cane.
Quantitated motion analysis during walking with the AFO identified less knee hyperextension in stance (10 degrees) and increased knee flexion in swing (35 degrees). (Fig.1) He was also able to walk barefoot. Quantitated motion analysis during walking barefoot showed decreased inversion throughout and improved dorsiflexion in single limb support (10 degrees) and swing (5 degrees). (Fig. 2) His free walking velocity in the AFO was improved to 53 m/min (64% of normal) and he was able to increase his velocity for a fast walking trial to 72 m/min (87% of normal).
Fig 2. Left ankle Pre-Op (above) and Post-Op (below)
Summary
% Gait Cycle Fig 1. Knee kinematics Pre-Op (left) and Post-Op (right).
The gait analysis study with EMG activity allowed recommendation of appropriate surgical intervention to improve gait to a safe and independent level.
118

Small Incisions, Large Results: Development of Genu Recurvatum Post-Percutaneous
Medial Hamstring Lengthening: A Case Study.
Dennis AN, Miller AL
Mary Free Bed Rehabilitation Hospital; Grand Rapids, MI USA
Patient History
The patient is a 4+ 3y year old boy with history of spastic paraparesis related to infantile
transverse myelitis which occurred at the age of 5 months. He ambulates with bilateral solid
AFO’s set in neutral and bilateral modified ski poles for distances up to 200’. He was referred
for gait analysis by his neurologist for treatment planning. At that time recommendations were
made by the gait analysis team at our institution for evaluation by a neurosurgeon for global
spasticity control. Botox injections to the triceps surae, hamstrings and hip adductors were
described as a possible alternative. On May 12, 2009, patient underwent bilateral percutaneous
gracilis and semitendinosus lengthening at another institution. Patient was then re-referred to our
institution by his neurologist for postoperative gait analysis 5 months following surgery.
Clinical Data
Relevant preoperative and postoperative clinical findings include:
Preoperative Spasticity
(Modified Ashworth)
Left Right
Hamstrings 2 2
Plantarflexors 2 2
Passive Range of Motion
(R1/R2)
Left Right
Popliteal Angle 85/40 100/40
Popliteal Angle/Neutral Pelvis 70/30 90/30
Knee Extension -3 0
Ankle DF-Knee Extended -25/15 -25/10
Ankle DF-Knee Flexed -5/30 -5/25
Postoperative Passive Range of Motion
(R1/R2)
Left Right
Popliteal Angle 40/15 40/15
Popliteal Angle/Neutral Pelvis 30/10 30/0
Knee Extension +20 +25
*All other clinical exam measures remain unchanged.
Gait Data
Pre and postoperative kinematic data was collected in barefoot at a self-selected speed using the
ViconMX
system. Preoperative kinematics identified the following bilateral gait deviations:
marked ankle equinus in stance and swing, increased knee flexion at initial contact with
moderate flexion of the knees throughout stance. Postoperative sagittal plane kinematics
119

% Gait Cycle % Gait Cycle
Lines represent Mean +/- 1 Standard Deviation
identified a marked increase in anterior pelvic tilt, double bump pelvic motion and bilateral ankle
equinus in stance and swing. While his postoperative kinematics did show increased knee
extension at initial contact bilaterally, he demonstrates marked genu recurvatum bilaterally,
maximum -16 and -28 degrees on the L and R respectively.
Treatment Decisions /Results
Pre-op triceps surae spasticity
contributed to the patient’s
bilateral ankle equinus.
Postoperative ankle kinematics
were similar because there was
no treatment that targeted the
triceps surae spasticity. This,
along with excessive hamstring
length, likely contributes to his
marked postoperative genu
recurvatum (R>L) due to an
excessive plantarflexion-knee
extension couple. In addition,
excessive hamstring length
likely caused the marked change
in anterior pelvic tilt. Bilateral
spasticity management of the
triceps surae is recommended.
In addition, knee cage extensions
may need to be added to his
current AFO’s to correct for his
postoperative hyperextension.
Increased forces across the knees
due to increased anterior pelvic
tilt postoperatively may warrant
the use of a posture-control
walker to improve upright
posture during ambulation.
Summary
Preoperative gait analysis allowed for identification of abnormal kinematics and for appropriate
treatment recommendations focusing on spasticity control and bracing in this young child
without fixed deformities/contractures. When alternative treatments were performed, the use of
gait analysis allowed for quantification of the impact of percutaneous hamstring lengthening 5
months postoperatively. While the patient’s family was enthusiastic regarding the procedure and
outcome due to the size of the incisions and quick postoperative recovery, the patient has
developed markedly abnormal pelvic, hip and knee kinematics during ambulation. This is likely
due to lengthening the hamstrings without addressing ankle plantarflexor spasticity.
120

������������� �������������������������������������������������������������������������� ��������������!���"�� ���������#��� ����$"%��������&��"�����
$�������'��������������������� ������������������������� ������������������������� �
���!�!�
�"���#�$�%&��#������������'�'���&��#��������� ��(�) ��$���*����"���#�$�%+�$ ���#���)�*$���'�'���,�##����%����-�#����������*��
������������� � �� $��) �#. ��##��� ��.��� �% %���#�$ �% *�$ ���# ���)�*$ /��� ��)�-)�# �)��)��(���� '�#%�)'����� 0�12 �3 '���� *)��) /� )�%�))�. �� ��� '����� ���#$ � #�-�)���)$ %�)�(�#��������� � �/���)���-�#�������*#������4&�/� *)� �)�-�.)���-�#�������/������(�)������) � �% �� *���#�5������ -�� ��## �%%�)�. %)�' ��� �'��� �� ��$ .�%���� �% )���� �**�)�6�)�'���� 4����� ��%�� .� �)� �� )���)� �� ��##���� ��������.���*������*�$ ���# ���)�*$4+�$ ���# ���)�*$ %�) �'*)�(�.'�(�'���� �. �� ��-�#��$�%��.7�%%����) 0���.��. %����) 2.�)���)�������'�����/� -������� �.�)�.*)��)���� %�) �'��������#$ � �(�#������4&�������.�)/��� *�$ ���# ���)�*$ �� �� �**�) �6�)�'���� � ��. �- �8����#$ �� ��.'��������#$ � �(�#������.���'����.*� �7*�$ ���#���)�*$%�)�� �**�)�6�)�'���� -�%�)��.������#*�$ ���#���)�*$4 ������������ � �*�$ ���#�6�'�������%��.��� /�)����).�������.� �).�)�%)�����**�)�6�)�'���� 4���)�/� �)�'�)�%���)�������..�)���'�(�'���4����� ��%�����*#�����*� �����/� �� ��-#�.�)��� ��� '�(�'��� �% �**�) �6�)�'���� 4 �# �� ���)� /� $'*��' #��� � �'������ ���.$ �)��)�� ��. �'��� �� �)$ .�%����4 ��)��� ��� ���) � �% �� *���#�5������ *������ �)��. ��)�*#���.�'��������. )���� �� #�%�4� � )� �#� �% ��. *�$ ���# �6�'�������� �� ��-#� �% ���*#����� *� ����� .�)��� ��� '�(�'��� )���(�)�. �(�) �-��� � '���� 4 �$'*��' #���� �'������ ���.$ �)��)����. �'��� �� �)$.�%���� ��##)�'����.�-��)�*#���.�'��������.)������#�%�/� ��/������ �)$4 ������������������ ���)�������'������%���*������/� ���#$5�.��)��7.�'�� ����##$/����'��������#$ � $ ��' 0���#� .�����# )��# ��'� $ ��'� ��3&52 ��. $���)���5�. /��� �/� %�)�� *#��%�)' 0������3&524������.(�#����$ � ��(��-$ ��� �'�%���� ��'����# )�������9�# � ��� ��'����# ����)�������%����'���� .�� �� ����**�)�6�)�'���� �� ������.(�#����$���-�.���)'���.4���'����# ����)������ �%������� .�� ��*)�6�'�# ��.� ��# �%�**�) �6�)�'���� � ��'���.-$�� ��(�) �.$��'�� �**)����/�)��(�#����.-$��#��#�������'*�����/������.���. ����� ��)8��4�"���)� � ��/ ��'����# ����)������ �% ����'���� .�� �� ��� �**�)�6�)�'���� ��������.(�#����$4��:3;�%��.�(�#����������%�)��)'�� �������� �����#�)(�#����$4����**�)�)'��.���.�# ���.�����-#�����#�)(�#����$%�##�/�.-$%�)��)'4���'������.��%����#�)(�#����$��.�����.%�)��)'7�**�)�)'7���.�).�)4!��������)���.���<3;�%� ��(�#�������%�)��)'��.�**�)�)'�� �������� �����#�)(�#����$4� *����##$��**�)�)�������#�)(�#����$�%� ��(�#�������� �)����)���������%��.�(�#������4�����'*���.)� �#� ��.�����.�����%�)���� ��(�#�����������**�)�)�������)�-�������������.(�#����$/� �)����) ���� �����%��.�(�#������4&�/�(�)� �## ��'�������)�-���. �� ������.(�#����$� ���*#��� �%%��� �� ��� ��. �(�#������4 �# �� ����� ��)8�� ��.�����. �)����) �'*)�(�'��� �
121

�������������� ������������������������ ������� ��������� ��� ���������
��������������� ������ ���������������������������������� ������������ �����������
�
������������� ����!����� ������� �������
�
������������� ����!����� ������� �������
" �" #" $" %" �"" �
"
�
�
&�����'��(���)*+
��
� ���
)�,�+
-���� �����./0�����
�����
" �" #" $" %" �"" �
"
�
�
&�����'��(���)*+
��
� ���
)�,�+
���� ���.10
���2���
3� !2���
" �" #" $" %" �"" �
"
�
�
&�����'��(���)*+
��
� ���
)�,�+
����� �.40
��
��2�
" �" #" $" %" �"" �
"
�
�
&�����'��(���)*+
-���� �����./0
�����
�����
" �" #" $" %" �"" �
"
�
�
&�����'��(���)*+
���� ���.10
���2���
3� !2���
" �" #" $" %" �"" �
"
�
�
&�����'��(���)*+
����� �.40
��
��2�
������������ ��� ������������� 5�����������������������������������6���2����������� ���������� ������2������������7��� 8� ��������������� ������������ ������������� 8����������������������� ����3��2������������������9�� 5��������� ����������3�������������#�� 5��������� ������������3�����������������:�� ;� �����������������! �����3����������������� ������������ ����������5� � ����� �� ��������� ������� ����������6 ������������ 3� ����� � �������2��� ��
���2�7��� 8� ���������������� ������������ ������������� 8� ����������������� �����3����������������� ���9�� 8� ��������������������� �����3��������������<�������=���������������������#�� ;� ������������������! �����3����������������� ������������ ����������������� (��� ��� �����������2 ��������������������������� ��� ����������2������ �� ����� �������!������ ����������������������� ���������3���5�-��������(���� ������� �������� ������ ���� �� !������� � ��� !����� � ��������� ��� �3<� ���� ��� ���� �������� � ������� ��2� �� ������ ���� ����� 8� ���� ���6 ���� ��� ��� ���� ���� ������������������ �� �������� ������ ���� �������� 3��2��� ������� ��� ������ 8� ��������6 �����3����� �� ����� ������� �� ��� ������� ������� ��� <���� ���=�� ���� ���� ��������������������������� �������������������� )�+��������>�������?���� ���� �9@.�""$0���A ��9%
122

PODIUM SESSION #5B
SIMULATION AND MODELING I.
(TECHNICAL FOCUS)
Moderated by: Scott Delp, Ph.D., Stanford University, Stanford, CA, USA
Ilse Jonkers, PhD, K.U. Leuven, Belgium
SIMULATION AND MODELING I. (TECHNICAL FOCUS) 1. Creation of a Pelvis Model when Landmarks are Missing Alexander Hooke 2. Reliability of Hip and Knee Curves in Clinical Gait Analysis Morgan Sangeux 3. Determining the Best Hip Joint Centre Localization Method for Normal Subjects
Compared to 3-D Ultrasound Morgan Sangeux 4. Joint Coordinates of the Knee: Bony Landmarks Compared to Functional Calibration
Jaap Harlaar 5. Energetics of Movement: Comparison of Two Different Models for the Estimation of
Muscular Energy Consumption Maria Cristina Bisi 6. How Robust is Human Gait to Muscle Weakness? Marjolein M. van der Krogt 7. Contributions of the Tibialis Anterior, Soleus, and Gastrocnemius to Lower Extremity
Joints in Presence of the Subtalar Inversion and Eversion during the Stance Phase Ruoli Wang
123

CREATION OF A PELVIS MODEL WHEN LANDMARKS ARE MISSING
Alexander W. Hooke, Krista A. Coleman Wood, Diane M. Serfling, and Kenton R. Kaufman Division of Orthopedic Research, Mayo Clinic, Rochester, MN, USA
E-mail: [email protected] Introduction An external hemipelvectomy is a rare procedure performed for tumor resection or trauma. This procedure removes half the pelvis and the ipsilateral leg. Advancements in surgical techniques and prosthetic design have increased the mobility of these patients, allowing some to walk using a prosthesis and assistive devices versus being bound to a wheelchair. This situation has lead to the referral of three ambulatory hemipelvectomy patients to our lab since 2007. While the clinical details on these patients varied, their lack of traditional bony landmarks used in gait analysis modeling required the development of novel set of techniques to measure their gait mechanics as accurately as possible. Clinical Significance Modeling techniques that can be used for patients who lack external land have been developed to accommodate the growing number of such patients regaining ambulation post surgery. Background A three-dimensional gait analysis was performed on three patients with external hemipelvectomies. Patient 1 was a female, age 28 years with an external hemipelvectomy and sacrectomy. A spinopelvic arthrodesis constructed from her removed proximal femur was inserted between the forth lumber vertebra and the right hemipelvis. She was referred to determine if walking without prothesis, only axillary crutches, would cause excessive torque on the spinopelvic arthrodesis. Patient 2 was a male, age 41 with an external hemipelvectomy. He was initially referred due to prosthetic socket pain during daily activities and referred a second time after upgrading from a uniaxial prosthetic hip joint to a multiaxial hip joint system. Patient 3 was a male, age 26 with an external hemipelvectomy. His referral was to investigate whether the multiaxial hip joint system could improve his gait. Methods For all patients, a 10 camera motion capture system (Motion Analysis Corporation, Santa Rosa, CA) and three force plate systems (2 Kistler [Kistler Corporation, Amherst, NY] and 1 AMTI [Advanced Mechanical Technology, Inc., Watertown, MA]) were used. All models were constructed using deviations of the Helen Hayes markerset1 and model and were created using Visual 3D (C-Motion, Inc., Germantown, MD). Placement and utilization of reflective markers to define the pelvis and locate the hip joint center differed between patients. Traditional boney landmarks on the pelvis were limited due to both their removal during the hemipelvectomy operation or being covered by the prosthetic socket. In the case of a landmark being obscured by the prosthesis, the landmark was palpated and its location translated onto equivalent location on the prosthesis. In the case a missing landmark due to bone removal, marker placement for the missing landmark was placed consistent with a contralateral one. Hip joint centers were identified using regression, functional joint using
124

method of Schwartz2, or direct calculation marker placement on the prosthesis. Descriptions of modified marker placement and subsequent segment definitions for the pelvis and hip are described in table 1. Patients completed various activities depending on the goals of their referrals ranging.
Patient 1 Patient 2 Patient 3 Intact Leg Prosthesis Intact Leg Prosthesis Intact Leg Prosthesis
Sacral markers on central vertrebral spinous process at height of right PSIS
markers on prosthetic bucket, indicating palpated sacral location
markers on prosthetic bucket, indicating palpated sacral location
Right ASIS markers on right ASIS markers on prosthetic bucket,
indicating palpated right ASIS markers on prosthetic bucket, indicating palpated right ASIS
Helen Hayes
Defined Pelvis Left
ASIS markers on left-anterior residual tissue
at height of right ASIS marker markers on prosthetic bucket, at height
of right ASIS marker markers on prosthetic bucket, at height
of right ASIS marker
Hip Joint Center
Helen Hayes Regression model using
Sacral and ASIS markers
None Functional joint center
Midpoint of markers placed
directly on mechanical joint
Functional joint center
Midpoint of markers placed
directly on mechanical joint
Hip Sagittal Motion
05
101520253035404550
0 20 40 60 80 100Normalized % Gait
Angl
e (d
eg)
Corrected
Uncorrected
Front Plane Model View
Table 1: Descriptions of reflective marker placements responsible for defining the Helen Hayes defined pelvis and hip joint center identification with a visualization of the model’s frontal plane. Results The model modification techniques presented here resulted in clinically significant changes in pelvic-gait mechanics when compared to a standard model with the hip joint center determined using the Helen Hayes regression. An example of this can be seen in hip sagittal motion where the new techniques result in approximately 9° more extension across the gait cycle for Patient 3 (Figure 1) and 7° for Patient 2. As the corrected values identify the hip joint directly, they can be considered a more accurate description of gait mechanics.
Figure 1: Hip sagittal motion of Patient 3. Comparison of the uncorrected regression-based and direct-prosthesis hip joint center identification techniques show a 9° difference.
Discussion The development of modeling techniques to accommodate the growing number of ambulatory external hemipelvectomy patients can provide clinicians with valuable information on the stresses applied to the repaired tissues, as in the case with patient 1, as well as on the mechanical relationships between a patient and their prosthetic. Such protheses are novel. By using the techniques described here, their performance can be objectively quantified leading to the development of a more optimal device. References: 1. Davis RB, Ounpuu S, Tyberski d, Gage JR. Human Movement Science. 1991;10:575-587. 2. Schwartz MH, Rozumalski A. Journal of Biomechanics. 2005;38:107-116.
125

Reliability of hip and knee curves in clinical gait analysis Morgan Sangeux, Richard Baker
Hugh Williamson Gait Laboratory, Melbourne, Australia The University of Melbourne, Australia
INTRODUCTION
In clinical gait analysis laboratories, patients often undergo several gait analyses in order to quantify the evolution of their gait pattern with time or before and after a surgical operation. The difference of the gait pattern observed should be compared to internal and external sources of variation affecting the reliability of the kinematics curve produced for a given subject. Internal source of variation is the intrinsic variability of a subject gait pattern during different trials. External sources of variation will come from how the subject’s skeleton has been modeled across sessions. It has been shown that one of the greatest sources of variation is the definition of the knee axis of flexion which also defines the medio-lateral axis of the femur [1] and therefore the rotation of the hips. In conventional clinical gait analysis this axis is defined by the use of a Knee Alignment Device (KAD) positioned by the therapist in charge of the session. Another way to define the knee axis is to use functional calibration movements and algorithms to define the knee axis. The purpose of this work was to assess the reliability of the kinematics curve derived from conventional or functional techniques at the hip and the knee in a clinical environment.
CLINICAL SIGNIFICANCE
Functional calibration methods to locate the knee joint axis are seducing since they could improve the reliability of the subject’s skeleton modeling and therefore the reliability of the kinematics curves at the hip and the knee joint.
METHODS
10 normal children without any pain or known previous injury participate to the study (6 �, 4 �). 3 complete gait analyses (sessions) were conducted on each child with the same physiotherapist and 1 session with another one. Each session consists in a static calibration acquisition, left and right knee calibration exercises and 5 gait trials. The two therapists were among the most experienced therapist in our lab with over ten years experience in marker placement. The conventional modeling method is following the Plug In Gait (PIG, VICON, UK) protocol and uses the KAD to locate the knee joint center and axis. The functional calibration methods tested in this work is the axis transformation technique, ATT, which has been compared to most of the methods available and presented as the best axis functional calibration method on simulated data, [2]. A marker set with 4 additional markers on the femur and 3 on the tibia was used as well as the traditional markers from the PIG protocol. To ensure a fair comparison we used the same skeletal tracking technique for both modeling methods: global optimization fitting [3]. Both hips and knees were modeled as ball and socket joints. The method was implemented in Matlab and interfaced with Nexus through PECS (VICON, UK). Deviations from the mean curve intra-session and inter-therapists were pooled across subjects following the method presented in [1]. The point by point standard deviations of the deviations curves were then computed.
126

RESULTS
Table 1 presents the left/right average for the full gait cycle of the point by point standard deviation intra-session and inter-therapists for the hip and knee. Flexion/extension angles were the most variable intra-session whereas Internal/External rotations were the most variable inter-therapist. As expected, the intra-session results were almost identical for one or the other model across joints and planes. The inter-therapist results were sensibly the same for the sagittal and coronal planes but PIG rotations was 1o more variable than functional calibration ones. The ratio between inter-therapist and intra-session was less than 2 in all cases for the functional calibration whereas it was 2.1 and 2.2 with PIG for the int/external rotation. Table 1: Left/Right average intra-session and inter-therapist standard deviation
��������� �� ��������������
����������������
��������������
�������������������
�������
��������������
���������������������
��������
�������� � !� " #� " $� ! �� � %� % "�
���������� � %� " #� " $� ! !� � %� ! ��
&������ ! %� " '� � !� % �� " #� ( ��
���������� ! %� " "� � !� % �� " #� ! )�
DISCUSSION
This study shows that functional calibration gives similar results to those attained by very experienced marker placers and reduces variability in the transverse plane at both the hip and the knee. The functional calibration methods are unlikely to be sensitive to the marker placers and may thus have an important role in assuring the quality of data particularly when captured by less experienced marker placers.
Further work is required to distinguish between the effects of different functional calibration procedures that have been suggested for the knee joint axis and to see whether these benefits extend to the patients seen routinely in gait analysis services.
REFERENCES[1] Schwartz et al., 2004, Gait & Posture, 196-203 [2] Ehrig, et al, 2007, Journal of Biomechanics, 2150-2157 [3] Lu et al., 1999, Journal of Bio.mechanics, 129-134
127

Determining the best hip joint centre localization method for normal subjects compared to 3-D ultrasound
Morgan Sangeux, Alana Peters, Richard Baker Hugh Williamson Gait Laboratory, Royal Children’s Hospital, Melbourne, Australia
The University of Melbourne, Australia
INTRODUCTION
In motion analysis, bone and joint positions are deduced from external marker positions. The conventional way to determine the position of the hip joint centers (HJC) in clinical gait analysis is to use regression equations that define the position of the hip from the patient anthropometric measurements and pelvis markers. A different approach uses functional calibration to locate joint centers in relation to the tracking markers. With this methodology, joint center positions should mainly depend on segments relative movement and not on absolute marker placement. Although the accuracy of such methods has been previously reported [1], recent developments made by the two approaches [3, 4 and 5] justify an update on their respective strength. This study assessed the HJC localization accuracy with reference to 3D Ultrasound (3-DUS) measures on a normal population implementing a state of the art of the methods available.
CLINICAL SIGNIFICANCE
HJC localization is one of the main modeling assumptions made in gait analysis. Finding the optimal method to make this assumption and knowing its accuracy for a given population is therefore of great importance.
METHODS
19 adults (age: 36, range: 12–70 years, BMI: 23 range: 18–32 kg/m2) participated in the study. Plug In Gait (PIG, VICON, UK) and Harrington et al. [3] were used as the conventional way to determine the HJC location from regression equations.
For the functional calibration the subjects were equipped with 4 markers on the pelvis (Left/Right and Anterior/Posterior Superior Iliac Spine) and 3 or 6 markers on each thigh. The calibration exercise consisted of 5, star shaped, movements: hip flexion, hip extension, hip abduction, hip flexion and abduction and hip extension and abduction.
Three types of functional calibration techniques were implemented: Sphere fitting, Transformation and Global calibration techniques. Two sphere fitting techniques, Geometrical [7] and Algebraic [8], and 2 transformation techniques, CTT and SCORE [6], were tested. For the sphere fitting and transformation techniques the segment movement was determined by the least squares mapping [6] of the skin mounted markers. The global calibration technique, called Kylie, is a new method provided by VICON to be evaluated in a clinical environment.
Prior to the motion analysis, all the subjects had a 3-DUS scan of both hips with the pelvis markers visible in order to define a pelvis coordinate system. A sphere, representing the femoral head was fitted on the 3-DUS scans and its location was recorded with reference to the pelvis coordinate system.
128

RESULTS
The results (Table 1) showed that the functional Geometrical sphere fitting technique had the best accuracy. The functional calibration methods performed better and were more reliable if implemented with 6 rather than 3 markers on the thigh. Of the conventional methods, PIG performed poorly but the Harrington et al. regression equations results were very close to the best functional calibration method. The proportion of the sample with error greater than a chosen threshold was also investigated. These indicated the functional sphere fitting and Harrington et al. methods were the best techniques, given only 5% of the sample (2 hips) obtained error greater than 30mm. The new global calibration method gave results similar to the functional transformation techniques. Table 1: Differences between 3-DUS and model determined 3-D HJC location
Descriptive Statistics in mm (3-DUS – Model HJC)
Proportion of sample with error > threshold (mm) in %
Model RMS Mean SD > 20 > 25 > 30 Conventional Plug in Gait 31 30 6.4 95 71 58
Harrington 17 16 6.4 13 5 5 Functional (3 Markers)
Geometrical 16 15 6.6 16 5 3 Algebraic 17 16 5.3 13 5 3 CTT 24 22 9 50 37 18 SCORE 22 20 8.6 45 29 11
Functional (6 markers)
Geometrical 15 15 4.5 11 3 0 Algebraic 19 17 6.7 42 11 3 CTT 20 19 7.3 47 13 8 SCORE 20 19 7.3 47 13 8 Kylie 22 20 9.8 47 34 16
DISCUSSION
On the normal population studied, the first functional calibration method described in the literature, Geometrical [7], gave better results than any of the newly developed algorithms. It also appeared to be best method overall, just surpassing the Harrington et al. conventional method. It must be acknowledged that these results are valid only on the normal population tested in this study. Results might not be the same for another population, a clinical one in particular.
CONCLUSION
The best method to localize the HJC was the Geometrical sphere fitting technique using 6 markers on the thigh. 15mm accuracy was reached and the error was never greater than 30mm.
REFERENCES [1] Leardini et al., 1999, Journal of Biomechanics, 99-103
[2] Hicks et al., 2005, Gait & Posture, 138-145
[3] Harrington et al., 2007,Journal of Biomechanics, 595-602
[4] Ehrig et al., 2006, Journal of Biomechanics, 2798-28
[5] Reinbolt et al., 2005, Journal of Biomechanics, 621-626
[6] Söderkvist et al., 1993, Journal of Biomechanics, 1473-1477
[7] Cappozzo et al., 1984, Human Movement Science, 27-50
[8] Chang et al., 2007, Journal of Biomechanics, 1392-1400
129

JOINT COORDINATES OF THE KNEE : BONY LANDMARKS
COMPARED TO FUNCTIONAL CALIBRATION
Jaap Harlaar and Dave Ligthart
Dept. of Rehabilitation Medicine, Research Institute MOVE,
VU University Medical Center, Amsterdam, The Netherlands
INTRODUCTION
The measurement of 3D kinematics in gait is widely used in clinical services and research. The
importance of precise and accurate methods is evident to conclude reliable and meaningful
information [1] . Variation in marker placement and skin artefacts are well known sources of
error [2]. It has been shown that the use of functional calibration methods, instead of anatomical
calibration, improves the reliability and the accuracy of knee kinematics [3,4,5,6]. These studies
have used a mechanical analog [3,4,6] or a virtual joint [5] to prove computational correctness or
superiority [3,5]. Its positive effect on gait kinematics was demonstrated by using either a single
subject [4] or markers attached on the knee epicondyles in the control condition [7]. Since this
location is very susceptible to skin artefacts, causes of a (possible) functionally erroneous
transepicondylar axis could not be separated from skin artefact effects. Minimisation of skin
artefact can be obtained using technical clusters and virtual markers after calibration [8]. So the
research question of this study is how functional calibration using proven computational accuracy
[5] is still superior - in terms of reliability and apparent accuracy - to the approach of using
virtual markers to identify the transepicondylar axis [8] in gait analysis. Additionally, loaded and
unloaded knee axis calibration were compared.
CLINICAL SIGNIFICANCE
Knee kinematics have been shown to be effected by anatomical calibration of the knee joint
coordinate system. Optimal and feasible calibration serves the quality of 3D kinematic gait
analysis in clinical practise and research.
METHODS
Ten healthy subjects(7 male, 3 female; 1.81±0.07m;74.7±8.2kg) aged between 18 and 70
participated in the study. All measurements took place in one session, in 3 parts. In the first part
functional calibration was performed in 3 ways (trials): (1) palpating the relevant bony
prominences (including medial and lateral epicondyles); (2) functional loaded calibration by
performing three consecutive free squat movements; and (3) performing three (unloaded)
flexion-extension movement of the knee by an examiner while the subject is sitting. The second
part consisted of ten walking trials in the gait lab. In the third part, all calibrations (see part one)
were repeated. An active stereophotogrammetry system (OptoTrak, Northern Digital Inc.) was
used to track the three-dimensional coordinates of the markers. A cluster of three markers was
attached to the right thigh and shank. To minimize the movement between the cluster and the
underlying bone the optimal location was chosen and attached with a wide elastic band [8]. An
axis of rotation was computed from all functional calibration trials, using the SARA algorithm
[5]. Anatomical coordinate systems for the thigh and the shank were computed using either the
transepicondylar axis or the functional axes from the two other calibration trials. Knee kinematics
were computed for all calibration trails, using one stride from each walking trial, averaged to a
mean over the ten trials. Joint angles for flexion, valgus and rotation were obtained using
130

standard decomposition. Descriptive statistics were used, including adaptations of the Coefficient
of Multiple Correlation (CMC) [9] .
RESULTS
The mean difference of repeated palpation of bony landmarks stayed within 1 cm, except for the
Trochanter Major (2 cm). The mean differences (between solid angles) of repeated knee angle
calibration was 4.3 deg. for palpation of the transepicondylar axis; 6.2 deg for the unloaded
functional axis and 2.3 deg. for the loaded functional calibration. The mean difference between
the loaded functional axis and transepicondylar axis was 14.3 deg.
Although the differences in reliability of knee kinematics per subject during were not very
apparent from visual inspection, CMC's for each subject comparing the first and the second
calibration trial showed some differences for the two methods (see table below). CMC's between
subjects demonstrated a more consistent knee kinematics over subjects for the functional
calibration. A few CMC's appeared as an imaginary number, which were omitted.
CMC values within subjects between subjects
Axis: Flexion Valgus Rotation Flexion Valgus Rotation
Transepicondylar 0.995
(± .007)
0.924
(± 0.103)
0.932
(± 0.079) 0.9485 0.1594 0.0980
Functional loaded 0.999
(± 0.000)
0.971
(± 0.026)
0.981
(± 0.043) 0.9631 0.4093 0.4157
DISCUSSION
Palpation errors showed an identical magnitude as in another study [2]. Since loaded functional
axis calibration showed the least repeatability error, this seems to be the preferred method.
Although CMCs are hard to interpret straightforward, it demonstrates that functional calibration
using a loaded knee flexion is superior to palpating the transepicondylar axis for that purpose.
This is in line with the visual impression of the graphs, where functional axis calibration showed
less variation (between calibration trials) and less crosstalk (between planes) . However the cross
talk was less compared to a comparable study [7]. So it seems that although loaded functional
knee axis calibration is superior, the use of technical clusters and virtual markers is second best,
and to be preferred in cases where loaded calibration is not possible, or as a back up. This should
be confirmed by future research.
REFERENCES 1: McGinley JL, ea Gait Posture 29 (2009) 2. Della Croce U, ea. MBEC 37 ( 1999)
3: MacWilliams BA. Gait Posture 28 (2008) 4: Schwartz MH & Rozumalski A. J Biomech. 38 (2005)
5: Ehrig RM ea J Biomech. 40 (2007) 6. Piazza, SJ & Cavanagh, PR, J Biomech. 33 (2000)
7: Schache AG ea Gait Posture 24 (2006) 8. Cappozzo, A. ea Clin.Biomech.10 (1995)
9. Kadaba, HKR, ea. J. of Orthop. Res. 7 (1989)
ACKNOWLEDGEMENT
Michael Schwartz and Adam Rozumalski are gratefully acknowledged for providing us the
SARA algorithm.
131

132

perform both the positive work (efficiency set at 25%) and the negative work (efficiency 120%). Leg muscular metabolic task cost was calculated according to [1]. Muscle-skeletal model: The same task was simulated using a musculoskeletal multilink model [2], which took experimental EMG and kinematics as inputs and gave muscle forces and muscle energetics as outputs (EMG driven model approach [5]). Model parameters were taken from literature [2], while maximal isometric muscle forces were optimized in order to match predicted joint moments with experimentally estimated ones [5]. One leg energy consumption was calculated summing the energy expended by each muscle.
ResultsPreliminary results regarding one leg of one subject are shown in Figure 1.
Fig. 1. Estimated energy consumption (W) for one representative subject in the four tests.
Model results on metabolic energy consumption were close to the values obtained through indirect calorimetry using both approaches.
DiscussionPreliminary results obtained in comparing model predictions with experimental data are promising for both the evaluated models. The differences in between the two models can be due to experimental data uncertainty: analysis of the results of all subjects can bring further information about these differences. Clearly the choice of using one or the other model should depend on the question the researcher would like to answer. The kinematic model is clearly more simple and easy to apply but it doesn’t give any information about joint loadings and muscle functioning. The muscle-skeletal model can add a lot of information regarding muscle activity and force production, but it needs a lot of work for implementing, using and validating it.
References [1] Laursen B. et al., Appl Ergonom.; 31:159-166, 2000 [2] Umberger B.R., et al. Comput. Methods. Biomech. Biomed. Engin., 6:99-111, 2003 [3] Cappozzo A. et al., Clin Biomech 10:171-178, 1995 [4] Weir JB. J Physiol. 109:1-9, 1949 [5] Buchanan T. et al. J Appl Biomech. 20:367-395, 2004
One leg energy consumption (W)
0
50
100
150
200
0 Level 490 spm
W Musle-skeletalmodel
Indirectcalorimetry
Kinematicmodel
Level 4100 spm
Level 790 spm
Level 7100 spm
One leg energy consumption (W)
0
50
100
150
200
0 Level 490 spm
W Musle-skeletalmodel
Indirectcalorimetry
Kinematicmodel
Level 4100 spm
Level 790 spm
Level 7100 spm
133

HOW ROBUST IS HUMAN GAIT TO MUSCLE WEAKNESS? Marjolein van der Krogt12, Scott Delp1, & Michael Schwartz2
1 Department of Bioengineering, Stanford University, Stanford, CA, USA 2 Gillette Children’s Specialty Healthcare, St. Paul, MN, USA
Introduction Muscle weakness is a common impairment in many patient populations. Weakness is assumed to limit functional performance and is related to functional gait measures in cerebral palsy and stroke [1,2]. However, the effects of strength training on gait have remained equivocal [2,3]. Underlying this limited success may be a lack of understanding of the effect of weakness on gait. Therefore, the purpose of this study was to investigate to what extent individual muscles can tolerate weakness before gait is impaired. We sought to answer the following questions: • Is the gait pattern most sensitive to weakness of specific muscles? • Can other muscles compensate when individual muscles get weaker? • What is the (additional) cost for these compensation strategies?
Clinical Significance Determining which weak muscles are most likely to limit gait may improve the ability to design successful strength training programs. Furthermore, knowing which muscles can tolerate weakness is important when considering treatments that may weaken muscles, such as botulinum toxin treatment or surgical muscle lengthening.
Methods We simulated normal gait for a group of healthy subjects using a generic musculoskeletal model [4] with progressively weaker muscles.
Gait kinematic and kinetic data for 6 healthy adolescent subjects walking at free speed were selected from an existing database [5]. Only older and bigger subjects were included, which limited the amount of model scaling necessary (age: 16±1y, all=15y; weight: 68±5kg, all=60kg; height: 175±9cm, all=160cm). One stride per subject was used for analysis.
We simulated the gait using OpenSim, by performing inverse kinematics, residual reduction, and computed muscle control (CMC) [4]. First, we used the standard gait model, scaled to the individual subject sizes. Next, we progressively weakened each major leg muscle group, one at the time, by adjusting maximum muscle force to 80, 60, 40, 20, and 0% of normal strength. We re-ran the CMC algorithm, computing optimal muscle control to track the normal gait kinematics and kinetics, but taking into account the weakened muscle properties.
For all weak simulations, we checked whether normal gait kinematics could still be tracked. If so, we then evaluated muscle forces, muscle activations, and the total muscle stress. Total muscle stress was quantified as the sum of all individual muscle stresses; similar to those used in the cost function in OpenSim.
Results Increasingly weak muscles generated less force, while other muscles compensated [Fig.1]. Normal gait was most affected by weakness of the plantar flexors (soleus and gastrocnemius together), followed by gluteus medius, iliopsoas, and hamstrings. Each of these muscles could be weakened to approximately 20% of normal strength, but at the cost of increased overall muscles stress [Fig.2]. Normal gait started to be impaired at lower strength values of these muscles. That is, kinematics deviated and/or the model’s reserve actuators had to generate
134

significant joint moments to compensate for muscle weakness. For all other muscles, compensations were possible even for total weakness (0% strength).
DiscussionWeakness of individual muscles can be compensated by activating the weak muscle more and/or by activating other muscles. With either strategy the total muscle stress goes up. Thisincreased load places a larger burden on muscles and may induce fatigue and/or damage,thereby weakening muscles even further.
Tolerance of weakness differs between muscles. Weakness in the gluteus maximus and quadriceps is better tolerated than weakness in the plantar flexors, gluteus medius, or iliopsoas. This is due to the fact that the latter muscles normally operate at a higher % of their maximal force and fewer compensation strategies are possible.
It should be noted that total muscle stress is not a direct measure of metabolic cost. Other more economically optimal compensation strategies may be used by subjects besides those predicted by the model. In pathological gait patterns, the effects of weakness may be different from those in normal gait. This hypothesis requires further study.
In conclusion, total muscle stress goes up with weakness, imposing a larger relative load on muscles. Weakness of plantar flexors, hip abductors, and hip flexors affect the gait most, and therefore these muscles may be the best to target with strength training programs. Normalgait appears most robust to weakness of hip and knee extensors.
References: [1] Ross SA & Engsberg JR 2007; Arch Phys Med Rehabil 88:1114-20.[2] Bohannon RW 2007; J Rehabil Med 39:14-20.[3] Mockford M & Caulton JM 2008; Pediatr Phys Ther. 20:318-33.[4] Delp et al. 2007; IEEE Trans Biomed Eng 54:1940-50.[5] Schwartz et al. 2008; J Biomech 41:1639-50.
Acknowledgements: Funding was provided by the Dutch Ter Meulen Fund and by the NIH.
Fig.2 Total muscles stress increases with weakness (80% to 20% of normal strength). Muscle stress is increased most with weakness of plantar flexors, and least with weakness of gluteus maximus and vasti.
0
50
100
150
200
250
300
% In
crea
se in
tota
l mus
cle
stre
ss
80%
60%
40%
20%Plan
tar f
lexo
rs
Glu
teus
med
ius
Iliop
soas
Ham
strin
gs
Sole
us
Tibi
alis
ant
erio
r
Gas
trocn
emiu
s
Rec
tus
fem
oris
Glu
teus
max
imus
Vast
i
0 50 1000
500
1000
% Gait cycle
Forc
e (N
)
0 50 1000
500
1000
% Gait cycle0 50 100
0
500
1000
% Gait cycle0 50 100
0
500
1000
% Gait cycle
100% GMED0% GMED
Fig.1 Effect of increasingly weak gluteus medius muscle (100% to 0% of normal strength ) on muscle forces generated over the gait cycle. A Force in gluteus medius decreases with weakness B-D other muscles compensate by increasing force.
Gluteusmedius
Gluteusminimus
Gluteusmaximus
Semimem-branosus
A B C D
135

Contributions of the tibialis anterior, soleus, and gastrocnemius to lower extremity joints in presence of the subtalar inversion and eversion during the stance phase Ruoli Wanga, Elena M. Gutierrez-Farewika,b
a Department of Mechanics, Royal Institute of Technology, SE-100 44 Stockholm, Sweden b Department of Women’s and Children’s Health, Karolinska Institutet, Stockholm, Sweden 1. Introduction
Understanding the causal relationship of individual muscle functions and walking pattern is complex since a muscle can accelerate joints it does not span, an effect that is not easily measurable experimentally. Generally, the tibialis anterior is considered as a powerful ankle dorsiflexor, and the gastrocnemius and soleus as major ankle plantarflexors. However, all three muscles span the subtalar joint, and in a neutral position, all have considerable inversion leverage arm. Although the subtalar joint’s range of motion is far less than the talocrural joint, it plays a significant role in gait. If normal subtalar motion is lost, the ankle has no relief from the super-imposed rotational forces from talar torsion, which may lead secondary degenerative arthritis [1]. The aim of the study is to determine the contributions of the tibialis anterior, gastrocnemius and soleus to accelerate the hip, knee, ankle, subtalar joints in the presence of excessive subtalar inversion and eversion.
2. Clinical significance
The identification of certain postures’ influence on individual muscle function is valuable for understanding compensation strategies in pathological gait and further helps clinician to improve the interpretations of clinical gait analysis.
3. Methods
The study used a generic 3D linkage model which was scaled to fit specific subjects, configured by experimental gait data and driven by 1N muscle force. The model consisted of 28 rigid segments, 30 joints and 88 lower extremity muscles. Foot-ground contact was modeled in four sub-phases: initial-contact to foot-flat (‘1st rocker’), foot-flat (‘2nd rocker’), heel lift to toe-flat (‘3rd rocker’) and toe-flat to toe-off (‘toe-off’). Three ground-foot joints were added in the model to serve as the constraint for the estimated center of pressure. Instead of the measured ground reaction force, the calculated joint reaction force acted to constrain these joints. Eight healthy adult controls (age: 32±13 yrs) were examined with a gait analysis system (Vicon MX40) while walking at a self-selected speed. The subtalar inversion and eversion was modeled by offsetting ±10˚ and ±20˚ from the normal subtalar angle while other configurations remain unaltered. The induced acceleration analysis (IAA) [1] were performed in SIMM Dynamic Pipeline (Musculograohics) and SD/FAST (Symbolic Dynamics).
4. Results An example of the 1st rocker IAA profile was shown in the Fig 1. In the unaltered gait, the
muscles generally act in an expected fashion. However, the gastrocnemius had potential to extend the knee. Remote effects which referred to the accelerations of joints not spanned by
136

the muscle can be seen on all three muscles, e.g. hip flexion potential by the tibialis anterior. Excessive subtalar eversion reduced the gastrocenmius’ potential to plantarflex the ankle, the soleus’ potential to extend the knee, and increased the tibialis anterior’s potential to flex the hip. Unexpectedly, excessive subtalar eversion reduced gastrocnemius and soleus’ potential to evert the subtalar joint.
Figure 1. Angular accelerations of the hip, knee, ankle and subtalar joints induced by the gastrocnemius, soleus and tibialis anterior, average over the 1st rocker. 5. Discussion
In the current study, we confirmed that muscles acted generally as their anatomical definitions in the normal gait [3]. Counterintuitive functions can be seen in the bi-articular muscle i.e. gastrocnemius. Excessive subtalar eversion was found to diminish the dorsi-, and plantarflexors’ function which may lead to a less plantarflexed ankle, less extended knee and more flex hip after initial contact. Moreover, we found that reduced plantarflexion potential generated by ankle plantarflexors could contribute to the reduced subtalar eversion potential, due to the inertial coupling effects. Future application to actual pathological gait study can improve the clinical application relevance.
6. References [1] Perry J. Slack Incorporated, 1992 [2] Zajac FE et al. Exercise Sport Sci Rev, 1989 187-230 [3] Kimmel SA et al. Gait Posture, 2006 23:211-221
137

138

PODIUM SESSION #6
SIMULATION AND MODELING II. (CLINICAL FOCUS)
Moderated by:
Richard Baker, Ph.D., C.Eng., C.Sci., University of Salford, Salford, UK Steve Piazza, Ph.D., Penn State University, University Park, PA, USA
SIMULATION AND MODELING II. (CLINICAL FOCUS) 1. Contributions from Muscles and Passive Dynamics to Swing Initiation at Different
Walking Speeds Melanie Fox 2. Determining the Best Hip Joint Centre Location Method for Patients Compared to 3-DUS
Alana Peters 3. Dynamic Loading Situation of the Knee and Hip Joint in Children with Varus
Malalignment Felix Stief 4. An Alternative Technical Marker Set to Improve Pelvis Tracking in Clinical Gait Analysis
Ugo Dimanico 5. Kinematic Compensation Strategies in Patients with Medial Compartment Knee
Osteoarthritis Michael Pohl 6. Age-Related Changes in Joint Kinematics for Deep Squats Pius Wong 7. Kinematic Gait Deviations, Step-to-Step Transitions, and Metabolic Power Demand in the
Gait of Subjects with Cerebral Palsy Michael H. Schwartz
139

140

flexion in swing. Knee flexion velocity at toe-off increased with walking speed (p < 0.05), from 182°/s at very slow speed to 380°/s at fast speed. This was achieved by an increase in average knee flexion acceleration during double support with increased walking speed (p < 0.01).
���������� ������knee flexion acceleration during double support was achieved primarily by hip flexor muscles on the preswing leg with assistance from biceps femoris short head and gravity (Fig. 1). The increase in knee flexion acceleration during double support with faster walking speed was primarily due to increased force generated by the hip flexors. The hip extensors and abductors on the pre-stance leg and velocity-related forces opposed knee flexion during double support.
Figure 1. Contributions from muscle groups on the preswing leg to knee flexion acceleration of the preswing knee during double support.
Discussion The study reveals how muscles and passive dynamics coordinate to produce knee flexion acceleration in double support, a key requirement for achieving sufficient knee flexion in swing. This provides a framework for determining the cause of an individual’s stiff-knee gait, enabling the potential for improved treatment outcomes.
References 1Liu M, et al., 2008 J Biomech 41, 3243-3252. 2Hof A, 1996 Gait Posture 4, 222-223. 3Liu M, et al., 2006 J Biomech 39, 2623-2630.
Acknowledgements May Liu, Michael Schwartz, and Chand John, and NIH -R01 HD046814
141

Determining the best hip joint centre localization method for normal subjects compared to 3-D ultrasound
Morgan Sangeux, Alana Peters, Richard Baker Hugh Williamson Gait Laboratory, Royal Children’s Hospital, Melbourne, Australia
The University of Melbourne, Australia
INTRODUCTION
In motion analysis, bone and joint positions are deduced from external marker positions. The conventional way to determine the position of the hip joint centers (HJC) in clinical gait analysis is to use regression equations that define the position of the hip from the patient anthropometric measurements and pelvis markers. A different approach uses functional calibration to locate joint centers in relation to the tracking markers. With this methodology, joint center positions should mainly depend on segments relative movement and not on absolute marker placement. Although the accuracy of such methods has been previously reported [1], recent developments made by the two approaches [3, 4 and 5] justify an update on their respective strength. This study assessed the HJC localization accuracy with reference to 3D Ultrasound (3-DUS) measures on a normal population implementing a state of the art of the methods available.
CLINICAL SIGNIFICANCE
HJC localization is one of the main modeling assumptions made in gait analysis. Finding the optimal method to make this assumption and knowing its accuracy for a given population is therefore of great importance.
METHODS
19 adults (age: 36, range: 12–70 years, BMI: 23 range: 18–32 kg/m2) participated in the study. Plug In Gait (PIG, VICON, UK) and Harrington et al. [3] were used as the conventional way to determine the HJC location from regression equations.
For the functional calibration the subjects were equipped with 4 markers on the pelvis (Left/Right and Anterior/Posterior Superior Iliac Spine) and 3 or 6 markers on each thigh. The calibration exercise consisted of 5, star shaped, movements: hip flexion, hip extension, hip abduction, hip flexion and abduction and hip extension and abduction.
Three types of functional calibration techniques were implemented: Sphere fitting, Transformation and Global calibration techniques. Two sphere fitting techniques, Geometrical [7] and Algebraic [8], and 2 transformation techniques, CTT and SCORE [6], were tested. For the sphere fitting and transformation techniques the segment movement was determined by the least squares mapping [6] of the skin mounted markers. The global calibration technique, called Kylie, is a new method provided by VICON to be evaluated in a clinical environment.
Prior to the motion analysis, all the subjects had a 3-DUS scan of both hips with the pelvis markers visible in order to define a pelvis coordinate system. A sphere, representing the femoral head was fitted on the 3-DUS scans and its location was recorded with reference to the pelvis coordinate system.
142

RESULTS
The results (Table 1) showed that the functional Geometrical sphere fitting technique had the best accuracy. The functional calibration methods performed better and were more reliable if implemented with 6 rather than 3 markers on the thigh. Of the conventional methods, PIG performed poorly but the Harrington et al. regression equations results were very close to the best functional calibration method. The proportion of the sample with error greater than a chosen threshold was also investigated. These indicated the functional sphere fitting and Harrington et al. methods were the best techniques, given only 5% of the sample (2 hips) obtained error greater than 30mm. The new global calibration method gave results similar to the functional transformation techniques. Table 1: Differences between 3-DUS and model determined 3-D HJC location
Descriptive Statistics in mm (3-DUS – Model HJC)
Proportion of sample with error > threshold (mm) in %
Model RMS Mean SD > 20 > 25 > 30 Conventional Plug in Gait 31 30 6.4 95 71 58
Harrington 17 16 6.4 13 5 5 Functional (3 Markers)
Geometrical 16 15 6.6 16 5 3 Algebraic 17 16 5.3 13 5 3 CTT 24 22 9 50 37 18 SCORE 22 20 8.6 45 29 11
Functional (6 markers)
Geometrical 15 15 4.5 11 3 0 Algebraic 19 17 6.7 42 11 3 CTT 20 19 7.3 47 13 8 SCORE 20 19 7.3 47 13 8 Kylie 22 20 9.8 47 34 16
DISCUSSION
On the normal population studied, the first functional calibration method described in the literature, Geometrical [7], gave better results than any of the newly developed algorithms. It also appeared to be best method overall, just surpassing the Harrington et al. conventional method. It must be acknowledged that these results are valid only on the normal population tested in this study. Results might not be the same for another population, a clinical one in particular.
CONCLUSION
The best method to localize the HJC was the Geometrical sphere fitting technique using 6 markers on the thigh. 15mm accuracy was reached and the error was never greater than 30mm.
REFERENCES [1] Leardini et al., 1999, Journal of Biomechanics, 99-103
[2] Hicks et al., 2005, Gait & Posture, 138-145
[3] Harrington et al., 2007,Journal of Biomechanics, 595-602
[4] Ehrig et al., 2006, Journal of Biomechanics, 2798-28
[5] Reinbolt et al., 2005, Journal of Biomechanics, 621-626
[6] Söderkvist et al., 1993, Journal of Biomechanics, 1473-1477
[7] Cappozzo et al., 1984, Human Movement Science, 27-50
[8] Chang et al., 2007, Journal of Biomechanics, 1392-1400
143

DYNAMIC LOADING SITUATION OF THE KNEE AND HIP JOINT IN CHILDRENWITH VARUS MALALIGNMENT
Felix Stief ¹, Harald Böhm ¹, Ansgar Schwirtz ² and Leonhard Döderlein ¹
¹ Orthopaedic Clinic for Children, Aschau i. Chiemgau, Germany² Technical University, Munich, Germany
INTRODUCTIONThe correction of leg malalignment usually depends on radiographic measurements observed statically without representing aspects of the loading situation at the knee during dynamic situations. The external knee adduction moment is an often-used predictor of knee joint loading [1] and the most common outcome measure reported from gait analysis in adults with knee osteoarthritis (OA). Moreover, it is a strong contributing factor to articular cartilage degeneration in the medial compartment of the knee joint [2, 3]. However, the dynamic loading situation at the knee in children with pathological varus alignment but no indication of knee OA has not been previously reported. Furthermore, there is a lack of research on gait data in the sagittal and transverse plane in these patients. Therefore, the purpose of this study was to determine knee and hip joint moments and angles in three planes obtained from quantitative gait analysis in children with varus malalignment and healthy control subjects.
CLINICAL SIGNIFICANCEThe three-dimensional gait analysis is a diagnostic tool aimed at receiving a better understanding of the relationship between loading and the onset or progression of articular cartilage degeneration in subjects with varus malalignment and it provides a means of detecting which patients develop compensatory mechanisms to reduce the dynamic loading on the medial knee compartment.
METHODSFourteen children with varus malalignment (8 female and 6 male) with a mean age, height, weight and walking speed of 15±2 years, 157±22 cm, 52±13 kg and 1.24±0.11 m/s, respectively gave informed consent to participate in this study. Fifteen healthy control subjects (9 female and 6 male) were selected to have a comparable age, height, weight and walking speed (15±4 years, 164±14 cm, 53±14 kg and 1.28±0.11 m/s, respectively). An 8-camera Vicon system (Oxford Metrics, UK) and 2 force plates (AMTI) were used to collect kinematic and kinetic data. A modified Helen Hayes marker set [4] was applied to determine joint centers. In addition, a medial femoral epicondyle, medial ankle and trochanter majormarker were placed on the subjects. Differences between the samples were tested for significance using student’s t-test with a significance level set at �� �� ����. Moreover, an external joint moment convention was used.
RESULTSChildren with varus malalignment exhibited a significantly lower maximum knee and hip extension moment in terminal stance compared with the control group (Fig. 1). As expected, the maximum knee adduction moment in the frontal plane was significantly higher in the
144

patient group. (Fig. 1). However, the maximum hip adduction moment did not show significant differences between the two groups. Regarding the transverse plane, the maximum knee internal rotation moment in terminal stance and the maximum hip external rotation moment in loading response and mid stance were significantly higher in children with varus malalignment (Fig. 1).
-1.00
-0.75
-0.50
-0.25
0.00
0.25
0.50
0.75
1.00
Mom
ent [
Nm
/kg]
Normal (N=15) Patient (N=14)
Knee Extension
Knee Internal Rotation
Hip Extension
Hip External Rotation
Knee Adduction
*
*
*
*
**
Figure 1: Average maximum knee and hip joint moments during stance. * indicates a significant difference at p<0.05 and ** a significant difference at p<0.001.
DISCUSSIONThe reduction of the knee and hip extension moments can be explained by the significantlyreduced knee and hip extension in the patient group. The significantly higher than normal peak knee adduction moment in children with varus malalignment suggests that these subjects are walking with increased knee joint loads on the medial compartment. Furthermore, abnormally increased knee internal rotation and hip external rotation moments were present in young subjects with varus malalignment. These findings imply that varus malalignment is not an isolated problem in the frontal plane. Load reducing mechanisms, such as an increasedexternal foot progression angle [5], were not found in this group of patients. This suggests that gait training and the correction of biomechanical variables in children with varus malalignment may reduce knee and hip joint loading in the frontal and transverse plane anddelay the progression of disorder.
REFERENCES[1] Andriacchi et al. (1994) Orthop Clin N Am, 25:395-403.[2] Sharma et al. (1998) Arthritis Rheum, 41:1233-40.[3] Miyazaki et al. (2002) Ann Rheum Dis, 61:617-22.[4] Davis et al. (1991) Hum Mov Sci, 10:575-87.[5] Guo et al. (2007) Gait & Posture, 26(3):436-41.
145

AN ALTERNATIVE TECHNICAL MARKER SET TO IMPROVE PELVIS TRACKING IN CLINICAL GAIT ANALYSIS U.Dimanico1, M.Caramella1, S.Pastorelli2, F.Leonardi3, A.Battezzato2, L.Gastaldi2 1 Laboratorio di analisi del cammino e del movimento, ASL CN1, Fossano, Italy 2 Department of Mechanics – Politecnico di Torino – Torino, Italy 3 SC Ortopedia e Traumatologia, Ospedale Savigliano, ASL CN1, Italy Introduction In human gait analysis pelvis is usually identified by an anatomical coordinate system: right and left anterior superior iliac spine (RASI, LASI), right and left posterior superior iliac spine, (RPSI, LPSI). A pelvis correct recognition is crucial in definition of the entire kinematic chain: the loss of one anterior superior iliac spine jeopardises the entire trial data. Usually in healthy subjects acquisition of pelvic markers is not critical, whereas in pathologic subjects different causes can determine occlusion of the anterior marker and hence nullify collected gait data. Clinical Significance Pathological gait patterns (i.e. hip flexion, fixed posture of the upper limb, overweight, scoliosis) may lead to frequent anterior pelvis markers occlusions, skin movement artefacts or contact with anterior iliac spines. Besides, frequently in clinical gait analysis the patient has reduced compliance, poor balance and increased fatigue. Considering the combination of these factors it is essential to perform few and reliable trials. In this contest the use of a technical marker set for the pelvis, instead of the traditional anatomical one can greatly help. The validity of alternative marker set for the pelvic segment has been proved by different authors [1, 2] for healthy or athletic subjects. The presented study is focused on a heterogeneous pathological group (post-stroke and orthopaedic patients) to better clarify usefulness of simpler technical marker set with a standard optoelectronic capture system. Methods In the proposed alternative marker set, two marker are still placed on right and left posterior superior iliac spine (RPSI, LPSI), while a third marker is placed with a wand of 10 cm in correspondence of S1. A preliminary static trial with LASI and RASI markers is necessary in order to evaluate the position and rotation matrix of the anterior superior iliac spines respect to the technical coordinate system comprised of S1, RPSI and LPSI makers. Gait analysis of 10 pathological adult patients was performed. Data were collected with the anatomical and technical marker sets simultaneously placed, in order to evaluate the clinical usefulness and reliability of the technical marker set. For each subject 10 trials with self-selected speed were registered using a 460 VICON motion capture system with 6 MCAM2 cameras operating at 100 Hz. Data were processed using VICON Workstation (Plug-in Gait Model) and Polygon. For the technical marker set it was necessary to pre-process data with an algorithm written using VICON BodyBuilder software, in order to calculate LASI and RASI virtual markers.
146

Results Trends of the pelvic angles were considered, as these are most affected by the pelvic marker configuration. Repeatability of results achieved with the two marker sets and the difference between values obtained with the technical set and the anatomical one are analysed. For each subject, considering all the trials, the standard deviation trend for each pelvic angle has been calculated for each instant of the stride; then the mean value of the standard deviation had been evaluated. Eventually, the mean value and the standard deviation of the standard deviations distribution was calculated across the subjects, taking into account the two maker sets. Results are reported in figure 1. In figure 2, accuracy, defined as the mean across the root-mean-square of the difference of the pelvic angles evaluated with the technical set and the respective angle achieved using the anatomic set, is depicted.
Fig. 1. Intra-subjects mean and standard
deviation of pelvic angles precision Fig. 2. Intra-subjects mean and standard
deviation of pelvic angles accuracy Discussion In authors clinical experience the employment of the technical marker set leads to results comparable with the one obtained with the traditional pelvic marker set, with in addition the advantage of simpler usage in pathological patients. In literature similar results can be found [3, 4], but they were obtained with normal subjects and often with rigid clusters of markers, not reliable in clinical applications. In conclusion, it can be stated that the positive results achieved with this study really reflect effective usefulness in clinical gait analyses. References [1] Fukuchi et al, Journal of Biomechanics (2009), doi:10.1016/j.jbiomech.2009.09.050. [2] Ramanujam A et al, 2009, 33th Annual Meeting of the American Society of Biomechanics. [3] Miana AN et al, Int J Sports Med. 2009; 30(11): 827-33. [4] Vogt L et al, Gait and Posture 18 (2003) 178-184.
147

KINEMATIC COMPENSATION STRATEGIES IN PATIENTS WITH MEDIAL COMPARTMENT KNEE OSTEOARTHRITIS
Michael B. Pohl, Victor Lun, Preston Wiley, Reed FerberFaculty of Kinesiology, University of Calgary, Calgary, AB, Canada
INTRODUCTION: Studies report that patients with knee osteoarthritis (KOA) have altered gait kinematics [1]. It has been postulated that these adaptations are made to reduce contact forces in the knee joint and avoid the pain associated with KOA [1]. Even when patients have bilateral KOA, they often experience greater pain in one limb compared to the other. However, the majority of KOA gait biomechanical studies do not report on the differences between limbs. It seems reasonable that gait kinematic adaptations used as a strategy to reduce pain while walking, will be influenced by the more symptomatic knee.
It has been suggested that medial compartment (MC KOA) patients attempt to reduce the forces across the medial compartment during gait [2]. Specifically, it has been postulated that KOA patients laterally flex the trunk towards the affected knee to reduce the knee external adduction moment, an indirect measure of medial joint contact force [2,3]. It is likely that by shifting their centre of mass (CM) towards the affected knee, KOA patients would decrease the frontal plane lever arm about the knee. However, no studies have determined whether bilateral MC KOA patients adopt this type of strategy relative to the more painful knee. Therefore, the purpose of the present study was to assess the between-limb kinematic adaptations in patients with MC KOA. We hypothesized that the more symptomatic limb would demonstrate altered lower extremity kinematics compared to the less symptomatic limb. Moreover, we hypothesized that the frontal plane distance between the CM and knee would be reduced in the more symptomatic compared to the less symptomatic limb.
CLINICAL SIGNIFICANCE: Little is know about how medial OA patients compensate to reduce painful loads across the medial compartment. This study incorporates a new kinematic method to assess how medial knee OA patients adapt their gait in response to symptoms.
METHODS: Fifteen subjects with radiographic knee OA in the medial compartment (age:61±11years, mass:79±12kg) were recruited from patients seen by two sports medicine physicians at the University of Calgary Sports Medicine Centre. All KOA patients complained of bilateral knee pain that was primarily localised in the medial compartment of each knee. Subjects were free from known OA in any other lower extremity joints and had not received any intra-articular injections or arthroscopic surgery within the last three months. Subjects were asked to identify which limb was the most symptomatic.
Figure 1. CP-KJC frontal plane distance
Retro-reflective markers were attached to anatomical locations on the pelvis and both limbs, and rigid shells containing tracking markers were secured to each segment. Three-dimensional kinematic data were captured using motion analysis while subjects walked on a treadmill at 1.1 m/s. All subjects were able to walk without a cane or assistive device and were familiar with treadmill walking. A total of ten strides were collected bilaterally for each subject. Sagittal and frontal plane kinematic variables of interest were calculated for the knee and hip at the temporal events of initial contact (IC) and
148

25% of stance. Values at 25% stance were calculated since this corresponds to the approximate time of the first knee adduction moment peak [2,3]. The centre of the pelvis (CP) was used to approximate the CM [4]. The frontal plane distance between the CP and the knee joint centre (CP-KJC) was also calculated at IC and 25% stance (Fig 1). All kinematic variables between the most and least symptomatic sides were compared using paired t-tests. RESULTS: A summary of the variables of interest for the most and least symptomatic limbs is presented in Table 1. The most symptomatic side exhibited significantly reduced knee flexion and hip flexion at IC. None of the other kinematic variables were statistically different between limbs. However, the frontal plane distance between the CP and knee joint centre was approximately 1cm lower in the most symptomatic limb, approaching significance. Table 1. Mean kinematic variables for both limbs. *Indicates significance at p < 0.05. Variable Most Least p-Value Cont. pelvic drop at IC -1.6 -1.8 0.838 Cont. pelvic drop at 25% stance 2.1 2.2 0.880 Knee flexion at IC 2.1 7.0 <0.001* Knee flexion at 25% stance 16.5 17.6 0.250 Hip flexion at IC 26.3 28.3 0.004* Hip flexion at 25% stance 17.6 17.4 0.815 Knee adduction at IC 0.6 0.9 0.782 Knee adduction at 25% stance 3.9 4.9 0.406 Hip adduction at IC 1.3 1.7 0.585 Hip adduction at 25% stance 5.7 5.9 0.718 CP – KJC distance at IC (cm) 7.6 8.2 0.082 CP – KJC distance at 25% stance (cm) 7.2 8.1 0.055 DISCUSSION: The current study demonstrated that patients with bilateral MC KOA adopt different kinematic patterns dependant on which limb is more symptomatic. Specifically, greater knee and hip flexion were observed at initial contact in the most symptomatic limb. Interestingly, both greater knee flexion [1] and hip flexion [5] at initial contact have been observed in patients with more severe MC KOA when compared to those with a less severe form of the disease. These changes may be a gait strategy to reduce the sagittal plane moment acting at the knee joint. In the frontal plane, the distance between the CP and knee joint centre in the more symptomatic side was reduced compared to the less symptomatic limb. This implied that the patients attempted to shift their centre of mass more towards the knee joint centre perhaps to reduce the frontal plane lever arm at the knee, thus reducing the knee external adduction moment. However, future studies including force plate and joint moment data are required to further understand this relationship. REFERENCES: [1] Mundermann et al., Arthritis Rheum 52:2835-44, 2005. [2] Hunt et al., Osteoarthr Cartilage 16:591-599, 2008. [3] Briem et al., J Orthop Res 27:78-83, 2008. [4] Eames et al., Hum Movement Sci 18:637-646, 1999. [5] Huang et al., Med Eng Phys 30:997-1003, 2008. ACKNOWLEDGEMENT: This work was supported by the Alberta Heritage Foundation for Medical Research.
149

Fig. 1: Squat Times vs. Age
0
2
4
6
8
10
20 40 60 80Age (y)
Sq
uat
tim
e (
s)
Fig. 2: %Cyc at Max Flexion
vs. Age
0
20
40
60
80
100
20 40 60 80Age (y)
%C
ycle
Age-related changes in joint kinematics for deep squats
Wong, P1; Leardini, A
2; Callewaert, B
3; Labey, L
1; Desloovere, K
3,4
1European Centre for Knee Research, Smith & Nephew, Leuven, Belgium;
2Movement
Analysis Laboratory, Istituto Ortopedico Rizzoli, Bologna, Italy; 3
University Hospital
Pellenberg, Katholieke Universiteit Leuven, Belgium; 4
Department of Rehabilitation
Sciences, Katholieke Universiteit Leuven, Belgium
Introduction: Gait analysis supports the clinical assessment of functional recovery after
orthopedic knee treatments. Joint kinematics during walking often should be compared to age-
matched control data to account for variance with age [1]. Kinematics in squatting also is
becoming of interest in these assessments, but the effect of age has not been thoroughly
investigated yet for this motor task. The present pilot study intended to quantify how squat
kinematics may change with age among typical subjects. It was hypothesized that older
subjects would show signs of reduced knee ranges of motion in the three anatomical planes.
Clinical Significance: This study provides a set of reference or control data for squat
kinematics. Squatting can be considered a more complex or demanding motor task than
walking and may thereby facilitate the discrimination of pathological and typical knee motion.
Methods: Twenty-two volunteers (age range: 21-76, BMI range: 17.7-30.8, 14 male, 8
female) with the ability to squat and with no history of musculoskeletal pathology were
recruited and gave informed consent to participate. Each subject performed three repeated
squats, while undergoing motion analysis by one well-trained physical therapist, using a 14-
camera optical tracking system and standard clinical marker set (Plug-in-Gait with Knee
Alignment Device, Vicon, Oxford, UK). Subjects were instructed to squat down from a
standing position as low as comfortably possible, then rise back up, with no use of the upper
limbs. Joint kinematics were recorded and time-normalized over a 100% cycle, defined
between times of full knee extension, from standing to standing. The correlations (Minitab,
State College, PA, USA) among a large set of resulting motion parameters were investigated,
including age, knee joint ranges of motion, kinematic consistency indices (coefficient of
multiple correlation, standard deviations [2]), and timing measures.
Results: Gender and
BMI were distributed
evenly across the age
range. No significant
correlations were found
for age versus height,
weight, BMI, or
kinematic consistency
indices (p>0.10).
However, age showed
significant positive
correlations with squat
time (Fig 1) and %cycle at maximum knee flexion (Fig 2), reflecting slower squat speeds,
y = 0.0581x + 1.5224 R
2 = 0.40, R = 0.64
p = 0.001
y = 0.3105x + 48.493 R
2 = 0.24, R = 0.49
p = 0.021
150

Knee in/external rotation
0
5
10
15
20
25
30
0 50 100
%Cyc
Ex
(-)
/ In
(+
)
Knee flexion-extension
0
50
100
150
0 50 100
%Cyc
Ext
(-)
/ F
lex (
+)
Knee ad/abduction
-20
-15
-10
-5
0
5
10
0 50 100
%Cyc
Ab
(-)
/ A
d (
+)
Hip in/external rotation
-20
-10
0
10
20
30
0 50 100%Cyc
Ex (
-) /
In
(+
)
Hip flexion-extension
0
20
40
60
80
100
120
140
0 50 100%Cyc
Ext
(-)
/ F
lex (
+)
Hip ad/abduction
-25
-20
-15
-10
-5
0
0 50 100%Cyc
Ab
(-)
/ A
d (
+)
Fig 3. Hip and knee kinematics curves for subjects >45 years old (solid line, n=12), and <45 years old (dashed line, n=10). Error bars are one standard deviation, plotted only on one side of each curve for clarity.
especially in descent. Significant negative correlations were found for age versus minimum
(R=-0.586, p=0.004) and maximum (R=-0.559, p=0.007) ab/adduction angles, with older
subjects showing more abduction. Average curves also were analyzed for two age groups:
“younger” (<45 years) and “older” (>45 years), with selected curves plotted (Fig 3). Older
subjects showed more thorax anterior tilt, more hip flexion, smaller and delayed maximal
knee flexion, more knee abduction, less knee internal rotation, and less ankle dorsiflexion.
Discussion: This study confirmed that some aspects of squat kinematics vary significantly
with age, and that the basic methodology employed here can successfully detect these age-
related trends. Older subjects clearly required more time to descend and ascend. They also
showed signs of less knee flexion and less knee internal rotation than younger subjects, based
on kinematic plots of two age groups, but a larger sample size is needed to reveal stronger
correlations. Older subjects showed more forward leaning, resulting in increased hip flexion
and thorax anterior tilt. These may be compensation for reduced knee flexion. Increased age
also was correlated with larger maximal knee abduction for these subjects. This could be a
real finding, or it could be due to systematic measurement errors; however, systematic error
seems unlikely, since subject characteristics related to measurement error were distributed
across the age range, including BMI and kinematic consistency measures. Future studies with
more subjects, and that analyze muscle activity, could investigate these differences further.
References
[1] Ko et al. J Biomechanics. 2009; [2] McGinley et al. Gait & Posture. 2009.
151

152

Discussion: Metabolic power in subjects with CP increased with both mechanical step-to-step transition power, and with kinematic gait deviations. The variance accounted for by step-to-step transition power (28%) suggests that in subjects with gait pathology, factors besides re-directing the center of mass may play a significant role in creating metabolic demand. Such factors include spasticity, which can lead to “workless” co-contraction, and knee-hyperflexion, which can cause deviations from an efficient pendulum gait. Indeed, with increasing gait pathology, a smaller portion of metabolic power is assignable to step-to-step transitions. On the other hand, gait deviations alone only accounted for 25% of the variance in speed-matched metabolic power, indicating that walking atypically is not a sufficient explanation for increased power demand during gait in subjects with CP.
It should be noted that experimental design shortcomings may have introduced variability into the results; for example, collecting asynchronous gait and metabolic data, and not enforcing matched speeds between these two testing modalities.
The specific mechanism for increased metabolic power demand in CP is not fully explained by either step-to-step transition or by kinematic gait deviations. However, each of these measures may be clinically useful as a means of assessing sources of gait inefficiency, and evaluating interventions aimed at lowering the metabolic cost of gait.
References [1] Donelan JM et al. (2002) J Exp Biol, 205:3717-27. [2] Schwartz MH et al. (2008) Gait Posture, 28:351-7. [3] Schwartz MH et al. (2006) Gait Posture, 24:14–22.
Figure 3. Metabolic power generally increases with gait deviations at a given transition power
Figure 1. Metabolic power increases with mechanical step-to-step transition power in subjects with CP.
Figure 2. Metabolic power as a percent of speed-matched control increases with gait deviations.
153

PODIUM SESSION #7
OUTCOMES II. (CLINICAL OUTCOMES ANALYSIS)
Moderated by: Mr. Tim Theologis, M.D., Nuffield Orthopaedic Hospital, Oxford, UK.
Tishya Wren, Ph.D., Childrens Hospital, Los Angeles, CA, USA
OUTCOMES II. (CLINICAL OUTCOMES ANALYSIS) 1. Real World Walking Behavior in Children Treated for Clubfoot Michael S. Orendurff 2. Short Term Outcome of Patients Undergoing a Selective Dorsal Rhizotomy: Comparison
to a Matched Control Group Michael H. Schwartz 3. How do Strength and Body Composition Relate to Function in Ambulatory Children with
Cerebral Palsy? Donna J. Oeffinger 4. Application of the Gillette Gait Index, Gait Deviation Index and Gait Profile Score to
Several Clinical Pediatric Populations Mark McMulkin 5. Evaluation of the Loss in Spinal Motion from Inclusion of a Single Mid-Lumbar Level in
Posterior Fusion for Adolescent Idiopathic Scoliosis Sylvia Ounpuu 6. Pre to Post-TKA Effects on Sit-to-Stand Kinetics and Function among Prehabbed and
Non-Prehabbed Patients Peter M. Quesada
154

REAL WORLD WALKING BEHAVIOR IN CHILDREN TREATED FOR CLUBFOOT
Michael S. Orendurff, Vy K. Do, Kelly Jeans, Lori A. Karol
Movement Science Laboratory, Texas Scottish Rite Hospital for Children, Dallas, TX, USA [email protected]
INTRODUCTION Treatment for congenital talpes equinovarus (clubfoot) can include surgical posteriomedial releases, Ponseti serial casting or French functional (physical therapy) methods. Several studies have evaluated the efficacy of these treatments using computerized gait analysis[1-3]. However, limited data exists on how technical metrics of joint function observed in the gait laboratory translate to performance on typical locomotor behavior in real world settings. CLINICAL SIGNIFICANCE Quantifying the real world locomotor behavior of children treated for clubfoot will improve our understanding of the relationship between ankle kinetics and functional performance. METHODS This initial cohort of seven children treated for club foot is part of a larger study of club foot treatment outcomes. The protocol was approved by the Institutional Review Board governing this institution. Parents signed informed consent to participate in the study and freely chose their child’s initial treatment option and ongoing care. For this group initial treatment was the French functional physical therapy method, and five children went on to have posteriomedial releases before their fourth birthday. All children are now over 10 years of age. The children each wore a StepWatch Activity Monitor (OrthoCare Innovations, Mountlake Terrace, Washington, USA) on their ankle for one week. The StepWatch was programmed to record all steps in each 10 second time interval. The data was processed using custom code that summed sequential steps. A frequency analysis divided sequential steps into ten categories: <10 steps in a row; 10 steps in a row; 20 steps in a row; 50 steps in a row; 100 steps in a row; 200 steps in a row; 300 steps in a row; 500 steps in a row; 1000 steps in a row and 2000+ steps in a row. The total number of daily steps was also recorded. ANOVAs and Scheffe’s tests post-hoc were utilized to compare sequential step distributions to age-matched typically developing children. RESULTS The ten year old children treated for clubfoot had significantly fewer total daily steps compared to the typically developing ten year old children (13,168 ± 5081 versus 15,204 ± 5681; p < 0.0158). The clubfoot treated children had no significant differences in the number of steps at 10, 20, 50 or 200 steps in a row (p >0.141) or at longer durations of 500 and 1000 steps in a row (p > 0.129). However they did have a significantly lower number of steps in walking bouts of <10 (0.0008), 100 steps in a row (p< 0.0179), 300 steps in a row (p< 0.0021) and 2000+ steps in a row (p < 0.0170).
155

*
Locomotor Behavior for Play:Exercise-level Activity
Walking for Transport:The Gait of Daily Living
Number of Steps in a Row
Num
ber o
f Ste
ps p< 0.0021
0
500
1000
1500
2000
2500
3000
3500
4000
4500
<10 10 20 50 100 200 300 500 1000 2000+
10 Yr Clubfoot10 Yr Norms *
p< 0.0170
*p< 0.0008
*p< 0.0179
*
Locomotor Behavior for Play:Exercise-level Activity
Walking for Transport:The Gait of Daily Living
Number of Steps in a Row
Num
ber o
f Ste
ps p< 0.0021
0
500
1000
1500
2000
2500
3000
3500
4000
4500
0
500
1000
1500
2000
2500
3000
3500
4000
4500
<10 10 20 50 100 200 300 500 1000 2000+<10 10 20 50 100 200 300 500 1000 2000+
10 Yr Clubfoot10 Yr Norms *
p< 0.0170
*p< 0.0008
*p< 0.0179
DISCUSSION Despite failing non-operative treatment and progressing to posteriomedial release surgery by about 3 years of age this cohort of children diagnosed with clubfoot show minimal disturbances to performance on typical walking durations by their 10th year of life. They appear able to achieve most of the walking bout durations needed for transport during their day: the short duration walking to move about at school, at home and in the community. Moderate walking durations, those with 100 to 300 steps in a row generally occur just a few times each day and represent walking from classroom to auto or bus transport. This may be the only walking for transport that elicits a feeling of weakness or pain for these children in their affected foot or ankle. Although there were minor limitations on some moderate length walking bouts, these children treated for club foot appear able to participate fully in some long duration locomotor behaviors (500-1000 steps in a row) generally associated with play behavior during recess, physical education classes, playground games and after school activities. However, the number of steps in the longest duration bouts of 2000+ steps in a row averaged less than half the value of age-matched norms. These data suggest that these children treated for clubfoot are active enough to receive adequate stimulus for general musculoskeletal development in all but the longest bouts. The treated children may not be as fast at running as their peers due to their reduced ankle power[1]. The observed decreased in long duration locomotor bouts suggests that children treated for clubfoot may not be able to participate fully in exercise-level activity with their peers into adolescence. REFERENCES 1. Karol, L.A., et al, J Pediatr Orthop, 1997. 17(6): p. 790-5. 2. Karol, L.A., et al, J Pediatr Orthop, 2005. 25(2): p. 236-40. 3. Karol, L.A., et al, Clin Orthop Relat Res, 2009. 467(5):1206-13
156

Short Term Outcome of Patients Undergoing a Selective Dorsal Rhizotomy: Comparison to a Matched Control Group
Schwartz MH1,2, Trost JP1, Novacheck TF1, Dunn ME1, and Krach LE1,2 1 Gillette Children’s Specialty Healthcare, St. Paul, USA, 2 University of Minnesota, Minneapolis, USA
Introduction: Selective dorsal rhizotomy (SDR) is used to improve gait and functional ability of children with cerebral palsy. Critics of SDR state weakness and the possibility of developing crouch as primary concerns after surgery. They also suggest that due to their relatively high-functioning status, SDR patients would do well no matter what interventions they received. Despite these critiques, there are only a few studies comparing results of SDR to alternative procedures [1-3].
Clinical Significance: The purpose of this case-control design study was to compare the outcomes of SDR to alternative treatments on a matched set of patients. Understanding short-term outcome differences will help clinicians and families make informed surgical decisions.
Methods: Two groups of subjects (SDR and CONTROL) were identified from the existing database at the Gillette Children’s Specialty Healthcare Center for Gait and Motion Analysis. Subjects in both groups underwent a complete gait analysis between 4-8 years of age (initial), and another within 9-36 months (follow-up). At the time of the initial visit, subjects in both groups met the clinical criteria for an SDR related to etiology, selective motor control, spasticity, and strength described by Trost et al. [4]. Subjects in the SDR group received only an SDR between the initial and follow-up visit, while those in the CONTROL group did not. Gait, clinical exam, and functional data were extracted for subjects in the two groups.
Results: Subject Characteristics: The subjects were matched in terms of gender, age, and GMFCS level [Table 1]. Both groups had a variety of treatments prior to baseline evaluation.
Table 1. Subject characteristics
Group N Female Male GMFCS Initial Age Follow-up
Age Follow-up
time
SDR 61 38% (23) 62% (38) 2.3 (.58) 5.7 (1.1) 7.3 (1.1) 1.6 (0.4) Control 21 38% ( 8) 62% (13) 2.4 (.78) 5.6 (1.0) 7.2 (1.1) 1.5 (0.5)
Key: mean (standard deviation), all times in years.
Treatment: Prior treatment was well matched, with a slight bias towards Botox in the SDR group, and towards physical therapy in the CONTROL group. Between initial and follow-up exams CONTROL subjects underwent the following treatments: None (0%), Botox only (10%), SEMLS only (34%), SEMLS+Botox (38%), Therapy only (18%).
Speed: Dimensionless speed remained constant at 0.37 (SDR) and 0.38 (CONTROL).
O2: Net nondimensional oxygen cost as a percentage of speed matched control dropped in the SDR group from a mean of 342% (sd = 141%) to 306% (133%), and remained essentially constant in the CONTROL group at 308% (127%) initially and 306% (92%) on follow-up.
FAQ: Functional walking ability (FAQ) improved 0.6 levels for the SDR group from 7.4 (2.1) to 8.0 (2.0), and 0.5 levels for the CONTROL group from 7.4 (2.1) to 7.9 (1.3).
157

Gait Data: Gait pathology as measured by the GDI improved 5 points in the SDR group from 67 (9.0) to 72 (9.4), and 3 points in the CONTROL group from 68 (10.1) to 71 (13.4). On follow-up, there was a slight increase in anterior pelvic tilt (19º�21º) in the SDR group, though pelvic tilt range-of-motion decreased slightly. Knee extension improved in the SDR group at initial contact (39º�26º) and on average throughout stance-phase (26º�17º), while the CONTROL group knee extension deteriorated slightly. The SDR group was in significantly more equinus at initial visit. Both groups, however, showed improved ankle kinematics; though the amount of improvement was slightly greater in the SDR group (8º vs. 5º).
Discussion: The results demonstrate that that the two groups were well matched on both clinical and gait data. This strongly suggests that retrospective controls can be identified and compared to patients who receive an SDR.
Significant improvements were seen in knee extension of the SDR group, but not in the CONTROL group. On the other hand, the SDR group showed an increased anterior pelvic tilt, while decreasing pelvic tilt range of motion. Both groups maintained their walking speed and improved overall walking ability, but only the SDR group reduced their energetic cost of walking.
Short term outcomes for both groups were positive; with some slight indications of advantages for SDR in knee and ankle function, and in the metabolic cost of gait. The
long term effects of spasticity reduction via SDR on clinical and gait pathology, and on rates and types of subsequent interventions cannot be evaluated from these short-term data. This design, however, offers the prospect of examining long-term outcomes systematically.
References: 1. Steinbock P, et al. (1997) Dev Med Child Neurol, 39:178-84. 2. Buckon C, et al. (2004) Arch Phys Med Rehabil, 85: 457-65. 3. Schwartz MH, et al. (2004) J Pediatr Orthop, 24: 45-53. 4. Trost JP, et al. (2008) Dev Med Child Neurol, 50: 765-71.
Figure 1. Initial (- - -) and follow-up ( ) sagittal plane gait kinematics for the SDR and CONTROL groups.
158

How do Strength and Body Composition Relate to Function in Ambulatory Children with
Cerebral Palsy?
Donna Oeffinger1, PhD; George Gorton
2, BS; Anita Bagley
3, PhD, MPH; Sahar Hassani
4,
MS; Diane Nicholson5, PhD PT; Sylvia Ounpuu
6, MS; Mark Abel
7, MD; Mark Romness
7,
MD and Chester Tylkowski1, MD
Shriners Hospitals for Children, 1Lexington;
2Springfield,
3N.California;
4Chicago;
5Salt Lake
City; 6Connecticut Children’s Hospital; and
7University of Virginia
Introduction: Children with cerebral palsy (CP) frequently have decreased strength compared
to their peers. Factors contributing to decreased strength include low level of physical activity,
decreased central input to the muscle due to a pyramidal tract insult, changes in the elastic
properties of the muscles themselves, and spasticity. There is increasing evidence that
strength plays a vital role in function of the child with CP. Lower extremity strength has been
related to freely-selected walking velocity and Gross Motor Function Measure (GMFM)
scores in children and adolescents with CP1,2
. While strength has been identified as a potential
contributing factor to function, how body composition affects function of individuals with CP
has not been thoroughly investigated. The study purpose was to identify if lower extremity
strength and body composition are related to function in ambulatory children and adolescents
with CP.
Clinical Significance: If strength and/or body composition are associated with function these
findings can lead to altered intervention strategies focusing on strength training and
modifications to body composition, ultimately leading to improved function for children with
CP.
Methods: Data were collected from a convenience sample of children with CP from seven
pediatric orthopedic hospitals. 180 children with diplegic CP (119 M, 61 F; GMFCS level I=
42, II= 90, III= 48) and 77 children (28 M, 49 F; GMFCS Level I= 61, II=16) with hemiplegic
CP participated. Mean age of participants was 12.7 years (range 8-19). Each study assessment
included Body Function & Structure measures of: height, weight, self report of Tanner
pubertal stage, body composition measured using Body Mass Index (BMI) and percent body
fat and lean mass, and strength normalized to body weight. Activity and participation
measures included: temporal spatial gait parameters, the Gillette Gait Index (GGI), Gross
Motor Function Measure (GMFM-66), Pediatric Outcomes Data Collection Instrument
(PODCI), One Minute Walk Test (1MWT), and Timed Up and Go (TUG). Body Fat was
measured using a Body Stat Quadscan Bioelectrical Impedance device. Strength was
measured using a standardized protocol and a JTech Commander II Hand Held Dynamometer.
Eight lower extremity muscles were measured for each limb and the maximum strength value
of three efforts was used to calculate the strength scores. Strength scores were assessed by
limb and as total strength averaged across both limbs and normalized to the participant’s
weight. Body fat was measured on both sides and averaged to obtain the mean body fat.
159

Pearson Correlations were calculated for comparisons between strength normalized to body
weight, percent body fat, BMI and the measures of activity and participation. Those
correlations that are statistically significant (p < 0.01) and R ≥ 0.3 are reported separately for
participants with hemiplegia and those with diplegia. Correlations between strength and body
composition measures and age were also analyzed.
Results: For those with hemiplegia, normalized strength was moderately correlated to total
meters walked in 1MWT and to BMI (Table 1). For those with diplegia, normalized strength
was moderately correlated with BMI, GMFM-66 and Walking speed (Table 1). For all other
measures, for both groups, weak correlations (R2 < 0.30) were seen. Similarly, only weak
correlations were found for age at time of the study with strength and body fat measurements.
Significant Strength Correlations with Activity & Participation Measures
HEMIPLEGIA
Strength
Normalized RT
Strength
Normalized LT
Total Strength
Normalized
Total Meters-1MWT R = 0.35(**) R = 0.30(**) R = 0.34(**)
BMI R = -0.41(**) R = -0.39(**) R = -0.4(**)
DIPLEGIA
BMI R = -0.36(**) R = -0.36(**) R = -0.36(**)
GMFM66 R = 0.48(**) R = 0.48(**) R = 0.48(**)
Walking Speed Mean R = 0.34(**) R = 0.34(**) R = 0.35(**)
Table 1 (**p < 0.01)
Discussion: While percent body fat did not correlate with strength, BMI did for both those
with hemiplegia and diplegia. The negative relationship indicates that as BMI increases,
normalized strength decreases. The relationships seen for strength with GMFM and Walking
speed in children with diplegia are consistent with what has been previously reported.
Strength was not correlated with function as measured using the 1MWT, Timed-up-and-go,
PODCI, or the GGI for those with diplegia. For those with hemiplegia, strength was most
related to endurance as measured with the 1MWT. The lack of correlation with other
functional measures for those with hemiplegia may in part be due to the high level of function
achieved by this group with little functional variability seen.
References 1Damiano, D.L. et al. Arch Phys Med Rehabil, 1998. 79(2): p. 119-25.
2Kramer, J. et al,. Pediatr Phys Ther, 1994. 6: p. 3-8.
Acknowledgements
Funding for this study was provided by Shriners Hospital for Children research grant #9158.
160

Application of the Gillette Gait Index, Gait Deviation Index and Gait Profile Score to Several Clinical Pediatric Populations Mark L. McMulkin1, PhD, and Bruce A. MacWilliams2, PhD Shriners Hospitals for Children, Spokane, WA, USA (1) and Salt Lake City, UT, USA (2)
Introduction The Gillette Gait Index (GGI)1 has gained widespread acceptance to quantify overall kinematic outcomes of patient populations. The Gait Deviation Index (GDI)2 and Gait Profile Score (GPS)3 are two closely related indices that have been proposed to address shortcomings of the GGI. The advantages of the GDI are that it is transformed and scaled such that the average score for a typically developed group is 100 with a standard deviation of 10. It is normally distributed allowing parametric statistical testing. The advantages of the GPS are the use of degrees as the unit of measure, ability to decompose scores by joint and plane, and adaptability to new models or altered indices (e.g. adding kinetics) without the need for a large control database3. However, the application and comparison of the three indices for a number of diagnoses with gait pathologies has not been reported. The purpose of this study is to compare the GGI, GDI, and GPS for populations with common gait pathologies including a range of severity to determine the sensitivity and interpretation of these indices.
Clinical Significance To assess outcomes of clinical populations using a gait index, it is important to understand which index is most sensitive. It is also important to understand the information provided by each index and if results match clinical impressions.
Subjects/Methods Seven populations of subjects with gait pathologies from current or previous IRB approved research studies were identified to represent a range of severity. Five of the populations had surgery with gait studies compared pre- and post-operatively: 1) Cerebral Palsy (CP) with multi-level surgery (n=52), 2) idiopathic toe walkers with gastrocnemius recession or TAL surgery4 (n=28), 3) idiopathic excessive tibial torsion (TT) with derotational tibial osteotomies5 (n=25), 4) severe Slipped Capital Femoral Epiphysis (SCFE) treated with a flexion-rotation osteotomy (n=8), 5) Genu Valgum (GV) treated with staples6 (n=31). Two additional groups were compared to controls collected as part of the study: 6) 5 year olds previously treated for clubfeet (n=29) compared to controls (n=22), 7) young adults with hip impingement (HI, n=11) compared to age matched controls (n=11). The GGI, GDI, GPS, and individual gait variable scores (GVS) for the GPS were calculated for each subject in each group. Scores on the GGI, GPS, and GVS from pre- to post-operative (or to control) were compared using the non-parametric Wilcoxon signed ranks test (or Mann-Whitney Test if compared to controls). The pre to post-operative GDI was compared using parametric t-tests.
Results For the CP, ITW, and TT groups all three indices improved pre to post-op (Table 1). For the SCFE group the GDI and GPS improved significantly while the GGI did not change. The clubfoot group was close to significantly different from a control group (p<0.07) for the GDI and GPS while the GGI was not (p = 0.30). For the GV and HI groups there were no significant differences from any of the indices. For the CP, ITW, TT, GV, SCFE and Clubfoot groups there were several GVS that were significantly different.
161

TABLE 1. Gillette Gait Index (GGI), Gait Deviation Index (GDI), Gait Profile Score (GPS) indices for 7 diagnoses (CP = Cerebral Palsy, ITW = Idiopathic Toe Walkers, TT = Tibial Torsion, SCFE = Slipped Capital Femoral Epiphysis, GV = Genu Valgum, HI = Hip Impingement). GDI scores are means; all other scores are medians. *Significant difference pre to postop (or vs. control), p<0.05. † p=0.05 to 0.07. Composite Indices Gait Variable Scores (GVS) – 9 kinematic variables that make up GPS
Pelvis Hip Knee Ankle Foot Study Group GGI GDI GPS Tilt Obliq Rot Flex Ab/Ad Rot Flex DF/PF Prog
CP- Pre 327 74.8 13.5 8.2 3.6 6.1 7.1 4.5 19.4 13.9 8.7 22.7 CP- Post 196* 87.0* 8.9* 7.5 3.4 7.2 7.0 4.5 8.3* 12.0* 7.1* 10.8*
ITW- Pre 133 87.3 8.5 5.1 2.6 3.2 4.3 3.3 10.8 7.4 12.7 6.8 ITW- Post 43* 97.2* 6.1* 2.9* 2.2 3.0 4.5 3.1 6.3 5.2 5.4* 6.4
TT- Pre 79 82.4 10.5 5.7 2.1 4.3 8.9 4.0 7.7 6.0 4.3 24.9 TT- Post 45* 95.3* 6.7* 6.0 1.8* 4.0 6.6* 3.0* 8.0 5.6 4.5* 8.7*
SCFE- Pre 83 76.0 13.0 3.3 3.3 4.2 5.3 4.4 28.7 8.7 5.0 18.0 SCFE- Post 68 94.9* 6.6* 3.3 3.7 3.3 7.3 5.1 8.0* 6.7 5.2 4.8*
GV- Pre 25 88.5 7.7 3.5 2.0 4.7 5.5 4.7 12.0 9.1 5.4 9.4 GV- Post 23 90.1 7.7 5.7 2.0 3.7* 6.6 3.2* 8.5* 9.8 5.1 8.4
Clubfoot 41 94.5 7.3 4.4 1.6 3.8 4.5 2.7 12.1 5.8 3.5 9.6 Control 37 98.6† 6.4† 4.3 1.8 3.2 6.2 3.2 10.5 5.3 3.3 5.4*
HI 18 99.2 6.3 5.3 1.7 2.6 5.5 2.9 8.0 4.7 3.7 5.5 Control 19 97.8 6.0 3.0 1.8 2.9 6.4 3.1 8.3 6.4† 4.7 5.1
Discussion The GDI and GPS gait indices could be more sensitive to treatment than the GGI. Two groups (SCFE, Clubfoot) showed no differences using the GGI, but significant or nearly significant differences were exhibited by both GDI and GPS. Clinically the GDI is easy to interpret. For example the CP, ITW, TT and SCFE groups prior to treatment were 1.5 to 2.5 SD from the mean of typical gait with the latter three groups improving to within 1 SD of typical. It is not surprising that the GV group had no change on any composite index, since none incorporate frontal plane knee kinematics or kinetics; however, GVS detected significant changes in hip abduction which was a noted secondary improvement6. GVS also largely matched clinical expectations such as ankle dorsiflexion improving for the ITW and foot progression improving for the tibial torsion and SCFE (along with hip rotation) groups. Other score improvements might lead to further understanding such as any possible difference between the clubfoot and control groups being due to foot progression. Also, the ITW group improved significantly in pelvic tilt in addition to ankle dorsiflexion. The comparative lack of sensitivity of the GGI and nonparametric characteristics indicate its use should be discontinued. Selection of the GDI or GPS depend on the relative advantages of each. The GDI is intuitive while the GPS allows analysis of individual kinematic components.
References: 1. Schutte LM et al. (2000) Gait Posture, 11:25-31. 2. Schwartz MH et al. (2008) Gait Posture, 28:351-7. 3. Baker R et al. (2009) Gait and Posture, 30:265-9. 4. McMulkin ML et al. (2006) J Pediatr Orthop, 26:606-11. 5. MacWilliams B et al. (2009) GCMAS Proceedings: 52-3. 6. Stevens PM et al. (2004) J Pediatr Orthop, 24:70-4.
162

EVALUATION OF THE LOSS IN SPINAL MOTION FROM INCLUSION OF A SINGLE MID-LUMBAR LEVEL IN POSTERIOR FUSION FOR
ADOLESCENT IDIOPATHIC SCOLIOSIS
Mark Lee, MD, Sylvia Õunpuu, MSc, Matthew Solomito, BSME and Jeffery Thomson, MD
Center for Motion Analysis, CT Children’s Medical Center, Farmington, CT, USA E-mail: [email protected] Web: www.ccmckids.org
Introduction Adolescent idiopathic scoliosis (AIS) is commonly treated with instrumented posterior spinal fusion. Long-term outcomes data have suggested that extension of the fusion construct into the low lumbar spine predisposes the patient to accelerated radiographic degeneration of the distal unfused levels and greater incidence of back pain1,2. It has been proposed that increased and atypical compensatory motions of the unfused segments result in degeneration. Little objective data is available to describe the impact of spinal motion when adding a single lumbar segment to a fusion construct. Therefore, the purpose of this study was to evaluate trunk motion for different levels of spinal fusion.
Clinical Significance Current discussion in the treatment of AIS focuses on the impact of a single additional distal lumbar fusion level at the mid to low lumbar spine on overall spinal motion. Preservation of even a single additional level may allow for significantly improved spinal motion and possibly slow disc deterioration and lumbar facet arthrosis. Understanding the impact of level of spinal fusion on spinal motion will provide an additional basis for making treatment decisions about the distal level of fusion (L1/2 vs. L3).
Methods Twenty-three patients with AIS undergoing posterior spinal fusion to either the distal levels of L1/2 or L3 were evaluated pre and one year post-operatively with standard radiographic and three dimensional motion analysis techniques. Inclusion criteria for the study included radiographic and clinical diagnosis of surgical magnitude AIS. Exclusion criteria included concurrent diagnoses of congenital lower extremity joint and spinal anomalies.
Three-dimensional standing and motion data were collected using a VICON 512 system (VICON Motion Systems, Los Angeles, CA). Retroreflective markers were attached to bony landmarks on the torso, pelvis, and lower extremities3. Patients completed maximal trunk bending motions in the coronal, sagittal and transverse planes. Mean peak and range of motion (ROM) for the coronal sagittal, and transverse planes for the spine (thoracic segment relative to the pelvis segment) were computed.
All patients’ scoliosis were treated through a posterior approach. Spinal instrumentation consisted of hybrid pedicle screw and hook constructs.
Statistical analysis consisted of an analysis of variance between preoperative and postoperative radiographic data and motion analysis data. Demographic variables were compared using either a student t-test for averages or Fisher’s exact test for small number contingency tables. A p value of <.05 was considered statistically significant.
163

Results The cohort consisted of 18 females and 5 males with a mean pre-operative age of 15 yrs (range 8-22). There were no significant differences in gender and age between the two surgical groups and between the groups in terms of mean preoperative and post-operative Cobb (Table 1). The average correction was 69% of preoperative Cobb values.
Table 1 – Patient demographics for each group.
All planes of motion demonstrated decreased ROM post surgery compared to pre-surgery in both groups (Table 2). The largest loss pre to post surgery was seen in the transverse plane in both groups. The pre to post surgical loss of ROM was greater in the L3 group as
compared to the L1/2 group in the coronal and sagittal planes. The opposite was found for the transverse plane
Table 2 – Comparison of the mean (±1 s.d.) pre, post and pre-post operative spine range of motion for each plane of motion for both surgical groups with associated p levels. *Statistical difference between mean pre-post decrease between L1/2 and L3 fusion levels P=0.002.
Discussion The data suggest that extension of the posterior lumbar fusion level to L3 in AIS decreases the spinal motion one-year post-operatively in the coronal and sagittal planes. Therefore, there is less loss in spinal motion by preserving a single lumbar level which may be important for the long-term health of the remaining spinal segments. The relative reduction in loss of spinal motion for the L1/L2 group may decrease the degree of abnormal motion at the individual distal unfused levels. Future studies of the long-term outcomes of spinal fusion for the same group of patients using motion analysis and radiographic techniques will help to further understand the long-term implications of distal fusion level decisions.
Acknowledgement: This study was supported by Stryker Spine Inc.
1. Balderston, R. A. et al.: Spine, 23(1): 54-8, 1998. 2. Danielsson, A. J. et al.: Acta Radiol, 42(2): 187-97, 2001. 3. Davis et al., Human Motion Analysis: Current Applications and Future Directions.
Piscataway, IEEE Press, 17-42, 1996.
L1/2 (N=11) L3 (N=12) p
Age, yr (range) 15 (14-22) 14 (8-19) 0.102 Male 1 4 0.162 Female 10 8
Major Cobb (degrees) Pre-Op (mean) 56 58 0.657 Post-Op (mean) 17 19 0.977
Fused Segments (Range) 12 (11-13) 10 (5-13) 0.340
Plane of Motion L1/2-pre L1/2-post pre-post p L3-pre L3-post pre-post p
Coronal (deg) 53±20 50±6 3±15* 0.53 59±10 38±7 21±13* 0.000
Sagittal (deg) 85±25 75±23 11±23 0.158 85±17 61±25 24±31 0.017
Transverse (deg) 103±25 58±14 44±32 0.001 96±23 64±22 32±22 0.000
164

PRE TO POST-TKA EFFECTS O SIT-TO-STA D KI ETICS A D
FU CTIO AMO G PREHABBED A D O -PREHABBED PATIE TS 1Peter M. Quesada,
2Ann M. Swank, and
3Robert V. Topp
1Dept. of Mechanical Engineering, Univ. of Louisville, contact: [email protected]
2 Dept. of Health & Sport Sci.; and
3 School of Nursing, Univ. of Louisville, Louisville, KY
Introduction
Total knee arthroplasty (TKA) is often indicated when conservative knee osteoarthritis (OA)
treatments are ineffective.1 TKA removes the painful joint; but, it causes other inflammation
and pain, that are generally transient, and which initially lead to decreased functional
capacity. Rehab then seeks to improve capacity to hopefully greater than pre-surgery levels.
The concept of prehab2 (similar to rehab, but prior to surgery) anticipates that a proper pre-
surgical exercise regimen will increase pre-surgery functional capacity. The concept further
anticipates that, after post-operative functional declines, prehabbers will begin rehab with
greater functional capacity, and will achieve greater post-rehab functional capacity.
Post-TKA functional assessment often focuses on overall task completion measures.3 The
number of sit-to-stand repetitions in 30 seconds is commonly assessed, since ability to stand
from a chair typically declines among knee OA patients.4 Other metrics (e.g. strength
measures) are often not specific to any functional task. Measures that quantify the way that
individuals perform functional tasks are less often considered in clinical post-TKA assessment
of function. The ways in which specific tasks are performed, however, could have
implications regarding development of future musculoskeletal pathology.
In the work reported here the investigators evaluated pre and post-TKA sit-to-stand function
among prehabbed and non-prehabbed, knee OA patients. The purpose was to evaluate
whether a prehab exercise program was associated with improved post-TKA sit-to-stand
function. This evaluation not only utilized traditional clinical functional measures, but also
involved biomechanical measures that quantified how sit-to-stand was performed.
Statement of Clinical Significance
Similar pre and post-TKA asymmetry for control and prehab group vertical ground reaction
forces indicated that prehab among knee OA patients did not significantly affect the presence
of compensatory sit-to-stand mechanisms following TKA. Persistence of compensatory
mechanisms that tend to favor a less affected limb could be a factor in further degeneration of
musculoskeletal tissue, despite post-TKA improvements in some clinical functional measures.
Methods
The present study sample consisted of 39 subjects who underwent unilateral TKA. Nineteen
subjects (6 male, 13 female; mean age, height, and weight of 65±7 years, 166±10 cm, and
91±17 kg) were randomly assigned to a prehab group. The remaining 20 subjects (7 male, 13
female; 65±7 years, 169±11 cm, and 88±22 kg) were assigned to a control group (i.e. no
prehab). All subjects signed an IRB approved consent form.
165

Subjects completed 2 identical data collection sessions that occurred ≥ 4 weeks prior to TKA,
and ≈ 12 weeks after TKA. For each session’s 1st sit-to-stand trial, each subject performed a
single rep with the unaffected and affected limbs on and beside a force platform, respectively.
For the 2nd
trial foot placements were reversed, and subjects were told to perform as many
reps in 30 seconds as they were able. Subjects were also instructed to perform the 1st trial at
the same pace as the 2nd
. The 2nd
trial rep count (nrep), affected limb peak isokinetic knee
extensor torque (τext,peak, %BW), and sit-to-stand visual analog scale pain rating (VASpain , %
maximum conceivable pain), were recorded as standard clinical functional measures. In
addition, affected and unaffected limb, peak vertical ground reaction forces during stand and
sit (VFST and VFSIT, %BW) were obtained from each trial’s 1st rep. Unaffected limb minus
affected limb VFST and VFSIT (VFSTunaff-aff and VFSITunaff-aff) were computed to quantify
symmetry (or lack of) in the way that sit-to-stand tasks were performed.
Results
Pre-post-TKA, prehab group changes were not significantly different from control group
changes for the clinical functional measures (nrep: 2.6 vs 2.2, p=.56; τext,peak: 2.9 vs -7.6, p=.19;
VASpain: -18% vs -27%, p=.61). For each group, however, the improvements in nrep and
VASpain were significantly different from zero (p≤0.002 for nrep increases and VASpain
decreases). Prehab pre-post-TKA changes in VFSTunaff-aff and VFSITunaff-aff were not
significantly different from control changes (VFSTunaff-aff: 2.1% vs 1.9%, p=0.97; VFSITunaff-
aff: -0.4% vs -2.9%, p=0.56). For each groups, however, VFSTunaff-aff and VFSITunaff-aff were
significantly different from zero (range from 7.5% to 12.4%, p≤0.023) at each session.
Discussion While previously reported results have suggested that a prehab regimen can improve pre-
TKA clinical functional measures more than a non-prehab condition, present results indicated
that post-TKA changes are not enhanced by prehab. Consequently, improvements in clinical
functional measures were more attributable to TKA and/or rehab. It was further evident, from
unaffected minus affected peak ground reaction forces, that following TKA the asymmetrical
manner in which knee OA patients perform sit-to-stand tasks was not affected by prehab.
Compensatory mechanisms, particularly those associated with greater loading on one limb,
likely develop to mitigate pain. However despite significant post-TKA pain improvement, the
current prehab regimen of exercises (directed towards strength, flexibility and balance
development) was unable to affect asymmetric loading compensations. Persistence of these
compensations could result in accelerated deterioration of a "good" knee, and could be a
factor in many knee OA patients undergoing a subsequent second TKA. Prehab, as well as
post-TKA rehab, should consider including components directed towards modifying
compensatory mechanisms.
References 1. Brady O et al. (2000) Canadian Medical Association Journal, 163(10), 1285-1291.
2. Ditmyer MM et al. (2002) Orthopaedic Nursing, 21(5):43-51.
3. Sharma L et al. (1999) Arthritis & Rheumatism, 42(1):25-32.
4. Felson DT et al. (1987) Arthritis Rheumatology, 30, 914-918.
166

Saturday, May 15, 2010
TIME PROGRAM/ ACTIVITY ROOM
7:30-8:30am Breakfast Monroe/Flagler - Foyer
8:30-9:45am Podium #8 Pathologic Gait III
Moderators: Asa Bartonek, PT and
Glen Ginsburg, M.D.
Monroe/Flagler
PATHOLOGIC GAIT III (CLINICAL FOCUS) 1. Plantar Pressures following the Ponseti and French Physiotherapy Functional Kelly
Jeans
2. Gait Asymmetries in Children: Do They Deteriorate with Running Felix Stief
3. Biomechanics of the Unaffected Knee and Hips in Patients with Knee Osteoarthritis Andrew Metcalfe
4. Walking Velocity does not affect Joint Powers in Peripheral Arterial Disease Panagiotis
Koutakis
5. Anatomical and Dynamic Rotational Alignment in Hemiplegic Cerebral Palsy Jacques
Riad 6. Sagittal Plane Lower Extremity Kinematics in Children with Juvenile Idiopathic Arthritis
Matthias Hartmann 7. Assessment of Conservative Treatment of Scoliotic Patients Using Spinal Segmental
Movements During Gait M.Syczewska
9:45-10:00am General Awards Presentations Monroe/Flagler
10:00-10:45am Break Monroe/Flagler
10:45am-12:00pm Podium #9 Balance
Moderators: Jacques Duysens, Ph.D. and
Vassilios Vardaxis, Ph.D.
Monroe/Flagler
BALANCE 1. Single Leg Balance in Typically Developing Children and Patients with CEV Thomas
Zumbrunn 2. Quantitative Romberg Test in Individuals with Diplegic and Hemiplegic Cerebral Palsy
Diane Damiano
3. Development of Dynamic Balance in Adolescence Timothy A Niiler 4. Center of Mass- Base of Support Interaction During Gait Li-Shan Chou 5. Balance and its Role in the CP Gait Pattern Van Gestel Leen 6. Differences in the Walking Balance of Children with Cerebral Palsy and Typically
Developing Children Max Kurz 7. Standing in Bilateral Cerebral Palsy Cecilia Lidbeck
12:00pm Best Paper Award Monroe/Flagler
167

PODIUM SESSION #8
PATHOLOGIC GAIT III. (CLINICAL FOCUS)
Moderated by: Åsa Bartonek, PT, Karolinska University Hospital, Stockholm, Sweden
Glen Ginsburg, M.D., University of Nebraska, Omaha, NE, USA
PATHOLOGIC GAIT III (CLINICAL FOCUS) 1. Plantar Pressures following the Ponseti and French Physiotherapy Functional Kelly
Jeans 2. Gait Asymmetries in Children: Do They Deteriorate with Running Felix Stief 3. Biomechanics of the Unaffected Knee and Hips in Patients with Knee Osteoarthritis
Andrew Metcalfe 4. Walking Velocity does not affect Joint Powers in Peripheral Arterial Disease Panagiotis
Koutakis 5. Anatomical and Dynamic Rotational Alignment in Hemiplegic Cerebral Palsy Jacques
Riad 6. Sagittal Plane Lower Extremity Kinematics in Children with Juvenile Idiopathic Arthritis
Matthias Hartmann 7. Assessment of Conservative Treatment of Scoliotic Patients Using Spinal Segmental
Movements During Gait M.Syczewska
168

Plantar Pressures following the Ponseti and French Physiotherapy Functional
Methods for Clubfoot
Kelly A. Jeans, MS and Lori A. Karol, MD
Texas Scottish Rite Hospital for Children
Introduction Wide spread interest in non-operative treatments for clubfoot including Ponseti
casting (Cast) and French Physiotherapy (PT) led our institution to prospectively study the
long term outcomes following treatment protocols. Current research shows good sagittal
plane ankle kinematics following both treatments in the young child,1-3
but differences in
plantar loading following these treatments has not yet been reported. The purpose of this
study was to compare differences in plantar pressure measures in feet treated with the Ponseti
program versus those treated with the PT method and to compare both groups to a group of
controls.
Clinical Significance Outcome measures following clubfoot treatment have led to changes in
clinical practice at our institution. The use of gait analysis and pedobarograph following non-
operative treatment protocols have allowed for objective assessment following treatment.
Methods Pedobarograph data were collected and analyzed with the Emed System and
software (Novel, Munich, Germany) on 151 clubfeet, treated with either Cast (79 feet) or PT
(72 feet), at two years of age. Due to the young age of the participants, lead-up-steps were not
controlled for, but no fewer than three steps were taken before data collection. Medial and
lateral differences in plantar pressures, contact area (normalized to the % of the total foot),
contact time and the pressure time integral were assessed in the hindfoot, midfoot and forefoot
using the PRC automask. An assessment of forefoot adductus was made by taking the
bisecting angle of the hindfoot to the forefoot, while the center of pressure line was quantified
by taking the integrals both medially and laterally. Seventeen age-matched controls were
used for comparison.
Results When comparing Cast feet to PT feet, few differences were found in peak pressure
and the pressure time integral in the hindfoot and medial midfoot regions. Table 1 Peak
pressure and the pressure time integral were both found to be decreased in the medial hindfoot
following PT compared to Cast. Peak pressure was less in the medial midfoot for the PT feet
compared to the Cast feet. When compared to controls, both Cast and PT feet had increased
pressure, contact time, contact area and pressure time integral in the lateral midfoot, while the
same measures were all significantly decreased in the first metatarsal region. An assessment
of forefoot adductus, showed no significant difference in means between the Cast (135.2 +
18.0) and the PT (133.4 + 17.7) feet, but when compared to controls (160.4 + 31.4), both
groups had a significantly greater forefoot angle (P<0.0001). The center of pressure line was
significantly displaced to the lateral side of the foot in both groups (P=0.0006), however,
when assessing the medial displacement, only the PT feet had significantly less medial
distribution compared to control (P=0.0006).
169

Medial Lateral Medial Lateral 1st Met. 2nd Met. 3-5th Mets.
mean mean mean mean mean mean meann + sd + sd + sd + sd + sd + sd + sd
CAST 79 9.7 9.8 8.2 10.3 5.5 9.2 12.12.9 2.8 2.7 2.7 2.8 3.2 3.9
PT 72 8.2 ^ 8.7 6.9 ^ 11.1 4.8 8.3 13.32.2 2.1 2.5 3.8 2.7 2.9 5.8
Control 28 17.8 * 15.8 * 8.7 ~ 8.0 * 10.6 * 11.4 * 11.6
5.0 4.0 2.4 1.8 4.3 2.6 3.8
CAST 79 11.5 11.8 8.7 20.1 7.6 8.8 19.41.3 2.0 4.1 3.3 3.4 1.4 4.3
PT 72 10.9 12.0 7.6 21.5 8.1 8.6 20.11.3 3.6 3.8 3.1 4.2 1.8 2.8
Control 28 11.2 11.3 8.7 15.1* 10.9* 9.0 16.9*1.3 1.1 4.3 2.9 2.0 1.7 3.1
CAST 79 48.1 53.3 58.3 79.2 64.0 81.3 89.214.7 13.4 16.4 6.2 22.5 11.2 6.2
PT 72 42.7 51.4 53.7 81.2 66.3 82.9 91.518.1 14.7 22.2 7.1 24.5 12.5 7.8
Control 28 51.8 ~ 51.3 49.7 63.1 * 80.9 * 83.5 82.6 *
10.0 9.6 12.3 9.5 9.2 9.2 11.0
CAST 79 1.4 1.5 1.4 2.6 1.0 1.8 2.70.7 0.6 0.7 0.7 0.6 0.6 0.9
PT 72 1.0 ^ 1.3 1.2 2.8 1.0 1.7 2.90.6 0.6 0.7 1.0 0.6 0.6 1.1
Control 28 2.4 * 2.2 * 1.3 1.5 * 2.4 * 2.4 * 2.40.7 0.6 0.5 0.47 1.1 0.6 0.8
Table 1. Plantar pressures measures comparing Cast, PT & Control. Pressure Time Integral (PTI)
P<0.05: ^ Cast different from PT, ~ PT different from Control, * Cast/PT different from Control.
PTI N.s/cm2
Hindfoot
Peak Pressure N/cm2
Midfoot Forefoot
Contact Area (%CA)
Contact Time %ROP
Discussion Pedobarography illustrates residual pressure differences during gait in children
with non-operatively treated clubfeet. These data provides a more detailed description of
dynamic foot loading and residual deformity than sagittal plane kinematics alone. Significant
shifts were seen in pressure and force away from the medial heel and medial midfoot,
following PT suggesting residual hindfoot varus. Both PT and Cast feet have a global
increased lateralization of the center of pressure line, but only the PT feet lacked medial
pressure. Pedobarograph data document residual differences in two year old patients with
idiopathic clubfeet following non-operative treatment. The clinical significance of these
findings, i.e, need for later surgery, is a matter for future study.
References 1. Karol LA, et al. (2005) J Pediatr Orthop.25, 236-240.
2. El Hawary R, et al. (2008) J Bone Joint Surg. 90, 1508-1516.
3. Karol LA, et al. (2009) Clin Orthop Relat Res. 467, 1206-1213.
170

GAIT ASYMMETRIES IN CHILDREN: DO THEY DETERIORATE WITH RUNNING?
Felix Stief, Harald Böhm and Leonhard Döderlein
Orthopaedic Clinic for Children, Aschau i. Chiemgau, Germany
INTRODUCTIONThe instrumented gait analysis (IGA) is used as an investigation tool to plan surgery, to optimise therapy and to follow up the results in orthopaedic and neurological patients [1].Some authors recommend the use of instrumented running analysis (IRA) to improve the diagnosis of motor deficits and pathological loads [2]. This is because running creates higher loads on the musculo-skeletal-system than walking and claims the neuromuscular abilities in a more complex way [3]. Analysing the joint angles and spatio-temporal parameters of numerous patients during walking and running, it appeared that the difference between the left and right side increased noticeably in running. This was helpful to determine the more involved side of the pathology. However, some patients showed the opposite behaviour, their asymmetry disappeared during running. This information might be useful for indication of conservative treatment by running therapy. There exists no information about the effect of running on the asymmetrical behaviour of the lower limb. Therefore, the purpose of the present study was to investigate the effect of running on the asymmetrical behaviour on patients with different pathologies.
CLINICAL SIGNIFICANCEThe combined diagnostic usage of the IGA and IRA aimed at receiving a better understanding of the cause of gait asymmetry in subjects with different clinical histories and it provides a means of detecting which patients can improve the asymmetrical behaviour during running.
METHODSThirty-four children with a mean age of 11(4) years with different clinical histories (15cerebral palsy (8 spastic diplegia and 7 hemiparesis), 7 arthrogryposis multiplex congenita(AMC), 2 myelomeningocele (MMC) and 10 patients with other orthopaedic or neurological problems) took part in the study. All parents gave informed consent for their children to participate in this study. Walking and running speed were 1.14(0.15) m/s and 2.55(0.45) m/s, respectively. An eight-camera Vicon system (Oxford Metrics, UK) and 2 force plates (AMTI) were used to collect gait data. Markers were placed according to the conventional Helen Hayes marker set [4]. Differences between the left and right leg in spatio-temporal parameters(step length and duration of stance phase) as well as the maximum difference between left and right knee flexion/extension angle during the gait cycle were determined to define the asymmetry in walking and running. Differences of the asymmetries between walking and running were tested for significance using paired t-test. Moreover, Pearson correlation coefficient (r) between walking and running was calculated.
RESULTSThe differences in step length, duration of stance and knee flexion/extension angle are shown in figure 1. All parameters increased with running, differences were significant for step length
171

and knee angle. No correlation (r = 0.14) was found between step length asymmetry in walking and running. Weak correlations (r = 0.49 and r = 0.48) were found for duration of stance and knee flexion/extension angle. In the following, patients were listed showing a better symmetry in running: For step length, 10 patients (5 hemiplegic, 2 AMC, 2 MMC and 1 patient with leg length discrepancy), for duration of stance, 14 patients (4 hemiplegic, 2 AMC, 1 MMC, 1 spastic diplegia and 6 other diagnoses), for knee flexion/extension angle, 10 patients (3 hemiplegic, 2 MMC, 2 spastic diplegia, 1 AMC and 2 patients with other diagnoses).
Figure 1: Average difference between left and right side during walking (black bar) and running (white bar). * indicates a significant difference at p<0.05 and ** a significant difference at p<0.01.
DISCUSSIONThe significantly greater asymmetry between the left and the right leg in step length and in the knee flexion/extension angle in running compared to walking imply that IRA may allow an easier recognition of the asymmetrical behavior and motor control function of the lower limbs. Since weak or no correlation was found between asymmetry in running and walking, running does not simply amplify the existing asymmetries. This suggests that small differences during walking might result in great differences in running, which are especially useful in detecting the pathological side. More patients (about 65 %) demonstrated a greater symmetry during walking which is in accordance with what was expected. Regarding the pathology, it seems that hemiplegic patients tend to increase their symmetry during running, whereas only one of the patients with diplegia increased symmetry during running. From this study we conclude that the combined diagnostic usage of gait and running analysis can give additionally information. Furthermore, especially in patients with hemiparesis, the IRA showed a greater symmetry of the lower limb and could therefore be helpful for clinical decision making.
REFERENCES[1] Perry (1992) Gait Analysis, SLACK Inc, pp192-5.[2] Davids et al. (1999) J Pediatr Orthop, 19: 461-9.[3] Arampatzis et al. (1999) J Biomech, 32: 1349-53.[4] Davis et al. (1991) Hum Mov Sci, 10: 575-87.
172

������������ ������ �������������������������������
������������������
������� ������������������� �������!�����������"�������"�����������!��������#�$�����
����������� ����������� �������������������������������� !���������"����#���$% �
���#$�����"�&����'������(�)���$**���$+���$�'�����
����������
����� ����������������������� �� ������� ���� �������%������&�� �����������'���� �� �����
�����������(������%���������������'������������������)*�+������������������,�����%�
$�������������(�����(��������������*������-������� ����������%������������������������
��������������������������������*���,��$�����$����������� ������ ������
������$�������������(��������,���(���
��� ������ ��
����������(�� ������ ������ �����*��������'������ ������������������$�����������
�����������������������(������������������������������,���(����������'������������
�������
-�������%����$�������,���$%�������������������,����$�������������,�������������
��,����$�����
��,������������)�.��������/� �����+���������������������������*������������
'���������������������� ������������������%�����(�������-����������(���������������
�.��%����������������������'�����������$����������$������$������0������������
��,����� � �������%� � ����(���� � � � ��� � ����� � '��� ����� � �&���� � � �1*������
*& ���������������������������������$'���������� ������������������ �����,���������������
��$�%�������������$�������������$���������������'����������������������������(�
�������������������2����)2�����*& �����34+��%�����������������������������������
)���..!5+�����,�������(�������(������������ ��������������������(���������-6�
�����������)�...!5+�$������������� ��������� ��������������������������,���������������
������7�������������������������������(��$�������%���0�8����������������
���(�����������%��%����������������...!5�
4������� � � � ������� � ���� � �������� � ���( � ��� � 2��� � 9���(:� � (��; � ������ � � � ��:
������������&������������� �������0�8���(��������������� �������������������(�
�����(������� ��������$��������(�������,������������&������������������(�����(���
�%��������������������������������� ���������(��:������������� �����;������������ �����
,��$��������*2�� �������������,��$����)� ���2�������<+�
�������
-������(��� ���������������/.�)�"�=�=+�����(������������.�>?�@������������%�
(���������AA�@���������������(������ ��������:�������������������� �������*��
(�����������������-$������
173

���������� ������������������������ ���!"#�$���!� �!��%�#&�'�(!��#��)��**"+ �!��
�!��� ��� �����,�-!�� �.�#/00��(!����*�� ��+���!��� ��� �����-!�� �1�
�!�+!� ��+ �!� � ��*�+�� � (!� � ��*��� � ��* � �� ���� � 2��� ����� � ��* � 3"�*�4 � �5#�����* � ���
0/$��"�/�����������4 �6����078�00�����*����9���*�0:,�007�� �� �����9� (!�� 2���((�+ �*�
)���.�070�007����*����9���*�078�007���� �����9�(!�� 2��"��((�+ �*�)�����2���3"�$���� �
$��"���(!�� 2��+!� �!���6����0�:�00�����*����9���*�0�:�00����� �����9���((�+ �*�)������*�
+!� �!��#/00�.�"��((�+ �*�)������*�+!� �!���#/00�.��((�+ �*���*�"��((�+ �*�)����#/00���
�2� � �� ���� � +!�+!� ��+ �!� � ��*�5 � ��* � 2� � #��) � �**"+ �!� � �!��� � 6��� � �! � +!����� �*�
�;7&00<�4 �62����� � 2���� ���� �+!�+!� ��+ �!� ���*�5���*� 2����*�� ��+���**"+ �!���!��� �
+!����� �*�6�����;7&08:�
����������
� 2!"�2� 2���((�+ �*��"�-�+ ������2�*�!��9��������-!�� �� 4����!����� ���������� �6������������
2��2�#����*�)�����!(��! 2���������6���������� �"�)��! �!�����#�� �+"���4�+!�!����#�������*�
� ��+���!��� ��6���������(�+�� �9����� ��4���*�#��)��!��� ��6������������*��#� �� 2��������
*�((����+� � �� � ��� � �#��* � �� 6��� � 2� � ��!"#� � ��!���� � 2��� ���� � ��* � 3"�*��+�#� � +!�
+!� ��+ �!��!++"������� �����9����#� ��� �6� 2��������-!�� �� �
��+�����*���*�!��� ����� �"�)��!$���� ��������+!�����*�+!�#���� !�9�� �� ��9����)����� �
��*���9���� 2� �+�"�� �!( � 2� ����!���� �2�#���*�+!� ����� ���� �)��� � �!�*��� �(!"�*� �� � 2���
� "*9�47�=�+2���+���(�+ !�����9�#��9���#�� ���� 2��*�$��!#��� �!(��"� �#���-!�� �� :�>"� 2���
��$�� ��� �!���� !� 2���#2��!���!�����6����� �*���*���9����*� !���#�!$���� ����� 2���!���
����!" +!���(!�� 2����#� ��� ��
����� �� � ��
�2��� "*9�6���("�*�*��9������� �(!��?<,00�(�!�� 2��;�����+2���*�@�$��!#��� �*�#�� ��� �
!(� 2���!� 2�A������B'���"� ��2���������!�+!�(��+ ��!(��� ���� � !�*�+����
� � � �� �
�� '2�)!!���4�C�!+)�D 4�'2! �'4������DE��!����*!��F$!�" �!��!(�F�*�' ������ �!�� 2�� ���
!(� 2��G!6���G����������������7007.,8��7�4�#:�H�I:�H�
�� '2�)!!���4�B"�6� J�@F4�C�!+)�D 4�'2! �'4������DE� �9��� ��+������G!�*�������
*$��+�*����� �����B�#��� �!�� 2�� ���������������,H�8��700:�#���8I��8�
�� C������4�'�9*���=�+)����G�E�!5�����K�� � *�# � �!������=�*���������� � ��������
����7<����700��#<H�H:
�� ="�*������� 4�@9��9�� 4� �*���++2���E�'�+!�*��9�K�� ��2���������E� ��� ��A� 2�
=�*�����!�#�� ��� �������� �!�� 2�� ���������������7����700��#7H:�I7H,,
�!� �!��
����
�!� �!��
B�#
((�+ �*�
����
��((�+ �*�
����
�#���� �����
B�#
�!� ���� �����
B�#
E��)�
�**"+ �!��
�!��� �
08,
�008�
0H�
�00<�
0��
�008�
0,<
�008�
0<:
�00��
0<:
�00H�
=�*�� ��+��
�**"+ �!��
�!��� �
0�,
�00:��
0,0
�00,��
0,,
�00H�
0::
�008�
08,
�008�
08�
�00H�
174

WALKING VELOCITY DOES NOT AFFECT JOINT POWERS IN PERIPHERAL ARTERIAL DISEASE
Panagiotis Koutakis1,4
, Dimitrios Katsavelis1, Sara A Myers1, Jason M Johanning2,3, Iraklis Pipinos2,3, Nicholas Stergiou1,4
1Nebraska Biomechanics Core Facility, University of Nebraska at Omaha, Omaha, NE 2Department of Surgery, University of Nebraska Medical Center, Omaha, NE
3Veterans Affairs Medical Center, Omaha, NE, USA 4College of Public Health, University of Nebraska Medical Center, Omaha, NE
Email: [email protected] Web: http://biomech.unomaha.edu/ INTRODUCTION Peripheral arterial disease (PAD) affects over 10 million people in the United States and is a manifestation of atherosclerosis leading to decreased blood flow to the legs. This results in ischemic pain (claudication) induced by physical activity resulting in diminished ability to walk [1]. CLINICAL SIGNIFICANCE Recent studies from our laboratory have determined that patients with PAD have altered ground reaction forces and joint kinetics and kinematics as compared to controls.[2, 3, 4] However, it is not clear if PAD is the limiting gait factor or if the differences observed in our previous work [4] are the results of slower walking velocity in the PAD patients. In previous studies with healthy individuals, it has been demonstrated that increased walking velocity is associated with increased joint powers.[5-6] We hypothesized when walking velocity is controlled experimentally, the significant differences previously identified in joint powers of PAD patients compared to healthy controls will persist. METHODS Twenty four PAD patients (age: 62.46+10.19yrs, mass: 79.76+16.20kg, height: 1.72+0.06m), and twenty matched healthy controls (age: 66.95+12.55yrs, mass: 83.25+23.95kg, height: 1.72+0.08m) walked over a force platform (600 Hz; Kistler Instruments, Switzerland) to acquire kinetics, while joint kinematics were recorded simultaneously with an 8-camera motion capture system (60 Hz; Motion Analysis, Santa Rosa, CA). Five trials were collected for each limb in a pain free (prior to the onset of claudication) condition. During the pain free condition, one minute rest periods were required between each walking trial to prevent onset of claudication pain. Subjects and healthy controls were matched for self-selected walking velocity. Joint powers were calculated during the stance phase of gait. Independent t-tests were used to compare the joint powers between the PAD patients and the healthy controls. RESULTS Results are presented in Table 1 below. Only significant results are reported (p<0.05).
175

DISCUSSION Our previous research has shown that PAD patients exhibit abnormal joint powers during gait [3,4]. When controlling for gait velocity by matching PAD and control subjects, our results demonstrate that many of these significant results remain. The PAD patients have significantly reduced propulsion in late stance phase, with significantly reduced ankle power generation consistent with our previous studies. This is the most consistent and reproducible finding in PAD patients [3,4]. Knee joint power was significantly reduced in all parameters as compared to controls. This provides further support that PAD limits gait function by reducing subjects’ ability to accept and control weight and then propel the body forward to the next step. Therefore, the biomechanical alterations found appear to be due to the known underlying neuromuscular alterations including metabolic myopathy and altered neural function [7]. These findings support the hypothesis that reduced gait function in PAD patients reflected by reduced propulsion and poor weight transfer are independent of gait velocity. REFERENCES 1. Rosamond et al. (2007). Circulation, 115(5): e69-171. 2. Scott-Pandorf et al. (2007). Journal of Vascular Surgery, 46:491-499. 3. Chen et al. (2008). Journal of Biomechanics, 41:2506–2514. 4. Koutakis et al. (in press). Journal of Vascular Surgery. 5. Chen et al. (1997). Gait & Posture, 6: 171–176. 6. Winter DA (1983). Journal of Motor Behavior 15: 302–330. 7. Pipinos et al. (2008). Vascular Endovascular Surgery, 42(2):101-112. ACKNOWLEDGEMENTS Support was provided by the Nebraska Research Initiative and the Alexander S. Onassis Public Benefit Foundation Table 1: Group means (±SD) from peak joint powers PAD Pain Free Control p-value Walking Velocity (m/sec) 1.25±0.02 1.27±0.02 0.570 Ankle Power in Late Stance (w/kg) 2.65±0.53 2.94±0.64 0.030 Knee Power Early Stance (w/kg) -0.77±0.31 -0.98±0.41 0.013
Knee Power Early Mid-stance (w/kg) 0.39±0.20 0.52±0.28 0.022
Knee Power Late Stance (w/kg) -0.71±0.21 -0.92±0.34 0.001 Hip Power Mid-stance (w/kg) -0.79±0.24 -0.94±0.26 0.008
176

Anatomical and dynamic rotational alignment in hemiplegic cerebral palsyJacques Riad 1,2, Thröster Finnbogason 3, Eva Broström 21 Skaraborgs Hospital, Skövde, Sweden2 Women’s and Children’s Health, Karolinska Institute Stockholm, Sweden3 Department of Radiology, Astrid Lindgren Hospital for Children, Stockholm, SwedenIntroductionIn mild hemiplegic cerebral palsy gait deviations are subtle and difficult to define although the gait pattern is clearly asymmetric. Even if the brain injury is the sole primary cause of the asymmetrical movement pattern the secondary changes are probably a combination of impaired motor control, increased tone, compensation mechanisms and anatomical changes.In Winters´ classification of hemiplegic cerebral palsy based on sagittal kinematics, type 4 is the most severely involved with not only ankle and knee but also hip involvement. [1] In type 4 the rotational malalignment is common and as a consequence the pelvis is retracted in gait on the hemiplegic side to compensate for increased internal hip rotation. [2]However even in mild hemiplegic cerebral palsy, Winters type 1 and 2, on the clinical examination we often find an increased internal rotation in the hip joint with a corresponding limited external rotation on the hemiplegic side, apart from changes in the sagittal plane.In normal newborn there is a femoral torsion/anteversion of around 35 degrees that with growth decreases to 15 degrees on average at skeletal maturity. The cause and mechanism of this rotational bone growth in the transverse plane is not well understood but is clearly altered in cerebral palsy. [3, 4]The femoral torsion in mild spastic hemiplegic CP and possible impact on gait is however not well investigated. The goal of this study was to assess lower extremity anatomical rotational alignment together with clinical rotational status of the hip and three dimensional gait analysis data in spastic hemiplegic cerebral palsy.Clinical significanceRotational deformity even in mild hemiplegic CP may contribute to movement deviations and influence treatment plans and should therefore be assessed with care and be included in the overall assessment.MethodsForty-eight hemiplegic patients, mean age 17, 7 years (range 13, 0-24, 0 years) participated. Seventeen were female and 31 male. All were classified as GMFCS 1 and Winters ´ 1 and 2.[5, 1] No patient had previous surgery except soft tissue procedures in the calf muscles.The magnetic resonance imaging (MRI) equipment used was Philips Intera 1.5 T (PhilipsMedical Systems, Best, the Netherlands). The patient was placed supine with both legs stretched and parallel to the long axis of the body. In order to measure the rotation T2 weighted coronal images were used covering an area that included both the hip joint and the sole of the feet. Slice thickness was 5 mm with 0.5 mm gap between slices. From specific anatomical landmarks on the transverse views the rotation was calculated separately for tibia and femur and the degree of forward orientation of the acetabulum. [6]The clinical examination was performed with the patient supine to assess hip rotation and degree of anteversion.Gait analysis was performed using Gait analysis was performed with a Vicon, 8 camera system (Vicon, Oxford England) with two force plates (Kistler). Patients walked at a self selected speed and three trials were collected from the hemiplegic and non-involved side.ResultsWilcoxon signed ranks test was applied using SPSS 15. We found significant increase infemoral torsion (p=0,000) and decrease of forward orientation of the acetabulum (p=0,038)comparing the hemiplegic and non-involved side on the MRI. There was no difference in tibiarotation.
177

On the clinical examination on the hemiplegic side the internal rotation was increased(p=0,001) and the external rotation decreased (p=0,003) meaning that the movement range was directed more internal compared to the non-involved side.The Gait analysis data revealed an increased external rotation of the pelvis on the hemiplegic side (p=0,000). There was no difference in maximal hip internal rotation or foot progression. DiscussionComparing the hemiplegic side with the non-involved side we found a significant shift of hip movement in the transverse plane towards internal rotation on the clinical examination and an increased bony femoral torsion/anteversion on the MRI assessment together with a decreased forward orientation of the acetabulum. Gait analysis showed an increased pelvic external rotation on the hemiplegic side. Interestingly the foot progression was the same.Several authors have reported that in cerebral palsy the increased tone and spasticity preventsnormal rotational growth of the femur with maintained increased internal torsion. [2, 3, 4, 6]We believe in hemiplegic CP this is compensated with pelvic external rotation during walkingand as a consequence of the external forces acting on the pelvis and acetabulum the forward orientation of the acetabulum is decreased on the hemiplegic side.It has been reported from K. Graham et al that derotational osteotomy of the femur in severe hemiplegic CP normalizes the transverse changes found on the gait analysis including the pelvic external rotation and the foot progression is maintained more or less equal on both sides. [2] Our findings are in line with the K.Graham report but the changes are not as pronounced. Our interpretation is that there is a drive towards keeping the feet pointing equally much forward regardless of the degree of femoral torsion. This might be of practical and cosmetic reasons or for dynamic reasons as to obtain a good lever arm for push off. The drive to keep the feet pointing in the direction of movement is strong and the impaired motor control seems to be overruled. We speculate that if the femoral torsion could be prevented or treated by an easy measure even in the mild hemiplegic cerebral palsy patient’s improvement in gait function could be expected. The secondary changes with external rotation of the pelvis during gait and thedecreased forward orientation of the acetabulum would not have developed.ConclusionAlthough not pronounced, the existing spasticity in mild hemiplegic CP influences the natural development of femoral growth. Rotational deformity even in mild hemiplegic CP may contribute to movement deviations and influence treatment plans and should therefore be assessed with care and be included in the overall assessment.References[1] Winters TF, Jr., Gage JR, and Hicks R. Gait patterns in spastic hemiplegia in children and young adults. J Bone Joint Surg Am 69: 437-441, 1987.[2] Graham HK, Baker R, Dobson F,Morris ME. Multilevel orthopaedic surgery in group IV spastic hemiplegia. J Bone Joint Surg Br. 2005 Apr; 87 (4):548-55[3] Staheli LT, Duncan WR, Schaefer E. Growth alterations in the hemiplegic child.A study of femoral anteversion,neck-shaft angle,hip rotation, C.E. angle,limb length and circumference in 50 hemiplegic children. Clin Orthop Relat Res. 1968 Sep-Oct;60:205-12.[4] Robin J et al. Proximal femoral geometry in cerebral palsy. J Bone Joint Surg Br. Vol.90-B, No 10, October 2008.[5] Palisano R. Development and reliability of a system to classify gross motor function in children with cerebral palsy. Developmental Medicine and Child Neurology 39: 214-223, 1997.[5] Guenther KP Guenther KP, Tomczak R, Kessler S, Pfeiffer T, Puhl W. Measurement of femoral anteversion by magnetic resonance imaging-evaluation of a new technique in children and adolescents. Eur J Radiol. 1995 Nov;21(1):47-52.
178

SAGITTAL PLANE LOWER EXTREMITY KINEMATICS IN CHILDREN WITH JUVENILE IDIOPATHIC ARTHRITIS Hartmann, M. 1, Kreuzpointner, F. 2, Haefner, R.1, Schwirtz, A.2, Haas, J.P.1 1 German Center for pediatric and adolescent rheumatology, Garmisch-Partenkirchen 2 Department of Biomechanics in Sport, Technische Universität München
Introduction Juvenile idiopathic arthritis (JIA) in children and adolescents is a chronic autoinflammatory affection which might occur in any joint. Some JIA patients suffer from symmetric arthritis located within joints of the lower extremities. The disease causes pain and may lead to posture and movement modifications for pain relieve thus causing muscular imbalance and reduced range of motion. These processes may lead to mal-positioning or compensatory movements that increase the risk for subsequent arthrosis. 3d-gaitanalysis is used for JIA patients with multiple affected joints in the lower extremities to quantify their gait parameters to individualize and optimize their physical therapy. Clinical significance In the context of JIA therapy, reeducation to physiological movements is an important issue which might be supported by sport activities. Therefore the aim of this study is to quantify the movement restrictions in JIA patients to plan an adequate sport therapy. Methods Into the patients group (pg) (n=36) children and young people were included, which suffers on JIA with symmetric arthritis with inflammation and/or movement restrictions in both hip-, knee- and ankle joints (sex: �=26; �=13; age: 13.2±4.2y; weight: 44.0±17.7kg; size: 1.49m ±0.15m)). For the comparative measurement a control group (cg) of 20 healthy young persons were examined (sex: �=17, �=3; age: 17.9±6.5y; weight: 53.8±15.0kg; size: 1.59 ±0.13m)). Gaitanalysis is performed in a 9m long laboratory equipped with six infrared cameras (Vicon) with 120Hz. For investigation the participants were marked in accordance to the Plug in Gait Model for the lower extremities [2] with 16 reflecting balls (• • =14mm). The walking speed is individually selected and should represent a pleasant and normal speed. For the evaluation 12 left and right strides were used. Due to symmetrical joint infestation of the pg and on the assumption of a symmetrical gait of the cg the results of the right and left side of each participant were averaged. Further analysis on the basis of arithmetic means focused on walking speed, stride length and kinematic parameters in sagittal plane in pelvis, hip, knee and ankle joint. For the statistic examination on differences the Welch-test was used. The results are secured on a probability level of 95%. Results Clear differences are seen in the self chosen walking speed (p<0.0001). The pg went slower and made besides smaller stride length (p<0.0001). The children with JIA exhibit obviously a stronger anterior tilting pelvis in the average value than the cg (p=0.014). The comparison of the ROM average of the hip flexion and extension appears clearly differently (p<0.0001). The pg shows significantly lower values. In addition to this hip movement restriction the pg reached much less hip extension positions (p=0.001). Within the array of the sagittal knee movement the pg shows lower ROM extension movement during the single support phase (p<0.0001) as well as in the following ROM up to the maximum flexion position during swing phase (p<0.0001).
179

Table 1: Comparison of the kinematic results of the patients with JIA and healthy controls Welch-Test
Pelvic Tilt - Average [°] 10,8 3,9 14,2 5,9 0,01Hip Flex/Ext-max. extension [°] -5,8 5,4 0,7 8,3 0,00Hip Flex/Ext-ROM [°] 44,0 3,3 38,8 5,9 0,00Knee (ROM-Ext. Stance P.) [°] 15,8 3,2 9,7 4,5 0,00Knee (ROM-Flex. Swing P.) [°] 56,7 3,8 46,4 8,3 0,00Ankle (ROM-Dorsi-Ext.-Stance P. [°] 17,4 3,0 19,4 4,0 0,04Ankle (ROM-Plant-Flex-Push Off) [°] 31,0 4,9 25,6 7,9 0,00Foot-Flat (±2°) [%] 23,7 4,8 27,7 8,0 0,02Stride Length [m] 1,26 0,10 1,06 0,17 0,00Walking Speed [m/s] 1,32 0,08 1,06 0,17 0,00
Control group (n=20) mean (SD) JIA-Patients (n=36) mean (SD)
The dorsal extension ROM of the subtalar joint movement throughout the stance phase is increased within the pg (p=0.44). The following plantar flexion ROM while push off appears in the pg clearly under the average ROM of the cg (p=0.003). The comparison of the percentage duration of the flat foot phase during the roll off procedure shows a longer phase in the pg (p=0.22). Discussion Comparison of gait parameters between JIA patient with multiple joint infestation and healthy young person showed significant differences. First is the very low walking speed of the patients caused by pain and movement restrictions as well as by compensatory movements. The decrease of the freely selected walking speed with JIA patients is affirmed by results of Lechner et al. [3]. Broström et al. [1] determined a significant, negative correlation between pain and progressive movement speed with children with JIA. These are reasons, in addition to the body height variation between the investigation groups, responsible for the approx. 20 cm shorter stride length of the pg. The movement restrictions express themselves in a likewise crouch walking position, with increased pelvic tilt and decreased hip extension with accompanying reduced knee extension in single stance phase. The increased dorsal extension motion in the subtalar joint during stance phase shows in connection with the extended time during foot standing flat on the ground a retarded roll off behavior. The strongly reduced plantar flexion suggests an additive passive roll off manner. Despite the homogeneous patient collective with comparable joint infestation high standard deviations are present with the pg, which suggests that some patients exhibit much higher differences to the cg. Since the disease often arises in episodes with changing joint inflammations, it is possible to recommend reintegrating a preventive mobility workout for the entire body after the first manifestation of arthritis, particularly within the hip and knee extension and subtalar plantar flexion on a long-term. The results show that 3d-gaitanalysis is an important instrument to quantify movement restrictions and also to develop the therapy for children with JIA. References 1 Broström E., Haglund-Akerlind Y.,et al.: Gait in children with juvenile chronic arthritis –
Timing and force parameters. Scandinavian Journal of Rheumatology, 2002, 31: 317-323. 2 Kirtley C.: Clinical gait analysis. Theory and Practice. Edinburgh: Churchill Livingstone,
2006. 3 Lechner D., McCarthy., Holden M.: Gait deviations in patients with juvenile rheumatoid
arthritis. Physical Therapy, 1987, 67:1335-1341. Acknowledgements The authors wish to thank the German Foundation for children’s rheumatism for supporting this study.
180

ASSESSMENT OF CONSERVATIVE TREATMENT OF SCOLIOTIC PATIENTS USING SPINAL SEGMENTAL MOVEMENTS DURING GAIT
Syczewska Malgorzata 1, 1 Dept. Padiatric Rehabilitation, The Children’s Mem Hlth Inst., Warsaw, Poland
Introduction Scoliosis is most common orthopaedic problem among children and adolescents, with frequency of occurrence estimated between 1 to 4 % [1]. In more than 60 % patients with scoliosis the progression in time is observed [1]. The progression of scoliosis or the efficacy of conservative treatment is usually assessed based on X-ray examination of the spine and the clinical assessment. The spine deformity is not only structural problem, but influences also the functional outcome [2,3]. This paper presents the use of spinal segmental movements during gait and signal correlation coefficients in assessment of the functional outcome of conservative treatment in scoliotic patients. This method could be used for the monitoring of the functional status of the patients during rehabilitation, and for the design of the individual rehabilitation plan.
Clinical significance The described method could be used for assessment of the functional changes occurring during conservative treatment in scoliotic patients, and could help to evaluate the efficacy of this treatment.
Methods Thirty five girls with scoliosis, aged 12 to 17 years old, participated in the study. The inclusion criteria were as follows:
- scoliosis in lumbar and thoracic region with rotation in transversal plane; - Cobb angle greater than 20 degrees; - they were not treated prior to the inclusion of the study; - no accompanying problems or diseases, which could influence the functional outcome
were present. The patients underwent two times the gait analysis with spinal movement recording during gait: at the time of the inclusion of the study, and 6 months after the intensive rehabilitation program. The segmental spinal movements were registered using VICON 460 system. Markers were placed along the spine from C7 to S2, acromions, pelvis and legs [4, 5]. The movements of the spine segments (the spine was divided into 7 segments) were calculated in sagittal and frontal planes in respect to the gait cycle. The relative movement of the shoulders in respect to pelvis was calculated in sagittal, frontal, and transversal planes. To estimate the impact of the conservative treatment on the functional outcome the signal correlation coefficients were calculated. The curve representing movement of the spinal segment in a plane was regarded as a signal, changing in time. The correlation with another signal (in this case with data of healthy subject [4]) could be calculated. The coefficient represent the agreement between two signals, where 0 means total disagreement, and 1 total agreement.
181

Results Figure 1 shows the examples of the results of one patient. The dashed line represents the coefficients between the first examination and results of healthy subject, the solid line the results of the second examination.
Figure 1. The exemplary results of one scoliotic patient. The dashed line shows the signal correlation coefficients of the segmental movements (patient and healthy subject) prior to the treatment, the solid line shows the coefficients after 6 months of conservative treatment. Fig. a shows the results in sagittal plane, fig.1b in frontal plane. Segments are numbered from 1 (highest) to 7 (lowest). Fig. 1c shows the coefficients for shoulders vs hips movement in sagittal (1), frontal (2), and transversal (3) planes.
Discussion Although scoliosis is regarded as an orthopaedic problem: a structural deformity of the spine, the movement of the spine during gait is also changed. This abnormal movement could be measured, and used for the evaluation of the changes induced by the conservative treatment. The signal correlation coefficients enable the assessment of the distance between the movement of spinal segment of the patient and the healthy subject. The help to evaluate in which region of the spine this distance is higher. The comparison of the results obtained during the rehabilitation treatment show in which part and in which plane the improvement occurs, thus could influence the individual treatment plan.
References [1] Roubal PJ et al, (1999) Physiotherapy, 85, 259 – 268 [2] Mahaudens P et al, (2009) Eur Spine J, 18: 512 – 521 [3] Mahaudens P et al, (2009) Eur Spine J, 18: 1160-1168 [4] Syczewska M et al, (1999) Clin Biomech, 14: 384 – 388 [5] Syczewska M, Oberg T (2006) J Hum Kinetics, 16: 39 – 55
Acknowledgements This study was supported by the research grant 0483/B/P01/2009/36 of Polish Ministry of Science and Higher Education.
a b
c
182

PODIUM SESSION #9
BALANCE
Moderated by: Jacques Duysens, Ph.D., K.U. Leuven, Belgium
Vassilios Vardaxis, Ph.D., Des Moines University, Des Moines, IA, USA
BALANCE 1. Single Leg Balance in Typically Developing Children and Patients with CEV Thomas
Zumbrunn 2. Quantitative Romberg Test in Individuals with Diplegic and Hemiplegic Cerebral Palsy
Diane Damiano 3. Development of Dynamic Balance in Adolescence Timothy A Niiler 4. Center of Mass- Base of Support Interaction During Gait Li-Shan Chou 5. Balance and its Role in the CP Gait Pattern Van Gestel Leen 6. Differences in the Walking Balance of Children with Cerebral Palsy and Typically
Developing Children Max Kurz 7. Standing in Bilateral Cerebral Palsy Cecilia Lidbeck
183

Single Leg Balance in Typically Developing Children and Patients with CEV
Thomas Zumbrunn2, Bruce A. MacWilliams1,2,3, Barbara A. Johnson1
Shriners Hospital for Children (1) and the University of Utah, Dept. of Bioengineering (2) and
Dept. of Orthopaedics (3) Salt Lake City, UT, USA
Introduction
In measuring balance of individuals with vestibular and somatosensory impairments, double
limb balance protocols are often utilized [1, 2]. Higher functioning individuals with
musculoskeletal impairments may have normal balance as measured with double limb balance
protocols. A single limb balance test may provide a more demanding and functional protocol
for these individuals. There are few reports of this protocol in the literature, and no known
reports of this protocol being applied to a population with a musculoskeletal disorder, other
than ankle instability [3]. In this study, we compared results from a single limb balance
protocol in children with congenital equinovarus (CEV) to an age matched typically
developing (TD) population. We hypothesized that center of pressure (COP) parameters from
this test will identify balance impairments in the CEV group.
Clinical Significance Single limb balance ability may be a key measure in determining a child’s functional ability
as it has implications for single limb stance in gait and other functional activities such as
jumping. A balance test able to discriminate between typically developed and high
functioning but impaired individuals may prove to be a useful clinical assessment tool.
Methods
Fifteen typically developing (TD) subjects (age 4-7) and ten patients with CEV (age 4-7) were
evaluated. For the CEV group only the affected limbs were analyzed (n=13 limbs) and
bilateral subject data were treated independently. Most TD subjects were tested on both legs,
and limbs were treated independently (n=28 limbs).
The subjects were tested on a force plate integrated in the floor of a laboratory equipped with
a ten camera motion capture system. Reflective markers were placed and ankle joint centers
(AJC) computed according to a standard gait model. Data collection began during double
limb stance prior to the test initiation and continued for at least five seconds. The protocol was
repeated five times for each leg. Three continuous seconds had to be completed without
having the contralateral foot touch the ground for the trial to be deemed valid.
Several balance variables were calculated in order to enable comparison to previous reports.
Mean center of pressure (COP) in anterior/posterior and medial/lateral directions were
computed relative to the AJC. COP standard deviation (SD), maximum excursion and
velocity were each recorded with these same directional components. Additionally COP
combined standard deviation, area, average radial displacement, path velocity and COP
frequency were computed using previously defined methods [1-3]. The CEV group was
compared to the TD group using Student’s t-test (α=0.05).
Results
The comparisons between CEV patients and the age matched TD group showed significant
differences for most of the force plate parameters (Figure 1.). Exceptions were mean COP
(p=0.40) and SD COP (p=0.06) in medial/lateral direction and frequency (p=0.06). Mean
184

Mean COPx
Mean COPy
0
20
40
60-
Po
ste
rio
r/La
tera
l
(
mm
)
+
An
teri
or/
Med
ial
TD
CEV
SD COPx
SD COPy
SD COPr
Ave. Radial D
isp.
0
5
10
15
20
(mm
)
COPx Velocity
COPy Velocity
COP Path Velocity
0
50
100
150
(mm
/s)
*
*
*
*
*
*
*
Figure 1: Selected COP measures comparing clubfoot patients (CEV) to an age matched typically
developed (TD) group from single limb stance protocol. x = anterior(+)/posterior(-) direction,
y=medial(+)/lateral(-), SD = standard deviation. Error bars indicate 95% confidence intervals. *
indicates significant difference (p<0.05) detected between groups.
COP, SD COP, max COP and COP velocity in anterior/posterior direction, area COP, average
radial displacement and path velocity all showed highly significant differentiation between
TD subjects and patients with CEV (p<0.01).
Discussion
The single limb balance test determined that patients with CEV have a lack of balance
development. Compared to TD children, children with CEV maintained the COP closer to the
AJC on average, but with larger and faster excursions, most notably in the anterior/posterior
direction. The greatest differences between the CEV and TD groups were observed for path
velocity, COP velocity and max COP in anterior/posterior direction. For directional variables,
differences in anterior/posterior direction demonstrated more consistent significance than in
the medial/lateral direction. This may be explained by the larger range of possible balance
excursion in the anterior/posterior direction. This is opposite to the case of double limb stance
where larger medial/lateral excursions are possible. In the medial/lateral direction the subjects
seemed less likely to be able to maintain balance when the COP moved even small distances
away from the AJC.
References 1. Wolff et al. J Orthop Res, 1998. 16(2): p. 271-5., 2. Rose et al., Dev Med Child Neurol, 2002. 44(1):
p. 58-63., 3. Ross et al. Med Sci Sports Exerc, 2009. 41(2): p. 399-407.
185

Quantitative Romberg Test in Individuals with Diplegic and Hemiplegic Cerebral Palsy Diane L. Damiano1, Christopher J. Stanley1, Lindsey Bellini1, Jason R. Wingert2
1Functional & Applied Biomechanics Section, National Institutes of Health, Bethesda, MD 2Department of Health & Wellness, UNC-Asheville, Asheville NC
Introduction Persons with cerebral palsy (CP) tend to have poorer static stability than those without CP, and stability is known to be lower in the absence of visual input1. The Romberg test is a non-specific neurological assessment of standing balance in the absence of visual input2. Increased sway or falling with the eyes closed in stance and feet close together is a positive test indicative of proprioceptive, vestibular or cerebellar dysfunction. Our goal was to evaluate performance on this test separately in individuals with diplegia and hemiplegia compared to controls using multiple quantitative sway parameters to differentiate groups. Clinical Significance Persons with diplegic and hemiplegic CP have decreased large joint (hip) proprioception compared to non-CP3. Our aim was to evaluate group differences on a classic functional test of proprioception with the ultimate goal of determining mechanisms of balance deficits in CP. Methods Participants included 52 children and young adults from 7-34 years, 19 with diplegic CP, 13 with hemiplegic CP (GMFCS Levels I-II), and 20 without disability. All stood with feet as close together as possible without contacting the edges of two adjacent force plates (Kistler, Winterthur, Switzerland). Three 20s trials with eyes open (EO) and eyes closed (EC) were performed. Full body kinematic and kinetic data were captured with a Vicon 612 System (Lake Forest, CA). Kinematic data were collected at 120Hz and force plate data at 1080Hz. A Woltring filter (predicted MSE value = 15) was applied to the trajectory data used to calculate the center of mass (COM) in Vicon Nexus. The force plate data were filtered with a bidirectional low pass Butterworth filter (cutoff frequency 6Hz). Center of pressure (COP) was calculated from the filtered force plate data in Visual3D (C-Motion, Inc., Gaithersburg, MD). The variables analyzed were: COM and COP velocity, excursion, and the difference between COM and COP in anterior-posterior (AP) and medial-lateral (ML) directions, and average COP location in the ML direction (sway asymmetry). ANOVA/ ANCOVA procedures and paired/unpaired t-tests were used to differentiate among groups (hemiplegia, diplegia or controls), conditions (EO, EC) or dominant/ non-dominant sides (p<0.05). Results In EO and EC conditions, both groups with CP had larger COM and COP excursion, COM velocity, and COM-COP difference (Fig 1) in the AP & ML directions compared to controls. A larger COM-COP difference indicates greater neuromuscular demand to maintain standing balance4. However, when controlling for the EO condition, ANCOVA revealed that groups did not perform significantly different during EC, indicating that the loss of vision had a similar effect on performance across groups. The group with hemiplegia had significantly larger COP AP and ML velocities than the control group. The COP ML velocities also tended to be larger in diplegia than controls, but did not reach significance (p = 0.062-0.065). Those
186

with hemiplegia were more asymmetric in stance with an average COP ML location of 17mm off center towards the dominant side, compared to <1.5mm for controls and diplegia (Fig 2).Figure 1. Average COM-COP difference (mm)
Figure 2. Representative stabilogram of groups showing predominant increase in AP sway in diplegia, with ML sway increasing more in hemiplegia. Cross represents center between feet showing asymmetry in hemiplegia.
DiscussionAlthough the hallmark of CP is motor dysfunction, there is increasing evidence of alterations in sensory pathways in this population5. Balance deficits with EO indicate multisystem sensory and/or motor loss with CP. However, the lack of difference with EC in CP sub-types, when controlling for EO, suggests that proprioceptive deficits were either not present or, if present, were not severe enough to alter group performance (negative Romberg) on a fairly simple motor task. Other factors such as postural weakness, spasticity and/or dystonia more likely contribute to the balance deficits seen in CP. This is the first report of static balance in hemiplegia showing marked asymmetry in stance and the highest sway velocities and excursions across groups with most parameters significantly different from controls.
References 1. Cherng RJ, Su FC, Chen JJ, Kuan TS. Am J Phys Med Rehabil. 1999;78(4):336-43. 2. Khasnis A, Gokula RM. J Postgrad Med. 2003;49:169. 3. Wingert JR, et al. 2009; Arch Phys Med Rehabil. 90(3):447-53. 4. Nault ML, et al. Spine. 2002;27(17):1911-7. 5. Wingert JR, et al. 2010 Human Brain Mapping (in press).
Acknowledgements: This work was supported in part by the intramural program at the NIH Clinical Center, United Cerebral Palsy Research Foundation, and NIH NRSA Grant.
187

�������������� ������������������������
�������������� ��������������������� �������������������� ������ �� �!"�#$�
��������
��������%����������� ��������������� �������%������ ������� ���&�'��� &���������� ����� ����� �&����� ���$������������&� �����������(�)�*�������� � �� � ����� ������� �������� &��� ����� ��+,-����.������������)�������������.���� ���� ��&����� ����/������������� ��� �&������������&��.�����&&������ �&� �� ����� ������0��� &����� � ����������� ����������� �����.�����������������.����������%���'������+1-���2� �����&�'��� &��� ��&�����&�����!��� ��2��+3-����.���������������.������������� � �����������'�+4-�&� �'����������5�� ������� ���&�'��� &����� � ������!��������������.��&��&���&���6����������%������� &��'��.�� �����&� �����������(�)�*�� ���� ��7�� � �����&� ����������������� �����&�� ������ ��� ��.��&������������������ ���&���������������������%����� ���2��������������%���'������� �!��� ��&����� ������������5�� &������)����7����� ����������� � �����������'�������������� &��'��.�� �������� ������.����� ���������������� ������� ������%���&������7�������)��������������������
��������������������������%����� �����%������������&� �'���������� �5�� ����� ������8�� �����'��� &������&�� &����� �&�� �&������������ ��������
!���� �������������&��%��9� �����&� �������������::�����&�������%����� ���'7�&���� � �� �� ������3����,;���������� ��.�������&��������������������������'7�&���.��9����������<����&�������.� ������ ��������������� ��&���������,����:������������&�����������������=,>�������.��������� �������������&�������9� �����&��.�����������&��&������&� ������������������ ����.���������������&��!��2��� ��'������'������'���������&������'��.�� ���'7�&���������������'�.��� �����6��������'7�&����� ��������� �� ��� �.���������'���������%������.������ ��%�� ������������ ��%�� ��!��2����'��%���������� ������&����'7�&�������&����������$�'7�&���.�����'��%������ ���� �� �����'������ � �����%��� �� ���� ����. �� �)�����9���?���������.���� ���6������ ���)@����������� �������� &���'��.�� �� ��&���
�����&�������������<����&������������ �������&��� �� ���������9����$!�����<��&������.�������������������� �� ������� ���������� &���������
�� ���� �����'��� &������������������ &��� ����� ��������. �� ������� �������)@������%�� ��!��������� &��� ����� �� �������.������ ���&� ����&������ ��%�� ��!������ ��
��������������
�������������
���������
������
�����
�����
�����
�����
�����
�����
�����
�����
�����
��������
����
����� �������!��
188

increases. Similarly, the average normalized margin of support, bN, decreases with age after age 5.5 years. Unlike either bN or DN, the trends with KN were not so prominent. At first, the average KN is quite low until age 5.5 where it suddenly increases until age 11.5 when it dips and then rebounds at age 15.5. This is a generally increasing trend, but the differences between the average KN at ages 6.5 and 15.5 are not significant. DISCUSSIONInitial comparison of the parameters bN and DN show very similar behavior as a function of age group as might be expected from parameters that are both derived from the COM. An increase in DN is reflective of an anterior shift in the COM. Therefore, as average DN
decreased with age, the COM shifted backwards with respect to the line of support as in Austad et al. [1] The hypothesized reason for this is that the subjects have a more upright posture as they get older. This decrease in forward tilt with age may be due to the fact that older children are stronger and can exert a more forceful pushoff [5][6], whereas younger children must rely on forward lean to maintain walking speed - essentially falling forward instead of pushing off. Due to its method of calculation, an increase in bN could be due to either increased forward tilt, or increased velocity. In contrast to the inverse correlation of bN
and DN values with age, there is a direct correlation between KN values and age. This seems to indicate a decrease in balance abilities as age progresses. The resolution of this paradox may be that older children make more motor control decisions and as a result have a smaller variability in the relative location of their COM. There are two ages at which significant changes occur in bN and DN: from 3.5 to 5.5, and from 13.5 onwards. The first corresponds to the maturity of gait in early childhood [7]. The second major change may be indicative of the onset of puberty and the associated strength increases. Additionally, the changes in muscle stiffness noted at this age may also play a role in ability to respond quickly and thereby be partly responsible for the increase in KN [8].CONCLUSIONSDynamic balance parameters DN and bN indicate a gradual posterior shift of the position of the COM with respect to the parameters' defined base of support as age increases. However this effect is more pronounced in DN due to its postural basis. The mild increase of KN with age is indicative of more pronounced variability in gait in older children, but this may be the result of a better ability to make adjustments to balance rather than an indication of balance loss. Finally, the largest changes in these parameters occur at the maturity of gait and at puberty.
REFERENCES[1] H. Austad, A.L.H. van der Meer. (2007) Exp Brain Res. 181: 289-295.[2] J. L. Huffman et. al. Gait Posture. (2009) 30 (4): 528-32[3] T. Niiler et al. (2007) (GCMAS) Springfield, MA.[4] A. L. Hof, et al. (2005) J. Biomech. 38: 1-8.[5] V. Gatev et al. J. Neurological Sciences. (1981) 52 (1) 85-90.[6] V.L. Chester & A.T. Wrigley. (2007) Clinical Biomechanics. 23 (2) 212-220.[7] D. H. Sutherland et al. (1988). The development of mature walking. Philadelphia: J.B. Lippincott. [8] Lambertz et al. (2003) J Appl Physiol 95: 64–72.
189

CENTER OF MASS - BASE OF SUPPORT INTERACTION DURING GAIT
Vipul Lugade and Li-Shan Chou Department of Human Physiology, University of Oregon, Eugene, OR, USA.
Email: [email protected]
INTRODUCTION Balance during gait is maintained by regulation of the center of mass (CoM) about the
supporting foot, with a safe trajectory of the swing foot providing precise end-point control (MacKinnon and Winter, 2003). Stable gait is achieved as a function of the CoM position and velocity (CoMv) at the moment of foot placement (Townsend, 1985). While past research has investigated the interaction of the CoM, CoM velocity and base of support (BoS) during stance, no analysis has been performed on the interaction of the CoM to the BoS during gait.
In order to maintain balance among walking machines, the CoM is maintained close to the center of the BoS. The stability margin, defined as the shortest distance of the center of gravity to the support polygon, is used as a measure of balance (Garcia, et al. 2003). Utilizing these measures of static balance, as well as the CoMv-BoS interaction to quantify dynamic balance, the purpose of this study was to examine the trajectory of the CoM in relation to the dynamically changing base of support among humans during gait. This interaction of the CoM, CoMv and BoS was further analyzed in healthy young adults, healthy elderly adults as well as elderly patients who reported gait imbalance.
CLINICAL SIGNIFICANCE During ambulation, the body is in a continuous state of imbalance, with each subsequent foot strike preventing a fall. With balance impairment, the ability to place the foot properly in order to capture the CoM and regulate the body’s velocity might be weakened. With falls being the leading cause of death among older adults, understanding the dynamically changing base of support and its interaction with the CoM might provide insights into the mechanisms of imbalance and possible intervention. METHODS Twenty healthy young adults (HY), 10 healthy elderly adults (HE), and 10 elderly fallers (EF) were recruited from the surrounding community. The elderly fallers scored 52 or less on the Berg Balance Scale and reported one or more falls in the year previous to the testing date. Subjects were asked to walk at a self-selected speed across a 10 meter walkway. Marker trajectories of 29 markers placed on bony landmarks were captured at 60 Hz using an 8-camera motion analysis system (Motion Analysis Corp., Santa Rosa, CA).
The BoS was defined throughout gait based on the configurations of both feet; whether at heel strike, foot flat, heel off and toe off. The boundaries of the base of support were identified using the heel and forefoot markers as well as the length and width of both feet (Fig. 1). Balance was defined as a combination of the following CoM and BoS interactions: 1) The shortest distance from the CoM to the base of support (when the CoM is located within the BoS this distance is referred to as the stability margin; when outside it is referred to as the CoM separation); 2) The distance from the CoM to the centroid of the BoS; and 3) The distance from the CoM to the base of support along the direction of the CoMv (Fig. 2). Measures (1) and (2) represent static CoM-BoS interactions, and (3) the dynamic interaction.
190

Figure 1: Base of support (black area) as defined by foot markers and gait events. RESULTS At heel strike, while the stability margin and distance to centroid was similar for all groups, HY demonstrated a greater CoMv distance to the border than both HE and EF (Fig 2A; Table 1). Similarly, at toe off, greater CoM separation and distance to the BoS centroid was demonstrated by HY when compared to both HE and EF (Fig 2B; Table 1). In addition, a larger CoMv distance to the border was shown by HY compared to EF.
Figure 2: Representative CoM and BoS position at heel strike (A) and toe off (B). The arrow represents the direction of the CoM velocity, with the dashed lines representing distances from CoM to BoS.
Table 1: Group averages (SD) for the CoM and the BoS interaction at heel strike and toe off. Gait Variable HY HE EF At Heel Strike CoM Stability Margin (cm) 3.5 (0.4) 3.5 (0.6) 3.9 (0.8) Distance to Centroid (cm) 2.2 (0.7) 2.2 (0.4) 2.5 (0.4) CoMv Distance to Border (cm) 23.0 (4.1) 18.7 (4.0) * 17.5 (2.6) * At Toe Off CoM Separation (cm) 12.4 (2.5) 10.4 (2.4) * 8.3 (2.4) * † Distance to Centroid (cm) 25.5 (2.6) 23.4 (3.0) * 21.4 (2.4) * CoMv Distance to Border (cm) 17.2 (3.7) 15.3 (6.7) 11.3 (4.0) * * Significant difference from HY (P < .05). † Significant difference from HE (P < .05). DISCUSSION/CONCLUSIONS
We have provided a means for calculating the base of support throughout gait, and identifying static and dynamic measures of balance control. While at heel strike all subjects demonstrated similar static balance control, HY demonstrated a greater amount of dynamic distance to the BoS boundary. This suggests that dynamic balance control during the transition to double limb support is better among HY. While the CoM is located outside the BoS at toe off, HY demonstrated a larger separation between the CoM and BoS for all three measures. This might be indicative of a more conservative gait pattern in HE or EF, or HY have a better ability to extend the CoM further outside of the BoS. REFERENCES Garcia, E. et al. Robotica. 2002; 20:596-606. MacKinnon, C. and Winter, D. J Biomech. 1993; 26(6):633-44. Townsend, M. J Biomech. 1985; 18(1): 21-38.
191

Balance and its role in the CP gait pattern.
Van Gestel L MSc1,2, Meyns P MSc2, De Cock P MD PhD3, Bruyninckx H Ir PhD4, Wambacq H.4, Molenaers G MD PhD5, Desloovere K PhD2,5
1Research assistant of the Research Foundation – Flanders, Belgium 2Department of Rehabilitation Sciences, Faculty of Kinesiology and Rehabilitation Sciences, KULeuven, Heverlee, Belgium 3Department of Neuropaediatrics, University Hospital Gasthuisberg, Leuven, Belgium 4Department of Mechanical Engineering, Production Engineering, Machine Design and Automation, KULeuven, Heverlee, Belgium 5Clinical Motion Analysis Laboratory, CERM, University Hospital Leuven, Leuven, Belgium
192

INTRODUCTION One of the primary motor deficits in children with Cerebral Palsy (CP) is an impaired balance. Although mature balance seems to be widely accepted as a key prerequisite for a normal gait pattern, it is not clear to what extent the impaired balance in children with CP is responsible for the typically observed gait deviations. This study artificially decreased balance in a group of CP children to evaluate the importance and impact of this motor feature on gait.
CLINICAL SIGNIFICANCE If the unique role of balance in CP gait is defined, then key gait parameters indicating underlying balance impairments can be used to identify children with CP whose gait pattern is mainly disrupted by an impaired balance. These children’s gait pattern might drastically improve by targeted balance training.
METHODS A group of 23 children with CP was selected for gait analysis in the Pellenberg Clinical Motion Analysis Laboratory. Inclusion criteria were: diagnosis of CP, 5-12 years of age, no history of surgery or recent BTX-A treatment. Their mean age was 9 yrs 10 months ± 2 months, there were 9 children with hemiplegia and 14 children with diplegia. All children first received full barefoot gait analysis (lower limb kinematics and kinetics, 8 camera vicon system, 2 AMTI force plates, PlugInGait markerset). Subsequently, extra gait trials were collected after enlarging the impact of balance on the gait pattern. Children therefore had to walk with their arms crossed in front of their chest. Since arm sway plays a significant role in maintaining balance, crossing the arms in front of the chest will decrease the balance1 and thus increase the impact of this deficit on gait. For every walking condition at least two trials with kinematics were registered. A control group of 16 age-matched typically developing (TD) children without any gait impairments was recruited as well. Their mean age was 9 yrs 1 month ± 4 months. These children underwent the same full barefoot gait analysis with the extra walking condition described above. 118 gait parameters per gait trial were extracted from the gait curves and compared between and within TD and CP gait for both the baseline and balance condition by a MANOVA (with posthoc Tukey).
RESULTS Walking with the arms crossed in front of the chest caused no to only very subtle changes in gait for healthy children. Consequently, only one gait parameter was found to be significantly altered by this manipulation: ankle plantarflexion velocity at push-off increased significantly (p= 0.02). However, in children with CP, several parameters were significantly altered by the manipulation of balance. Stride length, sagittal range of pelvic motion, sagittal range of hip motion and hip flexion velocity in swing decreased significantly in CP and the maximal knee extension angle was significantly delayed in the gait cycle. (Table 1)
193

Table 1: Mean (SE) of significantly changed gait parameters in CP gait when walking with arms crossed.Gait Parameters Baseline Decreased balance P-value Stride length 0.96 (0.02) 0.87 (0.02) <.0001 Sagittal ROM of the pelvis 8.05 (0.29) 7.01 (0.25) <.0001 Sagittal ROM of the hip 49.01 (0.84) 46.87 (0.98) 0.003 Hip flexion velocity in swing 222.96 (5.27) 202.20 (5.52) <.0001 Timing of max knee extension 35.14 (1.18) 40.03 (0.82) 0.01 ROM: range of motion, max: maximal
Furthermore, TD and CP children often adapted their gait pattern differently in response to the decreased balance. These differences in adaptation however, were mostly tendencies and only turned out to be significantly different responses for walking velocity, maximal plantarflexion angle at toe-off, range of hip rotation (Figure 1) and the above described parameters. All these parameters were decreased in children with CP in response to the decreased balance whereas healthy children maintained the same values or increased them.
Figure 1: Adaptation of the range of hip rotation in TD and CP children in response to a decreased balance during gait. (means +/_ SE)
DISCUSSION The manipulation of balance caused in general only disruptions or major changes in the gait pattern of children with CP. Healthy children barely responded to the manipulation. Crossing the arms in front of the chest resulted in a decreased balance in children with CP which caused them to take shorter steps, decrease their walking velocity and their range of motion in several lower limb joints. This might be an indication of a compensation mechanism for imbalance, called ‘fixation’. The children then try to ‘freeze out’ some degrees of freedom in their joints by fixating them in certain positions or by allowing only a decreased amount of joint motion enabling better control over their balance. Consequently, as they move through a smaller range of motion, they take smaller steps and walk slower. This study provides first evidence for potential key gait parameters that might be used for identifying children with balance problems underlying their gait pathology.
REFERENCES 1. Donelan JM, Shipman DW, Kram R, Kuo AD. Mechanical and metabolic requirements for active lateral stabilization in human walking. J Biomech 2004 Jun;37(6):827-35.
AKNOWLEDGEMENTS LVG received a PhD-fellowship of the Research Foundation Flanders.
Range of hip rotation movement
1719212325
Baseline Arms Crossed
Deg
rees
(°) TD
CP
194

Differences in the Walking Balance of Children with Cerebral Palsy and Typically Developing Children
Max J. Kurz, Wayne Stuberg, Brad Corr & Glen Ginsburg
Munroe-Meyer Institute for Genetics and Rehabilitation, University of Nebraska Medical Center, Omaha, Nebraska
E-mail: [email protected] Web: http://www.unmc.edu/mmi/ Introduction The musculoskeletal impairments seen in children with cerebral palsy (CP) can create disturbances in the voluntary control of the walking pattern. These disturbances may cause a loss of balance and falls if they are of sufficient magnitude [1]. Although it is readily evident that children with CP have balance impairments, metrics that can effectively identify the magnitude of the walking balance problems are strangely absent in the clinical literature. Floquet analysis is an engineering based analysis technique that has historically been used to evaluate the dynamic stability of mechanical systems such as automobiles and helicopters [2,3]. Recent experiments have demonstrated that floquet analysis may also be useful for quantifying the dynamic stability of human walking [4]. Floquet analysis evaluates the ability of the neuromuscular system to dissipate disturbances that arise from the interaction of the mechanical components of the limbs and errors in the stepping motor command. The walking pattern is considered to have greater stability if the disturbances are dissipated over a fewer number of strides. The feasibility of using floquet analysis for the assessment of the magnitude of the walking balance impairments seen in children with CP has not been explored. Furthermore, it is currently unknown if the rate of dissipation of the disturbances is related to the child’s ability to voluntary control their gross motor patterns. The purpose of this investigation is to fill this knowledge gap by exploring the clinical utility of floquet analysis for assessing the walking balance of children with CP. Statement of Clinical Significance Floquet analysis provides a metric for identifying the magnitude of the walking balance problems seen in children with CP. Furthermore, we show that the rate of dissipation of the disturbances that are present in the walking pattern is related to the child’s ability to voluntarily control walking, running, and jumping gross motor tasks. Therapeutic protocols that focus on improving these types of motor tasks may enhance the child’s walking balance. Methods Nine children with spastic diplegic CP (Age= 9.2 + 2 yrs.), and six typically developing (TD) children (Age = 8.8 + 2 yrs.) participated in this investigation. The children with CP had Gross Motor Function Classification levels of 1 or 2. Sections D (standing) and E (walking, running jumping) of the Gross Motor Function Measure (GMFM) were used to assess the motor abilities of the children with CP [5]. The participants walked on a treadmill for two minutes (CP = 0.76 + 0.08 m/s; TD = 0.81 + 0.03 m/s) while wearing their prescribed ankle-foot-orthosis. A three-dimensional motion capture system (120Hz) was used to determine the bilateral sagittal plane angular rotations of the lower extremity joints. The position data for all markers were filtered using a zero-lag Butterworth filter with a 6 Hz cut-off. A state vector (S) was created to define the attractor dynamics (Eq 1.) S(t) = [ 1,..., 6, ˙ 1,..., ˙ 6]T Eq 1.
195

where i represent the respective bilateral lower extremity sagittal plane joint angles (e.g., hip, knee and ankle), and ˙ i are the respective derivatives. The state space data were partitioned into their respective strides and were normalized to 101 samples. Poincare maps were created for every sample of the normalized stride, and the Floquet multipliers (FM) were calculated for each map [4]. The FM quantified the rate of dissipation of small disturbances that were present in the walking pattern. It was assumed that the mean ensemble (S*) represented the preferred joint kinematics, and deviations away from the mean from one stride (Sn) to the next (Sn+1) represented disturbances (Eq 2). [Sn+1 S*] = J(S*)[Sn S*] Eq 2. The rate of change in the state vector from one stride to the next was quantified by the Jacobian (J(S*)), and the FM were the eigenvalues of the Jacobian. The largest FM across the stride was used to quantify the dissipation rate of the disturbances present in the walking kinematics. A FM that was further away from zero signified poorer walking balance because it took more strides to dissipate the disturbances. Independent t-tests were used to discern differences in the FM of the children with CP and the TD children. Pearson product moments were used to determine if the FM for the children with CP were significantly correlated with the GMFM scores for sections D and E. Results There was a significant difference in the largest FM of the respective groups (CP = 0.81 + 0.11; TD = 0.69 + 0.05; p<0.03). Furthermore, there was a significant negative correlation between Section E of the GMFM and the FM calculated for the children with CP (r= -0.73; p<0.05). There was no correlation (r=-0.2; p>0.05) between the Section D of the GMFM and the FM values for the children with CP. Discussion The children with CP required more strides to dissipate the disturbances that were present in their walking pattern. This result partially explains why these children may have poor walking balance and a higher incidence of falls [1]. Our results also indicated that the ability to dissipate the disturbances is related to the child’s ability to voluntarily control dynamic motor tasks such as walking, running and jumping. The floquet multipliers were not related to the child’s ability to perform standing balance tasks (e.g., stand-to-sit, balance on one leg, etc.). This result further supports the notion that dynamic walking stability is not directly related to postural stability [6]. Furthermore, it highlights the notion that therapeutic protocols that are aimed at improving walking balance should focus on motor tasks that require dynamic balance as opposed to static balance. Floquet analysis is a novel method for identifying the balance impairments seen in children with CP. Further exploration of the utility of this analysis technique for assisting clinical decisions is warranted. References [1] Bjornson et al. (2007). Phys Ther 87 :248-257 ; [2] Oliver & Bikishkov (2001). J Am Helicopter Soc 46 :200-9 ; [3] Marghitu et al. (1997). Vehicle Sys Dynamics 28 :41-55 ; [4] Arellano et al. (2009). J Exp Biol 212 :1965-1970 ; [5] Russel et al. (1989). 31 :341-52 ; [6] Kang & Dingwell (2006) Exp Brain Res 172:35-48.
196

Standing in children with bilateral cerebral palsy
Cecilia M. Lidbeck MSc PT1,Elena Guiterrez-Farewik1,2, Eva Broström PHD PT1, Åsa
Bartonek PHD PT1*
1Dept. of Woman and Child Health, Karolinska Institutet, Stockholm, Sweden
2KTH Mechanics, Royal Institute of Technology, Stockholm, Sweden
197

Introduction During quiet standing, postural orientation means that the body segments must be aligned with respect to the earth vertical and the positioning of the body segments should be such that the projection of the centre of gravity remains inside the base of support for maintaining equilibrium. Standing in children with cerebral palsy (CP) has mostly been presented in terms of postural control. To our knowledge however there are no studies describing standing in kinematic terms. The aim of this study was therefore to describe body segment orientation during quiet standing in children with CP.
Clinical Significance This study can lead to better understanding of the children’s ability to position her/himself in standing and of each child’s individual solution in dealing with gravity. It can also show the variability among children with bilateral spastic cerebral palsy to organize their standing position and contribute to an analysis of need of individual external support during standing.
MethodsTwenty-six children with bilateral CP, mean age 11 (SD 3) years, with GMFCS level I in 3 children, II in 9, III in 11 and IV in 3 children participated in the study. Inclusion criteria were ability to stand for at least 30 seconds. Fifteen children stood without support (CP-Group I), and 11 children used a bar for hand support (CP-Group II). Nineteen healthy children constituted a control group. The study was approved by the local Ethics committee and informed consent was obtained from participants and their parents.
All children underwent a whole-body motion analysis with 34 reflective markers attached to anatomical landmarks. Standing posture was recorded during 20 seconds. Non-parametric statistics were used to calculate differences between the more and the less weight-bearing limb and to compare segment and joint angles between the two CP groups.
ResultsSymmetry in standing Asymmetric weight-bearing during standing was observed in 19 children in the entire CP group. In the entire CP group, the more weight-bearing limb showed significantly more knee extension; 34°(SD 27°) versus 38° (SD 26°, p=0.014), as well as less ankle dorsiflexion; 12° (SD 17°) versus 15° (SD 18°, p=0.02) than in the less weight-bearing limb. In the CP-Group I, the more weight-bearing limb showed significantly more knee extension; 16° (SD13°) versus 23° (SD15°, p=0.015) than the less weight-bearing limb. In the CP-Group II there were no differences with respect to symmetry. The more weight-bearing limb of the children in the CP groups was chosen for further analysis. Among the children with no asymmetry, and in control children, the right limb was chosen.
In the control group a significant difference between sides of 2° was seen in the average hip flexion angle, but was interpreted to be of no clinical relevance.
Segment and joint angles in the more weight-bearing limb during standing In the CP-Group I versus the CP-Group II, the trunk was significantly more anteriorly tilted (p=0.026), the hips more flexed (p=0.005), and the knees more flexed (p= <0.001) (Fig.1).
198

-20
0
20
40
60
80
100
Trunk Pelvis Hip Knee Ankle
D
egre
es Controls
CP-Group I
CP-Group II
Figure 1. Segment and joint angles (mean, SD) in the more weight bearing limb. Trunk; anterior tilt (+), posterior tilt (-). Pelvis; anterior tilt (+). Hip; flexion (+). Knee; flexion (+),extension (-). Ankle; dorsiflexion (+).
Segment and joint movement in the more weight-bearing limb during standing Greater range of movement during the data collection duration was observed in the CP-Group II than in Group I at the pelvis (mean 5°, SD3° versus 3°, 2° ,p=0.012), hip (mean 12°, SD 6° versus 5°,4°, p=0.009) and knee (mean 12°, SD 6° versus 5°, 3°, p=0.001) (Fig. 2).
0
5
10
15
20
25
Trunk Pelvis Hip Knee Ankle
Deg
rees Controls
CP-Group ICP-Group II
Figure 2. Segment and joint range of movement (mean, SD) during the testing duration in the more weight- bearing limb.
DiscussionIn this study the children were grouped according to their ability to stand independently or to use hand support. In both CP groups we found increased flexion angles during quiet standing possibly reflecting the children’s difficulty to align their body segments. The increased segment and joint motion during standing, in particular in CP-Group II, may indicate the difficulty to maintain the position with respect to gravity.
References Horak and MacPherson 2008, Massion and Woollacott 2004
Acknowledgements This study was supported by the Siftelsen Frimurare Barnhuset, Sällskapet Barnavård and Promobilia in Stockholm, Sweden. We would like to thank all children and their parents for participating in this study.
199

ODD POSTERSPoster # Topic Abstract 1st Author1 Case Presentations Limb Salvage Surgery Versus Transtibial Amputation: A Case Study Jenna D. Montgomery3 Case Presentations Effects of Aquatic Therapy in Ankylosing Spondylitis: A Case Study Paulo Roberto Garcia
Lucareli5 Balance Static and Dynamic Posturography of Normal and Deteriorated Balance Control Systems Hamed Ghomashchi7 Balance Impact of Task Constraint on Posutral Adaptation by Children with Diplegic Cerebral Palsy and
Typically Developmenting ChildrenRong-Ju Cherng
9 Balance Vestibular Influence on Whole Body Rotation in Children with Cerebral Palsy Maurizio Petrarca11 Balance Biomechanical Model of Postural Control for the Analysis of Adolescents with Idiopathic Scoliosis Susan A. Riedel
13 Balance The Physiological Effects of Balance and Balance Confidence Jody L. Riskowski15 Balance Effects of an Integrated Functional Fitness BOSU Exercise Program on Postural Stability and
Gait in Older Women: Preliminary ResultsJinsup Song
17 Balance Walking in a Moving Virtual Corridor with Variable Width Size affects Step Width Control Ka-Chun Siu19 Balance Impaired Dynamic Postural Stability Following a Concussion Thomas A. Buckley21 Balance Analysis of Static Balance in Individuals with Cerebral Palsy Submitted to Neuromuscular Block
and Functional Electrical StimulationClaudia Santos Oliveira
23 CP Gait The Functional Effect of a Distal Rectus Femoris Lengthening in Adults with Cerebral Palsy Lisa Cannegieter25 CP Gait Clinically versus Dynamically Measured Maximum Angular Velocities Damien Kiernan27 CP Gait Does the Gluteus Medius Contribute to Pelvic and Hip Rotation in Cerebral Palsy? Rory O'Sullivan29 CP Gait A Retrospective Study into the Strength Profiles of Ambulant Children with Cerebral Palsy
Undergoing Single-Staged, Multi-Level Orthopaedic SurgeryAanchal Kejriwal
31 CP Gait A New Approach To Stiff Knee Gait In Spastic Cerebral Palsy James W. Fee, Jr.33 CP Gait Daily Step Count in Children with Cerebral Palsy: Relation to Clinical Function Tests Anita Bagley35 CP Gait The Effects of Ankle Foot Orthoses on Center of Mass Mechanics and Work during Gait in
Children with Cerebral PalsyBradford C. Bennett
37 CP Gait Development of Calcaneal Gait without Prior Triceps Surae Lengthening in Patients with Static Encephalopathy
Susan Rethlefsen
39 CP Gait The Relationship Between Arm Posturing and Gait Deviation in Teenagers and Young Adults with Spastic Hemiplegic Cerebral Palsy
Jacques Riad
41 Foot & Ankle Changes of Boys Feet Dimensional Proportionality with Age Tsatsral Byambadorj43 Foot & Ankle Comparison of Dynamic Foot Motions between Children with Typically Developing Feet and
Children Previously Treated for Unilateral Club Foot DeformitiesHank White
45 Foot & Ankle The Ponseti Approach versus Traditional Orthopaedic Management for Children with Talipes Equino Varus: Preliminary Results
Brona McDowell
47 Foot & Ankle Principal Components Analysis to Assess Plantar Loading in Patients with Midfoot Arthritis and Matched Control Subjects
YenWei Chen
49 Foot & Ankle Quantification of Ankle 3D Kinematics: A Simplified Protocol Rita Stagni51 Foot & Ankle Technique for Assessing Foot Kinematics and Plantar Soft Tissue Stiffness during Stance for
Varying Arch StructuresCarolyn Roposh
53 Foot & Ankle Comparison of Six-Segment-Foot Movements between MRI and Motion System in TD Children Xuecheng Liu
55 Foot & Ankle The Influence of Heel Height on Frontal Plane Ankle Biomechanics: Implications for Lateral Ankle Sprains
Alicia Foster
57 Foot & Ankle Plantar Pressure Analysis Repeatability: Use of Motion Capture Markers for Automated Division of the Foot
Adam Miller
59 Foot & Ankle The Relationship between Foot Kinetics and Kinematics during Gait in Children with Cerebral Palsy and Triceps Surae Contracture
Derek Curtis
61 Muscles and EMG Stair Descent Performance in Older Women: Changes in Kinetic Profile and Muscle Activity Following Power Training
Anders Holsgaard-Larsen
63 Muscles and EMG The Use of the Velocity-Dependent Muscle Activation Index to Detect the Effect of Botulinum Toxin A n the Medial Gastrocnemius
Oren Tirosh
65 Muscles and EMG Development of Quantitative Evaluation of EMG Consistency Among Spinal Cord Injured Persons during Treadmill Stepping with Body Weight Support
Peter M. Quesada
67 Muscles and EMG The Influence of Heel Height on Pelvis Kinematics and Trunk Muscle Activity during Gait Yi-Chen Chou69 Outcomes Outcomes of Multi-Level Surgery with and without an External Femoral Derotational Osteotomy
in Children with Cerebral PalsyMark McMulkin
71 Outcomes �Quantitative Home Assessment of Mobility in Parkinson s Disease Cristiane Zampieri-Gallagher
73 Outcomes Goal Attainment Scale Outcomes for Ambulatory Children: With and Without Orthopedic Surgery Andi Gordon
75 Outcomes Efficacy of Clinical Gait Analysis: A Systematic Review Tishya Wren77 Pathologic Gait Simplification of Gait Measures and Lower Extremity Alignment Measures Among Runners With
and Without Medial Tibial Stress SyndromeSae Yong Lee
79 Pathologic Gait Gait Analysis in the Clinical Path for Functional Surgery of Foot in SCI Patients Maria Grazia Benedetti81 Pathologic Gait Walking Gait Characteristics of Individuals with Dementia: A Signal Detection Approach. Tasos Karakostas83 Pathologic Gait Anti-Trendelenburg Gait: Classification and Etiology in Children Böhm85 Pathologic Gait Effects of Osteoarthritic Knee Alignment on Stair Negotiation Michelle Varnell87 Pathologic Gait Simultaneous Multisegment Foot Kinematics Kinetics and Plantar Pressure Analysis in
Rheumatoid ArthritisZimi Sawacha
89 Pathologic Gait Automatic Detection of Subjects at Risk for Diabetic Foot through Gait Analysis zimi sawacha91 Pathologic Gait Kinematic Gait Variability is Altered in Multiple Sclerosis Patients Jessie Husigna93 Pathologic Gait The Configuration of the Joints of the Lower Limbs in the Frontal Plane in the Gait of the
Overweight and Obese ChildrenElzbieta Pretkiewicz-Abacjew
95 Pathologic Gait Gait Adaptation in Visually Impaired Subjects Reflects a Cautious Walking Strategy Ann Hallemans
200

ODD POSTERS
Poster # Topic Abstract 1st Author97 Pathologic Gait A New Test of Hip Abductor Strength Krista ColemanWood99 Pathologic Gait Altered Inter-Joint Coordination during Walking in Patients with Total Hip Arthroplasty Li-Shan Chou101 Pathologic Gait Outcomes with Gait Analysis of Limb Reconstruction for Severe Forms of Fibular Hemimelia Jennifer McCahill
103 Pathologic Gait Comparison of Gait Energy Cost between Aquatic and Overground Treadmill Walking in People Post-stroke
Yoshimasa Ozaki
105 Pathologic Gait Gait Impairment in PAD Patients is Independent of Level of Disease Neil B Huben107 Pathologic Gait The Relationship Among Pain, Structure, and Function of the Knee in Patients with Medial Knee
OsteoarthritisBecky Avrin Zifchock
109 Prosthetics and Orthotics
3D Gait Kinematics of Transtibial Amputees Walking in Every-day-life Environments: Reliability Study of a Protocol Based on Inertial & Magnetic Sensors
Michele Raggi
111 Prosthetics and Orthotics
The Effect of Turning Gait on Coronal Plane Ankle Moments in Transtibial Amputees and Non-amputees
Ava Segal
113 Prosthetics and Orthotics
Vertical Ground Reaction Forces during the Sit-to-Stand and Stand-to-Sit Activity in Transtibial Amputees
Vibhor Agrawal
115 Prosthetics and Orthotics
Gait Kinematic and Kinetic Characteristics in Patients with Patellofemoral Pain Syndrome Six Months After Reoperation Following Total Knee Arthroplasty
Gapeyeva Helena
117 Quality Assurance & Treatment Decision Making
A Spot Check for Estimating Inertial and Magnetic Sensors Errors Andrea Cereatti
119 Quality Assurance & Treatment Decision Making
Markerless Motion Tracking for Assessment of Robot Assisted Gait Rehabilitation Jochen Radmer
121 Quality Assurance & Treatment Decision Making
Assessing a Mechanics-based Approach to the Treatment of Crouch Gait Jennifer Hicks
123 Simulation and Modeling
Determinants of Slip-Related Balance Recoveries - A Gait Simulation Approach Arash Mahboobin
125 Simulation and Modeling
Muscle Compensation Strategies with Plantarflexor and Dorsiflexor Activation Impairment Brian A. Knarr
127 Simulation and Modeling
Comparison of Two Methods for Estimating Hip Joint Parameters during Stair Ambulation Samantha M Reid
129 Simulation and Modeling
Subject-Specific Characterisation of Lower Limb Anatomy for Gait Simulation and Modelling Katja Oberhofer
131 Simulation and Modeling
Adolescents with Idiopathic Scoliosis Spinal Range of Motion Pre and Post- Spinal Fusion Compared to Age-Matched Controls
Adam Graf
133 Simulation and Modeling
Midterm Functional Assessment of the Sit-Stand-Sit Task Following a Total or Resurfacing Hip Arthroplasty
Manoshi Bhowmik-Stoker
135 Simulation and Modeling
Kinematic Coupling between the Sagittal and Transverse Planes of the Knee for Male and Female Healthy Individuals during Everyday Activities
Kristamarie Pratt
137 Simulation and Modeling
A Novel Biofeedback Device for Hip Arthroplasty Patients Ewan Law
139 Simulation and Modeling
Shoulder Joint Dynamics during Walker-Assisted Gait Katherine Konop
141 Simulation and Modeling
A New Wireless Inertial Sensing Device to Track Human Motion: Preliminary Assessment on Elementary Exercises
Maria Grazia
143 Simulation and Modeling
Identifying Phases of Gait Using Image Flow Nalini Vishnoi
145 Simulation and Modeling
Comparison of Markerless and Marker-based Motion Capture Technologies through Simultaneous Data Collection during Gait
Elena Ceseracciu
147 Sports Stiffness Characteristics of Neutral Cushion Running Shoes during Long-term Mechanical Fatigue
Eve Hoffman
149 Sports The Effect of Exertion on Gluteus Medius Fatigue in Female Runners with and without Iliotibial Band Syndrome
Allison M. Brown
151 Sports Landing Strategies Focusing on the Rotatory Control of Knee Joints in Patients with ACL Reconstruction, Basketball Players, and Healthy Controls
Wen-Ling Chen
153 Typically Developing Studies
Analysis of Running Kinematics, Kinetics and Electromyography in Typically Developing Children Roy A. Wervey
155 Typically Developing Studies
Evaluation of Asymmetry in Muscle Activity and Ground Reaction Force during Sit-to-Stand and Stand-to-Sit in Asymptomatic Subjects
David R Burnett
157 Typically Developing Studies
Lifestyle Factor Influences on Ambulatory Activity in Youth and Adults Teri Rosenbaum-Chou
159 Upper Extremity Upper Limb Kinematic Characteristics in Children with Hemiplegic Cerebral Palsy and Typically Developing Children
Jaspers Ellen
161 Upper Extremity Effects of Different Crutches and Arm Dominance on Shoulder Joint Kinetics Kunal Singhal163 Upper Extremity 3D Motion Analysis on Daily Living Activities: Implication in Neurorehabilitation Ursula Costa165 Upper Extremity Normative Data of Kinematic Upper Extremity Tasks: Age Dependent Changes M.Syczewska
201

202
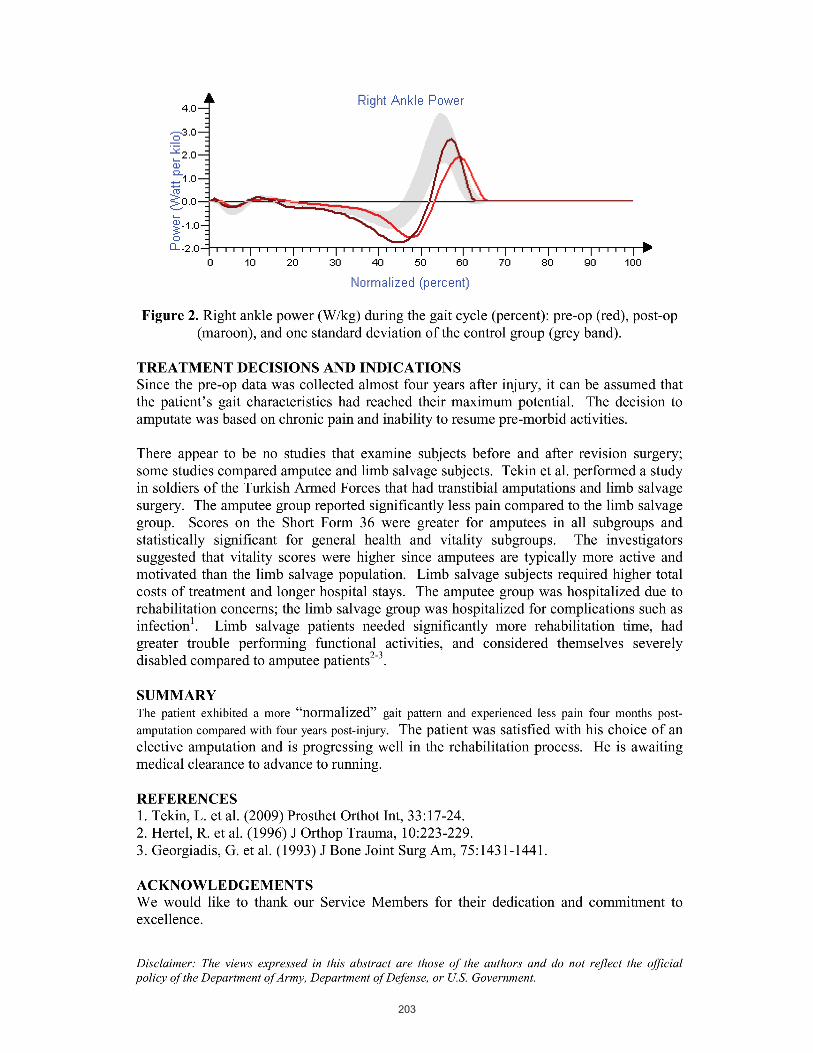
203

Effects of Aquatic Therapy in Ankylosing
Spondylitis: A Case Study
Gimenes, RO1; Lucareli,PRG2,3; Dumangin, FA1; Angelini, MMP1; Pantaleão MO1. 1 Professor of Centro Univesitário São Camilo, Physical Therapy Department 2 Physical Therapy Department - Health and Science Institute - Universidade Paulista – São Paulo – Brazil. 3 Einstein Movement Analysis Laboratory – Hospital Israelita Albert Einstein - São Paulo - Brazil 4 Physical Therapy Post Graduate Student. INTRODUCTION Ankylosing spondylitis (AS) is a systemic inflammatory rheumatic disease, progressive, whose main feature is the bone fusion of the spine, affecting mainly the joints in the region of the axial skeleton and sacroiliac joints, resulting in immobility and rigidity. It can also affect other joints such as shoulder, wrist, hip, knee and ankle. The patient with AS suffers some structural changes in the spine that begin early and are progressive, leading the patient to adopt a posture called "skier's stance" may be associated with significant functional limitation and impaired quality of life. OBJECTIVE The objective of this study was to assess the benefits of an aquatic therapy program developed for a patient with AS, assessing pain, muscle strength, range of motion, and gait of a patient with 28 years old, males and sedentary. CLINICAL CASE The individual studied was diagnosed with AS for 2 years, performing drug treatment since shown stiffness accompanied by pain, and occasionally inflammation of the insertions of ligaments, joint capsules and tendons, hindering their mobility. Displays commitment in the joints of the cervical and sacroiliac joints, lumbar lordosis, thoracic kyphosis accentuated and the head forward. These changes have established beyond compromise their quality of life, leading to abnormal gait, which occurred in relation to the ankle, the progression angle of the foot in medial rotation bilaterally, inadequate pre-positioning of the feet in the initial contact, excessive dorsiflexion at initial contact to the right, reduced plantar flexion in pre-swing bilaterally, and excessive dorsiflexion during the swing phase, in relation to the knee, there was a slight increase in flexion during stance phase, inadequate hip abduction during the whole cycle and increased antevertion throughout the cycle. The treatments were included 2 months and 2 weeks, totaling 20 sessions, 2 times a week for 50 minutes. The patient underwent a physical examination, it was stated range of motion by goniometry, a physical assessment by testing muscle strength, visual analogue scale (VAS) for his pain, and ultimately was checked by running a three-dimensional analysis beyond comparative Gait Deviation Index (GDI). All instruments were applied at the beginning and end of the treatment of aquatic therapy. This treatment was chosen because studies show that the aquatic environment seems to be the best alternative for rehabilitation of the AS, because it promotes greater relaxation, reduced impact of the exercises and joint overload, and increase range of motion and assist in the maintenance or reduction of the table painful, thus promoting the adequacy of the march.
204

The three-dimensional gait analysis was collected using 8 Falcon Motion Analysis cameras in São Camilo/INSTRUCOM laboratory and complements the use of assessment tools to be considered a way of highlighting the effects of aquatic therapy on mobility and movement of the patient evaluated. Because their results are presented in a specific and detailed three-dimensional kinematics of the joints of the pelvis, hip, knee and ankle, by obtaining three-dimensional images due to a set of cameras that capture the situation of marked placed on anatomical points already selected, which estimates the position of joint centers and calculates the three-dimensional kinematics. Data from the instruments of the initial evaluation were analyzed and it was developed a protocol for aquatic therapy which involves therapeutic measures that would reflect the involvement observed in our patient. The specific treatment consisted of stretching global assets and liabilities, gait training with changes of direction, against the turbulence (front, back, side, and decoupling-girdle), active exercises with the repetition of movements for 10 joint groups defined, some positions of Water Pilates method, muscle strengthening with the use of water floats and weights, and ending with the therapy method Watsu. We obtained results in improved muscle strength in the plantar flexors, there was increased range of motion in all joints and the most significant improvement in the hip, knee, ankle, spine and neck and shoulder on the VAS scale patient reported decreased pain in the lumbar spine, cervical spine and shoulder region, and the gait analysis was observed in Gait Deviation Index (Pre/Post treatment Left Side = 72.8/80.81 and Right Side = 60.58/77.72) an improvement in the ankle range of motion, a reduction of the medial progression angle greater on the right, increasing the plantarflexion during pre-swing bilaterally and dorsiflexion during the swing bilaterally. No changes on knee joint were noted. The right hip abduction and pelvis anteversion decreased in gait cicle. We conclude that the aquatic therapy program was beneficial for the patient with AS, improving muscle strength, with a reduction of pain, and therefore taking the adequacy of the gait, showing that aquatic therapy is a valuable resource to reduce symptoms of ankylosing spondylitis in this patient. Keyword: Ankylosing Spondylitis, Aquatic Therapy, Gait analysis, Rehabilitaton.
205

Static and dynamic posturography of normal and deteriorated balance control systems
Sanaz Rajabali 1, Hamed Ghomashchi2*, Ali Esteki 3
1MSc. Biomechanical Engineering, Faculty of Biomedical Engineering, Islamic Azad University, Tehran Science and Research Branch, Tehran, Iran
2Faculty Member, Faculty of Mechanical Engineering, Islamic Azad University Qazvin Branch, Qazvin, Iran 3Professor of Biomedical Engineering, Department of Medical Physics and Engineering, Shahid Beheshti University
(Medical Campus), Tehran, Iran Introduction Balance control during quiet standing is one of the essential activities that human learn in childhood and perform at subconscious level. Despite its apparent simplicity, the task of maintaining an upright posture involves a complex sensorimotor control system. Various mechanisms and neurophysiologic sensory systems including visual, vestibular, and somatosensory systems contribute to our stability during quiet standing and respond to internal or external perturbations in a synergetic manner. Clinical Significance With regards to synergetic approach, balance can be broken down into three aspects: steadiness, symmetry, and dynamic stability. All of these components of balance have been found to be disturbed following deterioration of postural control system [1]. Characterization of postural control system outputs may improve our understanding about interactions between components to achieve postural balance. Method Participants: In this study, with the aim of investigation of normal and deteriorated postural control systems, two distinctly different groups were considered. Postural control system of healthy young adults was considered as the normal and of elderly stroke patients with severe balance disorders was considered as the deteriorated postural control system. 33 stroke patients (18 male and 15 female) with a first hemispheric intracerebral infarction or hematoma with less than one year post stroke time with the age of 40~75 years old and 30 healthy young adults (17 male and 13 female) with the age of 20~35 years old participated in the experiment. There was no significant difference between BMI indexes of two groups. Instruments: postural steadiness and limb load asymmetry during quiet standing were examined using a dual force platform and dynamic stability was assessed using the Biodex stability system (BSS). The BSS uses a circular platform that is free to move about the anterior posterior (AP) and mediolateral (ML) axes simultaneously. Rather than measuring the deviation of the COP during static conditions, this device measures the degrees of tilt about each axis during dynamic conditions. Since it is unclear how the time series of degrees of tilt about each axis relate to COP fluctuations and how the ankle, knee and hip joints movements affect the movement of circular platform, the time series are considered as the reflection of coordination of body segments during unstable standing (interaction of internal and external perturbations) or dynamic stability. Data Collection: the COP coordinates were captured 20 seconds for
* Corresponding author: Address: Room 419, Department of Mechanical Engineering, Islamic Azad University Qazvin Branch, Qazvin, Iran Tel: +98 912 6073741 Fax: +98 281 3670051 E-mail: [email protected]
206

evaluating postural steadiness and 65 seconds for limb load asymmetry test with 100 Hz sampling frequency. Tilting of circular platform along both directions were sampled 30 seconds with 1 KHz sampling frequency. Measures: various posturographic measures in time domain (i.e. path length, postural variability, sway range, mean sway velocity, sway area) and frequency domain (i.e. total power, median, centeroid and maximum frequencies, frequency of 99% of total power) were calculated for both steadiness and dynamic stability time series. Normalized limb load asymmetries were calculated 5 seconds and also 65 seconds after starting the test to investigate the effects of prolonged standing on limb load asymmetry. Results Sway parameters of both static posturography and dynamic stability analyses were significantly different between groups except in some cases (AP and ML median and maximum frequencies and AP centeroid one in static posturography analysis). Time domain sway parameters were higher in deteriorated postural control system whereas the frequency measures of postural oscillations were lower comparing to that of normal controls. The results indicated postural variability and sway range are the most sensitive stabilometric parameters. Our findings also indicated that in both normal and deteriorated postural control systems, AP and ML static posturographic measures were significantly different in time and frequency domains (except median frequency of deteriorated one) also there were significant differences between AP and ML dynamic stability measures (except centeroid and maximum frequencies) of normal control system, but there were no significant differences between AP and ML time domain dynamic stability measures as well as total power of deteriorated one. Limb load asymmetry was higher in deteriorated postural control system in comparison with the normal one, but there were no significant differences between asymmetries of both groups one minute after starting the test. Discussion The results of this study are generally in agreement with the findings of Perieto [2] and Maki et al. [3]. Increase of sway range is the clinical symptom of deterioration of postural control system and postural instability, but in this study we showed that several measures in time and frequency domains from different examinations (each corresponds a feature of postural control system) also can be used as the pathological criteria. In dynamic stability test, one encountered with an interacting loop of internal and external perturbations and should maintain its stability in a more complex situation, so the measures calculated from dynamic stability time series are more sensitive comparing to the same measures calculated from postural steadiness time series. Limb load asymmetry also can be used as discriminating criterion but this factor is not sensitive enough when the postural control impairment does not much affect weight symmetricity. References [1] Nichols, D. S. (1997). "Balance retraining after stroke using force platform biofeedback."
Physical Therapy 77(5): 553-558. [2] Prieto, T. E. (1996). "Measures of postural steadiness: differences between healthy young
and elderly adults." IEEE Transactions on Biomedical Engineering 43(9): 956-966. [3] Maki, B. E., P. J. Holliday, et al. (1990). "Aging and postural control: A comparison of
spontaneous and induced sway balance tests." J. Amer. Geriatr. Soc. 38: 1-9.
207

IMPACT OF TASK CONSTRAINT ON POSUTRAL ADAPTATION BY CHILDREN WITH DIPLEGIC CEREBRAL PALSY AND
TYPICALLY DEVELOPMENTING CHILDREN
Yun-Huei Ju1,2 Rong-Ju Cherng2, 3*
1Faculty of Physical Therapy, College of Health Sciences, Kaohsiung Medical University
2Institute of Allied Health Sciences, College of Medicine, National Cheng Kung University
3Department of Physical Therapy, College of Medicine, National Cheng Kung University
IntroductionSeated reach tasks occur every day in life, such as reaching for a toy. Postural control embeds in reach tasks [1]. In addition, task context might affect children’s motor performance [2]. Children with different postural control abilities might adapt different motor strategies to attain successful reach task and stabilize themselves concurrently as perceiving different task context. The purpose of this study was to explore the impact of task constraints on children’s postural adaption in terms of center of pressure (COP) displacement.
Clinical significance The results may help with the assessment for postural control of seated reaching task in children with spastic diplegic cerebral palsy
MethodChildren with cerebral palsy (CP) and typical development (TD) participated in the study. Two force plates (beneath chair and feet) were used to capture children's motor performance at a sampling rate of 150 Hz. They were asked to perform a reach out and return task in a seated position on a chair. Three targets were set a distance of 120% arm-length in 3 locations respectively (anterior, medially, and laterally). The reaching speed was modulated by a metronome at a rate of 46 beats/min. All force and COP data was rotated to a local coordinate system for comparison of group and task conditions. Movement time (MT), absolute maximum amplitude of force (AP & ML direction), and maximum COP excursion (AP & ML) were calculated during reach-out phase in 3 directions. In addition, mean force values (AP) were calculated in acceleration and deceleration segments during reach out.
Result and Discussion Children with CP demonstrated longer MT of COP than children with TD did. They showed greater AP and ML force than children with TD did (group: chair, F=4.88, p=0.008; feet, F=5.17, p=0.006). Direction effect of chair force data (AP) revealed in children with CP, not TD. Contrastively, children with TD showed adapted amplitude of feet force as changing task directions. Children with CP likely adapt peak AP force of trunk-pelvis segment (chair data) to fit in task demanding. However, children with TD utilized different peak force of feet to adapt different directional demands. Children with CP also adapted tasks differently in terms of max. amplitude of COP_AP excursion. The group*direction effect existed in chair data (AP: F=8.64, p=0.001; ML: F=5.41, p=0.011). Children with CP showed max. amplitude of
208

COP_AP at med40 reach, but children with TD did so at lat40 reaches. According to max. amplitude of COP_ML excursion, children with CP showed great value with minor adjustment, but children with TD showed gradual adaptation with reduced amplitude in three reach conditions. Probably, they acted balance threats imbedding in task demands in their own way due to constraints of postural adaption ability. We further plot mean AP force with acceleration and deceleration segments defined by hand reach velocity profile. Children with TD showed clear posterior force trend (pushing) during acceleration segment and oscillated AP force around zero during deceleration segment in chair data (See Figure 1, Appendix). However, children with CP showed wide variability of force adaptation. An insufficient interplay between AP forces during 2 segments was observed. This finding is similar with Näslund’s result [3].
References [1] Westcott SL and Burtner PA (2004) Phys Occup Ther Pediatr, 24: 5-55. [2] Newell KM (1986) in Motor Development in Children: Aspects of Coordination and Control (eds MG Wade and HTA Whiting), London: Martinus Nigkoff, pp341-361.[3] Näslund A, Sundelin G, and Hirschfeld H (2007) J Rehabil Med, 39: 715-723.
Acknowledgements The study was supported by a grant from National Science Council, Taiwan. We also thank all the participating children and their family.
[3]••Näslund••A,••Sundelin••G,••and••Hirschfeld••H••(2007)••J� ••
Figure 1. Box and whisker plots of group median AP force value derived from individual participant’s mean AP force during acceleration and deceleration segments.
Task Directions
TD group
ant lat40 med40 ant lat40 med40-10
-5
0
5
10Acceleration segment Decceleration segment
Post
erio
r (pu
shin
g)
A
nter
ior (
brak
ing)
CP group
ant lat40 med40 ant lat40 med40
mea
n A
P fo
rce
(% o
f bod
y w
eigh
t)
-10
-5
0
5
10
209

210

211

Biomechanical Model of Postural Control for the Analysis of Adolescents with Idiopathic Scoliosis
K.D. Bustamante Valles1,6, J.T.Long1,3,4, A.M. Sovol3, S.A. Riedel5, A. Graf2, J. Krzak2, M. Riordan2, K. Zaharski1, S. Hassani2, P.F. Sturm2, and G.F. Harris1-4
1Orthopaedic and Rehabilitation Engineering Center, O.R.E.C., Milwaukee, WI 2Shriners Hospital for Children, Chicago, IL 3Department of Biomedical Engineering, Marquette University, Milwaukee, WI 4Department of Orthopaedic Surgery, Medical College of Wisconsin, Milwaukee, WI 5Department of Electrical and Computer Engineering, Marquette University, Milwaukee, WI 6Instituto Tecnológico y de Estudios Superiores de Monterrey(ITESM), Chihuahua Campus, Chihuahua, Mexico Introduction: This study employs a biomechanical model for bi-planar analysis (anterior-posterior, medial-lateral) of postural control to compare typically developing children and adolescents with idiopathic scoliosis (AIS). The model provides an intuitive method for assessing balance by comparing a small number of computed model parameters rather than the typically large number of sway metrics calculated from experimental data. Clinical Significance: Postural control assessment can be used to characterize the way signals from the vestibular, visual, and somatosensory systems are integrated by the central nervous system [1]. Postural control data is acquired from subjects standing on a force plate and using measured forces and moments from the force plate to calculate the subject’s center-of-pressure (COP) [2]. The COP data is then used to calculate both time-domain and frequency-domain metrics that represent balance, with recent studies reporting 34 different calculated metrics [3,4]. The model reported here is described by only 6 parameter values, three in each plane, providing a more concise description of balance strategies. Methods: Biomechanical models of posture control often employ an inverted pendulum with a single link segment limited to the AP plane [5]. Ours is a bi-planar model of AP and ML sway, shown in block diagram form in Fig. 1, consisting of an inverted pendulum with proportional-integral-derivative (PID) control in each plane. In the inverted pendulum model J is the moment of inertia, m is body mass, h is body height and g is gravity. Disturbance torque is generated by a white noise source filtered by a low pass filter with gain Kn. The PID controller is described by its three gains: proportional gain Kp, derivative gain Kd, and integral gain Ki. A time delay Td models the conduction delay between the nerve signals generated in the brain and the muscles that control balance.
Figure 1 Block diagram of bi-planar model
212

Results: The model is simulated using Simulink (Mathworks, Inc.) and computes the same time-domain and frequency-domain metrics from COP data as are calculated from experimentally-acquired data. During the simulation, the model parameters (Kp, Kd, Ki, Kn, and Td) are systematically varied until the values of the sway metrics from the model match the values of the sway metrics from the experimental data, thereby fitting the model to experimental data. In this work, the experimental data was acquired from 16 children with idiopathic scoliosis and 20 typically-developing children who stood for 30 seconds with one foot on each fixed force plate and focused on a fixed target placed at eye level at a distance of 1.5m. Discussion: Differences in model parameter values are seen for the proportional gain in the PID controller in both planes [Kp(AP)and Kp(ML)] and for the integral gain in the ML plane [Ki(ML)]. The proportional gain corresponds to the stiffness of the model, suggesting that one effect of scoliosis from a modeling perspective is an increase in stiffness in both planes. The integral gain corresponds to the damping in the model, indicating a second effect of scoliosis in the model is increased damping in the ML plane. References: [1] J. Massion and M. Woollacott, “Posture and Equilibrium,” in Balance, Posture and Gait,
A. Bronstein, T. Brandt, and M. Woollacott, Eds. New York: Oxford University Press, Inc, 1996.
[2] P. Gagey and G. Bizzo, “Measure in Posturology,” vol. 2005. Paris: Association pout le Developpement et l’Application de la Posturologie, 2001.
[3] T. Prieto, J. Myklebust, R. Hoffmann, E. Lovett, and B. Myklebust, “Measures of postural steadiness: differences between healthy young and elderly adults,” IEEE Transanctions on Biomedical Engineering, vol. 43, 1996.
[4] K. Bustamante, J. Long, S. Riedel, S. Hassani, A. Graf, J. Krzak, and G. Harris, “Postural control under altered sensory conditions in children with cerebral palsy,” Proceedings of RESNA 2008, Washington, DC, Jun. 28-30, 2008.
[5] F. Borg, “An inverted pendulum with springy control as a model of human standing,” vol. 2005: Cornell University Library, 2005.
Acknowledgements: The authors gratefully acknowledge the assistance provided by the Motion Analysis Laboratory at Shriners Hospital, Chicago; the Orthopaedic and Rehabilitation Engineering Center (Marquette University/Medical College of Wisconsin); and NIDRR Grant No. H133P040008.
Figure 2 Comparing model parameter values for IAS and typical subjects
213

THE PHYSIOLOGICAL EFFECTS OF BALANCE AND BALANCE CONFIDENCE
Jody L. Riskowski1
1 Department of Kinesiology, University of Texas at El Paso
Introduction
Reduced balance confidence and poor balance are risk factors for falls in older adults,
and the correlation between falls and fear of falling is well established. [1-2] However, the
physiological effects that correspond to the loss of balance confidence are unknown. The purpose
of this study is to examine the relationship between balance ability and confidence with respect
to physiological markers of anxiety.
Clinical Significance
Understanding the biomechanical and physiological effects of balance confidence may
provide new treatment strategies and outcomes assessments for clinicians working with older
adult women.
Methods
Thirty women between the ages of 60 to 80 years participated in this study (mean ±
standard deviation [SD]; age 64.9 ± 3.4 years; body mass index 24.6 ± 3.8 kg/m2). Subjects were
free from neurological deficits, neuromuscular ailments, and cardiovascular disease.
For the balance protocol, subjects underwent four 30-second conditions: (1) both feet on
the ground, eyes open (baseline); (2) both feet on the ground, eyes closed; (3) non-dominant foot
(NDF) standing, eyes open; and (4) dominant foot (DF) standing, eyes open. Foot dominance
was defined as the first foot used to start walking. The testing started with both feet, eyes open
followed by both feet, eyes closed, and the DF and NDF standing conditions were randomized.
Balance was assessed using an AMTI force plate at 1000Hz. The center of pressure
(COP) measures were determined in the anterior-posterior (AP) position. A mean power
frequency (MPF) of the COP was determined in the AP direction (AP-COP MPF), normalized
by foot length (mean position * 100/foot length).
At the end of each balance condition, subjects were asked to rate their balance confidence
on a scale of 0-10 in that task, with 0 being not at all confident and 10 being extremely confident.
For the single foot conditions, the condition was finished when the subject needed external
assistance or placed her other foot on the ground. After each condition, subjects were given
approximately five minutes rest to relax, bringing their breath and heart rate back to the baseline.
Breath and heart rate were monitored using Clevemed Biocapture Pro synchronized to the
force plate. Physiological data was captured at frequency of 100Hz.
Data analysis consisted of repeated measures analysis of variance with a covariate
(ANCOVA) from the 2 foot, eyes open condition (baseline). Pearson’s correlation coefficient
assessed the relationships between heart and breath rate, balance confidence, and AP-COP MPF.
Results
As the subject’s balance was challenged with eyes closed or on one foot balance
confidence decreased, while the breath and heart rate increased from baseline (Table 1). There
was a negative relationship between balance confidence and change in heart rate from baseline (r
= -0.831). Balance confidence was also negatively correlated to AP-COP MPF (r = -0.784).
214

Table 1: Physiological effects during the balance conditions. Changes in breath and heart rate are with
respect to the baseline condition (both feet on the ground, eyes open). br/min = breaths per minute.
Reported as mean ± SD; * = p <0.05 with respect to baseline.
Balance
Condition
Breath Rate
(br/min)
Breath Rate
Change
(br/min)
Heart Rate
(beats/min)
Heart Rate
Change
(beats/min)
Balance
Confidence
AP-COP
MPF
(Hz)
Both foot, eyes open
(Baseline) 14.4 ± 2.2 -- 63.0 ± 4.8 -- 9.9 ± 0.2 0.22 ± 0.04
Both feet, eyes closed 15.4 ± 1.9 1.5 ± 0.9 65.3 ± 3.8 2.3 ± 2.0 8.9 ± 0.3* 0.26 ± 0.05*
NDF, eyes open 17.0 ± 2.2* 2.8 ± 1.9 65.2 ± 3.5 2.3 ± 2.4 4.4 ± 1.6* 0.28 ± 0.06*
DF, eyes open 17.7 ± 1.9* 3.3 ± 1.7 67.3 ± 3.4* 4.3 ± 3.2 3.4 ± 1.1* 0.31 ± 0.06*
y = 0.0147x + 0.2137R² = 0.672
0
0.05
0.1
0.15
0.2
0.25
0.3
0.35
0.4
0.45
0.5
-2 0 2 4 6 8 10 12
AP
-CO
P M
PF
(H
z)
Change in Heart Rate from Baseline Condition
Relationship Between Change in Heart Rate and AP Sway
y = -0.0096x + 0.1339R² = 0.8656
0
0.02
0.04
0.06
0.08
0.1
0.12
0.14
0.16
0 2 4 6 8 10
Ch
ange
in A
P-C
OP
MP
F (
Hz)
Balance Confidence
Change in AP Sway and Balance Confidence
Figure 1: (Top) Heart rate increases from
baseline during the three balance
conditions lead to increased AP sway.
(Bottom) Increases in AP sway from
baseline lead to reduced balance
confidence.
Discussion
Low balance confidence and fear of falling can diminish an older adult’s quality of life.
Understanding the biomechanical and
physiological effects that affect balance
confidence may provide clinicians alternative
treatment strategies for working with older adults
who have a fear of falling. In this work, there
were significant increases in breath and heart rate
when the older adults were in situations that
challenged their balance (e.g., eyes closed limits
visual cueing, one foot reduces base of support).
Biomechanically, the balance-challenging
activities tended to increase AP sway, similar to
previous work. [1] However, with the increased
sway, there was also a corresponding increase in
breath and heart rate. It is unknown if the increase
in breath and heart rate led to the increase in AP
sway and low balance confidence or if the
increased AP sway led to the increased breath and
heart rate and low balance confidence. Regardless
of which caused the low balance confidence, this
study provides an alternative view for assessing
balance confidence when working with older
adults. Balance training in older adults should
address some of the physiological effects of low
balance confidence, such as learning to control
one’s breath rate and learning to relax in balance-
challenging situations.
References
[1] Maki, BE, Holliday PJ, and Topper, AK. (1991). J. Gerontol., 46(4):M123-M131.
[2] Yardley, L. (2004). Rev. Clin. Gerontol., 13:195–201.
Acknowledgements
The author would like to thank SS Guiterrez and KM Herrera.
215

216

217

Walking in a Moving Virtual Corridor with Variable Width Size affects Step Width Control
Ka-Chun Siu1,2, Mukul Mukherjee1, Dimitrios Katsavelis1, Jung-Hung Chien1,2 and
Nicholas Stergiou1,2 1Nebraska Biomechanics Core Facility, University of Nebraska at Omaha; 2College of
Public Health, University of Nebraska Medical Center, Omaha, NE Email: [email protected] URL: http://nbcf.unomaha.edu
Introduction: Human walking is highly adaptive and can be adjusted according to the surrounding environment. For example, in experiments conducted in virtual environments, it has been shown that walking speed is driven by the speed of the optic flow of the moving corridor [1-3] and suggested that walking is more likely to be altered in a more dynamic situation. However, those studies have mainly focused on gait changes in the sagittal plane, and seldom explore control in the frontal plane. Our goal was to investigate the effect of a moving virtual corridor with variable width size on step width while walking. Clinical Significance: Step width and step width variability are commonly used to investigate balance control [4-7]. It has been shown that insufficient step width control in older adults, indicated by larger step width variability, is associated with a high risk of falling [4]. Brach and colleagues also found that older adults with either low or high step width variability were more likely to fall [6]. Since, environmental constraints affect gait performance, investigating how these constraints are perceived and evaluating their effect on step width control is crucial for improving our knowledge on falling. Methods: Five healthy young adults performed 5 treadmill walking conditions for 6 minutes each while being in different virtual environments, where the width size of the moving virtual corridor changed sinusoidally either from 15 to 45 inches (narrow condition) or from 15 to 105 inches (wide condition). The rate of these changes were also manipulated being either 30 (fast condition) or 120 second per cycle (slow condition). A fixed corridor, 75 inches wide, was also presented as the control condition. All participants walked at their self-selected pace and the speed of the virtual corridor matched the walking pace. Average step width and step width variability (coefficient of variation; CV) were calculated from kinematics. Repeated measures ANOVA were conducted to examine the effect of the manipulations of the size of the width of the corridor on the step width measures.
218

Results: A significant condition effect was shown for the average step width (p=0.001) and the CV (p=0.047). Compared with the control condition, the average step width was significantly smaller in the narrow/slow and the wide/slow conditions (Fig 1), and the CV was significantly higher in the wide/fast and the wide/slow conditions (Fig 2).
Discussion: Our results reveal that step width control during walking is influenced by changes in the width size of the virtual corridor. Especially in the slow condition, the step width increases when the width size of the virtual corridor increases, and vice versa. It is possible that the control in the frontal plane requires higher level of brain function, e.g. temporoparietal region [8], to maintain lateral postural stability, and is susceptible to the change in the frontal plane of virtual corridor. In addition, changes of step width seem to be speed dependent. When the slower corridor was presented, it resulted in larger variability and smaller step width. This may have to deal with the speed information processing at the higher brain centers and the associated time to react. Modulation of step width may require slow and wide virtual corridors.
References: 1. Hollman JH, Brey RH, Robb RA, et al. Gait Posture. 2006; 23(4):441-4. 2. Lamontagne A, Fung J, McFadyen BJ, et al. J Neuroeng Rehabil. 2007; 26(4):22. 3. Chou YH, Wagenaar RC, Saltzman E, et al. J Gerontol. 2009; 64(2):222-31. 4. Owings TM, Grabiner MD. Gait Posture. 2004; 20(1):26-9. 5. Thies SB, Richardson JK, Ashton-Miller JA. Gait Posture. 2005; 22(1):26-31. 6. Brach JS, Berlin JE, VanSwearingen JM, et al. Neuroeng Rehabil. 2005; 26(2):21. 7. Brach JS, Studenski S, Perera S, et al. Gait Posture. 2008; 27(3):431-9. 8. Pérennou DA, Leblond C, Amblard B, et al. Brain Res Bull. 2000; 53(3):359-65.
Acknowledgement: This project was funded by the Nebraska Research Initiative, the American Heart Association and University of Nebraska Medical Center.
*p > 0.05
219

220

221

Analysis of static balance in individuals with cerebral palsy submitted to neuromuscular block and functional electrical stimulation
S Kazon¹; RV Costa²; M Kanashiro³; A I Shiguemi4; LMM Sampaio5; CS Oliveira6
1 Student of Master’s Program in Rehabilitation Sciences, UNINOVE, Brazil;
2 Student of Master’s Program in Rehabilitation Sciences, UNINOVE, Brazil;
3 Student of Master’s Program in Rehabilitation Sciences, UNINOVE, Brazil;
4 Student of Doctoral degree in Biomedical Engineering, UNICASTELO, Brazil;
5 Prof. Dr. of Master’s Program in Rehabilitation Sciences, UNINOVE, Brazil;
6 Prof. Dr. of Master’s Program in Rehabilitation Sciences, UNINOVE, Brazil;
Support of Conselho Nacional de Pesquisa, Cnpq, Brazil.
222

ABSTRACT
Introduction: Spasticity is one of the main complications of cerebral palsy (CP) and
directly affects the physical therapy process. Objectives: The aim of the present study
was to analyze static balance in individuals with spastic CP after being submitted to
TBA associated to FES. Methods: The sample was made up of 18 male and female
individuals between five and 17 years of age (mean=9.11±3.28 years) divided into three
groups of six individuals: Group 1 (individuals with CP treated with TBA and FES),
Group 2 (individuals with CP treated with conventional therapy) and Group 3 (healthy
controls). The non-modified Ashworth scale was used to assess the degree of spasticity.
A pressure plate (Medicapteurs, Fusyo) was used to analyze static balance. Data
collection was carried out with eyes open and eyes closed, each for 30 seconds. All
groups were submitted to an initial evaluation. Group 1(TFG) was treated with 30-
minute sessions of TBA + FES twice a week and was evaluated on four separate
occasions. Group 2(CG) was treated with conventional physical therapy twice a week
for three months and was evaluated a second time at the end of treatment. Group 3(HG)
did not undergo any type of intervention and was only submitted to the initial
evaluation. Results: There was a significant reduction in spasticity in Group 1(TFG),
whereas no statistically significant reduction was observed in Group 2 (CG). Analyzing
the total area of oscillation in Group 1(TFG) with eyes open, there was a significant
reduction between the 1st and 2nd evaluations (p<0.05), between the 2nd and 3rd
evaluations (p<0.05) and between the 2nd and 4th evaluations (p<0.01). The same
occurred regarding the oscillation of the center of pressure (COP) on the anterior-
posterior (A/P) and medial-lateral (M/L) axes over the four evaluations. In Group 2
(CG), the COP oscillation values on the A/P and M/L axes underwent a non-significant
reduction between the 1st and 2nd evaluations. There was a significant difference
between Groups 1(TFG) and 3(CG) on the 1st evaluation, whereas no significant
difference between these groups was found on the 4th evaluation, thereby indicating an
approximation of Group 1 to Group 3 after treatment. The results of the present study
suggest a reduction in spasticity and COP oscillation following treatment with TBA
associated to FES. Further studies with a larger sample and a division of groups
according to type of treatment are needed in order to confirm the data presented here.
Keywords: Cerebral palsy, spasticity, botulinum toxin, balance, FES.
223

The Functional Effect of a Distal Rectus Femoris Lengthening in Adults with Cerebral Palsy
Lisa Cannegieter, PT, DPT, Melanie Buckland, PT, DPT, ATP, Leon Root, MD, Sherry Backus, PT, DPT, MA
Hospital for Special Surgery Introduction Typically, the rectus femoris muscle is active during pre-swing to initial swing and from terminal swing to loading response. This muscle is not active during the majority of swing phase to allow knee flexion and foot clearance. In individuals with cerebral palsy, with a spastic rectus femoris muscle, the activity of the muscle becomes prolonged and obstructs swing phase knee flexion.1 This leads to poor clearance during swing and may cause toe drag, tripping, and falling. The presence of a stiff knee gait pattern in individuals with cerebral palsy is well documented in the literature.2-6 The purpose of this study was to determine the effect of a distal rectus femoris lengthening on gait in adults with cerebral palsy. We hypothesized that a distal rectus femoris lengthening would improve gait in adults with cerebral palsy by improving gait kinematics specifically, peak knee flexion, peak hip extension, timing of peak knee flexion in swing and total knee excursion while maintaining knee extension strength. It was also hypothesized that subjects would be satisfied with the improvements in their gait pattern and function. Clinical Significance There have been multiple studies published determining the effect of lower extremity surgery on improving gait in children, not adults, with cerebral palsy.2-5 Research specifically studying the adult population with cerebral palsy, in particular, the effect of a distal rectus femoris lengthening on improving gait is lacking in the literature. This study found significant improvements in peak hip extension, peak knee flexion, and total knee excursion without loss of knee extension strength following a distal rectus femoris lengthening in five adults with cerebral palsy. Therefore, a distal rectus femoris lengthening is a surgical option for adults with cerebral palsy with stiff knee gait to improve their gait pattern and function. Methods Eight adult subjects with cerebral palsy who received a distal rectus femoris lengthening were contacted to participate in the study. All subjects received this surgery between 2004 and 2008. Of the eight, five adults (ages 25-51) agreed to participate in the study and were at least one year post-operative. Four out of the five subjects underwent an isolated distal rectus femoris lengthening; the fifth subject also had bilateral adductor releases. For all subjects, knee extension strength was measured by manual muscle testing. Three-dimensional lower extremity gait kinematics were captured at 100 Hz, based on a Cleveland Clinic marker set and calculated in OrthoTrak (v 6.55, Motion Analysis Corporation, Santa Rosa, CA). Pre-operative versus post-operative kinematics were compared by using an average of 10 trials for peak hip extension, peak knee flexion, timing of peak knee flexion during swing, and total knee excursion. Additionally, the
224

subjects completed a questionnaire prepared by the investigators to measure perceived change in function. In addition to descriptive statistics, changes in gait variables were analyzed by a paired sample t-test using SPSS version 16.0 with an alpha set at ≤ 0.05. Results Four subjects underwent bilateral distal rectus femoris lengthening while one subject received unilateral surgery. A total of nine lower extremities were included in the study. Significant improvements were found for total knee excursion (p = 0.014), peak hip extension during stance (p = 0.005), and peak knee flexion during swing (p = 0.002) (Table 1). The timing of peak knee flexion was unchanged. Knee extensor strength either remained the same or improved in all five subjects. Subjectively, four out of five subjects were satisfied with the surgery; one patient was not satisfied due to an increase in knee hyperextension during stance. Three out of five patients who stated they had pre-operative tripping reported marked improvement in tripping since surgery. Table 1: Changes in Gait Variables (n = 9)
Pre-Op (mean ± sd)
Post-Op (mean ± sd)
p-values
Peak Hip Extension Angle -1° ± 10° 5° ± 9° 0.005 Peak Knee Flexion Angle 41° ± 8° 52° ± 6° 0.002 Knee Excursion 36° ± 8° 49° ± 12° 0.014 Timing of Peak Knee Flexion (% of Swing) 43% ± 13% 48% ± 7% 0.071 Discussion This study showed significant findings of improved peak hip extension, peak knee flexion, and total knee excursion without loss of knee extension strength following a distal rectus femoris lengthening in five adults with cerebral palsy. Even with a limited subject pool, we were able to demonstrate improvements in selected kinematic parameters. The mean peak knee flexion angle change of 11° is also considered clinically significant for functional clearance improvements during gait. The improvements in this study are comparable to those found in children following rectus femoris transfers.3 Therefore, a distal rectus femoris lengthening can be considered as a surgical option for adults with cerebral palsy with stiff knee gait to improve their gait pattern. References 1. Perry, J. (1987) Develop Med Child Neurology; 29:153-181 2. Chamber, H et al. (1998) J Pediatric Orthopedics;18:703-711 3. Sutherland, D, et al. (1990) J of Pediatric Orthopedics;10:433-441 4. Ounpuu, S., et al. (1993) J of Pediatric Orthopedics;13:331-335 5. Sutherland D., et al. (1975). Develop Med Child Neurology; 17: 26-34. 6. Jonkers I., et al. (2006) Gait and Posture; 23:222-229. Acknowledgements Rebecca Zifchock, PhD - statistics
225

Clinically versus dynamically measured maximum angular velocities
Kiernan D MSc, Walsh M MMedSc, O’Sullivan R MSc, Fitzgerald D PhD, O’Brien T FRCSI.
Gait Laboratory, Central Remedial Clinic, Clontarf, Dublin 3, Ireland.
Introduction:
Clinical tests such as the Popliteal Angle and Duncan Ely are commonly used in a clinical
setting to assess muscle response to stretch. The Duncan Ely, as previously described1, requires
the patient to be in a prone position where the knee is rapidly flexed (as fast as possible) by the
examiner. The test is positive if excessive resistance or ipsilateral hip flexion occurs. The
corresponding angle is then noted. The Popliteal angle is measured with the patient in the
supine position. The Tardieu scale2 provides a scale for the popliteal test at velocities V1, V2
and V3 (V1- as slow as possible, V2 – speed of limb segment under gravity, V3 – as fast as
possible). Some studies have compared clinical with dynamic gait variables3,4
, however little
has been done comparing maximum angular velocities between clinical examination and gait.
The aim of this study was to determine whether maximum angular velocities at which these
tests are conducted during clinical examination (i.e. as fast as possible) are representative of
the corresponding velocities measured during gait. Repeatability of measurements between
observers was also examined.
Clinical Significance:
This study investigates whether maximum angular velocities reached during clinical
examination are representative of those seen during gait. It was felt that if sufficient testing
velocities were not reached during clinical examination, then similar muscle responses to those
occuring during gait (e.g. spasticity) would not be adequately detected and reported during
clinical examination.
Patients/Materials and Methods:
The study examined 7 normally developed children (14 limbs, 5 male and 2 female, age range
7-14yrs) assessed by 3 observers. Codamotion active markers were placed on the lateral aspect
of each leg at the greater trochanter, knee, ankle and foot. Each observer conducted the
Popliteal and Duncan Ely test while a Coda mpx30 system (Charnwood Dynamics Limited,
Leicestershire, England) simultaneously tracked the angle and angular velocity of the limb
throughout the test. The test was repeated 3 times by each observer. Gait analysis was then
conducted using the same marker set with 3 full clean gait cycles taken for each leg. Maximum
angular velocity (AVmax) during the Duncan Ely and Popliteal tests was measured and
compared to the AVmax from the point of maximum extension in stance to peak knee flexion in
swing (Duncan Ely) and from the point of peak knee flexion during swing through to terminal
swing (Popliteal). A paired t-test was used to determine whether any significant difference
existed between groups (P<0.05). Inter-rater reliability was assessed using interclass
correlation coefficients (ICC) and Bland & Altman Limits of Agreement (LoA).
226

Results
Table 1: Difference between clinical and gait measured max. angular velocities
Table 2: Bland and Altman LoA & ICC for inter-rater reliability
Discussion and Conclusion: The aim of this study was to compare maximum angular velocities (AVmax) recorded during clinical examination and gait and to assess inter-rater reliability. It was felt that insufficient testing velocities would cause muscular responses seen in gait to be missed during clinical examination. While the Duncan Ely AVmax was measured significantly faster (mean 92.40 deg/s), it suggests that it is more than sufficient to initiate any muscle responses seen during gait. The Popliteal test was on average 13.98deg/s slower compared to gait but no significant difference existed suggesting AVmax to be sufficient during clinical examination (Table 1). For inter-rater reliability, the Bland & Altman results (Table 2) showed poor agreement between observers. The Popliteal measure ranged by 118.2deg/s and the Duncan Ely by 87.2deg/s between observers. These results along with the moderate correlations (ICC range: 0.32�0.77) demonstrate how the instruction “as fast as possible”, used to describe the fastest velocity required during these tests, is quite vague and heavily dependent on the individual observer. However, overall results have shown this instruction to be sufficient to reach similar velocities experienced during gait. References: 1. Jonkers I et al. Gait & Posture 2006; 23(2):222-229 2. Haugh AB et al. Disability & Rehabilitation 2006; 28(15):899-907 3. Desloovere K et al. Gait & Posture 2006; 24(3):302-313 4. McMulkin ML et al. J Pediatr Orthop 2000; 20(3):366-369.
Max Angular Velocity (degrees/sec) N Mean(SD) Std. Err Mean Mean Diff (1-2) sig (1) Clinical (Duncan Ely) (2) Dynamic (Gait)
14
492.62 (72.2) 400.22 (34.89)
19.23 9.33
92.40
.045*
(1) Clinical (Popliteal) (2) Dynamic (Gait)
14
426.37 (59.39) 440.35 (38.01)
10.16 15.87
-13.98
.257
Test Between d (deg/s) S.E of d 95% C.I for d S.D. diff 95% LoA ICC Popliteal 1-2
1-3 2-3
49.6 -18.9 -68.6
12.19 19.8 18.8
23.3�76.0 -61.7�23.8 -109.2�-28.0
45.6 74.0 70.3
-41.6�140.9 -166.9�129.1 -209.2�72.0
.588
.539
.319 Duncan Ely 1-2
1-3 2-3
-50.1 -13.0 37.1
16.2 13.2 11.8
-85.0�-15.2 -41.5�15.6 11.6�62.7
60.4 49.4 44.2
-171.0�70.8 -111.9�85.9 -51.3�125.6
.613
.772
.774 (d - mean difference, S.E of d – standard error of d, 95% C.I for d – 95 Confidence Interval for d, S.D diff – standard deviation of d, 95% LoA – 95% Limits of Agreement (d± S.D diff *2)
227

Does the gluteus medius contribute to pelvic and hip rotation in cerebral palsy?
O’Sullivan R, Fitzgerald D, Kiernan D, Walsh M, O’Brien T. Central Remedial Clinic, Dublin, Ireland.
Introduction Surgically altering the insertion of the gluteus medius muscle has been suggested as a possible treatment option for the correction of internal hip rotation gait in cerebral palsy1,2. These studies describe selection criteria for the surgery and report positive outcomes in terms of improved foot-progression. However, both of these studies lack full gait analysis assessment of outcomes. Our previous work attempted to retrospectively identify factors which may contribute to internal hip rotation and pelvic retraction during gait in cerebral palsy3,4. We did not have retrospective data on the gluteal muscles available and so did not consider this muscle group. Biomechanical modelling has shown that the anterior fibres of the gluteus medius have an internal hip rotation moment5 and that this tends to increase with hip flexion6 as is often seen in cerebral palsy gait. The purpose of this preliminary study is to examine any potential contribution of the gluteus medius to internal rotation of the hip or retraction of the pelvis in cerebral palsy gait.
Clinical Significance Internal hip rotation is often treated surgically with a femoral derotation osteotomy. Less commonly, advancement of the insertion of the gluteus medius and minimus has been advocated as a treatment subject to selection criteria. This preliminary study examines the possible contribution of gluteus medius muscle activity to transverse plane abnormality in cerebral palsy.
Methods Surface EMG of the gluteus medius was recorded during gait in 13 cerebral palsy subjects (mean age 9yrs; 9 male, 4 female; GMFCS I-III) attending for routine gait analysis. Average normalised amplitude (during stance, swing and over the whole gait cycle) and time to peak activity were correlated with transverse plane kinematic variables from the pelvis and hip. Clinical measures previously shown to be associated with such gait abnormalities3,4 were also correlated.
Results Table 1 below shows the correlation between gluteus medius EMG data and clinical measures and transverse plane kinematic data.
Discussion
Over-all the correlation between the clinical measures and the kinematics was less than 0.5 which is consistent with previously reported values7. There were eight significant
228

correlations between the EMG variables and the transverse plane kinematics and four significant correlations between clinical data and kinematics. The results of this preliminary study suggest that the gluteus medius may contribute to an internal rotation gait. Further study is warranted in a larger population to further examine the effects of an over-active gluteus medius and to determine the long-term outcomes of surgery to this muscle.
Table 1. Correlation between EMG and clinical data and kinematic data.
*Correlation Significant to p<0.05 level **Correlation Significant to p<0.01 level GMA Gluteus Medius Average Amplitude References
1 Steel HH. Gluteus Medius and Minimus Insertion Advancement for Correction of Internal Rotation Gait in Spastic Cerebral Palsy. J Bone Joint Surg Am. 1980;62:919-927
2 Joseph B. Treatment of Internal Rotation Gait Due to Gluteus Medius and Minimus Overactivity in Cerebral Palsy:Anatomical Rationale of a New Surgical Procedure and Preliminary Results in Twelve Hips. Clinical Anatomy. 1998;11:22-28
3 O’Sullivan R, Walsh M, Hewart P, Jenkinson A, Ross LA, O’Brien T. Factors associated with internal hip rotation gait in patients with cerebral palsy. J Pediatr Orthop. 2006;26(4):537-541
4 O’Sullivan R, Walsh M, Jenkinson A, O’Brien T. Factors associated with pelvic retraction during gait in cerebral palsy. Gait Posture. 2007;25:425-431
5 Dostal WF, Soderberg GL, Andrews JG. Actions of the hip muscles. Physical Therapy. 1986;66(3):351-359
6 Delp SL, Hess WE, Hungerford DS, Jones LC. Variation of moment arms with hip flexion. J Biomech. 1999;32(5):493-501 7 McMulkin ML, Gulliford JJ, Williamson RV, Major MC, Ferguson RL. Correlation of Static to Dynamic Measures of Lower Extremity Range of Motion in Cerebral Palsy and Control Populations. J Pediatr Orthop. 2000;20(3):366-9
Maximal Pelvic
Rotation Minimal Pelvic
Rotation Average Pelvic
Rotation Maximal Hip
Rotation Minimal Hip
Rotation
Average Hip
Rotation Gait Cycle GMA -.177 -.335 -.304 .426* .297 .383
Stance GMA -.132 -.179 -.183 .448* .435* .465* Swing GMA -.197 -.486* -.408 .357 .132 .261
Time of Peak Activity -.260 -.475* -.436* .471* .128 .321 Internal Rotation Range -.057 -.070 -.074 .310 .290 .316 External Rotation Range .229 .442* .399 -.366 -.474* -.440*
Femoral Anteversion -.117 .144 .022 .259 .161 .223 Hip Flexion Contracture -.465* -.167 -.364 .070 -.095 -.010
Gastrocnemius Tightness .187 .186 .219 .412 .267 .360
229

A retrospective study into the strength profiles of ambulant children with cerebral palsy undergoing single-staged, multi-level orthopaedic surgery Authors: 1 Aanchal Kejriwal, 1 Marietta van der Linden and 2 Alison Richardson Affiliations: 1 Queen Margaret University, Edinburgh, UK and 2 Anderson Gait Analysis Laboratory, SMART Centre, Edinburgh, UK INTRODUCTION Single-staged, multi-level orthopaedic surgery (SSML) is often performed in children with CP to correct all deformities and joint contractures. Such muscle and tendon lengthening procedures are known to decrease muscle strength even in normal muscles (Moseley 1992). Seniorou et al (2007) found a significant decrease in muscle strength (measured using hand held dynamometer) in children with CP post SSML six months post-operatively. This did not return to pre-operative levels even 1 year post-operatively. No previous studies have documented the long-term effects of SSML, i.e. longer than one year, on muscle strength in children with CP. Aims The main aim of the study was to quantify changes in (a) muscle strength,(b) walking speed and stride length and (c) gait in ambulant diplegic children with CP, 6-12 and more than 18 months after SSML. CLINICAL SIGNIFICANCE Various studies have confirmed that joint active range of movement increase post SSML in children with CP. However, if muscle strength decreases post SSML, therapeutically, post-operative physiotherapy will need to focus on increasing muscle strength. METHODS Data of 14 children diagnosed with spastic diplegic CP, between the ages of 7-16 years, who underwent SSML and attended Anderson’s Gait Analysis Laborartory pre and post-operativly were extracted from their files. Outcome Measures The data of the following outcome measures were extracted - (a) Active Range of Movement Scores (AROM) for measurement of muscle strength (summarised scores for hip flexors and abductors, knee extensors and ankle plantarflexors) (b) dimensionless walking speed (Hof 1996 ) and stride length (c) Edinburgh Gait Score (EGS) for measurement of gait (Read et al 2003). The Anderson’s Gait Laboratory, Edinburgh has developed a way of assessing muscle strength based on ‘active range of movement (AROM)’. First, the AROM of a muscle against gravity is measured. This is described in terms of outer, middle or inner range. Once the child attains the maximum AROM, manual resistance is applied. The AROM maintained against resistance is then noted. This gives the strength at a given joint. The EGS, designed for gait analysis of children with CP using video analysis, consists of 17 variables of gait for each leg of the subject (Read et al 2003). Each variable is scored 0, 1 or 2. The lower the total score, the lesser the deviation from normal gait. Data Analysis Repeated Measures AVOVA was used for analysis of effect of SSML on muscle strength, stride length, walking speed and EGS pre-operatively, 6-18 months post and >18 months post-operatively.
230

���������� ��������� ��� � �� ��������� ������ ��� ���������� ����� ���������� �������� �������� ������ ��������� ��������� ������������� �������� ������������ ��� �������� ���������� ���� ���� ������������������������������������������������� �� ������������������������������������ �!��"�#�$$%�����& ������������� ��� �����������������#%����������������%�'(#����� �����)%�*#+���� ������������������� �����,������#��-������������ ��� ���������� ����������������������� ���(��������� ./��0������������������� �����1����������������������������������������������������� ./� ��23�3#� �� 43�33#� ������������%�� & ��� �������� �� ��1��� ������ �� ������� ���� � ���� ���������������(��������������������*#+���� ������(������������56 ����������������������������������������������� ./��& ��56 ���������������(����������������*#+���� �����(��������������
��� �� ��& �� �������� �� � ���� �����7�#%���(������������ ��%'(#+� ��� �� �� �)%*#+��� �� ����(������������������������� ./�������������������������������������� ��������� �89���������� ����������������� ���������������������������1����������1�����& �������������� ������������������ �� ./�������������������������������������������� ����� �������� ���� ���������� ����������� ��������������*#+���� �%��-��������������������������1���������������������� ����������������*#+���� ��� ����������������������������������������� ��-��������������� ��� �������������������������������� � ������� ����� � #+� ��� � �������� ��������� ������� ���� ������������ ���� ������� ����������������������������������������������������������������������:���������������(��������� �����%�� ,������ �������� � ����� ���������� � ��� ���� ������ -� �������� � �� ;�������� �� ���� ���������������� �������(������������������������������������������ ����� ������������� ����������������������������������������� ��������� �89��������������#%�0������/��#��'�� ����������������������<������������� �=��������>)����%�?����0� ���0<��������.�5���0������ �@���9���������?�@����?�����?�@��33)��5������ ���������������������������������������������������������������������������)��������'()3#���)%� ��������.���& �������A���0��������.����& ���������&���33$��?�����������.������ ����� �,��������.����(��������� ������� ���������!��������8�������9��������������������'����=$B(+#��
�
��
��
��
��
��
��
�
�� ������ �� ������ �� ������
����� ���� ����
��� ������ ����� �
��� ������ �������� � ����
!"�
231

A New Approach To Stiff Knee Gait In Spastic Cerebral PalsyBy James W. Fee, Jr. and Freeman Miller, MD
Alfred I duPont Hospital for Children
ABSTRACTLack of knee flexion in early swing phase is a common abnormality of spastic cerebral palsy (CP) called stiff knee gait. We examined the interaction between muscles on opposite sides of the body in children with CP and stiff knee gait. A standard treatment approach to stiff knee gait is to perform rectus transfer surgery. However, this procedure improves the gait of only about 66% of the cases. In half of these cases the pattern of the stiff knee gait reverts back within two or three years to the preoperative knee motion. In the remaining 33%, the intervention seems to have little effect. The upper extremities of those with CP often exhibit mirrored limb movements: while one limb performs a task, the contralateral limb will make similar, mirrored movements. This work will demonstrate that a similar mirroring may exist in the lower limbs during gait. In the swing phase of gait, the knee of the weight bearing limb must be stiff, while at the same time the nonweight bearing leg should be free to swing. If the stiffness of the weight bearing limb is mirrored in the nonweight bearing limb, by increased muscle excitation in swing phase, stiff knee gait may occur.
INTRODUCTIONThe motivation behind this work is an observation based on long term followup after
surgery to treat children with stiff knee gait. These patients exhibit a substantial variation in outcome that is difficult to explain based on current analysis. There is often EMG excitation of gastrocnemius, rectus, vastus and hamstring muscles, in stiff knee gait of children with spastic CP, which seems to be of unexplained origin.
Traditionally, stiff knee gait is corrected with a rectus transfer surgery. Studies at our institution and others have shown a success rate of about 66%, of these half will have a recurrence of the condition within three years. In the additional 33% the transfer appears to have little to no effect.
Mirrored movement has often been observed in the upper extremity of those with hemiparesis due to both stroke and CP. Aicardi defines these movements as involuntary, symmetrical, identical movements associated with a voluntary movement carried out by the contralateral hand, in particular finger motion[1]. They are thought to be caused by a pathological remapping of the corticalspinal tracks to the motor cortex of the least damaged hemisphere of the brain[2]. Recognition and treatment of this pathology seems to be limited to the upper extremities.In this paper the authors will replace the phrase “Mirrored Movements” with “Mirrored Excitation” as a more accurate nomenclature for what may be happening in the lower limbs. It is the postulate of this work, not that the ipsolateral limb “Moves” the contralateral stiff knee, but rather “Excites” its muscles, thus contributing to the inhibition of its normal motion
METHODSWith the approval of the IRB committee at our institution, we began a retrospective study of fourteen subjects with cerebral palsy. Inclusion criterion in the study was that each subject has a diagnosis of spasticity with stiff knee gait. All subjects had been seen in our Gait Laboratory before any intervention had been performed, thus each subject had EMG and kinematic data available for examination. In our laboratory, each subject performs multiple walks, during which up to 10 muscle EMG’s are recorded. For this analysis each data set was cut so that it started and ended with a heel strike on the right foot. The walks were strung together, end to end, making one continuous set of ten to fifteen gait cycles. The data set was marked off in tenths of a gait cycle; to be referred to as “data segments”. EMG’s in our laboratory are collected at 1000 Hz, thus each segment consisted of 200 – 300 points. Our study examined four muscle groups: 1)rectus, 2)vastus medialis, 3)tibialis anterior, and 4)hamstrings. These
232

muscles were paired according to co-contracting or ipsolateral-contralateral “mirror” groups. For each data segment a correlation coefficient was calculated between the respective muscle groups. The result was an array of coefficients, one for each segment, for each muscle pair. Starting with the co-contraction pairs we used a one-way ANOVA to test for significant differences between the ipsolateral-contralateral sides. If a difference was found, the side with the highest mean coefficients was held as the “interaction standard”. The coefficients of each of these muscles were then compared with the coefficients of the corresponding ipsolateral muscle. If the one-way ANOVA yielded NO significant difference between the “interaction standard” and the ipsolateral muscle, it must be assumed that co-contraction and “mirrored excitation” correlations are equal for the given ipsolateral-contralateral pair. One further step was taken; segments of one-tenth of a gait cycle were defined about the point of mid-swing. In cases where “mirrored excitation” was found to be equal or more significant than co-contraction, the mid-swing correlations were also compared with a random sample (equal number) of coefficients of the contralateral muscle.
RESULTSWhile all the data resulting from this study cannot be presented here, it is hoped that a typical interaction between two of the muscles examined will interest the reader in a new approach to the problem of stiff knee gait. The data for Tibialis-Hamstring interac-tion clearly demonstrates the dominance of co-contraction on one side of the body. This is to be expected in a hemiparesis. Of more importance is the fact that, in a number of cases, the correlations between ipso-lateral-contralateral muscles are greater than those be-tween co-contracting mus-cles. In even more cases the correlation at mid-stance between ipsolateral-contralateral pairs is clearly dominate over everything else. Our analysis of variance demonstrates, in a number of cases, that the correlation between one of the higher co-contracting muscles and the same muscle on the contralateral side is higher, in mid-swing phase, than the correlation of the co-contracting muscles..
CONCLUSIONSThe limited sample size makes any statistical analysis impractical. However our data suggests that in some subjects the correlation of muscle activation between the ipsolateral-contralateral sides of the body is higher than the correlation of co-contracting muscles. In mid-swing, the correlation is highest between ipsolateral-contralateral pairs. This correlation might be explained as a mirrored excitation of contralateral muscles by ipsolateral muscles. If such an excitation exists, it is certainly worth of examining further as a possible contributing factor in stiff knee gait.
REFERENCES1. Aicardi, J, "Diseases of the Nervous System in Childhood", Mac Keith Press, New York,
1992.2. Cincotta M, Ziemann U. "Neurophysiology of unimanual motor control and mirror
movements", Clin Neurophysiol. 2008 Apr;119(4):744-62.
233

Daily Step Count in Children with Cerebral Palsy: Relation to Clinical Function Tests Anita Bagley PhD MPH1, Donna Oeffinger PhD2, George Gorton BS3, Mark Romness MD4, Diane Nicholson PT PhD5, Sahar Hassani MS6, Mark Abel MD4, and Chester Tylkowski, MD2 1Shriners Hospitals for Children (SHC), Sacramento, CA; 2SHC, Lexington, KY; 3SHC, Springfield, MA; 4University of Virginia Children's Hospital, Charlottesville, VA; 5SHC, Salt Lake City, UT; 6SHC Chicago, IL Introduction: A basic component of the International Classification of Functioning, Disability and Health (ICF; 1) is participation, defined as involvement in a life situation. One way to measure participation is to record steps taken per day. For healthy physical activity, Tudor-Locke et al. (2) recommend 10,000 to 12,500 steps per day for males 6 to 12 years of age and 9,500 to 12,000 steps per day for females. Data on the number of steps per day taken by children with cerebral palsy (CP) according to Gross Motor Functional Classification Scale (GMFCS) Level and type of CP have not been reported. Clinical Significance: Measurement of the physical activity of children with cerebral palsy (CP) in their communities, homes and schools is needed in order to establish the efficacy of treatments designed to improved ambulation. Methods: A convenience sample of children with CP from six pediatric orthopedic hospitals included 105 subjects with diplegia (73 males, 32 females; 26 GMFCS Level I, 53 Level II, 26 Level III; ages 8.1 to 19.0 years) and 44 subjects with hemiplegia (26 male, 18 female; 37 GMFCS Level I, 7 Level II; ages 8.0 to 18.4 years . Each subject performed 1 minute walk test, Gross Motor Function Measure (GMFM66), timed up and go test (TUG), and gait analysis. Subject height and weight were recorded to calculate Body Mass Index (BMI). Each subject was given a LifeCorder PLUS Activity Monitor which is an accelerometer-based pedometer. The subject was asked to wear the LifeCorder on the right hip for six days except when sleeping. Descriptive variables were analyzed by GMFCS Level, Age Group (under 10 years, 10 to 11.9 years, 12 to 13.9 years, and 14-19 years), and gender by ANOVA or t-test. Pearson Correlation Coefficients were calculated for average steps per day versus distance walked in 1 minute test, GMFM66 score, time for TUG, and gait velocity. Results: On average, children with hemiplegia take more steps per day than children with diplegia. For children with diplegia, on average those of GMCFS Levels I and II take more steps per day than those of Level III. There is no difference between males and females. Younger children walk more than older children. More steps per day is associated with greater 1 minute walk distance, higher GMFM66 score, faster time in the TUG, and faster gait speed. For children with hemiplegia, there is no difference in steps per day for GMFCS Level or gender. Data on age groups are limited by sample size. Children with hemiplegia who take more steps per day have lower BMI and faster TUG time. Table 1: Average Steps per Day (standard deviation) by Subject Characteristics Subjects with Diplegia Subjects with Hemiplegia Average Steps 5134 (3009) 8253 (3903) p < 0.001 GMFCS I 6591 (3257) 8415 (4032) GMFCS II 5406 (2790) 7394 (3256)
234

GMFCS III 3124 (2076) I, II > III p < 0.001 No difference Male 5460 (2673) 8787 (3730) Female 4391 (2673) 7193 (4007) No difference No difference 8 to 9.9 years 7090 (4002) n = 12 10650 (3636) n = 13 10 to 11. 9 years 6091 (3544) n = 24 6783 (3034) n = 12 12 to 13.9 years 5117 (2307) n = 24 9705 (3621) n = 5 14 to 19 years 4111 (2333) n = 45 6768 (3929) n = 14 8 to 9.9 > 14 to 19 years p = 0.002
10 to 11.9 > 14 to 19 years p = 0.007 Limited sample sizes
Table 2: Correlation Coefficients for Subject Measures Relative to Average Steps per Day Diplegic Subjects Hemiplegic Subjects BMI 0.02 -0.33 (p = 0.029) 1 minute walk distance 0.29 (p = 0.002) -0.03 GMFM66 0.48 (p < 0.001) -0.13 TUG -0.39 (p < 0.001) -0.44 (p = 0.003) Gait velocity 0.36 ( p < 0.001) -0.19 Discussion: Children with diplegia who are more involved (greater GMFCS level) and older are less active based on daily step count. Step count was related to clinically administered function tests but not to BMI. Children with hemiplegia have higher and less variable lower extremity function scores than children with diplegia (3). Except for TUG time, a proxy measure for endurance, their function scores did not correlate with steps per day. Lower BMI in children with hemiplegia did correlate with increased steps per day. Children with CP do not meet the recommended number of steps per day for health. Using a baseline of 10,000 steps, children with diplegia achieve 51% of the goal and children with hemiplegia reach 83% of the goal. In addition, the rate at which these steps are taken may be insufficient for cardiac health. A step rate of over 100 steps per minute is defined as moderate activity (4). Future analyses of step count data will investigate intensity and duration parameters in relation to pediatric health guidelines which recommend 60 minutes per day of moderate intensity physical activity (5). References: 1. International Classification of Functioning, Disability and Health. World Health
Organization, 2001. 2. Tudor-Locke, C et al., Med Sci Sports Exercise, S537-S543, 2008. 3. Damiano, D et al., Develop Med Child Neurol, 48:797-803, 2006. 4. Jago, R et al. J Sports Sci, 24:241-251, 2006. 5. National Association of Physical Education and Sports. Guidelines for Appropriate
Physical Activity for Elementary School Children, 2004. Acknowledgements: Funding for this study was provided by Shriners Hospital for Children research grant #79158.
235

THE EFFECTS OF ANKLE FOOT ORTHOSES ON CENTER OF MASS MECHANICS AND WORK DURING GAIT IN CHILDREN WITH CEREBRAL
PALSY Bradford C. Bennett, PhD. & Mark F. Abel, MD,
University of Virginia, contact: [email protected] Introduction Children with cerebral palsy (CP) expend two to three times as much energy in walking as able-bodied children and this energy cost correlates with mechanical work performed in children with CP(1). Recently, researchers have documented that AFOs improve the gait of some children but not others(2)We have found that an important component of the increased energy cost of walking in children with CP is the lack of energy transfer that occurs in a pendular gait(3). The importance of poor potential-kinetic energy exchange in children with CP has been noted in other work(4). To date, a quantitative analysis of center of mass (CoM) mechanics of children with CP with and without AFOs has not been performed. This study examines the CoM mechanics in children with CP and evaluates the impact that ankle foot orthoses (AFOs), both hinged and non-articulated AFOs (DAFOs) have on CoM mechanics. Statement of Clinical Significance The primary aim of the study is to examine the impact that AFOs have on ambulation mechanics and mechanical work performed during gait. The methodology presented provides a means to understand how AFOs can improve or not improve pathologic gait. Methods 3-D kinematic data (Vicon) was collected from a convenience sample of 21 children with CP that wore AFOs. Eleven of the subjects wore hinged AFOs and 10 children wore DAFOs. All subjects walked at their preferred walking speed. CoM position was computed with using the full body model validated by Eames et al(5). To allow comparison between individuals, CoM vertical excursion for each trial was normalized by the vertical excursion of a compass gait model with matching leg and step lengths. The kinematic data were used to compute kinetic energy (KE), potential energy (PE), and external work on the CoM. The relative phase between the two energy components was computed using a cross-spectral density function and the peak-to-peak ratio of the PE to KE was calculated. The energy recovery factor, representing the percentage of mechanical energy recovered via exchange between kinetic and potential energy in the CoM movement, was computed as described by Winter(6). Within group repeated measures ANOVA’s were applied to the dependent measures. Results The results are summarized in Table 1. The stride length but not the velocity increased with AFO use, as has been reported in other studies. When examining the recovery factor and the components that affect it, i.e. relative phase and amplitudes of the kinetic and potential energy, the hinged AFO use resulted in greater improvements in gait. The use of AFOs resulted in a more pendular gait, as demonstrated by the reduced ratio of PE to KE and improved relative phase resulting in a higher recovery factor. Most importantly the use of hinged AFOs resulted in a 22% reduction in mechanical work performed, while the use of DAFOs resulted in a tendency for a 16% reduction in mechanical work performed on the individual’s CoM.
236

Table 1. Summary of Experiment 2 Results DAFOs Hinged AFOs No Brace Brace P No Brace Brace P Stride Length 0.99 1.12 <.0045 0.85 0.98 <.0072 Velocity 1.05 1.06 0.988 0.93 0.92 0.7487
Wext (J/kg/m) 1.34 1.12 <.0639 1.42 1.11 <.0125
Normalized CoM Vertical Excursion 0.82 0.81 0.7859 0.99 0.95 0.6934 PE/KE 1.91 1.76 0.388 2.26 1.92 <.0561 Recovery (%) 44.95 51.53 0.2716 32.55 44.31 <.0041 Relative Phase (degrees) 94.89 138.44 0.2371 89.97 138.15 <.0714
Discussion: The results show that the effects of AFOs on gait can be quite subtle. The use of AFOs changed the timing of CoM motion such that the relative phasing of the energies improved allowing increased work recovery, but did not always reduce the external work performed by the subjects. In fact 5 of the subjects (three in DAFO group and two that wore hinged AFOs) performed more work to walk with AFOs than without. This is in line with the work of Brehm et al.(2) that found a significant portion of AFO users with CP used more metabolic energy to walk with AFOs than without. Since energy usage is an important factor in the amount of mobility a child has clinicians need to be aware that this can occur. While oxygen consumption is the gold standard of energy consumption it is difficult to collect in children with CP. Thus the use of the amount of external work performed by a child may be more convenient to compute as all it requires is full body kinematics. The small magnitude of changes in gait with typical AFOs, seen here and in other studies, suggests that improved AFO designs are needed to significantly reduce energy costs of walking in children with CP. While we recognize that the external work does not represent the total effort required to walk, it is a significant fraction of the energy costs(5) and overall efficiency is related to efficient energy transfer(6). Work is underway to quantify the relationships between these measures and O2 consumption.
References
1. Unnithan, V. B.; Dowling, J. J.; Frost, G.; Bar-Or, O. Medicine & Science in Sports & Exercise 1999, 31(12), 1703-1708.
2. Brehm, M. A.; Harlaar, J.; Schwartz, M. Journal of Rehabilitation Medicine 2008, 40(7), 529-534.
3. Bennett, B. C.; Abel, M. F.; Wolovick, A.; Franklin, T.; Allaire, P. E.; Kerrigan, D. C. Archives of Physical Medicine & Rehabilitation 2005, 86(11), 2189-2194.
4. Olney, S. J.; Costigan, P. A.; Hedden, D. M. Physical Therapy 1987, 67(9), 1348-1354. 5. Eames, M. H. A.; Cosgrove, A.; Baker, R. Human Movement Science 1999, 18(5), 637-646. 6. Winter, D. A. Biomechanics and motor control of human movement; Wiley-Interscience: N.Y.,
1990.
237

DEVELOPMENT OF CALCANEAL GAIT WITHOUT PRIOR TRICEPS SURAE LENGTHENING IN PATIENTS WITH STATIC ENCEPHALOPATHY Kenneth Huh, M.D. 2, Susan A. Rethlefsen, P.T.1, Tishya A.L. Wren, Ph.D. 1,2,3, Robert M. Kay, M.D. 1,2
1Childrens Orthopaedic Center, Childrens Hospital Los Angeles; 2Keck School of Medicine, University of Southern California; 3Biomedical Engineering Department, University of Southern California
Introduction: The prevalence of calcaneal gait has been reported at >30% among patients with cerebral palsy (CP), even in the absence of prior surgical intervention. 1 The goal of the current study was to identify characteristics predictive of development of calcaneal gait in patients without prior triceps surae lengthening. Clinical Significance: Motion analysis data are useful for documenting the natural history of gait patterns in CP. Knowledge that gait deviations, such as calcaneus, can occur naturally over the course of time may alter treatment patterns, possibly resulting in more conservative management of equinus and toe-walking. Methods: Gait analysis data were reviewed for all patients with CP who had undergone gait analysis between 1993 and 2008. Inclusion criteria were: 1) diagnosis of CP, bilateral involvement, 2) minimum of two complete gait analysis assessments, 3) no history of triceps surae lengthening, 4) no evidence of calcaneal gait pattern at initial gait study or midfoot breakdown at either study. There were 58 children in the study (42 diplegia, 16 quadriplegia). Calcaneal gait was defined as excessive dorsiflexion (greater than 1 standard deviation above normal) during at least 50% of stance phase with or without diminished plantarflexion during push off. Patients were placed into 1 of 2 groups [calcaneal gait (CG) or non-calcaneal gait (NCG)] based on the development of calcaneal gait between gait studies. Statistical analysis (Student's t-test and Fisher’s Exact) was performed to compare the two groups on the following variables: age at initial gait analysis, time between studies, CP subtype (diplegia or quadriplegia), ambulatory functional level as measured by the Gross Motor Function Classification System (GMFCS) at initial gait analysis, gait velocity at initial gait analysis as a percentage of normal adjusted for age, and change in height, weight and body mass index (BMI) between studies. Comparisons were also made based on clinical examination at the initial gait study, including plantarflexion strength and selective control, quadriceps strength and selective control, dorsiflexion range with the knee flexed and extended, and popliteal angle. Results: Of the 116 extremities, 24 (21%) showed calcaneal gait (CG) at the second gait study. Sixteen of the 58 subjects (28%) developed calcaneal gait in at least one limb. Demographics (age, CP subtype, time between tests, and GMFCS level) and gait velocity at initial gait analysis did not differ significantly between the two groups.
238

Change in BMI was greater in the CG group (p = 0.006). This was due to a significant increase in body weight in that group. Patients in the CG group gained approximately 6 kg more than those in the NCG group (p = 0.007). Change in height was only 3 cm greater in the CG group, and was not significantly different between groups. (Table 1) Table 1. Change in anthropometric measures between tests, mean +/- SD
Variable NCG (N=92) CG (N=24) p-value Change in BMI (kg/m2)
2.0 +/- 2.8 (range: -6.1 to 9.1)
4.0 +/- 4.2 (range: -2.0 to 11.0)
0.006
Change in height (cm) 20.1 +/- 12.1 (range: 0.5 to 63.7)
23.1 +/- 14.1 (range: 0.5 to 63.7)
0.30
Change in body weight (kg)
11.5 +/- 8.7 (range: -2.5 to 46.1)
17.6 +/- 13.2 (range: 0.1 to 46.1)
0.007
At the initial gait analysis test, passive dorsiflexion range of motion with the knee flexed was significantly greater in the CG group (NCG = 16 +/- 9, range: -2 to 35; CG = 22 +/- 11, range: 0 to 40; p = 0.005). However, dorsiflexion with the knee extended, popliteal angle, and hip extension range of motion did not differ significantly between groups (p ≥ 0.07). There was no statistically significant difference in distribution of any of the strength or selective control variables between groups. Plantarflexor strength tended to be lower in the CG group (<3/5 in 80% of limbs in CG compared with 46% in NCG, p = 0.08). Discussion: Patients who undergo (or have potential to undergo) significant weight gain, and have tendencies toward excessive passive dorsiflexion with the knee flexed may be at risk for development of calcaneal gait over time. In such patients, treatment regimens should include therapy to maintain or improve plantarflexor strength, and methods to prevent overstretching the plantarflexors. Non-surgical treatments for triceps surae contractures, such as serial casting, may be preferable, to avoid hastening development of calcaneal crouch gait over time. References: 1. Wren TAL, Rethlefsen S, Kay RM. Prevalence of specific gait abnormalities in children with cerebral palsy: influence of cerebral palsy subtype, age, and previous surgery. Journal Pediatr Orthop, 25(1):79-83, 2005.
239

The relationship between arm posturing and gait deviation in teenagers and young adults with spastic hemiplegic cerebral palsy Jacques Riad 1, 2, Scott Coleman 3, Eva Broström 21 Skaraborgs Hospital, Skövde, Sweden, 2 Women’s and Children’s Health, Karolinska Institute Stockholm, Sweden, 3 Baylor University Medical Center Dallas, Texas, USAIntroductionThe severity and location of the brain injury in cerebral palsy (CP) determines the degree of increased muscle tone and spasticity in the upper and lower extremity. The increased tone in the flexor muscles causes the arm positioning (AP) and the decreased movement of the arm during walking in spastic hemiplegic cerebral palsy. The increased flexion in the shoulder, elbow and wrist and sometimes abduction in the shoulder together with forearm pronation has a dynamic component with more pronounced deformity in fast walking and running and in younger individuals. [1, 2, 3] The assessment and care of the dynamic AP falls between the orthopaedic surgeon with focus on lower limb deformity and gait deviations and the hand surgeon with focus on hand function.There is to our knowledge no existing comprehensive way to quantify deviations of arm posturing during walking and the relationship between the upper and lower extremity movement deviations are not well investigated.The primary goal was to study the relationship between arm positioning in walking and the lower limb gait deviations in teenagers and young adults with spastic hemiplegic CP.Clinical significanceIt is of importance to have a comprehensive view of the movement patterns in CP as to be able to understand deviations and appreciate if they are direct consequences of the impaired motor control or if they are compensation mechanisms. Material and MethodTwenty-eight hemiplegic patients with a mean age 18, 3 years (range 13, 0-24, 0 years) and 5 controls with mean age 17, 7 years (range 13, 4-22, 0 years) were included. All patients were GMFCS 1 and classified as type 1 and 2 in the Winters´ classification of hemiplegic CP and walked without assistive devices. [4, 5] No patient had previous upper extremity surgery or other lower limb surgery than muscle lengthening of the calf muscle. Gait analysis was performed with a Vicon, 8 camera system (Vicon, Oxford England). The patient walked at a self selected speed. Upper and lower extremity and trunk kinematics were collected.From the lower extremity the Gait deviation index (GDI) was calculated. [6] The range of motion from shoulder flexion, adduction and elbow flexion and wrist flexion were calculated. The mean of all trials were calculated within each of the 100 frames making up the gait cycle. The range of motion with minimum and maximum was calculated. The sum of rang of motion of the shoulder flexion, the shoulder abduction, elbow flexion and wrist flexion on the hemiplegic and non-involved side was calculated and an arm symmetry index (ASI= hemiplegic arm divided with the non-involved arm multiplied with 100) was obtained. By using the arm symmetry index (ASI) two main subgroups were derived.ResultsThe arm symmetry index revealed two groups where group 1 showed decreased range of motion and a stiff movement pattern. Group 2 that was more variable but closer to the control group in many ways showed increased movement on the hemiplegic side compared to the non-involved side. The two groups gait deviation index and arm symmetry index is shown in table 1.
240

Mean Group 1 Group 2 ControlsGait deviation indexHemiplegic side
80,6 83,8
91,2Gait deviation indexNon-involved side
81,7 85,1
Arm symmetry index 61 % 140% 97%
Number 18 10 5 Table 1.
Mann-Whitney test revealed significant difference comparing the mean GDI of group 1 and 2 with the controls, (p=0.014) and (p=0,037) respectively. Table 1The Spearman non-parametric correlation showed significance at the 0, 05 level on the hemiplegic side between the GDI and shoulder flexion and abduction. In group 2 there was a tendency towards significance regarding shoulder flexion.DiscussionWe found a correlation between arm positioning and gait deviation in a subgroup of patients with spastic hemiplegic CP. The goal with lower extremity treatment in spastic hemiplegic CP is to improve gait. Several treatment options are available to reduce and influence the effect of spasticity. Orthosis and surgical lengthening at and above the ankle joint redirects the position of the foot at initial contact and botulinum toxin reduces spasticity and the degree of plantar flexion. Withimproved gait often an improvement in arm positioning is noted at least in younger patients groups. [3] Comprehensive measurement of gait pathology in CP and other neuromuscular diseases has made the often complex data generated from three-dimensional gait analysis more easily accessible even for the uninitiated. These objective quantitative measurements can be used following natural progression and evaluate treatment. However further more extensive studies are needed.ConclusionThe gait deviations found in hemiplegic CP is to some extent correlated to the arm positioning. However there seems to be subgroups of hemiplegic cerebral palsy patients where it is difficult to state that the degree of lower limb involvement necessarily is linked to the upper extremity involvement. Confounding factors as compensation mechanisms in the high function patient groups has to be considered. References[1] Bleck E: Orthopaedic management in Cerebral Palsy.Clinics in Developmental Medicine No99/100. London, MacKeith Press, 1987[2] Miller F: Cerebral Palsy. New York, Springer, 2005[3] Riad J, Coleman, S, Miller F. Arm posturing during walking in children with spastic hemiplegic cerebral palsy. J Pediatr Orthop 2007 Mars:27(2):137-41[4] Palisano R. Development and reliability of a system to classify gross motor function in children with cerebral palsy. Developmental Medicine and Child Neurology 39: 214-223, 1997.[5] Winters TF, Jr., Gage JR, and Hicks R. Gait patterns in spastic hemiplegia in children and young adults. J Bone Joint Surg Am 69: 437-441, 1987.[6] Michael H Schwartz. The gait deviation index: A new comprehensive index of gait pathology. Gait and Posture 28 (2008) 351-57)
241

CHANGES OF BOYS FEET DIMENSIONAL PROPORTIONALITY WITH AGE
Byambadorj T.1; Hlavacek P.
1; Jamiyan O.
2;
1Department of Physics and Materials Engineering, Tomas Bata University in Zlin,
Czech Republic 2
Department of Fur and Leather Study, University of Science and Technology, Mongolia
Introduction
A detailed knowledge of shape changes in children feet during growing is an important issue
to design footwear with comfort and healthy attributes [1]. The morphology of the children
foot differs from that of the adult foot, so children last should be designed considering their
specific anthropometric features.
Morphological characteristics of two-dimensional foot shapes have been used with different
purposes as clustering to assess the insole design [2]. Also three-dimensional morphological
analysis has been developed using Free Form Deformation technique for last design [3].
The studies performed in Tubingen stress the fact that, besides the theoretically given
differences in foot widths, it is necessary to respect also the toe length differences.
The aim of this study is to state whether the dimensional proportionality of the feet of boys
markedly changes with the age and whether it is necessary to respect these changes when
designing the shoe lasts for the manufacture of children’s footwear.
Methods
A random sample of 342 Mongolian boys ranging from 3 to17 years of age was divided into
4 groups according to their age (Table 1). Foot characteristics were measured on each child’s
right foot using foot-measuring device and a measuring tape; ball width and ball girth. Static
standing footprints were recorded from a standing full weight-bearing position. The footprints
were analyzed and three dimensions were measured from each footprint: foot length, arch
length and toe length.
Table 1 Distribution according to age group
Age group Age No. of
Subjects %
Kindergarten 3-6 86 25.15
Basic school aged 7-11 105 30.70
High school aged 12-14 81 23.68
Adolescents 15-17 70 20.47
Total 342 100
Starting from these data, matrices of the respective correlation coefficients were computed.
Among the given five variables, the following criterions were taken into consideration: foot
length (1), arch length (2), toe length (3), ball width (4) and joint girth (5). Correlation
coefficients were plotted with respect to the age of the boys.
242

Results
The following figure depicts the correlation results gained from the experiments. Fig. 1
shows the dependence of the correlation coefficient on the age of Mongolian boys. As can be
seen the correlation coefficient between the foot length and the arch length (1--2) only slightly
decreases with the age, whereas the correlation coefficient between the arch length and the toe
length (2--3) decreases more markedly. This fact refers to an interesting conclusion with a
practical effect. With younger boys, the dimensional proportionality of their feet is more
identical and this value decreases with the age. Above all, it is the toe length which changes.
This statement would confirm the justification of the standardization of the shape of the lasts
intended for the manufacture of the shoes for the youngest children (in our case, the boys).
0.97290.9523
0.8733
0.8087
0.68220.6648
0.5905
0.3689
0.9313
0.9671
0.833
0.737
3-6 age 7-11 age 12-14 age 15-17 age
1--2
1--3
2--3
Fig. 1. The dependence of the correlation coefficient, by age group
Discussion
The given study has been done on a group of boys and, for an objective confirmation of the
existing dependence, it would be good to perform the same study with the adult population as
well. It is evident that the fashion designers very frequently do not respect the principles of the
dimensional shapes of foot with age. Owing to the fact that most deformities of the children´s
feet arise within the period when their feet grow, it is necessary to pay more attention to this
problem.
References
1. Gonzalez JC, Nacher B, et al. Study of children footprints growth using geometric
morphometric techniques. Proceedings of the 7th Symposium on Footwear Biomechanics.
July 27-29 2005, Cleveland, Ohio.
2. Battaller A, Alcantara E. Morphological grouping of Spanish feet using clustering
techniques. Proceedings of the 5th Symposium on Footwear Biomechanics. July 5-7 2001,
Zurich, Switzerland. 3. Mochimaru M, Dohi M, Kouchi M. Analysis of 3D human foot forms using the FFD
method and its application in grading shoe last. Ergonomics, 43 (9): 1301-13, 2000.
243

Comparison of dynamic foot motions between children with typically developing feet
and children previously treated for unilateral club foot deformities.
White, H, Augsburger S, Sander, L, Talwalkar V, Edester, B, Rodriquez K, Tylkowski C.
Shriners Hospital for Children, Lexington, Kentucky
Clinical significant: To compare the intermediate/long term follow up outcomes for children
previously diagnosed with unilateral club foot deformities treated operatively or
nonoperatively with a new multi-segment foot model (The Lexington Foot Model).
Introduction: The incidents of clubfoot deformities has been reported to range from 1-4 per
1000 births.[1] The Ponseti technique is the current clinical intervention to correct these
deformities. Despite improvements in care (Ponseti technique) long term children can
continue to demonstrate some abnormalities in their walking patterns.[2] It has been
suggested that the uninvolved foot of a child diagnosed with a unilateral club foot deformity is
also abnormal. To date, the differences between the multi-segment foot motions measured
with three-dimensional motion analysis systems has not been reported for the involved and
uninvolved foot of subjects with clubfoot deformities compared to typically developing
children.
Methods: This study is a prospective study designed to assess the differences between
typically developing (TD) foot motions and the motions of the involved and uninvolved foot
of a patient previously diagnosed with a clubfoot deformity.
Study Population: The study was approved by local review board and informed
consent/assent were obtained from 25 participants with unilateral clubfoot deformities (mean
age 7 (1.5) years; 8 females; 17 males) and 10 typically developing (TD) participants (mean
age 9 (2.5) years; 5 males; 5 females). For the participants with unilateral clubfoot
deformities, 5 were previously treated with Ponseti, 12 Ponseti & Achilles tenotomy, 8
Ponseti, TAL, and Anterior Tibialis Transfer to the third cuneiform. The mean time since all
interventions was 6 years (range 2-9).
Research Procedures: Reflective markers were placed on: (medial/lateral knee, shank triad,
medial/lateral malleoli, posterior, medial and lateral calcaneous, between 2nd and 3rd
metatarsals just distal to the metatarsal cuneiform joint line, between 2nd and 3rd metatarsals
just proximal to the joint line between metatarsal and phalanges, dorsum of the 5th and 1
st toe
just proximal to the joint line between metatarsal and phalanges 5th metatarsal, and dorsum of
1st toe nail bed. The following kinematic motions were calculate: for all three planes hind foot
and forefoot motions, and great toe ab/adduction and great toe dorsiflexion/plantar flexion. A
minimum of three walking trials were collected for each subject while walking at his/her self
selected walking speed using the Motion Analysis system with 8 Eagle cameras in standard
set up for traditional gait analysis. Kinematic data were processed using Cortex (Motion
Analysis Corp. Santa Rosa, CA) and visual 3-d software.
244

AP and Lateral radiographs were collected of the foot and ankle per standard clinical protocol
used to assess foot deformities. The radiographs are required to relate the foot motions
measured while walking to the boney alignment of the foot (calcaneal pitch and forefoot
plantar flexion).
Results: Multivariate Analysis of Variance demonstrated significant differences between the
average motions of three groups of feet (typical developing feet, involved and uninvolved
feet) F (18, 118) = 4.21, p >.001. Post hoc T-tests (Bonferroni correction) revealed significant
differences (Table 1). TD
Average
degrees
(St. Dev)
Uninvolved
side
Involved
side P value
Maximum hind foot
varus
9.9
(4.0)
12.7
(5.8)
16.0†
(4.9) P < 0.001
Maximum hind foot
dorsiflexion
26.2
(5.0)
22.7
(7.1)
15.4†‡
(7.7) P <0.001
Maximum hind foot
plantar flexion
7.0
(5.7)
6.2
(5.7)
1.4†‡
(7.5) P < 0.05
Maximum forefoot
dorsiflexion
25.3
(6.0)
25.5
(5.7)
23.1†
(7.3) P < 0.05
Maximum great toe
dorsiflexion
48.0
(8.9)
42.6
(5.1)
37.1†
(10.2) P < 0.001
Maximum ankle
plantar flexion
12.6
(6.5)
7.7*
(6.7)
7.0†
(5.4) P < 0.05
* Indicates significant difference TD versus uninvolved side, † indicates significant difference
TD versus involved side, ‡ indicates significant difference uninvolved side versus involved
side
Discussion: The uninvolved foot of children previously diagnosed with unilateral club foot
deformities demonstrated less hind foot plantar flexion compared to typically developing
children’s motions. However, no other differences were noted between these two groups. The
involved foot demonstrated less dynamic motions than TD participant’s foot for all motions
reported. The involved side also demonstrated less hind foot dorsi/plantar flexion compared to
the uninvolved side. The involved foot demonstrated an increase in hind foot varus. The
involved foot demonstrated limited hind foot, forefoot and great toe motion compared to the
uninvolved foot. Overall, small limitations in foot motions were noted for the involved side of
children previously treated for club foot deformities.
References:
[1] Sharp L, Miedzybrodzka Z, Cardy AH et al. The C677T polymorphism in the
methylenetetrahydrofolate reductase gene (MTHFR), maternal use of folic acid supplements, and risk
of isolated clubfoot: A case-parent-triad analysis. Am J Epidemiol 2006; 164:852-61.
[2] Cooper DM, Dietz FR. Treatment of idiopathic clubfoot. A thirty-year follow-up note. J Bone Joint
Surg Am 1995; 77:1477-89.
245

����������� ������������������������� ���������������������������������
���� �������������������������������
���������� ����������� ������ ���������������������� !
"�# $%����#���&��� �������'��(����)����# ���� ��)��%*���%������� +,-�
.% ��/�� #�%0��%'�%# ��+��#���12�#%�3������+13!#�� ���� ��#��/&����%'�%# ��
/�����# ��� ���� �%/����� ������4#�� ���5#%�(���5666&#� �7.% ���� ��
8 ��/# #�%��*������� �+$!�� #� #%(��(�����#����� #%'�%/�� �%����/�'�����
��&��2��% ���'�������� #�#��/7��������% �����#%#�#�%� �(��� �/��� �����
��%���(� #(�8��%�� #*������� ��$!�� #� #%(��(��'�% ����%#���� #�%�� ����
��#% �#%�/��#%'���#������ ����� �7$� #���� �%� ���#�����#�/�� ������� �%����#/���
�2�#%��79 #�� �����% �# ��� ���#������� #(��� ���%�� #�� �/� ���#�����)��
2��% # � #(�������� ������#%'&� �� %#2���7
��#%#����#'%#�#��%��0+ #�����#&#�# �� �/����)� ����(#/��%�(#/�%��&����������� �
��%�� # �� %#2��7:�#%''�# �%����#��%/�(��#/� �/����������%)��;��� /#��&#�# ���
������#��%&� ���% ��$�%/+$ ��&��%�%/�� �)�%7
�� �/�01#' �� #�/��%�# �/#�'%��#����+13��'�/&� ���%<�%/56����%/��%�'�/
� �����'#�%���� ���/#����(#�������#%(# �/ ���� #�#�� �#% �� �/�7+��% �=�#(�
��#�����/�(�����/�+�!� #�/��%�# %�������#�&/#��&#�# ��������������# �/7� #�/��%
�# �+13������'�%#��/#% �'�����/���%/#%'�%� � �� ��������%�'�/��#%' �
�$��+$7�� ������������#%���/�/�� ��#����4��#%� #�%���/�&���'��� ��>�'�#
�%����#��%/#���� ��/#��&#�# ���#%' ��4���/$%)���%/��� ?��� #�%%�#����4$�?!
@5A7+ ��� ��B#%� ����% ��������� �/#% #������7+ ��4$�?�#%/���%/�% �������� �/
&�&� �� #�/�%/ �#�����% ������� ������ ����� ;�%)�����&����#% ���/���#%���
�#��C� ��#������ ���D�����%/��� #�%��7E#%��� #�'�# /� �������� ���/��#%'�3#��%
F5B�� #�%��� ������ ���%/��������/��#%'�� ��&73��#�&����%�����/����#� �/#%+�&��
B7$G�3$�# ��%%� *�+>��� �� �� ��������/ �/� ���#%��%�/#�����%���&� ���%
'�����7�%�� ������ �/�#�&��� �� #�/��%�# �+13����#%���/�/#% ��%������7
+��%HB<! �$"�����%HB,! +$"�����%HB>! $��� #�/��%�%H--!
"�%/����0�! 5F0, B60, B60> <F0B5
:%#�� 3#�� G;$ 5F05> 5>056 G;$
$'�����! I76J57< F7<J-7, ,75JF7, -7IJ57F
+�&��57��&K�� � ���� ��#� #��� #������������% 7
����� �0��&K�� � ���� ��#� #���� �--� #�/��% � ��� #�#�� �/#% �� �/����/� �#��/#%
+�&��57���%��%/� �%/��//�(#� #�%���� � ���/���#%��� ��4$�?���������#��/
#%�#'���57$G�3$� ���/�#'%#�#��% /#�����%���&� ���% �'�����������/���#%���
��4$�?�4��� � #�/����� ���� ���D����7��� = �� �� ���(����/�#'%#�#��%
/#�����%���&� ���% �+��%/&� �+13'������# #% �� ��#����%/��� #�%��
/���#%��&� ����% �%/� #�/����� !�%/#% ��� ���D����/���#%�����% ����� �%��!7
�%�� �����% ����� �� ���� #�%��/���#%� ���/�#'%#�#��% /#�����%���&� ���%
�+13'�����7����� ����)#%��� #�(��#�&������������#��/#%+�&��B7
�#�����#�%09 #��&� �+13'����������/���� #(��� #' ���%���/���#%��� ��4$�?�
�����������#'%#�#��% ������� �% �+�'�����# #%��� /���#%�79# #% ��+13
'����� ���������%�#� �% ��%/��������� �&� #' ��#%� #�/��%��%�'�/�# �
246

����������� �������������� �������������� ������������������������������
���������������� ������������������ ������������������������������� ���
������������� �� ������������ �������������� �����������
�
��
��
��
��
���
���
��� ����������
�
��
��
��
��
���
���
��� ����������
��� ����� �����
�
��
��
��
��
���
���
��� ����������
��� ���������������
�
��
��
��
��
���
������ ����������
�
��
��
��
��
���
���
��� ����������
�
��
��
��
��
���
���
�� � � ��� ����������
��� �����!����
"���#����� �����"���#���������������"���#�����!����
�� � � �� � �
�� � � �� � � �� � � �
��
��
��
��
���
���
��� ����������
�
��
��
��
��
���
���
��� ����������
�
��
��
��
��
���
���
��� ����������
��� ����� �����
�
��
��
��
��
���
���
��� ����������
��� ���������������
�
��
��
��
��
���
������ ����������
�
��
��
��
��
���
������ ����������
�
��
��
��
��
���
���
��� ����������
�
��
��
��
��
���
���
�� � � ��� ����������
��� �����!����
"���#����� �����"���#���������������"���#�����!����
�� � � �� � �
�� � � �� � � �� � �
������ !��"���#$�%����&'(�)���������������� ������������%!���� ��������������(!
����������� ���(!������������� ��
*������ ��������������������� ���� ���� +!+������������(�����������������
���� ���������� +��������(������,���-�./��������������������'���������
�����������������+���������������������������������������������%������
�����������������������(����������������������� ���������� �����������
��������'�������������������0��������'����������������� ���
�%
��123������
�(
��124������
�(
��155������
$������ �
������� � �
*���6�����'�������� ����� �������� �� 2 �789 77�789 2:�2:9 !!
������� +��� ����� � ; �79 83�:9 7<�79 !!
"'����%�������'�������� ���������� 4�8#5�; 4�7#:�28 :�3#8�< =$
"'������������'������������������� 8�<#:�3> 5�<#:�8> 4�;#8�;> �?<�<:
"'����%�������'������������������� 2�5#5�2 4�7#2�5 �;#7�5 =$
%�������'���@������������ 5<�<#:�5> 4:�7#2�;> 43�7#7�; �?<�<:
.'���������������������������� �
�� �3�2#:�3> �2#3�8>A !:�2# <�8>A �?<�<:
����4�*������ ��� �����������>������� ���������� ����������%������-�./�������A������� ��
�������� ���������-�./�������
(�������������������������������� �������������������������� ���������
�������������������� �� ������������ �����������������������������
��������������������
B C"����������4<<3�D,���D����$���,��;<E 2: !7�
( +������������E�������F� �����������@���������������� �������� <755:;�E���F� �����4<<8G48�
247

Principal Components Analysis to Assess Plantar Loading in Patients with Midfoot
Arthritis and Matched Control Subjects
Yen Wei Chen1, Judith F. Baumhauer
2, Deborah A. Nawoczenski
3,
Howard J. Hillstrom4, Smita Rao
1
1 - New York University, 2 - University of Rochester Medical Center, 3- Ithaca College –
Rochester Center, 4 - Hospital for Special Surgery, New York, NY, USA.
Introduction
Arthritis of the tarsometatarsal joint (midfoot) has emerged as a challenging problem due to
its high potential for foot pain and chronic secondary disability. Recent evidence from
biomechanical studies in a variety of clinical populations suggests that foot pain may be
related to elevated regional plantar loading, but quantitative data elucidating the role of
regional plantar loading strategy in midfoot arthritis is lacking. The purpose of our study was
to examine regional plantar loading pattern in patients with midfoot arthritis compared to
asymptomatic, matched control subjects, using principal component analysis (PCA).
Clinical Significance
Evaluation of plantar loading strategy is challenging due to the multi-variate nature of plantar
loading data. As a novel solution, we propose to use PCA to assess plantar loading. An
improved understanding of loading strategy may help develop corrective interventions to
optimize patients’ function.
Methods
Plantar loading data were collected on two groups of subjects. Group 1 comprised 29 midfoot
arthritis patients who had unilateral foot pain localized to the tarsometatarsal region, and
aggravated by weight bearing. Group 2 contained 20 asymptomatic control subjects, matched
in age, gender and body mass index (BMI) to midfoot arthritis patients in Group 1.
Demographic characteristics of both groups are as follows: (Mean ± SD in patient and control
groups respectively, age in years: 62 ± 7 and 58 ± 8; BMI in kg/m2: 29.7 ± 5.7 and 29.3 ± 4.3)
Plantar loading data was obtained using an Pedar-X system (Novel Inc, St Paul, MN) at 90
Hz. Patients walked at self-selected speed during data collection. Control subjects’ speed was
matched to patients’ walking speed. For analyzing loading patterns, the foot was divided into
heel, medial and lateral midfoot, medial and lateral forefoot, and great toe, defined as a
percent of foot length and width. The outcome variable was average pressure, and expressed
in kilopascals (kPa). Independent t-test was used to determine significant differences in
average pressure between subjects in two groups. We used principal component analysis
(PCA), which has been applied to investigate kinematic and kinetics measures of human
movement [1], to compare the data structure between the midfoot arthritis group and the
control group, using average pressure in six masks. Components were determined by
eigenvalue greater than one and varimax rotation was used to interpret the findings.
Results
The independent sample t-test indicated that patients with midfoot arthritis sustained
significantly lower forefoot average pressure (t(47) = 2.51, p = .02, Table 1) and trends
towards higher medial midfoot average pressure, compared to matched control subjects.
Results from PCA suggest that the two groups used different plantar loading strategies during
248

walking. (Table 2) A two component loading strategy was found in the control group, where
the first component included the lateral portion of the foot (lateral midfoot, lateral forefoot
and medial midfoot masks), and the second component included the medial portion of the foot
(great toe, medial forefoot and heel masks). The two-component loading strategy explained
70.55% variance in the data. In the midfoot arthritis group, a two component loading strategy
was noted; however the masks in each component were different from the masks in the
control group. The first component encompassed the anterior portion of the foot (medial and
lateral forefoot, and great toe masks). The second component encompassed the posterior
portion of the foot (heel, medial midfoot, and lateral midfoot masks). The two components
explained 69.23% variance in the data.
Table 1. Mean (SD) average pressure (expressed in kPa) sustained during walking, in patients
with midfoot arthritis compared to matched asymptomatic control subjects.
Heel Medial
midfoot
Lateral
midfoot
Medial
forefoot
Lateral
forefoot
Great toe
Arthritis
Group
113.64
(29.58)
53.82
(13.70)
66.09
(22.17)
108.20
(29.46)
78.77
(19.79)
118.20
(50.42)
Control
Group
123.36
(32.00)
48.83
(11.79)
66.21
(20.54)
104.81
(24.63)
93.63
(21.27)
121.24
(31.66)
p value .28 .19 .99 .67 .02 .81
Table 2. Component matrix with varimax rotation in midfoot arthritis and control group.
Arthritis Group Control Group
Component 1 Component 2 Component 1 Component 2
Heel .49 .73 .18 .84
Medial midfoot .16 .85 .82 .27
Lateral midfoot .14 .82 .92 -.09
Medial forefoot .81 .27 -.07 .62
Lateral forefoot .85 .01 .78 .16
Great toe .67 .28 .34 .88
Discussion
PCA revealed different plantar loading strategies between two groups. In the midfoot arthritis
group, subjects used an anterior-posterior loading strategy during walking, while subjects in
control group used a medial-lateral loading strategy. This study provides preliminary evidence
suggesting that PCA may be a potential tool to investigate the multi-variate nature of plantar
loading patterns. Future studies using discriminant analysis are indicated to assess the clinical
utility of the loading strategies determined using PCA.
References
[1] Daffertshofer A, Lamoth CJ, Meijer OG, Beek PJ. (2004) PCA in studying coordination
and variability: a tutorial. Clinical Biomechanics; 19(4): 415-428.
Acknowledgements
We would like to acknowledge funding from the Arthritis Foundation and the American
Orthopedic Foot and Ankle Society.
249

QUANTIFICATION OF ANKLE 3D KINEMATICS: A SIMPLIFIED PROTOCOL
Stagni R. 1*, Merlo A. 2,3*, Prati P. 3*, Mazzoli D.3*1* DEIS, University of Bologna, Italy, [email protected]
2* LAM – Laboratorio Analisi Movimento. Dip. di Riabilitazione, Correggio, AUSL di Reggio Emilia – Italy, [email protected]
3* Laboratorio Analisi Movimento e Biomeccanica – Osp. Priv. Accr. Sol et Salus, Rimini –Italy, [email protected]
Introduction The widely used Davis protocol does not allow to quantify ankle 3D kinematics according to ISB reccomendations. Recent studies [1,2,3] proposed exhaustive protocols for the quantification of ankle 3D kinematics. The introduction of new protocols for the clinical motion analysis can be difficult due to resistance to change individual lab procedures and difficult comparison with previous data.The aim of the present study was to propose and test an integration of the Davis Protocol for the quantification of ankle 3D kinematics.
Clinical Significance The quantification of ankle 3D kinematics is of great interest in the clinical practice, for the evaluation of functional limitations deriving from different pathological conditions. A protocol that allows the quantification of 3D ankle kinematics according to ISB recommendations, without altering the laboratory practice and allowing comparison with previously acquired data, can improve significantly the clinical effectiveness of functional evaluation.
Materials and methodsProtocol: Two markers are added on the tibial tuberosity (tt) and on the first metatarsal head (1 met) to quantify the dorsi-plantarflexion (DP), intra-extrarotation (IE) and prono/supination (PS) angles of the ankle according to ISB recommendations. Markers are placed for the shank on fibula head, tibial tuberosity, lateral bar on mid-tibia, lateral ankle bone; for the foot on heel, first metatarsal head and fifth metatarsal head.
Fig. 1. Marker placement on shank and foot.
250

The protocol was implemented with SMART Analyzer software (B.T.S., Italy). Ten healthy adult subjects (age 21-44 years) were analysed, using a 6 TV-cameras stereophotogrammetric system (ELITE, B.T.S., Italy) at 100 Hz acquisition frequency. The analysed motor task was walking at self-selected speed; 6 repetitions were acquired and analysed for ach subject.Ankle joint 3D ranges of motion obtained with the proposed method were compared to those available in literature [1, 2, 3].
ResultsNormal ranges (mean• •std) for both relative and absolute ankle joint angles are reported in Figure 2.
Fig. 2. Mean and standard deviation of 3D relative (above) and absolute (below) ankle joint angles.
Discussion The suggested model integrates the Davis protocol with DP and PS relative angles and absolute angles which are comparable to literature data. Differences in the measurement of angles of DP and IE with respect to the Davis protocol (1991) are due to the use of axes suggested by the ISB.Given its simple use (just two markers added to Davis model) the above model is deemed to be adequate for adult patients with acquired brain injuries, for which they are to support the clinical evaluation also of absolute angles. Ankle joint deformity in the frontal plane is frequent in patients who had a stroke. A measure of PS angle is needed to assess both the deformity level and the efficacy of the selected treatment, amongst orthoses, botulinum toxin injection, functional surgery and rehabilitation protocols.
References [1] Leardini A, et al. Gait & Posture 2007; 25:453-462. [2] Jenkyn TR, Nicol AC. Journal of Biomechanics 2007; 40:3271-3278. [3] Hunt AE, et al. Clinical Biomechanics 2001; 16:592-600.
251

TECHNIQUE FOR ASSESSING FOOT KINEMATICS AND PLANTAR SOFT
TISSUE STIFFNESS DURING STANCE FOR VARYING ARCH STRUCTURES
Carolyn Roposh 1, Carole Tucker
2, Margo Orlin
1, Rami Selikar
1
1: Drexel University, Philadelphia, Pa; 2: Temple University, Philadelphia, Pa
Introduction- The foot greatly impacts bipedal locomotion and an improved understanding of
foot biomechanics can lead to better clinical decision making. During gait, the medial arch
absorbs most of the impact and is considered the main support structure. Current theory and in
vitro research suggests that as the arch height decreases, the structural stability of the foot is
compromised [1, 2]. Though the relationship between decreased arch height and increased
foot flexibility is accepted within the clinical community, there is little in vivo evidence to
support this claim, nor knowledge of the effect of arch structure on plantar surface stiffness
due to higher impacts [2-6]. The overall objective of this research is to examine the effect of
the arch structure, foot kinematics, and plantar soft tissue stiffness during walking. We
hypothesize that flexible high arched feet will have a greater range of motion and decreased
plantar stiffness. Clinical Significance- A higher arch structure is typically less flexible and
could exhibit increased stiffness due to rigid foot kinematics [1]. Studies using current motion
capture techniques have not detected consistent differences in foot mechanics of varying arch
height structures [2-5]. A kinematic model would be useful to quantify foot biomechanics to
better support clinical practice. Similarly, assessment of soft tissue is particularly important
for foot structures that may be prone to exhibit increased stiffness [1]. Any damage to the soft
tissue of the plantar surface can result in increased plantar stiffness and higher forces which
have been associated with foot pain [6]. Plantar stiffness has been evaluated using a variety of
methods, but there are no standardized methods to measure plantar stiffness that take into
account the real time, dynamic, weight bearing condition of the stance phase of gait.
Therefore, it is important to develop a technique to examine foot mechanics and plantar
stiffness, to improve clinical decision-making and therapeutic management, as well as to
prevent injury. Methods- Eight Vicon motion capture cameras were positioned around a
Novel EMED-ST/E pedobarograph. Markers and triads were placed on boney landmarks of
four subjects to track the movement of the feet. Subjects were classified as high arched and
the arch stiffness was calculated using the same method as Williams et al (2000) [7]. Static
standing and sitting trials were captured to determine offsets for the kinematic model and the
stiffness calculation. Data was collected while the subjects walked along a 20 foot pathway. A
foot kinematic model was implemented using Vicon Bodybuilder v. 3.6 (Vicon Motion
Systems, Oxford Metrics Ltd., Oxford, England). Marker positions and anatomical
relationships were used to define four functional units of the foot (rearfoot, midfoot, first
metatarsal and lateral forefoot). Stiffness of the soft tissue was calculated using deformation
and force inputs for a simple spring model using motion capture and pedobarography data.
Deformation of the soft tissue was tracked for each segment in the vertical direction when the
foot was unloaded and during walking trials. This trajectory data were limited to the time the
segment had contact with the ground determined by pedobarograph data. Force for each
segment was specified to corresponding deformation data, and all the data was inputted into
the equation for a simple spring. Results- All of the subjects were classified as having high
arch structures, however two of the subjects had flexible arches while the remaining subjects
were nearly twice as stiff. The difference between the peak maximum and minimum range of
252

motion was analyzed to determine flexibility of the foot during stance. Of the 15 possible
rotations examined, the two flexible high arched subjects had a greater range for 11 of the
rotations. The maximum stiffness values for the two subjects with rigid arch types were
higher for the heel and first metatarsal segments than subjects with more flexible arch
structures. The midfoot segment had higher stiffness values in the flexible high arch subjects.
The heel and midfoot segments show a maximum stiffness at mid contact while the first
metatarsal and hallux show the peak towards the end of contact. Discussion-This preliminary
work demonstrates the feasibility of the proposed methods of characterizing foot function and
structure. The arch stiffness was taken into consideration while examining the range of
motion of the high arched subjects. As expected the flexible arched subjects had higher ranges
of motion in the majority of the rotations. Since the preliminary data did not include low arch
subjects, the results were compared to a similar study. Cobb et al (2009) tested subjects with
mobile low-arches and typical arch structures in sandals using similar definition for
segmentation of the foot. The ranges of motions for the tibia-heel rotations of the high arch
subjects were lower than those of typical. However, some of the rotations of the heel and first
metatarsal with respect to the midfoot showed higher ranges in the high arch subjects [5]. This
outcome illustrates the importance quantifying the arch stiffness when examining foot
kinematics in the high arched population. Rigid kinematics appears to influence the plantar
stiffness of subjects within the same arch height group. The higher stiffness values in the
midfoot segment of the flexible arches indicate that this arch structure may not be able
dissipate the forces as effectively during walking. Future work will include subjects with
flexible low arches for comparison to these results. This work also demonstrates that
combining motion capture data with pedobarograph data can characterize plantar stiffness
during dynamic weight-bearing conditions such as level walking. These results show that
plantar surface stiffness changes during the dynamic condition of stance. Such variations in
plantar stiffness during loading and unloading may relate to subsequent alterations in
biomechanics and function. Further analysis is needed to evaluate the reliability of the
method, to validate the findings, and to determine the responsiveness of the approach for
different foot structures. Acknowledgement We’d like to thank the patients, families and
staff at The Motion Analysis Laboratory, Shriners Hospital for Children – Philadelphia for
their assistance with data collection. References-[1] D. H. Van Boerum and B. J. Sangeorzan,
"Biomechanics and pathophysiology of flat foot," Foot and Ankle Clinics of North America,
vol. 8, pp. 419-430, 9. 2003. [2] Wilken, J. The effect of arch height on triplanar foot
kinematics during gait. Doctor of Philosophy The University of Iowa, 2006. [3] A. E. Hunt
and R. M. Smith, "Mechanics and control of the flat versus normal foot during the stance
phase of walking," Clinical Biomechanics, vol. 19, pp. 391-397, 5. 2004. [4] A. E. Hunt, A. J.
Fahey and R. M. Smith, "Static measures of calcaneal deviation and arch angle as predictors
of rearfoot motion during walking," Aust. J. Physiother., vol. 46, pp. 9-16, 2000.[5] S. C.
Cobb, L. L. Tis, J. T. Johnson, Y. “. Wang, M. D. Geil and F. A. McCarty, "The effect of low-
mobile foot posture on multi-segment medial foot model gait kinematics," Gait Posture, vol.
30, pp. 334-339, 10. 2009. [6] K. Rome, P. Webb, A. Unsworth and I. Haslock, "Heel pad
stiffness in runners with plantar heel pain," Clinical Biomechanics, vol. 16, pp. 901-905, 12.
2001. [7] D. S. Williams and I. S. McClay, "Measurements Used to Characterize the Foot and
the Medial Longitudinal Arch: Reliability and Validity," Physical Therapy, vol. 80, pp. 864-
871, 2000.
253

Comparison of Six-Segment-Foot Movements between MRI and Motion System in TD Children
1Marquez-Barrientos C., Liu, X.C., Thometz, J., Lyon, R., 2Tarima, S., and 3Verber M 1Musculoskeletal Functional Assessment Center, Dept. of Orthopaedic Surgery, Children’s Hospital of WI, 2Dept. of Biostatistics, 3CSTI, Medical College of Wisconsin
Introduction: Although multiple foot segment models have been developed using an optically based motion analysis system (1,2), few studies have applied an Electromagnetic Motion Tracking System (EMTS) to measure movement in children (3). An advantage of the EMTS is that mini sensors (0.6 cm or 1.5 cm) can be placed on the limited anatomical landmarks of a child’s foot. The 3D measurement of foot joint angles has been done using MRI images by Udupa et al. and has proven to be a reliable tool in characterizing 3D motion and bone configuration. The objectives of this study are: 1) to advance a 6-segment-foot MRI measurement tool to calculate three axes angles (principal, 2nd and 3rd) using imaging software; 2) to compare 3D joint angles derived using EMTS with those derived using MRI for children as foot movement occurs in an ankle joint motion device. Clinical Significance: The EMTS has become an alternative to optically based motion tracking systems and provides more opportunities to measure the kinematics of the small joints found in children. We will try to establish a protocol to assess joint rigidity based upon 3D MRI kinematics in children. Methods: Ten patients between 10-18 years of age, without a history of foot pathology had their feet imaged using an MRI (General Electric, Milwaukee, USA). The patients’ feet were positioned using a non-weight bearing polymeric ankle joint motion device (Chamco, Cocoa, FL). MRI images were taken of the foot when it was placed in two “external” positions (dorsiflexing up to 10°, externally rotating up to 20°, and everting up to 10°), three “internal” positions (plantarflexing up to 15°, internally rotating up to 30°, and inverting up to 15°), and a neutral position. Six bones were extracted from the MRI images using 3DVIEWNIX (4): the Tibia, the Calcaneus, the Cuboid, the Navicular, the 1st Metatarsal, and the Hallux. The “Live Wire” segmentation feature was used to trace the bones. The traced bone images were smoothed with a 3D Gaussian filter and used to created 3D volumes. Centroid axes were calculated from bone volumes. The relative rotation between bones in the foot was calculated using the centroid axes. The relative rotation of the principal axes in a bone from one position to another could be calculated for any position. The same subjects had their foot motion measured using the EMTS (Polhemus, VT). Six markers were placed on the leg to approximately measure the movement of the Tibia, Calcaneus, Cuboid, Navicular, 1st Metatarsal, and Hallux (3). The subjects again had their feet placed in the ankle joint motion device and placed in the same positions as previously examined. The relative rotation of the markers between positions could easily be determined.
254

Results:A statistical analysis found that there were significant differences and correlation between EMTS and MRI measurement in some joints and certain positions. For the Tibia-Calcaneus joint, the rotation around the internal/external axis of the EMTS corresponded in several of the internal positions to the rotation around the 1st principal axis of the tibia (Figure 1). There was some correspondence between rotation around the internal/external axis of the EMTS and the rotation around the third principal axis of the 1st Metatarsal and Hallux joint (see table 1).
Position Correlation Coefficient
P value
Neutral to External 1
-0.20 0.58
Neutral to External 2
0.67 0.03
Neutral to Internal 1
-0.55 0.10
Neutral to Internal 2
-0.73 0.02
Neutral to Internal 3
-0.71 0.02
Table 1. Correlation for the 1st Metatasrsal- Hallux joint between the transverse rotation of the EMTS and the rotation around the 1st principal axis of MRI
Figure 1. The rotation around the 1st principal axis of the tibia versus the rotation around the internal/external EMTS axis.
Discussion:Overall the change in rotation measured for the MRI angles is larger than those measured in the EMTS. Differences and correlation of these measurements increase with increased foot rotation for certain joints. It is apparent that the EMTS coordinates and the MRI system principal axes do not always rotate in the same planes. The sagittal, transverse, and coronal plane rotations do not correspond closely to the principal axes rotations for Calcaneus-Cuboid joint and Navicular-1st Metatarsal joint.
Reference:1. Leardini A, Benedetti MG, Catani F, Simoncini L, and Giannini S. An anatomically
based protocol for the description of foot segment kinematics during gait. Clinical Biomechanics 1999, 14:528-536.
2. MacWilliams BA, Cowley M, Nicholson DE. Foot kinematics and kinetics during adolescent gait. Gait and posture 2003, 17: 214-224.
3. Liu XC, Thometz, R.Lyon, and Boudreau C. Dynamic six-segmental foot model using EMTS. 20th International Society of Biomechanics/29th American Society of Biomechanics, Abstracts, Cleveland, OH, 2005.
4. Udupa JK “3DVIEWNIX: An open, transportable, multidimensional, multimodality, multiparametric imaging software system” SPIE Proc. Vol 2164, p 58-73, 1994.
••
255

The Influence of Heel Height on Pelvis Kinematics and Trunk Muscle Activity During Gait
Yi-Chen Chou, Alicia A. Foster, Mark G. Blanchette, MS, Christopher M. Powers, PhD, PT Jacquelin Perry Musculoskeletal Biomechanics Research Laboratory
Division of Biokinesiology & Physical Therapy, University of Southern California 1540 E. Alcazar St., CHP-155, Los Angeles, CA 90089
Introduction Wearing high-heeled shoes has been associated with several clinical conditions, including low back pain.1 Although high-heeled gait has been well described for the lower extremity,2 pelvis kinematics and trunk muscle activity have received limited attention.3,4 The association between wearing high-heeled shoes and low back pain suggests that trunk and pelvis motion may be altered when compared to wearing low-heeled shoes.5 The purpose of this study was to evaluate the influence of shoe heel height on pelvis kinematics and the electromyography (EMG) of erector spinae (ES) and rectus abdominis (RA) during gait. Clinical Significance The results of this investigation may provide insight as to whether wearing high heeled shoes increases an individual’s likelihood of developing low back pain. Data obtained from this study may highlight the need for increased awareness and proper education related to the wearing of high-heeled shoes. Methods Twenty healthy women (mean age 25.3 ± 4.0 yrs) participated in this study. Participants walked at self-selected velocity under 2 different shoe conditions (low heel: 1.27 cm; high heel: 9.53 cm). Each subject was provided with footwear in their respective shoe size. Both pairs of shoes were made by the same manufacturer and were chosen for their similarities in design, construction materials, and quality. Using a standard lower extremity marker set, 3D kinematics of the pelvis were quantified using an 8 camera motion analysis system (Vicon; 120 Hz). EMG signals of the ES and RA muscles were recorded using surface electrodes (1560 Hz). Subjects performed 5 walking trials for each shoe condition. Kinematic variables of interest included the peak anterior tilt angle during stance as well as peak forward rotation and backward rotation of the pelvis during early and late stance respectively. EMG variables of interest included peak EMG amplitude (% MVIC) during the first 20% of stance. Paired t-tests were performed to assess for differences in kinematic and EMG variables between the 2 shoe conditions. Significance levels were set at p<0.05. Results The self-selected gait speed during the high heel condition was found to be significantly slower than the low heel condition (1.2 m/s vs. 1.4 m/s; p<0.001). A significant increase in peak forward rotation of the pelvis was found in the high heel condition compared to the low heel condition (3.1° vs. 5.0°; p<0.001). No significant differences were found for peak anterior tilt or peak backward rotation of the pelvis between the 2 shoe conditions. With respect to the EMG results, significantly greater trunk muscle activation was found during the high heel condition compared
256

to the low heel condition (RA: 5.4% vs. 8.1% MVIC, p=0.008; ES: 19.8% vs. 29.8% MVIC, p<0.001)(Fig.1).
Fig 1. Comparison of peak normalized EMG activity (% MVIC) of the RA and ES while wearing low and high heeled shoes. * indicates significant difference between the 2 shoe conditions. Discussion Wearing high heels is thought to be a contributing factor to low back pain. The findings of our study support this premise as wearing high heels resulted in greater activation of the trunk musculature, particularly the ES. We believe this finding is relevant as Lamoth and colleagues5 have reported that increased ES activity may contribute to low back symptoms.5 The greater trunk muscle activity observed during the high heel condition did not appear to be related to pelvis motion as kinematic differences between the 2 shoe conditions were minimal. As such, the greater muscle action of RA and ES when wearing high heels may reflect the need for greater trunk control in the presence of diminished stance stability. References 1. Opila-Correia KA. Kinematics of high-heeled gait with consideration for age and
experience of wearers. Archives of Physical Medicine and Rehabilitation. 1990;71:905-9. 2. Stefanyshyn DJ, Nigg BM, Fisher V, O'Flynn B, Liu W. The influence of high-heeled
shoes on kinematics, kinetics, and muscle EMG of normal female gait. Journal of Applied Biomechanics. 2000;16:309-19.
3. Joseph J. The pattern of activity of some muscles in women walking on high heels. Annals of Physical Medicine. 1967;7:295-9.
4. Lee CM, Jeong EH, Freivalds A. Biomechanical effects of wearing high-heeled shoes. International Journal of Industrial Ergonomics. 2001;28:321-6.
5. Lamoth CJ, Daffertshofer A, Meijer OG, Beek PJ. How do persons with chronic low back pain speed up and slow down? Trunk-pelvis coordination and lumbar erector spinae activity during gait. Gait & Posture. 2006;23:230-9.
257

Plantar Pressure Analysis Repeatability: Use of Motion Capture Markers for Automated Division of the Foot
Miller, AL Mary Free Bed Rehabilitation Hospital; Grand Rapids, MI USA
Introduction:
A common method for analyzing plantar pressure data involves dividing the foot into regions and calculating values specific to each region. For example, Bowen et al. divided the foot into five segments and calculated a ratio of the pressure within each region to the maximum pressure under the foot [1]. The repeatability of these methods depends largely on repeatable division of the plantar pressure distribution. Division of the foot when there is abnormal or partially absent foot contact is challenging or impossible. Consequently, the concept of synchronizing motion capture and plantar pressure data for subdivision of the foot was first introduced by Giacomozzi et al. [2]. In this method, reflective markers placed on bony landmarks are projected onto the plantar pressure mat and are used to automatically divide the foot. Stebbins et al. refined and utilized this method to assess repeatability of peak force and peak pressure measurements [3]. However, the impact of marker placement variability on the repeatability of this method has not been quantified.
Clinical Significance: Abnormal muscle control and secondary static deformity often result in deviations in foot structure
and function, which alter the pressure distribution between the plantar surface and the floor. These complex and varied deviations are often the target of surgical or non surgical treatments. Therefore, documentation of treatment outcomes using plantar pressure measurement is of clinical interest. An understanding of the repeatability of the measures is required for proper interpretation of change. Methods:
Data were collected on two typically developing subjects. Subject 1 was a 10 year-old female, 43kg in mass and 152cm in height. Subject 2 was a 12 year-old female, 54kg in mass and 134cm in height. Each subject underwent 6 gait analysis sessions within a single day; three performed by each of two proficient Motion Analysis Center staff members. In each session, detailed pedobaragraph data were obtained by synchronizing motion capture and plantar pressure measurements systems. A 12-camera Vicon MX system and a Tekscan HR-Mat were used to collected data at 120Hz and 60Hz sampling frequencies, respectively. Foot markers were placed, bilaterally, based on modified definitions provided by Leardini et al.[4] and used to subdivide the foot into 8 regions: medial hindfoot (MHF), lateral hindfoot (LHF), medial midfoot (MMF), lateral midfoot (LMF), medial forefoot (MFF), lateral forefoot (LFF), medial toe (MTOE), and lateral toe (LTOE). Peak contact pressure (kPa), impulse (% total impulse), peak force (% body weight) and contact time (% stance) were calculated for each region of the foot for 5 gait cycles in each session. The intra-session, intra-placer, and inter-placer standard error and the pooled mean of each measurement were then estimated using the methods outlined by Schwartz et al [5].
MHF LHF
MMF LMF
LFF MFF
LTOE MTOE
Fig 1: Plantar Pressure Division
258

Results: The intra-session, inter-placer, and intra-placer
standard error in addition to the pooled mean of each
variable are shown in Table 1. The relatively low
mean midfoot impulse was caused by the lack of
midfoot contact in the two subjects in this study. The
largest peak force and contact time occurred in the
medial and lateral forefoot, resulting in the highest
impulse to also occur in these regions. Excluding the
midfoot, the average inter-placer coefficient of
variation of contact time, contact pressure, peak force,
and impulse were 12%, 18%, 26%, and 30%,
respectively.
Discussion:
Much of the variability in this study was due to
intrinsic variability in the subjects’ gait. The relative
similarity in the magnitude of the inter-marker placer
standard error values and the intra-session standard
error values indicates that the variability induced by
the recalibration of data collection equipment and
marker placement was minor. This supports the use
of combined motion capture and plantar pressure
measurement for quantification of plantar pressure
patterns.
The standard error values estimated in this study
aid in the identification of statistically significant
differences in plantar pressure variables. Simple t-
tests can be used to determine if changes or
abnormalities in a subject’s plantar pressure
measurements are statistically significant. For
example, a t-test could be conducted using the inter-
placer standard error and standard error of the mean of
a normal dataset to determine whether or not a
deviation can be considered abnormal or if the
deviation could be due to error induced by marker placement alone.
References
1. Bowen TR, et al. Pediatr Orthop 1998;18:789–93
2. Giacomozzi C, et al. Med Biol Eng Comput 2000;38:156–63.
3. Stebbins J, et al. Gait Posture 2005;22:372-76.
4. Leardini A, et al. Clin Biomech (Bristol, Avon) 1999;14:528–536.
5. Schwartz, M, et al. Gait Posture 2004;20:196-203
a = pooled mean
b = intra-session std. error
c = intra-placer std. error
d = inter-placer std. error
a 61 66 ab 11 11 bc 12 12 cd 12 13 da 75 83 ab 7 3 bc 9 3 cd 8 3 da 14 28 ab 11 13 bc 12 14 cd 12 16 da 58 55 ab 5 5 bc 5 5 cd 5 5 d
MM
F
LMF
MH
F
LHF
Contact Time (% Stance)
MTO
E
LTO
E
MFF
LFF
a 8 3 ab 2 1 bc 2 1 cd 3 1 da 25 26 ab 4 6 bc 5 6 cd 5 7 da 0 0 ab 0 1 bc 0 1 cd 0 1 da 20 18 ab 4 4 bc 4 4 cd 5 4 d
MFF
LFF
MM
F
LMF
MH
F
LHF
Impulse (% Total Foot)
MTO
E
LTO
E
a 31 11 ab 8 4 bc 8 4 cd 9 5 da 82 72 ab 10 14 bc 13 16 cd 14 16 da 1 2 ab 0 2 bc 0 2 cd 1 3 da 72 68 ab 13 11 bc 14 13 cd 16 14 d
MM
F
LMF
MH
F
LHF
Force (% Body Weight)
MTO
E
LTO
E
MFF
LFF
a 175 129 ab 27 25 bc 30 30 cd 34 30 da 345 245 ab 39 30 bc 53 39 cd 60 42 da 46 61 ab 26 20 bc 30 25 cd 31 26 da 363 278 ab 37 29 bc 48 39 cd 52 42 d
MH
F
LHF
Contact Pressure (kPa)
MTO
E
LTO
E
MFF
LFF
MM
F
LMF
Table 1: Repeatability Study Results
259

The relationship between foot kinetics and kinematics during gait in children with cerebral palsy and triceps surae contracture Derek Curtis1,2, Jesper Bencke1, Ben Stansfield3
1Ganganalyselaboratoriet, Hvidovre Hospital, Copenhagen, 2Fysioterapien, Hvidovre Hospital, Copenhagen, 3School of Health and Social Care, Glasgow Caledonian University, Glasgow, UK
1. Introduction There are a number of methods for documenting the effect of an intervention on foot loading. The two most widespread methods are pedobarography, which measures foot kinetics, and 3D gait analysis using the Oxford foot model, which measures foot kinematics. The aim of this study was to investigate the relationship between foot kinetics and kinematics during gait, comparing results from pedobarography and the Oxford foot model in children with cerebral palsy (CP) with triceps contracture.
2. Clinical Significance The ultimate aim of treatment in the lower extremity in CP is to normalize forces and moments around the joints. The models or measurement techniques used as outcome measures should therefore be sensitive to changes in forces and consequently moments around the targeted joints. The objective of this study was to assess to what extent the Oxford foot model contra pedobarography could measure differences in loading patterns between feet in healthy children compared with those of children with spastic CP and triceps contracture. The outcome from this study should help to guide the clinician in their choice of outcome measure when considering foot pathologies in children with spastic CP.
3. Methods Eight children (4 girls, 4 boys, mean ± SD, 12 ± 2yrs, range 8-15yr) with spastic CP and a contracture or catch in their triceps surae limiting dorsiflexion to a maximum of 0º with a fully extended knee were included in the study. Kinematic data was collected for 3 trials at self-selected walking speed using a Vicon 612 eight-camera system (Oxford Metrics, Oxford, England). Foot kinematics were calculated using the Oxford foot model1. Plantar pressure measurements were obtained from three walking trials at self-selected speed for the same children using an EMED-NT pressure platform (Novel, Munich, Germany). The inherent Novel Scientific Analysis software (Version 13) was used to analyze the pressure data by dividing the foot, using the automask function, into ten anatomical regions. The gait cycle was divided into three rockers and swing phase2. Typical parameters associated with equinus gait measured using the Oxford foot model and pedobarography were compared with data from an age and gender matched group of 8 healthy children.
4. Results There were no statistically significant differences in gender, age or anthropometry between the children with CP and healthy groups. Results from the Oxford kinematic foot model are shown in table 1. There were no significant differences in any of the kinematic parameters between the healthy and CP groups.
260

Table 1 Results from the Oxford foot model for healthy and CP groups Rocker Healthy group
mean±SD (deg) CP group
mean±SD (deg) T-test
sig. (2-tailed)
First Max. hindfoot dorsiflex. -0.7 ± 4.6 -1.4 ± 4.0 0.70
Second Max. hindfoot dorsiflex. 9.6 ± 5.6 5.8 ± 12.5 0.29 Max. forefoot dorsiflex. 8.6 ± 4.8 10.6 ± 4.7 0.24 Max forefoot pronation -4.7 ± 3.3 7.0 ± 11.3 0.44
Third Max forefoot pronation -6.4 ± 2.9 -7.5 ± 11.7 0.70
Table 2 shows the results from pedobarography of the healthy and CP groups. There was a highly significant difference between groups in all the parameters with the exception of the normalized lateral forefoot force in third rocker. Table 2 Results from pedobarography for the healthy and CP groups
Healthy group Study group Rocker mean force±SD (%BW) mean force±SD (%BW) T-test
sig. (2-tailed)
First Medial heel 29.0 ± 6.1 12.8 ± 13.0 0.00 Lateral heel 22.9 ± 4.3 10.7 ± 11.6 0.00
Second Medial heel 22.5 ± 4.3 12.0 ± 7.0 0.00 Lateral heel 17.1 ± 3.7 9.7 ± 5.9 0.00
Lateral forefoot 19.4 ± 3.8 31.0 ± 16.0 0.01
Third Lateral forefoot 13.3 ± 5.4 17.1 ± 10.9 0.23
5. Discussion It would appear that kinetics measured using pedobarography are affected to a greater extent than kinematics using the Oxford foot model in children with triceps surae contracture. There are two possible reasons for this difference. The first is that measurements using pedobarography are more repeatable than kinematic measurement using stereophotogrammetry. This may be true in some planes, but repeatability of the Oxford foot model in the sagittal plane is very good1, 3. The more probable reason for the difference between the methods is that the Oxford foot model measures kinematics and pedobarography measures kinetics. It may well be that a large change in forces around the foot are required to produce a more moderate change in foot kinematics. This would seem to indicate that it is important to examine foot kinetics and not solely foot kinematics when considering foot function and treatment outcome in cerebral palsy.
6. References 1. Stebbins J, Harrington M, Thompson N, Zavatsky A, Theologis T Repeatability of a model for
measuring multi-segment foot kinematics in children. Gait Posture 2006; 23: 401-410 2. Perry J Gait Analysis: Normal and Pathological Function. Thorofare, NJ: SLACK Incorporated,
1992 3. Curtis DJ, Bencke J, Stebbins JA, Stansfield B Intra-rater repeatability of the Oxford foot model
in healthy children in different stages of the foot roll over process during gait. Gait Posture 2009; 30: 118-121
7. Acknowledgements Many thanks to Julie Stebbins at the Oxford Gait Laboratory for technical assistance and advice in the use of the Oxford foot model.
261

Stair descent performance in older women: changes in kinetic profile and muscle activity following power training
Holsgaard-Larsen, A.1,2, Sørensen, H.3, Caserotti, P.2,4, Puggaard, P.2, Aagaard, P.2
1Institute of Clinical Research, University of Southern Denmark.
2Institute of Sports Science and Clinical Biomechanics, University of Southern Denmark 3Department of Sport Science, University of Aarhus, Denmark
4Laboratory of Epidemiology, Demography, and Biometry, NIH, Bethesda, USA
Introduction: Stair walking is an important functional movement task that requires considerable amounts of muscle strength/power (1-3) and is considered one of the most hazardous activities in everyday life (4). With increasing age, stair walking becomes more demanding as the relative load imposed on the leg extensor muscles increases significantly (3). Further, elderly may adopt a gait pattern with elevated antagonist muscle coactivation to ensure a more stable postural balance (2). However, biomechanical measurements of ground reaction force (GRF) and antagonist muscle coactivation during stair walking of elderly individuals are limited. The aim of the present study was to test the hypothesis that power training would lead to increase in stair descent performance mediated by changes in kinetic profile and reduced antagonist muscle coactivation in elderly women. Clinical Significance: Old people perform stair walking very close to their maximum performance (2;3). Increased antagonist coactivation has been observed during stair walking in elder subjects compared to young (2), which may limit the full potential of agonist muscular function (5;6). Strength/power training in the elderly leads to enhanced neuromuscular performance (6;7) and/or reduced antagonist coactivation (6) which suggests a more economic movement pattern. Strength/power training has the potential to increase functional independence and may potentially reduce the risk of falling during stair descending in elderly individuals. Methods: Nineteen healthy elderly women (age 69.7 ± 3.4 years, mean ± SD) were randomized into training (TG) (n = 10) or controls (CG) (n = 9). TG performed power training (8) for the leg muscles (12 weeks, 5 exercises, 4 sets, 8-10 RM, twice per wk). Stair walking analysis: Stair descent at self chosen velocity was performed at baseline and post intervention. Kinetic variables were obtained from a force plate (Kistler 9281 B, Winterthur, Switzerland) integrated into a 9-step staircase (rise: 16 cm; depth: 23 cm; width: 60 cm). Strides per minute and vertical GRF were recorded according to previous published methods (2). In brief, the GRF signal was normalized to body weight (% BW) and the first and second peak GRF force (Fz2, Fz4) were identified, respectively, along with the minimum GRF (Fz3) within this interval. The mean force in the entire stance phase (Fmeanstance), mean force in the Loading Phase (Fmeanload; onset of force to Fz2), and mean force in the Unloading Phase (Fmeanunload; Fz4 to toe-off) were also calculated. Further, Loading Slope ( F/ t; onset of force production to 80% Fz2) and Unloading Slope ( F/ t; 80% Fz4 to toe-off) were calculated. Antagonist coactivation: bipolar surface EMG signals were obtained from vastus lateralis (VL), vastus medialis (VM), rectus femoris (RF), biceps femoris (BF), semitendinosus (ST)) of the left leg during stair descent and were subsequently normalized to the maximal EMG
262

signal amplitude obtained during maximal voluntary isometric contractions (MVC). The degree of agonist-antagonist muscle coactivation was calculated as the magnitude of relative signal-overlapping (common EMG-signal area) divided by the total unified EMG-signal area (2). Muscle coactivation was evaluated for the thigh muscles involved in knee extension and flexion, respectively ([VM + VL + RF] / [BF + ST]), and was calculated separately in the Entire Stance Phase, Loading Phase, and Unloading Phase (2). Maximal muscle strength: Isolated quadriceps and hamstring strength were assessed by use of isokinetic dynamometry (KinCom 500H, Chattecx Corp, TN, USA). Maximal gravity-corrected knee extensor and flexor torques were obtained during slow (30o s-1) concentric and eccentric contractions of the quadriceps and hamstring muscles, respectively. Range of motion was 90° to 20° (0° = full knee extension). Details of the measuring procedures have been described elsewhere (2). Pre-to-post intervention changes were evaluated using Wilcoxon signed rank test (within-group) and level of significance was set at P < 0.05. Results: Maximal thigh muscle strength increased in TG after the period of training (Quadriceps-ecc: +11%, P<0.001; Quadriceps-con: +16%, P<0.01; Hamstring-ecc: +14%, P<0.05; Hamstring-con: +21%, P<0.01). Maximal muscle strength remained unchanged in CG. Self chosen stair descent velocity (Strides per min) remained constant for both groups. Elevated Fmeanstance (+4%, P<0.05), Fmeanload (+23%, P<0.01), Fz2 (+10%, P<0.01), and Unloading Slope (+18% P<0.05) were observed in TG following the period of training. A small, albeit significant decrease in FZ3 (-5%, P<0.05) was observed in CG. Discussion: The present study demonstrates that power training in elderly women can lead to increases in kinetic profile during stair descent at self chosen speed. However, the magnitude of thigh muscle coactivation remained unaltered. Progressive long-term (6 month) heavy-resistance training has previously been found to reduce antagonist muscle coactivation in elderly subjects when recorded in standardized isolated motor tasks (MVC, dynamic leg extension) (6). The present improvements in maximal muscle force characteristics might not per se have been adequate to affect antagonist muscle coactivation while performing a more complicated motor task (stair walking). Alternatively, the healthy and active elderly subjects studied in the present study may have shown a level of antagonist coactivation that was optimally tuned already prior to training. Despite not being able to reduce the antagonist coactivation the present training regime lead to an increased kinetic profile during stair descent. This observation could be of clinical interest since it indicates an improved functional capacity. References
(1) Larsen et al., Scand J Med Sci Sports. 19, 678-86, 2009 (2) Larsen et al., J Electromyogr Kinesiol. 18, 568-80, 2008 (3) Hortobagyi et al., J Gerontol A Biol Sci Med Sci. 58, 117-26, 2003 (4) Roys, Appl Ergon. 32, 135-9, 2001 (5) Hortobagyi & Devita, J Electromyogr Kinesiol. 10, 117-26, 2000 (6) Hakkinen et al., J Appl Physiol. 84, 1341-9, 1998 (7) Suetta et al., J Appl Physiol. 97, 1954-1961, 2004 (8) Casserotti et al., Scand J Med Sci Sports. 18, 773-782, 2008
Acknowledgements: This study was supported by research grants from the Danish Ministry of Social Affairs.
263

Title: The use of the velocity-dependent muscle activation Index to detect the effect of Botulinum Toxin A injection in the medial Gastrocnemius.
Authors: Tirosh Oren, PhD 1, Wong Matthew, M Eng 1, Rutz Erich, MD 1,2,3
1 Murdoch Childrens Research Institute, Royal Children’s Hospital, Victoria, Australia2 Pediatric orthopeadics University Children’s Hospital Basle UKBB, Switzerland 3 Laboratory for Gait Analysis, University Children’s Hospital Basle UKBB, Switzerland
Introduction: Clinical accepted spasticity is a motor disorder characterized by velocity-dependent increase of muscle activation upon lengthening [1]. Botulinum toxin A (BTX-A) injections are an effective treatment of spasticity in children with Cerebral Palsy (CP) which reduces the muscle tone for approximately 8 to 12 weeks [2]. While gait kinematics reported to improve as result of BTX-A injection, there are no evidence of improvement in muscle activity indicated by surface electromyography (sEMG) [3, 4]. Recently, time–frequency characteristics of muscle activation quantified by instantaneous mean frequency (IMNF) have been suggested to be more reflective of the resultant changes in gait kinematics [5]. It is possible that examination of sEMG in the time domain (amplitude) only, as done in previous studies, is insufficient to show improvement in muscle activation. By coupling IMNF and gait kinematics, we developed an Index to quantify velocity-dependent muscle activation during gait [6]. Greater Index values for Medial Gastrocnemius (MG) were associated with greater Ashworth Scale of spasticity, with significant large correlation (r = 0.72). Our goal here was to examine the improvement of MG activity pre, 6 and 12 weeks post BTX-A injection using our developed Index and other conventional sEMG processing methods. Clinical Significance: The novel velocity-dependent muscle activity Index is suggested to be a good indicator on to the effect of BTX-A injection on MG activation. The Index is both objective and dynamic measurement that can be measured during walking and may be appropriate for assessing spasticity interventions.
Methods: We performed a retrospective analysis of 10 children (age 13.5±4.5 years) with CP (6 hemiplegia and 4 diplegia) having single BTX-A test injections for planning surgery preoperatively, 6 and 12 weeks after the test injection. Each test included 4 time-normalised trials of three-dimensional gait analysis (3DGA) simultaneously recorded with sEMG from the MG. The BTX-A injection was controlled by ultrasound in all cases. The average dosage was 50 U of botulinum toxin per muscle. Surface EMG signals were pre-amplified, band-pass filtered (20–500 Hz) at a sampling rate of 2520 Hz, which followed by 3 different processing methods:
1. Muscle activation time as percentage in the gait cycle (tOn): determined by identifying when muscle is switch ‘on’ and ‘off’ [7] and calculating the percentage of the time in the gait cycle when the muscle is ’on’ (active).
2. Linear envelope Root Mean Square Difference (RMSD): determined by calculating time-normalised linear envelopes (6Hz lowpass filter) from 4 strides followed by gain-normalisation and RMSD relative to normal patterns [8].
3. Velocity-dependent muscle activation index (Indx): determined by performing continues wavelet transform (CWT) analysis from time-normalised sEMG to generate IMNF curves [5]. Followed by calculating
264

† p < .05, # p< = 0.045, * p < .01, ‡ p < .01,
the ratio of the peak joint angular velocity (Vmax) measured from the initial swing phase and the IMNF value (IMNFVmax) at the time where the peak joint angular velocity occurred, Indx= IMNFVmax / Vmax [6].
For each processing method a Repeated Analysis of Varience was used to indicate any significant difference between the 3 testings (pre, 6, and 12 weeks after BTX-A injection). The injected limb was analysed as the affected side. For the unaffected side analysis, data from only the hemiplegic patient group was considered. Results: Six and 12 weeks after BTX-A injection there was no significant differences in muscle activity on both sides indicated by tOn (see table). In the sEMG patterns indicated by RMSD, only the affected side showed significant deterioration between pre and 12wks. Conversely, the Indx indicated significant improvement in the affected side after both 6 and 12 weeks post BTX-A injection. In the unaffected side the Indx showed significant deterioration between 6 and 12 weeks post BTX-A injection, but with no significant differences between pre and post 12 weeks.
Side Variable Pre 6wks 12wks tOn 80.7±8.8 80.1±10.2 79.8±11.6 RMSD † # 0.077±0.022 † 0.095±0.048 # 0.092±0.025 Affected Indx ‡ * 0.45±0.38 ‡ 0.33±0.25 * 0.31±0.14 tOn 71.9±13.9 73.3±10.4 65.8±17.0 RMSD 0.072±0.037 0.060±0.017 0.060±0.034 Unaffected Indx 0.22±0.08 ^ 0.18±0.05 ^ 0.24±0.08
Discussion: The three sEMG processing methods showed various results in the effect of BTX-A injection in MG. Evaluation of muscle activation timing (tOn) that showed no significant changes are in agreement with earlier findings [3]. In addition, the RMSD results are in line with previous studies [4, 8] where deterioration of sEMG patterns in MG was detected post 6 weeks BTX-A injection. Calculation of the velocity-dependent muscle activation Index, however, did show significant improvement after 6 weeks, with further improvement after 12 weeks. This is inline with Gracies [2] who suggested that BTX-A injection reduces the muscle tone for approximately 8 to 12 weeks. The Indx is calculated by coupling kinematics and sEMG data. This may suggests that sEMG alone, is not sufficient to indicate changes in MG mechanics. Previously, we found large positive correlation between Indx values and Ashworth Scale [6], which is most common clinical test for spastic hypertonia. Botulinum Toxin A injection is aimed to reduce spasticity, which strengthen the argument of using Indx values for spasticity management. Nevertheless, further investigation is needed in finding objective functional measurements for spasticity. References: 1. Crenna P, in: Delwaide PJ, Young RR (Eds.), Elsevier, Amsterdam, 1985, pp. 109–124. 2. Gracies JM. Mov Disord 2004;19(Suppl. 8):S120-8. 3. Sutherland DH, et al. Gait Posture, 1996;4:269-279.4. Houwen L, et al. Gait Posture, 2009;30(Suppl 2):S6.5. Lauer RT, et al. Gait Posture 2007; 26: 420-7. 6. Tirosh O, et al. A novel index to quantify velocity-dependent muscle activation during gait of children with Cerebral Palsy., Submitted abstract JEGM2010. 7. Sophie H, et al. Gait Posture 1997;6:110-118. 8.Desloovere K, et al. Eur J Neurol 2001;8(Suppl 5):75–87.
265

DEVELOPME�T OF QUA�TITATIVE EVALUATIO� OF EMG CO�SISTE�CY
AMO�G SPI�AL CORD I�JURED PERSO�S DURI�G TREADMILL STEPPI�G
WITH BODY WEIGHT SUPPORT 1Peter M. Quesada, PhD,
1,2,3Claudia A. Angeli, PhD,
2,3Christie K. Ferreira, BS,
2,3Menka M. Sanghvi, MS,
2,3Andrea M. Willhite, BS, and
2,3Susan J. Harkema, PhD
1 Dept. of Mechanical Engineering, University of Louisville, contact: [email protected]
2 Department of Neurological Surgery, University of Louisville
3 Human Locomotion Research Center, Frazier Rehabilitation Institute
Introduction
Among individuals with spinal cord injury, burst durations and mean amplitude from
electromyography (EMG) signals are often computed to quantify muscle activation patterns,
during stepping with body weight support on a treadmill (BWSS) and with manual facilitation.
Evaluation of muscle activity consistency across stepping cycles, however, is more qualitative
and subjective. The purpose of the efforts described here is to develop quantitative evaluation of
muscle activity consistency during stepping using BWSS with manual facilitation.
Statement of Clinical Significance
Quantitative evaluation of EMG consistency during treadmill BWSS will provide for improved
assessment of outcomes among spinal cord injured individuals.
Methodology Development and Preliminary Results
EMG data recorded during stepping using BWSS with manual facilitation are processed, in
conjunction with lower extremity kinematic data, to quantitatively characterize the consistency
of muscle activity across stepping cycles. For the lower extremity joint motions (hip, knee and
ankle joint angles) the frequency spectrums are obtained (Fig 1) by applying the Fast Fourier
Transform (FFT) to assisted BWSS data. The dominant frequency (i.e. frequency at which peak
FFT coefficient magnitude occurs) is extracted to estimate stepping cycle frequency (i.e. the
number of gait cycles per time). The inverse of the dominant frequency then estimates cycle
duration. Stepping cycle duration is next multiplied by sampling rate to estimate number of data
samples per gait cycle (ncps).
For each muscle for which EMG data are obtained, the correlation coefficient between the initial
ncps EMG samples (i.e. sample 1 through sample ncps) and the succeeding ncps EMG samples (i.e.
sample ncps+1 through sample 2ncps) are computed. The succeeding ncps EMG samples are then
shifted forward by one sample (i.e. sample ncps+2 through sample 2ncps+1) and the succeeding
correlation coefficient with the initial ncps EMG samples is determined. This process of shifting
one EMG sample and computing the correlation coefficient is repeated until the final EMG
sample is reached. A time series of correlation coefficients results for each muscle for which
EMG data are obtained (Fig 2).
Further data processing will utilize two characteristics of the correlation coefficient time series.
The first is that EMG recordings from muscles that have more consistent activity from cycle to
cycle will produce correlation coefficient time series that oscillate in a more sinusoidal manner.
Additionally, correlation coefficient time series that are obtained from more consistent data time
series will appear highly similar despite dissimilarity between the data time series.
266

The FFT will next be applied to each EMG correlation coefficient time series (Fig 3). A series
that is obtained from a more consistent EMG activity recording will tend to have a very
predominant spike in its frequency spectrum, and have very low magnitudes across the
remainder of the frequency spectrum. Consequently, highly consistent EMG recordings will
generate higher predominant coefficient spike magnitudes, regardless of the nature of the EMG
data recording.
Fig 1
Fig 2
Fig 3
Discussion
The predominant coefficient spike magnitudes will provide a means for quantitatively evaluating
consistency among EMG activity, associated with BWSS, on a treadmill, with manual
facilitation. Differences in EMG pattern consistency between groups or improvements (or lack
of) following training can then be assessed.
Dominant Frequency
Dominant Coefficient Magnitude
267

The Influence of Heel Height on Frontal Plane Ankle Biomechanics: Implications for Lateral Ankle Sprains
Alicia A. Foster, Yi-Chen Chou, Mark G. Blanchette, MS, Christopher M. Powers, PhD, PT
Jacquelin Perry Musculoskeletal Biomechanics Research Laboratory Division of Biokinesiology & Physical Therapy, University of Southern California
1540 E. Alcazar St., CHP-155, Los Angeles, CA 90089 Introduction Wearing high heeled shoes is thought to increase the potential for lateral ankle sprains.1 Typically, ankle sprains occur after heel strike when ankle stability is most compromised.2 The association between wearing high heeled shoes and the increased risk of ankle sprains suggests that the biomechanical demands on the ankle while wearing high heeled shoes may place an individual at greater risk for injury. Although the kinematics and kinetics of high-heeled gait have been well described,1,3,4 no study has examined the frontal plane biomechanics of the ankle when ambulating in shoes of varying heel heights. Therefore, the purpose of this study was to evaluate the influence of heel height on frontal plane kinematics, kinetics and electromyographic (EMG) activity of the ankle joint during gait. Clinical Significance The results of this study may provide insight as to whether wearing high heeled shoes increases an individual’s likelihood of experiencing a lateral ankle sprain. Data obtained from this investigation may highlight the need for increased awareness and proper education related to the wearing of high-heeled shoes. Methods Eighteen healthy women (mean age 25.6 ± 4.1 yrs) participated in this study. Participants walked at self-selected velocity under 2 different shoe conditions (low heel: 1.27 cm; high heel: 9.53 cm). Each subject was provided with footwear in their respective shoe size. Both pairs of shoes were made by the same manufacturer and were chosen for their similarities in design, construction materials, and quality. Three-dimensional kinematics of the lower extremity were quantified using an 8 camera motion analysis system (Vicon; 120 Hz). Ground reaction forces were recorded using a force platform (AMTI) at 1560 Hz. .EMG signals of the tibialis anterior (TA) and peroneus longus (PL) were recorded using surface electrodes (1560 Hz). Subjects performed 5 walking trials for each shoe condition. The following stance phase variables were evaluated: peak ankle plantarflexion, peak ankle inversion angle and the peak ankle evertor moment. The EMG variables of interest consisted of the average EMG amplitude (% MVIC) of the TA and PL during the first 50% of the stance phase. Paired t-tests were used to assess differences between the 2 shoe conditions. Results The self-selected gait speed during the high heel condition was found to be significantly slower than the low heel condition (1.2 m/s vs. 1.4 m/s; P<0.001). When compared to the low heel condition, wearing high heels resulted in significantly greater peak ankle plantarflexion and inversion angles (Figure 1). In addition the peak evertor moment at the ankle and the PL muscle activity was found to be significantly higher in the high heel condition (Fig.2). No difference in TA muscle activity was found between shoe conditions.
268

Fig 1. Comparison of peak sagittal (left) and frontal (right) plane ankle angles between heel height conditions. * indicates significant difference between the 2 shoe conditions.
Fig 2. Comparison of the peak evertor moment (left) and peroneus longus EMG (right) between heel height conditions. * indicates significant difference between the 2 shoe conditions. Discussion Wearing high heels is thought to be a contributing factor to lateral ankle sprains. The findings of our study support this premise as wearing high heels resulted in greater peak ankle inversion angle compared to the low heel condition. The greater tendency of the ankle to assume a more inverted posture during the high heel condition can be explained by the greater ankle plantarflexion angle as these 2 motions are known to be coupled1, 4. The increase in the inversion angle also placed a greater demand on ankle evertors as evidenced by an increase in the peak evertor moment and PL EMG signal. The increased muscle action of the PL was reflective of the need for greater lateral ankle control. References
1. Geffin A, Megido-Ravid M, Itzchak Y, Arcan M. Analysis of muscular fatigue and foot stability during high-heeled gait. Gait and Posture. 2002;15(1):56-63.
2. Kerrigan DC, Johansson JL, Bryant MG, Boxer JA, Della Croce U, Riley PO. Moderate-heeled shoes and knee joint torques relevant to the development and progression of knee osteoarthritis. Archives of Physical Medicine and Rehabilitation. 2005;86(5):871-5.
3. Opila-Correia KA. Kinematics of high-heeled gait with consideration for age and experience of wearers. Archives of Physical Medicine and Rehabilitation. 1990;71:905-9.
4. Stefanyshyn DJ, Nigg BM, Fisher V, O'Flynn B, Liu W. The influence of high-heeled shoes on kinematics, kinetics, and muscle EMG of normal female gait. Journal of Applied Biomechanics. 2000;16:309-19.
269

Outcomes of Multi-level Surgery With and Without an External Femoral Derotational Osteotomy in Children with Cerebral Palsy Mark L McMulkin, PhD, Andi B Gordon, MPT, Paul M Caskey, MD, Bryan Tompkins, MD, and Glen O Baird, MD; Walter E. and Agnes M. Griffin Motion Analysis Lab, Shriners Hospitals for Children, Spokane, WA USA
Introduction Ambulatory children with cerebral palsy (CP) often present with multiple deviations in all planes including increased internal hip rotation during gait. This is often due to excessive femoral antetorsion. Common management of increased femoral antetorsion includes external femoral derotational osteotomy (FDO). Improvements in overall kinematics (both long term and short term) have been demonstrated1 when an FDO is included along with other appropriate multi-level surgeries; however, this study did not have a control group. Other studies looking at changes in gait following FDO have focused on the transverse plane2-4. The purpose of this study was to evaluate preoperative to postoperative changes in gait and functional outcomes for a group of subjects with CP who underwent multilevel surgery including an FDO compared to a pseudo-match group undergoing surgery without an FDO.
Clinical Significance If inclusion of femoral derotational osteotomies in the surgical treatment for children with CP results in better outcomes, surgeons may be more likely to include this surgery in their management plan.
Subjects/Methods Children with CP (GMFCS I and II) seen in the Motion Analysis Lab since 1996 were reviewed retrospectively (approved by the local Institutional Review Board) to include subjects that had an FDO in their surgical intervention. A control group was established that had indications for an FDO, but did not have this surgery. 37 subjects (52 sides) had orthopedic surgery which included an FDO (mean age 12.2yrs) – FDO group. 36 subjects, 47 sides had similar surgical interventions (Table 1) that did not include an FDO (mean age 10.4yrs) – No-FDO group. Data was included only for the sides that had an FDO or had indications (contralateral side may have had surgery). The No-FDO group subjects were matched to the FDO group based on physical exam and kinematic hip rotation (Table 1-2). Postoperative studies were a mean of 14 months after surgery for both groups. Pre to postoperative kinematic and kinetic variables, Gait Deviation Index (GDI), PODCI scores, and net oxygen cost were analyzed for each group with paired t-tests. Groups were compared pre and postoperatively with unpaired t-tests. Significance was set at 0.05.
Results Preoperatively, there were no significant differences between the two groups on any variable (common kinematic/kinetic and functional measures), except speed. Pre to postoperatively, there were several significant improvements for kinematic and kinetic variables in both groups (Table 2). The FDO group also had significant improvements for kinematics and kinetics on several additional variables. Postoperatively the FDO group compared to the No-FDO group had significantly less internal hip rotation in stance, less internal foot progression angle, greater peak stance plantarflexion moment, and a higher GDI. The GDI improved significantly for both groups although the FDO group demonstrated significantly greater improvement. PODCI scores improved significantly for both groups on different sub-scores.
270

Net oxygen cost (ml O2/kg/m) improved significantly only for the FDO group (Table 2).
Discussion All subjects for this study had indications for an external FDO based on physical exam measures of hip rotation and kinematic gait internal hip rotation. The surgical management of subjects was similar with the exception of one group having an FDO and the other not having an FDO. Typical sagittal plane kinematic variables improved significantly by equivalent magnitudes for both groups. However, analysis by simple mean data may not be optimal due to the large and varied gait morphology across patients. An additional limitation of this study was that several subjects in both groups had previous soft tissue surgeries which may conceal the effect of addressing all deviations at one time. Also subjects that were GMFCS Level III were not included. Transverse plane improvements were only seen for the FDO group as would be expected. The GDI, an overall index of kinematics, improved by a significantly greater amount for the FDO group. The FDO group had greater peak stance plantarflexion moment which is consistent with improved biomechanical alignment related to the FDO. The most compelling result to include an FDO in the surgical plan was the improvement in net oxygen cost for the FDO group. This improvement suggests that the inclusion of an FDO leads to overall improved efficiency, again likely due to improved biomechanics. The results of this study support that femoral derotational osteotomies will result in better gait outcomes for children with CP and should be performed when indicated.
References: 1) Ounpuu S et al, 2002, J Pediatr Orthop, 22: 139-45. 2) Aminiam A et al, 2003, J Pediatr Orthop, 23: 314-20. 3) Kay BM et al, 2004, J Pediatr Orthop, 24: 278-82. 4) Saraph V et al, 2002, J Pediatr Orthop B, 11: 159-66.
Table 1. Surgical interventions (# sides) for FDO and No-FDO (control) groups. Surgeries FDO No-FDO Femoral Derot Osteot 52 0 Psoas Lengthening 14 8 Prox Rectus Release 0 4 Sartorius Release 0 3 Add Longus release 6 9 Medial Hamstrings 32 31 Lateral Hamstrings 3 11 Rectus Transfer 24 8 Distal Rectus Release 1 6 Gastric/Soleus
Vulpius 12 15 TAL perc/open 8 15
Tibia Derotation Osteot 10 0 Bony foot procedure 4 2 Plantar fascia release 3 0 Posterior Tib Surgery 3 6 Nothing 8 4
Int Hip Rot (Phys Exam) 73º 75º Ext Hip Rot (Phys Exam) 22º 26º
Table 2. Outcomes for FDO versus No-FDO groups. *Significant pre- to post-op; †Significant difference between groups post-op, p < 0.05. FDO No-FDO Variable Pre Post Pre Post Pelvic tilt arc of motion 7.4 6.1* 8.2 7.0* Mean pelvic rotation -2.6 -0.7* -3.0 -3.2 Pelvic obliq arc of motion 10.7 8.7* 10.8 10.2 Mean hip rot-stance 15.7 -3.0*† 13.7 12.3 Knee flexion at IC 26.7 20.6* 28.1 20.7* Timing Pk Kn flexion (%) 46.6 42.8* 43.7 39.2* Knee arc of motion 40.4 43.7* 37.5 44.5* Peak DF-stance 8.7 13.8* 6.2 15.2* Peak DF-swing -3.8 1.9* -6.5 1.5* Foot progress angle 12.6 -5.0*† 7.3 0.7* Cadence (steps/min) 130 124* 127 125 Late stance PF moment 0.85 1.00*† 0.80 0.90* Pk ankle power absorp -1.34 -0.95* -1.10 -0.82* GDI 74.8 86.9*† 74.4 79.0* PODCI – UE 75.7 81.8* 75.5 79.3PODCI – TF/Mobility 87.8 87.7 82.1 86.8*PODCI – Sports 57.8 60.1 52.0 59.8*PODCI – Pain 69.7 82.2* 77.4 79.4PODCI – Global 72.7 77.9* 70.9 76.0*Net Oxygen Cost 0.224 0.178* 0.230 0.205
271

Quantitative home assessment of mobility in Parkinson’s Disease
Cris Zampieri1, Arash Salarian2, Patricia Carlson-Kuhta2, John, G. Nutt2 and Fay B. Horak2
1Functional and Applied Biomechanics Laboratory, Rehabilitation Medicine Dept., National Institutes of Health, Clinical Center, Bldg 10, MSC1604, Bethesda, MD, 20892, USA 2Department of Neurology, School of Medicine, Oregon Health & Science University, 3181 SW Sam Jackson Park Rd Portland, OR 97006, USA
Introduction: Gait and mobility problems are one of the hallmarks of Parkinson’s Disease (PD) and a major cause of disability1. Such deficits start early in PD, but are not observable during clinical examination until patients reach moderate to advanced stages of progression. Only analysis of motion in the laboratory has been able to detect early deficits associated with PD. The aim of this study was to test if inertial sensors could be used in the home to detect movement deficits associated with PD.
Clinical Significance: Measuring mobility in the home environment may be advantageous over laboratory assessment because it is more convenient, practical and ecological. However, no studies have reported whether quantitative mobility assessment in the home is feasible and whether results are the same as those obtained in the laboratory. The literature reports the use of inertial sensors to instrument the Timed Up and Go test (iTUG), where a group of patients with untreated PD was tested in the laboratory2,3. The objectives of this study are: 1) to investigate the feasibility of using the iTUG to test patients with early PD and healthy subjects at home, and 2) to compare mobility measurements performed in the home versus laboratory in subjects with early PD and healthy subjects.
Methods: Six subjects with PD (age 57.3 ± 8.6 yrs; 3M, 3F) and 8 healthy subjects (age 63.7 ± 5.9 yrs; 2M, 6F) participated in this study. The groups were similar in height and weight (p>0.05). Patients were in early-to-mid-stages of PD, with a UPDRS Motor Section of 28.6 ± 15 and a Hoehn and Yahr Scale of 1.9 ± 0.7. All participants provided informed consent approved by the OHSU IRB. Patients performed the iTUG in their home within 24 hours before or after the laboratory testing with the same therapist administering all tests. The iTUG has been described in previous work2,3. Three trials were collected at each location. Subjects wore a portable data-logger on a waist belt (Physilog®)4 with 5 inertial sensors attached to their body. Two uni-axial gyroscopes (range 600°/s) were attached to the shank, two 2-D gyroscopes (range ± 1200°/s) were attached to the dorsum of the wrists, and one sensor, which contained a 2-D gyroscope (range ± 400 °/s, pitch and roll axis) and a 3-D accelerometer (range ± 2g), was attached to the sternum. Data were recorded at 200 Hz, 16 bits/sample and stored in a flash memory card. A Matlab program was used to calculate the following parameters: stride velocity, stride length, cadence, peak arm swing velocity on the more affected Side (MAS), and turning velocity 2,3. A Repeated Measures ANOVA was run with group (PD vs Control) as a between-group factor, and location (Laboratory vs Home) as a within-group factor for each parameter measured. Critical � level was established at 0.05.
Results: Distances walked at home were shorter than laboratory (7 meters), and there were no significant differences between groups (PD home=5.9 ± 0.5m, Control home=5.9 ± 0.6m).
272

Group and location comparisons are shown in Figure 1. There was a significant group effect for stride velocity (F(1,12)=5.8, p=0.03), cadence (F(1,12)=8.85, p=0.01), peak arm swing velocity MAS (more affected side) (F(1,12)=15.2, p=0.002) and turning velocity (F(1,12)=9.51, p=0.009). There was a significant interaction effect for stride velocity (F(1,12)=6.16, p=0.02) and stride length (F(1,12)=13.86, p=0.002). In addition, there was a significant location effect for turn velocity (F(1,12)=7.57,p=0.01). A Tukey-Kramer Post-hoc test revealed that the location effect was significant only for control subjects.
Discussion: Our results showed that performing the iTUG at home is feasible, and that the home environment affected subjects’ performance, more so for patients with PD than for controls. Fig. 1a and b shows that when tested in the lab, there is no difference between patients and controls, but when tested at home, patients walk slower with shorter steps than controls. These findings seem to indicate that the home environment makes mobility testing more sensitive than the laboratory environment. Several factors may contribute to our findings: 1) Home environments are more cluttered and constrained than gait laboratories. Constraints in the environment are known to affect gait in PD, for example, freezing of gait usually is triggered by narrow spaces such as doorways or between furniture5. 2) People may feel more comfortable and relaxed at home. Whereas a formal laboratory environment may increase alertness and stress, at home patients may be more relaxed and thus exhibit their typical posture and gait. 3) Patients may be more distracted at home than in the laboratory. Performance of a cognitive task while walking can interfere with gait in PD even more so than in healthy subjects6. The home environment may naturally engender shared attentional resources between walking and a mental task.
References: 1. Marras C, et al. Arch Neurol 2002;59(11):1724-1728. 2. Zampieri C, et al. JNNP 2009; doi:10.1136/jnnp.2009.173740.3. Salarian A, et al. Trans Neural Syst and Rehab 2009;In press. 4. Aminian K, et al. J Biomech 2002;35 689–699. 5. Okuma Y, Yanagisawa N. Mov Disord 2008;23 Suppl 2:S426-430. 6. O'Shea S, et al. Phys Ther 2002;82(9):888-897.
Acknowledgements: This research was supported by the Kinetics Foundation, the National Institutes on Aging (006457) and the Oregon Center for Aging and Technology (AG024978). Dr. Horak was a consultant for the Kinetics Foundation. This potential conflict of interest has been reviewed and managed by OHSU.
Figure 1. Comparison of gait and turning measures between groups (Contro vs PD) and locations (Lab vs Home) on the iTUG test. Symbols: *group effect, § location effect, ¥ interaction. ••
(%he
ight
/sec
ond)
(%he
ight
)
(ste
ps/m
in)
(deg
rees
/sec
ond)
(deg
rees
/sec
ond)
273

Goal Attainment Scale Outcomes for Ambulatory Children: With and Without Orthopedic Surgery Andi B Gordon, MPT, Mark L McMulkin, PhD and Glen O Baird, MD; Walter E. and Agnes M. Griffin Motion Analysis Lab, Shriners Hospitals for Children, Spokane, WA, USA Introduction
Several assessments exist to measure outcomes for children following orthopedic surgery. Two examples of these include: the PODCI 1 and the Gillette FAQ 2. These tools are not specific to the individual and often miss the subtlety of improvement or decline. Additionally, stated goals may be a single task or question embedded within the questionnaire or their goal may not exist at all among the many items on the form. It is then often difficult to determine whether an individual’s goals were met.
The aims of this study were two fold: (1) to use a modified Goal Attainment Scale (GAS)3 for assessing the individual outcomes of specific goals for children seen in the Motion Analysis Laboratory (MAL) following lower extremity orthopedic surgery or on follow up without orthopedic surgery, and (2) to determine if the improvements measured by the GAS when established by the family were consistent with findings of other standardized tests commonly used to assess outcomes.
Clinical Significance The process of goal setting could help us improve communication with families regarding
expectations for their child’s mobility as well as provide feedback to practitioners on interventions and patient selection.
Subjects/Methods This retrospective study was approved by the local Institutional Review Board. Twenty
six subjects with a diagnosis of CP (mean age 12 + 4; females=14, males=12; GMFCS Level I=14; II=11; III=1) established goals prior to surgical intervention (CP-Surgery group). Families rated achievement of their goals at their postoperative MAL visit, mean 12.4 months following surgery. Thirteen subjects also with CP (mean age 11 + 5; females=6, males=7; GMFCS Level I=5; II=7; III=1) established goals during a visit to the MAL and rated achievement of those goals at a follow up visit to the MAL, mean 12.0 months later, with no surgery in between (CP-Follow up group). Ten of the 13 subjects in this group went on to have surgery at a later date. A third group of 13 subjects (mean age 12 + 9 months; females=8, males=5) seen in the MAL with a variety of diagnoses also established goals and rated their achievement following lower extremity orthopedic surgery, mean 12.7 months later (Other-Surgery group).
A questionnaire, created at our facility, asked the parent to establish three goals for their child’s mobility. The interviewer routinely paraphrased the goal back to the family to ensure that the parent would understand the goal they set when they returned to the MAL; however, no counseling regarding the achievability of the goal was completed specifically at this time. At their next visit to the MAL, goal achievement was rated (by the family) using a 5 point ordinal scale (Figure 1). In this scale, descriptions of the rating were not made specific to the goal but were a
-2 = Worse -1 = No change 0 = Goal was met +1 = Exceeded goal expectation +2 = Greatly exceeded goal
expectation Figure 1. Ratings for GAS
274

generic scale of achievement, exceeding achievement or worsening. These ratings were determined by the family at the post op or follow up visit as an overall view of their child’s status at that time relative to their previously stated goal.
The goal attainment scale ratings at the subjects’ second visit were converted to a T score3. When the goals are met, the T score is 50; overall not meeting goals will result in a score less than 50; exceeding goals will result in a score greater than 50.
Results In the CP-Surgery group, the mean T score for GAS was 49.3 which was not significantly
different from 50, p = 0.73 (74 goals; 66% met or exceeded, 34% no change or worse). In the CP-Follow up group, the mean T score for GAS was 35.6 which was significantly less than 50, p < 0.001 (36 goals; 14% met, 86% no change or worse). In the Other-Surgery group, the mean T score for GAS was 57.8 which was significantly greater than 50, p = 0.003 (37 goals; 86% met or exceeded, 14% no change). Significant improvements were noted in the CP-Surgery group and the Other-Surgery group on the PODCI in several categories while no significance was found for the CP-Follow up group in any category. Significant improvement was found on the Gait Deviation Index (GDI)4 for the CP-Surgery and the Other-Surgery group but not for the CP-Follow up group. The Gillette FAQ improved significantly only for the Other-Surgery group.
Discussion Children with a diagnosis of CP or with a diagnosis other than CP who had lower
extremity surgery met their goals while those that did not have surgery did not meet their goals. In the CP-Surgery group 25 of 74 goals were no change or worse while in the Other- Surgery group, only 5 of 37 goals were no change with not one goal receiving a rating of worse. The children with CP in the Follow up group had ratings that reflected not meeting their goals. Out of 36 goals only 5 were rated as met while the remaining 31 goals had no change or worse ratings. Other outcome tools reflected this group’s neutral/negative result with no significant improvements noted on the PODCI, the GDI, or the Gillette FAQ.
Results in this study demonstrate an overall correspondence with standardized functional outcome tools; when goals were met, improvements were noted. However, goals were not universally achieved in the groups who had intervention. Fourteen out of 26 subjects in the CP-Surgery group had at least one goal that was not met (rating of no change or worse). If a professional (adept at predicting goal achievement) had guided the family in setting goals, the realization of meeting goals would be more likely, and a worse rating would be less likely. Professional counseling in collaborative goal setting would aim to ensure that more realistic and ‘achievable’ goals are set, yet those goals would remain unique to the child. If goals are not met, the lack of achievement of a goal may suggest a problem with: patient selection for a given procedure, the intervention, goal setting or communication with the families.
The goal attainment scale provides a focused assessment of outcomes following orthopedic surgery and can be used as an adjunct to other standardized tools. Optimal goal setting would include both the family and the practitioner in order to maximize goal achievement and maximize feedback to professionals regarding their interventions.
References: 1. Daltroy LH et al, (1998), J Pediatr Orthop, 18: 561-71. 2. Novacheck TF et al, (2000), J Pediatr Orthop, 20: 75-81. 3. Kiresuk TJ et al, (1968), Community Ment Health J, 4: 443-53. 4. Schwartz MH et al, (2008), Gait Posture, 28: 351-7.
275

EFFICACY OF CLINICAL GAIT ANALYSIS: A SYSTEMATIC REVIEW
Tishya A. L. Wren1, George E. Gorton III2, Sylvia Õunpuu3, Carole A. Tucker4 1Childrens Hospital Los Angeles, Los Angeles, CA; 2Shriners Hospital for Children,
Springfield, MA; 3Connecticuit Children’s Medical Center, Farmington, CT; 4Temple University, Philadelphia, PA
Introduction: Clinical gait analysis remains controversial. Proponents argue that gait analysis provides important information needed to optimize the care of patients with complex walking problems. Opponents argue that gait analysis is an unproven technology whose clinical efficacy has not been established. The aim of this systematic review was to evaluate and summarize the current evidence base related to the clinical efficacy of gait analysis. Clinical Significance: Evidence of efficacy is being demanded by healthcare providers and insurers. It is important to establish the current evidence base for clinical gait analysis to understand what evidence exists and what additional research is needed. Methods: A literature review was conducted to identify references related to human gait analysis published between January 2000 and September 2009. Additional older references known to the reviewers were also included. All identified references were scored independently by two of the reviewers using a hierarchical model of efficacy 1 adapted for gait analysis (Table 1). References identified as addressing efficacy by at least one of the reviewers (scores 1-6) were then also scored by the remaining two reviewers. After the initial scoring, the review criteria were discussed and clarified using 12 references with discrepant scores to focus the discussion. All references with discrepant scores were then independently re-evaluated by the individual reviewers; reviewers were allowed to assign multiple scores to references that addressed multiple levels of efficacy. The results are summarized using scores agreed upon by at least 3 of the 4 reviewers. Table 1: Scoring scheme based on hierarchical model of efficacy 1 SCORE EFFICACY TYPE DESCRIPTION
1 Technical Physical process of obtaining data (system & personnel) 2 Diagnostic accuracy Effectiveness of data plus interpretation of data
3-4 Diagnostic thinking and treatment
Effect on decision-making and treatment
5 Patient outcome Effect on outcomes for individual patient 6 Societal Cost-effectiveness or cost-benefit from societal viewpoint 7 --- Gait analysis as a descriptive or outcome measure
Results: Of 1,363 references relating to human gait analysis, 240 were identified as relating to clinical efficacy (scores 1-6). Based on the scores of all four reviewers, 107 papers addressed technical efficacy, 86 papers addressed diagnostic accuracy, 13 papers addressed diagnostic thinking and treatment efficacy, 4 papers addressed patient outcomes efficacy, and 1 paper addressed societal efficacy. An additional 29 papers addressed some level of efficacy, but were scored inconsistently among the reviewers.
276

Technical and Diagnostic Accuracy (Levels 1-2): The vast majority of studies relating to efficacy addressed technical or diagnostic accuracy (N=193). These include direct assessments of accuracy and reliability, as well as the development of methods to improve the quality of the data collected and the usefulness of the data interpretation. Diagnostic Thinking and Treatment Efficacy (Level 3-4): 13 studies have evaluated the impact of gait analysis on clinical decision-making and treatment. The results have consistently shown that treatment plans change after consideration of gait analysis data and that the treatment performed differs from the plan before gait analysis. The change in treatment is likely due, at least in part, to the addition of gait analysis since gait analysis recommendations are followed in a high percentage of cases 2-3. This conclusion is supported by unpublished data from an ongoing randomized controlled trial. Patient Outcome Efficacy (Level 5): 4 studies have evaluated the effect of gait analysis on patient outcomes using case-control or case series designs 4-7. These studies have consistently found better outcomes when treatment followed gait analysis recommendations. Specifically, function improves when surgery is done consistent with gait analysis recommendations, function is maintained when no surgery is done as recommended by gait analysis, and function deteriorates when surgery is recommended by gait analysis but not done. Societal Efficacy (Level 6): Only 1 study was found relating to societal efficacy 8. This study retrospectively compared ambulatory patients with CP who had lower extremity orthopaedic surgery with (N=313) and without (N=149) pre-operative gait analysis. Patients with gait analysis had more procedures and higher cost during the index surgery, but less subsequent surgery, with no difference in the total cost or number of procedures. The authors concluded that clinical gait analysis results in less disruption to patients’ lives without increasing costs. Discussion: The vast majority of gait analysis research has focused on methodology for data collection and interpretation. A smaller group of studies have demonstrated the impact of gait analysis on treatment decision-making. An even smaller group have investigated the effect of gait analysis on patient outcomes. These cohort comparisons suggest that gait and functional outcomes are improved when treatment follows gait analysis recommendations, although no data on outcomes are currently available from randomized, controlled trials. Finally, one study has indicated a possible societal benefit of gait analysis in reducing disruption to patients’ lives without increasing costs. While the existing evidence supports the efficacy of clinical gait analysis, particularly at levels 1-4, evidence is sparse at the higher levels of efficacy (levels 5 and 6). Thus, this evidence review suggests that more research is needed to address the higher levels of efficacy. References: [1] Thornbury & Fryback, Eur. J. Radiology 14, 147-156, 1992. [2] Wren et al., J Ped Orthop B 14, 202-5, 2005. [3] Lofterod et al., Acta Orthop 78, 74-80, 2007. [4] Chang et al., J Ped Orthop 26, 612-6, 2006. [5] Lofterod et al., Dev Med Child Neurol 50, 503-9, 2008. [6] Filho et al., Gait Posture 28, 316-22, 2008. [7] Gough & Shortland, J Ped Orthop 28, 879-83, 2008. [8] Wren et al., J Ped Orthop 29, 558-63, 2009.
277

2010 Gait and Clinical Movement Analysis Society Annual Meeting
SIMPLIFICATION OF GAIT MEASURES AND LOWER EXTREMITY ALIGNMENT MEASURES AMONG RUNNERS WITH AND WITHOUT MEDIAL TIBIAL STRESS SYNDROME
Sae Yong Lee
E-mail: [email protected]
1, Chris Ingersoll2, Sue Saliba2, Fan, Xitao2, Kerrigan, D. Casey2, and Jay Hertel2
1 University of Miami, FL, USA; 2 University of Virginia, Charlottesville, VA, USA
INTRODUCTION The understanding of the relationship between gait parameter and lower extremity alignment is needed to better clarify the mechanisms of lower extremity injuries in order to evaluate, treat, and prevent medial tibial stress syndrome (MTSS). In clinical setting, however, there are potential limitation of assessing both gait kinematic and lower extremity alignment measures because of a large number of redundant alignment measures to be assessed and a high expense to conduct gait analysis. If there are high correlations between gait kinematics and specific lower extremity alignment measures, the clinician may be able to use selective alignment measures to predict risk of lower extremity injury and gait biomechanics with relatively short period of time and lower expenses. Previous studies have mainly examined only foot-related alignment measures and tried to correlate it with foot motion without considering more proximal segments.1,2,3 Therefore, the purpose of this study was to classify measures of gait kinematics and static proximal and distal alignment that are highly correlated to each other in order to develop latent variables (factors) that reduce the dimensionality of potential predictor measures. CLINICAL SIGNIFICANCE Clinicians will be able to obtain gait related risk of MTSS easily without conducting expensive and time consuming gait analysis through static lower extremity alignment measures and predict possible gait alteration. Furthermore, an understanding of how the MTSS and normal population have different constructed relationships between lower extremity alignment and gait characteristics may help to prevent and treat MTSS patient efficiently. METHODS A total of 74 recreational and competitive runners (37 normal, 37 MTSS injured) were recruited. The runners were recruited from area high school, university varsity track and the community at large in Charlottesville, VA. The general inclusion criteria for both groups were running more than 15 km per week and working out at least three times a week. The inclusion criteria for the MTSS group requires that at least three of the following criteria be met with the first criteria being mandatory: 1) tenderness and dull pain in an area longer than 2.5 cm along the distal posteromedial tibial border, 2) palpable thickening over the area corresponding to tenderness, 3) aggravated pain with resisted plantar flexion or standing on tip-toe, 4) pain with one leg hop test, and 5) pain or weakness with inversion manual muscle test with the foot in an everted position. Static arch height in standing and subtalar joint neutral position was assessed using a Vernier Height Gage 506-201 (Mitutoyo Inc, Japan). A
278

general orthopedic Goniometer (6” and 12”, Allegro Medical) was used to measure rearfoot anlge, Q-angle, standing rearfoot angle, genurecurvatum, tibial varum, and tibial torsion. A PALM® inclinometer (Performance Attainment Associates, St Paul, MN) was used to measure pelvic tilt. Bubble inclinometer was used to measure femoral anteversion. Twenty four reflective markers were attached to subjects’ pelvis and lower extremity.4 The location of markers was obtained using a 10 camera motion analysis system at sampling rate of 120Hz. Four trials each lasting 15 seconds were captured while subjects continuously jogged at 2.65 m/s on a treadmill with embedded force plates. In order to obtain 3-dimensional kinematics, raw data were processed using algorithms implemented in LabVIEW and Vicon Plug-in Gait. Seven maximum kinematic during mid-stance phase of gait cycle were used gait parameter. Two separate exploratory factor analysis (control, MTSS injured group) using principle component analysis (PCA) were conducted to categorize dependent variables which have high correlation. RESULTS
Measures Control (37) Components
1 2 3 4 5 Max tibial IR -.90 Max EV .85 Max knee VAL .83 Femoral anteversion .80 Max hip IR .76 Standing rearfoot -.57 Rearfoot alignment -.52 Tibial torsion .81 Max hip ADD -.61 Navicular drop test -.61 Q-angle .48 Pelvic tilt -.73 Genu recurvatum .70 Max pelvic anterior rotation .68 Tibial varum .46 Max knee IR .36
SUMMARY/CONCLUSIONS The inter-relationship between multiple lower extremity alignment and relevant gait kinematics were strong in the MTSS group. On the other hand, weaker relationships were found in the control group. These findings indicated that the abnormal compensation of lower extremity alignment in weight bearing was strongly reflected in the dynamic activity of running in the MTSS group whereas no specific trends were observed in the control group. REFERENCES
1. Burns, J et al. J Am Podiatr Med Assoc. 2005;95;235-241. 2. Cornwall, MW & McPoil, TG. The Foot. 2004;14;133-138. 3. McClay, I & Manal, K. Clin Biomech. 1998;13;195-203. 4. Pohl, MB & Buckley, JG. Clin Biomech. 2008;23;334-341.
Measures MTSS (37)
Components 1 2 3
Standing rearfoot .82 Navicular drop test .80 Rearfoot alignment .78 Max EV -.57 Max hip IR .86 Genu recurvatum .67 Femoral anteversion .65 Max hip ADD .53 Pelvic tilt -.46 Max pelvic anterior rotation .73 Q-angle .72 Max knee IR .54 Max knee VAL .43 Tibial varum .36 Max tibial IR .32 Tibial torsion .29
Table 1. Alpha values of each alignment and gait measures in relation to the three factors solution identified for factor analysis in MTSS
Table 2. Alpha values of each alignment and gait measures in relation to the five factors solution identified for factor analysis in control
279

280

means of disability scores and even velocity of gait, considered a key factor for gait
improvement, can be unchanged after surgery. Gait analysis,besides assisting in clinical
decision making for surgical plan, allows to evidence improvement in gait kinematics which
can explain the patient’s perception of greater stability and other goals attained such as
modification of shoes, orthoses, and assistive devices.
Fig.1 Pre (left graphs) and post-op (right graphs) 3D ankle-foot kinematics of a patient (left side operated)
Table 1
Injury/Desease Foot deformity Surgery Problems Gait Velocity
pre and post-
surg
Other
outcomes
1994
(incomplete T12-
L1)
Right: Equinus-
varus, claw toes
(walker)
2007 Right foot: Achilles
tendon
Lenghtening,Flexors
tenotomy, Arthrodesis
1,2,4, Ostetomy 1mt
Unstable gait,
scarce walking
endurance
15,0 15,0 More stable foot
support
2005
(incomplete T12-
L5)
Left: Equinus-varus,
stiff knee
(two canes, left AFO)
2007 Left foot: Achilles
tendon lenghtening, EPA
transfer IV MT
Unstable gait,
scarce walking
endurance
38,1 38,3 More stable foot
support, removal
of AFO
1978
(incomplete C5+
polio)
Right: Equinus varus
and knee recurvatum,
striatal toe
(right toe off AFO,
one cane)
2009 Right foot: Achille
lenghtening, proximal
osteotomy I MT,EPA
transfer IV, Flexors
tenotomy
Pain right hip,
pain under foot
71,3 50,2 Relief of hip pain,
more controlled
knee recurvatum,
removal of AFO
1970
(multiple spinal
interventions)
Right: Equinus- varus
(walker+ KAFO
right)
2009 Right foot: Achilles
lenghtening, Jones,
Artrodesis IF hallux, TP
transfer
Unstable gait,
scarce walking
endurance
8,0 8,0 More stable foot
support
2007
(incomplete C4)
Left:Equinus- varus 2009 Left foot: Achilles
lenghtening, Grice
Unstable gait,
scarce walking
endurance
50,0 55,0 More stable foot
support
1999
Paraparesis ND
Left:Equinus- varus,
claw toes
(two canes,
bilateralAFO)
2007 Left foot: Achilles
tendon lenghtening, EPA
transfer IV MT, flexors
digitorum tenotomy
Unstable gait,
scarce walking
endurance
10,0 12,0 More stable foot
support
Strumpell -
Lorraine
Right and left:
Equinus- varus, claw
toes
(two tripods)
2007 Right and left foot:
Achilles tendon
lenghtening, flexor
digitorum tenotomy, EPA
transfer on IV MT, TP
lenghtening
Unstable gait,
scarce walking
endurance
9,8 10 Modification of
orthopaedic shoes,
change of tripods
with sticks
Strumpell -
Lorraine
Right: Equinus- varus 2007 Right foot: Achilles
lenghtening, EPA transfer
on IV MT
Unstable gait,
scarce walking
endurance
27,7 28 More stable foot
support
References
�1] Patrick HJ, Spinal Cord (2003) 41:479-482, [2] Krawetz P, Nance P. Arch Phys Med
Rehab (1996) 77:635-638, [3] Gil-Agudo A. Clin. Biomech (2009) 24:551-557, [4] OzdolopS.
Spinal Cord (2006) 44:787-790, [5] Leardini A.et al. Gait Posture (2007); 26:560-571.
281

Walking gait characteristics of individuals with Dementia: a signal detection approach.
T. KARAKOSTAS1,5, B. DAVIS2,6, S.M. HSIANG3, M. MACLAGAN4
1Motion Analysis Center, Childrens Memorial Hospital, Chicago, IL, 2Program of Gerontology, University of North Carolina, Charlotte, Charlotte, NC 3Department of Industrial Engineering, North Carolina State University, Raleigh, NC 4 Department of Communication Disorders, University of Canterbury, Christchurch, New Zealand 5College of Health Professions, Medical University of South Carolina, Charleston, SC 6College of Nursing, Medical University of South Carolina, Charleston, SC
Introduction
The evaluation of time distance gait characteristics has been used in the research field of dementia to
assess cognitive status [1] and, thereby, identify individuals with the disease [2], the type [3], its
progression [4] and those who might be at an increased risk of falling [5]. Gait has been used alone or
combined with another cognitive or motor task (such as walk while talking or walk and hold a glass of
water) for these purposes. However, although in every study either all or a limited number of time
distance descriptors are evaluated, the ones being reported, typically, as significant are the
nonspecific velocity and stride variability.
Clinical Significance
It was the purpose, therefore, of this study to identify the minimum number of velocity-related
specific time distance gait characteristics that are most sensitive to differentiating individuals with
dementia from normal individuals irrespective of the walking task.
Methods
To meet our goal we used single and dual task paradigms. Six normal aging subjects and seven
diagnosed with dementia participated in the study. Age ranged from 69 to 90 years. An 18 feet
instrumented walkway (GAITRite, CIR Inc., Clifton, NJ) was taken to the subjects’ residence to collect
all time distance gait parameters. Data were collected at 120Hz. Subjects walked on the walkway at
their self selected speed. To identify the minimum number of sensitive time distance gait descriptors
signal detection theory (SDT) in conjunction with receiver operator characteristic (ROC) curves was
used. The experimental protocol and informed consents for participants were approved by the
Institutional Review Board at UNC-Charlotte and by the owners and directors of the residential
facilities of the subjects.
Results
The results suggest that only six of the thirteen time distance variables were needed to distinguish
individuals with dementia from the normally ageing, irrespective of whether individuals were tested
using gait as a stand alone task or under a dual task paradigm. The discriminating variables were:
stride time and width, single support time, toe-in/out, swing time and stride length. Consideration of
additional variables made no noticeable difference in the ability to differentiate between the two
cohorts (see Figure 1).
282

Discussion The descriptors can be considered true predictors, because their combination is specific to the condition of dementia, whereas velocity and stride variability identified by previous studies are nonspecific. The 6 discriminating temporal-spatial descriptors that discriminate individuals with dementia from their normal counterparts provide new and less complicated focus for the health care professionals involved in their diagnosis and treatment delivery.
Figure 1
Figure 1 The ROC curve when all temporal-spatial variables (All variables) are used to discriminate the individuals with dementia from those of normal aging plotted against the respective ROC curve for the minimum six gait descriptors (STEP DISC). The plot represents the probability of false positives (P(FA)) against the probability of true positives (P(HIT)).
References [1] J. Verghese, C. Wang, R. B. Lipton, R. Holtzer, and X. Xue, "Quantitative gait dysfunction and
risk of cognitive decline and dementia," J Neurol Neurosurg Psychiatry, vol. 78, pp. 929-35, 2007.
[2] J. Verghese, M. Robbins, R. Holtzer, M. Zimmerman, C. Wang, X. Xue, and R. B. Lipton, "Gait dysfunction in mild cognitive impairment syndromes," J Am Geriatr Soc, vol. 56, pp. 1244-51, 2008.
[3] J. Verghese, R. B. Lipton, C. B. Hall, G. Kuslansky, M. J. Katz, and H. Buschke, "Abnormality of gait as a predictor of non-Alzheimer's dementia," N Engl J Med, vol. 347, pp. 1761-8, 2002.
[4] R. Holtzer, J. Verghese, X. Xue, and R. B. Lipton, "Cognitive processes related to gait velocity: results from the Einstein Aging Study," Neuropsychology, vol. 20, pp. 215-23, 2006.
[5] L. Lundin-Olsson, L. Nyberg, and Y. Gustafson, ""Stops walking when talking" as a predictor of falls in elderly people (letter)," Lancet, vol. 349, pp. 617, 1997.
FFFigure 11
283

ANTI-TRENDELENBURG GAIT: CLASSIFICATION AND ETIOLOGY IN CHILDREN
Harald Böhm, Katrin Schweizer, Felix Stief and Leonhard Döderlein Orthopaedic Clinic for Children, Aschau i. Chiemgau, Germany
INTRODUCTIONConservation of energy is a major problem in children with neuromuscular or skeletal disorders. In particular high amplitude displacements of the center of gravity of the pelvis and trunk in vertical and lateral directions contribute to increased energy expenditure during walking [1]. Increased contra lateral pelvic drop (Trendelenburg gait, Fig. 1) and increased ipsilateral trunk lean (Duchenne gait) are documented compensatory mechanisms for distal neuromuscular disorders [2]. Compared to Trendelenburg and Duchenne gait patterns, increased contra lateral pelvic elevation (anti-Trendelenburg gait, Fig. 1) also known as pelvic hike, is not well documented in the literature. It is assumed that this gait pattern is used to increase leg clearance [3]. Therefore, the aim of this study is to objectively classify anti-Trendelenburg gait pattern and describe its possible causes.
Figure 1: Trendelenburg (left) and anti-Trendelenburg (right) gait pattern. The graphs show the corresponding pelvic obliquity in two patients walking at a non-dimensional speed of 0.29 and 0.19 respectively.
CLINICAL SIGNIFICANCE The causes of anti-Trendelenburg gait pattern were clearly identified as a lack of leg clearance manifested by contractures of the lower limb and reduced muscle functioning of ankle dorsiflexors. Anti-Trendelenburg gait pattern was observed predominantly in patients with Arthrogryposis multiplex congenita (AMC), since they have adequate functioning of abductor muscles to perform the contralateral pelvic elevation.Treatment of contractures might decrease the energetically inefficient anti-Trendelenburg gait pattern; however, it appears to be an important compensation mechanism and is therefore essential for ambulation in patients with reduced leg clearance.
284

METHODSIn a retrospective, cross-sectional study 147 patients were gait analysed in 2009. All parents gave informed consent to participate in this study. Gait analysis was performed using an 8-camera Vicon System (Vicon, UK). The Plug-in-Gait model was used to determine pelvic and trunk angles. Abnormal movements of pelvis and trunk were defined when the average angle during single stance exceeds the 2 S.D. range of 83 healthy children [4]. Since the amplitude of pelvic and trunk movement in healthy children is dependent on walking speed [4], the movement amplitudes of the patients were compared to those of the healthy controls walking about the same non-dimensional speed. Norm data of pelvic obliquity at different speeds are shown in fig 1.Manual muscle testing (scale 0-5) of hip abductors and limb muscles responsible for leg clearance (ankle dorsiflexors, knee- and hip flexors) was performed. Passive hip, knee and ankle range of motion (ROM) was clinically examined. Differences between patients group showing anti-Trendelenburg and patient group categorized as Trendelenburg and/or Duchenne gait patterns were tested on a significance level of 5%.
RESULTSIncreased pelvic or trunk motion in the frontal plane was observed in 65 children. Twelve patients demonstrate anti-Trendelenburg gait, 8 of them combined with Duchenne gait pattern. The other patients showed Trendelenburg (11), Duchenne (24) or both (18) gait patterns. In the anti- Trendelenburg gait group 10 patients were diagnosed with Arthrogryposis multiplex congenita (AMC), one with Myelomeningocele and another with Metatrophic Dysplasia. Children with anti-Trendelenburg gait showed significantly higher Hip abduction force of 4.3(0.8) compared to the other patients with abnormal trunk movements of 3.2(0.7). Dorsiflexion muscle force was significantly decreased in anti-Trendelenburg gait 1.3(1.4) compared to 3.1(0.9) in the other group. Hip and knee flexor muscles did not show significant differences between groups. Hip, knee and ankle ROM were significantly decreased in children with anti-Trendelenburg gait.
DISCUSSION Anti-Trendelenburg gait pattern was found in 18 % of the patients with abnormal pelvic and trunk movements. Ten of the 12 patients were diagnosed with AMC. Considering the total amount of 17 AMC patients participating in this study, anti-Trendelenburg gait is closely linked to this diagnosis. Other patients e.g. with cerebral palsy might also require increased leg clearance but their abductor muscles might be too weak to perform contralateral pelvic elevation during stance. The causes of anti-Trendelenburg gait were clearly identified as a lack of leg clearance manifested by contractures of the lower limb and reduced muscle functioning of ankle dorsiflexors. Treatment of contractures might decrease the energetically inefficient anti- Trendelenburg gait pattern; however, it appears to be an important compensation mechanism and is therefore essential for ambulation in patients with reduced leg clearance.
REFERENCES 1. Waters (1999) Gait & Posture, 9:207-312. Metaxiotis et al. (2000) Gait & Posture, 11:86-91 3. Perry (1992), Gait Analysis, SLACK Inc., pp. 268 4. Schwartz et al. (2008) J. Biomech., 41:1639-50
285

Effects of Osteoarthritic Knee Alignment on Stair Negotiation
1McCamley, J D; 1Varnell, MS; 1,2Jacofsky, MC; 2Jacofsky DJ 1Banner Sun Health Research Institute, Sun City, AZ, 2The Core Institute, Phoenix, AZ
Introduction The ability to negotiate stairs is compromised by pain and limited range of motion associated with knee osteoarthritis. Stair negotiation places large demands on the joints of the lower limbs (Andriacchi et al., 1980; Nadeau et al., 2003) but there is little understanding of the effect knee frontal plane alignment has on the ability of a person with severe knee osteoarthritis (OA) to ascend or descend stairs. Previous studies have shown that mechanical knee alignment affects the manner with which subjects walk (Barrios et al., 2009) but little is known about the effect of alignment on the manner by which persons negotiate stairs. Reid et al., (2007) investigated knee biomechanics of differing stair ambulation patterns and found higher joint loads when healthy subjects used a step-by-step pattern compared to a step-over-step pattern. Clinical Significance: A better understanding of the effects lower limb alignment combined with osteoarthritis, have on patients ability to perform common demanding will assist therapists target treatments specifically to individual requirements. Methods: Fifty-six patients visited the motion analysis laboratory prior to receiving unilateral total knee replacement surgery. Patients were excluded if they had any pathologies of the ipsilateral lower limb other than knee osteoarthritis, or any gait altering diseases of the contralateral limb. All patients signed informed consent prior to participating in the study. Knee alignment was measured during a 30 second quiet standing trial with patients instructed to stand upright and motionless, looking straight ahead, with their arms crossed and relaxed against their chest. Patients were assigned to the varus group if mechanical knee angle in the frontal plane measured greater than zero degrees and to the valgus group if the angle was less than zero. Patient’s demographics are listed in table 1.
Table 1. Patient demographics for varus and valgus groups. Varus Valgus Number 38 18 Male 21 6 Female 17 12 Age 70 ± 6 72 ± 6 Weight (kg) 80 ± 18 81 ± 17 Height (m) 1.68 ± 0.09 1.65 ± 0.11
Patients were asked to ascend and descend a four-step staircase with three instrumented steps a minimum of five times. A fixed rail was provided to the left of the stair case and patients were instructed to use the rail in a manner necessary to ensure safe negotiation of the staircase. The manner in which the patient ascended and descended the staircase was
286

287

Simultaneous multisegment foot kinematics kinetics and plantar pressure analysis in rheumatoid arthritis
Zimi Sawacha1, Annamaria Guiotto1 , Chiara Fassina1 , Elena Carraro2, Silvia Del Din1, Aristide Gravina2, Stefano Masiero2, Claudio Cobelli1.
1. Department of Information Engineering, University of Padova, Padova, Italy 2. Department of Medical Surgical Specialty, Orthopaedic Institute-Orthopaedic Rehabilitation, University Polyclinic of Padova, Italy
Introduction In the last decade several papers investigated the kinematics, kinetics and plantar pressure (PP) of specific foot segments in the diabetic population [1-3]: they all show that there are important kinematic and kinetic alterations in the foot of diabetic neuropathic patients. Both multisegment foot kinematics [4] and plantar pressure [5] have been shown to provide a more complete description of foot motion abnormalities.
Clinical significance RA is a pathology presents at multiple joints, leading to complex and varied patterns of impairment. So far this technique may be useful to evaluate functional changes in the foot and to help plan interventions.
Methods Data were collected with a motion capture system (Smart, BTS, 60-120 Hz, 6 cameras) synchronized with two force plates (Bertec, FP 4010) and two baropodometric systems (Imagortesi), and the technique described in [3] was applied. Ten normal and one pathological subjects were analyzed and the following variables mean and standard deviation evaluated: local sub-segment vertical (V), anterior-posterior (AP) and medio-lateral (ML) ground reaction forces (GRFs) as [1] (GRFs were normalized to body weight); center of pressure (COP) displacement during gait, the peak pressure curve (PPC), the mean pressure curve (MPC), the loaded surface curve (LSC); four segments tridimensional tibia and foot kinematics [2].
Results Kinematics analysis revealed an hindfoot excessively inverted, a midfoot excessively everted, externally rotated and plantarflexed during the stance phase of gait (see Figure 1). The forefoot resulted excessively everted, externally rotated and dorsiflexed. When considering the ground reaction forces (GRFs) outcome the right foot exhibited excessive tangential forces in each direction at each subsegment during almost the whole stance phase of gait (see Figure 2a). An opposite trend was observed in correspondence of the left limb forefoot vertical GRF (see Figure 2b).
Fig. 1: Hindfoot-tibia (a) and midfoot-hindfoot (b) inversion/eversion angle over normative bands.
288

Fig. 2: From the top-left: (a) Right whole foot ML and AP GRF, (b) Left forefoot ML and V GRF, (c) Mean plantar pressure of the whole and 3 subsegment of the left foot, (d) Contact surface area of the whole and 3 subsegment of the left foot.
Discussion In RA, multisegment foot integrated kinematics kinetics and PP analysis may provide a more complete description of foot motion abnormalities where pathology presents at multiple joints, leading to complex and varied patterns of impairment. This technique may be useful to evaluate functional changes in the foot and to help plan corrective and rehabilitation interventions.
References
1. Uccioli L. et al., Clin. Biom., 16, 446-454, 2001 2. Sawacha Z. et al., Journal of NeuroEngineering and Rehabilitation, 6:37, 2009. 3. Sawacha Z. et al., Gait & Posture, 24: S2-S3, 2006.4. Woodburn J et al., J Rheumatol. 31(10):1918-27, 2004. 5. Giacomozzi et al., Gait and posture, 23(4):464-470, 2006.
289

Automatic detection of subjects at risk for diabetic foot through gait analysis
Zimi Sawacha1, Guarneri Gabriella2, Annamaria Guiotto1, Fabiola Spolaor1, Alessandro Mario Munari3, Paola Contessa1, Andrea Venturin3, Angelo Avogaro2, Claudio
Cobelli1.
1. Department of Information Engineering, University of Padova, Padova, Italy.
2. Department of Clinical Medicine and Metabolic Disease, University Polyclinic, Padova, Italy.
3. Department of Medical Surgical Specialty, Orthopaedic Institute-OrthopaedicRehabilitation, University Polyclinic of Padova, Italy.
Introduction
World Health Organization warns that as many as 33 million Europeans will suffer from diabetes, about 15% will likely develop foot ulcers, and approximately 15% to 20% of these patients will face lower-extremity amputation. The diabetic foot, one of the most serious complications of diabetes mellitus, and a major risk factor for plantar ulceration is determined mainly by peripheral neuropathy (PN), foot trauma, foot deformity, increased foot pressures, and callus [1]. Several authors found gait pattern alteration in diabetic patients both with (PN) and without diabetic neuropathy (NoPN) [2]. Therefore, a methodology for automatic detection of patients at risk for plantar ulcers formation is of primary importance. A methodology based on gait analysis has been developed in this work.
Clinical significance
Early detection of patients at risk for diabetic foot may reduce the risk of ulcerations and so far reduces the number of amputation. Nevertheless gait analysis is an easy non-invasive methodology.
Methods
Gait and EMG analysis were performed both with a fullbody and a multisegment foot markerset [2,3] on 50 subjects (20 PN, 20 NoPN, 10 control subjects (C)). Mean BMI was respectively 26.8 ± 3.4 kg/m2 in PN, 26.4 ± 2.6 kg/m2 in NoPN, 24.5 ± 2.8 kg/m2 in C; mean age was respectively 61.2 ± 7.8 years in PN, 56.5 ± 13.3 years in NoPN, 61.2 ± 5.1 years in C. BTS motion capture system (6 cameras, 60-120 Hz) and surface EMG (POCKETEMG, 16 channels) synchronized with 2 Bertec force plates (FP4060-10) and two plantar pressure (PP) systems (Imagortesi) were used. Surface EMG signals (sEMG) were recorded from peroneus longus, tibialis anterior (TA), gastrocnemius medialis, rectus femoris (RF), gluteus medius and extensor digitorum muscles. sEMG was band pass filtered between 10 and 450 Hz and full wave rectified. The rms value was computed with a moving window of 50 ms and the signal was normalized to the mean value in the gait cycle. The linear envelope of the rectified sEMG was computed by low-pass filtering the signal with a 4th order Butterworth filter and a cut off frequency of 5 Hz [3]. Three force-plate strikes of each limb were recorded. Velocity,
290

stride and step parameters were calculated together with all angular displacements and internal joint moments [2,4,5]. Each parameter was compared with those obtained with the data of the control population by means of k-means cluster analysis [6]. Afterwards, the clusters generated by the variables in which kmeans reached an optimal solution were analysed and compared with the clinical outcome. Their mean and standard deviation of kinematics, kinetics, emg, time and space parameters were estimated.
Results
Cluster analysis classification led to definition of 4 well separated clusters. Two clusters were identified as the one containing subjects with major biomechanics alterations. One family including only PN subjects and one including both PN and NoPN. In one of the formers the highest PP (max PP= 400 KPa) and ground reaction forces (GRFs) were found together with altered timing activation during gait. Indeed TA showed delayed onset at (25% of gait cycle) and RF showed dominant activation during midstance. Furthermore in cluster 3 the mean GRFs registered were respectively: 20.4 ± 1 % of body weight (% BW) in Medio-Lateral (ML) GRF, 149.7 ± 25 % BW in vertical (V) GRF, 3.5 ± 7 % BW in Anterior-Posterior (AP) GRF. These clusters were characterized by a large proportion of subjects affected by diabetic micro-and macrovascular complications together with the longest disease’s duration (cluster 3: 15 ± 9 years and cluster 4: 26 ± 10 year of disease). In cluster 3 microalbuminuria was detected in the 20% of subjects, autonomic neuropathy in 20%, retinopathy in 60%, peripheral vasculopathy in 20%, PN in 100%. Meanwhile in cluster 4 microalbuminuria was detected in 30% of the subjects, autonomic neuropathy in 15%, retinopathy in 50%, peripheral vasculopathy in 15%, PN in 60%.
Discussion
Surface EMG associated with gait analysis showed to be effective detectors of neuromuscular disorders both in PN and NoPN subjects. The study showed that gait data were sufficient to distinguish PN and NoPN subjects gait pattern from those obtained in C subjects. Therefore, their employment as methods for early detection of PN is encouraged.
References
1. .Van Schie CHM., Int J Low Extrem Wounds, 4(3): 160–170, 2005.
2. Sawacha Z. et al., Clin Biomech, 24(9): 722-8, 2009.
3. Akashi P.M.H. et al., Clin Biomech, 23: 584-592, 2008
4. Sawacha Z. et al., Journal of NeuroEngineering and Rehabilitation, 6:37, 2009.
5. Sawacha Z. et al., Gait & Posture, 24: S2-S3, 2006.
6. Everitt B.S. et al., Cluster Analysis, Hodder Arnold Pub. 2001.
••
291

Kinematic Gait Variability is Altered in Multiple Sclerosis Patients
Jessie M. Huisinga1, Mary L. Filipi
2, Dimitrios Katsavelis
1, and Nicholas Stergiou
1,3
1Nebraska Biomechanics Core Facility, University of Nebraska at Omaha, Omaha, NE
2University of Nebraska Medical Center, College of Nursing, Omaha, NE
3University of Nebraska Medical Center, College of Public Health, Omaha, NE
Email: [email protected] URL: http://biomech.unomaha.edu
Introduction
Multiple Sclerosis (MS) patients experience motor and sensory disturbances in a range
of severities. While the mechanism of disturbance is likely related to impaired nerve
conduction, the overall neuromuscular adaptations that MS patients adopt to maintain
function are not understood. One approach to investigate the motor control strategies
employed by MS patients is to evaluate gait variability. In a biological system such as the
ambulating human, it is hypothesized that there is an “optimal” state of gait variability which
has a highly organized form, and its maintenance at the optimal level is associated with
health(1). Decreases or increases of this variability are associated with malfunction and
disease. A decrease will make the locomotor system rigid and less adaptable to different
perturbations, whereas an increase makes the system noisy and unstable. Our goal was to
examine gait variability by evaluating joint kinematics over multiple continuous strides
performed by MS patients to understand the underlying motor control strategies in this
population during walking. It was hypothesized that MS patients would exhibit altered gait
variability measures.
Clinical Significance
The evaluation of gait variability of patients with MS can provide important insight on
the effects of the disease and on the neuromuscular adaptations adopted by these patients. A
better understanding of these adaptations will allow the development of new rehabilitation
programs that will focus on establishing an “optimal” state of movement variability for an MS
patient. According to Stergiou and colleagues(1, 2), the goal of neurologic therapy should be to
foster the development of this optimal state of movement variability by incorporating a rich
repertoire of movement strategies. To improve gait deficiencies in MS patients, gait training
that incorporates variability may be of interest. When investigating gait training modalities,
Cai et al(3) suggested that the functional connectivity that is responsible for standing and
stepping is related with the overall assembly of synapses and recommended that motor
training for a specific task should also incorporate variability so that learning may occur.
Therefore, use of gait variability can allow for the evaluation of such gait training protocols
and will help to create optimized rehabilitation programs for MS patients.
Methods
Thirteen MS patients (Age 45.8 ± 10.5 yrs; EDSS 2.7 ± 1.0) and 13 healthy controls
(Age 43.1 ± 9.6 yrs) walked on a treadmill at self-selected pace for three minutes while
kinematic data was collected at 60 Hz. Relative joint angles were calculated for ankle, knee,
and hip flexion/extension from eighty consecutive strides. The range of motion from each
stride was then calculated for each joint. Standard deviation (SD) and coefficient of variation
(CV) (both linear measures of the amount of gait variability) were calculated for the range of
motion for all strides and for each joint. The temporal structure of gait variability was also
292

evaluated by using the largest Lyapunov exponent (LyE), a commonly used nonlinear
measure(4-6). The LyE was calculated for each joint flexion/extension time series. Independent
t-tests were used to compare the gait variability variables (SD, CV, LyE) between groups.
Results
SD significantly increased at the hip (p = 0.047) in the MS patients (Figure 1, left).
CV significantly increased at the knee (p = 0.047) and at the hip (p = 0.041) in the MS
patients (Figure 1, middle). LyE significantly increased at the knee (p = 0.039) in the MS
patients (Figure 1, right).
Discussion
MS patients exhibit increased gait variability at the knee and hip compared to healthy
controls using both the linear and nonlinear variability measures. These findings indicate
significant deterioration in the locomotor system of MS patients. This deterioration results in
increased noise and instability of gait and is a potential contributing factor to the falls and
mobility problems experienced by MS patients. Interestingly, the increased variability (LyE
20% higher in MS patients) are consistent with the increased noise and instability of gait
reported in elderly subjects (LyE 30.5% higher in elderly)(4). Overall these results suggest that
like the elderly, MS patients experience movement patterns that result in a system that is less
stable and less able to react concisely to perturbations due to excessive noise in the system. In
conclusion, evaluation of gait variability allows for insight into the intricate strategies MS
patients use to control movement and may eventually help develop and evaluate appropriate
diagnostic and rehabilitative tools.
References
1. Stergiou et al. J Neurol Phys Ther. 2006 Sep;30(3):120-9.
2. Harbourne & Stergiou. Dev Psychobiol. 2003 May;42(4):368-77.
3. Cai et al. Philos Trans R Soc Lond B Biol Sci. 2006 Sep 29;361(1473):1635-46.
4. Buzzi et al. Clin Biomech. 2003 Jun;18(5):435-43.
5. Kurz & Stergiou. J Neuroeng Rehabil. 2007 Aug 15;4:30.
6. Stergiou et al. Clin Biomech. 2004 Nov;19(9):957-63.
Acknowledgements
This work was supported by the MARS Foundation, the National Institutes of Health (K25
HD047194), and the Nebraska Research Initiative.
0
2
4
6
8
10
12
14
Ankle Knee Hip
Coefficient of Variation
**
0.02
0.04
0.06
0.08
0.10
0.12
0.14
0.16
Ankle Knee Hip
Lyapunov Exponent*
0
0.5
1
1.5
2
2.5
3
3.5
4
4.5
Ankle Knee Hip
degre
es
Standard Deviation
*
Figure 1: Results for joint kinematics variability. * Sig.
differences between groups (p < 0.05).
293

THE CONFIGURATION OF THE JOINTS OF THE LOWER LIMBS IN THE FRONTAL PLANE IN THE GAIT OF OVERWEIGHT AND OBESE CHILDREN Elzbieta Pretkiewicz-Abacjew, Ph.D., D.Sc. The Jedrzej Sniadecki University School of Physical Education and Sport, Department of Postural Studies and the Methodology of Corrective Exercises, Gdansk, Poland
Introduction. One of the main problems of preventative paediatric medicine is that of excess weight and obesity. The most common form of obesity in schoolchildren is primary nutritional obesity, resulting from a calorie intake surplus to the body’s needs when the level of physical activity is low. This leads to a prolonged state of superfluous energy so that adipose tissue is deposited and the system of bones, muscles and ligaments is overloaded, while the excess body mass restricts physical activity and reduces fitness and physical efficiency [1]. In this study it is assumed that an early symptom of this is overloading in the area of the lower limbs and, as a result, faulty configuration of the joints, manifest in all forms of locomotion including gait. The purpose of the study was to investigate the configuration of the lower limb joints in the frontal plane in the gait of overweight or obese six-year-olds and to compare the results with those for children of normal body mass. Clinical significance. The changes in the configuration of the joints of the lower limbs in the gait of overweight and obese six-year-olds merit particular attention because of the danger posed to the bone-joint-ligament system of the lower limbs. The valgus twisting of the knee and tarsus in gait forces the children to increase step width, causing changes in the loading of the growth cartilage in the vicinity of particular joints, which may in turn lead to asymmetrical growth of the sockets. Maintaining the uneven distribution of an enlarged body mass on the bearing surfaces of the organs of movement may in the long term result in overloading, various kinds of deformity and later degenerative changes. Methods. A total of 35 overweight or obese six-year-olds were examined. The control group consisted of 33 children of normal body mass, who had been examined earlier using the same methods [2, 3]. Body build was determined by measuring body mass and height, and the lengths of the lower limbs and the distance between the hip joints were also measured. A BMI value within the 85-95 centile range was the criterion for regarding a child as overweight, while a BMI over the 95th centile was taken to indicate obesity [4, 5]. Gait was examined using a video-computer system (50 Hz). The children walked in a natural manner, barefoot. Angle values were measured in the frontal plane for the inclination of the tarsus in relation to the tibia (angle �°) and for the angle between the tibia and the femur in the knee joint (angle �°) during the single support phase, the central part of the foot being flat and with the whole weight of the body resting on it. The distance between the feet as positioned during the double support phase was measured and assessed in relation to the distance between the hip joints and the length of the lower limbs [2, 3]. Results. No difference was evinced in either group of children between the right and left limbs, either in terms of their length or of the joints analysed during gait, so that the results in
294

Table 1 have been set out for the right limb only. The overweight and obese children were similar in body height but were characterised by shorter lower limbs and a smaller distance between the hip joints. In the single support phase children of both groups showed a valgus positioning of the tarsus in relation to the tibia (angle �°), but in the case of the overweight and obese children this was almost twice as great and constituted a statistically significant difference. The configuration of the knee joint (angle �°) in the overweight and obese children was characterised by a valgus twisting of the tibia in relation to the tarsus, while in the children of normal body mass this was varus. Step width also differed significantly in relation to the distance between the hip joints and the length of the lower limbs. The overweight and obese children had a greater distance between the feet than between the hip joints as positioned in gait.
Table 1. The results of the examination of morphological features and the kinematics of gait. Feature / Children Normal Obesity & overweight Mass (kg) 22.6 ±3.14 (17.0-30.0) 28.7 ±3.7 (22.5-36.0)*Height (cm) 119.8 ±5.9 (106.0-133.0) 121.3 ±4.1 (111.0-128.5)BMI 15.7 ±1.44 (12.8-16.9) 19.5 ±1.95 (18.3-21.8)* Leg length (cm) 63.12 ±4.78 (55.3-79.1) 60.77 ±5.01 (53.9-78.5)* Distance of the hip joints (cm) 9.46 ±0.88 (8.19-11.87) 8.94 ±0.93 (7.9-10.2)*Ankle angle in frontal plane (α°) 8.08 ±3.0 (4.0-15.0) 15.3 ±3.78 (5.0-22.0)* Knee angle in frontal plane (β°) 4.97 ±1.94 (0.0-8.0) vg 5.5±1.02 (4.0-8.0)* kk Step width vs. leg length (%) 13.15 ±2.85 (8.1-19.5) 17.9 ±2.5 (14.1-23.4)* Step width vs. dist. hip joints (%) 88.05 ±19.68 (55.0-103.0) 108.9 ±16.6 (98.4-168.0)*
*Significant difference (p<0.05); vg – valgum knee; kk – knock knee
Discussion. The results demonstrate considerable irregularity in the operation of the lower limbs in overweight and obese children, combined with instability of the joints during locomotion, particularly during the single support phase, when the whole weight of the body rests on the supporting limb. An explanation for the wider step width observed during the double support phase may be found in the adaptive changes involved in the subconscious rebalancing of the body, hindered by excessive body mass, analogous to the adjustments made by children when learning to walk, who also place their feet further apart in order to keep their balance and stabilise the vertical position in gait [6]. To conclude, excessive body mass has a detrimental influence on the configuration of the joints of the lower limbs in gait in six-year-old children. References [1] Dietz W.H. (1994), American Journal of Clinical Nutrition. 59, 955-959. [2] Pretkiewicz-Abacjew E. and al., (2000), Journal of Human Kinetics 3, 115-130. [3] Pretkiewicz-Abacjew E., (2003), J. Sports Medicine and Ph. Fitness, 43, 156-162. [4] Rolland-Caschera M.F. and al., (2002), Inter. Journal of Obesity, 26, 1610-1616. [5] Report of WHO, (1995). [6] Sutherland DH and al., (1988), The Development of Mature Walking. Mac Keith Press.
295

Gait adaptation in visually impaired subjects reflects a cautious walking strategy Hallemans A, PhD. 1, 2, Meire F, MD, PhD. 3, Ortibus E, MD. 4 & Aerts P, PhD. 1,5
1. Functional Morphology, University of Antwerp, Belgium 2. Neuro- & Psychomotor Physiotherapy, Artesis University College of Antwerp, Belgium 3. Hopital Universitaire Des Enfants Reine Fabiola (HUDERF), Brussels, Belgium 4. University Hospital Gasthuisberg, Leuven, Belgium 5. Department of Movement & Sports Sciences, University of Ghent, Belgium
Objectives - To provide a biomechanical analysis of the habitual gait pattern of visually impaired individuals in an uncluttered environment.
Introduction - Vision provides information about the environment from a distance and plays an important role during locomotion, in the maintenance of dynamic stability and for route planning1. These insights result primarily from experimental studies manipulating the amount of visual information that reaches the eye either by blurring or occluding vision or using displacing prisms2. Only few studies3-6 exist that study the effect of low vision on locomotion in a population of visually impaired subjects. To gain insight into possible adaptation strategies used by the visually impaired, data on step-time parameters need to be complemented with kinematic data of gait. Apart from adding to the understanding of the problems faced by the visually impaired, this information can also improve our knowledge regarding the visual control of locomotion.
Methods - We investigated the natural walking pattern of 10 individuals with visual impairment (VIS) in an uncluttered environment and compared it to the gait pattern of 20 age-matched controls with normal vision (CON). Because of the close link between postural control and locomotion, we also considered postural sway.Postural sway was quantified by calculating the mean 2D velocity of the oscillations of the centre of pressure (VCoP) during 30 s of quiet stance. Participants were then asked to walk barefoot over an instrumented walkway (1.5 x 11m), free of obstacles, at self selected speed. Gait was recorded using an automated infrared camera system (Vicon Mcam 60, 6 cameras, 120 Hz, and Elite BTS, 6 cameras, 120 Hz.). Events of foot contact and foot off were determined based on force platform recordings and ankle trajectories. From these events, walking speed, step frequency, stride length, step width and duration of stance were calculated and scaled to leg length according to Hof7. Kinematics of thorax, pelvis, hip, knee and ankle was calculated using the Vicon ® Plug-in-Gait model. A set of 16 parameters (table 1) was selected to describe the kinematic waveforms. Differences between VIS and CON groups were investigated using the Mann-Whitney U test, significance level was set at p < 0.05.
Results - Individuals with visual impairment show a significantly smaller stride length (p < 0.05), limited trunk anteflexion (TAF, p < 0.001), increased hip flexion at foot contact (H0, p < 0.05), limited ankle plantar flexion at loading response (ALR, p < 0.001) and limited hip abduction in swing (Hab, p < 0.05). The increased postural sway (CoPvelo) and decreased preferred walking speed (D_speed) in the VIS compared to the CON group, show a trend towards significance (0.05 < p < 0.10).
296

Parameter Definition Parameter Definition TAF Maximal Trunk Anteflexion HROM2 Hip in/ext rotation range of motion TROM Trunk range of motion in coronal
plane K0 Knee flexion at foot contact
PROM1 Pelvic range of motion in frontal plane
KLR Knee flexion at loading response (range of motion)
PROM2 Pelvic range of motion in coronal plane
KROM Knee flexion/extension range of motion
H0 Hip flexion at foot contact A0 Ankle dorsiflexion at foot contact HROM1 Hip flexion/extension range of
motion ALR Ankle plantar flexion at loading response
(range of motion) Hab Maximal hip abduction in swing Adf Maximal ankle dorsiflexion in stance Had Maximal hip adduction in stance Apf Maximal ankle plantar flexion at push-off Table�1
Discussion - In literature, contradicting results are published regarding postural sway in blind subjects. Our results show a trend towards increased postural sway in VIS compared to CON. This confirms the findings of Juodzbaliene and Muckus 8 who demonstrated differences in equilibrium parameters between sighted and totally blind subjects and concluded that vestibular function cannot replace the role of vision during motor performance. Similarly to the findings of Nakamura 6 walking speed is lower in VIS compared to CON. A slower walking allows for more time for haptic exploration1. This seems to be confirmed by the flat foot contact that is observed in the VIS group which allows the foot to probe the ground. Marked features of gait in the visually impaired are a more backward position of the trunk, a flexed hip and a flat foot contact. The more backward leaning position of the trunk and the more flat foot contact are also observed in blindfolding experiments 9. The observed gait adaptations are suggested to reflect a more cautious control strategy of walking.
Acknowledgements This study was funded by the National Science Foundation Flanders by means of a personal grant for AH. We thank all participating adults and children. The “Centre de reeducation fonctionnel de Ghlin” is much appreciated for their logistic support.
Reference List 1. Patla AE Understanding the roles of vision in the control of human locomotion. Gait & Posture 1997; 5:
54-69 2. Patla AE. How is human gait controlled by vision? Ecological Psychology 1998; 10: 287-302 3. Kallie CS., Schrater PR., Legge GE. Variability in stepping direction explains the veering behavior of
blind walkers. Journal of Experimental Psychology: Human Perception and Performance 2007 4. Loomis JM., Klatzky RL., Golledge RG., Cicinelli JG., Pellegrino JW., Fry PA. Nonvisual navigation by
blind and sighted: assesment of path integration ability. Journal of Experimental Psychology - General 1993; 121: 73-91
5. Seemungal BM., Glasauer S., Gresty M., Bronstein AM. Vestibular Perception and Navigation in the Congenitally Blind. J Neurophysiol 2007: E-pub ahead of print
6. Nakamura T Quantitative analysis of gait in the visually impaired. 1997 7. Hof AL Scaling gait data to body size. Gait & Posture 1996; 4: 222-223 8. Juodzbaliene V, Muckus K The influence of the degree of visual impairment on psychomotor reaction and
equilibrium maintenance of adolescents. 2006 9. Hallemans A, Beccu S, Van Loock K, Ortibus E, Truijen S, Aerts P Visual deprivation leads to gait
adaptations that are age and context-specific: II. kinematic parameters. 2009 ••
297

A NEW TEST OF HIP ABDUCTOR STRENGTH Krista A. Coleman Wood, Kenton R. Kaufman
Mayo Clinic Motion Analysis Laboratory, Rochester, MN
Introduction: Gait depends on adequate hip musculature strength for both stabilizing the trunk on the stance limb and for driving the body through space. Three dimensional hip kinetic parameters are frequently used to discriminate between “normal” and “abnormal” dynamic function. Patients with hip osteoarthritis have been shown to have decreased hip abduction strength 1 compared with unimpaired subjects. These patients have a concomitant decrease in dynamic hip function (Trendelenburg limp), which both has 2 and has not 3 been detected during level walking. Using stair tasks to increase demand on the hip abductor muscles have not been successful 4 in part because many study subjects have not been able to perform the stairs tasks 5. Studies have predominantly focused on detecting difference between the involved hips of a subject with OA and matched control subjects. However, neither dynamic hip abduction kinetics during level walking nor stair climbing have been able to differentiate between involved and uninvolved sides. We hypothesized that a hip abduction task performed in standing (SAbT) would place a more focused demand on hip abductors of the stance limb and thus differentiate between involved and uninvolved hip joints. Clinical Significance: A new test has been developed for quantification of dynamic hip abduction function. This test is beneficial for determining efficacy of outcomes from surgical intervention (total hip arthroplasty), rehabilitation (strength training), or changes due to altered anatomy (lever arm dysfunction following hip fracture stabilization with compression pinning). Methods: A cohort of consecutive subjects with unilateral hip osteoarthritis, participating in a study of minimally invasive surgery (MIS) for total hip arthroplasty (THA), was enrolled after providing informed written consent. Motion data was acquired (60 Hz) via a 10 camera high resolution system (Motion Analysis Corp., Santa Rosa, CA) within a data capture volume of 4x5x2 m. Four force platforms (2 Kistler model 9281B; Kistler Instrument Corp., Amherst, NY and 2 AMTI model BP400600; Advanced Mechanical Technology, Inc., Watertown, MA) embedded in the floor and a pair of AMTI force platforms (model ZBP 245600) embedded in the second and third steps of a flight of seven, 16.5 cm steps were used to gather ground reaction force data. Data from the force platforms was temporally synchronized with the motion analysis data. Five trials were collected for each walking condition. The SAbT consisted of the subject standing with both feet on one of the floor level force platforms and raising one of their legs into abduction before returning it to the standing position. The SAbT was performed three times for the surgical side (ipsilateral - IL) and the non-surgical side (contralateral - CL). Kinetic data were calculated using OrthoTrack v.6.29 (Motion Analysis Corporation, Santa Rosa, CA). Custom programs written in MatLab (The Mathworks, Natick, MA) were used to average the kinetic data from activities and extract extrema for analysis. Comparisons were tested for statistical significance using repeated measures ANOVA in the JMP software (Version 8.0; SAS Institute, Inc., Cary, NC). Statistical significance was set at p ≤ 0.05.
298

Figure 1. Preoperative mean peak hip abduction moments and standard deviations of subjects with OA during level walking, ascending steps, descending steps and the SAbT. Peak hip abduction moments are significantly greater during the SAbT than any other gait tasks.
0
0.2
0.4
0.6
0.8
1
1.2
1.4
IL CL
Hip
Abd
uctio
n M
omen
ts (N
m/k
g)
Results: Twenty-two subjects (15 males and 7 females) with an average age of 63.95 years (± 13.01) participated as subjects. All subjects performed level walking but only 15 subjects were able to perform the stair walking and 18 were able to perform the SAbT bilaterally. Peak abduction moments during the SAbT were significantly greater than during any other gait task on both the IL and CL sides (Figure 1). Differences between the IL and CL sides were statistically significant (p = 0.052) for all tasks. Discussion: Peak hip abduction moments obtained during the SAbT are greater than during any other gait activity indicating the SAbT presents a greater challenge to hip abductor muscles than the other gait tasks. Performance of the SAbT to test hip abductor muscles does not require instrumented stairs and thus can be used in any lab with a motion capture system and force platform embedded. More subjects could perform the SAbT than the stair tasks. The magnitude of difference between the hip abduction moments during traditional gait activities and the SAbT demonstrates that SAbT is a clearly superior challenge to hip abductor muscles than the other gait tasks. References: 1. Arokoski, et al., J Rheumatol, 29(10):2185-95. 2002 2. Foucher, et al., J Biomech, 40(15):3432-7. 2007 3. Hurwitz, et al., J Biomech, 31(10):919-25. 1998 4. Nadeau, et al., Clin Biomech, 18(10):950-9. 2003 5. Foucher, et al., Clin Biomech, 23(6):754-61. 2008 Acknowledgements: Thanks to my colleagues Diana Hansen, Kathie Bernhardt, Christine Huyber and Alex Hooke for their assistance with data collection and reduction.
299

ALTERED INTER-JOINT COORDINATION DURING WALKING IN PATIENTS WITH TOTAL HIP ARTHROPLASTY
Shiu-Ling Chiu and Li-Shan Chou
Department of Human Physiology, University of Oregon, Eugene, OR, USA
E-mail:[email protected]
INTRODUCTION Total hip arthroplasty (THA) is a common surgery for a deteriorated hip joint to effectively regain its functions. Previous gait analyses of THA patients were mainly focused on the kinematics and kinetics of individual joint. However, human gait is a complex task requiring a precise end point motor control that is accomplished by a multi-joint coordination. Inconsistency in such coordination may induce gait deviations. Inter-joint coordination implies the essential timing and sequencing of neuromuscular control over biomechanical degrees of freedom, and the variability of coordination reflects the adaptability of this control. The purpose of this study was to investigate the patterns and variability of inter-joint coordination for both surgical and non-surgical limbs of THA patients during walking. CLINICAL SIGNIFICANCE Patients underwent THA are reported to have a higher risk of falling due to the residual deficits in balance control and joint function [1]. Investigating the inter-joint coordination during gait would help us to identify changes in neuromuscular control strategies due to hip joint dysfunction. This information might be useful in developing rehabilitation interventions or fall prevention programs for THA patients in the future. METHODS Thirty adults were recruited and divided into two groups in this study. Twenty patients underwent unilateral THA (15 male, 5 female, age = 56.5 ± 5.4 yrs, BMI = 32.6 ± 4.0 kg/m2), and 10 subjects served as age-matched controls (5 male, 5 female, age = 59.9 ± 5.3 yrs, BMI = 26.3 ± 3.9 kg/m2). THA patients were tested three times at pre-surgery, 6-weeks and 16-weeks post surgery, respectively. All patients received the same un-cemented Zimmer hip implants and followed the same physical therapy regimens during the study period. Control subjects were tested twice with one month apart. An eight-camera motion analysis system (Motion Analysis Corp., Santa Rosa, CA) was used to collect the whole body motion during level walking at self selected pace. A total of 29 reflective markers were placed on bony landmarks. Joint kinematics of the bilateral lower extremities was calculated by using OrthoTrak kinematic analysis software (Motion Analysis Corp). Continuous related phase (CRP), which is derived from the phase portraits of two adjacent joints, was used to investigate the inter-joint coordination pattern and variability [2]. Between groups differences in CRP pattern were examined by using cross-correlation measures and root-mean-square (RMS) difference to compare the ensemble mean curves of THA group to the controls. The variability of coordination for each subject was calculated as average standard deviation of every point on the ensemble CRP curve over a stride, namely deviation phase (DP). A mixed-model analysis of repeated measures was used to analyze the effects of groups and time on DP. Significance level was set at 0.05.
300

05
101520253035
Pre 6wk 16wk
Time
RM
S di
ffere
nce
(deg
rees
)
non surgical H-Knon surgical K-Asurgical H-Ksurgical K-A
0.9
0.92
0.94
0.96
0.98
1
Pre 6wk 16wk
Time
Cro
ss-c
orre
latio
n C
oeffi
cien
t(r2 )
non surgical H-K
non surgical K-A
surgical H-K
surgical K-A
RESULTS RMS difference for hip-knee and knee-ankle CRP decreased gradually after surgery for both surgical and nonsurgical limbs (Fig. 1). The surgical limb remained a greater RMS difference than nonsurgical limb at 6- and 16-week post surgery. Cross-correlation measures were overall strong for CRP pattern of both limbs, with r2
values greater than 0.94, and were improved after surgery (Fig. 2). The variability for CPR is shown in Table 1. The surgical and nonsurgical limbs of THA group had higher DP values comparing to the controls at pre-surgery and 6-week post surgery. Of the surgical limb, significant group differences in hip-knee DP values were detected at pre-surgery, and significant group differences in knee-ankle DP values were detected at both pre-surgery and 6-week post surgery. Compared to pre-surgery, significant time effects on THA patients were detected in hip-knee DP values at 16-week post surgery for both limbs, and in knee-ankle DP values at 16-week post surgery for surgical limb. DISCUSSION/CONCLUSIONS Our results suggest that adjustments in inter-joint coordination of THA patients occurring at both surgical and nonsurgical limbs in responses to a deteriorated hip joint. Both hip-knee and knee-ankle coordination were altered with higher variability to compromise with this constrained hip joint, especially in the surgical limb. Asymmetric changes in accommodations and variability of bilateral lower extremities may contribute to the residual gait problems observed in THA patients. Therefore, clinical efforts may exert to improve the inter-joint coordination in this population. REFERENCES 1. Majewski, M., et al. J Bone Joint Surg [Br] 87, 1337-1343, 2005. 2. Burgess-Limerick, R., et al. J Biomech 26, 91-94, 1993. ACKNOWLEDGEMENTS Assistances from Hao-Ling Chen, Brian Jewett, MD, and Dennis Collis, MD are appreciated. Table 1. DP values for CRP curves of controls and THA
* significant group difference; † comparing to pre-surgery; # comparing to 6-week post surgery
Controls
THA
Non surgical Surgical
Pre-surgery 6-week post surgery
16-week post surgery
Pre-surgery 6-week post surgery
16-week post surgery
Hip-Knee 30.63 (7.22)
41.14 (17.87)
40.05 (28.79)
26.98 † # (10.63)
53.38 * (25.83)
45.44 (25.17)
30.98 † # (11.30)
Knee-Ankle 38.47 (6.32)
48.32 (18.93)
47.14 (25.65)
37.81 (21.58)
63.76 *
(27.23) 53.59 * (21.04)
42.62 † # (15.52)
Fig. 1. RMS differences (degrees) for CRP patterns between controls and THA.
Fig. 2. Cross-correlation (r2) for CRP patterns between controls and THA.
301

Outcome with gait analysis of limb reconstruction for severe forms of fibular hemimelia1J. McCahill, 1J. Stebbins, 2 S.Thomas, 1C.Bradish, 1M.McNally 1T.Theologis
1Oxford Gait Laboratory, Nuffield Orthopaedic Centre, Oxford UK2 Bristol Royal Hospital for Children, Bristol UK
INTRODUCTIONFibular hemimelia is a congenital limb reduction deficiency characterised by partial or complete absence of the fibula and a spectrum of associated anomalies. For children with a major anticipated limb length discrepancy and severe foot deformity, management (amputation or limb reconstruction) is controversial.
CLINICAL SIGNIFICANCEThis is the first study to use instrumented gait analysis for severe fibular hemimelia managed with limb reconstruction. The results add ob jective data to the debate over limb reconstruction or amputation in this group of children.
METHODSEight participants (mean age 25 years ± 5.2) who underwent limb reconstruction as children inone of two UK centres for severe fibular hemimelia were assessed using lower limb kinematicsand kinetics, energy consumption, and quality of life questionnaires. Kinematic and kinetic datawere collected using a 12 camera Vicon 612 system (Oxford, UK) and compared to our normative database. Energy expenditure and walking speed were calculated with the COSMED K4b2 system using a ‘figure of 8’ walkway 20 metres in length. The SF-36 and lower limbdomains of the Toronto Extremity Salvage Score (TESS) questionnaires were also administered.
RESULTSKinematic analysis of the affected limbs, in the sagittal plane, revealed that 6 participants had an anterior pelvic tilt with a “single bump” pattern and reduced hip extension. At knee level there was an absent loading response in 7 participants with overall variable knee extension in midstance. Two patients had significantly reduced peak knee flexion in swing. 6 participants had absent 1st and 2nd ankle rockers and 7 had equinus in swing. In the coronal plane all subjects had pelvic obliquity, with the affected side down, and reduced range of hip abduction. 6 participants had valgus knee alignment. Kinetic data of their affected limb showed an internal hip adduction moment in late stance. All 8 participants had consistently abnormal coronal knee moments with increased internal varus moments throughout stance. They also had reduced peak plantar flexion moment with reduced push-off power at the ankle.
Quality of life questionnaires indicated that participants scored well for general health but had functional limitations reflected in lower TESS scores. Subjective residual problems included:inability to kneel, patellar subluxation, inability to walk barefoot, unstable ankle, unstable knee, and persistent leg length discrepancy. Residual leg length discrepancy measured clinically was mean 2.5 cm.
302

Results from the energy consumption testing are displayed in Table 1, and show that speed wasreduced and O2 cost increased compared to normal data published in the literature.
DISCUSSIONAlthough the number of participants is small, this is the first study to use instrumented gait analysis for severe fibular hemimelia managed with limb reconstruction. The results add objective data to the debate over limb reconstruction or amputation in this population. Thekinematic and kinetic deviations occurred mostly in the sagittal and coronal planes at pelvis, hip, knee and ankle levels. Of interest, there were kinematic and kinetic deviations in some of the participants’ uninvolved limbs which require further investigation.
As expected, our COSMED results indicate that individuals with reconstructed unilateral fibular hemimelia have increased energy requirement for ambulation compared to normal data and adjust for this by slowing their walking speed.
Case groupVO2ml/kg/min
O2costml/kg/m
Speed(m/s)
Reconstructedunilateral FH 11.96 (3.02) 0.21 (0.03) 0.95 (0.21)Normal control group 13 +/-2.7 0.16 1.4Traumatic BK amputee 15.5 0.20 1.2Vascular Syme amputee 11.5 0.21 0.9
Table 1: Comparison of energy expenditure results with Waters et al (1976)
Comparing our data with Waters et al (1976) shows that individuals with traumatic below knee amputations select a quicker walking speed at increased energy consumption but with similar efficiency to our study group. Individ uals with vascular Syme’s amputations select a similar walking speed to our study group with a similar rate of oxygen cost and energy expenditure.There is currently no data in the literature for energy consumption in patients with amputation following fibular hemimelia.
REFERENCESWaters RL, Perry J, Antonelli D, Hislop H. Energy cost of walking of amputees: the influence of level of amputation. J Bone Joint Surg Am 1976;58-1:42-6.
303

Comparison of Gait Energy Cost between Aquatic and Overground Treadmill Walking
in People Post-stroke
Yoshimasa Ozaki, Konstantinos Vrongistinos, PhD, Victoria Jaque, PhD and
Taeyou Jung, PhD
Center of Achievement,Department of Kinesiology, California State University, Norrthridge
Introduction
Approximately 5.8 million people have had a stroke in the United States. Nearly one third of
them retain some permanent disability1. The restoration of ambulation is a critical objective in
rehabilitation as only 23 % of individuals who have had no independent ambulation ability
after stroke are able to recover independent ambulation2. Hemiparesis caused by stroke
increases energy expenditure, joint stress, and fall risk during walking3, 4
. Such limitations
affect their functional mobility as well as other activities of daily living. As a result of the
compromised mobility and physical inactivity, their cardiovascular fitness suffers and can
lead to an increased risk for a recurrent stroke and secondary health conditions. Thus, the
improvement of cardiovascular fitness is one of the most important components in
rehabilitation after stroke.
Water properties can provide individuals with hemiparesis post-stroke with an ideal
environment for gait and cardiovascular training. Aquatic setting can help them walk with
decreased body weight bearing, joint stress, and fear of falling. These advantages may allow
them to exercise for a longer duration or possibly at a higher intensity as compared to
compatible exercise on land. The purpose of this study was to compare the cardiorespiratory
(CR) responses between aquatic and conventional overground treadmill walking (TW) in
people with hemiparesis post-stroke.
Clinical Significance
Few studies has investigated CR responses during aquatic TW or compared energy
expenditure between aquatic TW and conventional overground TW in people with
hemiparesis post-stroke. This study applied a novel approach to examine the differences in
metabolic cost and gait efficiency between the two TW modes. The findings can yield
scientific foundation for clinicians to develop evidence-based rehabilitation programs for
individuals post-stroke in various recovery stages.
Methods
A total of 8 individuals with hemiparesis post-stroke (5 males, 3 females, mean age: 56.0±9
yrs) and 8 healthy controls (5 males, 3 females, mean age: 54.9±9.8 yrs) participated in this
study. Each participant was randomly assigned to perform 10-minute aquatic and overground
TW at a matched walking speed on separate days. The matched speed was calculated based
upon the average of their self-selected comfortable walking speeds from each TW condition.
The pool water temperature was set between 90 and 94 degrees Fahrenheit, and the water
depth was adjusted at the xiphoid process of each participant by a movable floor pool in order
to provide an equivalent experimental setting. Research variables included oxygen
consumption (VO2), oxygen cost (VO2 cost), carbon dioxide production (VCO2), minute
ventilation (VE), and respiratory quotient (R). They were measured using a telemetric
metabolic system (K4b2, Cosmed Inc., Rome, Italy, 1998). The means of CR values were
304

determined between minute 6th and minute 9th under steady state and were compared with responses during resting and recovery phases. MANOVA was used for the statistical analysis. Results The matched walking speed of stroke group was significantly lower than control group (P<.01) (Table 1). Both groups showed increased steady state VO2, VO2 cost, VE, and VCO2 during as compared to baseline (Ps<0.01) (Fig.1). Aquatic TW in stroke group showed significantly lower steady state VO2 (66.2%), VO2 cost (36%), VCO2 (75%), and VE (31.9%) compared with overground TW (Ps<.01) while control group showed no significant difference between 2 TW conditions. A significant group interaction was found across 2 TW conditions. Table 1: Mean (SD) values in CR responses during overground and aquatic TW Control group Stroke group Matched-walking speed (m/sec) 0.56 (0.19) 0.26 (0.08)*
Overground Aquatic Overground Aquatic VO2 (ml/kg/min) 8.53 (1.74) 6.96 (2.09) 10.75 (2.95) 6.47 (2.27)* VO2 cost (ml/kg/m) 0.27 (0.04) 0.22 (0.27) 0.75 (0.31) 0.48 (0.27)* VE (l/min) 17.7 (5.1) 17.8 (3.62) 26.6 (11.3) 20.1 (6.5)* VCO2 (l/min) 485.4 (156.2) 359.6 (75.0) 713 (222.4) 407.5 (193.4)* R 0.78 (0.04) 0.75 (0.09) 0.86 (0.03) 0.81 (0.13)
*P<.01: overground TW vs. aquatic TW within group
0
2
4
6
8
10
12
Rest Steady state Recovery
VO2
(ml/k
g/min)
Phase
VO2 change in stroke group
LD
AQ
0
2
4
6
8
10
Rest Steady state Recovery
VO2 (
ml/k
g/m
in)
Phase
VO2 change in control group
LDAQ
Fig.1: Changes in VO2 during aquatic and overground TW, *P<.01
Discussion Our finding of the greater VO2 in stroke group than control group during overground TW is consistent with previous study results3. However, during aquatic TW, we found that stroke group showed a lower VO2 than healthy control group. The significant reduction in VO2, VCO2 and VE during aquatic TW in the stroke group indicates that a lower metabolic cost is required for people with hemiparesis to walk on aquatic treadmill than overground treadmill. This outcome suggests that the aquatic environment may be more advantageous for individuals with hemiparesis post-stroke to perform walking exercise without taxing excessive energy cost particularly in the early stage of rehabilitation.
1. Prevalence of stroke--United States, 2005 (2007). MMWR Morb Mortal Wkly Rep, 56(19), 469-474. 2. Jorgensen, H. S., Nakayama, H., Raaschou, H. O., & Olsen, T. S. (1995). Recovery of walking function in stroke patients:
the Copenhagen Stroke Study. Arch Phys Med Rehabil, 76(1), 27-32. 3. Platts, M. M., Rafferty, D., & Paul, L. (2006). Metabolic cost of over ground gait in younger stroke patients and healthy
controls. Med Sci Sports Exerc, 38(6), 1041-1046.
305

Gait Impairment in PAD Patients is Independent of Level of Disease
Neil B Huben1, Jennifer M Yentes
1, Panagiotis Koutakis
1, Sara A Myers
1,
Jason M Johanning2, 3
, Iraklis I Pipinos2, 3
, Nicholas Stergiou1, 4
1Nebraska Biomechanics Core Facility, University of Nebraska at Omaha, Omaha, NE
2Department of Surgery, University of Nebraska Medical Center, Omaha, NE
3Veterans Affairs Medical Center, Omaha, NE, USA
4College of Public Health, University of Nebraska Medical Center, Omaha, NE
Email: [email protected] Web: http://biomech.unomaha.edu/
INTRODUCTION
Peripheral arterial disease (PAD) is a manifestation of atherosclerosis in the lower extremities
which causes reduced blood flow to the legs. This leads to muscle ischemia and claudication,
or pain during walking due to insufficient oxygen delivery to the working muscles. PAD can
manifest as one of three levels of disease based on the location of the atherosclerosis in the leg
arteries. Atherosclerosis occurs in the iliac arteries in aortoiliac occlusive disease (AIOD), in
the femoral and popliteal arteries in femoropopliteal occlusive diseases (FPD), and in one or
more of the iliac, femoral and popliteal, and posterior tibial and peroneal arteries in patients
with multiple-levels of disease (MLD).
CLINICAL SIGNIFICANCE In previous studies in our laboratory, we have determined that PAD patients have altered joint
kinetics and kinematics as compared to controls[1,2,3]
. However, it is unknown if these
differences are consistent for patients with varying levels of occlusion. We hypothesized that
the joint kinetics would be similar between AIOD, FPD, and MLD groups and that
differences between healthy controls and each respective group would be consistent.
METHODS
Twenty-eight AIOD (age: 60.42+11.56yrs), thirty-six FPD (age: 66.33+9.20yrs), and thirty-
four MLD (age: 62.71+8.43yrs) patients presenting with claudication in at least one limb and
thirty-eight matched healthy controls (age: 61.07+12.10yrs) walked over a Kistler force
platform (600 Hz) to acquire kinetics of the affected limb, while kinematics was recorded
simultaneously with an 8-camera Motion Analysis system (60 Hz). Five trials of pain free
walking were collected for the affected limbs, with a mandatory 1-minute rest period between
each trial to prevent onset of claudication pain. Joint moments and powers were calculated
from the kinematics and kinetics during the stance phase of gait. One-way ANOVAs were
used to identify differences between the three PAD groups for selected parameters.
Independent t-tests were also performed to identify differences between each PAD group and
the healthy matched controls.
RESULTS
Results are presented in Table 1 below. Only significant results are reported.
DISCUSSION Comparisons between the three PAD groups identified only 3 out of 42 comparisons as
significant. However, the three significant comparisons occurred in variables that were
306

consistently identified as affected in PAD patients especially with respect to push-off in late
stance and it should be mentioned that the FPD group exhibited the worst values. When each level
of disease group was compared to controls, 30 of the 42 comparisons were significantly different.
These results show that joint kinetics are consistently altered as compared to healthy controls,
regardless of the level of disease occlusion. In general, these results support our previous research
which combined PAD patients of varying levels of disease. These findings are also in agreement
with our previous work that found an inability of PAD patients to accept, support, and propel
the body forward during the stance phase. Furthermore, the overall absence of significant
differences between the three PAD groups emphasize further that these biomechanical
alterations are due to the documented metabolic myopathy and altered neural function[4]
,
which affects proximal muscles in addition to distal muscles, regardless of occlusion location.
REFERENCES
1. Chen et al. (2008). Journal of Biomechanics, 41:2506–2514.
2. Koutakis et al. (in press). Journal of Vascular Surgery.
3. Scott-Pandorf et al. (2007). Journal of Vascular Surgery, 46:491-499.
4. Pipinos et al. (2007). Vascular and Endovascular Surgery, 41(60):481-489.
ACKNOWLEDGEMENTS Support was provided by the NIH/NIA/Ruth L. Kirschstein National Research Fellowship and the
Nebraska Research Initiative.
Table 1: Group means (±SD) from peak joint moments and powers. Aortoiliac
Occlusive Disease
Femoropopliteal
Occlusive Disease
Multiple-Levels
of Disease
Control
Ankle Dorsiflexor Moment (N*m/kg) 1.30±0.26 1.20±0.17* 1.33±0.14 1.35±0.15
Ankle Plantarflexor Moment
(N*m/kg) -0.32±0.11 -0.30±0.14*† -0.32±0.11† -0.36±0.10
Knee Extensor Moment (N*m/kg) 0.56±0.29* 0.68±0.30 0.56±0.26* 0.76±0.21
Hip Extensor Moment (N*m/kg) 0.71±0.24* 0.77±0.22* 0.77±0.14* 0.92±0.24
Hip Flexor Moment (N*m/kg) -0.91±0.40† -0.74±0.30*† -0.90±0.27* -1.06±0.23
Ankle Plantarflexor Power Mid-
stance (w/kg) -0.42±0.22 -0.33±0.19* -0.39±0.22* -0.54±0.28
Ankle Plantarflexor Power Late
Stance (w/kg) 2.36±0.57* 1.98±0.57*† 2.49±0.49*† 2.97±0.66
Knee Power Early Stance (w/kg) -0.63±0.36* -0.68±0.31* -0.58±0.28* -1.02±0.40
Knee Power Early Mid-stance (w/kg) 0.28±0.16* 0.33±0.21* 0.30±0.21* 0.53±0.29
Knee Power Late Stance (w/kg) -0.66±0.36* -0.62±0.29* -0.60±0.22* -0.91±0.33
Hip Power Early Stance (w/kg) 0.43±0.22* 0.52±0.22 0.45±0.19* 0.60±0.25
Hip Power Early Mid-stance (w/kg) -0.68±0.29* -0.63±0.35* -0.64±0.22* -0.96±0.26
Hip Power Late Stance (w/kg) 0.58±0.23* 0.52±0.21* 0.63±0.20 0.71±0.22
Note: *
p < 0.05, significant differences between PAD group and healthy controls. † p < 0.05, significant differences between two indicated PAD groups using Tukey post-hoc analysis.
307

The Relationship Among Pain, Structure, and Function of the Knee in Patients with Medial Knee Osteoarthritis
Becky Avrin Zifchock PhD, Allison Brown PT MA, Sherry Backus PT DPT MA, Eric
Bogner MD, Helene Pavlov MD, Chris Chen PhD, Lisa Mandl MD, David Hunter MD PhD, Howard Hillstrom PhD
Leon Root, MD Motion Analysis Laboratory; Hospital for Special Surgery; NY, NY
INTRODUCTION Knee osteoarthritis (OA) severity is often characterized using various measures of pain, structure, and function. Pain is typically the most important factor from a patient’s standpoint, and is often considered a primary outcome in assessing disease severity. Structural assessment via x-ray is considered the gold-standard for diagnosis. Kinetic and kinematic variables are measured in high-tech motion analysis laboratories, and are useful for the objective quantification of function, while questionnaires provide more easily-obtained measures of subjective function. Therefore, the following aims were assessed: (1) to examine the relationship among knee pain, structure, and function in patients with medial knee OA, (2) to examine the strength of the relationship between subjectively and objectively-determined measures of function, and (3) to identify the structural or functional variable that is most predictive of pain. CLINICAL SIGNIFICANCE It is important to understand whether these measures of pain, structure, and function are gauging similar aspects of the severity of knee OA. METHODS Baseline characteristics were studied in 10 subjects in an ongoing longitudinal study: 4 male/6 female, 67.8yrs±8.3, 1.7m±0.1, and 79.6kg±8.4. All had unilaterally-symptomatic medial knee osteoarthritis with a Kellgren-Lawrence grade ranging from 2 to 4. The variables of interest in this study were: pain: pain following a 5-min walk (100mm visual analog scale); structure: knee flexion-extension range of motion, tibio-femoral angle (varus +), and minimum medial tibio-femoral joint space; objective function: peak stance-phase knee adduction angle and abduction moment; subjective function: the five subscales of the Knee Injury and Osteoarthritis Outcome Score (KOOS): Pain, Symptoms, Activities of Daily Living, Sport, and Quality of Life [1]. A lower score in any of the subscales is indicative of compromised function. To assess the first and second aims, Spearman correlation coefficients were calculated between each of the variables of interest. All relationships were described for the first aim, and the subset of subjective and objective functional measures were more closely examined for the second aim. A multiple regression was carried out to assess the third aim. P < 0.05 was considered significant for all tests.
RESULTS Structural measures of severity were highly correlated with each other. Subjectively-determined functional measures tended to be strongly correlated amongst each other. Objectively-determined functional measures exhibited weak relationships within themselves as well as with the subjectively-determined functional measures. The results of the multiple regression showed that medial joint space was the single best predictor of pain, accounting for 80% of the variability of the measure.
308

Table 1: Spearman Rho correlation coefficients. Structural and functional variables, respectively, are grouped together. Redundant matrix entries are shaded. (*p < 0.05, ** p <0.01)
Pain Knee FL/EX
TF Ang
Jnt Space
KAD Ang
KAB Mom
KOOS Pain
KOOS Symp
KOOS ADL
KOOS Sport
KOOS QOL
Pain -0.7* +0.7* -0.7* +0.7* 0 -0.8** -0.6 -0.6* -0.4 -0.5
Knee FL/EX -0.7* -0.7* +0.9** -0.9** +0.2 +0.6 +0.7* +0.5 +0.4 +0.7*
TF Ang +0.7* -0.7* -0.7* +0.7* -0.2 -0.7* -0.7* -0.3 -0.4 -0.6
Jnt Space -0.7* +0.9** -0.7* -0.9** +0.2 +0.7* +0.7* +0.6 +0.5 +0.8*
KAD Ang +0.7* -0.9** +0.7* -0.9** -0.5 -0.5 -0.6 -0.4 -0.4 -0.6*
KAB Mom 0 +0.2 -0.2 +0.2 -0.5 -0.2 -0.1 -0.4 -0.2 -0.1
KOOS Pain -0.8** +0.6 -0.7* +0.7* -0.5 -0.2 +0.7* +0.8** +0.7* +0.7*
KOOS Symp -0.6 +0.7* -0.7* +0.7* -0.6 -0.1 +0.7* +0.8* +0.7* +0.9**
KOOS ADL -0.6* +0.5 -0.3 +0.6 -0.4 -0.4 +0.8** +0.8* +0.7* +0.8**
KOOS Sport -0.4 +0.4 -0.4 +0.5 -0.4 -0.2 +0.7* +0.7* +0.7* +0.9**
KOOS QOL -0.5 0.7* -0.6 +0.8* -0.6* -0.1 +0.7* +0.9** +0.8** +0.9**
DISCUSSION The large number of significantly correlated pain, structural, and functional variables suggest that these factors may be addressing similar aspects of disease severity. As expected, pain was highly correlated with most of the other variables particularly with the KOOS Pain subscale. Subjectively and objectively-determined measures of function tend to exhibit weak relationships, which supports previous work by Gandhi et al. [2] that showed weak relationships between subjective and objective functional testing in patients undergoing hip and knee joint replacement. It should be noted that knee abduction moment was not significantly correlated with any other variable, which suggests that it assesses a different aspect of disease severity, or that is not a strong indicator of severity. Radiographic evidence, specifically narrowing of the medial joint space, which is currently the gold standard for diagnosing knee osteoarthritis, was most strongly predictive of pain. Thus, to date, the data from this study suggest that radiographic findings are appropriate for defining disease severity from both the patient’s and clinician’s perspective. REFERENCES [1] Roos, et al. Health Qual Life Outcomes, 2003 [2] Gandhi, et al. Clin Rheumatol, 2009 ACKNOWLEDGEMENTS The authors gratefully acknowledge Yatin Kirane, D. Orth, PhD for his assistance in data collection, New Balance for providing footwear, and Ossur Americas for providing knee braces for our subjects and an unrestricted educational grant that helped support this study.
309

3D GAIT KINEMATICS OF TRANSTIBIAL AMPUTEES WALKING IN EVERY-DAY-
LIFE ENVIRONMENTS: RELIABILITY STUDY OF A PROTOCOL BASED ON
INERTIAL & MAGNETIC SENSORS
Cutti A.G.1, Raggi M.
1, Garofalo P.
2, Bottoni G.
3, Amoresano A.
1
1 I.N.A.I.L. Prostheses Centre, Vigorso di Budrio (BO), Italy
2 DEIS, Department of Electronics, Computer Science and Systems, University of Bologna (BO), Italy
3 DEI, Department of Information Engineering, University of Padova (PD), Italy
Introduction The instrumental 3D gait analysis of amputees is currently limited to few prosthetic centres in
which expensive movement analysis laboratories are available. Moreover, in the laboratotory the
gait of a patient can be conditioned by the stress imposed by the operators and by the artificial
surrounding environment. Inertial and Magnetic Measurement Systems (IMMSs) might allow to
overcome these limitations, being low-cost and portable. In addition, since the 3D orientation of
their Sensing Units (SU) is known in a global earth-based coordinate system, which is
ubiquitous, long measurements can be possible in real-life environment. For this purpose, we
proposed a protocol named „Outwalk‟ to measure the 3D kinematics of gait based on the IMMS
by Xsens Technologies (NL) [1]. The aim of the present work was to test the inter-operator
reliability of the protocol on Transtibial Amputees (TA).
Clinical Significance
The measurement of the 3D lower limb kinematics through IMMUs allows to perform clinical
evaluations during spontaneous walking in real-life environments. In this conditions the walking
of amputees can be analyzed where the gait-training is typically carried out, such as corridors,
gyms and environments out of the buildings whilst measuring important clinical parameters.
Outwalk protocol based on IMMSs might have important implications for the diffusion of
portable instruments to every-day-life clinical routine even in small prosthetic centres.
Methods
To measure the pelvis-trunk, hips, knees, and ankles 3D kinematics, Outwalk requires to 1)
position 8 SUs on trunk and lower-limb segments; 2) flex-extend each knee to estimate its mean
flexion-extension rotation axis; 3) measure the SUs‟ orientation with the subject in the upright
anatomical posture [1]. Ten TA (45±10 year-old, K2-K3 level) participated in the experiment
after signing an informed consent, together with 2 operators (O1, O2). O1 and O2 independently
applied Outwalk on each subject and acquired the amputee‟s gait kinematics while walking at
self-selected speed in the park of our Centre along a 30m straight path. Acquisitions by O1 and
O2 were 10 min apart. Gait cycles were segmented using the algorithm described in [2]. To
quantify the inter-operator reliability we computed, among others, the Standard Error of
Measurement (SEM) of the 36 parameters described in [3], based on an ANOVA with repeated
measures, as recommended in [4,5].
310

Results
For the interest of brevity, Table 1 reports SEM values for the 14 most significant parameters of
the 36 examined, both for the sound and prosthetic side. The SEMs reported both consider
random and systematic effects. The names used for the parameters are those reported in [3], to
which the reader is referred for a detailed description. Here suffices to say that: 1) H, K, A refer
to hip, knee and ankle; 2) parameters ending with 6 and 7 refer to the sagittal and frontal plane
range of motion (ROM); 3) ending with 2 refer to the maximum flexion/plantaflexion at loading
response; ending with 3 refer to the maximum extension/dorsiflexion in stance phase; ending
with 5 refer to the maximum flexion/dorsiflexion in swing.
Discussion
Results appear consistent with reports on other populations [5,6]. In particular, the sagittal ROMs
(H-K-A6) have a SEM<1.9°. Regarding the hip, H7 (useful for the analysis of hip circumduction
deviations) appear particularly reliable with a worst-case SEM of 1.3°. Regarding the knee, K2
and K3 (SEM< 2°) appear reliable to draw conclusions on a flexed-knee gait, and K5 about the
lack of foot clearance related to insufficient knee flexion in swing. Regarding the ankle, results
for A2 and A3 (SEM< 1.8°) suggest the possibility of precise conclusions over vaulting
problems, and A5 for push-off problems. SEMs for the prosthetic ankle (<1°) suggest the
possibility of a detailed analysis of performance between different types of foot. Even though
partial, results suggest the applicability of Outwalk for the “out-of-the-lab” gait analysis of TA
amputees.
H3 H5 H6 H7 K2 K3 K5 K6 K7 A2 A3 A5 A6
Sound 2.8 2.7 0.7 1.3 1.9 2.0 2.0 1.9 2.9 1.7 1.8 2.5 1.4 Affected 2.1 2.8 1.7 1.0 1.6 0.7 1.9 1.4 3.4 0.9 0.8 0.9 0.5
Table 1 SEM values for important features of the kinematic patterns of hip, knee and ankle, as defined in [3]
References
[1] Cutti et al., Med Biol Eng Comput. 2009 Nov 13. [Epub ahead of print]
[2] Raggi et al Gait Posture, 2008 doi:10.1016/j.gaitpost.2007.12.051
[3] Benedetti et al Clin Biomech, 13(3) 204-215, 1998
[4] Weir JP, J Strength Cond Res, 19(1):231–240, 2005
[5] McGinley et al, Gait Posture, 29(3):360-369, 2009
[6] Fortin et al, Eur Spine J., 17(2):204-216, 2008
311

THE EFFECT OF TURNING GAIT ON CORONAL PLANE ANKLE MOMENTS IN TRANSTIBIAL AMPUTEES AND NON-AMPUTEES
Ava Segal, MS1, Michael Orendurff, MS5, Joseph Czerniecki, MD1,4, Glenn Klute, PhD1-3
1Dept. of Veterans Affairs, RR&D Center, Seattle, WA; Depts. of 2Mech. Eng., 3Electrical Eng., & 4Rehab Med., U. of WA, Seattle, WA, 5Texas Scottish Rite Hospital for Children, Dallas, Texas, USA.
INTRODUCTION Maintaining balance during walking involves control of frontal body motion that shifts the center of mass (COM) mediolaterally between the base of support [1]. Coronal plane ankle moments contribute to this mediolateral (ML) control by shifting the center of pressure (CoP) during stance toward the contralateral limb. Without active musculature at the ankle, amputees must rely on the mechanical properties of their prosthetic foot to maintain ML balance during prosthetic limb stance, which often results in a wider stride compared to non-amputees [2]. The ability to alter coronal plane ankle moments may become even more critical during more complex gait such as turning [3]; however, the effect of turning on coronal plane ankle moments has not been reported to date. The purpose of this study was to examine the differences in coronal plane ankle moments for unilateral transtibial amputees and non-amputees during straight-line walking and turning.
CLINICAL RELEVANCE Understanding coronal plane ankle moments during ambulation may help design prosthetic feet by identifying optimal stiffness properties that facilitate maneuvering while maintaining stability.
METHODS Six unilateral transtibial amputees (51 ± 13 yrs, 1.77 ± 0.08 m, 82.6 ± 8.1 kg) wearing their prescribed prosthesis and six non-amputees (49 ± 10 yrs, 1.76 ± 0.09 m, 85.4 ± 22.9 kg) gave informed consent to participate in this IRB-approved study. Subjects walked in a straight-line as well as clockwise and counter-clockwise along a 1-m radius circular path at their self-selected turning walking speed. Thirty-five 14 mm reflective markers were placed on each participant at locations consistent with Vicon’s Plug-in-Gait full-body model (Oxford Metrics, Oxford, England). Data were collected with a 12-camera Vicon MX System (Centennial, CO) and two embedded force plates (Bertec, Columbus, OH) and moments were calculated using inverse dynamics from the Plug-in-Gait model. Peak internal eversion (positive by convention) and inversion (negative) ankle moments were extracted using Event Analyzer (Vaquita Software, Zaragoza, Spain) and then averaged across 3 repeated trials for each limb type (non-amputee, amputee prosthetic, amputee intact), separating by walking conditions (straight: ST; inside limb turning: IN; outside limb turning: OUT). Differences across limb conditions (non-amputee, prosthetic, intact) were determined for each walking condition (ST, IN, OUT) using linear mixed effects models with limb condition as the fixed effect and subject as the random effect. Statistical significance was set at p < 0.05.
312

RESULTSFor the outside limb, non-amputees and amputees demonstrated an increased eversion moment compared to ST (Figure 1A-C, solid curves). For the inside limb, both groups demonstrated an inversion peak moment (negative) compared to an eversion moment for ST (Figure 1A-C,dashed curves). The differences in peak coronal plane ankle moments for non-amputees versus amputees were not statistically significant for both straight-line and turning gait (Table 1).
Table 1: Peak coronal plane ankle moments (Nm/kg)Sample Means [±SD] Non-amputee Prosthetic Intact(1) ST Eversion Moment 0.079 [0.043] 0.11 [0.055] 0.11 [0.087] (2) OUT Eversion Moment 0.14 [0.047] 0.19 [0.077] 0.15 [0.087] (3) ST Inversion Moment -0.052 [0.027] -0.053 [0.067] -0.089 [0.082] (4) IN Inversion Moment -0.11 [0.041] -0.13 [0.054] -0.13 [0.067]
DISCUSSION Coronal plane ankle moments increased during turning compared to straight-line walking for both amputees and non-amputees. The prosthetic outside limb moment appeared slightly greater than non-amputees and the intact limb; however, this was not supported statistically perhaps due to the small sample size and high variability across subjects. Since these amputees were successful community ambulators, they may have learned to adapt to the increased moments; less experienced amputees may not be as successful at modulating these moments. Ultimately, coronal plane ankle moments may be used to determine optimal stiffness properties for prosthetic feet, which facilitate maneuvering while not hindering straight-line walking.
(B) Prosthetic Limb (C) Intact Limb (A)Non-amputee
Figure 1: Avg. coronal plane ankle moments (Nm/kg) across the gait cycle for straight-line (ST) and turning (IN, OUT) gait for (A) non-amputees, (B) amputee prosthetic and (C) amputee intact limbs.
REFERENCES [1] Lyon, IN (1997) Exp Brain Res. 115: 345-56. [2] Hof, AL., et al. (2007) Gait & Posture. 25: 250-8. [3] Orendurff, M., et al. (2006) Gait & Posture. 23: 106-11.
ACKNOWLEDGEMENTS This work was supported by the Department of Veterans Affairs, RR&D Service (A3611I).
313

Vertical ground reaction forces during the Sit-to-stand and Stand-to-sit activity in
transtibial amputees
Agrawal VRa,b, Gailey RSa,c, Gaunaurd IAa,c, Gailey RS III, Carriere DLa, O’Toole COa
a. Functional Outcomes Research and Evaluation Center, Miami Veterans Affairs Healthcare System, Miami, USA.
b. Department of Biomedical Engineering, University of Miami, Miami, Florida, USA.
c. Department of Physical Therapy, Miller School of Medicine, University of Miami, Miami, Florida, USA.
Introduction:
The sit-to-stand and stand-to-sit movements are perhaps the most demanding activities of
daily living performed by transtibial amputees (TTAs). The movements are repeated 43-61
times a day by TTAs as they are unable to avoid these maneuvers and remain active1. While
the biomechanics of gait on various surfaces is well understood, biomechanical investigations
of sit-stand and stand-sit activities in TTAs have not been reported in the scientific literature.
The purpose of this research was to characterize weight distribution symmetry between the
intact the prosthetic limb of TTAs during sit-stand and stand-sit activities.
Clinical Significance:
TTAs have a higher prevalence of degenerative joint diseases in the intact limb joints than
non-amputees2. Their tendency to load the intact limb more than the amputated limb during
everyday activities may be a contributing factor to the development of adverse secondary
conditions3.
Methods:
Twelve TTAs (mean age 49±10.5 years) and twelve non-amputee control subjects (mean age
52.4±8 years) performed 3 to 5 rising and sitting trials using chair arm-rest assistance.
Vertical ground reaction forces (GRF) from the chair and the feet were collected using a
Tekscan Matscan system. The two activities were divided into five events4,5
; Sit-to-Stand (1)
Pre-Ascent: Start of forward momentum generation. (2) Ascent Initiation: Onset of vertical
center of mass (CoM) acceleration (3) Seat-Off: Zero load on the seat. (4) Deceleration: Start
of vertical CoM deceleration. (5) Standing: Attainment of a stable standing posture. Stand-to-
sit4: (1) Descent Initiation: Start of vertical CoM descent (2) Deceleration: Onset of CoM
deceleration. (3) Seat-contact: Start of weight transfer from legs to the seat. (4) Stabilization:
Beginning of trunk and balance adjustment. (5) Sitting: Onset of quiet sitting. Symmetry of
weight distribution, expressed as a percentage, was calculated at each event using GRFs from
the chair and feet.
Results:
Table 1 shows the symmetry indices for TTAs and controls at the five events of sit-to-stand
and stand-to-sit activities. TTAs had an inconsistent weight distribution pattern with a
314

tendency to shift weight to the intact limb during the course of both activities. The highest
asymmetry was evident at the Seat-off (71.4%) and Seat-contact (68.6%) events. Control
subjects also did not have equal weight distribution between the two limbs and loaded the
dominant side more than the non-dominant side. The symmetry indices between the two
groups were significantly different for both the activities while the rise and sit times were not
significantly different.
Table 1: Symmetry indices (in percentages) for transtibial amputees and non-amputee controls
at the five sit-to-stand and stand-to-sit events.
Discussion:
The time period around the Seat-off event in rising and just before the Seat-contact event
during sitting can be considered as the most challenging phase of the respective activities. The
noticeable asymmetry at these events indicates the tendency of TTAs to rely on the intact limb
for successfully executing both the sit-to-stand and stand-to-sit movements. Overloading the
intact limb and foot during the course of the activities may contribute to the development of
adverse medical conditions. Some possible ways to address this asymmetry include task
specific training for the sit-stand activities, awareness training to promote equal weight
distribution between the limbs and choosing the appropriate prosthetic foot.
References:
1. Bussmann JB, et al. Daily Physical Activity and Heart Rate Response in People With a
Unilateral Traumatic Transtibial Amputation. Arch Phys Med Rehabil. 2008;89:430-4.
2. Norvell DC, et al. The prevalence of knee pain and symptomatic knee osteoarthritis among
veteran traumatic amputees and nonamputees. Arch Phys Med Rehabil. 2005 March;86(3):487-93
3. Gailey R, et al. Review of secondary physical conditions associated with lower-limb
amputation and long-term prosthesis use. J Rehabil Res Dev. 2008;45(1):15-30.
4. Kralj A, et al. Analysis of standing up and sitting down in humans: Definitions and normative
data presentation. J Biomech. 1990;23(11):1123-38.
5. Schauer M, et al. A clinically applicable system for analysis of standing up using measurements
of floor reaction forces. Biomed Technik. 1993;38(5):105-10.
SIT-TO-STAND
STAND-TO-SIT
Events Symmetry Index,
mean(SD) Events Symmetry Index,
mean(SD) TTAs Controls TTAs Controls
Pre-Ascent 97.8% (3.7) 91% (2.6) Descent
Initiation
98% (13) 94.9% (7.4)
Ascent
Initiation
97.9% (6) 91.7% (2.6) Deceleration 83.2% (12) 95.6% (8.9)
Seat-Off 71.4% (17) 94.4% (6) Seat-Contact 68.6% (17) 93.7% (6.8)
Deceleration 71.9% (19) 91.3% (7.9) Stabilization 95.7% (5.3) 90.1% (2.5)
Standing 101% (11) 94.3% (5.9) Sitting 96.3% (3.7) 91.2% (2.9)
315

GAIT KINEMATIC AND KINETIC CHARACTERISTICS IN PATIENTS WITH PATELLOFEMORAL PAIN SYNDROME SIX MONTHS AFTER REOPERATION FOLLOWING TOTAL KNEE ARTHROPLASTY
Helena Gapeyeva1,2, Jaan Ereline1,2, Tiit Haviko3, Herje Aibast1,2,Aare Märtson3, Mati Pääsuke1,2
1Institute of Exercise Biology and Physiotherapy, 2Estonian Centre of Behavioural and Health Sciences and 3Department of Traumatology and
Orthopaedics, University of Tartu, Tartu, Estonia
Introduction Patellofemoral complications following total knee arthroplasty (TKA) continue to be a significant source of postoperative morbidity and revision surgery. Possible complications include patellofemoral instability, extensor mechanism impairment, soft tissue impingement, prosthetic wear or loosening, and osteonecrosis [1]. Cooney et al [2] retrospectively reviewed 361 patients who had a revision total knee arthroplasty done for an extensor mechanism problem to assess the prevalence, etiology, and risk factors of subsequent reoperation. The prevalence of reoperation was 23% because 84 patients were reoperated one or more times. The average time until the first reoperation was 2.4 years. The cumulative risk of a reoperation for any reason was 7% 1 year, 19.6% 5 years, and 35.9% 10 years after index revision. Authors found that the most common reason for reoperation was a new or recurrent patellofemoral problem, which accounted for 33% of the first reoperations. By data of Sierra et al [3] the average time from index revision total knee arthroplasty to the first reoperation was 3.5 years (range, 1 day-19 years) and the cumulative risks of first reoperation at 5, 10, and 15 years were 16.1%, 26%, and 31.4%, respectively.The level of ROM limitation and joint contracture localisation define the functional limitations of a patient [4,5]. It has been suggested that an imbalance between the vastus medialis and vastus lateralis forces causes abnormal tracking of patella, resulting in reduced contact areas, increased stresses, and patellofemoral pain [6]. Few studies were dedicated to the following outcome measures for patellofemoral pain syndrome (PFPS) patients using gait analysis. The aim of our study was to investigate the changes of gait kinematic and kinetic characteristics in patients with PFPS six months after reoperation following total knee arthroplasty.
Methods Eight patients (4 men and 4 women, mean age 66 year, range 56-77; BMI 31.9 kg/m2, range 26-39) with PFPS following unilateral TKA participatedin the study before and six months after reoperation (patellar prosthesis). Mean period between TKA and reoperation was 19.8 months (range 5-39). Gait kinematic and kinetic characteristics of involved (IL) and uninvolved leg (UL) were recorded using the ELITE motion analyzer and six infrared cameras with a sampling rate of 100 Hz (BTS SpA, Italy) and two force platforms with dimensions of 60 x 40 cm (Kistler 9268A, Switzerland) with a sampling rate of 500 Hz. Twenty passive reflecting markers were attached to the selected points of body according to the Davis protocol. Three to five trials were recorded by software Elite Clinic (BTS SpA, Italy) and the best trial was taken for analysis. Student’s paired t-test was used to find differences of data before and after reoperation. A level of p<0.05 was selected to indicate statistical significance.
316

Results and discussion Six months after reoperation a significant increase ofswing time from 376.5 to 474.4 ms (SwTi, p=0.008), swing time as per cent of stride (SwTi [%S], p=0.023) and stride length (SLi, p=0.053) was noted for IL in PFPS patients as compared to pre-surgery (Fig. 1). Postoperatively patients demonstrated a decrease of stance time from 66.6 to 61.1 ms (StTi [%S], p=0.023) and cadence from 108.5 to 99.8 step/min (p=0.031) and an increase of hip joint maximal extension for IL (p=0.048) as compared to before surgery. No significant difference (p>0.05) in other temporal and distance as well as in kinematic and kinetic characteristics of hip, knee and ankle joints as compared pre- and post-surgery was found.
SwTi
StTi [%S]
SwTi [%S]
Cadence
SLi
-10-505
10152025
Diff
eren
ce [%
]
Gait characteristics
Figure 1. Significant difference (p<0.05) in per cents of gait characteristics in PFPS patients six months after reoperation following TKA. Data before reoperation was taken as 100%.
Patients in our study had lower gait speed (0.96 pre and 0.97 m/s post surgery) and cadence as compared to the data of Besier et al [6] who found that PFPS subjects walked and ran with similar speed, stride length, and cadence to the control groups of males and females. Quadriceps muscle strength decrease in patients with orthopaedic problems evokes changes in body balance and gait [4]. It was found that compared to controls, the PFPS group had greater cocontrac-tion of quadriceps and hamstrings during walking, even though the net knee moment was similar between groups [6]. Our study suggests the improvement of most gait distance and temporal but not of kinetics and kinematics characteris-tics of gait in PFPS patients six months after reoperation following TKA.
References[1] Parker DA, Dunbar MJ, Rorabeck CH. (2003) J Am Acad Orthop Surg 11:238-47 [2] Cooney WP et al (2005) Clin Orthop Relat Res 440:117-21 [3] Sierra et al (2004) Clin Orthop Relat Res 425:200-6 [4] Mollinger, Steffen (1993) Phys Ther 73:437-46 [5] Fergusson et al (2007) Clin Orthop Relat Res 456:22-9 [6] Besier et al (2009) J Biomech 42:898-905
Acknowledgements This study was supported by Estonian Ministry of Education and Research project No SF0180030s07 and Estonian Science Foundation project No 7939.
317

A spot check for estimating inertial and magnetic sensors errors
A. Cereatti
(1), P. Picerno
(2), A. Cappozzo
(2)
(1) Dept. of Biomedical Sciences, University of Sassari, Sassari, Italy. (2) Dept. of Human Movement and Sport Sciences, University of Rome "Foro
Italico", Rome, Italy
Introduction
Prior to using any instrumental device, it is good practice to
quantify the errors associated to the relevant measures. Different
protocols for evaluating the performance of the instrumentation
typically employed in a movement analysis laboratory (i.e. stereo-
photogrammetric systems, force plates), have been so far proposed
[1]. Conversely, despite the recent widespread use of wearable
Magnetic Field Angular Rate and Gravity (MARG) sensors, studies on
their consistency in determining their orientation with respect to the
Global Frame (GF) are limited [2]. The aim of this study is to present
a method for evaluating the performance of MARG sensors in static
condition by verifying if a set of MARG sensors sense a common GF
(inter-sensor consistency) and whether a MARG sensor senses a
stationary GF while varying its orientation in space (sensor’s self-
consistency).
Clinical significance
An increasing number of clinical studies use inertial sensors for
motor capacity and performance assessment. This introduction in the
clinical practice of protocols for assessing the reliability of the
relevant measures would enhance the robustness of clinical findings.
Methods
The hypotheses on which the two experimental tests are based are
that, in absence of instrumental errors, a) the orientations of a set of
MARG sensors, identically aligned, is the same independently from
their orientation, and b) changing the sensor orientation, the GF
defined by the MARG sensor does not vary.
Inter- sensors consistency test (IC) - sensors were fixed on a
Plexiglas plank, equally spaced and accurately aligned to each other.
Orientation data were collected by orienting the plank in 12 different
poses, separated by at least 90° from each other. The angular deviation
of each sensor from the mean orientation was computed.
Self-sensor’s consistency (SC) test� - each sensor was aligned and
fixed on a Plexiglas prism. A rig composed of two orthogonal
Plexiglas planes allowed to rotate the sensor case by steps of 90°
about each of the three axes of its case. Differences between the
318

known imposed rotation and the rotation estimated by the sensor was
computed and used to assess the inaccuracy in the GF identification.
Both tests were performed on a set of nine sensors (s1,..,s9) (MTx,
Xsens).� The orientation of the sensors relative to the GF was
expressed in terms of the orientation quaternion q and its angular
components (α, β,γ) with respect to the GF axes were derived.
RESULTS
The IC test
showed that the set
of MARG sensors
employed in the
experiments, despite
the physical
alignment, defined
their orientation
differently. The angular
difference among
sensors was not
constant but varied according to their orientation in space (Fig. 1). The
IC test identified s8 as the sensor least consistent in determining its
orientation relative to the other sensors (αmax = 3.4°, βmax = 3.6°, γmax =
5.7°). The SC test showed average errors for s8 that were, over the 12
rotations, equal to 2.3° for α, 1.1°� for β, and 3.5° for γ. The most
accurate sensor was s3 (α = 0.5°, β = 0.4°, γ = 1.2°).
DISCUSSION
The exposure of MARG sensors to shocks or strong magnetic
sources, may cause an alteration of the calibration parameters and, in
turn, may affect sensor performance in defining the orientation with
respect to a common GF. A practical spotcheck has been proposed to
assess the errors that may be expected when estimating angular
kinematics using MARG sensors. The IC test allowed the
identification of the sensors that were least consistent with the
ensemble of sensors employed for the measurements. Conversely, the
SC test allowed the verification of whether the sensors, which have
been identified as less consistent by the IC test, were also the least
accurate in determining their orientation. The proposed spotcheck
provides information which may suggest either to recalibrate or to
exclude the less reliable sensors from the data collection.
REFERENCES
[1] Piazza SJ et al, 2007. Proc. 12th Annual GCMAS.
[2] Brodie MA et al, Computer Methods in Biomechanics and
Biomedical Engineering, 2008;11(6):641-8.
������� Maximum angular deviations from the mean
orientation and corresponding sensor numbers for the
nine MARG sensors and the 12 different poses of the
319

Markerless motion tracking for assessment of robot assistedgait rehabilitation
Jochen Radmer1, Sami Hussein1, Jörg Krüger1,2
1 Rehabilitation Robotics Group (IPK/TU Berlin), Faculty of Mechanical Engineering,
Technical University of Berlin, 10587 Berlin, Germany2 Rehabilitation Robotics Group (IPK/TU Berlin), Automation Technology Division,
Fraunhofer Institute IPK, 10587 Berlin, Germany
1 IntroductionThe use of robotic devices in gait rehabilitation has pro-
Figure 1: Rehabilitation robot Hap-ticWalker with optical system
ven beneficial in the rehabilitation of stroke patients in se-
veral clinical studies [1]. Furthermore the use of these de-
vices also provides huge potential in the field of rehabili-
tation assessment and gait analysis. Various types of inte-
grated sensors provide valuable data for gait and treatment
analysis. Inherently end-effector based robotic gait devices
enable the measurement of ground reaction forces via in-
tegrated force/torque sensors imposing defined constraints
and guidance on foot motion while leaving the remaining
parts of the body unrestricted. Therefore, these devices are
an ideal platform for the integration of camera based motion
tracking systems which provide information on e.g. knee,
hip and torso motion. This work is focused on the benefits drawn from a markerless human
motion tracking system for use with end-effector based robots in rehabilitation which is based
on a single 3D range imaging camera.
2 Clinical SignificanceGait analysis data can provide very useful information for rehabilitation therapy assessment and
planning and allow for quantitative methods to assess the progress and success of the treatment.
However, collecting motion tracking data (MT) is not applicable in clinical practice of reha-
biliation treatment with conventional markerbased systems especially with quickly exhaustive
patients after stroke. The presented approach using end-effector based robot assisted therapy
allows for the acquisition of MT data over the complete training period and along all spatial
degrees of freedom based on single 3D range cameras which can easily integrated in clinical
environment. The aquired MT data allows the evaluation of the effects of robot-assisted rehabi-
lition training on gait patterns as well a investigation on the effects.
3 MethodsThe device presented is used with the robotic walking simulator HapticWalker(see fig. 1). The
feet are tightly fixed on two footplates. Currently, data has been collected and analyzed in a so
called position controlled mode. Here the device imposes desired walking movements on the
feet and the resulting body movements are captured with the aforementioned 3D range camera
working at 30 f ps. The presented MT data was aquired form a healthy subject was recorded
at different walking speeds using a ’floor walking’ training pattern. The performance of the
320

MT capture system was evaluated by using normal gait pattern data as reference. Currently,
reference data is taken from literature [2]. Further reference data from impaired subjects is
under preparation. For that purpose, a motion analysis system (VICON) with 8 cameras will be
used (see. figure 1) and an impaired subject. For evaluation knee flexion and pelvic obliquity
trajectories were compared to reference data using distance metrics.
4 ResultsCompared to reference data [2] the pelvic obliquity measured by the novel markerless motion
tracking system showed no significant differences (see figure 2, left). The parameters of knee
flexion show symmetric behaviour. The second flexion wave at toe off resembles the one seen in
reference data, whereas little stance phase knee flexion is observed. The pelvic obliquity shown
in figure 2 on the right corresponds to the reference data from [2].
0 2 4 6 8 10 12−6
−4
−2
0
2
4
6
8pelvic obliquity
time in seconds
angl
e in
°
hip rotation
0 2 4 6 8 10 12−20
−10
0
10
20
30
40
50
60knee flexion
time in seconds
angl
e in
°
left kneeright knee
Figure 2: pelvic obliquity (left) and flexion angle of subject’s left and right knee (right) captured with the
markerless motion capture system.
5 DiscussionThe goal of this work was to find out if the developed motion capturing system is capable to
track gait kinematics on the HapticWalker. The system yielded data similar to the literature’s
reference data. The deformation of knee flexion trajectory needs to be further inverstigated. This
is expected to result at least partly from a general difference due to the guidance of the device.
Especially, this counts for the influences of the robot treatment on subject’gait, e. g. whether the
stiff guidance of the feet leads to a distortion of subject’s floor walking characteristics. Further,
an offset resulting from camera perspective shows in the knee flexion trajtory and needs to be
compensated.
References[1] J. Mehrholz, C. Werner, J. Kugler, and M. Pohl. Electromechanical-assisted training for walking
after stroke. Cochrane Database of Systematic Reviews, 4, 2007.
[2] Jessica Rose and James G. Gamble. Human Walking. Williams &Wilkins, 1993.
321

Assessing a mechanics-based approach to the treatment of crouch gait Jennifer L. Hicksa, Michael H. Schwartzb, and Scott L. Delpa
aStanford University, bGillette Children’s Specialty Healthcare
Introduction: A host of factors may contribute to the excessive knee flexion characteristic of crouch gait. Arnold and colleagues1 used a musculoskeletal model to show that subjects with short or slow hamstrings that became longer or faster after surgery tend to have reduced knee flexion. Musculoskeletal models have also demonstrated that a torsional deformity of the tibia substantially reduces the capacity of several major leg muscles to extend the knee joint2. Weakness of the extensor muscles may also contribute to crouch gait. Biomechanical analyses have revealed that muscles including the vasti, the gluteal muscles, and soleus all make substantial contributions to limb extension in both normal and crouch gait3. While these studies provide potentially valuable guidelines for treatment, it is unknown if correcting the individual mechanical factors that cause a patient to walk with crouch gait leads to a more erect walking posture. In the present study, we used a large database of subjects to create a multi-variable linear regression model to test the hypothesis that subjects with crouch gait show improved knee kinematics on a follow-up gait analysis when they have 1) adequate hamstrings lengths and velocities during gait, 2) normal tibial alignment, and 3) sufficient extensor muscle strength.
Clinical Significance: This retrospective analysis of a large and heterogeneous group of subjects is an important first step towards validating a treatment approach that is based on correcting each of the mechanical contributors to an individual subject’s excessive knee flexion.
Methods: Subjects were treated at Gillette Children’s Specialty Healthcare after 1997. Subjects qualified for inclusion if they received two consecutive gait analyses between 6 and 36 months apart and walked in crouch1 on their initial gait visit. We excluded subjects who had received a selective dorsal rhizotomy between gait visits, lower extremity surgery less than 12 months prior to the first gait visit, or botulinum toxin less than 6 months prior to the initial gait visit. These criteria yielded 237 subjects with a variety of surgeries or no treatment between gait visits.
We developed a regression model to predict a subject’s change in knee kinematics using a linear combination of predictive variables. A subject’s percent improvement in mean stance knee flexion between the initial and final visit was the outcome measure in the regression. For example, a subject whose mean knee flexion changed from 40º on the first visit to 20º on the follow-up would have a 50% improvement. We examined three main predictive variables to test our study hypothesis. First, we created a binary variable, called GoodHams, that assessed whether subjects had adequate hamstrings lengths and velocities. The value of GoodHams was set to 1 if a subject’s hamstrings were i) neither short nor slow on the first gait visit (using a 2.5 SD threshold) or ii) were initially short or slow and the subject received a hamstrings lengthening surgery. The value of GoodHams was set to 0 if the subject had short or slow hamstrings and did not receive surgery. The variable GoodTibia, which assessed subjects’ tibial alignment was set to 1 if i) a subject had normal tibial alignment (thigh-foot angle between -10 and 15°) on the first visit or ii) the subject had poor tibial alignment and received a tibial derotation osteotomy. The value of GoodTibia was set to 0 if the subject had poor tibial alignment, based on their thigh foot angle, and did not receive an osteotomy. Subjects with any combination of surgery or no surgery were included in our analysis; thus, we had a broad range of subjects with good and poor hamstrings function and tibial alignment. Our third variable of interest was knee extensor strength as measured in the clinical exam (scaled from 1 to 5). We
322

tested for interactions between the three predictive variables of interest, and also controlled for the severity of the subjects’ gait impairment, whether they received a patellar advancement, and the total number of other surgeries received between gait analyses.
-100
0
Results: The linear regression model revealed a significant relationship (p <0.01) between the predictive variables and percent improvement in mean stance knee flexion (Fig. 1), as determined with an F-test of the overall fit and Student’s t-tests to assess each of the predictive variables.
100
Pred
icte
d Pe
rcen
t Im
prov
emen
t
-100 0 100Actual Percent Improvement
Predicted vs. Actual Improvement in Knee Flexion
Fig. 1. Subject’s actual improvement in mean stance knee flexion vs. the improvement predicted by the linear regression
The coefficients for each of the variables in the linear regression model revealed the expected influence of that variable on the percent improvement in mean stance knee flexion. For example, the coefficient for the variable GoodHams was 55.7. This indicates that subjects with adequate hamstrings lengths and velocities on the first visit or whose short or slow hamstrings were corrected with surgery would be expected to have 56% larger improvement in knee flexion than subjects with “BadHams”, when holding the other variables in the model constant. Similarly, having good tibial alignment leads to a 54% larger expected improvement. For both of these coefficients, the standard error was approximately 13%. Knee extensor strength on the first visit was also associated with improvement, with a coefficient of 7.3 (Std. Err. = 2.7). Thus with a one point higher strength score, the model predicts that percent improvement in knee flexion increases by 7%. We also found an interaction effect between GoodHams and GoodTibia. When subjects had good hamstrings function and good tibial alignment the amount of expected improvement is 58% larger than subjects with poor hamstrings function and tibial alignment (Std. Err. = 12).
R2 = 0.27 F(7,229) = 14.97
In addition to the three predictive variables of interest, we controlled for several other variables. We found that subjects who received a patellar advancement were expected to have a 31% larger improvement in mean stance knee flexion than those who did not (Std. Err. = 9). We found a slightly greater amount of improvement when the number of other surgeries received was larger. Many subjects received femoral derotation osteotomies and foot stabilization surgeries, for example, which may also influence knee motion.
Discussion: Analysis of a diverse set of subjects with crouch gait demonstrated that correcting the mechanical causes of a subject’s excessive knee flexion, when present, is associated with improvement in crouch. We did not find perfect agreement between the predicted improvement in knee flexion and the actual change in a subject’s knee flexion (Fig. 1). This variability is expected, however, given that non-mechanical factors, such as motor control and patient motivation, were not taken into account. Given these possible confounding factors, we also caution against a strict interpretation of the coefficients in the model until these results are validated with a larger subject pool from multiple clinical centers. Nonetheless, we are confident in the trends we observed and believe this study is a powerful first step towards validating the use of biomechanical principles to guide the treatment of subjects with crouch gait.
References: 1Arnold, et al. Journal of Biomechanics, vol 39, pp 1498-1506, 2006. 2Hicks, et al. Gait Posture, v26, pp546-552, 2007. 3Kimmel and Schwartz. Gait Posture, v23, pp 211-221, 2006.
323

Determinants of Slip-Related Balance Recoveries – A Gait Simulation Approach
Arash Mahboobin1, Rakié Cham1, Stephen J. Piazza2 1University of Pittsburgh, Pittsburgh, PA, USA
2Pennsylvania State University, University Park, PA, USA Introduction Injuries due to slips and falls are a serious problem in older adults and research that elucidates postural control mechanisms is needed if fall-related injuries are to be reduced. It is important to understand the impact of initial conditions and post-slip responses on falling risk and how aging affects this relationship. This knowledge will provide a biomechanical rationale as to why one individual slips and recovers while another slips and falls in the same environment. Such information is also important for the development of falls-related intervention programs in the workplace [1]. This knowledge cannot be acquired through experiments alone. Whole-body simulations of slipping are needed to meet these research needs and this study develops such investigative tool. Specifically, the purpose of this study is to determine the potential importance of controlling downward drop of the body and foot horizontal velocity in slip-related balance recoveries through forward dynamic simulations of walking. Clinical Significance The results of the simulations have significant potential to reduce the risk of slips and falls through an understanding of the physiological/biomechanical factors contributing to failed balance recoveries. For example, reducing the downward drop of the body may be related to the function of the vestibular system, while minimizing the foot slip velocity may be attributed to the role of the somatosensory system. By understanding the relative contribution of each system (vestibular / somatosensory) in balance recoveries from external perturbations such as slips, falls prevention programs can be more efficient in preventing falls by targeting specific systems believed to be most important in recovering balance. Methods Normal walking kinematics and bilateral ground reaction forces were collected from healthy subjects at the University of Pittsburgh. Following the normal walking, a glycerol solution was applied onto the force plate without the subject’s knowledge to generate an unexpected slip at heel contact of the left foot (leading leg). A planar musculoskeletal model incorporating foot-floor interaction (Figure 1) was created and used to derive moment-driven forward-dynamic simulations. A parameter optimization was performed in which the set of joint moments was found
Figure 1. Planar musculoskeletal model with foot-floor interaction.
324

that minimized (1) the sum of the squares of the differences between simulated and measured
joint rotations and ground reaction forces in the normal gait and (2) the sum of the squares of
the differences between simulated and measured joint rotations and the body’s downward
drop and leading leg foot horizontal velocity. Gait was simulated from the leading leg heel
contact (0 ms) to 190 and 250 ms after heel contact, for the normal and slip conditions,
respectively.
Results
The optimization of normal walking (no slip) resulted in joint moments that reproduced
salient features of the experimentally collected data, with overall root-mean-square errors
between the simulated and experimental joint rotations < 6º. The RMSE between the
simulated and measured shear and normal ground reaction forces were less than 25 N and 33
N, respectively. There was general agreement between the experimental and simulated slip
joint angle results, especially when minimizing body’s downward drop and foot horizontal
velocity. Particularly, in these simulations, due to a low shoe-floor friction coefficient,
tracking of experimentally obtained joint angles alone was not sufficient in generating a
successful slip recovery reaction. Rather, minimization of both the downward drop of the
trunk and the foot horizontal velocity helped in eliciting such behavior in the simulation.
Discussion
We introduced a method in which a simulation of normal and slippery gait was created to
determine the joint kinematics, ground reaction forces, and applied joint moments after heel
contact of the leading leg. Simultaneous tracking of joint angles and measured ground
reaction forces can be a difficult problem, but reasonable results were achieved in the present
study using a simplified planar model with spring-based foot-floor contact in our normal
walking simulations. The slip simulations suggest that in severe slips, pre-programmed
normal walking patterns (tracking joint angles alone) are not sufficient to prevent a balance
loss. Additionally, the results suggest that the monitoring of the pelvis drop and foot slip
velocity, i.e. both the vestibular and somatosensory systems, may be responsible for the
triggering of the postural reactions that we see experimentally). Future work on these
modeling methods will include adding tracking of body’s downward acceleration to more
accurately mimic contributions of the vestibular system.
References
[1] Redfern, M.S., Cham, R., Gielo-Perczak, K., Grönqvist, R., Hirvonen, M., Lanshammar,
H., Marpet, M.I., Pai, Y.C., 2001. Biomechanics of slips. Ergonomics 44, 1138-1166.
Acknowledgements
Funding provided by NIOSH (R01OH007592)
325

Muscle compensation strategies with plantarflexor and dorsiflexor activation impairment Brian A. Knarr1, Jill S. Higginson, PhD1
1Center for Biomedical Engineering Research, University of Delaware Introduction Impaired activation has been cited as a mechanism of post-stroke muscle weakness1. Additionally, altered activation patterns have been observed in post-stroke gait2. The extent of activation deficits can have a direct effect on a person’s ability to maintain a normal gait, and compensatory strategies must be employed by less impaired muscles. Several studies have explored the effects of muscle atrophy on gait pattern, and the body’s ability to compensate with other muscles to maintain a normal gait3,4. In a stroke population, there is a significant impairment of muscle activation. The compensation strategies employed by these patients may be different than those with muscle atrophy. Additionally, a combination of plantarflexor and dorsiflexor impairment will likely result in different compensation than impairment of a single muscle. The objective of this study is to identify available compensatory strategies by simulating activation deficits seen post-stroke. Clinical Interest Understanding compensation strategies for a post-stroke population is important for both identifying and treating patients. Effective rehabilitation protocols based on a subject’s impairments can be designed to take advantage of available compensation strategies. Methods A total of 10 simulations were analyzed in this study, built from kinematic and kinetic data of 10 healthy subjects. The data was collected on a instrumented split belt treadmill using an 8 camera motion capture system. All subjects read and signed an informed consent form approved by the Human Subjects Review Board at the
University of Delaware. The OpenSim software package was used for analysis in the study. A 23 degree of freedom model with 54 muscle actuators was used to generate 3D, forward dynamic simulations from motion capture walking trials. Using the Computed Muscle Control (CMC) algorithm, the muscle forces and activations required to reproduce normal gait kinematics were computed5. Constraints were set on the activation capacity of the dorsiflexor (10% max) and plantarflexor (20% max) muscle groups to simulate activation impairments. CMC was run again to re-optimize muscle control with the imposed muscle activation limitations. The new calculated set of muscle activations, forces, and resulting kinematics were analyzed to determine compensation strategies.
To quantify the changes in muscle activation, we calculated percent activation, or the total activation of a muscle over a period of time relative to full activation. This value was calculated over the full gait cycle and during the double support phase. A one-way ANOVA was run to compare the average activation percentage between the normal and impaired simulations for each muscle in the model. Results Nine muscles showed a significant change in percent activation between the normal and impaired model. As, expected, the plantarflexor and dorsiflexor muscles had a significant decrease in activation in the impaired model (p<.05). The remaining muscles show a significant increase in activation in the impared model (Figure 1). Similar results are seen during the double support phase of gait (Figure 2).
326

Figure 1. Activation Percentage over the full gait cycle for normal and impaired simulations. p<0.05 between simulations for all muscles.
Figure 2. Activation Percentage during double support phase of gait for normal and impaired simulations. p<0.05 between simulations for all muscles. The biceps femoris short head showed the largest change in percent activation over the full gait cycle (+11.6%) and during double support (+24.37%). Discussion A significant increase in the activation of the knee flexors and hip flexors was seen across the entire gait cycle when the plantar and dorsiflexors were impaired. As expected, this increase is pronounced during the during the double support phase of gait, where the effect of the plantarflexor impairment is more severe.
The muscle compensation patterns predicted in this model (increased hamstrings activation, earlier plantarflexor activation, smaller increase in quads with PF/DF deficiency) agree with EMG data for a subset of individuals with post-stroke gait (2). This model differs in that the hamstrings were able to completely compensate and maintain normal knee flexion. In the post-stroke population, the peak knee angle in swing phase was reduced by ~20 degrees, which is likely related to hamstrings strength. Inclusion of subject-specific parameters in the model would allow for better prediction of compensation strategies.
The increase in knee and hip flexor activations may be due to a distal to proximal limb compensation. At the knee, the hamstrings must activate more to compensate for the loss of the gastrocnemius contribution to knee flexion. Increased biceps femoris activity has also been reported in previous studies as a result of excluding the gastrocnemius and soleus of the stance limb (4). This increased hamstring activity will also cause an increase in hip extension. To counteract the added hip extension moment from the hamstrings, the hip flexors must also increase. The cost function used minimizes the sum of the squares of the muscle stress. This could have an impact on the compensation strategy selected by the simulation. The compensation strategies predicted by this model provides a basis for rehabilitation protocols in an impaired population. Use of more targeted protocols can improve the efficacy and outcome of treatment. Acknowledgements NIH R01-055383 References 1. Landau WM. Arch Neurol. 2002;59:1453-1457. 2. Knutsson E. Brain 1979; 102:405-430 3. Goldberg EJ. Gait and Posture 2007:360-367. 4. Jonkers I. Gait and Posture 2002:264-272 5. Thelen DG. J Biomech 2006; 39:1107-1115.
327

Comparison of two methods for estimating hip joint parameters during stair
ambulation
Samantha M. Reid1, Alison C. Novak
2, Patrick A. Costigan
1,2, and Brenda Brouwer
1,2
1. School of Kinesiology and Health Sciences, Queen’s University, Kingston, ON, Canada
2. School of Rehabilitation Science, Queen’s University, Kingston, ON, Canada
Introduction: A necessary and important component of gait analysis is estimating the
location of joint centres relative to the spatial coordinates of surface markers. With
inverse dynamic calculations, an inaccurate estimate of the hip joint centre (HJC) will
lead to errors in the calculation of the length of the lever arm and the distance to the
segment centre of mass resulting in miscalculations of moments and angles. Non-
invasive methods of estimating HJC include both anthropometric and functional methods,
with the functional method identified as the most objective method as it eliminates the
need for x-rays and palpation of bony landmarks reducing the sources of error that stem
from anthropometric measurement and marker locations [1]. While the accuracy and
precision of HJC methods have been assessed via hip joint models [2] and during gait
trials [3,4], to date no study has investigated the rigour of these methods on the
calculation of hip joint parameters in functionally demanding tasks. It needs to be
determined if validations during level ground walking can be generalized to more
challenging activities, such as stair ambulation in which ground reaction forces are
higher, joint excursions are greater, therefore errors in calculated moments and powers
could be unacceptably high. Therefore repeat validation of anthropometric and
functional models during stair negotiation is needed. Our objective was to evaluate
differences in hip joint parameter using, 1) an anthropometric model [5], and 2) a
functional model [1] during stair ambulation.
Clinical significance: Abnormalities in the mechanics of ambulation are often described
relative to published age-related normative data. In view of the variation in methods used
to calculate joint centres it is important to know how they compare to ensure the
appropriateness of contrasting findings across studies as a means of determining
treatment approach.
Methods: Twenty-eighty (13M) healthy older adults (66.4 + 8.3 yrs) were recorded while
they ascended and descended a custom 4-step staircase. Three-dimensional net hip joint
forces, moments, and angles were calculated by inverse dynamics using both methods of
HJC estimation. Differences in the peaks between the two methods were determined
using paired-tests while the average difference was computed between paired averaged
curves.
Results: Results showed differences in the peak moments, forces, and angles in both the
sagittal and frontal planes during both stair conditions as a function of how the HJC was
estimated. Examination of the curves for both stair conditions supported the above
observation and the mean difference curves clearly illustrated the nature of the
discrepancies. It is also important to note that while the direction of the differences was
the same for both ascent and descent, in some cases there was a systematic bias reflected
by a uniform difference throughout the cycle, whereas in others the magnitude of the
differences varied throughout the gait cycle.
Discussion: This study indicated that discrepancies do occur when applying different
HJC models in functionally demanding gait tasks, with the difference between the two
models most apparent in the moment curves. While both methods yielded similar curve
328

profiles, there were differences in magnitudes between the two methods such that the
anthropometric method either underestimated or overestimated the magnitude of the
forces, moments, and angles in both planes compared to the functional model (‘gold
standard’). Discrepancies reported in the literature may be partly accounted for by the
method of estimating the HJC applied in each investigation. The findings of this study
provide insight into the ongoing debate of HJC estimation and calculation of joint
parameters in an effort to understand effects of the application of various techniques on
gait analysis and suggest the need for accurate reporting of the HJC model used in
studies.
References: 1. Schwartz, MH., Rozumalski, A., 2005. A new method for estimating joint parameters from motion data. Journal of
Biomechanics 28,107-116. 2. Piazza, SJ., Okita N., Cavanagh, PR., 2001. Accuracy of the functional method of hip joint centre location: effects of
limited motion and varied implementation. Journal of Biomechanics 34, 967-973.
3. Stgani, R., Leardini, A., Cappozzo, A., Benedetti, MG., Cappello, A., 2000. Effects of hip joint centre mislocation on gait analysis results. Journal of Biomechanics 33, 1479-1487.
4. Holden, JP., Stanhope, SJ., 1998. The effect of variation in knee centre location estimates on net knee joint moments. Gait
& Posture 7, 1-6. 5. Hamill, J., Selbie, WS., 2004. Three- dimensional kinetics. In: Robertson, DGE., Caldwell, GE., Hamill, J., Kamen, G.,
Whittlesey, SN.Research Methods in Biomechanics. Human Kinetics, Champaign, IL., P103-159.
Figure 1. Ensemble average angle, moment, and force curve profiles in the sagittal plane during
stair ascent obtained with the functional (solid) and anthropometric (dashed) models of estimation
of hip joint centre. The average deviation curve (dotted) of the difference between each method is
also represented graphically.
329

SUBJECT-SPECIFIC CHARATERISATION OF LOWER LIMB ANATOMY FOR GAIT SIMULATION AND MODELLING
Katja Oberhofer, Kumar Mithraratne, Susan Stott, Iain A Anderson Auckland Bioengineering Institute, University of Auckland, Auckland, New Zealand
Introduction One of the remaining challenges in clinical gait analysis is the accurate representation of the musculoskeletal system of individual subjects. Musculoskeletal models have generally been developed from cadaveric measurements on adult men specimen. However, previous work has demonstrated that generic or crudely scaled models can lead to false conclusions when applied to subject-specific data from gait analysis [1], [2]. Bone deformities in distal segments have been related to altered joint kinematics in proximal joints [3]; and changes in the geometry of one muscle may affect its force generating capability, its path, the paths of neighbouring muscles and thus the dynamics of the entire multi-body system. The aim of the present study is to introduce modelling techniques which enable the in-vivo characterisation of lower limb anatomy for use in gait simulations and their application to one subject.
Clinical Significance The relationship between altered lower limb anatomy, pathological gait and the development of fixed deformities in children with Cerebral Palsy (CP) has remained unclear because of limitations in accurately modelling the musculoskeletal system of individual subjects. As a consequence, the management of the musculoskeletal impairments in children with CP has remained challenging, and the outcome of orthopaedic surgeries has been variable [4].
MethodThe subject-specific lower limb model, introduced in [5], served as reference model to derive bony landmark positions, proximal femur geometry, muscle-tendon lengths, muscle volumes, attachment sites and moment arms. The model was developed from MRI data of one female subject (age 29 y, height 165 cm, weight 63 kg) using the software CMISS (www.cmiss.org) and fitting techniques previously outlined in detail [6] (Fig. 1a). Anatomical landmark positions were derived from the subject-specific model, allowing the definition of anatomical coordinate systems for all lower limb bones. The 3D neck-shaft angle, anteversion angle and neck length of femur were calculated from the epi-condylar axis, the neck axis and the shaft axis of the femoral mesh [3] (Fig. 1b). Muscle-tendon lengths and muscle volumes were derived as previously proposed [7]. Muscle attachment sites were defined as external faces of the bone meshes (Fig. 1c). The centre point of each muscle attachment site was further specified as reference point. Muscle moment arms were defined as distances between joint centres and their projection points onto the muscle meshes (Fig. 1d).
ResultsThe anatomical properties of the muscles and bones in the right lower limb of one female subject were characterised using the proposed modelling techniques. A total of 25 muscles were included in the analysis. The positions of bony landmarks and muscle attachment sites were expressed with respect to the anatomical coordinate system of pelvis. Muscle attachment sites were further recorded with respect to the corresponding bone meshes to facilitate the future coupling of muscle forces from dynamic gait simulations with the subject-specific finite element model.
330

Figure 1: (a) Subject-specific model from MRI; (b) femoral geometry; (c) muscle attachment sites around the hip; (d) moment arm of iliacus with respect to the hip joint centre.
DiscussionThe outcome of the present study demonstrates that advancements in subject-specific modelling are making the in-vivo assessment of anatomical parameters in the entire lower limbs feasible. The resulting dataset of one subject is currently used for analysing the effect of subject-specific muscle architecture on muscle dynamics during walking. We are further planning to derive anatomical properties in the lower limbs of children with and without CP based on the data described in [7]. More work is needed to reduce time requirements for model development and allow the application of the proposed techniques to a larger group of subjects. The Host Mesh Fitting technique in combination with a skin-based mesh may thereby enable the customisation of the present lower limb model to subject-specific dimensions in an efficient manner based on a few anatomical landmarks [5], [6]. We anticipate that the large-scale application of subject-specific musculoskeletal models to clinical gait analysis will provide significant new insights into the relationship between lower limb anatomy, gait dynamics and skeletal loading, and thus, assist clinicians in the assessment and management of the musculoskeletal impairments in children with CP.
Acknowledgement Funding for this study was provided by the New Zealand Foundation for Research, Science and Technology.
References [1] Arnold, A. S. et al. (2001), Annals of Biomedical Engineering, 29, 263 – 274[2] Scheys, L. et al. (2008), Gait and Posture, 28, 358 – 365 [3] Carriero, A. et al. (2009), Journal of Pediatric Orthopaedics, 29(1), 73 – 79[4] Stott, N. S. et al. (2004), Developmental Medicine and Child Neurology, 46, 628 – 645[5] Oberhofer, K. et al. (2009), The Visual Computer, 25(9), 843 – 851[6] Fernandez, J. et al. (2004), Biomechanics and Modeling in Mechanobiology, 2, 139 - 155 [7] Oberhofer, K. et al. (2010), Clinical Biomechanics, 25, 88 – 94
331

Adolescents with Idiopathic Scoliosis Spinal Range of Motion Pre and Post- Spinal
Fusion Compared to Age-Matched Controls
Introduction: Instrumentation and fusion in subjects with adolescent idiopathic scoliosis
(AIS) may alter spinal range of motion. Additionally, the number of instrumented
lumbar segments may impact the magnitude of change. This study quantifies the changes
in spinal range of motion (ROM) pre and post-operatively and statistically compares
them to each other as well as to age-group matched control subjects. This data may be
useful to the debate involving levels of spinal instrumentation and loss of ROM in AIS.
Methods: This is a prospective study of 26 patients with AIS (18 F, 8M, mean age 14.5
± 2.2y; Cobb angle > 50º) who underwent spinal instrumentation and fusion. 16 subjects
returned for a post operative assessment. Trunk ROM was assessed with a 3-
Dimensional Motion Capture system (VICON; Oxford, UK). While standing the subjects
were instructed to move their trunk maximally in all three planes (transverse, coronal and
sagittal). The max values were statistically compared within the Scoliosis Group (left side
to right side) to check for asymmetry and to a “Control Group” of age matched typically
developing adolescents with significance set at p<0.05. Further analysis was done to
compare those subjects in the Scoliosis Post-Op Group that had the fusion at L2 or above
(L2+) to those that had a fusion at L3 or below (L3-).
Results: Within the Scoliosis Pre-Op Group there was significantly greater rotation and
side-bending to the left versus the right. When compared to the Control Group the
Scoliosis Group had significantly less trunk rotation and side-bending to the right along
with less forward bending flexibility (Table 1). Post operatively the Scoliosis Group lost
greater than 46% ROM in the transverse plane, greater than 44% ROM in the coronal
plane, 50% ROM bending forward and 15% bending back.
Conclusion: Adolescents with idiopathic scoliosis demonstrate trunk ROM asymmetry
with limited motion in all three planes of motion compared to Controls. One year
following spinal fusion significant losses in ROM are present in all planes of motion with
even greater loss of ROM found in the group fused at L3 or below.
Significance: These limitations may affect the AIS group’s functional ability. These
results could provide a baseline comparison for spinal motion prior to surgical
instrumentation and fusion and also provide realistic expectations for spinal flexibility.
Table 1. Spinal Range of Motion During Standing Bending (degrees)
Transverse Plane Coronal Plane Sagittal Plane
Left Right Left Right Forward Back
Scoliosis Pre (n=26) 25.8ª 21.8b 42.1ª 36.7
b 43.2
b 49.5
Scoliosis Post (n=16) 13.9c 11.0
c 19.3
c 20.4
c 21.5
c 41.8
c
332

Control Group 28.3 29.8 39.5 41.4 61.6 48.5
Scoliosis Post L2+ (n=5) 12.9 12.2 26.7 23.8 29.9 43.6
Scoliosis Post L3- (n=11) 14.3 10.6 15.9d 19.6
d 17.6
d 40.9
ªSignificantly different within Scoliosis Group (left vs. right) using Student T-Test. bSignificantly different than Control Group using Student T-Test.
cSignificantly different between Scoliosis Pre and Scoliosis Post using Student T-Test.
dSignificantly different between L2+ and L3- fusion levels using Student T-Test.
333

Midterm Functional Assessment of the Sit-Stand-Sit Task Following a Total or Resurfacing Hip Arthroplasty
1Bhowmik-Stoker, M.; 1 Onstot, B.R.; 2 Buneo, C.; 1,3 Shrader, M.W.; 4 Jacofsky, M.C. 1 Banner Health – Sun Health Research Institute SHRI-CORE Orthopedic Research Labs, Sun
City West, AZ; 2 Arizona State University, Tempe, AZ; 3 Phoenix Children’s Hospital, Phoenix, AZ; 4 The Core Institute, Sun City West, AZ
Introduction The Sit-Stand-Sit (SSS) task has been shown to be one of the most mechanically strenuous lower extremity tasks (Riley et al. 1991). The inability to independently transfer in and out of a chair is a distinct sign of disability. Individuals with hip pain, instability, and muscle weakness caused by degenerative disease have trouble with SSS tasks. Total hip arthroplasty (THA) is considered a standard treatment of care for advance hip degeneration. Recently resurfacing hip arthroplasty (RHA) devices have been developed for younger patients who require greater ranges of motion (ROM) during activities of daily living (ADL). SSS activities have not been biomechanically assessed in HA populations even though it is the most common ADL. This study describes the differences in the recovery of hip function during the SSS task after a THA or RHA surgical intervention. Clinical Relevance RHA may provide advantages over traditional surgical treatments in functional performance of transfer motions. Since RHA devices have been shown to provide superior anatomical alignment, larger ROM, and greater bone conservation in comparison to THA devices, it may be a more desirable treatment option for pediatric and younger adult patients. Methods
This study was performed at the SHRI-CORE Motion Analysis Lab in Sun City West, AZ and received IRB approval from the Sun Health Institutional Review Board. Thirty three subjects were recruited for this study; 10 RHA, 11 THA, and 12 controls. Participation in the motion analysis lab was requested pre-operatively, at 6 weeks, at 3 months, and 1 year post-operatively. Patients were asked to sit on a knee height stool with feet a comfortable distance apart, with a foot on each force platform. Each patient was asked to rise from and descend onto the stool five times without using their arms for assistance. Three dimensional kinetic and kinematic data was collected using a 10 camera passive marker Motion Analysis system and 2 force platforms. EVaRT, OrthoTrak, Matlab, and SPSS were used for post processing, plotting and statistical analysis. Results
Table 1 provides selected results for both the sit to stand (STSU) and stand to sit (STSD) components of the task. STSU results indicated a faster recovery of hip motion in the frontal and transverse planes in the RHA group, when compared to control results. In contrast, abduction and rotational moments were similar in patient groups suggesting greater internal joint forces in the THA group. The THA group also produced greater power at the hip and ankle at 1 year. STSD results indicated faster rate of sustained recovery in the RHA group.
334

The THA group had internal rotation at the hip while controls indicated external rotation during the motion.
Table 1. Results for selected parameters during the SSS task with significance differences compared to controls (α = 0.05) shown in bold.
STSU Pre 6 Week 3 Month 1 year
RHA Hip Add Ang 14.1 (5.7) 13.9 (6.2) 11.9 (5.4) 10.0 (2.6)
THA Hip Add Ang 13.0 (5.9) 11.7 (5.9) 13.9 (6.5) 7.3 (5.2)
RHA Hip Int Rot Ang -6.0 (1.9) 0.1 (0.9) 3.1 (0.9) 2.2 (0.7)
THA Hip Int Rot Ang -6.8 (1.7) -4.7 (0.9) -2.2 (1.9) 2.9 (0.7)
RHA Hip Power 0.38 (0.16) 0.31 (0.16) 0.51 (0.17) 0.59 (0.36)
THA Hip Power 0.46 (0.21) 0.49 (0.23) 0.50 (0.18) 0.74 (0.24) STSD
RHA Hip Add Ang 13.7 (5.8) 13.9 (4.2) 11.7 (5.5) 10.7 (3.2)
THA Hip Add Ang 12.3 (5.7) 10.0 (6.4) 11.5 (7.3) 5.7 (3.2)
RHA Hip Int Rot Ang -4.5 (0.8) 1.7 (0.8) 1.8 (0.8) 1.8 (0.9)
THA Hip Int Rot Ang -6.4 (0.7) -2.6 (0.7) -0.1 (0.6) 6.6 (0.8)
RHA Hip Power 0.5 (0.2) 0.4 (0.2) 0.6(0.2) 0.5 (0.2)
THA Hip Power 0.2 (0.0) 0.4 (0.2) 0.5 (0.3) 0.8 (0.3)
Discussion
The RHA group produced control-like kinetics and kinematic values by 3 months post-operatively for SSS movements. Differences between THA and control groups at one year indicated significant midterm changes in joint forces and power potentially due to changes in neuromuscular control. Lingering joint instability, proprioceptive changes, and alterations to the length tension relationship of incised muscles may have inhibited the THA group creating compensatory movements.
The SSS task provides a more strenuous test than standard gait analysis for the comparison between hip arthroplasty groups. The RHA group demonstrates a biomechanical advantage in healing by returning to control-like values by the 3 month time point, while the THA group is still statistically different at the 1 year time point. This suggests resurfacing devices may provide biomechanical advantages during complex multi-planer movements which require significant hip control. Further investigation is needed to determine if the THA group continues with the trends shown by this study or if convergence with the RHA group and controls is attained. References Riley, P., Krebs, D.E., Popat, R.A. IEEE Transcation of Rehabilitation Engineering 1997; 5(4): 353-359
335

Kinematic Coupling between the Sagittal and Transverse Planes of the Knee for Male and Female Healthy Individuals during Everyday Activities
Kristamarie Pratt MEng, Rebecca A Zifchock PhD, Allison M Brown PT MA, Howard Hillstrom PhD, Steven Foglietta
Hospital for Special Surgery, Leon Root, MD Motion Analysis Laboratory, New York, NY INTRODUCTION: Knee injuries account for 13-71% of all sports injuries; the most common is rupture of the anterior cruciate ligament (ACL) [1]. Females are six to eight times more likely to injure their ACL than males [2]. This is likely due to several factors, including different movement patterns between genders. Understanding the kinematic coupling of knee flexion and internal rotation is particularly important for understanding the etiology of non-contact ACL injuries. Previous work has demonstrated differences in the variability of knee coupling between males and female during cutting tasks [3]. However, it is also important to understand differences in both the magnitude and variability of coupling between genders and among different activities. Therefore, the purposes of this study were (1) to compare the magnitude of kinematic coupling between genders and among activities, and (2) to compare the consistency of kinematic coupling between genders and among activities. The five activities were a pendulum drop, the stance phase of walking, the swing phase of walking, stair ascent, and stair descent. It was hypothesized that the magnitude and consistency of knee kinematic coupling would be similar between genders and across all activities for these healthy individuals.
CLINICAL SIGNIFICANCE: The results of this study may have important implications for understanding the mechanism of knee injuries, such as ACL tears. METHODS: Ten female subjects (33yrs±8; 1.6m±0.1; 59kg±4) and ten male subjects (32yrs±9; 1.8m±0.1; 82kg±16) were included in this study. Three-dimensional kinematic data were acquired using a 12-camera configuration while each subject performed six acceptable trials of each activity. For the passive pendulum drop, the participant was seated while an investigator passively extended their knee. The subject was instructed to remain relaxed as the investigator released their leg for data collection. A lack of quadriceps and hamstring electromyographic activity confirmed that the pendulum drop was a fully passive activity. Coupling was then calculated for the arc of motion from terminal knee extension to peak knee flexion. During walking, joint coupling data were analyzed from initial contact to the first peak knee flexion (during stance) and from peak knee flexion to initial contact (during swing). Joint coupling data during stair ascent were analyzed from initial contact to peak knee extension and during stair descent from initial contact to peak knee flexion. Sagittal and transverse plane knee angle data were used to create angle-angle plots for each activity. Vector coding was used to calculate the kinematic coupling of the knee joint as an angle, where a value of 45º indicates one-to-one coupling and values less than 45º suggest more sagittal than transverse plane motion. For each activity, the magnitude of kinematic coupling was quantified as the average of the coupling angles from six trials, and the consistency was quantified as the standard deviation of the kinematic coupling angle from six trials. A larger standard deviation was considered to be indicative of reduced consistency. Separate two-way mixed factor ANOVAs were used to compare the magnitude and
336

consistency of the coupling angles between genders and among activities. Post hoc testing was carried out where appropriate. P � 0.05 was considered significant.
RESULTS: The results of the ANOVA showed no significant interaction between activity and gender. There was a significant effect of activity for both magnitude and consistency of coupling. A trend suggested that females were less consistent in executing a task than males (P=0.11).
-50
-40
-30
-20
-10
0Pend Ascent Descent Stance Swing
Avg
Mag
nitu
de A
ngle
s (d
eg)
Female Male
**
**
0
2
4
6
8
10
12
Pend Ascent Descent Stance SwingAvg
Sta
ndar
d D
evia
tion
of A
ngle
s
* ***
Figure 1: The average magnitude and consistency of kinematic knee coupling angles for each activity. (* is indicative of significant difference between these two activities, ** is indicative of significant differences between this and each of the other activities)
DISCUSSION: These results suggest that there are differences in both the magnitude and consistency of knee kinematic coupling during different activities. It appears that the range of motion that occurred during an activity may influence their average movement patterns. The magnitude of the coupling angle for walk stance is significantly higher and exhibits coupling closer to one-to-one than the other activities. As compared to the other activities, walk stance was analyzed over a relatively small range of motion. The range of motion for walk stance may be 12 degrees whereas for the pendulum drop it may be 110 degrees. Thus, it is possible that during the stance phase of walking, greater bone surface congruency is maintained. It is not clear why the magnitude of the coupling angle for stair ascent is significantly lower than the other activities; however, it may be related to the fact that this was the only task requiring the muscles to contract concentrically against gravity. Similar average magnitudes of the coupling angles were revealed in the pendulum drop, walk swing, and stair descent. In general, walk stance was the least consistent activity, which could be a result of the fact that data were analyzed over a smaller range of motion, whereas the pendulum drop, which occurred over a larger range of motion, was most consistent. In contrast to Pollard et al [3], these data suggest that females may be less consistent in performing repeated tasks as compared to males. Limitations may exist in this study due to skin motion artifact.
REFERENCES: [1] Rishirajj et al. Sports Med 2009 [2] Hughes et al. Sports Med 2006 [3] Pollard et al. J Appl Biomech 2005
337

A novel biofeedback device for hip arthroplasty patients Jamie Law, Dr. Ioannis Agouris, Dr. Christopher MacLeod – The Robert Gordon University
IntroductionA system to monitor and log hip rotations following total hip replacement (THR) is currently being evaluated in the School of Health Sciences at The Robert Gordon University (see figure 1). The patient-worn system is able to record, in three-dimensions, real-time data about the hip during walking whilst not affecting movement itself while in use. Ongoing research includes the application of artificial intelligence software algorithms for the device, to detect any deviations in the hip movements, compared to that of normal patterns, and report the underlying muscle group(s) responsible, as well as to what degree, to further automate the diagnosis process.
Clinical SignificancePhysiotherapy plays an important role in the rehabilitation of THR patients with the main aims of regaining muscle strength, range of motion and function [1]. The effectiveness of these interventions will become increasingly important as the number of THRs-performed grows, in accordance with a demographically older population, while government targets work to decrease waiting times and push towards decreasing cost by accelerating time to discharge. Although THR usually results in a decrease of pain, improved function and more efficient walking patterns, abnormal walking patterns have been reported in patients months and years following THR [2]. In order to detect the underlying issues, gait analysis is employed, typically in one of two modes, instrumented and visually appraised gait analysis. Although considered the gold standard, instrumented analysis is generally expensive, requires dedicated laboratory space and necessitates trained operatives; the logistics and cost of implementation for every THR patient would be as unfeasible and therefore visual appraisal of gait quality tends to be the in-field choice for physiotherapists [3]. Although the reliability of visual gait appraisal has been shown to increase with clinical experience; THA patients are not routinely studied [4]. Consequently, there is an unmet clinical need for low-cost, portable and instrumented devices, such as the system described, which will occupy the role between subjective viewing of gait and accurate, objective measurement methods.
Figure 1: The Hip-Measurement Armature and system. Source: Author
338

339

Shoulder Joint Dynamics during Walker-Assisted Gait
K. Konop1,2
, K. Strifling1,2
and G. Harris1,2,3,4
1Orthopaedic and Rehabilitation Engineering Center (OREC), Milwaukee, WI,
2Marquette
University, Milwaukee, WI, 3Department of Orthopedic Surgery, Medical College of
Wisconsin, Milwaukee, WI, 4Shriners Hospitals for Children, Chicago, IL
Introduction
Comparative analysis of upper extremity (UE) dynamics (kinematics, kinetics) during
walker-assisted gait in children with cerebral palsy (CP) is limited in the current literature.
Our group has characterized the 3-dimensional joint angles for wrists, elbows, and shoulders
(glenohumeral joint) [1], as well as the joint reaction forces and moments (JRFs, JRMs) [2]
during anterior and posterior walker use. We found that the walkers generally produced
similar results, although the posterior walker tended to produce greater shoulder extension [1],
and a lower flexion JRM [2] than the anterior walker. The goal of this study is to characterize
the relationship between shoulder motion in the sagittal plane and all shoulder joint reaction
forces and moments (Fx,y,z, Mx,y,z) during both anterior and posterior walker use.
Clinical Significance
CP is a developmental disability that occurs at a rate of 3-4 per 1000 live births [3].
Many children with CP have a diplegic distribution of spasticity, usually with lower
extremities (LEs) more affected than UEs. This population can benefit from the use of
walking frames by distributing the gait loads to the UEs. However, the increased magnitude
and repetition of loads applied to the shoulder joints during walker-assisted gait leads to
concern for potential shoulder injury later in life. Understanding the relationship between
joint angles and kinetics with walker use may also allow for development of a method for
optimizing load sharing among UE joints.
Methods
Ten children (3 males, 7 females; aged 12.1 years) with spastic diplegic CP who
routinely used walkers were analyzed after IRB approval and informed consent were
obtained. The average height was 130 cm and the average weight was 35.6 kg. Reflective
surface markers were applied to the upper and lower extremities. The UE marker set included
eighteen 16-mm reflective markers applied to the following anatomical landmarks: left and
right anterior superior iliac spines (ASIS), sternal notch, vertebra C7, left and right acromion
processes, mid-humeri, olecranon, mid-radii, ulnar styloid processes, and the third and fifth
metacarpals. The shoulder is modeled as the glenohumeral joint. Each subject underwent
gait analysis with their usual walker. Motion data was collected at 60 Hz using a 12-camera
Vicon motion analysis system (Oxford Metrics, Oxford, UK). Two specially designed walker
handles (AMTI, Watertown, MA) instrumented with 6-axis strain gage-based load cells were
used to measure three forces and three moments acting at the hands. Both anterior and
posterior walkers were used by each subject. A 30-day acclimation period was allotted for
each walker type.
The raw data were filtered with a Woltering filter and run through a custom UE model
to obtain joint angles, angular velocities and accelerations. The kinetic portion of the model
used inverse dynamics to calculate the joint reaction forces and moments at the shoulder
340

joints (Equations 1 and 2). Force data were normalized to body weight (N), and moment data
to the product of body weight and stature (Nmm) to obtain dimensionless metrics. Data were
then time-normalized to 100% gait cycle.
Eq. 1 JRFproximal = (mass*acceleration)DistalSegment – FDistalJoint
𝑥𝑖𝑚𝑎𝑙
Eq. 2
Spearman rank correlation was performed between the peak angles (maxima and
minima) in the sagittal plane and peak forces and moments in all cardinal directions at the
shoulder. Correlation coefficients (Rho) of |R|>0.80 with p-values of less than 0.05 were
considered to be significant.
Results
Following the full analysis, very few significant correlations between peak sagittal
plane shoulder angles and peak forces and moments were found. Correlations with R>0.80
and p<0.05 were observed between the minimum angle and the minimum force in the x-
direction (posteriorly-directed) on the left side during posterior walker use (R=-0.8424,
p=0.0045), and between the minimum angle and minimum force in the x-direction
(posteriorly-directed) on the right side during anterior walker use (R=-0.8061, p=0.0082).
Discussion
The current analysis does not reveal strong correlations between the peak sagittal
plane shoulder angle and the peak JRFs and JRMs experienced at the shoulder during walker
use. The two observations that were statistically significant indicate that with less shoulder
extension (minimum sagittal plane angle), there is a lower posterior JRF. This is intuitive
since less shoulder extension (a more neutral arm position) causes the force of gravity to act
along the axis of the humerus, in the inferior/superior force direction. Greater extension
would transfer more of the gravity reaction to the posterior direction.
The joint reaction kinetics are complex and involve many variables, including the rate
of change of the joint angles, body segment parameters, and the kinematics and kinetics of the
distal joint(s). This complexity makes the interactions between UE kinematics and kinetics
far less intuitive. Overall, this study indicates that simple visual observation is not sufficient
and should not be used to predict joint reaction forces or moments. If joint kinetics are
needed, a quantitative motion analysis should be performed.
References
[1] Strifling KMB, et al., Gait Posture 2008; 28(3): 412-9
[2] Konop, KA, et al., Gait Posture, 30:364-369, 2009.
[3]Yeargin-Allsopp M, et al., Pediatrics 2008; 121: 547-554
Acknowledgements
NIDRR Grant numbers: H133P020004 & H133G010069
intintPrintPr ][][ DistalJooximalJoDistalJoentDistalSegmosimal FRFRMHJRM
341

A NEW WIRELESS INERTIAL SENSING DEVICE TO TRACK HUMAN MOTION: PRELIMINARY ASSESSMENT ON ELEMENTARY
EXERCISES M.G. Benedetti 1, S. Attala 1, G. Casadio 2, S. Peharec 3, A. Leardini 1
1 Movement Analysis Laboratory, Istituto Ortopedico Rizzoli, Bologna, Italy 2 LorAn Engineering Srl, Castel Maggiore, Bologna, Italy
3 Poliklinika Peharec, Pula, Croatia
Introduction In human movement analysis there is still the need for compact, easily transportable and cheap devices able not to interfere with the subject activities under analysis. In particular, wireless inertial sensing devices are being developed for the assessment of exercises and motor activities of the daily living, and for the identification of relevant events, without the typical limitations of measures in a laboratory setting [1]. The aim of this study was to preliminary validate a new wireless device, particularly exploiting applications in assisted rehabilitation [2]. Exemplarily, the mobility of the shoulder and elbow joints during elementary rotations and the counter-movement jump (CMJ) were analyzed.
Clinical Significance The new device and the relevant software tools can be utilized to assess easily human motion in real time and in standard conditions for any assisted rehabilitation.
Methods One healthy subject (age 25 years, weight 63 Kg, height 1.73 m) participated in the study. The Free4Act (F4A) device (LorAn Engineering, Bologna, Italy), sized 62x36x16 mm, made of a triaxial accelerometer and a biaxial magnetometer, was used at 50 Hz sampling rate, and was calibrated previously. In a first experiment, the subject in up-right posture with palms on thigh was asked to perform flexion-extension and ab-adduction of the left shoulder and flexion-extension of the elbow. From 90° shoulder abduction and 90° elbow flexion position, axial rotation of the shoulder and of the elbow (prono-supination) were performed. The devices were attached with elastic bands to the proximal third of the arm and at the distal apex of the fore-arm. The devices, set at ± 2.5g, were oriented along the long axes of these body segments. A marker triad consisting of three 10 mm diameter reflective spherical markers was attached to each device, and tracked at 200 Hz with a infrared camera stereophotogrammetric (SP) system (BTS, Milan, Italy). As for CMJ, from up-right posture with hands on hips, the subject was asked to jump up as high as possible for three times. One device, set at ± 4g, was attached with elastic bands on the back near to L5, oriented along the spine. A single 15mm diameter marker was mounted on it, and tracked at 100 Hz with a 8 M2 camera system (Vicon Motion System, Oxford, UK). Signals from the device were pre-processed by Butterworth low pass filters, and then analyzed for extracting accelerations and rotations of the body segments in the gravitational reference frame. Three repetitions of each exercise were collected. Synchronization of the two measures was obtained a-posteriori over the motion curves.
342

Results The measurements obtained by F4A compared very well with corresponding from SP, despite the different signal sources and the various necessary data processing. For rotations the differences were smaller than 1 degree.
Figure 1: Superimposition of the time-histories of segment rotations from F4A and SP systems in upper-limb motion exercise. Table 1: relevant range of movement
Figure 2: Superimposition of the time-histories of accelerations from F4A and SP systems in CMJ. Table 2: relevant parameters at the central jump
Discussion This study showed, though preliminarily, that some of the measurements traditionally obtained with the cumbersome SP can be obtained also by the more manageable inertial sensors. These shall be configured according to the specific motion analyzed.
References [1] Picerno et al., Gait & Posture. 2008 Nov; 28(4):588-95 [2] Coley et al. Med Biol Eng Comput. 2009 May; 47(5):467-74
Acknowledgement This study is supported by Regione Emilia Romagna, Italy. Website: www.aertech-lab.it
Forearm Range SP (°) Range F4A (°)Flex/Ext Rotation Pron/Sup
140.10 148.40 151.00
140.29 147.99 151.03
Arm Range SP (°) Range F4A (°)Flex/Ext Ab/Ad
244.00 181.80
244.16 182.75
Flight Time (sec)
Max Height (cm)
Max Acceleration
(m/s2) trial F4A SP F4A SP F4A SP
1 0.54 0.53 35.75 35.00 8.81 8.10 2 0.52 0.52 33.15 33.90 8.43 8.56 3 0.54 0.55 35.75 36.40 8.87 8.17
343

Identifying Phases of Gait Using Image FlowNalini Vishnoi, Wallace Lawson, Naomi Lynn Gerber, Zoran Duric
George Mason University, Fairfax, VA{nvishnoi, wlawson, ngerber1, zduric}@gmu.edu
IntroductionGait is one of the most important functions of humans and correlates with mortality
and functional independence. Quantitative measures of gait have traditionally requiredthe use of laboratories with expensive instrumentation and markers needing to be placedon limb segments. This approach has limited the ability to obtain reliable data in non-laboratory settings. There is substantial value in being able to capture segmental data,unobtrusively, in a variety of functional/real life settings without encumbering the subject.We present a novel way to overcome these limitations using computer vision techniquesthat do not require either calibrated cameras or special markers. Our approach usesvisible light cameras under normal illumination. In addition, we demonstrate that ourapproach can be used to obtain reliable quantitative data, such as velocity and time spentduring discreet phases of the gait cycle.
Clinical SignificanceThe analysis done using computer vision methods allows marker-less and unencum-
bered video capture of human locomotion. Applications to monitoring gait in homes andcommunities has application for the aged and disabled. It also provides an assessmentthat could be used to determine howsafe an individual might be in real situations. Datacan be streamed permitting monitoring from a distant site.
MethodsWe captured gait data from two subjects with three different types of shoes and
processed the data to detect phases of gait, as a proof of principle. The data were recordedin the frontal and sagittal planes at 60 frames/second at resolution 640 × 480 pixelsper frame. There were two illumination sources, overhead fluorescent lights and naturaldaylight coming from side corridor and behind the subject through several windows. Eachsubject walked for 18 feet before being recorded to enable them to reach a consistentwalking pattern.
We base our method on the following observations. First, the instantaneous headand torso velocity can be approximated with a high degree of accuracy by pure trans-lational velocity. This motion comprises forward translation of the body and up/downmovement/excursion. The minimum head excursion corresponds to double leg stance ofthe gait cycle, whereas the maximum head excursion corresponds to the single leg stance[4]. Note that these events occur at the zero value of the instantaneous velocity, i.e. theminimum excursion occurs when the velocity changes sign from negative to positive, andthe maximum excursion occurs as the velocity changes sign from positive to negative.
We have used the sequences captured using Point Grey Dragonfly® 2 color camera.The figure shows the results obtained for one of the sequences. The subject was recordedfrom the frontal plane, she was wearing flat sandals and moving with a comfortablespeed. We used background subtraction to detect moving people [2]. The backgroundwas observed over time and it was then subtracted from image frames to obtain theforeground/ silhouette of the moving person. We computed the bounding box containingthe person and took the top 30% of the box for further processing. This guaranteed thatthe head and shoulders were included in the region of interest. For all these regions, wecomputed image velocity, i.e. normal flow [1] from pairs of consecutive images. Thisnormal flow fields are used in our method to estimate the projected image motion, i.e.the perspective projection of the the instantaneous velocity of the moving person. (Anexample of estimated normal flow field is shown in the top left of the figure. Flow vectors inthe background are all close to zero. A non-zero value corresponds to the estimation noise.)The equations of motion of the moving person can be written as vx ≈ (fTx − xTz)/Z0,
344

vy ≈ (fTy − yTz)/Z0, where (vx, vy) is image velocity at (x, y) and (Tx, Ty, Tz) is theinstantaneous translational motion of person, Z0 is the approximate distance of the fromthe camera, and f is focal length of the camera lens.
We use image flow to determine the viewing direction. Observe that in the frontalview the instantaneous center of motion, i.e. the Focus of Expansion (FOE) is in theimage [3], but its position depends on the direction of velocity of the head movement. Wecompute an angle θ of the line from the center of the body image to the FOE with thevertical axis. The same method works for all frontal views of a moving person. When wedetect that the we are viewing a person from the sagittal plane, i.e. θ is approximatelyconstant, we fit a two-parameter image velocity model, (u, v), to the flow data [1]. Thevertical component u of the velocity exhibits very similar behavior to θ. Its zero crossingscorrespond to the minimal and maximal excursion events of the gait cycle.
ResultsThe middle top figures show two different positions of the FOE and the right top
figure shows values of θ for the sequence, where the numbers of the x-axis correspondto image frames. Note that the marked frames correspond to zero-crossings of θ. Theseframes are displayed in the bottom row of the figure: the first and all odd-numbered framescorrespond to the double leg support and the minimal head excursion, and the second adall even-numbered frames correspond to mid-swing and the maximal head excursion [4].
0 20 40 60 80 100 120 140 160 180�1.5
�1
�0.5
0
0.5
1
1.5
2
For ground truth we have extracted the identified image frames showing variousphases of gait.
ConclusionsWe have used gait videos of two subjects under different walking conditions to reliably
identify double and single-limb stance phases of gait. Due to the periodicity of gaitwith known frame rate and frame differences between consecutive occurrences of thegait phases, we can compute the time spent in each phase of gait. We believe this isan important step in being able to demonstrate the application of computer vision toquantitative gait analysis.
References1. H. Wechsler et al. (2004) In IEEE Trans. on PAMI, 26:466–478.2. Z. Duric et al. (2007) In Proc. VISAPP(2), 486-491.3. Trucco, Verri. Introductory Techniques for 3-D Computer Vision. 1998.4. J. Perry. Gait Analysis: Normal and Pathological Function. 1992.
345

Comparison of markerless and marker-based motion capture technologies through simultaneous data collection during gait
E. Ceseracciu(1), Z. Sawacha (1), S. Corazza (2), C. Cobelli (1) (1) Department of Information Engineering, University of Padova, Padova, Italy (2) Mixamo Inc., San Francisco, California, USA
Introduction Marker-based motion capture systems are widely used in motion analysis laboratories; however, marker-based motion analysis requires long preparation time and the presence of markers can lead to experimental artifacts [5]. This study presents a comparison between a marker-based kinematic reconstruction of embedded joint coordinates and the same one obtained with a markerless motion analysis technique [2]. This was performed through simultaneous markerless and markerbased acquisition by means of the same motion capture system.
Clinical significance Markerless motion capture aims to overcome errors due to soft tissue artifacts [6]. Indeed many techniques have been developed since now [6] in order to compensate errors associated with motion capture but most of them are difficult to adopt in clinical routine gait analysis. Moreover, this technique, without the need of applying any marker to the subject, allows acquisition of a gait which is closer to everyday life gait, even if evaluated with controlled laboratory conditions.
Methods Three subjects, wearing tight-fitting clothes and a swim cap, have been acquired according to a modified version of protocol [1], which entails calibrating each anatomical landmark, and their gait (three trials per subject) collected by means of a six-cameras BTS S.r.l. motion capture system (60 Hz). Grayscale images obtained from four of those cameras have been acquired at 30 Hz; silhouettes of the subjects have been extracted from them by thresholding their difference from a reference background image, and performing binary morphological operations (opening and closing, fig.1b). A three-dimensional representation of the subject (visual hull) has been reconstructed for each frame by back-projecting the silhouettes in space, and intersecting the resulting volumes. Kinematic estimation was then obtained by means of matching the surface of the visual hulls to segmented, subject-specific mesh models, employing the articulated-ICP algorithm developed at Stanford [2] (fig. 1c). The models have been created applying the automatic model generation algorithm described in [3] either to a visual hull (two subjects) or to a laser scan (one subject) of the subject in a reference pose. In order to compare the two approaches, intra class correlation coefficient (ICC) was evaluated [4] among joints’ trajectories obtained with the same methodology (intra-method) and with the two different ones (inter-methods), over the stance phase of gait.
346

c) b) a)
Figure 1: a) Original frame from a sequence. b) Silhouette extraction. c) Re-projection of the model on the image plane.
Results Intra-method ICC coefficients for X (medio-lateral), Y (vertical) and Z (antero-posterior) components ranged from 0.856 to 0.987 (ankle), from 0.755 to 0.999 (knee) and from 0.568 to 0.996 (hip) considering markerless, and from 0.798 to 0.999 (ankle), from 0.889 to 0.999 (knee) and from 0.939 to 0.997 (hip) considering marker-based. ICC showed that medio-lateral curves correlated poorly, while Y and Z components ICC coefficients ranged from 0.560 to 0.989. In particular, a nice correlation (mean 0.966 ± 0.052 SD) was found for the Z component of all joints with respect to each trial of each subject.
Discussion The application of a fully automatic markerless motion analysis technique was performed with a common optical motion capture system, available in most gait analysis laboratories. This has been shown to provide estimation of joints’ trajectories which correlated very well with that obtained with a conventional marker-based analysis. It should be noted that the very limited number of cameras employed for visual hull reconstruction, as well as the presence of markers which deforms the subjects silhouette, affected the performance of the markerless methodology. Further studies will be performed in order to compare the two methods’ joint angles estimation.
References [1] Leardini A et al, Gait & Posture 2007; Vol. 26(4):560-571 [2] Mundermann L et al, IEEE CVPR 2007 Page(s):1 - 6. [3] Corazza S et al, IEEE Trans Biomed Eng. 2008 Nov 18. [Epub ahead of print] [4] Schwartz MH et al, Gait & Posture 2004 Vol. 20(2):196-203 [5] Chiari L. et al Gait Posture. 2005, 21(2):197-211. Review. [6] Leardini A. et al Gait Posture. 2005, 21(2): 212–225. Review
347

Stiffness characteristics of neutral cushion running shoes during long-term mechanical fatigue
1Eve Hoffman, BA 1Alison Biercevicz, BS 1Ryan Rich 2David Paller, MS1RIH Orthopaedic Foundation Inc., Providence, Rhode Island
2Department of Orthopaedics, The Warren Alpert Medical School of Brown University, Providence, Rhode Island
IntroductionEpidemiological studies suggest
that the incidence of running related injuries remain anywhere from 24 to 65% of all runners [4]. Although, there are many risk factors associated with running—increased mileage, terrain, weather, previous fitness level—the choice and quality of cushioning in footwear has not been extensively studied as a risk factor in reduction of running injuries. Research on injuries in running suggests that many injuries are caused by the high impact force with which the foot strikes the ground [4]. This study investigates the ability with which current running shoe designs are able to effectively cushion this force.
The objective of this mechanicalstudy was to simulate running impact fatigue in various athletic shoe models and determine how the stiffness characteristics change over the fatigue life of the shoes. Results would determine the number of miles that can be run on a pair of shoes before it loses its ability to reduce impact forces. It is hypothesized that the greatest changes in stiffness will occur during the initial fatigue life of the shoe samples (0-100 miles).
Clinical Relevance:This study provides data on the dampening properties of various commercially available running shoe models. Understanding force dampening characteristics potentially reduces the incidence of running related injuries.
MethodsFive athletic shoe manufacturers each supplied women’s neutral cushioned size 8 shoes for analysis. A polyurethane cast mold was made from the feet of a female amateur marathon runner. The mold was instrumented with a cannulated metal rod. A universal joint connected the proximal end of the cannulated rod to the actuator on an Instron 8521S servohydraulic load frame. The universal joint intended to simulate the degrees of freedom of the ankle joint specifically the talocrural joint [6]. An aluminum wedge was mounted under the mid and forefoot of the shoe. This wedge placed each shoe sample in 10° of dorsiflexion simulating an initial heel strike as experienced during the gait cycle [4][5].
Figure 1: Shoe mounted in the test fixture
All shoes were initially tested monotonically to determine time zero stiffness. Each brand of shoe was tested dynamically up to 600 miles and monotonically at 5, 10 15, 25, 50, and
348

100 miles, and then 100 mile intervals up to a total of 600 miles. Dynamically, the shoes were tested to 1600 N (165 kg) of compression, or three times the body weight of the test subject [1][2][3] and at a test frequency of 2.5 hertz. This simulates a 5.3 minutes per mile running pace assuming a 1 meter stride length. Load and displacement data was collected on a semi-logarithmic scale during the dynamic tests at a rate of 200 Hertz.
The shoes were monotonically tested in compression at a rate of 6 mm per minute to a total displacement of 6 mm. This test was done before each shoe was tested dynamically, then at each 100 mile interval after having been held at a compressive load of -100N for a recovery period of 30 minutes. During the monotonic tests load and displacement data was collected at a rate of 25 Hertz.
A two-way analysis of variance (ANOVA) was performed to determine if statistically significant differences in stiffness existed between the shoe brands or the fatigue duration. The statistical significance level was set at 0.05 a priori. All stiffness values were calculated in N/mm using a custom LabView (National Instruments, Austin TX) program from data collected on the test frame.
Results:The data from testing of all shoe brands shows that the stiffness increased during the first fives miles of running, remained relatively constant between 5 and 50 miles, and then increased again between 50 and 100 miles of running. The stiffness values then reached a plateau and remained relatively constant from 100 to 600 miles. The stiffness calculation between 100 and 600 miles
were significantly higher the initial stiffness calculations for all shoe types ( p < 0.01 for all cases). In addition, the stiffness was significantly reduced after allowing for a recovery period in all brands of shoes ( p < 0.01 for all cases)
Discussion:Our objective was to determine how the stiffness characteristics change over the fatigue life of the shoes, and how many miles can be run on a pair of shoes before it loses its ability to reduce impact forces. Our findings that stiffness values increased after even 5 miles of running, but then decreased after a recovery period suggests that runnerswho run even a few miles every day may consider alternating between several pairs of shoes. Allowing the shoesenough recovery time to regain some of their initial cushioning properties may significantly reduce the likelihood of impact and or overuse injuries.
Acknowledgments:Shoes were donated by Mizuno, New Balance, Nike, Pearl Izumi and Reebok .
References: [1] Cavanagh et al., J Biomech 1980; 13: 397-406. [2] Cook et al., Clin Sports Med 1985; 4: 619-626. [3] Cook et al., Am J Sports Med 1985; 13: 248-253. [4] Hreljac. Med Sci Sports Exerc 2004; 36: 845-849. [5] Novacheck. Gait Posture 1998; 17: 77-95 [6] Wright IC et al., Clin Biomech 1998; 13: 521-531.
349

350

351

Landing strategies focusing on the rotatory control of knee joints in patients with ACL reconstruction, basketball players, and healthy controls Huang CY1, Chen YT1, Li JS1, Yang CY2, Su FC3, Chen WL1
1. Department of Physical Therapy, National Cheng Kung University, Tainan, Taiwan 2. Department of Orthopedics, National Cheng Kung University Hospital, Tainan, Taiwan 3. Institute of Biomedical Engineering, National Cheng Kung University, Tainan, TaiwanIntroduction: Anterior crucial ligament (ACL) injury is commonly seen in basketball players. Although tibial internal rotation has been described as the principal mechanism of ACL injury, pervious studies mainly focused on the control of knee valgus at landing and controversies still existed in the direction of tibial rotatory control during landing activities. While patients with ACL-deficient knees were found to walk with increased tibia internal rotation,[1] compensatory movement pattern with increased tibial external rotation during walking was also reported. [2] This study aimed to identify different landing strategies focusing on the rotatory control of hopping knees in people at different risk level for ACL injuries, and to examine the differences in hopping distance or strength variables between those with different landing strategies for subjects without ACL deficiencies. Clinical Significance: The way to classify landing strategies proposed in this study might shed a light on the early detection of landing strategies with excessive ACL stress.Methods: 61 male subjects including 27 patients with ACL reconstruction, 22 basketball players and 12 normal controls were recruited to undertake one-leg hop tests with kinematic assessment by a 3-D motion analysis system (Vicon- 460,Oxford Metric, UK) and strength measurements by a tensiometer (9301B, Kistler, USA). Three phases including preparatory phase, take-off phase, and landing phase during one-leg hopping were determined by the instants where maximal knee flexion angle before take off (MKFBH), the instant of toe-off (TO), the instant of foot contact (FC) and maximal knee flexion angle after landing (MKFAH) occurred. Knee kinematics was collected at these four instants. In addition, the instant where minimal knee flexion angle (KFmin) occurred right before landing, and the instant where the first peak of tibial internal rotation occurred after landing (TIRpeak) as well as the rotatory transit right before TIRpeak were also identified for kinematic data collection. Landing strategies for both legs of all subjects were then classified into two basic types according to the direction of knee rotatory control immediately after landing before reaching TIRpeak. (see Fig. 1) Type TIR referred to those landing with directly tibial internal rotation. Type TER referred to those landing with tibial external rotation first before the tibia started to rotate internally. Several Student t tests were conducted to examine the differences in landing kinematics, hopping distance, and knee strength between legs with different landing strategies (TIR, TER) except for legs in ACL group. Results: In this study, 9 reconstructed legs and 5 sound legs in ACL group (45 legs in all)
352

353

Analysis of Running Kinematics, Kinetics
and Electromyography in Typically Developing Children
Roy A. Wervey 1, Michael H. Schwartz 1,2, Johanna Dijkstal 2, Tom F. Novacheck 1,2 1 Gillette Childrens Specialty Healthcare, St. Paul USA
2 University of Minnesota, Minneapolis, USA
Introduction Although several studies provide descriptive information on the effects of changing walking speed on gait patterns, none look at the effects of speed on running kinematics, kinetics and muscle activation patterns in a combined study. This study is a continuation of the analysis of the effects of varying speeds of locomotion. We previously reported walking data for this same group of subjects (Schwartz). This report extends this work to a description of running and sprinting gait kinematics, kinetics, muscle activation patterns and spatial-temporal parameters. Clinical Significance The effects of speed on running provides a valuable reference data set for clinical work as we try to understand normal gait and its deviations. Methods After receiving IRB approval, parental consent and subject assent, we used standard gait lab tools to collect three-dimensional kinematics, kinetics and surface electromyography from 83 children (ages 4-17), over a range of walking speeds and at self selected running speeds. For analysis of the running data, only trials with kinetics (at least a single clean force plate strike), were included. The trials were sorted using the average ankle moment over the first two percent of the gait cycle into sprinters (plantarflexion moment) and runners (dorsiflexion moment), (Figure 1). Non-dimensional speeds (Hof), were calculated and each group was equally divided into fast & slow groups based on speed after eliminating trials that fell outside of the range including the 5th to 95th percentiles of the speed distribution to eliminate outliers. (Table 1). Averages for the four groups were calculated for the kinematics, kinetics and electromyography and plotted on the same graph for comparison. Group averages for spatial-temporal parameters were also compiled.
Fast Sprint
Slow Sprint
Fast Run
Slow Run
# of Trials 89 89 57 58# of Subjects 35 37 28 26
Foot Off, % GC 33.37 34.70 34.22 35.83Speed * 1.52 1.18 1.42 1.11
Stride Length * 2.88 2.59 2.75 2.48Stride Time * 1.90 2.20 1.94 2.24
Cadence* 15.15 12.62 15.00 11.99* Non-Dimensionalized
Table 1, Sprinters and runners: subject distribution, spatial temporal parameters averages.
Sprinters
Figure 1, Sorting free speed group into runners and sprinters using ankle moment characteristics at initial contact
Runners
354

Results The graphs presented here show highlights of the data that was processed for this study. (Figure 2). Table 1, summarizes the spatial-temporal parameters for the running & sprinting groups.
nnnnnnnnnnnnnnnnnn Discussion This work completes a descriptive study of the effects of varying ambulation speed for a group of typically developing children. The data presented reemphasizes the increased demands on strength, control and timing that running and sprinting presents. Many centers see and treat higher functioning patients for whom level ground walking in a controlled environment is not challenging enough to reveal their functional gait deficits. More demanding tests, such as running, may provide useful information for treatment decision-making and outcomes assessment. References Schwartz, Journal of Biomechanics 41 (2008) 1639-1650 Novacheck, AAOS Instructional Course Lectures Vol. 44 (1995) 497-506 Hof, Gait & Posture, 4(3) 222-223 (1996) Acknowledgements Thank you to the children who participated in this study and to their parents as well.
Figure 2. Sagittal plane kinematics and kinetics. The most interesting gait features in running occur in the sagittal plane. At initial contact sprinters are plantar-flexed and remain plantar flexed during swing phase. Runners are dorsi-flexed at initial contact and during the 2nd half of swing phase. Sprinters have an ankle plantar-flexion moment at initial contact; runners have a dorsi-flexion moment. Hip and knee ROM and power generation increase with speed. These results confirm previous work in our lab (Novacheck)
355

Evaluation of Asymmetry in Muscle Activity and Ground Reaction Force during Sit-to-Stand and Stand-to-Sit in Asymptomatic Subjects
1David R. Burnett, MS, 2Naira H. Campbell-Kyureghyan, PhD, 3Peter M. Quesada, PhD 1Department of Industrial Engineering, University of Louisville
2Department of Industrial & Manufacturing Engineering, University of Wisconsin-Milwaukee 3Department of Mechanical Engineering, University of Louisville
INTRODUCTION Common, yet essential, activities of daily living include the ability to rise from a seated
position [1-5] and sit from a standing position [1, 5]. Many studies have attempted to provide a biomechanical description of these tasks by applying commonly accepted data collection methodologies such 3-dimensional kinematics, kinetics, and electromyography (EMG).Biomechanical evaluations of Sit-to-Stand (SitTS) and Stand-to-Sit (StandTS) tasks among asymptomatic subjects are less numerous than gait studies and often consider either standing up or sitting down, but not both. One aspect of these fundamental functions that can be further expanded upon is the concept of bilateral symmetry. Determining whether biomechanical differences exist between the non-dominant (ND) and dominant (D) sides of the body is critical as asymmetry may indicate a potential biomechanical susceptibility toward the development of other joint pathologies [6]. The objective of this study is to quantify symmetry of vertical ground reaction force (VGRF) and EMG variables between the ND and D sides of the body in asymptomatic subjects during SitTS and StandTS tasks.
CLINICAL SIGNIFICANCEThe research is specifically aimed at determining a level of symmetry that can be used as
criteria for comparisons of healthy and impaired individuals. METHODS
8 male and 4 female subjects, with an average age of 23.7 years, participated in the study. In order to be included in the study, subjects could not be experiencing any joint pain which would potentially alter their ability to rise from or sit down into a chair. Average (±SD) height and weight of the subjects was 173.1 (±11.6) cm and 75.9 (±18.6) kg, respectively. All subjects voluntarily agreed to participate in the study and signed the IRB approved consent form prior to participation.
For collection of sit-stand movement data, initially seated subjects were instructed to assume an upright standing position (SitTS) followed by a seated position (StandTS) as many times as possible within a 30 second time interval. This process was performed one time with each leg (ND and D) on the force plate (Bertec Corp.). A single peak VGRF value was determined during each SitTS and StandTS cycle. Root mean squared (RMS) amplitude during the SitTS and StandTS phases was determined from 4 bilateral muscle groups: erector spinae (ES), rectus abdominis (RA), rectus femoris (QUAD), and hamstring (HAM).
A symmetry index (SI) of VGRF and RMS measures was calculated by dividing the value for the ND side by the value for the D side (Table 1, SI5 – SI7) and statistical differences were determined with a paired t-test (α=0.05). Time to complete the SitTS and StandTS tasks were compared (Table 1, SI8). For each SI, a value of 1 would indicate perfect symmetry while positive values would indicate a pattern that favors the ND side.
Table 1. Formulas used to compute the SI for SitTS and StandTS tasks
356

*
RESULTS
There were no statistical differences (p>0.05) in VGRF or RMS values between the ND
and D sides of the body during SitTS or StandTS tasks (Figure 1), and several parameters
showed near perfect symmetry. Specifically, VGRF SI during the entire sit-stand cycle was
extremely close to unity (SI5 = 1.008). Similarly, SI6 and SI7 values were between 0.989 and
1.372 which signify relatively symmetric muscle activity of the ND and D limbs during SitTS
and StandTS trials. The only statistically significant parameter was found to be SI8 with a value
of 0.715 (p = 0.004) which indicates that it took significantly more time to complete the StandTS
phase than the SitTS phase.
Figure 1. Summary of symmetry evaluation during SitTS and StandTS tasks
DISCUSSION
Sadeghi et al. [7] suggests that symmetry is achieved if no statistical differences exist
between parameters that are measured bilaterally. Based upon this definition, SitTS and
StandTS tasks in asymptomatic subjects are symmetrical with respect to VGRF and muscle
activity of the trunk, back, and leg muscles. Future research will include a similar symmetry
analysis of patients with low back pain and/or knee osteoarthritis to ascertain whether or not
particular compensation patterns are present which will affect symmetry. For instance, Shum et
al. [5] concluded that subjects with low back pain had significantly limited hip and spine
mobility and altered load sharing strategies during SitTS and StandTS while Mizner et al. [8]
found that knee OA patients adopted movement strategies that allowed compensation by the
uninvolved limb to accomplish functional tasks, potentially resulting in negative consequences in
the long-term.
REFERENCES
1. Kralj A, et al., Journal of Biomechanics, 1990, 23(11): 1123-1138
2. Riley P, et al., Journal of Biomechanics, 1991, 24(1): 77-85
3. Schenkman M, et al., Physical Therapy, 1990, 70(10): 638-651
4. Dehail P, et al., Clinical Biomechanics, 2007, 22(10): 1096-1103
5. Shum G, et al., Spine, 2005, 30(17): 1998-2004
6. Teichtahl A, et al., Arch Phys Med Rehab, 2009, 90(1): 320-324
7. Sadeghi H, et al., Gait & Posture, 2000, 12(1): 34-45
8. Mizner R, et al., Journal of Orthopaedic Research, 2005, 23(5): 1083-1090
ACKNOWLEDGEMENTS
The authors would like to thank Ms. Julia Kar for her assistance with data acquisition and
analysis.
357

Lifestyle Factor Influences on Ambulatory Activity in Youth and Adults
Kim Coleman1, MS, Linda Laing1, BS, Teri Rosenbaum-Chou1, PhD 1Orthocare Innovations, LLC, Seattle, WA
Introduction: The purpose of this analysis was to investigate which lifestyle factors have the greatest influence on ambulatory activity of healthy persons. Clinical Significance: Lifestyle factors that influence ambulatory activity need to be identified so that their confounding potential can be controlled in future studies addressing research questions with ambulatory activity outcome measures. Methods: The protocol was approved by Western IRB and funded by NIH SBIR grant R44 HD 39036-02 and conducted by Cyma Corporation. To be eligible to participate, subjects were required to be between the ages of 10 and 90 years old, be ambulatory, have no present injury or illness, no history of chronic disease, and have a BMI less than 39. Informed consent was obtained from each participant prior to enrollment. Following enrollment, subjects were given a survey that asked 39 questions about lifestyle topics on demographics, occupation, and home life. Subjects then wore a StepWatch activity monitor (Orthocare Innovations, Seattle, WA) on their ankle for 3 to 14 continuous days.
The following activity measures were calculated for each full 24-hour day of data and then averaged across the included days: 1) Daily steps – average strides/day; 2) Peak perf – average strides/min of the most intensive 30 individual minutes in the day (can be continuous or non-continuous); 3-7) Max 60, Max 30, Max 20, Max 5, Max 1 – average strides/min of the most intensive continuous 60, 30, 20, 5, or 1 minute in the day, respectively; 8) High activity – percent time at > 40 strides/min; 9) Med. activity – percent time between 15 and 40 strides/min; 10) Low activity – percent time at ≤ 15 strides/min; 11) Inactive – percent time inactive.
Statistical Analysis: The lifestyle factors that elicited a “yes” or “no” response were compared with an unpaired t-test. Linear regression was used to determine associations between activity measures and lifestyle factors that required a number of hours or days entry. Results: Data were collected on 230 subjects age 48 ± 21 years old for 6.9 ± 1.0 days. Only the lifestyle factors of having an “occupation”, “walking to work,” and “number of days a week at occupation”, and “hours a day at occupation” were associated with statistically increasing activity in both youth (under 18 yrs old) and adults (at or over 18 yrs old). Even though there were other lifestyle factors that statistically affected the overall subject population, the statistical differences in these cases either were more heavily influenced by youth or adults or did not have enough representation from youth or adults to determine if the association existed for that subgroup. Therefore, results focus on the lifestyle factors that highlight activity differences between youth and adults.
Youth who had a sibling age 5 to 10 years old had higher activity levels than youth who did not. The opposite was true of youth who lived with siblings age 16 years old or older (Table 1). Simple regressions between age (10 to 17 yrs old) and activity measures demonstrated that age was not likely a confounding variable for age group of siblings.
Youth who reported that they lived in the city were more active than those who lived outside of the city. This was especially true when comparing youth in the city to youth in the
358

suburbs. Number of days on computer and days exercising also affected youth and adults differently. Youth who spent more days of the week on the computer were less active, while adults were not statistically impacted. The opposite was true for the reported number of days people exercise in a week. However, the comparable correlation coefficients between youth and adults indicate similar associations. Therefore, a larger youth sample size may have yielded parallel results to the adults. Table 1 – Selected lifestyle factors that have difference associations for youth and adults. Statistically significant results are in bold and underlined Lifestyle Factors
Daily Steps
Peak Perf
Max 60
Max 30
Max 20
Max 5
Max 1
High activity
Med. activity
Low activity
Inactive
Live with Children 5–10 yrs old y: n=6/25 a: n=17/205
y: +1719 (25%) p=0.02 a: +903 (14%) p=0.05
y: +8.42 (16%) p=0.02 a: +0.78 (1.7%) p=0.71
y: +6.45 (24%) p=0.05 a: +0.84 (3.7%) p=0.69
y: +7.11 (21%) p=0.08 a: +1.16 (3.9%) p=0.65
y: +8.14 (20%) p=0.05 a: +0.30 (0.9%) p=0.91
y: +9.19 (17%) p=0.02 a: -0.63 (-1.3%) p=0.79
y: +5.97 (9.5%) p=0.05 a: 0.53 (0.9%) p=0.72
y: +1.16 (36%) p=0.05 a: -0.06 (-2.8%) p=0.88
y: +1.75 (22%) p=0.07 a: +1.07 (14%) p=0.10
y: +0.50 (3.1%) p=0.79 a: +2.40 (12%) p=0.05
y: -3.41 (-4.5%) p=0.18 a: -3.41 (-4.6%) p=0.04
Live with Children ≥16yrs old y: n=11/24 a: n=23/205
y: -1466 (-24%) p=0.02 a: -359 (-6.5%) p=0.36
y: -5.59 (-11%) p=0.08 a: -1.97 (-4.3%) p=0.28
y: -2.99 (-13%) p=0.31 a: -1.59 (-7.2%) p=0.39
y: -4.53 (-14%) p=0.22 a: -0.06 (-0.2%) p=0.97
y: -3.18 (-9.2%) p=0.15 a: -1.93 (-5.7%) p=0.41
y: -6.86 (-13%) p=0.06 a: -2.73 (-5.8%) p=0.17
y: -6.45 (-10%) p=0.02 a: -1.99 (-3.5%) p=0.12
y: -0.45 (-17%) p=0.41 a: -0.33 (-16%) p=0.30
y: -2.34 (-30%) p<0.01 a: -0.09 (-1.3%) p=0.89
y: -3.42 (-20%) p=0.03 a: 0.09 (0.5%) p=0.93
y: +6.20 (7.9%) p<0.01 a: 0.33 (0.4%) p=0.82
Live in the City y: n=13/25 a: n=156/205
y: +1840 (29%) p<0.01 a: +180 (3.3%) p=0.54
y: +8.87 (18%) p<0.01 a: +1.54 (3.4%) p=0.26
y: +6.94 (27%) p=0.01 a: +0.75 (3.4%) p=0.58
y: +8.76 (26%) p=0.01 a: +1.10 (3.7%) p=0.52
y: +9.36 (24%) p=0.01 a: +1.68 (4.9%) p=0.34
y: +9.68 (19%) p<0.01 a: +2.40 (5.0%) p=0.11
y: +7.21 (12%) p<0.01 a: +0.77 (1.35%) p=0.42
y: +1.21 (41%) p=0.01 a: 0.27 (13%) p=0.25
y: +1.66 (22%) p=0.04 a: 0.00 (0.01%) p=1.0
y: +1.50 (9.0%) p=0.35 a: 0.73 (4.25%) p=0.35
y: -4.37 (-5.7%) p=0.04 a: -1.01 (-1.3%) p=0.35
Live in the Suburbs y: n=8/25 a: n=33/205
y: -1465 (-25%) p=0.03 a: -405 (-7.4%) p=0.23
y: -7.95 (-16%) p=0.01 a: -1.30 (-2.8%) p=0.41
y: -5.77 (-24%) p=0.05 a: -1.57 (-7.1%) p=0.32
y: -7.57 (-24%) p=0.04 a: -1.64 (5.6%) p=0.40
y: -7.89 (-22%) p=0.04 a: -1.58 (-4.7%) p=0.44
y: -8.31 (-17%) p=0.03 a: -1.64 (-3.5%) p=0.34
y: -7.15 (-12%) p=0.01 a: -0.17 (-0.3%) p=0.88
y: -1.02 (-38%) p=0.06 a: -0.39 (-18%) p<0.01
y: -1.12 (-16%) p=0.22 a: -0.19 (-2.9%) p=0.69
y: -1.82 (-11%) p=0.28 a: -1.44 (-8.3%) p=0.11
y: +3.96 (5.1%) p=0.08 a: 2.03 (2.7%) p=0.11
Days on Computer y: n=25 a: n=204
y: - r=0.52 p<0.01 a: - r=0.04 p=0.55
y: - r=0.53 p<0.01 a: - r=0.09 p=0.22
y: - r=0.34 p=0.09 a: + r=0.06 p=0.40
y: - r=0.36 p=0.08 a: + r=0.09 p=0.19
y: - r=0.39 p=0.05 a: + r=0.10 p=0.16
y: - r=0.54 p<0.01 a: + r=0.12 p=0.08
y: - r=0.48 p=0.02 a: + r=0.12 p=0.08
y: - r=0.39 p=0.05 a: + r=0.01 p=0.85
y: - r=0.45 p=0.02 a: - r=0.03 p=0.64
y: - r=0.24 p=0.25 a: - r=0.15 p=0.03
y: + r=0.44 p=0.03 a: + r=0.12 p=0.09
Days Exercising y: n=25 a: n=203
y: + r=0.36 p=0.08 a: + r=0.19 p=0.01
y: + r=0.37 p=0.07 a: + r=0.33 p<0.01
y: + r=0.34 p=0.10 a: + r=0.40 p<0.01
y: + r=0.36 p=0.08 a: + r=0.40 p<0.01
y: + r=0.37 p=0.07 a: + r=0.39 p<0.01
y: + r=0.38 p=0.06 a: + r=0.33 p<0.01
y: + r=0.32 p=0.11 a: + r=0.29 p<0.01
y: + r=0.36 p=0.08 a: + r=0.32 p<0.01
y: + r=0.35 p=0.09 a: + r=0.02 p=0.79
y: + r=0.19 p=0.38 a: + r=0.11 p=0.11
y: - r=0.09 p=0.68 a: - r<0.01 p=0.96
Abbreviations: y = youth, a = adult, n = sample size of “yes” responses out of total sample size for the subgroup, + = positive correlation or demonstrating a positive mean difference between “yes” and “no” responses to lifestyle factor, - = negative correlation or a negative mean difference between “yes” and “no” responses to lifestyle factor, (%) = the percent difference between the mean values of the “yes” and “no” responses, r = correlation coefficient, p = p value from the statistic. Discussion: Future research studies aiming to quantify ambulatory activity effects of interventions in youth should also monitor the subject’s sibling age (if any), home neighborhood (city vs. suburb), and number of days a week on a computer. This is because changes in these lifestyle factors could influence ambulatory activity and, therefore, confound results if these factors are unbalanced between control and treatment groups or not controlled in the statistical analysis. In research studies with adults, number of self-reported days exercising per week impacted ambulatory activity.
359

Upper limb kinematic characteristics in children with hemiplegic cerebral palsy and typically developing children Jaspers E1, Feys H1, Bruyninckx H2, Molenaers G3, Harlaar J4, Klingels K1, Desloovere K1,5
1Dept of Rehabilitation Sciences, 2Dept of Mechanical Engineering, 3Dept of Musculoskeletal Sciences, KULeuven, Belgium; 4Research Institute MOVE, University Medical Center, Amsterdam, The Netherlands; 5Clinical Motion Analysis Laboratory, University Hospital Pellenberg, Belgium
Introduction An increasing interest has emerged among researchers and clinicians to use three dimensional movement analysis (3DMA) to gain further insights in the upper limb movement in children with hemiplegic cerebral palsy (CP). Because of the growing need for a standardised protocol, we developed a clinically feasible 3DMA procedure for the objective evaluation of upper limb movements during relevant functional tasks. The kinematic model complies with the ISB recommendations [1]. The reliability of this 3DMA procedure was established in both typically developing (TD) children, as well as in children with hemiplegic CP [2,3]. The ability to discriminate between normal and pathological movement characteristics is also a very important requirement to allow clinical implementation. The aim of this study was therefore to examine the upper limb movement characteristics that differentiate children with hemiplegic CP from TD children.
Clinical Significance This study is a first step to gain further insights in the pathological upper limb movements seen in children with hemiplegic CP. Comparing the performance of these children to TD children will facilitate the identification of compensatory movement strategies and the understanding of the pathological movement patterns. In the long run, these insights will help to define the upper limb treatment strategy.
Methods Ten children with hemiplegic CP and 10 age-matched TD children (controls) participated in the study (5-15 years). Children with hemiplegic CP were excluded in case of previous upper limb surgery or BTX-injections. The movement protocol consisted of 9 tasks: 3 reach tasks in different directions (forwards, upwards, sideways); 3 reach to grasp tasks requiring either forearm pronation or supination; and 3 gross motor tasks (hand to mouth, hand to top of head, hand to contralateral shoulder). Children were seated in a custom made chair that allowed individual adjustment of the sitting position and reaching distance and height. All tasks were executed with the non-preferred (i.e. hemiplegic or non-dominant) arm, at self-selected speed. Seventeen retroreflective markers were placed over the child’s trunk, scapula, humerus, forearm and hand in clusters of 3-4 markers. Anatomical landmarks were palpated and digitised during static trials (CAST) [4]. Marker tracking was done with 12 Vicon-cameras (Oxford Metrics, UK) and data was further processed with BodyMech (MOVE, Amsterdam) and Matlab. Temporal and kinematic parameters at the point of task achievement (PTA) were calculated, i.e. task duration (seconds) and the ROM (degrees) for the scapula, shoulder, elbow and wrist at PTA. These parameters were compared between both groups by means of a t-test. Statistical analysis was done with SAS Enterprise Guide (SAS Institute, Inc., Cary, NC) and significance was set at p < 0.05.
Results Children with hemiplegic CP (7 right, 3 left) had a mean age of 10y 10m (SD ± 3y), ranging from 6y 8m to 15y 2m. Four children were classified as MACS I and 6 as MACS II.
360

TD children had a mean age of 10y 4m (SD ± 3y 2m), which did not differ significantly from the hemiplegic children. Three tasks were analysed for the current study: reach forwards (RF), reach to grasp a vertically oriented cylinder (RGV) and hand to mouth (HTM). Mean and standard deviation (SD) of the parameters for both study groups with concurrent p-values are listed in Table 1. TD children moved significantly faster only during RGV. Children with hemiplegic CP used significantly less elbow extension and more scapular lateral rotation for RF and RGV, and significantly more scapular posterior tilt for RF. Hemiplegic children also showed a significant increase of elbow pronation and wrist flexion for all tasks. No significant differences were found for shoulder elevation, scapular protractions, or wrist ulnar deviation.
Table 1: Mean and standard deviations of task duration (seconds) and joint ROM (degrees) in children with hemiplegic CP (HCP) and TD children (TD), with concurrent p-values
Reach forwards Reach to grasp Hand to mouth HCP TD p HCP TD p HCP TD p Duration 0.96 (0.10) 0.97 (0.20) 0.95 1.33 (0.23) 1.11 (0.17) 0.03 0.96 (0.16) 0.85 (0.19) 0.17 Scapula tilting -4.4 (6.4) 1.2 (5.5) 0.05 -0.4 (6.0) 4.0 (5.0) 0.09 -5.7 (6.2) -5.7 (4.6) 0.98 med-lat rot -28.4 (5.2) -23.2 (5.1) 0.04 -26.5 (6.3) -20.5 (4.8) 0.03 -21.7 (11.7) -14.2 (7.2) 0.10 pro-retr 51.1 (7.9) 47.4 (7.0) 0.27 48.9 (8.2) 46.4 (8.7) 0.51 39.6 (12.6) 33.8 (6.5) 0.21
Shoulder elevation 72.5 (5.9) 78.2 (7.2) 0.07 71.9 (7.6) 76.9 (7.0) 0.14 50.7 (18.5) 40.9 (11.1) 0.17
Elbow fl-ext 63.0 (18.8) 40.6 (14.1) 0.01 65.0 (18.5) 40.5 (10.7) <0.01 145.3 (6.4) 148.3 (3.8) 0.22 pro-sup 140.0 (12.9)127.5 (10.9) 0.03 116.6 (22.3) 87.5 (12.7) <0.01 116.6 (22.3) 77.5 (13.3) <0.01
Wrist fl-ext 26.9 (22.3) 5.3 (4.8) 0.01 11.1 (22.6) -10.3 (11.3) 0.02 30.8 (37.2) 3.4 (7.6) 0.05 uln-rad dev -1.2 (7.0) 3.7 (5.5) 0.10 -2.8 (15.6) 4.7 (8.3) 0.22 -15.9 (10.4) -8.2 (14.6) 0.20
Discussion Task-dependent significant differences were found between both groups for duration and joint ROM of the scapula, elbow and wrist at PTA. No differences were observed for shoulder elevation or wrist ulnar deviation. To further clarify the discriminative ability of the 3DMA procedure, an extensive analysis of the other upper limb tasks is needed, along with the expansion of the movement protocol with tasks that elicit more wrist ulnar-radial deviation or shoulder elevation. Also, apart from the focus on the comparison of discrete joint angles, comparing angular waveforms between hemiplegic and TD children will help to identify and understand the compensatory and pathological movement patterns seen in children with hemiplegic CP.
References [1] Wu G. et al. (2005), J Biomech 38(5):981-992 [2] Jaspers E. et al. (2008), Gait Posture 28(Suppl.2):S76-S77 [3] Jaspers E. et al (2009), Gait Posture 30(Supll.2):S55-S56 [4] Cappozzo A. et al. (1995), Clin Biomech 10(4):171-178
Acknowledgements E. Jaspers received a PhD fellowship of the Research Foundation Flanders - Belgium
361

EFFECTS OF DIFFERENT CRUTCHES AND ARM DOMINANCE ON SHOULDER
JOINT KINETICS
Kunal Singhal, Jeffery B. Casebolt, Moon-Seok Kwon, Elaine Jackson, Young-Hoo Kwon
Texas Woman’s University, Denton, TX, USA
Introduction Injury to the lower extremity is one of the leading causes of hospital admissions in young
adults in the United States [1]. Assistive walking devices (AWDs) reduce the burden on lower
extremity joints by transferring the load to the upper extremities. Axillary (AC) and spring-
loaded crutches (SLC) are two such AWDs often prescribed. A previous study has shown that
while using AWDs, 3-point swing through gait is not symmetrical with respect of load sharing
on the upper body [2]. It has been reported that upper extremity joints are subjected to 44.4%
of body weight during crutch stance [3], it becomes essential to measure the amount of burden
acting on the joint. Thus, in order to use the crutches for long term and minimize injury, it will
be advisable to discover which type of crutch would reduce the burden on the shoulder joint.
As hand dominance plays a big role in ADL [4] it is necessary to analyze its effects on
biomechanics of shoulder joint during a strenuous activity like crutch walking. The purpose of
this study was to determine the effects of hand dominance and crutch type on the shoulder
joint vertical ground reaction force (VGRF), resultant joint moment (RJM) and joint power.
Clinical Significance
A developed understanding of shoulder joint kinetics during crutch walking would be
imperative in the possible reduction or prevention of overuse shoulder injuries.
Methods
Ten healthy adult participants (29.1 ± 9.0 years), with prior experience in crutch walking,
volunteered for the study after IRB approval. Participants were fitted with the crutches of their
height and sufficient practice time was given. Participants were asked to walk in 3-point
swing through gait pattern. 49 retroreflective markers were placed on the body. Ground
reaction forces (GRF) on the feet and crutches were collected using 4 force plates (AMTI OR-
6) while video data were captured from 8 digital camcorders (Panasonic AG-DVC20).
Subsequent marker tracking and processing was done using Kwon3D Motion Analysis Suite
Version 4.1 (Visol, Inc., Seoul, Korea; version XP 4.1). The upper extremity joint moments
were computed through the inverse dynamics procedure using the crutch GRF data and the
motion data. The joint moment data were normalized to the body mass. Peak crutch VGRF,
the peak joint moments and joint power for the dominant and non-dominant shoulder joints
were used as the dependent variables. Repeated measures ANOVA with Bonferroni
correction was applied to test for significance. The significance level was set at α = 0.05 and
all analyses were performed with SPSS for Windows (SPSS Inc., Chicago, IL; version 14.0).
Results
The results show no significant effect of type of crutches and arm dominance on peak VGRF
(Table 1). Peak RJM showed a significant interaction effect of crutch type and arm dominance
(Table 1). Dominant RJM increased by 45% & 36% on spring-loaded and axillary crutches,
362

respectively. There was a significant crutch effect for non-dominant side. Peak eccentric work rate was compared and was significantly decreased between the two sides with non-dominant being reduced by 41.13% (Table 1). Even though there was no significant crutch effect, the dominant side showed 35% and 48% greater peak eccentric work rate as compared to non-dominant side, during axillary and spring-loaded crutch respectively.
VGRF RJM Power
Axillary N-D Shoulder 4.96
(0.31) 0.44
(0.11)§† 36.98
(12.13)§
D Shoulder 5.03
(0.38) 0.69
(0.11)§ 56.47 (8.01)§
SLC N-D Shoulder 5.07
(0.33) 0.38
(0.15) §† 29.89 (7.98)§
D Shoulder 5.17
(0.63) 0.68
(0.15) § 57.14 (9.49)§
Table 1: VGRF, RJM and eccentric power measured for axillary and spring-loaded crutch.
Figure 1: VGRF pattern, a) axillary crutch, b) spring-loaded crutch. Discussion Though the participants were found to take uniform weight on their shoulder joints, the RJMs and eccentric work rate for dominant side for both crutches was significantly greater. This difference was larger on SLC then AC. This shows that even though participants were experienced users, there is a discrepancy in the technique of using crutches. As VGRF was insignificant, moment arms in sagittal plane for RJM were tested for significance and it was found that except for dominant side on both the crutches, moment arm for all other condition was significantly different. Results show that spring-loaded crutches cause greater disparity in load distribution and subsequent muscle work rate between dominant and non-dominant sides. This was confirmed by the participants who found using axillary crutches more stable than spring-loaded crutches. References [1]C.D.C.,2006. [2] Stallard, et al., Acta Orthop Scand 1980; 51:71-7. [3] Goh et al., Pros Orthot Int 1986; 10:89-95 [4] Bagesterio, et al., JNeurop 2002; 88:2408-21.
-1
0
1
2
3
4
5
6
1 9 17 25 33 41 49 57 65 73 81 89 97
(N/Kg)Right , Left ---a)
-1
0
1
2
3
4
5
6
1 9 17 25 33 41 49 57 65 73 81 89 97
(N/Kg) Right , Left ---b)
363

3D motion analysis on daily living activities: implication in neurorehabilitation Úrsula Costa1, Eloy Opisso2, Rodrigo Pérez3, Enrique Gómez3,Josep Medina1
1 Functional Rehabilitation Department, Institut Guttmann, Badalona (Spain) 2 Research Department, Institut Guttmann, Badalona (Spain) 3 GBT department, Universidad Politécnica Madrid, (Spain) Introduction: The upper limb is crucial to perform many daily living activities (DLA) (ej. eating, drinking, or grooming) but its role is not well described in the literature. Twenty years ago, some groups studied the upper limb motion during analytical tasks. [1,2] Functional studies of the upper limb came later and currently are still inconsistent [3,4]. Upper limb 3D motion analysis of DLA can contribute to objective data and new evidence in neurorehabilitation as occurred for gait 3D motion analysis in the 50’s decade. The lack of consistent, internationally validated upper limb protocols hampers the advance on this area. Clinical significance: Current upper limb motion assessements in neurologic population are focused on single-joint kinematics. Moreover, clinical tests are highly dependent on the examiner criteria. Futher development of reliable and valid multi-joint biomechanical evaluations are required, particularly for goal oriented reaching movements [5]. Typically, motion analysis in neurologic population are focused on the use of inertial sensors [6,7] or analytical tasks [8]. Moreover, current models include sacrum or pelvic markers. This might jeopardize the application of these models in neurologic population due to pelvic inestability and lack of trunk control. A new model, derived from Rab [9] was created in order to allow kinematic analysis of the upper limb in a wide neurologic population performing daily live activities. This analysis allow clinicians to take decisions based on objective data. This study focuses on the creation of five normative bands on DLA and the analysis of compensatory mechanisms in healthy subjects. Methods: An optoelectronic video-analysis system with 6 infrared and 2 video camera (BTS Smart-D, Italy) was used to evaluate 42 healthy subjects performing five daily live activities such as taking a bottle from a shelf, drinking from a glass (bilateral), taking a hanger, placing a book on a book-shelf and turning a key to open a door. A sixteen marker model (11 markers for unilateral tasks) was created for this study (see figure 1). Angular parameters for each subject were time wrapped into normative bands. All tasks were divided into transitions between relevant events. Angular and temporospatial parameters of each transition were analyzed. In addition, Pearson correlation between angular and temporo-spatial parameters were calculated. Results:
364

Once the normative bands were calculated, several angular and spatiotemporal parameters were analyzed. Shoulder and elbow flexoextension showed a negative correlation in healthy subjects (p<0.001). Motion velocity showed to be not relevant to explain angular variations during the performance of DLA for our study. At the same time, no relation between motion velocity and object track was observed. Discussion: Compensatory movements between shoulder and elbow flexoextension reveal that are not only present in neurologic population but healthy. Results obtained from motion velocity parameters were not expected, mainly, if we compare to gait analysis, where motion velocity has a large influence on angular parameters. DLA normative bands are scarce, therefore, it would be necessary to have a large internationally validated database of normalized parameters to allow comparison between pathologic and healthy movement patterns. Conclusion: New normative bands were calculated allowing clinicians and researchers to perform kinematic analyis of the upper limb on a safe and easy way. Correlation betweeen the 3D motion results and clinical tests in neurolgic population should be done in the near future. Compensatory mechanisms were observed in healthy subjects, opening bridges for future research on this area. References:
1) Cooper JE, Shweddyk E, Quanbury AO, Miller J, Hildebrand D Elbow joint restriction: effect on functional upper limb motion during performance of three feeding activities. Arch Phys Med Rehabil 1993; 74: 805-809
2) Langrana NA Spatial kinematic analysis of the upper limb using a biplanar videotaping method. Journal of Biomechanical Enginyeering 1981; 103: 11-17
3) Murphy MA, Sunnerhagen K, Johnels Bo, Willén C Three dimensional kinematic motion analysis of a daily activity drinking from a glass: a pilot study. J Neuroeng Rehabil 2006; 3:18
4) Rosen J, Perry J, Mannning N, Burns S, Hannaford B The human arm kinematics and dynamics during daily activities – toward a 7 DOF upper limb powered exoskeleton. Proceedings 12th International Conference on Advanced Robotics 2005 Seattle
5) Mccrea PH, Eng JJ, Hodgson AJ Biomechanics of reaching: clinical implications for individuals with acquired brain injury Disabil Rehabil 2002; 24 (10): 534-541
6) Thies SB, Tresadern PA, Kenney LP, Smith J, Howard D, Goulermas J, Smith C, Rigby J Movement variability in stroke patients and controls performing two upper limb functional tasks: a new assessement methodology J Neuroeng Rehabil 2009; 6: 2
7) Kwon YH, Sun Kim C, Ho Jan S Ipsi-lesional motor deficits in hemiparetic patients with stroke Neurorehabil 2007; 22: 279-286
8) Hingtgen BA, McGuire JR, Wang M, Harris GF Quantification of reaching during stroke rehabilitation using a unique upper extremity kinematic model Proceedings 26th Annual International Conference IEEE EMBS 2004
9) Rab G, Petuskey, Bagley A A method for determination of upper extremity kinematics Gait and Posture 2002;15:113-119
365

NORMATIVE DATA OF KINEMATIC UPPER EXTREMITY TASKS: AGE DEPENDENT CHANGES
Syczewska Malgorzata PhD 1, Krawczyk Maciej, PhD 2, Szczerbik Ewa, MSc1
1 Dept. Padiatric Rehabilitation, The Children’s Mem Hlth Inst., Warsaw, Poland2 Fac. Physiotherpay Acad. Phys. Educ., Inst. Psychiatry & Neurol., Warsaw, Poland
Introduction In various neurological, rheumatoidal and orthopaedic diseases patients experience problems with upper limb movements. These problems could be caused by muscular strength deficiency, degenerative joint and soft tissue changes, and lack or disturbances in motor control. The aim of the treatment process is the restoration or increase the patient’s capacity. In order to assess the patient’s progress and the treatment’s efficacy information about the abilities of healthy people is needed. The aim of this paper is the assessment the upper limb movements in simple tasks in healthy subjects, and to find out if the movement execution depend on the age.
Clinical significance The results of this study could be used as a reference data for patients with various problems affecting upper limb movements.
Methods Twenty eight healthy subjects participated in the study (11 men, 17 women, aged 21 to 65 years old). The neurological, cardiopulmonary, or orthopaedic disorders were the exclusion criteria. Patients were divided into three age groups: first from 21 to 35 years old, second from 36 to 50 years old, and third from 51 to 65 years old. The kinematic data were collected using VICON 460 system. Thirteen markers were placed on the upper extremities: on C7, acromions, elbows, shoulders, wrists and hands [1]. Collected data were transferred to the Visual 3D software. The model of the upper extremities was constructed in the software, based on markers placement and body dimensions. The movements of the distal versus proximal segments were calculated during five simple tasks: - rise of extremities parallel to the floor in frontal plane, straight elbows; - rise of extremities parallel to the floor in sagittal plane, straight elbows; - maximal possible range of elbows flexion in sagittal plane; - supination and pronation of forearms rotation of wrists with free hanging extremities; - extension of wrists with forearms supported on the table. Data were normalised to 100 % of the movement, where 0 % was the beginning of the movement, 100 % was the end of the movement. Kinematic data (angles) were exported from Visual3D as text data and later smoothed (filtered) and averaged in MATLAB, separately for each age group.
Results Fig.1 and fig.2 presents the results of elbow and shoulder joints of the second and third tasks. The results are presented as mean +/- standard deviation for the young (20-35 years old), and old groups (50 – 65 years old).
366

Figure 1. Elbow kinematics during third task in young (A) and old (B) subjects.
Figure 2. Shoulder kinematics during second task in young (A) and old (B) subjects.
Discussion In some of the tasks the range of movement in older subjects is reduced, and there is higher inter-subject variability of this range (higher standard deviation in the group). In some cases (e.g. Fig.2) the task execution is slightly different than in young subjects. Although the subjects were asked to smoothly rise up the limbs and immediately lower them older subjects keep the attained position for some time before lowering the limbs. Some explanation of these results could be the decline of muscular strength which occurs with age [2], partly due to changed muscular architecture, and changes occurring in nervous system [3]. There are probably also other factors, like diminishing elasticity of the soft tissues, increasing response time, etc. References [1] Sibella F et al., (2002) Gait & Posture, 16, S189 [2] Ferreira L et al., (2009) Arch Geront & Geriatrics, 49, 373-377 [3] Chung SG et al., (2005)Arch Phys Med Rehabil, 86, 318-327 Acknowledgement This study was supported by the research grant 404 02732/0521 of Polish Ministry of Science and Higher Education.
A B
A B
367

EVEN POSTERSPoster # Topic Abstract 1st Author2 Case Presentations Posture and Gait Analysis in Ankylosing Spondylitis: A Case Study Silvia Del Din
4 Balance Correlation between Clinical and Laboratory Measures in Chronic Stroke Subjects Zimi Sawacha6 Balance Dynamic Balance in Children with Ataxic CP does not Correlate with either GMFM (D) or
GDITimothy A Niiler
8 Balance The Effects of Auditoy Cues and Task Complexity on Interlimb Coordination and Perception-Action Coupling in Children with Developmental Coordination Disorder
Rong-Ju Cherng
10 Balance Gait Balance Trainer: A Novel Device for Balance Training during Over Ground Walking Andrej Olenaek
12 Balance Postural Assessment in Adolescent Idiopathic Scoliosis Joseph J Krzak14 Balance Reach Performance and Movement Patterns in Young and Older Adults Lin, Sang-I16 Balance Effects of Short-Term Multi-Axial Whole Body Vibration Exercise on Balance
PerformanceChun-Yu Yeh
18 Balance Improvement in Balance-Related Function in Older Adults with High Risk of Falling Sang-I Lin20 Balance Analysis of Static Balance in Elderly Individuals with Different Degrees of Physical
ActivityClaudia Santos Oliveira
22 CP Gait Does Soft Tissue Surgery Influence the Development of Planovalgus Foot Deformity in Young Children with Diplegic Cerebral Palsy?
Nancy Lennon
24 CP Gait Analysis of Trunk Movements during Gait in Children with Cerebral Palsy: Preliminary Results
Heyrman Lieve
26 CP Gait Is the Straight Leg Raise Test a Better Measure of Functional Hamstring Length than the Popliteal Angle Measures?
Rory O'Sullivan
28 CP Gait Effect of Compliant Surface on the Gait of Children with CP Maurizio Petrarca30 CP Gait Knee Contact Forces during Crouch Gait Katherine M. Steele32 CP Gait Emotional State Impacts the Kinematics of Forward Gait in Healthy Young Adults Kelly M. Gamble34 CP Gait Outcome of Single Event Multilevel Surgery in 121 children with Cerebral Palsy using the
Movement Analysis Profile and the Gait Profile ScoreErich Rutz
36 CP Gait Predictors of Excessive Hip Flexion during Gait Patients with Static Encephalopathy Susan Rethlefsen
38 CP Gait Arm and Leg Coordination during Gait in Children with Cerebral Palsy and Typically Developing Children
Meyns
40 CP Gait Arm Movement Symmetry during Walking in Teenagers and Young Adults with Spastic Hemiplegic Cerebral Palsy
Jacques Riad
42 Foot & Ankle Comparison of Plantar Pressure Distribution between Obese and Non-Obese Boys Native Chinese during Normal Walking
Luming Yang
44 Foot & Ankle Does Foot Type affect Foot Function? Andrew Kraszewski46 Foot & Ankle The Effects of Walking with Poles on Plantar Pressures of the Foot. David Hudson48 Foot & Ankle Kinematic and Kynetics Analysis of Flexible Flatfeet in Children during Gait Esteban Pavan50 Foot & Ankle Advantages of Multiple Calibration in Multisegment Foot 3D Kinematics Sawacha Zimi52 Foot & Ankle Does Coupled Hindfoot and Forefoot Motion Lead to Greater Ankle Power Generation
During Single Limb Hopping?Kirsten Tulchin
54 Foot & Ankle Comparison of In-Shoe Plantar Loading During Walking, Heel Raise and Sit-to-Stand Activities
On-Yee Lo
56 Foot & Ankle Biomechanical Analysis of Stepping Up and Down from a Step in Individuals with Ankle Instability: A Pilot Study
Gregory M. Gutierrez
58 Foot & Ankle A New Method for Synchronization of Motion Capture and Plantar Pressure Data Adam Miller60 Muscles And EMG Neurophysiological Aspects and their Relationship to Clinical and Functional Impairment
in Patients with Chronic Obstructive Pulmonary DiseaseJoao Carlos Ferrari Correa
62 Muscles And EMG The Effects of Postural Complexity on Modulation of the Soleus H-reflex Joshua Guggenheimer64 Muscles And EMG Strength Training with Electrical Stimulation- Is this a Viable Method of Facilitating
Independent Mobility and Improving Quality of Life after a Moderate to Severe Stroke?Leanne Claydon
66 Muscles And EMG New Method to Determine Threshold for Muscle Activation during Gait Based on a Bimodal Gaussian Model
Alberto Isaac Perez Sanpablo
68 Outcomes Consecutive Series of Gait Analyses in Patients After Total Ankle Replacement Scott Coleman70 Outcomes The Evaluation of Percutaneous Hamstring Lengthening Outcomes in Children with
Cerebral PalsySylvia Ounpuu
72 Outcomes The Effect of Time on the Waiting List for Total Knee Replacement on Pre-Surgery Knee Range of Motion
Marietta van der Linden
74 Outcomes Gait Patterns following 8-week Exercise Training Programs in Individuals with Transtibial Amputation: A Preliminary Report
Lin, Suh-Jen
76 Pathologic Gait Outcomes following Non-Operative Treatment for Clubfoot: Is There a Relationship between Gait Analysis, the Peabody and the PODCI?
Kelly Jeans
78 Pathologic Gait Effects of Progressive Ankle Equinus on the Ipsilateral Leg during Child Gait Brochard80 Pathologic Gait Gait Analysis in TKR Patients: What's New with Advanced Prosthesis Designs? Maria Grazia Benedetti82 Pathologic Gait The Impact of Speed and Crouch on Stiff Knee Gait in Normal Adults Jennifer Hutchens84 Pathologic Gait Analysis of Self-Selected Walking Velocity and Maximum Velocity in Patients with Upper
Motor Neuron SyndromeAlberto Esquenazi
86 Pathologic Gait Gait Variability Differences in MS patients are not affected by Resistance Training Jeffrey Kaipust88 Pathologic Gait Variability of Lower Extremity Joint Moments during Stair Negotiation in Young and Older
AdultsAlison Novak
90 Pathologic Gait Frequency Analysis of Ground Reaction Forces Shows Differences in Gait in Multiple Sclerosis Patients
Shane Wurdeman
92 Pathologic Gait The Kinematics of Gait in Children with Genu Recurvatum Elzbieta Pretkiewicz-Abacjew
368

EVEN POSTERS
Poster # Topic Abstract 1st Author94 Pathologic Gait Lower-body Temporal-Spatial and Kinematics Responses when Performing a Dual-Task
Experiment: The Effects of Multiple SclerosisSarah R. Dubowsky
96 Pathologic Gait Dynamic Knee Joint Stiffness after Total Knee Arthroplasty Vassilios Vardaxis98 Pathologic Gait Determination of Hip-Hiking Scale Based on Gait Analysis and Physical Therapist
ObservationBarri Schnall
100 Pathologic Gait Longitudinal Section of Lower Extremities in Sagittal View of Patients with Juvenile Idiopathic Arthritis
Kreuzpointner, Florian
102 Pathologic Gait Orthoses Mediated Changes in Hemiplegic Gait Patterns Arvind Ramanujam104 Pathologic Gait Gait Analysis of Aquatic Walking with Additional Weight in People Post-Stroke Ryota Nishiyori106 Pathologic Gait A Biomechanical Comparison Axillary Crutch Swing-Through Gait with and without Touch
DownJeffrey B. Casebolt
108 Prosthetics and Orthotics
Knee Kinematics Measurement on Transfemoral Amputees During Gait in Real-Life Environments using Inertial and Magnetic Measurement Units
Pietro Garofalo
110 Prosthetics and Orthotics
Effect of Novel CAD Designed Pedorthosis for Children with Clubfoot XueCheng Liu
112 Prosthetics and Orthotics
A Study of the Effects of Gel Liner Thickness on In Socket Residual Limb Pressures in Trans-Tibial Prosthesis Users
Rebecca Stine
114 Prosthetics and Orthotics
Ground Reaction Forces in Two Transtibial Amputation Techniques John-David Collins
116 Quality Assurance & Treatment Decision Making
Comparison of Over the Ground and Treadmill Propulsion Patterns of Manual Wheelchair Users with Tetraplegia
Jack R. Engsberg
118 Quality Assurance & Treatment Decision Making
Acceptable Levels of Forceplate Error in Gait Analysis Andrew Lewis
120 Quality Assurance & Treatment Decision Making
Pharmacological Treatment for Intermittent Claudication does not Significantly affect Gait Impairments during Claudition Pain.
Jennifer M Yentes
122 Quality Assurance & Treatment Decision Making
Potential for End-Effector Based Rehabilitation Robotics for the Analysis of Healthy and Pathological Gait
Sami Hussein
124 Simulation and Modeling
Inverse Dynamics-Based Musculoskeletal Models of Rectus Femoris Tendon Transfers Michael Skipper Andersen
126 Simulation and Modeling
Comparison of Electromyography and Joint Moment as Indicators of Co-Contraction Brian A. Knarr
128 Simulation and Modeling
Is the Gait Magnetometer System a Valid Tool for the Measurement of Gait Parameters during Walking?
Alison Clarke
130 Simulation and Modeling
Recognition of Health Problems through the Automatic Gait Analysis Bogdan Pogorelc
132 Simulation and Modeling
Reduction in Push Off Power During Gait in Children with Type I Osteogenesis Imperfecta
Adam Graf
134 Simulation and Modeling
A Method for Gait Analysis using Inertial Sensors Schipper L.
136 Simulation and Modeling
Can the Reliability of Gait Kinematics be Improved by Using Functionally Determined Joint Centers?
Chandra Lloyd
138 Simulation and Modeling
Kinematic Performance of a 6DOF Hand Model for use in Occupational Biomechanics Frank L Buczek Jr
140 Simulation and Modeling
Development of a Kinematic Trunk Model for Routine Clinical Use Joanne Bates
142 Simulation and Modeling
Methodology for Simulating Upper Extremity Functional Activities using Haptic Interfaces Nalini Vishnoi
144 Simulation and Modeling
Markerless Identification of Dissimilarities in Gait Sequences Wallace Lawson
146 Simulation and Modeling
Markerless 3-D Human Motion Capturing Using a Stereo Camera Yoon Hyuk Kim
148 Sports Biomechanics of Rotational Technique Collegiate Shot Putters William P. Hnat150 Sports The Relationship between Spine Rotation and Ball Speed in Adolescent Baseball
PitchersMelany Westwell
152 Sports The Relationship Among Knee Alignment, Knee Function and Strength, and Hopping Performance with Emphasis on Patellar Tendon Length and the Degree of Knee Version after ACL Reconstruction
Wen-Ling Chen
154 Typically Developing Studies
The Effect of Immediate Changes in Body Dimensions on the Walking Pattern of Toddlers between 15 and 36 Months
Van Dam Marleen
156 Typically Developing Studies
Cognitive Demands of Stair Ascent and Descent in Able Bodied Adolescents and Adults Andrew Schepmyer
158 Typically Developing Studies
A Comparison of Lifting Techniques Ioannis Agouris
160 Upper Extremity Novel Crutch System to Assess Upper Extremity Kinetics during Lofstrand Crutch-Assisted Gait
Neha Bhagchandani
162 Upper Extremity Intersegmental Dynamics during Manual Wheelchair Propulsion in Persons with Paraplegia: Influence of Gender and Shoulder Muscle Strength
Sara Mulroy
164 Upper Extremity The Reach of a Mobile Robot Modelled Mathematically to Stabilise Velocity Estimate from Accelerometers: Implications in Stroke Rehabilitation
Nour Shublaq
369

Posture and gait analysis in Ankylosing Spondylitis: A Case Study. Silvia Del Din1, Elena Carraro2, Zimi Sawacha1, Annamaria Guiotto1, Aristide Gravina2, Roberta Guglielmin2, Stefano Masiero2, Claudio Cobelli1
1 Department of Information Engineering, University of Padova, Padova, Italy 2 Department of Rehabilitation Medicine, University of Padova, Padova, Italy
Patient History The participant of this study was a 62 years old man (height 183 cm, weight 81 kg) with Ankylosing Spondylitis (AS). The clinical examination and X-ray based diagnosis revealed an increased kyphosis. At first visit the ankle, knee and hip joints rigidity was assessed. At second visit the patient had been treated with TNF-� inhibitors (infliximab) for three months, but he is not undergoing any rehabilitation treatment. He was referred for evaluation of his gait and posture and muscles timing during gait to assist in treatment planning. Clinical Data Clinical examination findings: Characteristics Before Treatment After TreatmentDuration of Syntoms [years] 10 / Years of disease [years] 7 / BASMI 8 6 Cervical Rotation right/left [degrees] 20/32 28/34 Intermalleoli distance [cm] 31.5 76 Wall-tragus distance [cm] 21 17.5 Schober 15 [cm] 1.5 2 Lateral inclination right/left [cm] 4.5/3 2/3 BASFI 4.4 3.65 BASDAI 4.5 4.3
Gait Data A six cameras BTS motion capture system (60-120 Hz), synchronized with 2 Bertec force plates (FP4060-10), integrated with 2 Imago S.n.c plantar pressure systems (0,64 cm2 resolution, 150Hz) was used to evaluate both posture and gait before treatment (bt) and after 3 months of infliximab (after treatment=at). Posture analysis was performed as [1]. 3D-motion analysis of independent barefoot walking was conducted to assess gait impairments [2]. Posture:Bt: Roemberg test showed increased center of pressure (COP) parameters both in eyes open and closed conditions, when compared with control subjects (CS) values. At: Roemberg test showed an increment in the ellipses area, sway area, total path and total velocity, path and velocity in medio-lateral direction and a reduction in the antero-posterior path and velocity (eyes-open). A reduction of almost each COP parameters was observed in eyes closed condition, while ellipsis and sway area increased. Postural assessment at different eyes-level conditions is shown in figure 1. Gait:Kinematics (bt):
• increased trunk extension • reduced hip flexion • increased knee flexion
An altered inversion-eversion and internal-external right ankle rotation were observed when compared with CS, furthermore no first rocker was observed. Kinetics (bt):
370

• increased hip extensor moment • decreased knee extensor moment • decreased left ankle plantarflexion and external-rotational moment
At: The greatest improvements were observed in hips internal-external rotation angle and relative moment, together with knees flexion range of motion (increased). Furthermore improvements in ankles shock absorption were assessed. So far in agreement with clinical findings the initial rigidity decreased. At bt and at assessment the subject exhibited decreased time and space parameters: stride period 1.03s (bt), 1.02s (at); and increased cadence 0.97 steps/s (bt), 0.98 steps/s (at). EMG analysis (bt) during gait showed markedly altered timing activation: l gluteus medius had prolonged activity during the full gait cycle, while the right one had dominant activity from loading response to initial swing, left and right (l/r) rectus femoris and l tibialis anterior had a delayed activation during midstance, l vastus medialis had a prolonged activation between loading response and initial swing, r vastus medialis had delayed onset with dominant activity from initial swing, r biceps femoris had dominant activity during loading response and initial swing, gastrocnemius medialis had delayed onset and dominant activity during terminal swing. After treatment analysis revealed improvements in the activation patterns of: tibialis anterior, gluteus medius and r biceps femoris. Meanwhile l vastus had early onset activity during midstance, r vastus showed early onset in terminal stance and pre-swing, l gastrocnemius medialis displayed prolonged activity during loading response, while the right one showed dominant activity during loading response. Treatment Decisions and Indications Based on the results after three months of infliximab, we could suggest to improve his gait patterns and posture with a supervised physical therapy together with a home based exercise program especially focused on the lower limb and spine mobility, in addition to the biological treatment. Summary Results demonstrated the important role of instrumental gait analysis as additive to clinical evaluation in understanding postural and gait impairments of AS patient and planning rehabilitation treatments as a support to infliximab therapy.
Figure 1: Posturographic parameters at different eye-levels over the normative bands. [1] Sawacha et al., Gait and Posture: 30(S1), S11-S12, 2009. [2] Sawacha et al., Clinical Biomechanics: 24, 722-728, 2009
371

Correlation between clinical and laboratory measures in chronic stroke subjects
Zimi Sawacha1, Elena Carraro2, Paola Contessa1, Silvia Battistella1 , Annamaria Guiotto1 , Stefano Masiero2, Claudio Cobelli1.
1. Department of Information Engineering, University of Padova, Padova, Italy
2. Department of Medical Surgical Specialty, Orthopaedic Institute-OrthopaedicRehabilitation, University Polyclinic of Padova, Italy
Introduction
Stroke is defined as the interruption of the blood supply to the brain, usually because a blood vessel bursts or is blocked by a clot. This cuts off the supply of oxygen and nutrients, causing damage to the brain tissue and may lead to extremely severe disabilities. The purpose of this study was to verify the relation among clinical and laboratory measures of balance and to investigate their usefulness as means for obtaining reliable feedback on the patient balance limitations.
Clinical significance
Stroke survivors may suffer from paralysis, numbness, difficulties carrying out daily activities, speech loss, vision loss, and many other mobility impairments. Another dangerous consequence of stroke is the loss of stability and balance impairment. So far development of reliable balance measurement tools are pursued.
Methods
Roemberg test was performed on 20 subjects (10 stroke (S) and 10 control (C) subjects) with 1 Bertec force plate (FP4060-10). Subjects mean age and BMI at evaluation were: 69.4 ± 8.2 (S) and 61.6 ± 8.6 (C) years and 25.2 ± 2.5 (S) and 27.3 ± 2.2 kg/m2 (C). The following measures of the centre of pressure (CoP) were computed: Sway area (SA); Ellipse (containing 95% of the data) (E); CoP path, both in the anteroposterior (AP) and in the mediolateral (ML) directions; CoP velocity (CoPv), both in the AP and ML directions [1] (Matlab software). The following clinical balance scales were administered to the S subjects: Tinetti Balance (TB); Berg Balance Test (BAT); Time up and go Test [2]. Comparison between S and C subjects was performed by means of the Student t-test (SPSS Software). The Pearson Correlation coefficient was computed between instrumental and clinical balance parameters (SPSS Software).
Results
Mean balance scales scores of S subjects were respectively: 13.4±3.6 for TB, 45.7±14.5 for BBT, 29.3 seconds for TUG. Moderate to high correlation were found (see Table 1) among CoP parameters and BBT, TUG both in the eyes open and closed conditions. Sway area was correlated only with TUG (see Table 1).
Correlations (eo) Correlations (ec)
372

TB BBT TUG TB BBT TUG
E R 0.08 -0.20 0,18 0,246 -0,24 0,47
p 0,58 0,40 0,32 0,558 0,56 0,24
SA R -0.15 -0.59 0.758* -0,25 -0,69 0,89*
p 0,47 0.09 0.011 0,545 0,06 0,004
CoP R -0.15 -0.25 0,33 -0,37 -0,49 0,50
p 0,47 0,33 0,11 0,361 0,28 0,21
CoP ML R -0.17 0,15 -0.02 -0,42 -0,64 0,69
p 0,45 0,38 0,67 0,299 0,08 0,06
CoP AP R -0.06 -0.74* 0.865* -0,33 -0,33 0,37
p 0,60 0.01 0.001 0,417 0,43 0,36
CoPv R -0.18 -0.43 0.671* -0,316 -0,75* 0,89*
p 0,43 0,146 0.034 0,445 0,03 0,003
CoPv ML R -0.19 0.09 0,09 -0,311 -0,79* 0,93*
p 0,41 0,55 0,50 0,454 0,018 0,001
CoPv AP R -0.10 -0.78* 0.92* -0,321 -0,71* 0,86*
p 0,54 0.01 0.000 0,43 0,04 0,01
Table 1. Correlations analysis in eyes open (eo) and eyes closed (ec) conditions (p<0.05).
Statistically significant differences were found between S and C in all CoP parameters in eo conditions (p<0.04 and p>0.005). Meanwhile in ec conditions significant differences were observed in the CoP path, the CoPv, and both the CoP path and the CoPv in AP direction.
Discussion
Only some of the clinical and instrumental balance assessments were related, indicating that they might measure different aspects of balance. Some balance alterations were related to visual condition. So far a complete balance analysis should be pursued considering both measurements.
References
1. L. Chiari et al. Gait and Posture. 12:225-234, 2000.
2. SL. Patterson et al., Arch Phys Med Rehabil. 88:115-9, 2007.
373

DYNAMIC BALANCE IN CHILDREN WITH ATAXIC CP DOES NOT CORRELATE WITH EITHER GMFM (D) OR GDI
T. Niiler, F. Miller, J. HenleyA.I. duPont Hospital for Children, Wilmington, DE, USA
INTRODUCTIONChildren with ataxic cerebellar palsy (ACP) present as having serious deficits in balance due to large lateral sway, as well as inconsistency in gait. The question of whether such balance issues are correlated with standard measures of normalcy and function such as the Gait Deviation Index (GDI) and Gross Motor Function Measure (GMFM) have yet to be answered. The GDI is a normalized statistic derived from the difference of a subject's net gait cycle deviation of 9 lower body kinematics variables from a normal average. Since knee and hip stiffness are thought to be related to balance problems in ataxic patients [1], it is postulated that the GDI should have some relevance to dynamic balance. There is some evidence that static balance predicts falls under dynamic conditions [2], although others have maintained that static and dynamic balance are maintained via different mechanisms [3][4]. Since the GMFM subtest D is a direct measure of performance in static balance, if dynamic balance is related to static balance in ACP patients, it should correlate to balance indices. Two such balance indices are DN which is a normalized deviation of the center of mass from the line of support indicative of postural sway, and KN which indicates the variation of the COM at a given moment in the gait cycle [5].
CLINICAL SIGNIFICANCEThis study demonstrates that dynamic balance in ACP patients is not related either to static functional measures or to the lower body kinematic deviations of patients from typically developing children.
METHODSA convenience sample of 26 children with ACP between the ages of 2 and 18 years were selected for this retrospective study. All children had been scored on the GMFM subtype D with scores on a 39 point scale ranging from 24 to 37. Kinematic data were used to calculate the balance indices DN and KN and the GDI. For comparison, the mean GDI for typically developing children was calculated from a database of 66 children ranging in age from 2.5 to 18.5 years. Regressions of average left and right leg (sampled over a gait cycle) DN and KN
versus GDI scores and DN and KN versus GMFM (subtype D) scores were computed.
RESULTSCalculated GDIs for the ACP group ranged from 47 to 100. DN values were within the normal range varying from 0.15 to 0.87. However, KN values were significantly below the normal range (0.015-0.059) in line with values found for the CP population at large [6]. No significant regression equation was found which related balance indices to either GDI or GMFM. Although the relationship between KN and GDI borders on being significance (p ~ 0.15), the correlation coefficient is nearly zero indicating little meaningful trend.
374

Table 1: Results of regression analysisBalance Index Normalcy Measure R2 p-value
DN GDI 0.02154 0.23
KN GDI 0.04461 0.15
DN GMFM (D) -0.04348 0.99
KN GMFM (D) -0.04346 0.98
DISCUSSIONAt first glance, the lack of correlation between GDI and either DN or KN is surprising in the context of the work of Küng et al. [1] However, with the exception of the pelvic angles, the GDI is defined unilaterally. It is largely the orientation of the pelvis (and trunk) with respect to the ground that defines posture, and the GDI does not include such information, nor the interaction between the two legs. Therefore, contrary to initial expectations, the GDI does not predict dynamic balance.
The lack of correlation between GMFM (subtest D) results and either DN or KN lends support to the recent studies decoupling static and dynamic balance among both healthy adults [3] and patients with peripheral neuropathies [4]. This is not to say that ACP patients are indistinguishable from their normal counterparts. Comparison of KN between the general CP population including ACP patients and normals shows that there are clear and significant differences in this parameter between groups [6]. The smaller KN compared to normal subjects is thought to indicate a more conservative gait pattern.
CONCLUSIONSRegression analyses of dynamic balance indices versus GMFM (subtest D) indicate that static balance deficiencies in ACP patients do not predict either postural difficulties as indicated by DN or COM variation as indicated by KN. Similarly, depressed GDI values which indicate a large difference in lower body kinematics appear to be unrelated to dynamic balance due to the inability of the GDI to express bilateral body positioning.
REFERENCES[1] U.M. Küng et al. Neuroscience. 159 (1): 390-404.[2] Y. Lajoie, and S.P. Gallagher. Arch. Gerontol. Geriatr. 38 (2004) 11–26[3] C. Hrysomallis et al. (2006) J. Science and Medicine in Sport 9, 288-291.[4] A. Nardone et al. (2006) Gait & Posture. 24, 364-373[5] T. Niiler et al. (2007) (GCMAS) Springfield, MA.[6] T. Niiler et al. (2007) (ESMAC) Athens, Greece.
375

THE EFFECTS OF AUDITOY CUES AND TASK COMPLEXITY ON INTER-LIMB COORDINATION AND PERCEPTION-ACTION COUPLING IN CHILDREN WITH DEVELOPMENTAL COORDINATION DISORDER
Yin-Yao Li1 Rong-Ju Cherng1*
Department of Physical Therapy, National Cheng Kung University, Tainan, Taiwan
IntroductionThe ability of inter-limb coordination and perception-action coupling are
important to acquire complex movements. Children with DCD had deficits in coupling their finger movements to an auditory beat and were less stable in bimanual rhythmic finger movements [1-2]. Limited study has examined the gross motor inter-limb coordination and coordination between limb action and external auditory cues in children with DCD. The aims of the study were to investigate the difference in children with DCD compared to TD children: (1) inter-limb coordination; (2) the effect of task complexity on inter-limb coordination (3) the effect of auditory cues on inter-limb coordination and perception-action coupling.
Clinical significance Children with DCD may take advantage of external cues to stabilize their limb
coordination.
MethodFourteen children with DCD (6.61± 1.02 yeas old, 12 boys, 2 girls) and fourteen
age- and gender-matched TD children participated in the study. Subjects were instructed to perform a task of marching or clapping alone and marching together with clapping in three auditory cue conditions (no cue, cue with preferred clap frequency and cue with preferred step frequency). Two Kistler force plates were used to separately collect force data of right and left foot during marching. Foot contact was identified when the force in z direction exceeded 15 N, and this was onset time of each marching cycle. A modified custom-made cymbal was used in the study to measure the timing issue of clapping. The coefficient of variances (CVs) of action frequency and step-clap phasing value within-trials were used to examine the performance of inter-limb coordination. The mean and CV of perception-action phasing value were adopted as the indicators of perception-action coupling ability (Fig. 1).
Results and Discussion The CVs of action frequency was significantly larger in DCD group than in TD
group (F1,26 = 10.21, p<0.01). The mean of step-clap phasing value was also significantly larger in DCD group than in TD group (F1,26 = 4.584, p<0.05).Significant cue × group interaction effect of the mean of perception-action phasing (F1,26 = 5.03, p<0.05) (Fig. 2) and the CV of perception-action phasing were noted (F1,26 = 5.59, p<0.05) (Fig. 3).
The results of our studies that larger CVs of action frequency in DCD group than in TD group and larger mean of step-clap phasing value in DCD group than in TD group are consistent with the results of previous study that children with DCD were less stable than TD children in an action and in the inter-limb coordination [3]. Our study also showed that TD children were more accurate and less stable than
376

Fig. 1 The identification of step-clap phasing value and perception-action value
c ue�diffe re nc e
ph
ase�
mea
n�(
%)
C ue �diffe renc e
Ph
ase�
cv(%
)
children with DCD in the action-perception phase. This represents that TD children were consistently adapting their action to the auditory cue frequency. TD children tend to couple their limbs in adaptation to the external cue and therefore their accuracy of perception action couple is high but variability is also high. In contrast to TD children, children with DCD reflected poor adaption to a cue with preferred step frequency. These findings suggest that TD children adapted to environmental task better. Children with DCD tend to entrap in an attractor status.
Acknowledgements The study was supported by a grant from the National Science Council, Taiwan. We also thank all the participating children and their family.
References [1] Whitall, J. and N. Getchell. Hum Mov Sci, 1996; 15(1): 129-155. [2] American Psychiatric Association. Diagnostic and Statistical Manual of Mental
Disorders (fourth edition). 1994. [3] Volman, M.J., M.E. Laroy, and M.J. Jongmans. Child Care Health Dev, 2006;
32(6): 693-702.
Fig. 2 The mean of perception-action phasing under preferred step cue and preferred clap cue condition
Fig. 3 The CV of perception-action phasing under preferred step cue and preferred clap cue condition
377

Gait Balance Trainer – A novel device for balance training during over ground walking
Andrej Olenšek, Jakob Oblak, Imre Cikajlo, Primož Novak, Katja Jere, Zlatko Matja�i� University Rehabilitation Institute, Republic of Slovenia
Introduction
In recent years integrating robot supported gait training in the field of neurorehabilitation to restore gait function in patients following stroke, spinal cord injuries and traumatic brain injuries has offered promising complement to conventional physiotherapy. With respect to physically demanding therapist assisted therapy, such devices [1,2] assure controlled training environment, they offer longer training sessions and may be used as instruments to accurately and objectively quantify patients’ performance. In their design they are confined to treadmill training environment and often display less degrees of freedom that are necessary to assure normal gait training. For this reason such training is considered to be more efficient in early stages of gait rehabilitation whereas when patient performance improves training should move from treadmill to over ground walking [3]. This paper presents a novel device for balance training during over ground walking where the range of pelvis movement can be adjusted and the level of constraint can be set to accommodate to patients’ performance level. Clinical Significance
Gait training demands well controlled and interrelated activities in legs, pelvis and trunk. In early stages of gait rehabilitation patients often cannot develop such comprehensive control mechanisms and the effort needed is to demanding. Devices that may offer full or partial bodyweight support (treadmill walking [2]) or constrain the pelvis motion to one plane (Lokomat [1]) on one hand reduce demanded effort level and allow focused motor control training but also impose unnatural gait dynamics. However, when patient's performance improves, unconstrained over ground motion is crucial for developing natural gait dynamics as well as for training and restoring full body balancing, which demands well controlled weight transfer. Methods
Figure 1 shows a prototype of developed gait training device. We upgraded the commercially available standing balance apparatus Balance Trainer (Medica Medizintechnik GmbH) with two motorized wheels and corresponding control scheme to enable gait training with adjustable gait velocity. For safety reasons and to minimize relative pelvic movement a waist girdle that is connected to the trainer is used. A unique spring system of Balance Trainer allows controlled forward and sideway movement of the frame where the level of movement compliance can be adjusted to correspond to patients’ performance level.
Device was tested with a young female patient diagnosed with Myelomeningocele, resulting in paraparesis. Gait training lasted for twelve consecutive days with thirty minute session each day. During training period she was also training according to conventional therapeutic program. Her performance level before and after the treatment was assessed with Berg Balance Scale (BBS) and six-minute walk test.
378

Figure 1. Prototype of a Gait Balance Trainer
Results
BBS test shows considerable improvements from scoring 29 points before the training to scoring 42 points after the training. Similar outcomes are evident in a six-minute walk test where the patient was able to walk 175 meters before the training, whereas after the training she improved to 210 meters. Discussion
Clinical test indicate that the proposed gait training method may have positive effect on faster gait motor control recovery and offers a promising groundwork for further detailed and comprehensive studies. In future the effect of gait rehabilitation with Gait Balance Training will be systematically inspected and assessed independently from conventional training approaches. References [1] Hidler J., Wisman W., Neckel N., Kinematic trajectories while walking within the
Lokomat robotic gait-orthosis, Clinical Biomechanics, 23, 2008, 1251-1259 [2] Veneman J.F., Menger J, Asseldonk E.H.F. van, Helm F.C.T. van der, Kooij H. van
der, Fixating the pelvis in the horizontal plane affects gait characteristics, Gait & Posture, 28, 2008,157-163.
[3] Chang M.D., Shaikh S., Chau T., Effect of treadmill walking on the stride interval dynamics of human gait, Gait & Posture, 30, 2009, 431-435
Acknowledgements
Research and development of Gait Balance Trainer was financially supported by Medica Medizintechnik GmbH, Germany.
379

Postural Assessment in Adolescent Idiopathic Scoliosis J. Krzak, PT¹, A. Graf, MS¹, P.F. Sturm, MD¹, Kim Hammerberg, MD¹, P. Gupta, MD¹, S. Hassani, MS¹, M. Riordan, BA¹, K Zaharski, BA¹, G. Harris, Ph.D¹ ² ¹Shriners Hospital for Children (Chicago) ²Orthopaedic & Rehabilitation Engineering Center (OREC) Marquette University/Medical College of Wisconsin, Milwaukee, IL Purpose: Idiopathic scoliosis is the most common type of spinal deformity in adolescence. Curve type and magnitude have been found to significantly contribute to postural instability in this patient population (Gauchard, et al 2001). The purposes of this study were to: (1) compare center of gravity (COG) asymmetry in subjects with idiopathic scoliosis to a population of typically developing children, (2) assess the impact of posterior spinal fusion on postural asymmetry, and (3) compare computerized measures of COG symmetry to commonly utilized clinical tool for assessing scoliotic severity (Coronal Decompensation and Shoulder Height). Methods: This was a prospective study consisting of 26 patients (21 F, 5 M, mean age 14.2 ±2.1, mean height 150.4 ±28.5, mean weight 59 ±27.6) with severe (Cobb angle greater than 50 º) adolescent idiopathic scoliosis (“Scoliosis Group”). The Scoliosis Group was compared to a group of age-matched controls without history of orthopedic or neurologic disease (“Control Group”). One-year postoperative data from 16 subjects was also collected. The SMART EquiTest® (Neurocom® International, Inc, Clackamas, OR) system was used to measure static standing weight symmetry (% deviated to the right (-) or left (+)) using the Motor Control Test (MCT) assessment protocol. Coronal decompensation was assessed using a plumb line measurement taken from C7 to the gluteal crease (cm). Shoulder height symmetry was measured at the height of the acromio-clavicular (AC) joint on right and left sides, and the difference was recorded (cm). Paired Student’s t-tests were used to compare groups, and correlation coefficients were calculated between computerized testing and the clinical measures. Significance was set at p<0.05. Results: (Table 1) Measurements of weight bearing symmetry indicated that the Scoliosis Group stood asymmetrically to the right as compared to the Control Group (Scoliosis Group: -10.7%, Control Group: -6.8%). Subjects in the Scoliosis Group who deviated to the right demonstrated greater asymmetry than the subjects who deviated to the left (Right: -14%, Left +7.7%). This asymmetry was not observed postoperatively (Preop: -10.7%, Postop: -8.1%). (Fig. 1 and Fig. 2) It was observed that clinical measures of deviation from midline did not correlate well with computerized data (Coronal Decompensation: R2=.082, Shoulder Height: R2=.0042).
380

Weight Symmetry (%BW) vs. Plumb Line Measure (cm)
R2 = 0.082
-4
-2
0
2
4
6
8
-30 -20 -10 0 10 20 30
Weight Symmetry
Plum
b Li
ne
Weight Symmertry vs Shoulder HeightR2 = 0.0042
-3
-2
-1
0
1
2
3
4
5
-40 -30 -20 -10 0 10 20 30
Weight Symmetry
Shou
lder
Hei
ght
Fig. 1 Fig. 2
Table 1: COG Symmetry Comparisons
Weight Symmetry (%BW)
Scoliosis Group (Preop)
-10.7*
Control Group -6.8
Scoliosis Group (L) -14.0†
Scoliosis Group (R) +7.7
Scoliosis Group (Postop)
-8.1**
Discussion: These results demonstrate that adolescents with idiopathic scoliosis stood with asymmetric weightbearing. This standing posture was then impacted by surgical intervention. Findings also demonstrate that there was a poor correlation between commonly used clinical assessment tools used to quantify curve severity and actual computerized measures of weightbearing symmetry. Thus, clinicians should use discretion interpreting these types of data for clinical decision making for children with adolescent idiopathic scoliosis. References: Gauchard GC, Lascombes P, Kuhnast M, Perrin PP. Influence of different types of progressive idiopathic scoliosis on static and dynamic postural control. Spine. 2001;26(9):1052-8.
* Significantly different than Control Group p < 0.05 † Significantly different than Scoliosis Group (R) p < 0.05 ** Significantly different than Preop p < .05
381

Age-related modifications in forward reach movement patterns Lin SI, Liao CF,* Hsu LJ, Wang HC
Department of Physical Therapy, National Cheng Kung University, Tainan, Taiwan Institutes of Allied Health, National Cheng Kung University, Tainan, Taiwan
Introduction. Aging is associated with deteriorations in the functions of many systems of the body which could lead to limitations in functional capacity. Modification of movement patterns is a common strategy for older adults to remain functional independence under their physiological constraints. Forward reaching is a frequently performed activity of daily living. Its performance, typically measured by reach distance, has been found to relate to frailty, higher risk of falling and declined functional capacity in older adults.1-4 However, it is unclear if older adults adopted different reach movement patterns than young adults and how effective such modifications were. The purpose of this study was to determine the movement patterns used during forward reaching and compare the reach distance between young and older adults. Clinical significance. The findings in this study will help to clarify if modifications in reach movement patterns in older adults were successful compensatory strategy and should be encouraged or they were manifestations of functional limitations and should be corrected. Methods. Thirty-three young and 31 older adults participated in this study and were instructed to stand erect, one arm raise to horizontal, and reach forward as far as possible without taking a step for three repetitions. Their reach distance, joint kinematics and center of mass (COM) motion in the sagittal plane was recorded using a motion analysis system. Based upon the hip and ankle joint motion, the reach movement pattern was classified into three strategies, hip, mixed and ankle. Results. For older adults, 80% of the trials showed a hip strategy, with the rest of the trials showing a mixed strategy. For young adults, 20% of the trials showed an ankle strategy, while the rest of the trials showed evenly a hip or mixed strategy. Older adults had significantly greater hip flexion (p=.002), and trends of greater hip posterior displacement, and ankle plantarflexion than young adults. The older adults had significantly smaller forward displacement of the COM (p=.001), but not reach distance (p=.093), than the young adults. Discussion. A hip strategy is characterized by greater hip flexion and posterior displacement of the hip. These movements would restrict the forward advancement of the COM while allowing the arm to reach farther forward. Adopting such a movement pattern during forward reaching has been found in young adults to result in significantly greater reach distance but not greater COM displacement, compared to
382

adopting an ankle strategy.5 Thus, it seems that older adults were capable of adopting a movement pattern that could help to limit balance threat and at the same time maximize task performance. Clinically, such a hip strategy may be instructed to older clients who have limited balance-related functions.
References 1. Duncan PW, Studenski S, Chandler J, Prescott B. Functional reach: predictive
validity in a sample of elderly male veterans. J Gerontol 1992; 47:M93-8. 2. Weiner DK, Duncan PW, Chandler J, Studenski SA: Functional reach: A marker of
physical frailty. J Am Geriatr Soc 1992; 40: 203-7. 3. Smith PS, Hembree JA, Thompson ME: Berg Balace Scale and Functional Reach:
determining the best clinical tool for individuals post acute stroke. Clin Rehab 2004; 18:811-8.
4. Wallmann HW. Comparison of elderly nonfallers and fallers on performance measures of functional reach, sensory organization, and limits of stability. J Gerontol A Biol Sci Med Sci 2001, 56: M580-3.
5. Liao CF, Lin SI. Effect of different movement strategies on forward reach distance. Gait Posture, 2008; 28:16-23.
Acknowledgements The research was supported by a research grant from the National Science Council of Taiwan. (NSC 97-2314-B-006 -003 -MY3)
383

Effects of Short-term Multi-axial Whole Body Vibration Exercise on Balance Performance
1Hsin-Chang Lo, 2Kuen-Horng Tsai, 3Chun-Yu Yeh 1Assistive Technology Laboratory; Department of Product Design, Ming Chuan University, Taiwan. 2Graduate Institute of System Engineering, National University of Tainan, Taiwan. 3School of Physical Therapy, Chung Shan Medical University; Physical Therapy Room, Chung Shan Medical University Hospital, Taiwan. E-mail: [email protected] Introduction
Whole body vibration (WBV) exercise has gained much attention and has been used widely for healthy people [1] and elderly [2]. Most of WBV devices currently available were deliver vibration by two means. One is the vertical displacements on the left and right side of the fulcrum. Another is up and down displacement of the whole plate [3]. However, vibration in our daily living is almost always multi-axis [4]. Few multi-axial whole body vibrators have been used to measure the effects of posture control following short-term vibration exercise. Therefore, the purposes of this study were to (1) understand the effects of the multi-axial whole body vibrator on balance ability and muscle strength of legs, and (2) compare the effects of different amplitudes of vibration exercises. Clinical Significance
Findings from the study will help with understanding the effects of the multi-axial whole body vibrator and provide the better exercise mode for the users. Methods
5 subjects with average age of 20±1.2-year-old (2 females and 3 males) were recruited in this study. Subjects received 5min multi-axial WBV exercise in 3 kinds of amplitudes (2mm, 5mm, and 10mm with 20Hz). The vibration directions included up-down and forth-back to form a non-anatomical plane trajectory (VX300 Vibration Trainer, Strength Master Co. Ltd.). Subjects were instructed to stand on the marked vibration platform. The balance ability and quadriceps muscle strength before and after multi-axial WBV exercise were measured using Smart Balance Master system (NeuroCom International, Inc.) and a hand-held dynamometer (MicroFET2, Hogan Health Industries, Inc.). The subject’s postural stability and limit of stability was used to measure the static and dynamic balance abilities. For the static balance ability, the centre of pressure (COP) excursions was estimated for 60 seconds by quiet standing on the force platform. These excursions reflect lateral movements (sway) in the centre of mass, and thus a higher average excursion in the COP is indicative of poorer postural stability. For the dynamic balance ability, subjects were requested to move the center of gravity following cursor shown on the computer screen as quickly and accurately as
384

-5-3-1135
Chan
ge ra
tio (%
)
cahnge ratio 2.15 1.58 -2.22
10mm 5mm 2mm -100
1020304050
Chan
ge ra
tio (%
)
cahnge ratio 9.83 26.41 5.27
10mm 5mm 2mm
*
*
Figure 1 The change ratio of static balance ability at 3 vibration amplitude.
Figure 2 The change ratio of maximum quadriceps muscle strength at 3 vibration amplitude.
possible for 8 seconds. The reaction time (RT) and maximum excursion (MXE) in four directions were recorded and used to express the dynamic balance ability. Friedman Test was used to compare the change ratios of static and dynamic balance abilities, and change ratio of maximum quadriceps muscle strength (MQS) between each test trial. Results
For the static balance ability, the COP excursions in 2mm reveals significant lower (p<0.05) than those in 5mm and 10 mm (Figure 1). For the dynamic balance stability, the change ratios of RT in posterior and left directions of 5mm significantly decreased than those of 2mm and 10mm (p<0.05). The MXEs after vibration exercise increased than those before exercise no matter what directions or amplitudes, but without significant difference. For the muscle strength, change ratio of MQS had significantly improved (p<0.05) in 5 mm comparing to other two amplitudes (Figure 2).
Discussion The negative change ratio of the COP excursion in 2mm amplitude revealed the COP excursion
was smaller after the vibration exercise. This phenomenon indicated that the static balance ability was improved. The larger vibration amplitude could contrary to influence the static balance ability. However, some change ratios of RT and the MQS in 5mm significantly improved than those in the other amplitudes. This results indicated the 5mm amplitude was the better selection to train the dynamic motor performance. Rererences [1]. Bosco C, Colli R, Introine E, Cardinale M, Tsarpela O, Madella A. Adaptive responses of
human skeletal muscle to vibration exposure. Clin Physiol 1999;19: 83-187. [2]. Rehn B, Lidström J, Skoglund J, Lindström B. Effects on leg muscular performance from
whole-body vibration exercise: a systematic review, Scand J Med Sci Sports 2007;17:2-11. [3]. Cochrane DJ and Stannard SR, Acute whole body vibration training increases vertical jump and
flexibility performance in elite female field hockey players, Br J Sports Med 2005;39:860-865. [4]. Mansfield NJ and S. Maeda, The apparent mass of the seated human exposed to single-axis and
multi-axis whole-body vibration, J Biomech 2007; 40:2543-2551.
385

Improvement in balance-related function in older adults with high risk of falling
Hsu YC1, Lin SI1, Lee HC2, Chang KC3, Tsauo JY4
1. Department of Physical Therapy, National Cheng Kung University, Tainan, Taiwan
2. Department of Physical Therapy and Assistive Technology, National Yang-Ming University, School of Medicine, Taipei, Taiwan
3. Division of Cerebrovascular Diseases, Department of Neurology, Chang Gung Memorial Hospital, Kaohsiung, Taiwan.
4. School and Graduate Institute of Physical Therapy, College of Medicine, National Taiwan University, Taipei, Taiwan
Introduction. Fall and related injuries are a major concern for older adults. Previous studies have shown that the risk of falling is higher for older adults with mobility problems, a history of fall-related injuries or multiple falls, and diseases that involve the central nervous system (Lord et al.,1993 and Sheahan et al.,1995). These high risk individuals are likely to have a greater gain following fall intervention. However, previous studies that examined intervention effect typically focused on general population, fallers, or patients with specific diagnosis. This study aimed to investigate the efficacy of an integrated intervention model on balance-related functions in a group of high risk older adults. Clinical significance. The findings will provide information for the development of balance training programs for older adults with high risk of falling. Methods. One-hundred and eighteen community-dwelling older adults who had mobility problems, a history of fall-related injuries or multiple falls, and diseases that involve the central nervous system participated the study. These subjects went through a battery of sensory, strength, reaction time and balance tests. Subjects were then randomly assigned to either control or experimental group. The former received a 3-month long, twice per week intervention including exercise and balance training, adjustment of medications, and referral to ophthalmologist or other specialists as needed. The latter group received a brochure that contained information about safety precaution, exercises, and home hazards. After the intervention, the subjects went through the assessment again. Repeated measures ANOVA of Time (before and after intervention) and group (was used to determine the intervention effect). Results. There was significant main Time effect (p=.005), but not group main effect or interactions. For both groups of subjects, there were significant reduction in risk score, hand simple reaction time, and postural sway, and increased grip strength after
386

intervention. Discussion. The results show that both groups improved balance-related functions after three months. Thus, the effect of the integrated program was not superior to that of a fall prevention brochure. It is possible that subjects in the control group actually followed the exercises in the brochure and might even perform the exercises more frequently than the intervention group. Further studies are needed to determine if the effect of un-supervised exercise would be as effective as supervised ones. References 1. Lord SR, Ward JA, Williams P, Anstey KJ. An epidemiological study of falls in
older community-dwelling woman: the Randwick falls and fractures study. Australian Journal of Public Health 1993;17:240-5.
2. Sheahan SL, Coons SJ, Robbins CA, Martin SS, Hendricks J, Latimer M. Psychoactive medication, alcohol use, and falls among older adults. Journal of Behavioral Medicine 1995;18:127-40
Acknowledgements The study was supported by a research grant from the Bureau of Health Promotion,
Department of Health, Taiwan, Republic of China [DOH97-HP-1301-3]
387

Analysis of static balance in elderly individuals with different degrees of physical
activity
I P Buzutti¹; RV Costa²; M Kanashiro³, AI Shiguemi4; W Monteiro5, CS Oliveira6
1 Student of Physiotherapy Course, UNINOVE, Brazil; 2 Student of Master’s Program in Rehabilitation Sciences, UNINOVE, Brazil; 3 Student of Master’s Program in Rehabilitation Sciences, UNINOVE, Brazil; 4 Student of Doctoral degree in Biomedical Engineering, UNICASTELO, Brazil; 5 Prof. Ms. of Physiotherapy Course, Anhanguera and FAPI, Brazil 6 Prof. Dr. of Master’s Program in Rehabilitation Sciences, UNINOVE, Brazil;
Support of Conselho Nacional de Pesquisa, Cnpq, Brazil.
388

ABSTRACT
Introduction: Postural oscillations in balance increase with age. Peak posture control
occurs at the end of adolescence and is maintained until approximately 60 years of age.
Physical activity (PA) is of considerable assistance in improving mobility and balance
among elderly individuals. Thus, studies are needed to demonstrate the correlation
between PA and balance in this population.Objectives: The aim of the present study
was to analyze static balance among elderly individuals with different degrees of
physical activity. Methods: The study was carried out at the Reference Center for the
Elderly of the Mandaqui Hospital Complex, Sao Paulo (SP, Brazil). The sample was
made up of 68 elderly individuals (40 women and 28 men) with an average age of 69.44
± 6.4 years. The individuals first responded to a questionnaire on the practice of
physical activity (IPAQ) and were then divided into three groups: sedentary (SG), active
(AG) and very active (VAG). A pressure platform (Fusyo, Medicapteurs) was used for
the assessment of balance, on which the individuals remained in an orthostatic positions
with no base restriction for the feet and with the heels aligned, arms alongside the body
and gaze fixed on a point at a distance of one meter from the height of the glabella. Data
collection was carried out under the condition of eyes open and eyes closed for 30
seconds each and a one-minute interval between readings. Results: There were
significant differences between groups. Higher degrees of PA were correlated to greater
displacement of the center of pressure (COP) on the anterior-posterior (AP) and medial-
lateral (ML) axes as well as a greater total COP area, demonstrating greater postural
oscillation in the VAG in comparison to the other groups (p<0.05). The greatest
difference in COP values on the AP and ML axes occurred between the SG and VAG
(p<0.01). Conclusion: The results of the present study suggest that the degree of
physical activity affects body oscillation, with an increase in PA leading to an increase
in oscillation. A possible explanation for this finding may be the use of the ankle
strategy for the maintenance of orthostatic posture in individuals with a greater degree
of PA rather than the hip strategy normally used by elderly individuals.
Key-words: balance, postural control, elderly, physical activity
389

Does Soft Tissue Surgery Influence the Development of Planovalgus Foot Deformity in Young Children with Diplegic Cerebral Palsy?
Nancy Lennon MS, PT, Brad Albertson†, Chris Church MPT,John Henley PhD, Freeman Miller MD
*A.I. duPont Hospital, Wilmington, DE † University of Rochester, Rochester NY
INTRODUCTIONDeformities of the feet are common in children with spastic cerebral palsy (CP), accounting for 25 to 30% of all surgical procedures preformed on ambulatory children to improve function1. There is some evidence to show the highly variable nature of dynamic foot posture during the early walking years of children with CP, including the natural resolution of early planovalgus foot position in some children 2. To our knowledge, no studies have examined the impact of soft tissue surgery on the development of foot deformities in young children with CP.
CLINICAL SIGNIFICANCEThe purpose of this study was to identify whether differences in the development of planovalgus foot posture exist between children with CP who have early soft tissue surgery vs. those that do not. Such understanding could lead to more effective early interventions for children at risk for later foot deformities. Longitudinal measurements of dynamic foot pressure during early childhood may provide an effective screening mechanism to identify children at risk for later foot deformities.
METHODSData is from a prospective cohort of 48 children with CP currently followed at regular intervals from age three through adolescence in the Gait Lab. Only data from children with bilateral involvement (n=23)was analyzed for this study, as previous results from this cohort revealed significant differences in dynamic foot pressure trends for children with unilateral involvement. Other exclusions included children who had boney footsurgery. Brace wear, Botox, and physical therapy were not controlled. Both right and left sides were included in the analysis. Dynamic foot pressure measurements were collected using the F-Scan measurement system (Boston, MA). Dynamic foot valgus was measured by an index defining the ratio of medial to lateral pressure impulses in the midfoot and forefoot regions. Indices of +/- 25 fall in a normal range with higher positive numbers indicating valgus and higher negatives varus3.
RESULTS Table 1: Descriptive Summary:
N = 46 feet Orthopedic Surgery (20 feet) No Orthopedic Surgery (26 feet)Visit initial final (post-op) initial final
Mean Age (range)
2.9 yrs(26 – 41 mo)
6.8 yrs(72 – 95 mo)
2.8 yrs(26 – 41 mo)
6.8 yrs(62 – 99 mo)
Mean GMFM (D)(range)
32% *5% - 77%
59% †21% - 95%
62% *13% - 90%
81% †26% - 100%
Gender 5 girls 5 boys 3 girls 10 boys* p<.01 surgery vs. no surgery (initial) † p<.01 surgery vs. no surgery (final)
390

Surgeries included gastrocnemius recessions (8), hamstring lengthenings (15), femoral derotation (1), adductor lengthenings (2), and iliopsoas lengthenings (4). One child in the surgery group also had selective dorsal rhizotomy (SDR). Mean age at surgery was 4.3 yrs (range = 34-79 months).
Table 2: Dynamic Foot Pressure Variables and Physical Exam Measurements Orthopedic Surgery (n=20 feet) No Orthopedic Surgery (n=26 feet)
initial final (post-op) initial finalValgus Index 26.0 31.0 26.9 15.5Heel Impulse 1.9* † 18.2 † 13.8* 17.6
Popliteal Angle 54° * 64° 34° * 58°Ankle DF 2° † 9° † 8° 4°
Valgus Index is a dimensionless ratio. Heel impulse is % of total foot pressure * p<.01 surgery initial vs. no surgery initial † p<.01 surgery initial vs. surgery final
Figure 1: Individual changes in valgus index over time - surgery group
Positive values = valgusNegative values = varusMeasurement Intervals = initial/ immediately pre-op/ final
DISCUSSIONResults of this study reveal differences in gross motor skillsbetween children with diplegic CP who undergo early soft tissuesurgery vs. those that do not. Differences in the physical examdata support accepted clinical decision making pathways, with the surgery group having greater contractures at a younger age. Dynamic foot pressure data reveals a positive trend in establishing a plantigrade foot position, with improved heel impulse in the surgery group. Although a trend of persistent foot valgus is seen in the surgery group, and one of resolving valgus is seen in the no surgery group, there was not a statistically significant difference in final dynamic foot valgus measurements between groups. The relationship between motor function and foot posture needs further investigation, as children with greater motor impairment may have less potential to resolve early foot valgus. The individual valgus changes seen in the surgery group illustrate the high variability in foot pressure between and within young children with CP, making it hard to uncover a relationship between early soft tissue surgery and valgus foot deformities.
REFERENCES1. Miller, F (2005) Cerebral Palsy, Springer Publications, 20052. Lennon, N, et al (2008). GCMAS Proceedings 2008: Richmond, VA3. Chang CH, et al (2002). J Pediatr Orthop. 22(6):813-818
-100
-80
-60
-40
-20
0
20
40
60
80
100
391

Analysis of trunk movements during gait in children with cerebral palsy L. Heyrmana, M. Cecchettib, A. Leardinib, H. Feysa, G. Molenaersc, E. Aertbeliënd, K. Deslooverea,e , aDept. of Rehabilitation Sciences (KUL), Leuven, Belgium, bIstituto Ortopedico Rizzoli, Bologna, Italy, cDept. of Paediatric Orthopaedics, University Hospital of Pellenberg, Belgium, dDept. of Mechanical Engineering, KULeuven, Belgium, eClinical Motion Analysis Laboratory (University Hospital Pellenberg), Pellenberg, Belgium Introduction/Clinical significance Children with cerebral palsy (CP) often show impaired trunk control, which influences their gait pattern. Deviated static position of head, shoulders and trunk as well as compensatory head and trunk movements during gait are commonly seen in these patients [1]. Improving trunk control is therefore usually seen as a major goal in physiotherapy. Despite this clinical relevance, research into trunk control in this patient group is scarce. The complexity of the structure of the trunk may account for the reduction as a single rigid segment in the majority of the current protocols for gait analysis [2]. Trunk models that contain more defined segments are mainly addressing clinical questions of a specific patient group rather than usable for more general populations [3]. We therefore developed a model for the objective evaluation of trunk movements during gait in children with CP. The model used in this study defines the head and trunk into five segments (head, thorax, pelvis, shoulder line and spine). These segments are clinically relevant to describe the main problems in trunk control of this patient group. This model can also be applied to a more general population. The aim of this study was to examine the clinical applicability of the trunk model to reveal differences in head and trunk movements between CP children and typically developing (TD) children during gait. Methods Ten children with diplegic CP (mean age 9y11m; range 6y5m – 13y9m) and five TD children (mean age 9y1m; range 5y4m – 11y7m) were included in this study. Trunk markers were placed on bilateral acromion, suprasternal notch, xiphoid process, spinous process of the 7th cervical vertebra (C7), the 2nd, 6th and 10th thoracic vertebrae (T2, T6, T10) and the 1st, 3rd and 5th lumbar vertebrae (L1, L3, L5) and bilateral anterior and posterior superior iliac spines (SISA, SIPS). Head markers were attached by use of a band on the left and right frontal and parietal bone of the head. The standard Plug-in-Gait marker set (Vicon Motion Systems, Oxford, England) was used to define gait cycle events. Each child walked barefoot at a self-selected speed. Three representative trials of a left and right gait cycle and one static trial were analysed. Data collection and processing were performed using an 8 camera VICON system and Workstation software (Oxford Metrics, Oxford, UK). Trunk data were further analysed using Matlab code (Mathworks, USA), developed in cooperation with the ‘Istituto Ortopedico Rizzoli’ in Bologna. The trunk model includes three three-dimension (3D) motion segments (head, thorax and pelvis) and two two-dimension (2D) motion segments (schoulder line and spine). A corresponding coordinate system is defined for each of the 3D-motion segments according to the principles of Grood and Suntay [4]. A Wilcoxon rank-sum test was used to compare the parameter range of motion (ROM) between the two groups. Furthermore, visual inspection was made of the 3D motion patterns in the children with CP and TD children.
392

Results Statistical analysis comparing ROM between the two groups showed a significant difference (p<0.05) for head lateral bending (p=0.025), thorax lateral bending (p=0.03) and pelvic flexion/extension (p=0.04) (see table 1). Analysis of the static trial revealed no remarkable differences in position of the segments. Visual inspection of the continuous plots of the decomposed 3D motion during gait showed several clinically relevant differences between the two groups. TD children showed relatively small ROM and leveled patterns for head and thorax movements in the sagittal and coronal plane. Head, thorax and pelvic movements of CP children showed in the sagittal plane (flexion/extension) an increased ROM, all characterized by a double bump pattern. In the coronal plane, head and thorax movements were characterized by an increase in ROM and a different pattern compared to TD children. In the transverse plane no remarkable differences were found between CP and TD children. Table 1: Median and lower - upper quartile of ROM for children with CP and TD children, with concurrent p-values CP TD p Head flex/ext 13.75 (8.8 - 17.13) 11.31 (10.36 – 11.95) 0.23 lat bend 9.33 (7.59 – 14.23) 4.18 (3.47 – 6.55) 0.025 rotation 9.64 (8.62 – 11.97) 6.69 (6.68 – 6.94) 0.12 Thorax flex/ext 13.32 (8.71 – 15.56) 5.89 (5.56 – 7.06) 0.08 lat bend 18 (15.23 – 23.44) 10 (9.61 – 11.92) 0.03 rotation 14.99 (13.61 – 22.9) 14.85 (13.7 – 16.49) 0.59 Pelvis flex/ext 7.24 (3.93 – 8.8) 3.67 (2.58 – 3.92) 0.04 lat bend 12.18 (10.56 – 13.83) 10.35 (8.88 – 12) 0.22 rotation 15.71 (13.31 – 26.43) 13.36 (10.46 – 15.23) 0.26 Discussion The results of this study show clear differences in ROM and 3D patterns between CP and TD children, supporting the added value of the analysis of trunk movements for clinical reasoning in children with CP. Further in-depth analysis on a larger group of patients will also include kinematics of schoulder line and spine, additional parameters (timing of maximum and minimum position, asymmetry,…) and correlations with lower limb kinematics and muscle strength. References [1] Gage, 2004. The treatment of gait problems in cerebral palsy, Mac Keith Press. [2] Leardini et al., 2009. Clin Biomech 24, 542-550. [3] Ferrarin et al., 2002. Gait Posture 16, 135-148. [4] Grood et al., 1983. J Biomech Eng 105(2), 136-144. Acknowledgements L. Heyrman received a PhD fellowship of the Research Foundation Flanders – Belgium.
393

Is the straight leg raise test a better measure of functional hamstring length than the popliteal angle measures? O’Sullivan R, Fitzgerald D, Kiernan D, Walsh M, O’Brien T. Central Remedial Clinic, Dublin, Ireland. Introduction The popliteal angle is widely used as a clinical means of estimating the hamstring length in cerebral palsy patients. Its relevance as such a measure has been assessed in relation to crouch gait and a significant inverse relationship between the modified popliteal angle and maximum hamstring length has been reported1. However, another study has reported a lack of correlation between static variables such as popliteal angle and dynamic kinematic variables such as knee extension2. In clinical practice it is generally accepted that hamstring tightness results in incomplete knee extension when the hip is in flexion3. The popliteal angle is recorded as the degree of knee extension with the hip flexed to 90o. However, during gait maximal hip flexion typically occurs at initial contact and is significantly less than 90o (approximately 35o). The muscle lengths of biarticular muscles such as the hamstrings depend on the complex interaction of both the angular changes under-gone at both the hip and the knee1. Flexing the hip to 90o during the popliteal angle test may significantly alter how this test relates to hamstring function during gait. While difficulties arise with the straight leg raise (SLR) measure in the presence of fixed knee flexion contracture this measure may offer additional information on hamstring length particularly in relation to functional length during gait. The purpose of this study was to investigate the usefulness of the SLR as a more functional measure of hamstring length. Clinical Significance Surgical decisions to lengthen hamstrings are often made on the basis of both clinical and kinematic data. The correlation between static and dynamic measures has been shown to be poor. The straight leg raise test may offer more insight into the functional length of the hamstring in comparison to the popliteal angle. Methods In a presenting sample of 39 cerebral limbs the SLR was measured in addition to the standard popliteal angle measures (modified, conventional and fast). These measures were then correlated with the following dynamic gait variables- hip ground contact, knee ground contact, mid-stance knee extension, maximal hip flexion, stride length and an estimation of hamstring length at initial contact4. Simple correlations (r-values) were calculated between all static and dynamic measures. Results Table 1 below shows the correlations between four clinical measures of hamstring length and kinematic data.
394

Table 1. Correlation between measures of hamstring length and kinematic data
Hip Ground Contact
Knee Ground Contact
Knee Extension
Mid-Stance
Maximal Hip Flexion
Stride length
Estimation of Hamstring
Length Straight Leg Raise -.110 -.227 -.484* -.181 .161 .003
Popliteal Angle -.170 .155 .426* -.101 -.168 -.278 Modified Popliteal
Angle -.163 .132 .465* -.089 -.124 -.258
Fast Popliteal Angle -.168 .167 .415* -.096 -.196 -.283
*Correlation is significant to p<0.01 level Discussion The correlation co-efficients between the clinical measures of hamstring length and the kinematic variables were all less than 0.5 and most were less than 0.2 which is consistent with previously reported data2
. While less than 0.5, the correlations between all clinical hamstring measures and dynamic knee extension during mid-stance were found to be significant. A previous study found a significant correlation between the modified popliteal angle and both maximal length and excursion of the semi-membranosis1. However, in this study no relationship was found between any of the clinical measures and an estimation of hamstring length at initial contact. The results of this study suggest that the SLR offers no additional information on the length of the hamstrings in comparison the popliteal angle measures. The results again highlight that surgery in cerebral palsy should not be under-taken on the basis of clinical examination alone. References
1 Thompson NS, Baker RJ, Cosgrove AP, Saunders JL, Taylor TC. Relevance of the popliteal angle to hamstring length in cerebral palsy crouch gait. J Pediatr Orthop. 2001 May-Jun;21(3):383-7 2 McMulkin ML, Gulliford JJ, Williamson RV, Major MC, Ferguson RL. Correlation of Static to Dynamic Measures of Lower Extremity Range of Motion in Cerebral Palsy and Control Populations. J Pediatr Orthop. 2000;20(3):366-9 3 Louis ML, Viehweger E, Launay F, Loundou AD, Pomero V, Jacquemier M, Jouve JL, Bollini G. Informative value of the popliteal angle in walking cerebral palsy children. Rev Chir Orthop Reparatrice Appar Mot. 2008; 94(5):443-8 4 Stewart C, Jonkers I, Roberts A. Estimation of hamstring length at initial contact based on kinematic gait data. Gait Posture. 2004;20(1):61-6
395

396

Results
We analyzed unperturbed gait and the stride after the platform perturbation. We analyzed powers and moments during stance. Although it was not statistically significant, when we compared perturbed and unperturbed gait we noticed an increase of moments and powers during the perturbed gait of toe walkers (Fig.1). Heel walkers showed more similar data in comparison of the two conditions (Fig.2). Data also showed a high spread, sign of variability between subjects.
Discussion
The differences between toe walkers and the other participants in the study showed changes of moments and powers during the stride executed after the step on the compliant platform. Toe walkers utilized a vertical conservation strategy exploiting the elastic properties of muscles and tendons. This strategy was characterized by the known repetition of absorption and generation of ankle power phases. During the perturbed stance, this mechanism was unable to work properly because of the compliant terrain. During the subsequent stride, toe walkers tried to overcome this fault enhancing the bump. Compared to toe walkers, heel walkers showed a more adaptive solution that seems not to require recovery after perturbation. Every attempt to modify toe walkers strategy should be anticipated by the study of the available resources on the single subject as indicated by the data spread. This is a preliminary study and it will be necessary to study more subjects and a complete comparison with healthy aged-matched children.
References [1] Crenna P. Neuroscience and Biobehavioral Reviews 1998; 22 (4):571–578. [2] Perry J et al. Arch Phys Med Rehabil 2003; 84: 7-13. [3] Romkes J, Brunner R. Gait & Posture 2007; 26(4):577-86. [4] Fonseca T et al. Physical Therapy 2004; 84 (4): 344-54.
FIG.1••Mean••of••the••maximum••powers••and••moments••peak••••in••six••toe••walker••children••
FIG.2••Mean••data••of••••the••maximum••powers••and••moments••peak••••in••four••heel••walker••children••••
397

Knee contact forces during crouch gait Katherine Steele
1; Matt DeMers
1; Michael H. Schwartz
2; Scott Delp
1
1Stanford University (Stanford, CA);
2Gillette Children’s Specialty Healthcare (St. Paul, MN)
Introduction Crouch gait is a common gait disorder in cerebral palsy characterized by excessive hip and
knee flexion. Over time, walking in a crouched posture can lead to joint pain and can
compromise an individual’s ability to walk independently [1]. A common reason for surgical
intervention in crouch gait is to reduce forces at the knee; however, the magnitude of these
forces and how they change with a more upright posture are unknown. Forces on the tibia
during normal walking are in the range of 2.0-2.5 times body-weight [2,3]. Perry et al.
examined the force at the knee during a flexed-knee stance using a statically loaded cadaver
model, and found increasing tibial contact force for more flexed postures [4]. We would
expect these static forces to increase during gait due to the additional muscle force required to
support and propel the body forward [5]. The purpose of this study was to determine the
magnitude of the tibiofemoral contact force during crouch gait and how it changes with
increasing knee flexion.
Statement of Clinical Significance Understanding the contact forces at the knee during crouch gait can help to identify the origin
of knee pain and cartilage deterioration in individuals with crouch gait, indicate how surgeries
that aim to achieve a more upright posture can prevent knee pain, and serve as a baseline for
treatments to prevent or alleviate knee pain.
Methods Tibiofemoral contact forces were estimated for 3 subjects
who walked with a mild crouch gait (minimum knee flexion
of 20°, age: 8.8 ±0.8 years, height: 1.22 ±0.1 meters, weight:
22.9 ±5.4 kg), 1 subject who walked with a severe crouch
gait (minimum knee flexion of 60°, age: 11.9 years, height:
1.67 meters, weight: 37.9 kg), and 2 speed-matched typically
developing control subjects (age: 8.6 ±2.2 years, weight:
33.6 ±10.6 kg). For each subject, gait data was imported into
OpenSim [6], freely-available biomechancis software. Next
a musculoskeletal model with 19 degrees of freedom and 92
musculotendon actuators was scaled to match the subject’s
size. Muscle forces during gait were estimated using a static
optimziation algorithm that minimized the sum of
activations squared. Tibiofemoral contact forces were
calculated as the vector sum of estimated muscle forces and
intersegmental forces from inverse dynamics. To test the
accuracy of this methodology, knee contact forces were
estimated for a subject with an instrumented total knee
replacement that measured contact force. The estimated joint contact forces had an RMS error
of 0.42 times body-weight and an average error of -0.09 times body-weight when compared to
Figure 1: Scaled OpenSim model
walking in a severe crouch gait.
398

forces measured with the instrumented total knee replacement. Further comparison with the
instrumented total knee replacement is not shown because the experimental data are being
used for a biomechanics prediction competition.
Results The calcualted average maximum tibiofemoral contact force was 2.8 (± 0.4) times body-
weight during normal walking, 3.9 (± 0.6) times body-weight during mild crouch gait, and 6.6
times body-weight during severe crouch gait (Figure 2). Larger knee extensor forces were
required during crouch gait to support the body which contributed to the higher contact forces
(Figure 2).
0
2
4
6
Percent Gait Cycle
Con
tact
For
ce (
xBW
)
20 6040 80 100
Mild Crouch
Severe Crouch
Normal
Figure 2: Tibiofemoral contact forces and maximum quadriceps force over the gait cycle normalized to body-
weight during normal gait (Norm) and mild and severe crouch gait. Standard deviations are shown for the two
typically developing subjects and three mild crouch gait subjects.
Discussion This study demonstrates the dramatic increases in tibiofemoral contact force with increasing
severity of crouch gait. Individuals who walk in a mild crouch gait experience slightly higher
loading of the tibia as compared to unimpaired walking; however, individuals with a severe
crouch gait experience three times the tibiofemoral contact force. These forces are
significantly higher than previously reported static flexed-knee stance forces (1.9 times body-
weight for 20° of knee flexion) which emphasize the higher forces experienced during
dynamic activities. The availability of in vivo force measurements provided confidence that
this methodology could estimate the magnitude and changes in knee contact force during
crouch gait. Future studies using instrumented total knee replacements in “crouch-like” gait
patterns will provide further validation of force estimates and help to refine the methods for
estimating muscle and joint contact forces during crouch gait. The results of this study
provide further evidence that surgical or therapeutic interventions aimed at decreasing knee
flexion are important, not only to improve walking efficiency, but also to decrease joint
loading and prevent joint deterioration.
References
[1] Jahnsen et al. (2004). J Rehabil Med, 36, 78-84. [2] D’Lima et al. (2006). J Arthroplasty,
21, 255-62. [3] Shelburne (2005). Med Sci Sports Exerc, 37, 1948-56. [4] Perry et al. (1975).
JB&JS, 57, 961-967. [5] Lu et al. (1997). J Biomech, 30, 1101-06. [6] Delp et al. (2007).
IEEE Bio-Med Eng, 55, 1940-1950.
Max
Qua
dric
eps
For
ce (
xBW
)
0
2
4
6
Norm Mild Severe
399

Emotional state impacts the kinematics of forward gait in healthy young adults
Kelly M. Gamble, Jessica Joyner, Chris J. Hass, and Christopher M. Janelle
Department of Applied Physiology and Kinesiology, University of Florida, Gainesville, FL,
USA
Introduction
Affective theorists traditionally agree that emotions prime or facilitate action [1]. Specifically,
pleasant emotions motivate behavioral responses to approach pleasant stimuli and situations,
whereas unpleasant withdrawal-related emotions motivate behavioral responses to avoid
unpleasant stimuli and situations [2, 3]. The research examining the impact of emotion on
movement has typically been acquired through protocols evaluating arm movements, facial
expressions, or posture during quiet standing. The influence of emotion on voluntary whole
body movements, such as gait, remains limited. The purpose of the current study was to
determine the impact of pleasant and unpleasant emotions on the kinematics of gait in healthy
young adults. We hypothesized that exposure to pleasant affective stimuli would facilitate
forward gait as evidenced by greater step lengths and velocities relative to unpleasant and neutral
stimuli. We additionally predicted that exposure to unpleasant withdrawal-related stimuli would
hinder forward gait as indexed by reduced step lengths and velocities relative to pleasant and
neutral stimuli.
Clinical Significance
Understanding which emotional states optimize and/or debilitate voluntary gait may have
important implications for individuals with abnormal gait, such as those with Parkinson Disease
(PD), Multiple sclerosis, or suffering from stroke. Gait difficulties are often highly disabling and
interfere with virtually every facet of daily living. Manipulating emotional state may be a novel
and efficacious strategy to improve gait in individuals with gait difficulties (e.g., PD) that is
additive to standard pharmacological interventions.
Methods
Twenty nine healthy young adults (males = 15), free of lower extremity injuries, participated in
this study. Participants completed four practice trials and 20 gait trials. As is common in the
affective sciences, pictures selected from the International Affective Picture System (IAPS) were
used to manipulate emotional states during each gait trial. The IAPS provides standardized
emotional stimuli, and serves as a worldwide measurement standard for the study of emotion [4].
Presented stimuli included 15 digitized photographs including 5 unpleasant (contamination), 5
pleasant (erotica couples), and 5 neutral (neutral faces) pictures. Five trials were completed with
no picture (blank) as a control condition. Pictures were presented on a 3.3 m x 2 m screen
located at the end of a 6 m walkway. Participants were fitted with retro-reflective markers and
stood in a comfortable stance at a designated spot approximately 2 m behind three force
platforms (Bertec, Columbus, Ohio model 4060). Starting positions were personalized so that
the participants hit the force plates in their natural walking pattern. Each trial began with the
presentation of a fixation cross, which signaled to the participants to begin walking at their
normal pace and to continue walking to the end of the walkway. Approximately 1 s prior to
stepping on force platforms, an IAPS picture appeared on the screen. Participants were instructed
to look at the image for the entire time it was on the screen as they were walking. The kinematic
characteristics (i.e., step length and step velocity) of the gait task were sampled while
400

participants walked over the force platforms using a ten-camera Optical Motion Capture System
(Vicon Peak, Oxford, UK).
Results
A one-way multivariate analysis of variance (MANOVA) was conducted to determine the effect
of the affective conditions (pleasant, unpleasant, neutral, blank) on the dependent variables of
length of step 1 and 2, stride length, and velocity of step 1 and 2. The MANOVA revealed a
significant effect of affective condition (p < .001). Follow-up ANOVAs indicated that significant
differences existed for all the dependent variables (p’s < .001), except length of step 1. Post hoc
analyses revealed that the unpleasant condition resulted in significantly 1) reduced stride length
compared to the pleasant and neutral conditions, and 2) reduced length and velocity of the
second step compared to all other conditions (See Figure 1). The pleasant condition resulted in
significantly 1) greater stride length compared to the unpleasant and blank conditions, 2) greater
velocity of step 1 compared to all other conditions, and 3) greater velocity of step 2 compared to
unpleasant and blank conditions (See Figure 1).
Figure 1. Velocity of step 1 (left) and step 2 (right) during each affective condition.
U=unpleasant, P= pleasant, N=neutral, B=Blank.
Discussion
As hypothesized exposure to pleasant emotional pictures facilitated forward gait as evidenced by
faster gait speeds and a longer stride length and step velocity. In contrast, exposure to unpleasant
emotional pictures hindered forward gait as evidenced by shorter and slower steps. These results
permit strong inference that emotional state systematically modulates whole body movement,
such as gait.
Furthermore, our findings support the notion that emotions motivate behavioral responses to
approach pleasant stimuli and avoid unpleasant stimuli and situations (Fridja, 2009, Lang, 1995).
References
1. Niedenthal, P.M. (2007). Embodying emotion. Science, 316, 1002-1005.
2. Frijda, N.H. (2009). Emotion experience and its varieties. Emotion Review, 1, 264-271.
3. Lang, P.J. (1995). The emotion probe. American Psychologist, 30(5), 372-385.
4. Lang, P.J. et al. International affective picture system (IAPS): Instruction manual and affective
ratings Tech Rep. No. A-6). University of Florida, Gainesville, FL.
1090
1095
1100
1105
1110
1115
1120
1125
1130
U P N B
Ve
loci
ty o
f St
ep
1 (
mm
/s)
1070
1075
1080
1085
1090
1095
1100
1105
1110
1115
U P N B
Ve
loci
ty o
f St
ep
2 (
mm
/s)
401

Title: Outcome of single event multilevel surgery in 121 children with cerebral palsy using the Movement Analysis Profile and the Gait Profile Score Authors: Erich Rutz 1, Richard Baker 1,2, Oren Tirosh 1, Elyse Passmore 2, H Kerr Graham 1,2,3
1 Murdoch Childrens Research Institute, The Royal Children’s Hospital, Victoria, Australia 2 Hugh Williamson Gait Laboratory, The Royal Children’s Hospital, Victoria, Australia 3 Orthopaedic Department, The Royal Children’s Hospital, Victoria, Australia
Introduction: The natural history of gait in children with bilateral spastic cerebral palsy (CP) is one of deterioration 1. Single Event Multilevel Surgery (SEMLS) is performed in order to prevent deterioration and to improve gait in patients with bilateral involvement of the lower extremities. This multilevel approach was first described in the 1980’s 2,3. A favourable outcome after SEMLS was described for independent 4-6 and assisted walkers 7,8. The aim of this study is to investigate the short-term outcomes of a large cohort of children with CP using the Movement Analysis Profile 9 (MAP) and the Gait Profile Score 9 (GPS) after SEMLS. The MAP has recently been developed to summarise much of the information contained within the kinematic data arising from 3 dimensional gait analysis (3DGA). The GPS reduces this information further to give a single number that reflects how much a gait pattern deviates from normal. Clinical Significance: Gait problems in children with bilateral spastic CP can be corrected successfully in one major operative session with the SEMLS approach in this large cohort of 121 children. 75% of the patients showed a clinical significant improvement, 22% of the patients showed no change, and only 3% of the patients deteriorated at short-term follow-up reflected by the overall GPS. The improvement of the overall GPS reported represents a reduction of 42% of the difference between pathological and healthy gait patterns. Methods: All 121 diplegic patients with GMFCS level II or III (48 girls/73 boys; mean age 10.7 ± 2.7 years at time of the surgical intervention) who had SEMLS at our hospital between 1995 and 2008 were included in this study. The mean number of surgical procedures per SEMLS session was 7.6 ± 2.1. 80 patients had GMFCS level II and 41 patients had GMFCS level III. All participants had pre- and postoperative 3DGA. From the 3D gait data the MAP and GPS were calculated for all participants. A change of one standard deviation (1.31°) in the overall GPS compared preoperative to postoperative was defined as clinical significant changing. All data were uploaded into Gaitabase 10. The significance level was set at �=0.05. Results: The mean interval between the first gait analysis and surgery was 7.3 ± 6.0 months. The mean follow-up was 1.3 ± 1.0 year. The mean overall GPS preoperative was 15.5° ± 3.9° and the mean overall GPS postoperative was 11.2° ± 2.5°. The change in GPS was 4.3° ± 3.7°. Six patients changed from GMFCS level III to level II after the SEMLS intervention. All the others did not change the GMFCS level. Figure 1 shows the MAP for all patients (left and right side) compared preoperative to postoperative. There is a statistical significant change in the MAP for pelvic obliquity, hip flexion, hip rotation, knee flexion, ankle dorsi-/plantar-flexion, foot progression and the overall GPS compared preoperative to postoperative (see Figure 1).
402

Figure 1 74.4% (n = 90) of the patients showed a clinical significant improvement, 22.3%(n = 27) of the patients showed no change, and only 3.3% (n = 4) of the patients showed a deterioration at short-term follow-up reflected by the GPS (see figure 2). These 4 patients showed improvements in the overall GPS at later follow-up examinations (2x 2 years, 1x 3 years, and 1x 5 years). Figure 2 Discussion:Outcome measurement of surgery in CP is difficult. A change of 1.31° (= 1 SD) in the overall GPS compared preoperative to postoperative was defined as clinical significant changing in this study. The median value of the GPS for healthy children is 5.2°. The improvement reported here thus represents a reduction of 42% of the difference between pathological and healthy gait patterns. Most SEMLS outcome studies report results from small cohorts. Only few reports contain a gait index. Schwartz et al. 4 reported in 2004 an improvement of 21 % using the GGI 11 in a cohort of 93 subjects after orthopaedic surgery. The overall gait pathology was measured by the GGI 11. In our investigation the overall gait pathology was measured by the GPS 9. Our study shows comparable results, but has a number of limitations such as retrospective data analysis and lack of a control group. References: 1. Bell KJ et al., J Pediatr Orthop 2002;22-5:677-82. 2. Norlin R et al., J Pediatr Orthop 1985;5-2:208-11. 3. Browne AO et al., J Pediatr Orthop 1987;7-3:259-61. 4. Schwartz MH et al., J Pediatr Orthop 2004;24-1:45-53. 5. Saraph V et al., J Pediatr Orthop 2005;25-3:263-7. 6. Gough M et al., J Bone Joint Surg Br 2008;90-7:946-51. 7. Ma FY et al., J Bone Joint Surg Br 2006;88-2:248-54. 8. Yngve DA et al., J Pediatr Orthop 2002;22-5:672-6.9. Baker R et al., Gait Posture 2009;30-3:265-9. 10. Tirosh O et al., Gait Posture 2006;24(S2):S52-3. 11. Schutte LM et al., Gait Posture 2000;11-1:25-31.
Acknowledgments: Erich Rutz has been financially supported by the Swiss National Science Foundation (SNF).
403

PREDICTORS OF EXCESSIVE HIP FLEXION DURING GAIT IN PATIENTS WITH STATIC ENCEPHALOPATHY Susan A. Rethlefsen, P.T. 2, Christopher Lening, M.A. 1, Tishya A. L. Wren, Ph.D. 2,3,4, Robert M. Kay, M.D.2,3
1 Georgetown University School of Medicine, 2 Childrens Hospital Los Angeles, 3 Keck School of Medicine, University of Southern California, 4 Biomedical Engineering Department, University of Southern California
Introduction: Excessive hip flexion in gait is commonly thought to be associated with hip flexion contracture, but has also been associated with excessive anterior pelvic tilt, knee flexion, internal hip rotation, and muscular factors.1-4 The purpose of this study was to examine the contributors to excessive hip flexion during gait in children with static encephalopathy, with and without hip flexion contractures. Clinical Significance: Motion analysis data are useful for documenting the natural history of gait patterns in children with static encepalopathy. Knowledge that gait deviations, such as excessive hip flexion, can occur due to factors other than fixed contracture may alter treatment patterns, possibly preventing unnecessary surgery. Methods: A retrospective review of gait studies was conducted for a consecutive sample of patients with static encephalopathy seen at the Motion Analysis Laboratory at the authors’ institution between 2004 and 2006. All patients were included, regardless of presence of hip flexion contracture or excessive hip flexion during gait. Patient age averaged 10.5 ± 3.8 years (range 4.0-23.6). The involved side was studied for hemiplegic patients, and the left side for all others. Eighty-eight patients had undergone one or more procedures affecting the limb under evaluation prior to the gait analysis, and 112 had not.
The kinematic variables examined in this study were maximum hip extension in stance, maximum knee extension in stance, mean pelvic tilt, maximum dorsiflexion in stance, and presence of ‘lever arm dysfunction’. Passive hip extension, popliteal angle, knee extension and dorsiflexion range of motion were examined. Hip extension, knee extension and plantarflexion strength were assessed as well. Patients were also categorized according to prior surgeries performed.
Univariate analysis was performed using simple linear regression for continuous variables and analysis of variance (ANOVA) for categorical variables. Post-hoc tests with a Bonferroni adjustment were included when appropriate. All variables were then included in a stepwise linear regression using forward selection. A Fisher’s exact test was performed to examine the impact of hip flexion contracture on the amount of hip extension achieved in the stance phase of gait. Results: The mean maximum hip extension in stance was –2.0° ± 12.6°, with a range of -44.7° (nearly 45 degrees of dynamic flexion) to +27.1° (a dynamic hyperextension). Univariate analysis demonstrated a statistically significant relationship (p < .05) between excessive hip flexion in stance and all predictive variables except for static dorsiflexion range of motion with the knee flexed (p = 0.46) and maximum dorsiflexion in stance (p = 0.16).
404

405

Arm and Leg Coordination during Gait in Children with Cerebral Palsy and Typically Developing Children
Meyns P MSc1, Van Gestel L MSc2, Massaad F PhD1, Desloovere K PhD2,3, Molenaers G MD PhD3 and Duysens J MD PhD1,4
1Department of Biomedical Kinesiology, Faculty of Kinesiology and Rehabilitation Sciences, KULeuven, Heverlee, Belgium 2Department of Rehabilitation Sciences, Faculty of Kinesiology and Rehabilitation Sciences, KULeuven, Heverlee, Belgium 3Clinical Motion Analysis Laboratory, CERM, University Hospital Leuven, Leuven, Belgium 4Department of Research, Development and Education, Sint Maartenskliniek, Nijmegen, The Netherlands
406

IntroductionArm swing movements are important in human locomotion1. Normal arm swing appears to require little effort but is an integral part of the energy economy of human gait 2. Unfortunately, little is known about the coordination of arm and leg movements during gait in children with Cerebral Palsy (CP). Therefore, in the present study step length and arm swing length during gait was compared between children with CP and typically developing (TD) children. In addition, we studied the effect of walking speed on these variables. Clinical SignificanceTreadmill training is increasingly used in the rehabilitation of gait in children with CP. Some types of training do not allow arm movements and one may wonder whether this is an appropriate strategy. To answer this type of question it is essential to know the role of arm movements during gait in children with CP as compared to TD children. MethodsA total of 26 children with CP (4-12 yr) and 24 TD children (5-12 yr) were included. The CP group included 11 children with hemiplegia and 15 with diplegia, based on the following criteria: ambulant (no walking aids), predominantly spastic type of CP, no Botox A treatment within the past 6 months, no orthopedic surgery and no ataxia. Total body kinematics were recorded using an 8 camera Vicon system with the Plug-in-Gait model. Three trials were assessed for each condition (preferred speed & as fast as possible). To calculate arm swing length, first the finger marker was projected on the sagittal plane. Arm swing length was then determined as the difference of maximum and minimum displacement of the finger marker along the x-axis (corrected for forward motion).�Step length was determined as the distance between contralateral toe to ipsilateral toe along the x-axis. To take into account size differences between children, step length and arm swing were normalized by dividing them by the subjects height. The asymmetry index (AI) was calculated as follows: (Xaffected-Xunaffected)/(maxX)*100. Within subject variability was expressed as coefficient of variation (CV). To compare the different groups for the step length, arm swing length AI and CV, we used a two-way repeated measures analysis of variance (speed always as a factor) and post hoc Tukey’s test. First the CP group was compared to the TD children, then children with hemiplegia were compared with the children with diplegia. ResultsThe three groups (hemiplegia, diplegia, TD) were not significantly different for age (p=0.07) and weight (p=0.09), but were different for height (p=0.03). They did not differ significantly when divided into two groups: CP and TD (age: p=0.7; weight: p=0.2; height: p=0.05). In general, we found that the step length was decreased in CP versus TD (p<0.01) whereas the length of arm swing was similar in both groups (p=0.15) (see Fig. 1). Comparing the two CP groups, children with hemiplegia (mean±SD) (0.43±0.04) had significantly increased step length compared to children with diplegia (0.36±0.07) (p<0.01). The length of arm swing did not differ between the two groups (p=0.5). Children with hemiplegia had significant increased arm swing length on the unaffected side (0.26±0.11) than on the affected side (0.13±0.07) (p<0.01).
407

Fig. 1. Mean values and standard deviations of the normalized step length and arm swing length for children with CP and TD children (averaged for the two conditions) (*:p<0.01)
No significant differences were found in the asymmetry index of the step length (p=0.29) and arm swing length (p=0.17) between children with CP and TD children. Children with diplegia did not show a significant different AI in step length compared to children with hemiplegia (p = 0.11). However, children with hemiplegia (-41.5±38.28) had significantly increased asymmetry in arm swing length than children with diplegia (-7.02±34.77) (p=0.01). Children with CP had more variable step length (0.07±0.05) (p=0.02) and arm swing length (0.3±0.2) (p=0.01) than TD children (step:0.05±0.03; arm:0.23±0.14). However, no differences in variability of step length (p=0.2) and arm swing length (p=0.9) were found between the children with hemiplegia and diplegia. In both children with hemiplegia and diplegia, and in TD children the speed had a significant effect on the step length (p<0.01). For arm swing length, however, speed did not have an effect in the children with CP (hemiplegia: p=0.87; diplegia: p=0.08) while it did have an effect in the TD children (p<0.01). Speed did not significantly influence the CV nor the AI of these measures. DiscussionChildren with CP have smaller step length than TD children whereas their arm swing amplitude is comparable. However, children with CP were found to have more variable step and arm swing length than TD children. Children with hemiplegia have a more asymmetric arm swing length than children with diplegia. The arm swing length on the unaffected side is increased compared to the affected side in children with hemiplegia. Both CP populations are equally variable in their step length and arm swing amplitude. Speed did not influence variability nor asymmetry. More research is needed to further investigate the role of arm movements during gait in children with CP. Mainly mildly affected children with CP (GMFCS I) were included in the current study. Broadening the scope to more severely affected children could yield interesting results. Reference List 1. Zehr EP, Duysens J Regulation of arm and leg movement during human locomotion.
Neuroscientist 2004; 10: 347-361 2. Collins SH, Adamczyk PG, Kuo AD Dynamic arm swinging in human walking. Proc
Biol Sci 2009; 276: 3679-3688 AcknowledgementsThanks to the children and their parents. Supported by grants from KU-Leuven (OT).
408

Arm movement symmetry during walking in teenagers and young adults with spastic hemiplegic cerebral palsy Jacques Riad 1, 2, Scott Coleman 3, Eva Broström 21 Skaraborgs Hospital, Skövde, Sweden, 2 Women´s and Children´s Health, Karolinska Institute Stockholm, Sweden, 3 Baylor University Medical Center Dallas, Texas, USAIntroductionThe typically described arm posturing (AP) in spastic hemiplegic cerebral palsy (CP) consists
of increased shoulder flexion and adduction and of increased elbow and wrist flexion together with forearm pronation. The increased tone in the flexor muscles causes the posturing, which often becomes more pronounced in transitions between different movements. The lack of normal movement on the hemiplegic side is obvious and the asymmetry makes the deviation noticeable. With increasing awareness in adolescents the general appearance becomes more important and the AP can develop into a cosmetic and social impairment. [1] Possible treatment of the AP is not often considered since the focus on treatment is on hand function by the hand surgeon and on the gait performance by the paediatric orthopaedic surgeon. The arm posture during walking in spastic hemiplegic CP is not well investigated. The goal was to develop a measure to quantify deviation in arm posturing with a focus on symmetry of arm movement in ambulatory patients. We wanted specifically to study arm posturing when standing, at gait initiation and during walking in spastic hemiplegic CP.Clinical significanceBy quantifying deviations of arm posturing during walking in hemiplegic CP an objective measurement is obtained and can be used to follow natural progression and treatment.Methods30 patients and 11 controls were studied. Mean age was 17, 8 years (range 13, 1-24, 0 years) for the hemiplegic group 17, 6 (range 13, 1-22, 7 years) in the control group. All were GMFCS 1 and classified as type 1 and 2 in the Winter classification of hemiplegic CP gait. [2, 3] No patient had previous upper extremity surgery or other lower limb surgery than muscle lengthening of the calf muscle.Gait analysis was performed with a Vicon, 8 camera system (Vicon, Oxford England). The patient was first asked to walk at a self selected speed and three trials from each side were collected. Then the patient started walking from standing on a given signal, rendering the gait initiation. The range of motion from shoulder flexion, adduction and elbow flexion and wrist flexion were calculated. The mean of all trials were calculated within each of the 100 frames making up the gait cycle.ResultsThe range of motion with minimum and maximum was calculated. The sum of rang of motion of the shoulder flexion, the shoulder adduction, elbow flexion and wrist flexion on the hemiplegic and non-involved side was calculated and an index describing the arm movement symmetry was obtained by dividing the hemiplegic side with the non-involved side. Two main subgroups were derived. Table 1.
Arm movementsymmetry
Group 1 Group 2 Controls
Mean 0,61 1,4 0,97range 0,44-0,80 0,97-2,56 0,80-1,36
Number 19 11 11Table 1. Arm movement symmetry = hemiplegic side sum of range of motion / non-involved side sum of range of motion.Comparing the range of motion in group 1 with the controls revealed significantly less shoulder and elbow movement in the sagittal plane on the hemiplegic side. The difference was
409

9, 0 degrees (p=0.013) and 7, 1 degrees (p=0,000) respectively. Between group 2 and the controls the differences occurred mainly on the non-involved side with less movement on the non-involved side in shoulder sagittal plane 10,4 degrees (p=0,003) and elbow sagittal plane 10,6 degrees (p=0,020). Additionally in the elbow on the hemiplegic side there was less movement 9,2 degrees compared to the control group, (p=0,045).DiscussionAssessing the shoulder, elbow and wrist movements during walking in hemiplegic CP revealed changes in arm posturing in teenagers and young adults. It has previously been reported that the increased elbow flexion in early childhood spontaneously improves with age. In combination with discouraging results from surgical tendon lengthening the recommendation has therefore been to follow the natural history and not intervene in young age groups. [4] We also found mainly changes in the elbow range of motion in this study of teenagers and young adults and identified two groups. Group 1 with a stiff arm with low range of motion and a clear asymmetry compared to the non-involved side. This group of patients is truly positioning the arm and the abnormal movement pattern is noticeable. Group 2 have a different movement pattern with a significant decreased range of motion in the shoulder and elbow on the non-involved side compared to the control group and also decreased range of motion in the hemiplegic elbow. However the difference between the hemiplegic and non-involved side is mainly in shoulder sagittal movement with less motion on the non-involved side giving the impression the hemiplegic arm is moving more and in a less controlled manner. We interpreted this as an expression of insufficient spasticity to develop the stiff and fixed posture as in group 1 but on the other hand not enough motor control to keep the arm movements within normal range. It is not clear if these two patterns could represent two different types of brain lesions. Comprehensive objective measurement of gait pathology in CP and other neuromuscular diseases has gained in popularity during the last few years. [5, 6] Three-dimensional motion analysis has made this possible and the arm posture assessment contributes to these measurements. ConclusionThe arm posture assessment is a comprehensive objective and dynamic measure on upper extremity deformity that can be used following natural progression and help in evaluating treatment. Possibly the arm posturing assessment can be used in several groups of patients with gait and motion impairment. Further studies are needed.References[1] Wake M, Salmon L, Reddihough D. Health status of Australian children with mild to
severe cerebral palsy: cross-sectional survey using the Child Health Questionnaire. Dev Med Child Neurol. 2003; 45:194-199.
[2] Palisano R. Development and reliability of a system to classify gross motor function in children with cerebral palsy. Developmental Medicine and Child Neurology 39: 214-223, 1997.[3] Winters TF, Jr., Gage JR, and Hicks R. Gait patterns in spastic hemiplegia in children and young adults. J Bone Joint Surg Am 69: 437-441, 1987.[4] Riad J, Coleman, S, Miller F. Arm posturing during walking in children with spastic hemiplegic cerebral palsy. J Pediatr Orthop 2007 Mars:27(2):137-41[5] Michael H Schwartz. The gait deviation index: A new comprehensive index of gait pathology. Gait and Posture 28 (2008) 351-57)[6] Baker, R. The Gait Profile Score and Movement Analysis Profile. Gait and Posture volume 30, Issue 3, October 9; page 265-69.
410

Comparison of Plantar Pressure Distribution between Obese and non-Obese Boys native Chinese during normal walking Luming Yang1, Petr Hlavá�ek1, Xiaohong Sun2, Wuyong Chen3
1 Faculty of Technology, Tomas Bata University, Zlin 760 01, Czech Republic; 2 First People’s Hospital, 264100, Muping, Shandong, China 3 Sichuan University, Chengdu 610065, Sichuan, China Introduction
The problem of childhood obesity in China has grown considerably in recent years. Obesity significantly increases the risk of high blood pressure, heart attacks, strokes, type 2 diabetes, osteoarthritis, gout, and low back pain. The foot is a major part of the skeleton that bears a significant load while standing and walking, some researches [1-2] showed that obese children could generate higher plantar pressures when walking in western societies. However, Hawes
[3] has suggested that the characteristics of foot are typical of ethnic or racial populations, so it is very interesting to know if the Chinese obese children also generate the potential higher pressure, which is possibly contributing to an increased risk of developing foot pathologies during weight-bearing walking. Clinical Significance
This study could be a good reference for the pediatrician and terapeuta in China.
MethodsA total of 10 obese boys (aged 12±1.5 years; BMI 28.9±3.6) and 10 non-obese boys (aged
12±1.1years; BMI 17.8±2.2) in China were recruited. Plantar pressures were collected by EMED system (Novel, Germany). All participants were required to walk barefoot at a self-selected speed, the parameters of peak pressure, maximum force, force-time integrals, pressure-time integrals and contact areas were collected. During analysis five plantar regions were identified: total foot (TO), hind foot (M01), midfoot (M02), forefoot (M03), big toe (M04), and toes 2345 (M05). Only data from the right foot was analyzed, independent samples t-tests were used to compare dynamic variables between two groups. The correlation of body mass index with the parameters was assessed Results
The contact areas were significantly bigger in obese group. The obese group generated a higher maximum force and force-time integrals in all regions compared to their non-obese counterparts and the differences were significant except for the Toe 2345 regions. The peak pressures and pressure-time integrals in obese boys were higher than control group except for the hind foot region (Fig.1.), but the difference was significant in Big toe area. Pearson correlations were performed between BMI and peak pressures for the foot across both groups. A significant positive correlation was found between BMI and peak pressure (TO) (r=0.54, p
411

< 0.01) and a strong significant positive correlation was found between BMI and maximum force (TO) (r=0.886, p < 0.01).
Marked Regions
Peak
Pre
ssur
e/(k
Pa)
obesenon-obese
Fig.1.Comparison of peak pressure between two groups
Discussion Higher peak pressure was found in obese subjects, it was correspond with the previous
research [2]. It is postulated that obese children are at an increased risk of developing foot discomfort and foot pathologies due to increased plantar loads and the increased plantar pressures in the obese foot may hinder obese children from participating in physical activity and it also indicated that the obesity boys suffer a higher risk of health problems. For the obese children, the walking posture could be changed compared to the normal BMI children, which results to the decrease of peak pressure in the hind foot region. This would be used for evaluating the effect of treatment for weight control. The correlation between BMI and peak pressures was not correspond with the adults’ results, BMI played an important part in peak pressures of children.
Reference [1] Dowling, A.M. et al., 2004a. What are the effects of obesity in children on plantar pressure distribution? International Journal of Obesity 28, 1514–1519. [2] Petr Hlavacek, et.al., 2008. Comparison of plantar pressures distribution between obese and non-obese children,Clinical Biomechanics 23, 699. [3] Hawes, M. R., Sovak, D., et al, 1994. Ethnic differences in forefoot shape and the determination of shoe comfort. Ergonomics, 37(1):187-196. Acknowledgement
The author would like to thank Mr. Xia, Mr. Qu and Mr. Yang, thanks for their help and support during the measurement.
412

DOES FOOT TYPE AFFECT FOOT FUNCTION?
A Kraszewski, MS1; B Chow, PT, MS
1; V Patel, BS
1; M Lenhoff, BS
1; S Backus, PT, DPT,
MA1; J Deland, MD
1; P Demp, DPM, PhD
2; J Song, DPM, PhD
2; B Heilman, MS
2; S Rajan,
BS, MS, EdD1; A Woodley, MS
1; J. Frey, BS
1; H Hillstrom, Ph.D
1,2.
1Leon Root, MD, Motion Analysis Laboratory, Hospital for Special Surgery, New York, NY 2Gait Study Center, Temple University School of Podiatric Medicine, Philadelphia, PA
Introduction:
Improved understanding of the pathomechanics that afflict individuals with pes planus (e.g.
hallux valgus, hallux limitus, osteoarthritis, tendonitis, plantar fasciitis, neuroma, posterior
tibial dysfunction, chronic keratomata, collapsing pes valgus, etc.) and pes cavus (e.g.
hammertoes, tailor bunion, metatarsalgia, diabetic neuropathy, etc.) feet is needed.
Individuals with Diabetes that lack sensation may develop limb threatening wounds beneath
their feet in part due to peripheral polyneuropathy and in part due to foot structure. The
specific aim of this project is: to develop a database of measures depicting foot structure and
function during gait for asymptomatic healthy individuals, stratify across foot type (i.e. pes
planus, rectus, and pes cavus), and compare these parameters with a group of patients with
diabetes and hallux valgus.
Clinical Significance: A data set that includes foot types, deformity, and pathology is
needed to provide clinicians with quantitative measures to differentiate foot structures and
their commensurate foot function. It is the investigator’s goal to ultimately develop a model
that incorporates subject specific data and serves as a tool for clinical decision making.
Methods: The investigators hypothesize that patients with diabetes and peripheral
neuropathy who have hallux valgus will have significant differences in structural parameters
(e.g. arch height index) and biomechanical function (e.g. peak plantar pressure) compared
with asymptomatic healthy individuals with pes planus, rectus, and pes cavus foot types.
Asymptomatic healthy test subjects were evaluated at the Leon Root, MD Motion Analysis
Laboratory at the Hospital for Special Surgery (HSS). Enrollment included 61 test subjects
at HSS which were stratified according to resting calcaneal stance position (RCSP) and
forefoot to rearfoot (FF-RF) relationship into pes planus, rectus, and pes cavus sub-groups. In
addition, 20 patients with Diabetes and hallux valgus were evaluated at Temple University
School of Podiatric Medicine with an identical protocol. Measures of foot structure were
acquired including Malleolar Valgus Index (MVI) to document hindfoot alignment and Arch
Height Index (AHI) while sitting and standing.1,2 Foot and lower limb function were
assessed with Center of Pressure Excursion Index (CPEI), step length, stance time, and peak
pressure beneath the load bearing regions of the planter foot. To test the hypothesis each
measure of foot structure and function was evaluated with a univariate mixed effect analysis
of variance (ANOVA). Foot type was considered a fixed effect and replicated trials was
considered a random effect. Significance was set at p< 0.05. For those parameters that did
not have replication (eg. MVI, AHI, etc) hypothesis testing employed a standard one way
fixed effect ANOVA. Post hoc t tests were performed using the Bonferroni method with
significance set at p< 0.0083.
Results: Table 1 summarizes the results from this investigation. The biomechanical
measures of foot structure and function were very sensitive to the asymptomatic individual’s
foot type as well as that of the diabetic patient. Individuals with the pes planus foot type
413

were significantly different in hindfoot alignment (MVI) and center of pressure excursion
index (CPEI) compared with those who were rectus or pes cavus. Note that patients with
diabetes behaved structurally and functionally like asymptomatic individuals with pes planus
feet. AHI decreased from pes cavus to rectus to pes planus as expected and was lowest in the
diabetic patients with hallux valgus. Temporal-distance footfall parameters (step and stride
length) were lowest in rectus feet and highest in pes planus and cavus feet. Hallucial,
metatarsophalangeal (MTP) joint 2, and MTP joint 3 peak pressures were also sensitive to
foot type. Patients with Diabetes and hallux valgus were distinguishable from healthy by 1st
MTPJ dorsiflexion, AHI, walking speed, peak hallucial, 1st, 2
nd, and 5
th MTP joint pressures
and most temporal-distance footfall parameters.
Discussion: Several measures of foot structure and function are sensitive to foot type and the
presence of pedal pathology and deformity. This data may serve as a basis for models to
improve diagnosis and treatment.
References: 1. Song J. JAPMA 2006 January; 86(1):16-23.
2. Zifchock R. Foot & Ankle International 2006 May; 27(5):367-372.
Acknowledgements: NIH 1R03HD053135-01
Table 1: Foot Structure and Function Results
Planus Rectus Cavus Diabetic
ANOVA
(p-value)
Significant
Post-Hoc*
MVI (%) 13.3 (0.8) 7.4 (0.7) 6.7 (1.0) 15.3 (1.2) 0.000 1, 2, 4, 6
AvgCPEI (%) 18.4 (0.9) 22.0 (0.8) 23.7 (1.2) 16.0 (1.4) 0.000 1, 2, 4, 6
RCSP (deg) -6.2 (0.4) -0.77 (0.3) 0.04 (0.5) -4.7 (0.5) 0.000 1, 2, 4, 6
FFRF (deg) 6.5 (0.4) 2.5 (0.4) -1.8(0.6) 12.1 (0.7) 0.000 1, 2, 3, 4, 5, 6
1st MTPJ Df
(deg) 74.5 (1.6) 73.7 (1.5) 78.3 (2.2) 45.2 (2.4) 0.000 4, 5, 6
AHI sitting 0.35 (0.005) 0.38 (0.004) 0.40 (0.006) 0.32 (0.007) 0.000 1, 2, 3, 4, 5, 6
AHI standing 0.34 (0.008) 0.36 (0.007) 0.38 (0.010) 0.29 (0.011) 0.000 1, 2, 4, 5, 6
Step Len (m) 0.688 (0.007) 0.655 (0.006) 0.694 (0.009) 0.518 (0.007) 0.000 2,3,4,5,6
Stride Len (m) 1.374 (0.014) 1.312 (0.012) 1.383 (0.018) 1.031 (0.015) 0.000 2,3,4,5,6
Velocity (m/s) 1.327 (0.018) 1.277 (0.016) 1.312 (0.024) 0.857 (0.02) 0.000 4,5,6
Cadence
(steps/min) 115.8 (1.0) 117.0 (0.9) 113.5 (1.3) 99.1 (1.0) 0.000 4,5,6
Peak Pressure
hallux (N/cm2) 45.2 (1.3) 36.6 (1.2) 28.9 (1.8) 37.4 (1.6) 0.000 1,2,3,6
Peak Pressure
mtp1 (N/cm2) 29.7 (1.8) 35.9 (1.6) 33.6 (2.4) 47.9 (2.1) 0.000 4,5,6
Peak Pressure
mtp2 (N/cm2) 50.6 (1.4) 37.8 (1.2) 38.3 (1.8) 48.9 (1.6) 0.000 1,2,4,6
Peak Pressure
mtp3 (N/cm2) 39.5 (0.9) 34.6 (0.8) 35.4 (1.2) 37.4 (1.0) 0.000 1,2
Peak Pressure
mtp4 (N/cm2) 27.2 (0.8) 26.4 (0.7) 26.5 (1.0) 29 (0.9) 0.093
Peak Pressure
mtp5 (N/cm2) 22.6 (1.5) 24.6 (1.3) 26.4 (1.9) 35.6 (1.7) 0.000 4,5,6
Stance Time(s) 0.617 (0.006) 0.620 (0.005) 0.640 (0.008) 0.756 (0.007) 0.000 4,5,6
*Bonferonni post-hoc significance set if p < 0.0083
1 = Cavus vs. Planus; 2 = Rectus vs. Planus; 3 = Cavus vs. Rectus, 4 = Diabetic vs Rectus; 5 = Diabetic vs
Planus; 6 = Diabetic vs Cavus
414

The effects of walking with poles on plantar pressures of the foot.
David Hudson, PhD, PT
Department of Physical Therapy, Western Carolina University, Cullowhee, NC
Introduction: Walking with poles is gaining popularity for recreation and rehabilitation. The shared load between the upper and lower extremities that occurs when walking with poles has been linked to reductions in several mechanical loads in the lower extremity2, 3. Lower joint loads are likely to result from lower ground forces that produce pressure on the plantar surface of the foot. Elevated plantar pressures have been implicated in the pathogenesis of neurogenic wounds in the feet of people with diabetes; and off-loading regions of high pressure has been recommended as an important part of the treatment plans for those patients1. The purpose of this study was to determine the effect of walking with poles on the pressure that develops on the plantar surface of the forefoot and great toe. Hypothesis: Walking with poles will result
in significant reduction in pressure on the plantar surface of the foot.
Clinical Relevance: Reducing plantar pressures is critical to the medical management of people that either have or at risk to developing neuropathic foot wounds.
Methods: The right lower limbs of ten previously untrained healthy subjects (6 females) were studied while walking with no poles (NP), with poles using a 2-point gait pattern, and with poles using a 3-point gait pattern. Subjects mean age was 27.3 years (23.5 – 43.5) with a body mass index of 23.1 (20.4 – 26.2). The procedures of this study were approved by the institution’s Human Subjects Review Board, all subjects gave their consent to participate and all of their rights were protected. Subjects were provided a pair walking poles one week prior to testing (Swiss Gear, Marysville, Washington). Poles were fitted to the subjects such that the elbow was bent to approximately 90 of flexion with the tip of the pole positioned vertically downward from the hand in a comfortable position anterior and lateral to the ipsilateral 5th toe. Subjects were instructed on two poling techniques and asked to practice until they felt competent with the techniques. For both techniques, the subjects were instructed to use the poles for support and avoid using the poles to push themselves forward. Descriptions of the pole techniques are as follows:
2-point technique: subjects followed the natural reciprocal motion of the arms and legs during gait. At the time the right foot struck the ground, the left elbow was bent to approximately 90 with the pole directed vertically downward. The pole tip was on the ground just lateral to the left shoulder and in-line mediolaterally with the middle of right foot. This was followed by simultaneous advancement of the right pole and left foot.
3-point technique: subjects used the two poles simultaneously with the advancement and weight-bearing of the right lower limb. At the time the right foot struck the ground, the elbows were bent to approximately 90 , the right and left poles were directed vertically downward. The pole tips were positioned slightly wider than shoulder width
415

and in-line mediolaterally with the middle of the right foot. The left foot swung forward while the two poles and right foot were on the ground.
Subjects were studied at a self selected pace that was consistent between the three conditions. A pedobarograph collected pressure data at 66Hz as subjects walked across a 25’ walkway; order of the walking conditions was randomized between subjects (HR Mat, Tekscan, MA). Proprietary software was used to identify and measure the region of maximal and average pressure under the metatarsal heads (PmaxMTH, MTH ) and under the great toe (PmaxToe, Toe). Statistical Analysis: The average of three trial were analyzed using paired t-tests to determine if there were differences in the pressures during the three walking conditions. The MTHs and great toe were considered separate studies; therefore, to account for the multiple comparisons (3 conditions X 2 variables) a Bonferroni correction was made and significance was set at p < 0.008.
Results: The 3-point walking style resulted in a 19% reduction in maximal pressure under the great toe (PmaxToe; p = 0.005) and a 20% reduction in the average pressure over the course of the stance phase in the region where pressure was greatest under the metatarsal heads ( MTH; p < 0.001). Other non-significant reductions in pressure were also found (Table).
Discussion: Walking with poles reduces plantar pressures that have been associated with the development of foot wounds in people with diabetes. Significant reductions in pressure were found using a 3-point technique; however, the reduced pressures that were not statistically significant may still be clinically important. Walking with poles may be useful for managing plantar wounds and may enable people at risk to developing wounds to engage in aerobic activity (walking) which is essential in the overall management of diabetes. While off-loading high pressure is recognized as an important component of managing neuropathic foot wounds, prospective research is needed to determine if the pressure values studied here will help heal or prevent wounds,
References 1. Cavanagh et al. Lancet. 2005.; 2. Fregly et al. J Orthop Res. 2009.; 3. Willson et al. MSSE 2001. Acknowledgemnts Cuddy, T, MPT; Goss, S, MPT; Risher, J, MPT – Graduates of Dept. of PT; Western Carolina University
Summary of findings; pressure values from the 2-point and 3-point styles have been normalized to values when walking without poles.
PmaxToe Toe PmaxMTH MTH
NP 1.0 1.0 1.0 1.0 2-point 0.98 1.02 0.94 0.87a 3-point 0.81c 0.85 0.87b 0.80d a – p = 0.03; b – p = 0.02; c – p = 0.005; d – p < 0.001 NP: walking without poles PmaxToe : region of maximal pressure under the great toe
Toe: average pressure in the region of maximal pressure under the great toe
PmaxMTH : region of maximal pressure under the metatarsal heads
MTH: average pressure in the region of maximal pressure under the metatarsal heads
416

KINEMATIC AND KYNETICS ANALYSIS OF FLEXIBLE FLATFEET IN CHILDREN DURING GAIT
Esteban E. Pavan, Carlo A. Frigo Movement Biomechanics & Motor Control Lab, TBM Lab, Bioengineering Dep., Politecnico di Milano, Italy
INTRODUCTIONAmong the different biomechanical models for the analysis of the foot, main differences regard marker positioning, the definition of anatomical segments and functional axis [1], and these may explain their reduced applicability in clinical gait analysis. In the Heidelberg Foot Measurement Method (HFMM), proposed by Simon and coll. [2], no constraints between foot segments are defined and the segmental motion is estimated considering different angles obtained after projecting twelve couples of axis each on a plane perpendicular to a predefined reference axis. With this method, only kinematic information regarding foot function can be derived. In this work, besides the kinematic study based on the HFMM foot model, a kinetics analysis was also performed to assess the pathological gait of flatfeet children, by performing a comparison between both types of variables obtained in a selected group of patients that had indication for surgical treatment and a control group of healthy subjects.
CLINICAL SIGNIFICANCE Conventional lower limbs protocols used in gait analysis represent the foot as a single rigid body segment and do not consider the relative motion between the different foot segments, providing inadequate information particularly when foot deformities are involved. This limitation is currently felt in the field of surgical treatment of flatfeet in pediatric patients. In this study, the flexible flatfeet in children has been analyzed. This is a deformity that is more often surgically managed and requires a specific analysis of foot kinematic and kinetics to be performed. In this case it has been assessed dynamically by means of a multisegmental model of the foot, demonstrating the sensitivity of the method to identify the main gait alterations and its applicability in clinical gait analysis.
METHODSA group of seven children (aged 12.5±1.9 years) with both feet affected by flexible flatfoot deformity have been included in this experimental study. The criteria for flatfoot was met by functional and radiographic findings. Wearing corrective shoes or inserts did not influence the course of their flatfoot. Four patient’s feet had been previously operated by subtalar arthroereisis performed unilaterally, while the remaining ten feet had indication for the same treatment. The control group was composed by nine normal subjects (aged 27.7±7.9 years) with no known foot abnormalities. Kinematic data of five barefoot strides from each side were collected using SMART-E (BTS, Italy), while the ground reaction forces were simultaneously collected by mean of a force platform (Kistler, Switzerland). Reflective, surface-mounted markers were placed according to the HFMM’s foot model [2] on shank and foot, using the “heel alignment device” to standardize the heel markers positioning. To avoid misleading biases introduced by markers placement the model consistency has been previously tested [3]. Functional angles were computed by using the projection angles method, which consists in obtaining the angle between two axis projected on a plane
417

perpendicular to a previously defined reference axis. Among these angles, the medial arch, the medial arch inclination and the forefoot-ankle supination were expected to be the more sensitive to this alteration. Besides the kinematic variables proposed in [2], a kinetics analysis has been also performed. To this aim, subtalar and tibiotalar moments have been computed, i.e. the moments at the midpoint between calcaneus-scaphoid bones and the ankle center, respectively, about the subtalar and the malleoli axes. The flexibility of the flatfoot deformity has also been confirmed by means of the tip-toe test. Relevant differences among kinematic and kinetics variables have been identified from a comparison with the control data, by means of paired t-test of the time course of each variable during the gait cycle, and the root mean square difference.
RESULTSThe most significant differences were: in the untreated flatfeet group the medial arch was medially inclined (mean±std.dev.: 20.1°, significance level: p<0.01), the forefoot was supinated (7.6°, p<0.01) and abducted in relation to ankle (7.7°, p<0.01), showing significant differences in relation to the control group during the whole gait cycle. Tibiotalar flexion showed a significant reduction in the peak of plantarflexion at initial swing (-4.8°±6.9° vs -12.5°±2.6°, p<0.01). Moments showing significant differences were: at the tibiotalar joint, the eversor moment was reduced during the whole gait cycle, subtalar moment maximum values were reduced for both the dorsiflexor and eversor moments (0.78±0.14 vs 0.99±0.13 Nm/BW and 0.86±0.11 vs 1.08±0.1 Nm/BW, respectively).
DISCUSSION Concerning kinematics, the medial arch inclination, the forefoot supination and the forefoot abduction, which were confirmed to be the most sensitive angles, revealed the expected characteristics of flexible flatfeet, i.e. a reduction in the medial arch height and plantar medial rotation of the talus, and supination and abduction of the forefoot. From the kinetics analysis, differences in the moment patterns were observed that may explain the reduction of the propulsion of the swinging leg, another common characteristic of flatfeet. Relevant patterns of flatfoot gait were more effectively quantified by integrating the analysis of the most sensitive variables of the HFMM with the analysis of relevant moments.
REFERENCES[1] Kaufman KR, Foot Models, First Joint ESMAC-GCMAS Meeting, Amsterdam, 2006 [2] Simon J, Doederlein L, McIntosh AS, Metaxiotis D, Bock HG, Wolf SI, Gait Posture 2006, 23:411-424 [3] Pavan E, Frigo C, Gait Posture 2009, 30S:109
ACKNOWLEDGEMENTS The clinical team of Prof. Portinaro, Humanitas Hospital (IRCCS), Rozzano, Italy, is acknowledged for providing access to selected patients.
418

Advantages of multiple calibration in multisegment foot 3D kinematics
Zimi Sawacha1, Annamaria Guiotto1, Silvia Fantozzi2, Rita Stagni2, Chiara Fassina1, Luca Tersi2, Claudio Cobelli1.
1. Department of Information Engineering, University of Padova, Padova, Italy. 2. Department of Electronics, Computer Sciences and Systems, University of Bologna,
Bologna, Italy.
Introduction
Soft tissue artefacts has been recognized as the most critical source of error in gait analysis data. The purpose of the present work was to describe and assess the performance of the multiple calibration methodology on foot subsegments and ankle joint rotations during gait analysis.
Clinical significance
Many pathologies which affect both the foot segment and the ankle joint requires surgical intervention in their treatment. So far the development of a precise methodology for assessing multisegment foot kinematics alteration which may be used to guide surgical treatments is pursued.
Methods
The 3 dimensional multisegment foot protocol [1] was applied on the same subject first by means of direct skin marker placement and second in a modified version (see Figure 1) which entails calibrating each anatomical landmark with respect to a local cluster of marker. Multiple calibration was performed [2] in three different positions: maximum passive dorsiflexion, maximum passive plantarflexion, neutral position [1]. The multiple calibration procedure was performed by two physicians in order to test the repeatability of the technique. Six cameras BTS Sr.l. motion capture system (60-120 Hz) synchronized with 2 Bertec force plates (FP4060-10) were used. Four walking trials were acquired and a static acquisition was also performed. Anatomical reference systems were computed and joint angles estimated as in [1] and by means of calibrating the position of each anatomical landmark applying both single [2] and multiple calibration [3] using ankle DP angle as control variable. The same experiment was performed with the synchronous acquisition of stereophotogrammetry and fluoroscopy (see figure 1e). The 3D geometric bone model of the foot was reconstructed from MRI images and Simpleware software. The 2D fluoroscopic images and 3D geometric model of the foot have being processed based on a standard 3D fluoroscopic analysis approach [4] for the reconstruction of the 3D kinematics of the bony segments of the foot.
Results
3Dimensional foot subsegment angles have been determined with the original model [1], by means of the single calibration approach and by means of the multiple calibration one. In Table 1 results of the comparison among the methodologies have been reported with respect to subsegments’ angles. Mean and SD values of each subsegments’ angle were evaluated,
419

together with intra class correlation coefficient (Icc): intrasubject (each subsegment angle evaluated during three different walking trials, either applying the multiple calibration executed by one of the two operator (Icc=0.98) or determined with the original model [1] (Icc=0.98) ), intermethods (comparison between each subsegments angle evaluated respectively by means of multiple calibration and original method) and interoperator (each subsegment angle evaluated applying the calibration performed from each of the two operator (Icc=0.77) ).
Fig. 1: The two versions of the protocol: during multiple calibration (a,b,c), with technical cluster and in its original version [1] (d) and during fluoroscopy (e).
Tab. 1: Mean and SD values of each subsegments’ angle evaluated in the original model method (OM) and in 2 operators’ calibration (op1 and op2), together with intra class correlation coefficient between the 2 methods.
Discussion
Multiple calibration has been demonstrated to be an important tool for the compensation of soft tissue artifact on knee rotations and translations evaluation [2]. In the present work this has been successfully extended to both the ankle joint and foot subsegments 3 dimensional kinematics.
References
1. Sawacha Z. et al., Journal of NeuroEngineering and Rehabilitation, 2009. 2. Cappello A. et al., IEEE-TBE, 2005. 3. Cappozzo A. et al. JB, 1995. 4. Zuffi S. et al, IEEE-TBMI, 1999.
OM [1] [mean±SD]
op1 [mean±SD]
op 2 [mean±SD]
Icc op2-OM
hf dp 22.2°±4.55° 23.2°±4.9° 22.9°±4.8°hp aa 6.9°±1.9° 11.6°±1.0° 5.9°±1.4° 0.98 hf ie -3.9°±0.8° -1.9°±1.9° -7.3°±2.0°mf dp 25.2°±2.9° 25.4°±2.8° 19.9°±2.6°mf aa 19.6°±0.5° 11.5°±1.7° 18.9°±1.9° 0.96 mf ie -6.3°±1.1° 6.8°±0.6° -0.4°±0.6°ff df 6.8°±6.6° 1.9°±2.9° -7.6°±2.7°ff aa -18.8°±2.7° -22.3°±1.6° -15.6°±1.6° 0.84 ff ie 14.1°±1.9° -4.1°±0.9° 9.5°±0.5°
420

DOES COUPLED HINDFOOT AND FOREFOOT MOTION LEAD TO GREATER ANKLE POWER GENERATION DURING SINGLE LIMB HOPPING?
Kirsten Tulchin, MS and Michael Orendurff, MS Texas Scottish Rite Hospital for Children, Dallas, TX, USA
Introduction Walking at a self-selected speed may not elicit functional deficits in patients with mild foot pathology. Tasks such as toe raises and single limb standing and hopping are straightforward tests that physicians and health professionals can use to assess a patient’s balance and function in the clinic. Quantitatively assessing the inter-segmental foot mechanics during these tasks may provide insight into future disease progression, and can be used to evaluate outcomes following treatment. Previous work has investigated the differences in hindfoot and forefoot coupling between walking and single limb hopping. [1] Therefore, it is anticipated that a strong coupling during the push-off phase of hopping will lead to increased ankle power, as the hindfoot and forefoot work together to form a rigid level for push-off. However it is unclear whether the “pre-positioning” of the foot and ankle during the countermovement phase would also significantly influence ankle power generation. The purpose of this study was to determine the relationship between inter-segment foot coupling and ankle power generation during single limb hopping. Clinical Significance The evaluation of tasks such as single limb hopping can provide insight into the functional strength, neural control and interaction between various foot segments. Quantification of segmental coupling may identify biomechanical deficits that are not elicited during self-selected walking, and provides an novel method of determining outcomes following treatment. Methods Nine healthy adult subjects were tested through this IRB-approved study. Each subject underwent standing AP and lateral radiographs of the feet to confirm normal anatomy. Instrumented lower extremity (Plug-in-Gait, VICON, Denver, CO) and multi-segment foot kinematics (custom model, Bodybuilder for Biomechanics, VICON, Denver, CO) were measured as each subject performed five consecutive single limb hops on each foot. For this initial data analysis, a single side and single trial were selected for each subject. Correlation coefficients (termed coupling coefficients – CC) between sagittal plane hindfoot and forefoot motions during the countermovement (CM: defined from initial contact to the point of minimum vertical displacement of the center of mass) and push-off (from end of CM phase to toe-off) phases were determined for each subject. The relationship between the CC and the peak ankle power generation during hopping were examined across all subjects.
421

Results Radiographs revealed normal hindfoot and forefoot bony anatomy in all subjects. During the countermovement phase, the mean CC between hindfoot and forefoot motion was 0.98 ± 0.02 (range: 0.94 to 0.99). The mean CC between hindfoot and forefoot motion during the push-off phase was 0.95 ± 0.14 (range: 0.58 to 0.99). Peak ankle power generation was more closely related to the CC during the push-off phase (r = 0.56) than to the countermovement phase (r = 0.13). Figure 1: Hindfoot and Forefoot coupling patterns for each of the 9 subjects during the Countermovement and Push-off Phases. Arrows indicate the direction of progression along each subject’s motion pattern.
Discussion Analysis of single limb hopping in this small cohort of adults with normal foot anatomy demonstrated that while the coupling between hindfoot and forefoot motion was greater during the countermovement phase, the ankle power generation was more closely related to Hindfoot and Forefoot coupling during the push-off phase. The slope of the linear foot coupling demonstrated increased variability between subjects during the countermovement phase in comparison to the push-off phase. These differences may be related to different strategies employed during the hop, for example different foot placement relative to the center of mass or angle relative to the ground at initial contact, increased knee and/or hip flexion during the countermovement phase, etc. In order to apply this methodology in patients with foot pathology, further investigation is warranted to examine the effects of various foot types (high arched vs. flat foot), intrinsic and extrinsic muscle strength of the foot, and the relationship of the segmental foot coupling to other measures of the task performance, such as vertical center of mass translation. References [1] Tulchin & Orendurff, ACSM 2009.
-20
-10
0
10
20
30
-30 -20 -10 0 10 20Hindfoot (degs)
Fore
foot
(deg
s)
PF DF
PFD
F
HindFoot and Forefoot Coupling During Countermovement Phase
-20
-10
0
10
20
30
-30 -20 -10 0 10 20Hindfoot (degs)
Fore
foot
(deg
s)
PF DF
PFD
F
HindFoot and Forefoot Coupling During Push-off Phase
422

Comparison of In-shoe Plantar Loading During Walking, Heel Raise and Sit-to-Stand Activities
On-Yee Lo1, Louis Iannuzzi1, Kenneth Mroczek2, Smita Rao1 1 - Department of Physical Therapy, New York University; 2 – Department of Orthopedics,
NYU – Hospital for Joint Diseases, New York, NY Introduction
Recent studies indicate that regional plantar loading is influenced by activity. [1-3] While most studies have assessed regional plantar loading during walking, bilateral activities such as heel raise and sit-to-stand have not been assessed. The sit-to-stand is an extremely common activity of daily living (ADL), the heel raise is an exercise commonly used to assess and strengthen plantar flexor musculature. However, plantar loading sustained during these activities is not known. The purpose of this study is to assess regional plantar pressure during walking at fast and self-selected speed, heel raise and sit-to-stand activities. Clinical Significance
Excessive regional plantar loading has been related to increased tissue break down risk in patients with diabetes, and increased risk for foot pain in patients with degenerative joint disease. [3] Objective data elucidating regional plantar loading during common ADL will be helpful to improve activity prescription in clinical populations. Methods
11 young healthy adults (7 males: 30.3 years, BMI: 26.4kg/m2; 4 females: 29.5 years, BMI: 21.2kg/m2) performed four activities: fast walking (F), self-selected walking (W), heel raise (H), and sit-to-stand (S). Subjects were encouraged to walk at self-selected and fast speeds along a 10 m walkway. For the heel raise activity, they were instructed to “go up on their toes and come back down”. For the sit-to-stand activity, subjects were asked to “stand from a seated position”, using a standard chair height. In-shoe plantar pressures were collected via the Pedar system (Novel, Munich, Germany). Peak pressure (PP, kPa) and pressure-time integral (PTI, kPa.s) were examined between four activities in six foot regions: heel (L0%-30%), midfoot (L30%-52%), medial forefoot (Med. FF, W0%-33%, L52%-81%), central forefoot (Ctrl. FF, W33%-66%, L52%-81%), lateral forefoot (Lat. FF, W66%-100%, L52%-81%) and hallux (W0%-27%, L81%-100%).
The effect of activity and foot area on plantar loading was assessed using a 2-way repeated measures analysis of variance (ANOVA). Separate 2-way ANOVAs were performed for PP and PTI (α = 0.05) using SPSS Version 16.0 (SPSS Inc., Chicago, IL). Interaction (activity x foot area) effects were assessed first. In presence of a significant interaction effect, simple effects (of activity on each foot area) were assessed subsequently. In terms of post-hoc testing, loading during each activity was compared to self-selected walking, using Bonferroni adjusted pair-wise comparisons. Results A significant activity-by-foot-area interaction was found for PP and PTI (P < 0.01). Subsequently, significant simple effects (effect of activity on PP and PTI at each foot area) were noted at the heel (P < 0.01), midfoot (P < 0.01), medial forefoot (P < 0.01), central forefoot (P < 0.01), lateral forefoot (P < 0.01) and hallux (P < 0.01). The results of pair-wise comparisons of activity on PP at each foot area are summarized in Figure 1. The results of
423

pair-wise comparisons of activity on PTI at each foot area are summarized in Table 1. * Indicates statistically significant differences, compared to self-selected walking.
Discussion This study compared regional plantar loading during fast and self-selected speed walking, heel raise and sit-to-stand activities. We found that PP during heel raise and sit-to-stand was significantly lower than during walking at self-selected speed at all foot regions. In particular, PP during sit-to-stand decreased by 80% at forefoot and by 90% at hallux, compared to self-selected walking. PP during heel raise decreased 71% at heel and decreased from 23% to 44 % at other foot areas, compared to self-selected walking. PP during fast walking was significantly higher at hallux and heel, than self-selected walking, consistent with previous reports.[3] PTI during the heel raise activity was significantly higher at forefoot and hallux, and was significantly lower at the heel and midfoot, compared to self-selected walking. PTI during sit-to-stand was significantly lower than self-selected speed walking at forefoot and hallux, but not significantly different at the midfoot and heel. These results suggest that bilateral activities such as the sit-to-stand and heel raise may offer low levels of regional plantar loading, and be safe for inclusion in the rehabilitation process. References 1. Guldemond, N.A., et al.,. Diabetes Res Clin Pract, 2007. 77(2): p. 203-9. 2. Rozema, A., et al., Foot Ankle Int, 1996. 17(6): p. 352-9. 3. Segal, A., et al., Foot Ankle Int, 2004. 25(12): p. 926-33. Acknowledgements We would like to acknowledge support from the New York Physical Therapy Association
Table 1: Pressure-Time Integral (kPa.s, Mean ±SD) sustained during
four activities: fast walking (F), self-selected walking (W), heel raise
(H), sit-to-stand (S) among different foot
areas.
F W H S 54.85±8.74 55.23±9.88 19.58±10.25 * 59.83±35.58 Midfoot 24.97±7.87 * 29.35±7.08 19.47±7.01 * 23.57±12.58 Med. FF 45.52±21.68 * 55.20±25.94 145.46±52.80 * 6.36±6.64 * Ctrl. FF 44.43±17.59 * 55.15±18.92 143.24±55.99 * 8.81±6.12 * Lat. FF 37.38±8.85 * 47.45±10.55 109.25±27.85 * 9.02±6.01 * Hallux 46.53±9.67 48.64±11.66 115.48±33.47 * 2.57±4.83 *
Figure 1: Peak pressure (kPa) sustained during four
activities: fast walking (black), self-selected walking
(white), heel raise (light grey), sit-to-stand (dark grey) among different foot areas. *
Indicates statistically significant differences,
compared to self-selected walking.
424

Biomechanical Analysis of Stepping Up and Down from a Step in
Individuals with Ankle Instability: A Pilot Study
Gutierrez, Gregory M., PhD; Pozzi, Federico, PT
Arthur J. Nelson Human Performance Laboratory, Department of Physical Therapy, New
York University; 380 Second Ave, 4th
Floor, New York, NY 10010
Introduction: Lateral ankle sprains (LAS) are among the most common orthopedic injuries.
It has been reported that up to 70% of individuals who suffer a LAS sprain have recurrent
symptoms up to 18 months post-injury, including pain, weakness, and sensorimotor
dysfunction.(Braun, 1999) These symptoms often result in recurrent ankle injuries, a
condition known as ankle instability (AI). The lower limb biomechanics of subjects with AI
has been previously investigated during gait, jumping and landing.(Hertel, 2008) It has been
proposed that a positional error, combined with differences in neuromuscular control, in the
unstable ankle joint prior to ground contact could increase the risk of recurrent
injuries.(Delahunt et al., 2006) There is a dearth of research available concerning
neuromuscular control strategies during stepping up and down from a step (e.g. a curb) in
persons with AI. The purpose of this pilot study is to analyze the 3D kinematic, kinetic and
muscle activations of the lower limb in subjects with AI during continuous gait, where the
subject will step up and step down from a height. Further, this work aims to compare
individuals with AI (AI group) and uninjured controls (CON group) to a third group of
individuals who have sprained their ankle, but did not develop AI (LAS group).
Clinical Significance: The scientific literature is still unclear as to why some people develop
AI after a LAS, while other people will not suffer from injury recurrence or symptoms of AI.
Curb walking represents an everyday activity that challenges our neuromuscular control
system and can represent a potential injurious situation.(Van Dieen et al., 2007) Thus, a better
understanding of the neuromuscular control patterns in our 3 groups during typical, yet
troublesome scenarios may help elucidate unstable neuromuscular control patterns and
potentially, what can be done to address those deficiencies.
Methods: Six subjects participated, gave informed consent, and completed a physical
screening form to assure that all subjects were free from any cardiovascular/neuromuscular
conditions that may affect movement patterns. All subject completed the Cumberland Ankle
Instability Tool (CAIT) to measure the severity of AI symptoms. Subjects were then assigned
to one of three group: AI group (must have suffered at least 1 LAS, self-report AI, and have a
CAIT score lower than 25), LAS group (must have suffered at least 1 LAS, but do not report
AI, and have a CAIT score above 27), and CON group (uninjured on either ankle and CAIT
score above 27). For all subjects, the more affected limb (determined via CAIT score) was
used as the test limb. Equivalent bilateral CAIT scores (e.g. in the CON group) triggered a
coin flip to determine test limb. A custom 10m walkway was built with a step-up to simulate a
street curb (~7”) with 2 embedded force plates (Kistler Instruments, Inc., Amherst, NY)
sampling at 1200 Hz and positioned to capture data from both legs during the step-up and
down transitions. The subjects were asked to walk on the ground level walkway, step up onto
the elevated walkway and keep walking until the end of the platform for the step-up tasks; the
opposite was performed for the step-down tasks. Kinematic data were acquired at 120Hz
using five ProReflex cameras (Qualisys, Inc., Gothenburg, Sweden). EMG data from the
425

peroneus longus, peroneus brevis, tibialis anterior and medial gastrocnemius were collected at
1200Hz using a Bagnoli 8 channel EMG (Delsys, Inc., Boston, MA). We acquired data from
both limbs in 4 different tasks: step-up with test leg trailing, step-up with test leg leading,
step-down with test leg trailing, step-down with test leg leading. The subjects were asked to
walk at a self-selected speed; controlled using optic timing gates. Each subject performed
three trials of each task in a random order. Trials were discarded and performed again if
subjects did not contact the force plates cleanly or if speed exceed +/- 5% of the pre-
determined self-selected speed.
Results: Due to the pilot nature of this work, only descriptive statistics were calculated. The
primary tasks of interest were the trials in which the test limb served as the leading limb in
both step up and down tasks, as this is when anecdotal evidence suggests injuries typically
occur. In these trials, both the LAS and AI group demonstrated a more inverted position of the
foot at touchdown (~3-5°) and more preparatory activity (prior to touchdown) in the tibialis
anterior muscle. Furthermore, these two groups also demonstrated less reactive muscle
activity (following touchdown) in the peroneus longus.
Discussion: We hypothesized that individuals with ankle instability would demonstrate
altered neuromuscular control patterns relative to the other two groups. However, in this small
sample the LAS group behaved similarly to the AI group, while the control group exhibited a
different pattern that can be construed as “safer” in terms of ankle stability (less inverted
position of the ankle at touchdown, less preparatory tibialis anterior activation, and more
reactive peroneus longus muscle activation). There is a recent push in AI research to focus on
this LAS group (individuals who have suffered a LAS, but did not develop AI) and they are
often termed “copers”; akin to individuals with anterior cruciate ligament deficiency who do
not experience episodes of the knee “giving way”. However, this term “copers” must be used
cautiously because researchers are often not able to evaluate whether there is an actual
ligamentous deficiency they are coping with, as the ankle ligaments are known to heal
following injury. This fact is highlighted in this small data set as the LAS and AI groups
behaved similarly. Since AI is a condition which relies on subjective information to diagnose,
it is possible that the individuals in these two groups can be mixed based on inappropriate
recall of their ankle status. Notwithstanding that, it appears this testing protocol is sufficient to
identify neuromuscular control deficiencies in persons with AI. With more subjects, more
powerful and substantial conclusions can potentially be drawn.
References
Braun BL. Effects of ankle sprain in a general clinic population 6 to 18 months after medical
evaluation. Arch Fam Med 1999;8:143–8.
Delahunt E, Monaghan K, Caulfield B. Altered neuromuscular control and ankle joint
kinematics during walking in subjects with functional instability of the ankle joint. Am
J Sports Med 2006;34:1970–6.
Hertel J. Sensorimotor deficits with ankle sprain and chronic ankle instability. Clin Sports
Med 2008; 27:353-370.
Van Dieen JH, Spanjaard M, Konemann R, Bron L, Pijnappels M. Balance control in stepping
down expected and unexpected level changes. J Biomech 2007; 40:3641-3649.
426

A New Method for Synchronization of Motion Capture and Plantar Pressure Data
Miller AL
Mary Free Bed Rehabilitation Hospital; Grand Rapids, MI USA
Introduction:
Plantar pressure analysis is a technique for measuring the dynamic pressure distribution between the
foot and the floor during locomotion. Several commercially available plantar pressure measurement
systems now exist that utilize arrays of small force sensors and allow for thorough analysis of plantar
pressure data. One type of analysis requires that the plantar pressure distribution be divided into
clinically meaningful regions based on key landmarks of the foot. The division of the foot into regions
has typically been done using visual inspection of the footprint and is subject to error when there is
partially absent or abnormal foot contact. A novel, robust method of synchronizing motion capture
and plantar pressure data was developed that allows for motion capture markers to be projected onto
the plantar pressure mat and used for accurate and autonomous subdivision of the foot, regardless of
contact pattern.
Clinical Significance:
Neurologic conditions, such as cerebral palsy, can result in deviations in normal foot structure, which
alter the pressure distribution between the plantar surface and the floor. These complex and varied
deviations are often the target of surgical or non surgical treatments. Therefore, accurate and
repeatable documentation of plantar pressure distribution may assist in documenting clinical outcomes.
Methods:
Synchronizing data from a plantar pressure mat and a motion capture system requires both temporal
and spatial synchronization. Temporal synchronization was achieved using the Tekscan TS-100 Tri-
Sync Box to start and stop plantar pressure data collection. Spatial synchronization was accomplished
using a linear calibration wand of known length, Lwand, which contained two retro reflective motion
capture markers along its length (Fig. 1a), and three motion capture markers that were adhered to the
plantar pressure mat. The calibration wand was used to locate a series of three calibration points, cp,
that were expressed relative to both a global reference frame, {G}, and a reference frame fixed to the
pressure mat, {M}. Calibration points were located relative to {M} by applying pressure to the
pressure mat and identifying
the sensel with highest
activation. In addition, a
reference frame, {MKR}, was
formed using the three
markers fixed to the pressure
mat (Fig. 1b). Formation of
these reference frames allows
for any point, p, to be
expressed relative to {M}
using the following formula:
cp3
cp2
cp1
mkr1
mkr2
mkrX
CPY
CPX
MX
MY
mkrY
mkr3
MX
MY
mkrw1
cp
mkrw2
Figure 1a Figure 1b
427

)( ORGMKRGMKR
GM
MKRM RR Mpp M
M Where:
RMMKR = Rotation matrix from {MKR} to {M} RMKR
G = Rotation matrix from {G} to {MKR} pG
= Position of point, p, relative to {G} pM= Position of point, p, relative to {M}
ORGMKRM = Position of the origin of {M} relative to {MKR} Results:
The midstance plantar pressure distribution is shown for a patient with a planovalgus foot deformity (Fig. 2a) and a patient with an equinovarus foot deformity (Fig. 2b). In both examples, visual identification of bony landmarks to be used for segmentation is impossible due to abnormal or absent foot contact. However, data were collected for both patients using a multi segment foot model based on the model developed by Leardini et al. [1] and the methods outlined in this paper. Spatial synchronization of foot markers placed on bony landmarks allowed for automatic segmentation of the foot, even though the pressure pattern in each example was markedly abnormal.
Discussion:
Segmentation of the foot is required for many types of plantar pressure analyses. Consequently, accurate measurement of plantar pressure variables requires accurate and repeatable subdivision of the foot. As other authors have identified, synchronization of motion capture and plantar pressure data may improve the accuracy of plantar pressure studies [2,3]. The method outlined in this paper allows for segmentation of the foot when there is absent or abnormal foot contact by utilizing motion capture markers placed on bony landmarks. Therefore, the primary limitation of this method is inter- and intra- observer repeatability of foot marker placement. An investigation into the resulting repeatability of relevant plantar pressure variables, such as peak pressure or impulse, is needed. Lastly, temporal and spatial synchronization permits simultaneous measurement of multi-segment foot kinematics and plantar pressure data. This could allow for studies to be conducted that examine the interplay between the motions of the foot and the plantar pressure distribution.
References 1. Leardini A, et al. Clin Biomech (Bristol, Avon) 1999;14:528–536. 2. Giacomozzi C, et al. Med Biol Eng Comput 2000;38:156–63. 3. Stebbins J, et al. Gait Posture 2005;22:372-76.
Figure 2a Figure 2b
428

Neurophysiological Aspects and their Relationship to Clinical and Functional
Impairment in Patients with Chronic Obstructive Pulmonary Disease
João Carlos Ferrari Corrêa1; Carolina Chiusoli de Miranda Rocco
1; Luciana Maria Malosá
Sampaio1; Roberto Stirbulov
2.
1 Nove de Julho University, São Paulo, Brazil;
2 Santa Casa Hospital, São Paulo, Brazil.
Introduction
The neurophysiological alterations often found in patients with chronic obstructive pulmonary
disease (COPD) are associated with the severity of the disease. Other factors, such as
reductions in body mass index, endurance, muscle strength and other conditions that affect the
peripheral skeletal musculature in patients as a whole, may have a negative impact on these
neurophysiological aspects and compromise their functional activity. The purpose of the
present study was to assess static and dynamic balance, monosynaptic reflexes, peripheral
muscle strength and the sit-to-stand test (SST), relating these neurophysiological responses to
the BODE Index in order to identify a possible functional and prognostic assessment for
patients with COPD.
Clinical Significance
Identify a possible functional and prognostic assessment by neurophysiological aspects and
their relationship to clinical and functional impairment in patients with chronic obstructive
pulmonary disease (COPD).
Methods
A cross-sectional study was carried out involving three groups of patients: COPD group (not
dependent on oxygen); COPD-O2 group (dependent on oxygen); and control group (CG,
healthy individuals paired for age). The following four factors are addressed in BODE Index
Evaluation: 1. Body mass index (BMI); 2. Airflow obstruction, assessed from the FEV1; 3.
Dyspnea scale; 4. Six-minute walk test (6MWT). To evaluation tests for neurophysiological
aspects was: the electromyographic signal, collected in two distinct situations – monosynaptic
reflex and peripheral muscle strength; the pressure plate (MatScan model) was used to
analyze oscillations in pressure points in relation to speed as well as anterior-posterior and
lateral-lateral displacement, enabling the assessment of balance by means of the center of
oscillatory pressure, which is the result of these two variables; the Tinetti Scale was used for
the assessment of gait as well as static and dynamic balance; and the patient was instructed,
standing up from and sitting down on the chair with no support from the hands, repeating the
procedure as many times as possible (Sit-to-Stand Test). As all data were parametric, one-way
analysis of variance (ANOVA) was used to compare the means of the data between the three
groups and Tukey’s DHS test for the multiple comparisons of means was used in the presence
of significance for the analysis between posts. The Student’s t-test was used for the
comparison of means between the COPD and COPD-O2 groups only for the total BODE
Index score. Person’s correlation coefficient was used to determine the degree of association
between two variables in the same group. The level of significance was set at 5%, with an � of
0.05 and � of 0.01.
429

Results
The individuals with COPD had a reduced reflex response (evident the by increase in latency
time of the patellar and Achilles reflexes), achieved a lower number repetitions on the SST
and exhibited lesser peripheral muscle strength on the femoral quadriceps muscle when
compared to the CG. No statistically significant differences were found between the COPD
and COPD-O2 groups regarding the neurophysiological aspects analyzed. The BODE Index
demonstrated correlations with balance assessment (determined by the Tinetti scale) and the
SST.
Both COPD groups had similar characteristics regarding the total BODE score and
neurophysiological aspects, which justifies pooling the two groups for the correlation analysis
between these variables (COPDt Group). Statistically significant strong and moderate
negative associations (p < 0.05) for the Tinetti Scale and SST, respectively. Correlations were
weak for the other variables.
Discussion
The individuals with COPD had a reduced reflex response, as observed in the increase in
latency time regarding the patellar and Achilles reflexes. These individuals also achieved a
lower number of repetitions on the sit-to-stand functional test and had lesser peripheral
muscle strength in the femoral quadriceps in comparison to the control group. However, the
oxygen-dependent group with COPD was similar to the non-dependent COPD group with
regard to the neurophysiological aspects and BODE Index, despite being different in relation
to functional capacity and pulmonary function. The BODE Index was correlated with the
neurophysiologcial evaluations of balance, Tinetti scale and the sit-to-stand test. Both are
functional tests and lower scores suggest a worse prognosis for individuals with COPD, which
speaks to the need for further investigations. These tests are easy to administrate, low-cost and
feasible, especially the SST, and may represent a new assessment modality for prognoses in
COPD that is more easily administered than the BODE Index.
References
1. Pitta F; Troosters T; Spruit M; Probst V; Decramer M; Gosselink R. Characteristics of
Physical Activities in Daily Life in Chronic Obstructive Pulmonary Disease. American
Journal of Respiratory and Critical Care Medicine, 2005; 171: 972-977.
2. Kayacan O; Beder S; Deda G; karnak D. Neurophysiological changes in COPD patients
with chronic respiratory insufficiency. Acta Neurologica Bélgica, 2001; 101: 160-165.
3. Corrêa JCF; Corrêa FI; Franco RC; Bigongiari A. Corporal oscillation during static biped
posture in children with cerebral palsy. Electromyography and Clinical Neurophysiology,
2007; 47(2): 1-6.
Acknowledgements
FAPESP, process n° 2007/06078-0.
430

The Effects of Postural Complexity on Modulation of the Soleus H-reflex
Joshua D. Guggenheimer1,3 & D. Clark Dickin2,3 1University of North Dakota, Grand Forks, North Dakota, 2 Ball State University, Muncie, Indiana, 3 University of Idaho, Moscow, Idaho Introduction Previous research has implicated the Hoffman reflex (H-reflex) as an effective means of assessing the responsiveness of the nervous system under various neurological conditions (1, 2). Given the reported modulation of the H-reflex in response to increased postural challenge in the form of standing, it seems plausible that increased postural challenges, in the form of elimination of one or more of sensory feedback mechanisms related to posture, may result in even greater suppression of the H-reflex over that of normal upright standing (3-5). Clinical Significance The purpose of this study was to examine the soleus H-reflex responses of young adults during postural tasks of increasing complexity. Specifically, we assessed the differences in H-reflex modulation during seated, standing and standing on a sway reference support surface, in order to determine the impact of the quality of somatosensory feedback on the modulation of the H-reflex. The importance of this study becomes apparent when considering the potential application for older adults. Considering the inherent decrease in stability that accompanies aging, it seems plausible that the findings of this study could have substantial implications in the exercise prescription for unstable populations, such as the elderly. Methods Twenty one college aged subjects (14 men and 7 women) (18-30 years old) participated in this study. The effects of postural positioning on the elicitation of the H-reflex were examined under three postural positions, consisting of 1) seated, 2) standing, and 3) managing a postural manipulation task, which consisted of a sway reference support surface (i.e., support surface rotates in direct response to anterior and posterior sway of the participant) used to reduce the efficacy of somatosensory feedback. H-reflexes and corresponding muscle activity (M-wave) were evoked and recorded using the BioPac MP150 system. Stimulation occurred at the tibial nerve, while corresponding muscle activity was monitored at the soleus muscle of the right leg. Differences in H-reflex modulation according to postural position and gender were assessed using a repeated measures analysis of variance (ANOVA). Tukey's post hoc analysis was utilized in order to determine the location of significant differences in H-reflexes relative to postural positioning. In addition, intraclass correlations (ICC) were conducted for repeated H-reflex measurements to assess overall reliability. Significance was determined using an alpha ≤ 0.05. Results A significant difference in H-reflex modulation based upon subject posture (p < .001) and subject gender (p < .001) was found. Furthermore, a significant interaction was found between the two independent variables (p < .001) in regards to their influence on H-reflex, suggesting that the H-reflex was differentially affected by standing as a function of gender
431

with males showing a greater modulation from seated to standing than females. Comparisons between postural positions suggested a significant difference between the original baseline condition compared to standing (p < .001) and sway referenced standing (p < .001). As seen in Figure 1, there was a significant difference between the seated condition and both standing conditions (p < .001). ICCs indicated a highly significant relationship between consecutive intra-subject H-reflex recordings (p < .001 in all cases). ICC values of .921, .956, .926, and .782 were found for the positions of baseline seated, seated, standing, and sway referenced standing, respectively.
Discussion The results of this study suggest that the postural complexity of a task has a significant impact on the corresponding modulation of the H-reflex. Our results provide evidence for the notion that more complex tasks elicit a greater suppression of the H-reflex, as noted by the significantly modulated H-reflexes of standing subjects. Related work supports these findings, suggesting the presence of H-reflex modulation under conditions of increased task complexity, most likely due to inhibition that occurs prior to the motoneuronal membrane (i.e., the Ia afferent terminals) (3,6,7). Interestingly, the male subjects in this study demonstrated overall greater modulation of the H-reflex than their female counterparts. This may be due to gender-related differences in the capacity of the nervous system to activate contracting muscle, (8) or gender differences in central drive (9). Considering the inherent decrease in stability that is associated with aging, along with the impaired ability to effectively modulate the H-reflex (1,5) the findings of this study may provide insight into the underlying mechanisms affecting balance, and therefore influence future exercise prescription for less stable populations such as older adults.
References: 1. Mynark, R. 2005. Clinical Neurophysiology, 116, 1400-1404. 2. Zehr, E. 2002. European Journal of Applied Physiology, 86, 455-468. 3. Bove, M., et al. 2005. Neuroscience Letters, 397, 301-306. 4. Kawashima, N., et al. 2003. Neuroscience Letters, 345, 41-44. 5. Chalmers, G., & Knutzen, K. 2002. Journal of Gerontology, 57A (8), B321-B329. 6. Frigon, A., et al. 2004. Journal of Neurophysiology, 91, 1516-1523. 7. Palmieri, R., et al. 2004. Journal of Athletic Training, 39(3), 268-277. 8. Deschenes, M., et al. 2009. European Journal of Applied Physiology, 105, 889-897. 9. Russ, D., & Kent-Braun, J. 2003. Journal of Applied Physiology, 94, 2414-2422.
Figure 1. Modulation of H-reflex amplitude according to postural stance and gender. * denotes a significant difference from baseline, # denotes a significant difference between genders within the same condition.
#••
••
#••*#
*#••
**••
432

JEGM 2010 Annual Conference
Strength training with electrical stimulation- Is this a viable method of
facilitating independent mobility and improving quality of life after a
moderate to severe stroke? Claydon L1, Stewart C1, Postans N1, Miller K1, Atherton F1, Durairaj R2, Koufali M2, Maganaris
C3, Pandyan A4
1 ORLAU, RJAH Hospital, Oswestry, UK, SY10 7AG
2 STAR, Aintree University Hospital, Liverpool, UK, L9 7AL 3 Manchester Met. University, IRM, John Dalton Building, Oxford Road, UK, M1 5GD
4 School of Health & Rehabilitation, Keele University, Staffordshire, UK, ST5 5BG
Introduction
There is a high risk that patients lose the ability to walk after a stroke. This is due to the
fact that key muscle groups in the lower limb show significant levels of muscle disuse
atrophy, despite routine therapy. This deterioration can lead to a significant reduction in
structural and functional muscle performance. The effect of disuse muscle atrophy will
also be more rapid and debilitating in the older patient due to existing age related muscle
impairments. The effect of paralysis and muscle atrophy often prevents immobile
patients from participating in currently recommended rehabilitation protocols, and
consequently the prognosis in terms of recovery of walking ability remains bleak.
Therefore this study aimed to see if electrical stimulation could be used to prevent
muscle atrophy after an acute stroke, and therefore improve the likelihood of walking. A
prototype “portable measuring device” was specifically designed and developed for this
trial, enabling accurate lower limb isometric muscle strength measurements to be
obtained, whilst proving the feasibility of such a prototype for use in a ward setting.
Clinical Significance
Onset of disuse muscle atrophy occurs within the first three days of immobility. Stroke
patients often require a prolonged period of rehabilitation to re-gain control of muscle
activation. If the integrity of distal muscle structure can be maintained with electrical
stimulation, rehabilitation protocols can be administered without the effects of muscle
performance decline. Therefore, the overall aim is to maximise the potential for this
group of patients to re-gain walking ability.
Methods
A phase I randomised controlled trial recruited stroke patients from an acute hospital
setting. Inclusion criteria required subjects to be aged younger than eighty years,
independently mobile pre-stroke, capable of independent or supported sitting post-
stroke, medically stable and capable of providing informed consent. Subjects were
excluded if they were able to walk post-stroke, and if they had any contraindications to
electrical stimulation. Subjects were randomised to a treatment or control group.
Treatment subjects received a strength based training program with electrical stimulation
on their quadriceps and gastrocnemius, three times a week, for six weeks. Frequency
was set at 50Hz, pulse duration 450µs and current amplitude was set to maximal
tolerated. Ton:Toff was 2seconds:10seconds. Both groups received standard NHS
physiotherapy; the control group received no additional treatment. Outcome measures
were taken at baseline, week-3 and week-6. These included muscle strength (portable
measurement device), internal muscle structure (2D ultrasound imaging) and walking
ability.
Results
9 Stroke patients were recruited (mean time since stroke: 22.7 days, SD 29.5 days).
Compliance with treatment was 100%, no adverse events were reported.
433

JEGM 2010 Annual Conference
Table 1: Summary of subjects in treatment and control groups.
Subject
number
Age Intervention Quadriceps
change in force
(baseline-
6weeks, Nm)
Gastrocnemius
change in force
(baseline -
6weeks, (Nm))
Increase in
pennation angle
(baseline – 6
weeks (degrees))
1 64 (M) Treatment 0 0 11.3
2 49 (M) Treatment 1.5 8.2 3.64
3 75 (F) Treatment 4.2 26 4
4 79 (F) Treatment 7.8 19.7 1.9
Mean changes 3.4 (SD:3.4) 13.5 (SD: 11.6) 5.2 (SD: 4.2)
5 54 (M) Control 19 2.6 -0.9
6 69 (M) Control 0 0 6.6
7 69 (F) Control Not applicable- withdrew consent at 3 weeks
8 63 (F) Control Not applicable- withdrew consent at baseline
9 74 (F) Control Not applicable- passed away
Mean Changes 9.5 (SD: 13.4) 1.3 (SD: 1.8) 2.85 (SD: 5.3)
(M= male; F= female; Nm= Newton meters; SD= Standard Deviation; pennation angle
measured by 2D ultrasound imaging on the lateral head of gastrocnemius)
Four patients regained mobility at the end of the study (three treatment [95% CI for
population proportion 0.3-0.95] and one control [95% CI 0.06-0.70]). Odds ratio of a
person walking as a result of treatment is 6 (95% CI 0.2-162.5).
Discussion
We focused on two of the key anti-gravity muscles used throughout stance phase in an
attempt to prevent onset of disuse muscle atrophy. The results suggest that treatment
with electrical stimulation may help patients regain the ability to walk after a stroke.
The portable measurement device proved feasible to use in a ward setting, and provided
accurate force readings. Post intervention muscle pennation angle demonstrated a small
but significant angular increase, indicating that we elicited a degree of hypertrophy.
Strength gains observed may also be attributed to neural adaptation. Artefact in
measurement with ultrasonography could not be entirely eliminated, and results should
be independently reviewed. It must be highlighted that this is a phase I pilot study, and
although these results are promising, it is not possible to extrapolate to the wide
population of stroke patients at this stage. A phase II trial is now required to study effect
size associated with treatment.
References
1. Aagaard P et al 2001. A mechanism for increased contractile strength of human
pinnate muscle in response to strength training: changes in muscle architecture. J
Physiol 534.2: 613-623
2. Glinsky J et al 2007. Efficacy of electrical stimulation to increase muscle strength in
people with neurological conditions: a systematic review. Physiother Res Int 12(3):
175-194
3. Hachisuka K et al 1997. Disuse muscle atrophy of lower limbs in hemiplegic
patients. Arch Phys Med Rehabil 78: 13-18
Acknowledgements
Special thanks for staff at ORLAU for developing and constructing the measurement
device, Doctors and nurses at Aintree University Hospital for their continued support,
and Action Medical Research (Grant reference AP113) for funding the project.
434

435

ResultsFig.1 shows examples of the outcomes. On the left side a good outcome to the method is shown. Linear envelope of sEMG signal is shown by blue line; red line represents the calculated threshold �. On the right side, calculated threshold � is too high due to a high sEMG activity of tibialis anterior muscle during mid and terminal stance phase of gait cycle.
Fig. 1: Output examples of threshold � calculated for trial 1238 (left side) and trial 379(right side). On the left side linear envelope of sEMG signal, red line shows the calculated threshold � based on bimodal Gaussian model method. Discussion One possible shortcoming of the developed method is the necessity of previous knowledge about normal sEMG activation patterns and the requirement of additional data like FS signal. Another possible shortcoming is the difficulty to calculate threshold � from sEMG signals affected by signals Si(t). However the influence of movement artifacts on Si(t) is reduced during signal acquisition by following SENIAM recommendations. As a result, muscle crosstalk is considered as the main source of uncertainties Si(t). However due to the complexity of the crosstalk phenomenon, further analysis with methods such as crosstalk risk factor and believed amount of coactivation, proposed by Meineke [4], could help to understand the recorded SEMG signals affected by Si(t). ConclusionThe developed method for the determination of threshold � based on bimodal distribution model is simple and suitable for practical application. This method does not rely on arbitrary decisions by the user and threshold � is calculated automatically. The method can be used not only in normal gait but in any functional test able to isolate different muscles activity. However, further investigations are necessary in order to get a more detailed knowledge of the behavior of factors Si(t) and to evaluate different applications of this method in assessment of such factors i.e. calculation of an index to estimate muscle crosstalk. Acknowledgements Thank you to the Mexican National Council of Science and Technology (CONACyT), the German Academic Exchange Service (DAAD) and the Mexican National Rehabilitation Institute (INR) for the support for the realization of this study. References 1. Rau, G., E. Schulte, and C. Disselhorst-Klug, From cell to movement: to what answers does EMG really contribute? J Electromyogr Kinesiol, 2004. 14(5): p. 611-7. 2. Farina, D., et al., Surface EMG crosstalk evaluated from experimental recordings and simulated signals. Reflections on crosstalk interpretation, quantification and reduction. Methods Inf Med, 2004. 43(1): p. 30-5. 3. Hermens, H.J., et al., Development of recommendations for SEMG sensors and sensor placement procedures. J Electromyogr Kinesiol, 2000. 10(5): p. 361-74. 4. Meinecke, L., Quantifizierung des Crosstalk-Anteils in Oberflächen-Elektromyogrammen, in Fakultät für Elektrotechnik und Informationstechnik. 2006, RWTH Aachen University: Aachen. p. 187.
436

CONSECUTIVE SERIES OF GAIT ANALYSES IN PATIENTS AFTER TOTAL ANKLE REPLACEMENT
Scott Coleman, Fabian Pollo, James Brodsky, Alex Rabinovich
Baylor University Medical Center, Dallas, TX
Introduction Intermediate and long-term results of third generation total ankle replacement (TAR) devices have emerged in literature reporting promising results. Common outcome measures include survival rates, the AOFAS hindfoot score, the Kofoed ankle score, visual scales accessing pain, the SF-36(1), and radiographic assessment. Three-dimensional gait analysis can provide an objective means of evaluation during functional activity and has been utilized in TAR assessment sparingly. The purpose of this study was to track the effects of TAR on gait function over a three year period. It was hypothesized that subject that had undergone TAR would show a significantly improved gait pattern and this improvement would remain consistent over the following two years. Clinical Significance Total ankle replacement surgery has become a viable option to ankle arthrodesis but the long term results have not yet been solidified in the foot and ankle community. This study offers additional information to support the short-term functional results of total ankle replacement. Methods Twenty-five subjects (61.2 years +/- 12.0) underwent unilateral total ankle replacement surgery performed by a single surgeon and single implant, the Scandinavian Total Ankle Replacement (STAR) system. The STAR, the first and only mobile bearing, three-component ankle available to date in the United States, was US FDA approved on May 27, 2009. Twenty-two subjects were diagnosed with osteoarthritis and three with rheumatoid arthritis. Subjects participated in a gait analysis pre-operatively and at three yearly intervals post-operatively. Kinematic and kinetic data were collected using a 12-camera Vicon motion capture system (100Hz) and 2 AMTI force platforms (1,000 Hz), respectively. A one-way analysis of variance for repeated measures was performed to determine statistical significance. A Tukey post hoc test was run to test for significance between analysis periods. Results There was a significant increase in gait velocity post-operatively (p<0.05). Post hoc analysis found pre-operative velocity (77.3 ± 23.1 cm/s) to be significantly different from each year post-operative (1yr- 102.5 ± 16.3 cm/s; 2yr- 106.8 ± 16.6 cm/s; 3yr- 109.2 ± 18.9 cm/s) as illustrated in Figure 1a. None of the post-operative time periods were significantly different from one another. Post-operative ankle sagittal plane range of motion values showed an increase (1yr- 18.6 ± 6.1 degrees; 2yr- 19.0 ± 6.7 degrees; 3yr- 18.7 ± 6.2 degrees) compared to the pre-operative value (pre- 15.0 ± 5.0 degrees), although there was no significant difference found (p=0.067). Peak ankle power did reach significance (p<0.05). Between group analysis found a significant difference
437

between pre-operative (0.81 ± 0.61 W/kg) and 1 year post-operative (1.23 ± 0.62 W/kg) gait analyses only.
Fig. 1: Velocity, ankle sagittal plane range of motion, and peak ankle power mean and ± 1 standard deviation at four time periods; pre-operative, 1 year post-operative, 2 year post-operative, and 3 year post-operative. The * shows statistical significance at p<0.05.
Discussion One major advantage of TAR over ankle arthrodesis is the maintenance of sagittal plane ankle range of motion. Increased risk of arthritis in surrounding joints is a common fear with arthrodesis due to immobilization of the ankle joint. Our subjects had an initial increase of approximately 3.5 degrees which was maintained in the following two years. This slight increase in motion is consistent with the literature (2,3,4). TAR may provide a few degrees of motion but will not restore range to normal levels reported to be at approximately 27 degrees (5). After one year, gait velocity reached similar values as other prospective gait analysis studies (4,6). An interesting finding was that the velocity for subjects in this study continued to increase each year after surgery. With the increase in velocity it might be expected to see an increase in ankle power. However, peak ankle power, while showing an initial increase one year after surgery, decreased over the following two years. Plantar flexor muscle weakness has been reported as high as 38% in patients with osteoarthritis (7). Post-surgery immobilization may further weaken the muscles. A possible explanation for our results is that it may take longer than 12 months to fully achieve the most efficient gait pattern and may take up to three years or more after surgery. TAR improved gait function a year following surgery and remained consistent as hypothesized with the exception of ankle power, which may not be clinically important as their velocity continued to increase and their range of motion remained constant. Continued tracking of this subject group for 5 to 10 years post-surgery may identify when and if subjects after TAR reach a consistent gait pattern. References 1. Naal, F.D., et al. (2009). Clin Orthop Relat Res, Aug 12. [EPUB ahead of print]. 2. Valderrabano, V., et al. (2007). Clin Biomech, 22:894-904. 3. Stauffer, R.N., et al. (1977). Clin Orthop Relat Res, 127:189-96. 4. Ingrosso, S., et al.(2009). Gait Posture, 30:132-137. 5. Vickerstaff, J.A., et al. (2007). Med Eng Phys, 29(10):1056-1064. 6. Dyrby, C., et al. (2004). Foot Ankle Int, 25:377-81. 7. Valderrabano, V., et al. (2006). J Orthop Res, 24(12): 2159-69.
438

THE EVALUATION OF PERCUTANEOUS HAMSTRING LENGTHENING OUTCOMES IN CHILDREN WITH CEREBRAL PALSY
Sylvia Õunpuu MSc, Kristan Pierz, MD, Kristie Anderson and Katharine Bell, MS Center for Motion Analysis, CT Children’s Medical Center, Farmington, CT, USA
E-mail: [email protected] Web: www.ccmckids.org
Introduction Excessive knee flexion at initial contact and in stance is a common problem for persons with cerebral palsy (CP). Excessive knee flexion in stance can lead to increased knee extensor moments and increased energy consumption. The intramuscular hamstring lengthening (IHSL) is the most common surgical intervention when excessive knee flexion is attributed to hamstring tightness/spasticity. Previous research has shown that IHSL results in increased knee extension at initial contact and in stance1. Percutaneous hamstring lengthening (PHSL) has been introduced as an alternative method to lengthen the hamstrings with less time needed to perform the procedure and therefore decreasing patient morbidity. It has been shown that the PHSL can achieve beneficial kinematic outcomes2. The purpose of this study was to provide further evidence of kinematic as well as kinetic PHSL outcomes.
Statement of Clinical Significance A systematic review of surgical outcomes using gait analysis techniques can lead to a better understanding of the impact of a particular treatment on gait and ultimately lead to a better understanding of treatment indications. If the PHSL procedure produces similar functional outcomes as the IHSL procedure there will also be benefits associated with the reduced surgical time to perform the procedure.
Methods This was a retrospective study using a convenience sample of existing records of patients who underwent medial PHSL for the treatment of excessive knee flexion in stance. Inclusion criteria included: diagnosis of CP, pre operative gait analysis, PHSL and postoperative gait analysis. All patients also underwent simultaneous other lower extremity surgeries at the time of the index procedure consistent with recommendations based on gait analysis data. Motion data was collected using a VICON 512 motion analysis system (VICON, Los Angeles, CA) following standard protocols3. Force plate data were collected simultaneously using three AMTI force platforms (Advanced Medical Technologies Incorporated, Watertown, MA). Pre versus post operative clinical examination, kinematics, kinetics and temporal and stride data were evaluated using a paired student’s T-test.
Medial PHSL involved lengthening of the semitendinosus, gracilis, and/or semimembranosus. With the patient supine, the hip flexed at 90°, and the knee held in maximum extension, the tight posterior medial structures were palpated. A stout needle or scalpel blade was used to enter the skin lateral to the semitendinosus just proximal to the popliteal crease, and rotated to tenotomize the structure and then removed. Either through a separate stab incision, or the same skin incision, the gracilis was lengthened in a similar fashion. The semimembranosus, which has an anterior aponeurosis, was fractionally lengthened through the stab incision by making small sweeps through the structure with the needle, until the popliteal angle was acceptable (less than 30°).
439

Results Twenty-four patients (43 limbs) met the inclusion criteria for this study. Eighteen patients were male, 6 female; 19 patients had been diagnosed with diplegia, 2 with asymmetric diplegia, and 3 with hemiplegia. The mean age at preoperative gait analysis was 6.2±2.6 years, and the time from surgery to postoperative analysis averaged 1.5±0.9 years. At the time of the preoperative analysis, 6 patients were of GMFCS level 1, 7 patients were GMFCS level 2 and 11 patients were GMFCS level 3. At the time of the index procedure, 23 of the 24 patients had simultaneous surgeries: 24 limbs had simultaneous soft tissue surgery only and 19 limbs had simultaneous bony surgery.
The associated clinical examination measures showed a statistically significant increase in knee extension (hip at 90º) from pre op (-53º±11) to post op (-40º±12) (p<0.00). The kinematic outcomes of the PHSL were consistent with the intramuscular procedure and included increased knee extension at initial contact and in stance (Table 1).
Table 1: Comparison of mean (± s.d.) pre versus post kinematics (n=43). Kinematic Parameter Preoperative Postoperative Reference p
Mean anterior pelvic tilt (deg) 21 ± 7 24 ± 7 11 ± 5 0.004
Pelvis range of motion (deg) 7 ± 3 9 ± 3 5 ± 2 0.003
Peak hip extension in ST (deg) 6 ± 9 5 ± 10 -8 ± 6 0.508
Knee angle at IC (deg) 40 ± 14 25 ± 14 9 ± 6 0.000
Mean knee angle in ST (deg) 24 ± 15 14 ± 15 15 ± 5 0.000
Peak knee extension in ST (deg) 14 ± 17 6 ± 17 6 ± 6 0.000
Legend: ST= stance, IC=initial contact, deg=degrees.
A subgroup of only 4 patients showed an increased mean knee extensor moment in stance pre op (0.21 ±0.09 N-m/kg) that decreased significantly post op (0.09 ±0.08 N-m/kg, P<0.012) closer to the typical value (0.08±0.11 N-m/kg). Outcomes by GMFCS levels 1, 2 and 3 showed similar findings with respect to knee sagittal plane kinematics with the most significant improvements at the knee seen in the GMFCS Level 3 patients.
Discussion The results of this study suggest that the PHSL provides similar results in terms of knee kinematics and kinetics to those found in the literature for IHSL for short-term outcomes of 1.5 years¹. Increased mean knee extensor moments in stance pre op were not observed as expected for increased knee flexion in stance due to an increase in the mean forward trunk tilt in comparison to typical values. Studies are now needed to determine if these short-term outcomes are maintained over the longer-term.
References 1. Adolfsen SE, Õunpuu S, Bell KJ, et al. J Pediatr Orthop.;27:658-67, 2007. 2. Gordon AB, Baird GO, McMulkin ML, et al. J Pediatr Orthop.;28:324-29, 2008. 3. Davis et al., Human Motion Analysis: Current Applications and Future Directions.
Piscataway, IEEE Press, 17-42, 1996.
440

The effect of time on the waiting list for total knee replacement on pre-surgery knee
range of motion
Marietta van der Linden1, Kavi Jagadamma
1, Richard W Nutton
2
1Queen Margaret University, Edinburgh, United Kingdom.
2Orthopaedic Department, New Royal Infirmary, Edinburgh, UK
INTRODUCTION
In Scotland alone over 6000 total knee replacement surgeries are performed each year. In the
past four years there has been a steadily decline in the time patients have to wait for their
surgery once they are placed on the waiting list. Several authors have investigated the effects
of time on waiting list on pain and self-reported function [1] but the range of motion during
functional activities has so far not been assessed.
AIMS
The aim of this study was to investigate whether the pre surgery range of motion of the knee
is affected by the time waiting for surgery.
CLINICAL SIGNIFICANCE
The question whether patients’ function declines while waiting for surgery is of high
significance for the planning of treatment of patients with end stage osteoarthritis.
METHODS
Between May 2004 and September 2009,155 patients were assessed 1-4 weeks before
surgery. Patients were grouped into two approximately equal groups, those who waited more
than four months (group A) and those who waited less than four months for their surgery
(group B). Waiting list time was defined as the time between the appointment with consultant
and the pre-operative assessment. Knee range of motion was recorded by flexible
electrogoniometry ( Biometrics ltd..) during several tasks including ascending and descending
stairs and walking on a level surface. Peak knee flexion in long sitting on a examination
plinth was also assessed with manual goniometer. Patient reported function and pain were
recorded using the respective components of the WOMAC (Western Ontario McMaster
University Osteoarthritis Index). One way ANOVA was used to analyse the difference
between the two groups. P values less than 0.05 were considered statistically significant.
RESULTS
Group A consisted of 72 patients who waited an average of 6.6 months (sd 2.6). Group B
consisted of 83 patients who waited an average of 2.5 months (sd 0.9). Age and male:female
ratio were similar for both groups. Table 1 shows that patients who were waiting more than
four months for surgery had a significant lower peak knee flexion in sitting and a lower range
of knee motion while ascending and descending stairs (p<0.05). However, there was no
significant difference between the two groups in walking speed, function and pain.
441

Table 1 Patient characteristics, range of motion of the knee during ascending and
descending stairs and walking on a level surface, and the function and pain components
of the WOMAC.
Age flexion upstairs downstairs level Function1 Pain
1
A 69.9(8.6) 106(15.3) 62(22.5) 58(25.7) 48(14.8) 32.6(11.1) 9.4(3.3)
B 68.9(7.8) 113(13.9)* 70(16.6)* 66(21.0)* 50(9.5) 31.1(10.3) 9.7(2.28)
*p<0.05 1
A higher value for the function and pain components indicate higher impairment of function
and higher level of pain.
DISCUSSION
A recent systematic review concluded that patients with OA do not experience deterioration
in pain or self-reported function when waiting more than 180 days for total knee or hip
replacement [1]. This study also did not found a difference in pain or self-reported function
between the two groups with an average difference in waiting time of four months. However,
the knee range of motion measured both on the plinth and during ascending and ascending
stairs was significantly lower in those waiting an average of 6.6 months. The disagreement
between the two outcome measures (objective and self-reported function) may indicate either
that these two measures of function are not closely related or that the function and pain
components of the WOMAC are not sensitive enough to detect differences between the
groups.
ACKNOWDLEGEMENTS
This study was party made possible through funding from DePuy Ltd.
REFERENCES
[1] Hoogeboom et al (2009) Osteoarthritis Cartilage 17; 1420-7
442

Gait patterns following 8-week exercise training programs in individuals with transtibial amputation – A preliminary report Suh-Jen Lin, PT, PhD, Fabian Bizama, PT, MS, School of Physical Therapy, Texas Woman’s University, Presbyterian Campus, Dallas, TX 75231.
Introduction Achieving upright walking is an important milestone for amputees during rehabilitation.
However, problems associated with overuse of the sound limb, degenerative arthritis, obesity, and cardiovascular co-morbidities often arise later in life for amputees. Furthermore, one of every two people with lower-limb amputation was reported to have a history of falling [1]. It has been shown that physical activity is a strong predictor for quality of life in amputees [2]. However, community-based exercise programs for people with lower-limb amputation are limited because they often require special considerations when engaging in exercises. Since walking is the most important function in daily life, beneficial changes in gait will enable amputees to increase walking and achieve potential cardiovascular benefits. This pilot study examined the effects of 8-week comprehensive fitness training programs on gait and functional capacity in individuals with lower-limb amputation.
Statement of clinical significance Previous gait studies on amputees were often conducted at one speed, i.e. at comfortable speed of walking, in a gait lab [3]. Daily walking involves natural variations in speed which often are not analogous to what is observed in a gait lab. Examining gait in multiple speeds of natural walking may provide a better picture on amputee gait. The six-minute walk test is a common and reliable outcome measure on cardiovascular endurance, which measures how far a person can walk in six minutes [4]. During the walk test, a person often naturally speeds up or slows down, so gait patterns at a range of walking speeds could be analyzed. Adding gait analysis during the walk test can allow us to examine the relative control between the sound leg and the prosthetic leg at a range of walking speeds, rather than only the distance of walking during the walk test.
Methodology
The inclusion criteria of subjects were being sedentary, stable medical conditions, intact skin of the residual limb, independent walking with a prosthesis for at least 6 months. Eight individuals enrolled and informed consent was obtained. Participants were randomly assigned to a home-based exercise group or a supervised training group in our facility. Four subjects with transtibial amputation completed the study (Age: 57±12 years, BW: 107± 30 kg), with two in each group. To take into account of learning effect, two trials of the six-minute walk test were conducted pre- and post-training. It was conducted on a 150-foot segment of a hallway, with distance, heart rate, blood pressure, and rating of perceived exertion measured pre- and post-walk test. One short segment of hallway had an instrumented walkway (GAITRite, CIR systems Inc. Havertown, PA), which automatically collected temporal-spatial gait parameters every time the participant walked on it. The home-based exercise group was given a specially designed exercise booklet and was encouraged to walk at least 20 minutes a day. The supervised group was trained three times a week in our facility, including resistive muscle training, balance exercise, and aerobic exercise via treadmill, elliptical bike, or level walking. Each subject was given a pedometer and was asked to record their daily step counts. Only 4 subjects completed the study, hence descriptive statistics were used for describing demographic data and the six-minute walk
443

test data. Linear regression analysis was used to analyze the relationship between step length and speed for both the sound leg and the prosthetic leg.
ResultsAfter training, three participants showed increased distance during the walk test, ranging
from 65 to 71 ft, with one subject in the home exercise group (S1) showing the largest increase in distance (162ft). His gait patterns are shown below. Step length increased with increasing speed of walking for the sound leg (S), but not for the prosthetic leg (P) before training (A). Aftertraining (B), the prosthetic leg showed increased step length with increasing speed of walking – a trend similar to that of the sound leg. The gait pattern became more symmetric between the two legs after training. The other three subjects had a more symmetric pattern between the two legs prior to training and their sound legs improved much more than the prosthetic leg after training.
A. Pre-training for Home S1
78
80
82
84
86
88
90
92
150 155 160velocity (cm/s)
step
leng
th (c
m)
step length Pstep length S
B. Post training for Home S1
80
85
90
95
160 165 170 175 180 185velocity (cm/s)
Step
leng
th (c
m)
step length Pstep length S
DiscussionAdding gait analysis during the walk test provided us some new insights on the gait
control before and after exercise training in amputees, not only at one speed, but over a range of walking speed. Distance of the walk test alone could not provide a good picture on how amputees have improved after community-based exercise training. Home exercise plus daily walking program seemed to have improved gait control in amputees. The supervised training group seemed to show more improvement on the sound leg than the prosthetic leg. However, no definite conclusions could be made due to the small sample size. Further studies are needed to show what kind of community-based exercise training is more effective for improving gait.
References1. Miller WC, et al. Arch Phys Med Rehabil. 2001;82(8):1031-7. 2. Deans SA, et al. Prosthet Orthot Int. 2008;32(2):186-200. 3. Su PF, et al. J Rehabil Res Dev. 2007;44(4):491-501. 4. American Thoracic Society. Am J Respir Crit Care Med. 2002;166(1): 111
Acknowledgement: This study was supported by a grant from the Texas Physical Therapy Foundation.
444

OUTCOMES FOLLOWING NON-OPERATIVE TREATMENT FOR CLUBFOOT
Is there a relationship between Gait Analysis, the Peabody and the PODCI?
Kelly A. Jeans MS, Lori A. Karol MD, Kim Kaipus PT, MPT and Shawne Faulks RN, MSN, CNS
Texas Scottish Rite Hospital for Children, Dallas, Texas
Introduction Non-operative treatment for clubfoot has been widely adopted as an alternative to
surgical management. Two methods are currently being used at this institution, the Ponseti casting
technique (Ponseti) and the French physiotherapy method (PT). Subtle differences in gait have been
found between groups at 2 years of age, including mild residual equinus in 15% of the PT feet, while
48% of Ponseti feet had excessive dorsiflexion.1
Follow up at 5 years of age included a group of patients initially treated non-operatively, who went
on to surgical management (Surgical) when full correction was not achieved or maintained. Results
showed no differences in kinematic or kinetic variables between clubfoot treatment groups, be it non-
operative or operative. When compared to a group of controls, significant differences showed that
the Surgical and PT feet had reduced ankle Dynamic ROM, ultimately leading to poor sagittal plane
ankle power. The Ponseti feet had normal ankle motion and power.2
The Peabody developmental motor scales (Peabody) and the Pediatric Outcomes Data Collection
Instrument (PODCI) were administered to a subgroup of the 5 yr old clubfoot patients. The purpose
of this study was to see if ankle kinematics and kinetics correlate to Peabody performance and if
functional outcome correlated to the parent’s perception of function.
Clinical Significance Functional outcome studies conducted at incremental stages of development
have helped clinicians objectively assess non operative treatment protocols. Since non-operative
approaches have gained the attention of the orthopedic community, it is essential to assess ankle and
foot function during gait, and functional motor skills following treatment.
Methods Fifty-six clubfoot patients initially treated non-operatively underwent gait analysis and the
Peabody assessment at approximately five years of age, as part of a prospective study. PODCI scores
were available for 36 of the patients. Gait analysis included kinematic and kinetic data collection
with two ATMI force plates (Watertown, MA), and a VICON system using Plug in Gait (Vicon,
Oxford, England) for data analysis. A representative trial was used for analysis. In patients with
bilateral involvement, one limb was selected randomly and included in the analysis. The following
gait variables were identified: mid stance maximum dorsiflexion (Max DF), plantar flexion at toe off
(Max PF), total dynamic range of motion (DynROM) in stance, and peak ankle power. The Peabody
was conducted by a trained therapist, and scored according to age at test and normalized. Overall
scoring included a stationary, locomotion and an object manipulation score which are combined as
the Gross Motor Quotient which is represented as a total percentile ranking (Total%). Results from
the Sport/Physical Functioning Scale (Sport/Phys Funct) and Global Functioning Scale (GFS) of the
PODCI were used to assess parent-perceived function. Data points were averaged and presented as a
mean with the corresponding standard deviation. Between group comparisons were made with an
ANOVA (p<0.05) and a post hoc Tukey test was run to determine level of significance. Pearson’s
correlation coefficient was conducted between gait variables, Peabody Total%, and the PODCI
Sport/Phys Funct and the GFS.
445

������������� ������������� ����������������������������������������������������������������������������������� �!"#"$%#������&��'������(���������'���������������'�������� ������� �)"#"*+,%���������'����������������������������� ���'�����'���� ��������������#���'���������������-���������������������������,*(��'�����'���������������������������.����������'��$"�'������������ *$�'�����*/�'����������0���%#�����1���������'�����'����'����.����� ����������������0������������'����������'�������������������'� ��'�����������������������'������1���������0�������'�����'����������������'��� �0�����������������0����������������������'���������� 2(%#������������������������������1�����������������������������������(���������������3�'���4���������54�#���'�������������� �������������������������'������������������(���������3�'���4����� �)"#,2627��)"#"82,%����������(�����54�� �)"#,/687��)"#",26%#�������� ���������������������������������������������������������������������������������#���
����������� ��
����������������
���������� ��
���������������� ��� �������
� ���!�"����#��� ���
������$ %& %'()�*'(+� %)(,�*-(%� )-(.�*.(.� ,(%�*+(.� /&('�*-(0� '-()�*%-(0� /+(.�*&(%� .%('�*.(.�
�� %& %%(&�*.(,� %'(%�*&('� ).(/�*.(.� )(-�*+(0� /0(/�*-(+� '.(+�*%'(0� &'(/�*%'(+� .%(0�*.(0�
�#�1$��� )+ %'()�*-()� %%(0�*0(%� ).(&�*'(.� )(-�*%(+� /,(,�*0('� ,'(,�*%0(+� &.('�*%,(%� '-(-�*0(/�
��2�����34�2� ���52�6�7��4
������#������� ������������� 9��%� ������ ����������������������'�� ����������:���� ��#��������� �������� ������������� �����������������#���������������������� ��������'�0��������'��������1���1��������������1�������������������������������'������������������������������0������������������������ �������8��������� ������������� ���������������������������#���� �������� �*����������������������������������� �����������������������������'������'���'���-�������������� ������������1���������������'�'��3'��������#���'���������'�����������������������'���������'�������������������� ������� ��'������������������� ������� ���������������#���������������'����������� �������������1����������������������1�����������������������0�� ��'���'���-��������������� ����'��������#�������������������� ��'���������-������������������������'������� ���������������'��0������������� ����������������0�����������������'���������-�������������(�����#������������������������������ ��'���'���-����������������������0�� ����������� ������#��������������1��1��������������� ������� ����������� ������������������������������� ��������'�����'���������������������#������� �0�����������'�������������.�����������������������������������0�#��������'������'����'�����'������-��������������������������������������'����������������������������'�������� ���1�����'�������'��� �������������������������;��������#���'������������ ���� ���1�����������'����0�����������������'����������������������������������'���������� ����������������#����������������#��<��=������������#� 8""2%�>�? ���> �������@���+"���$"2A�/#�8#��B����������#� 8""+%���������� �������������*/6���8"/A�8�,#�
446

Effects of progressive ankle equinus on the ipsilateral leg during child gait
Sylvain Brochard1,2,3
, Laetitia Houx1, Mathieu Lempereur
1,2, Olivier Rémy-Néris
1,2,3
1 CHU Brest, Service de Médecine Physique et de Réadaptation, Brest, F- 29200 France
2
Inserm, UMR_S 650, IFR 148, Brest, F-29200 France
3Université Européenne de Bretagne, Brest, France
Introduction
Equinus deformity is the gait pattern the most prevalent in child neurological disorders. It
induces biomechanical and functional changes which have been previously explored [1,
2,3,4]. However, these studies did not standardized the degree of the induced equinus when
exploring the gait changes. The aim of this study is to measure joint kinematics of the
ipsilateral leg when equinus is induced by a personalized orthosis at different degree of ankle
plantarflexion.
Clinical significance
There is a lack of evidence about the effect of isolated ankle equinus on child gait pattern.
Methods
Ten healthy children of 9,7 ± 1,25 years (4 girls and 6 boys) realized 4 trials along ten meters
at walking speed of 1 m/s in a gait analysis laboratory (Vicon, Oxford Metrics, Oxford, UK).
under different gait conditions: without orthosis, with orthosis without constraint (free), at 10°
of dorsiflexion (-10°), 0°, + 10°, +20° of plantarflexion and maximal tolerated plantarflexion
(+Max). Following data were analysed: spatio-temporal parameters, ipsilateral kinematic
joints using Benedetti’s recommandations [5]. Wilcoxon’s tests were realized to compare
conditions.
Results
Spatiotemporal parameters did not change during the progressive equinus. There was no
significant difference between the normal gait and the gait with “free” condition. The desired
447

angles were close to the obtained ankle plantarflexion at initial contact. At +Max and at initial
contact, we obtained a mean ankle dorsiflexion of 21.65° (SD 4.17). At initial contact, the
effect of equinus on the ipsilateral knee was moderate with a mean knee flexion of 17.41° (SD
10.67) observed at +Max. Two gait patterns appeared during stance phase: recurvatum knee
and flexed knee. The knee flexion peak during swing phase did not change. Concerning the
hip, the main changes appeared at +20°. There was a small increase of hip flexion at initial
contact (27.9° at free to 34° at +Max) and a larger increase of hip flexion during swing phase
(32.28° at free to 40.02° at +Max). The pelvis showed small changes with an increased pelvic
tilt (9.89° at free to 13.32° at +Max) but no other modification. Overall, effect of equinus was
significant when equinus was upper than +10°.
Discussion
This study isolated the effect of a progressive equinus until 20° of plantarflexion on the
ipsilateral leg in healthy children. More equinus has not been tolerated by the children.
Compared to the gait of the hemiplegic children presenting the same equinus the gait
deviation seems smaller. Equinus when isolated does not seem to have large effect on joint
kinematic of the leg. Comparisons to pathologic population should improve the understanding
of child abnormal gait pattern.
References
[1] Goodman M, et al. Gait Posture 2004;20,238-244.
[2] Matjacic Z, et al. J Biomech 2006;39(2), 255-266.
[3] Kerringan D et al. Arch Phys Med Rehabil 2000;81, 38-44.
[4] Perry J et al. Arch Phys Med Rehabil 2003;84(1),7-16.
[5] Benedetti M et al, 1998. Clin Biomech (Bristol, Avon);13(3), 204-215.
Acknowledgements
The authors would like to thanks Ouest Orthopédie society and IPSEN laboratory for their
support.
448

GAIT ANALYSIS IN TKR PATIENTS: WHAT'S NEW WITH
ADVANCED PROSTHESIS DESIGNS?Benedetti M.G., Catani F., Leardini A., Belvedere C, Berti L.,Giannini S.
Movement Analysis Laboratory, Orthopaedic Division, Istituto Ortopedico Rizzoli, Bologna.
Introduction
Most of the gait analysis studies on patients with total knee replacement (TKR) demonstrated
unsatisfactory kinematics, kinetics and muscular activity [1]. This was accounted for to
standard activities of the patients before surgery, proprioceptive deafferentation, comorbidity.
Also the role of the specific TKR design was explored [2,3], but gait abnormalities were
found irrespectively of this, traditional designs being posterior cruciate retaining (CR),
posterior stabilized (PS), mobile bearing (MB). The aim of the present work is to explore gait
kinematics, kinetics and muscular activity in patients operated on two fixed bearing TKA
designs of new conception: the BCS, and the posterior stabilized rotationally unconstrained.
Clinical Significance
Intrinsic kinematics of TKR is continuously revised to replicate normal knee motion. Gait
analysis can assess the relevant real performances in-vivo.
Methods
Ten patients operated on BCS (Journey® BCS, Smith & Nephew, London-England) (mean
age 63,3 SD 9,9 years; height 159,3 SD 9,4 cm; weight 71 SD 9,4 Kg, follow up 6 SD 1
months) and eleven patients operated on the posterior stabilized rotationally unconstrained
fixed bearing TKA (NRG Knee System - Stryker ®, Kalamazoo, MI, USA) (mean age 70,7 SD
4,5; height 163,4 SD 6,4; weight 75 SD 26,4; follow up 9 SD 3 months) were assessed by
means of gait analysis (Vicon Motion System, 8 TVC, two Kistler forceplates, Zerowire
EMG, Aurion, Milan; protocol Total3Dgait [4]). All the patients were operated by the same
surgeon with the aid of a surgical knee navigation system. Clinical assessment was performed
by using the International Knee Society (IKS) clinical score.
Results
Mean IKS score was 83,8 SD 12 for NRG group (range 62-96) and 80,5 SD 13,8 for Journey
group (range 56-93). Speed of progression was reduced in both groups (NRG 81,5 cm/s SD
20; Journey 84,2 cm/s SD 20,7; control 127,8 cm/s SD 11,2) both for reduced stride length
(NRG 103,1 cm SD 7,1; Journey 104,99 cm SD 19,5; control 127,8 cm/s SD 11,2) and
cadence (NRG 47 str/m SD 5,9; Journey 47,83 str/m SD 6,4; control 54,3 str/m SD 3,9),
though no statistically significant. Data on knee kinematics and kinetics in the sagittal plane
are reported in Table 1. No abnormalities were found for knee flexion at loading response
phase, though NRG group showed a larger knee flexion. Detailed analysis of the kinematics
patterns revealed that among the Journey patients four had normal knee flexion during
loading response phase and two of them also normal flexion-extension moment while other
had an extended knee pattern. In the NRG group five patients had normal knee flexion pattern
during loading response but all of them had a prevalent knee extensor moment. Other patients
presented a lack of re-extension during terminal stance. EMG activation interval showed
prolonged activity of medial and lateral hamstrings in both groups.
449

Table 1 (*pairwise post hoc analysis Mann Whitney test with Bonferroni correction)
Discussion
A physiologic bi-phasic flexion/extension pattern was observed at the replaced knee both in
terms of kinematics and kinetics, also without muscular co-contraction, in about half of these
patients with advanced prosthesis designs. The coordinated activity of the agonist and
antagonist muscles at the knee and a normal absorption function is fundamental to result also
in physiological loading of the prosthesis, thus preserving it from early failure. However, a
number of patients in both groups always shows gait abnormalities such as knee extended
patterns during loading response, knee lack of extension during terminal stance and extensor
moments. It emerged also that most of these patients presented comorbidities such as hip or
contralateral knee osteoarthitis. Further analyses are necessary to fully understand the reasons
of these abnormalities. It is confirmed that prosthesis design is not the only cause of gait
abnormalities in TKR patients.
References
[1] McClelland JA, Webster KE, Feller JA. 2007. Gait analysis of patients following total
knee replacement: a systematic review. Knee 14: 253-26317. [2] Gandhi R, de Beer J, Leone J
et al. 2006. Predictive risk factors for stiff knees in total knee arthroplasty. J Arthroplasty 21:
46-52. [3] Cates HE, Komistek RD, Mahfouz MR et al. 2008. In vivo comparison of knee
kinematics for subjects having either a posterior stabilized or cruciate retaining high-flexion
total knee arthroplasty. J Arthroplasty 23: 1057-1067 [4] Leardini A, Sawacha Z, Paolini G et
al. 2007. A new anatomically based protocol for gait analysis in children. Gait Posture 26:
560-571.
Parameter Group Mean SD
control 4,50 3,52
<0,0005 <0,0005 NS 0,01000NRG 8,78 4,07
Journey 4,67 6,56
control 16,01 5,97
<0,0005 NS NS 0,01000NRG 18,13 5,17
Journey 12,48 6,94
control 4,27 3,84
<0,0005 <0,0005 NS 0,00020NRG 10,93 4,04
Journey 5,26 5,28
control -2,36 1,56
<0,0005 <0,0005 NS 0,00100NRG -1,22 0,64
Journey -1,96 0,89
Max ext torque
control 4,07 1,78
<0,0005 0,00340 <0,0005 0,01000NRG 2,72 1,07
Journey 1,86 0,94
control -2,82 1,14
<0,0005 <0,0005 <0,0005 NSNRG -0,11 0,49
Journey -1,06 1,35
Kruskal
Wall is
contr vs
NRG *
contr vs
journey*
NRG vs
journey*
Flexion at Foot
Contact
Max flexion at
loading response
Max extension in
Stance
1st max flex
torque
2nd max flex
torque
450

The Impact of Speed and Crouch on Stiff Knee Gait in Normal Adults Hutchens J, Miller A
Mary Free Bed Rehabilitation Hospital; Grand Rapids, MI USA
Introduction: Crouch gait, characterized by increased knee flexion in stance, and diminished walking
speed are commonly seen in patients with neurologic disorders such as cerebral palsy [1,2]. These
patients also frequently present with a stiff knee gait pattern characterized by delayed and diminished
peak knee flexion [1,2]. However, the impact of walking speed and increased knee flexion in stance
on stiff knee gait is not well understood.
Clinical Significance: An investigation into the relationship between crouch gait, diminished walking
speed, and delayed and diminished peak knee flexion will aid in better understanding stiff knee gait.
Methods: Data were analyzed retrospectively from a study in which nineteen able-bodied adults (ages
18-40) were tested walking in 16 different semi-randomized combinations of speed (4) and crouch (4).
Crouch was induced via unilateral taping of the posterior knee joint and speed was controlled using a
laser timing device. Several gait cycles were chosen for analysis from each subject in each condition
(1560 total gait cycles). The following variables were extracted for analysis: peak knee extension
during midstance, walking speed, peak knee flexion during swing, early swing knee ROM, timing of
peak knee flexion, total dynamic knee ROM, average knee flexion velocity between midstance and
peak knee flexion, peak knee flexion velocity, and knee flexion velocity at toe-off. Multiple regression
was used to examine the relationship between walking speed and peak knee extension during
midstance with all measures of stiff knee gait. Significance was determined a priori at α = 0.05.
Results: All multiple regression models
were significant (p<<0.01). Dynamic
knee ROM increased with increased
walking speed, but decreased with
increased crouch (R2 = 0.79). Peak knee
flexion velocity, average knee flexion
velocity, and knee flexion velocity at
toe-off all decreased with increased
crouch, but increased with increased
walking speed. Peak knee flexion
magnitude tended to increase with both
walking speed and crouch. In addition,
peak knee flexion occurred earlier with
increasing crouch, but was delayed with
increased speed, although this
relationship was relatively weak.
Table 1.
Adjusted R2Model
Significance P-Value B B-stdPeak Knee Flex (°) 0.636 <<0.01
MdSt Peak Knee Ext <<0.01 0.254 0.420Walking Speed (m/s) <<0.01 11.966 0.580
Peak Knee Flex Time (% Sw) 0.310 <<0.01MdSt Peak Knee Ext <<0.01 -0.128 -0.261Walking Speed (m/s) <<0.01 7.327 0.438
Early Swing ROM (°) 0.598 <<0.01MdSt Peak Knee Ext <<0.01 -0.379 -0.500Walking Speed (m/s) <<0.01 12.648 0.489
Dynamic Knee ROM (°) 0.786 <<0.01MdSt Peak Knee Ext <<0.01 -0.746 -0.742Walking Speed (m/s) <<0.01 11.967 0.348
Peak Knee Flex Vel (°/ % GC) 0.567 <<0.01MdSt Peak Knee Ext <<0.01 -0.040 -0.666Walking Speed (m/s) <<0.01 0.476 0.234
Avg Knee Flex Vel (°/ % GC) 0.635 <<0.01MdSt Peak Knee Ext <<0.01 -0.018 -0.537Walking Speed (m/s) <<0.01 0.555 0.482
TO Knee Flex Vel (°/ % GC) 0.553 <<0.01MdSt Peak Knee Ext <<0.01 -0.038 -0.684Walking Speed (m/s) <<0.01 0.337 0.178
451

Discussion: Previous
research, based on a
dynamic walking model,
has suggested the
biomechanics of crouch
gait to cause a decrease in
the amount of peak knee
flexion [3]. The results of
the current study are in
direct contrast and show
that the amount of peak
knee flexion tends to
increase slightly with
increased crouch in
neurologically normal
adults. The present study
also illustrates that the
amount of peak knee
flexion increases with
increased speed in this
population.
The findings of this study
also suggest that increased
crouch and decreased
walking speed decrease the
rate of knee flexion in
normal adults. These
relationships imply that we
must proceed with caution
when using a decreased
rate of knee flexion
velocity as an indicator for treatment of stiff knee gait in the presence of slow walking and/or crouch
gait.
One must interpret the results of this study with discretion as all subjects were neurologically normal
adults. The presence of muscle spasticity, contractures and weakness in children with neurological
impairments add further complexity to the treatment of stiff knee gait in the presence of crouch gait.
References
[1] Gage et al. The Treatment of Gait Problems in Cerebral Palsy, 2004.
[2] Perry, J. Gait Analysis Normal and Pathological Function, 1992.
[3] van der Krogt et al. GCMAS 14th
Annual Meeting 2009.
0
10
20
30
40
50
60
70
80
90
0 0.5 1 1.5 2 2.5
Pe
ak K
ne
e F
lex
(°)
Walking Speed (m/s)
0
5
10
15
20
25
30
35
40
45
0 0.5 1 1.5 2 2.5Pe
ak K
ne
e F
lex
Tim
e(%
Sw
)
Walking Speed (m/s)
0
10
20
30
40
50
60
70
80
0 0.5 1 1.5 2 2.5
Kn
ee
RO
M (°
)Walking Speed (m/s)
0
0.5
1
1.5
2
2.5
0 0.5 1 1.5 2 2.5
Avg
Kn
ee
Fle
x V
el (
°/
%gc
)
Walking Speed (m/s)
0
10
20
30
40
50
60
70
80
-10 0 10 20 30 40 50 60
Kn
ee
RO
M (°
)
Mid Stance Peak Knee Extension (°)
0
0.5
1
1.5
2
2.5
-10 0 10 20 30 40 50 60
Avg
Kn
ee
Fle
x V
el (
°/
%gc
)
Mid Stance Peak Knee Extension (°)
0
10
20
30
40
50
60
70
80
90
-10 0 10 20 30 40 50 60
Pe
ak K
ne
e F
lex
(°)
Mid Stance Peak Knee Extension (°)
0
5
10
15
20
25
30
35
40
45
-10 0 10 20 30 40 50 60Pe
ak K
ne
e F
lex
Tim
e(%
Sw
)
Mid Stance Peak Knee Extension (°)
452

ANALYSIS OF SELF-SELECTED WALKING VELOCITY AND MAXIMUM
VELOCITY IN PATIENTS WITH UPPER MOTOR NEURON SYNDROME
Alberto Esquenazi (*)
, Daniela García, Stella Kim, Barbara Hirai
(*) Gait and Motion Analysis Laboratory, MossRehab, Elkins Park, Pennsylvania, USA.
INTRODUCTION: Gait velocity can be an indicator of motor function and also an
important predictor of quality of life and functional independence. Velocity can vary with
height, body weight, gender, or age. The ability to change walking speed permits
adaptability and proper response to obstacles and daily living needs. Upper motor neuron
syndrome (UMNS) is caused by a lesion of the descending corticospinal tracts, and may
be the result of trauma or disease. In adults stroke and traumatic brain injury (TBI) are
the most common causes of this syndrome. Patients with UMNS have reduced gait
velocity and less ability to adapt their speed to environmental challenges. Few studies
have evaluated gait velocity range in this population compared to normal (1)
, or the
differences between patients with stroke and TBI. To our knowledge, there are no
publications that have investigated the possible relationship between self-selected
velocity (SSV) and maximum velocity (MV).
CLINICAL SIGNIFICANCE: The main objective of this study is to report the SSV and
MV in patients with UMNS resulting from stroke or TBI seen in a Gait and Motion
Analysis Laboratory. Secondary objectives were to study the possible differences in
walking velocity range between stroke and TBI populations, the correlation of self-
selected to maximum walking speed and the influence of demographic variables on these
parameters.
METHODS: Retrospective study that analyzed all the clinical charts of patients with
diagnosis of stroke or TBI seen in the MossRehab Gait and Motion Analysis Laboratory
from January 2006 to October 2009. Each evaluation included at a minimum physical
exam, video recording with forceline visualization and temporal spatial profile of the
patient’s gait obtained with the electronic Gait Mat II. For this study we included only
adult patients that had both SSV and MV measurements recorded in the same visit and
under the same walking condition. Age, gender, diagnosis, body weight, and leg length
was also recorded. Patients were subdivided by diagnosis and also by self-selected gait
velocity (slow: ≤ 0.49 m/sec, moderate: 0.5-0.99 m/sec, fast: ≥ 1 m/sec) (2)
.
RESULTS: Of 2,060 records reviewed, 100 met the selected criteria, 51 had a diagnosis
of stroke and 49 TBI. Average age was 44.4 +/- 16.4 years. More than half the patients
were male (63%). The average body weight was 78.3 +/- 17.2 kg. The average leg length
was 0.85 +/- 0.05 m. The average SSV was 0.63 +/- 0.25 m/sec, the MV 1.01 m/sec +/-
0.2, and the average difference between measures or velocity range was 0.38 m/sec +/-
0.19. We found a statistically significant positive correlation between SSV and
453

MV (.0001). When the patients were subdivided by diagnosis we found a significant difference between the gait velocity range of stroke and TBI (p: 0.046). Only age and gender had a significant difference (p: .0001 and p: .01, respectively) with diagnosis. Lastly the sample was divided in three groups based on the SSV (see methods). Forty-two of the patients were in the slow group, 45 patients in the moderate, and 13 in the fast group. Velocity range differed significantly among the SSV groups (slow vs. moderate p: .012; slow vs. fast p: .0001; moderate vs. fast p: .005). We analyzed the impact of the demographic variables in the results and found a statistical difference between the age of both the slow group with the fast and the moderate with the fast (p: 0.0001 and p: 0.001, respectively). There was also a significant difference between diagnosis distribution in the slow and fast group, and between the moderate and the fast group (p: 0.01 and p: 0.004, respectively). But we did not find any difference between the age of the slow and moderate group, the diagnosis distribution between the slow and moderate group, with body weight, gender or lower limb length.
DISCUSSION: In our UMNS patients’ SSV is less than 50% of the same parameter reported in the literature for the normal population and limited MV range increase of 45%. The smaller range of velocity that this patients present could partially explain their difficulty to function normally in daily life. The positive correlation between SSV and MV suggests that SSV could be used to predict the range in velocity and should be implemented as a therapeutic goal. We also found that the TBI patients were significantly faster than stroke patients and they also had greater velocity range. The factors likely contributing to this difference are a younger age and male gender in this group. This study suggests that SSV is a useful tool to estimate the range of velocity produced by UMNS patient to accommodate to common demands. The demographic factors that play a role in these results are age (younger=faster) and the diagnosis. Further studies are suggested to corroborate the influence of the different demographic factors involved.
REFERENCES: (1) Mayer N, Esquenazi A. The use of digital video recording for observational analysis of gait. Phys Med Rehabil 2002; 16 (2): 179-199. (2) Ochi F, Esquenazi A, Hirai B, Talaty M. Temporal-spatial feature of gait after traumatic brain injury. J Head Trauma Rehabil 1999; 14 (2): 105-115.
454

Gait variability differences in MS patients are not affected by resistance training
Jeffrey P. Kaipust1, Jessie M. Huisinga
1, Mary L. Filipi
2, Anastasia Kyvelidou
1, and Nicholas
Stergiou1,3
1Nebraska Biomechanics Core Facility, University of Nebraska at Omaha, Omaha, NE
2University of Nebraska Medical Center, College of Nursing, Omaha, NE
3University of Nebraska Medical Center, College of Public Health, Omaha, NE
Email: [email protected] URL: http://biomech.unomaha.edu
Introduction
Multiple Sclerosis (MS) is an autoimmune disease of the CNS which causes progressive
disability. Neurological deficits such as weakness, spasticity, ataxia and sensory disturbance are
common even at the early stages of the disease and lead to gait impairment. A meta-analysis has
shown that exercise training improves mobility in MS patients1. However, the effect of exercise
training on walking in MS patients have only been reported in terms of spatiotemporal changes
during short walking distances 2
. Our goal was to determine the effects of progressive resistance
training on stride length and step width variability from multiple strides during continuous
walking in MS patients. We hypothesized that resistance training improves neuromuscular
communication in the lower extremities resulting in improved gait variability.
Clinical Significance Current pharmacological therapy is not available to treat the gait impairment of MS
patients. Exercise has been shown to have a positive effect in MS patients by slowing down the
progression of the disease by improving physical functioning and walking mobility1. However,
there has been no determination of the specific exercise training programs which would be the
most efficient in improving walking parameters of MS patients. The current resistance training
intervention could possibly be such a program.
Methods Nineteen MS patients (age 44.81 ± 10.50 years; EDSS 4.3 ± 1.6) and ten healthy controls
(age 35.3 ± 9.78 years) walked at their self-selected pace on a treadmill for three minutes, while
kinematics was collected with an 8-camera Motion Analysis system (60 Hz). Data was collected
at baseline (pre) and three months (post) after participation in a twice weekly progressive
resistance training program that included core exercises and specific routines for both lower and
upper extremities. The Standard Deviation (SD) and Coefficient of Variation (CoV) (both
measures of the amount of variability) and the Approximate Entropy (ApEn) (m= 2; r= 0.2*SD)
and Detrended Fluctuation Analysis (DFA) (both measures of the temporal structure of
variability) were used to investigate the fluctuations present in stride length and step width from
125 continuous steps. Independent t-tests were used to compare MS patients, pre and post
intervention, to healthy controls, while paired t-tests were used to compare changes due to
training within MS patients.
Results Compared to controls, before training MS patients had significantly smaller stride lengths
(p=0.003) but no differences in step width (Figure 1). SD (p=0.008) and CoV (p=0.002) were
both significantly larger for stride length but showed no differences for step width (Figure 1a).
ApEn was significantly lower for stride length (p=0.001) and step width (p=0.001) (Figure 1b,c).
DFA was significantly higher (p=0.007) patients for step width only (Figure 1c). Compared to
controls, after training there were no changes in the significant differences between groups.
455

Compared to baseline, after training MS patient’s ApEn significantly decreased for stride length
only (p=0.006) (Figure 1b). No other differences were found as a result of resistance training.
Discussion
Differences existed between MS patients and healthy controls prior to the resistance
training intervention which did not significantly improve after training. The lack of significant
differences as a result of the resistance training intervention may be due to the lack of specificity
in the program. One of the fundamental principles of experience dependent neuroplasticity is the
need to apply specificity of training, where the nature of training experience dictates the nature
of plasticity3. In this case MS patients would require gait specific training to improve gait
parameters. In MS patients, ApEn for stride length, where stride length is a function of sagittal
plane movement controlled by spinal neuronal circuits4, significantly decreased with training.
The resistance training may have caused an improvement in afferent signal conduction of the
lower extremities such that the spinal neuronal circuits may have increased control over
the locomotor pattern resulting in a more periodic stride length pattern. For step width, the
scaling exponent α was similar between MS patients and controls just as in Hausdorff et al5
where they found similar scaling exponent α values between other neurological disease patients
and healthy controls. In conclusion, while resistance training may improve overall physical
health of MS patients, it does not significantly affect gait variability measures. In order to
improve the deficits seen in MS patients a more specific gait training protocol is necessary.
Acknowledgements
This work was supported by the MARS Foundation, the National Institutes of Health (K25
HD047194), and the Nebraska Research Initiative.
References 1. Snook EM & Motl RW (2008) J Pain Symptom Manage 36(1): 46-53.
2. White LG, Dressendorfer RH. (2004) Sports Med. 34(15): 1077-100.
3. Kleim JA, Jones TA (2008) J Speech Lang Hear Res. 51(1): S225-93.
4. Dietz, V (1992) Phsiol Rev. 72(1): 33-69.
5. Hausdorff, JM (1997) J Appl Physiol. 82(1): 262-269.
Figure 1: Results for Stride
Length & Stride Width.
*Significant differences
between groups (p<0.05).
†Significant differences
within MS patients (p<0.05).
456

Variability of lower extremity joint moments during stair negotiation in young and older adults Alison C. Novak, Brenda Brouwer Motor Performance Laboratory, School of Rehabilitation Therapy, Queen’s University, Kingston, ON Introduction Stair ascent and descent requires greater lower extremity muscle moments compared to level ground walking1,2. As such, the requirements (demands) of the task may prove challenging for older adults experiencing age-related decline in physical activity and strength. It follows that to meet the higher demands variation in moment patterns and the relative contribution of each joint to the overall net support moment produced may differ from young adults. The purpose of this study was to examine the lower extremity joint moments and their variability during stair negotiation in healthy older adults and young adults. Clinical Significance Understanding age-related differences in the joint kinetics and their variability during functional tasks, such as stair negotiation, can inform the rehabilitation management and assessment of patient populations. Methods Twenty three young adults (23.6 ± 3.0 years) and thirty two older adults (67.0 ± 10.8) were recruited. All subjects were free of any neurological or orthopaedic condition affecting their lower limbs or walking ability. Subjects were instructed to ascend and descend stairs several times at a self-selected pace in a step over step manner without the use of a handrail. Full lower limb, three dimensional, bilateral gait analysis (Optotrak 3020 motion analysis system) provided joint moment profiles of the ankle, knee, hip and support moment throughout stance. A single coefficient of variation (%CV) was determined for the ensemble averaged curves for ascent and descent reflecting intra and inter-subject variability. Mixed factor ANOVA was used to compare kinetic variables of interest and %CV between the groups and sides. Data are reported for the dominant side only since no side-to-side differences were detected. Results During stair ascent, older adults demonstrated smaller ankle extensor moments in early and late stance (p<0.013) contributing to a lower support moment in early stance (p=0.04) compared to young adults. In late stance however, the support moment was higher than in young adults due to the greater knee flexor moment generated by young adults in terminal stance (p<0.001). Similarly, during stair descent, ankle extensor moments in older adults were low in early stance (p=0<0.001) and appeared to be compensated mainly by the hip extensors resulting in similar
457

458

Frequency Analysis of Ground Reaction Forces Shows Differences in Gait in Multiple
Sclerosis Patients
Shane R. Wurdeman1, Jessie M. Huisinga
1, Mary L. Filipi
2, Nicholas Stergiou
1,3
1Nebraska Biomechanics Core Facility, University of Nebraska at Omaha, Omaha, NE
2University of Nebraska Medical Center, College of Nursing, Omaha, NE
3University of Nebraska Medical Center, College of Public Health, Omaha, NE
Email: [email protected] URL: http://biomech.unomaha.edu
Introduction
Multiple Sclerosis (MS) is a progressive neurological disease that is characterized by
exacerbations and remissions of symptoms such as trunk and limb paresthesias, limb weakness,
clumsiness, gait ataxia, and cognitive decline[1]. Gait disturbance is one of the most common
disabling symptoms of MS with eighty-five percent of patients reporting it as primary
complaint[2], but gait analysis in MS patients has been limited to reports of spatiotemporal
parameters[3]. Thus, our goal was to quantify gait parameters of MS patients using frequency
analysis during overground walking. Frequency domain analysis has been used in biomechanical
studies to quantify differences in healthy and pathological populations[4, 5]. We hypothesized
that the median frequency, 99.5% frequency, and the frequency bandwidth of the vertical and the
antero-posterior ground reaction forces would be different in MS patients compared to healthy
subjects.
Clinical Significance
Traditional gait measures that analyze discrete points as a function of time do not provide
a comprehensive description of the overall gait pattern. Frequency analysis examines the overall
combined oscillations of the movement occurring throughout the gait cycle[6]. Any differences
found between healthy controls and patients may be a direct result of impairment in movement
resulting from an underlying pathology. The increased sensitivity of frequency domain analysis
may allow earlier diagnosis of the underlying pathology that affects gait performance.
Methods
Eighteen MS patients (age 45.3±9.7 yrs; EDSS 3.9±1.6) and eighteen age-matched
healthy controls walked across a 10 meter long walkway. Ground reaction forces (GRF) were
collected using an embedded Kistler force platform sampling at 600 Hz. A minimum of 5 trials
were collected for each limb, yielding a total of 36 limbs for each group. The antero-posterior
(A-P) and vertical GRF were evaluated in the frequency domain throughout stance using fast
Fourier transformation implemented in Matlab. The transformation breaks down a signal into all
of its component frequencies[6]. In this manner, the original signal can be thought of as a
summation of all the different frequencies resulting from the varying motions of different parts
(e.g. joints, bones, muscles, nerves). The resultant curve is the power spectrum. The power
spectrum allows analysis of the median frequency, frequency bandwidth, and the frequency that
contained 99.5% of the signal. Independent t-tests (α = 0.05) were used to compare the identified
frequency analysis variables between MS patients and healthy controls.
459

Results
Differences between MS patients and healthy controls were found only in the vertical
direction (Figure 1). Compared to healthy controls, MS patients had significantly lower vertical
99.5% frequency (p=0.006) and lower vertical median frequency (p=0.000).
Discussion
The frequency domain results from a summation of all frequencies of oscillations from
different components acting in a coordinated manner to provide the motion. The differences
found in vertical 99.5% frequency and vertical median frequency may be due to the alteration in
nerve conduction in MS patients and the subsequent changes in the neuromuscular control of the
lower extremities during walking. The lower values suggest MS patients may be adapting a more
careful, slower gait pattern to compensate for muscle weakness due to axonal degeneration and
conduction block[1]. These findings are different from those found by Stergiou et al. [4] in the
elderly, which showed significant difference in the A-P direction and not vertical, possibly a
result of differences between aging and disease. In conclusion, this study has found significant
differences in the frequency component of MS patients' GRFs. Future MS rehabilitation and
treatment studies may explore the possible use of GRF frequency analysis as an outcome
measure and as a potential screening tool for minimally impaired MS patients.
References
1. Noseworthy et al. N Engl J Med
2000;343(13):938-52.
2. Scheinberg et al. NY State J Med
1980;80(9):1395-400.
3. Martin et al. Mult Scler 2006;12(5):620-8.
4. Stergiou et al. Clin Biomech 2002;17(8):615-7.
5. McClenaghan et al. Gait Posture 1996;4(2):112-
21.
6. Giakas In: Stergiou N, editor. Innovative Analyses
of Human Movement. 1st ed. Champaign, IL:
Human Kinetics; 2004. p. 223-58.
Acknowledgments
This work is supported by funding from the MARS
Foundation and the UNMC College of Public Health
Graduate Fellowship.
Figure 1: Vertical GRF frequency analysis,
results for 99.5%, median, and bandwidth
frequency. * Sig, p<0.05.
460

THE KINEMATICS OF GAIT IN CHILDREN WITH GENU RECURVATUM Elzbieta Pretkiewicz-Abacjew, Ph.D., D.Sc. The Jedrzej Sniadecki University School of Physical Education and Sport, Department of Postural Studies and the Methodology of Corrective Exercises, Gdansk, Poland
Introduction. In young school-age children there is a functional dominance of the quadriceps femoris muscles over the muscles that end in the knee joint and frequent irregularity in the course of the anatomical axis of the lower limbs in the sagittal plane in relation to the mechanical axis which transfers the body weight. This condition, to which children with a weak or loose ligament and muscle structure are particularly susceptible, manifests itself in genu recurvatum [1, 2, 3]. The faulty distribution of forces on the surfaces of the knee joint adversely affects the whole limb, the pelvic girdle and the spine [4], and thus, it may be assumed, the child’s gait. The aim of the study was to investigate the kinematic values of the gait of children in whom genu recurvatum had been identified and to compare these with the results for their peers with a normal limb configuration. Clinical significance. The results obtained demonstrate the need for preventative action among the youngest schoolchildren in order to detect the disorder early and then to adopt individualised therapeutic programmes for those with genu recurvatum. Systematic exercises should be designed to ensure proper loading of the knee joint surfaces and to strengthen the stabilising muscles so as to prevent tightness at the front of the joint, leading to permanent damage. They will also prevent the meniscus from becoming displaced and trapped between the femoral and tibial joint surfaces and will keep the joints themselves from damage. Methods. Genu recurvatum was identified in 28 six-year-olds by means of clinical examination and confirmed by an audible clicking when the anterior drawer test was performed [3]. In other respects the children concerned conformed to the morphological norm. A control group of 33 six-year-olds with a normal knee configuration had been examined previously using the methods described below [5]. The test for axial alignment was performed by means of a goniometer with the child standing. An angle of 11° or more was taken to indicate overextension of the knee joint. Gait was examined kinematically using a video-computer system and commercially produced computer software [5, 6]. It was recorded (50 Hz) in the sagittal and frontal planes and processed frame by frame. The following kinematic features of gait were examined: gait cycle length and duration, the duration of the single support, double support and swing phases and velocity and cadence. In addition, height, body mass and BMI were measured. Results. The angle of knee extension (right and left) ranged from 12.0° to 28.0°, the mean value for the right knee being 14.82° (±3.60) and for the left 14.96° (±3.60). The differences were not statistically significant. The gait as analysed of the children with genu recurvatumdiffered significantly from that of those with normally configured lower limbs, except with regard to the length of the gait cycle. The two groups did not differ in the parameters for physical development and these results conformed to those for their age group.
461

Table 1. Statistical profile of the kinematics of gait [*Significant difference (p<0.05)] Feature / Children Normal Genu recurvatum
Stride length m 1.00 ± 0.09 (0.85 - 1.24) 0.95 ± 0.07 (0.79 - 1.07) Stride period s 0.92 ± 0.06 (0.84 - 1.00) 1.0 ± 0.08 (0.80 - 1.16)* Single support
s %
0.56 ± 0.04 (0.48 - 0.64) 60.7 ± 1.90 (57.0 -64.0)
0.65 ± 0.06 (0.52 - 0.76)* 65.0 ± 1.97 (62.5 - 69.0)*
Double support
s %
0.11 ± 0.02 (0.08 - 0.13) 12.1 ± 1.71 (9.0 - 14.0)
0.14 ± 0.02 (0.12 - 0.16)* 13.2 ± 2.03 (9.0 - 18.8)*
Swing phase
s %
0.36 ± 0.02 (0.28 - 0.40) 39.3 ± 2.06 (37.0 - 42.0)
0.35 ± 0.03 (0.28 - 0.40) 35.0 ± 2.59 (31.4 - 44.0)*
Stride frequency Hz 1.09 ± 0.07 (0.96 - 1.19) 1.01 ± 0.09 (0.86 - 1.25)* Gait velocity m/s 1.09 ± 0.13 (0.92 - 1.41) 0.96 ± 0.10 (0.68 - 1.16)*
Discussion. The results of the gait examination of children with normal configuration of the knee approximated to those obtained by other authors [7]. However, with the exception of the length of the gait cycle, the results differed in the two groups of children examined. This stemmed from biomechanical conditioning associated with the nature of genu recurvatum. Faulty configuration of the functional lower limb in children interferes with the conditions for proper locomotion, primarily in failure to maintain the dynamic balance of the muscles that move and stabilise particular parts of the lower limbs, but also in hindering transfer of the body weight onto the extremity [1, 3, 4]. To conclude, kinematic values for the gait of six-year olds with hyperextension of the knee differed from those for their peers whose knees were normally configured, indicating a relationship between a faulty configuration of the functional lower limb in the sagittal plane and the spatial parameters of gait. Although the genu recurvatum when associated with fragility and general instability of the apparatus of movement was not pathological, the statistically significant differences in the gait parameters analysed imply the existence of identifiable discrepancies that have a detrimental influence on the quality of these children’s gait. References [1] Gage J.R., (2004), Edit: The Treatment of Gait Problems in CP, 71-179, 207, 365. [2] Tecklin JS., (1996), Pediatric Physical Therapy. JB. Lippincott Company Philadelphia. [3] Dziak A., (1993), For Your Child to Be Fit, PZWL, 48-54. [4] Kapandji I.A., (1974), The physiology of joints. Churchill Livingstone: London. [5] Pretkiewicz-Abacjew E. et al., (2000), Journal of Human Kinetics, 3, 115-130. [6] Pretkiewicz-Abacjew E., (2003), J. Sports Medicine and Ph. Fitness, 43, 156-162. [7] Sutherland et al., (1988), The Development of Mature Walking. Oxford: Mac Keith Press.
462

Lower-body Temporal-Spatial and Kinematics Responses When Performing a Dual-Task Experiment: The Effects of Multiple Sclerosis
Sarah R. Dubowsky1,2, Arvind Ramanujam1,James F. Sumowski1,2,Erin L. Nett3,Gail F. Forrest1,2 1Kessler Foundation Research Center, NJ; 2University of Medicine and Dentistry of New Jersey,
NJ; 3Ohio State University Medical Center, OH
Introduction: Gait disturbance is a common symptom of Multiple Sclerosis (MS) [1, 2], and persons with MS require more cerebral resources to perform even simple motor tasks relative to healthy persons [3]. Given that (a) cerebral resources are finite in all humans, and (b) subjects with MS require disproportionately more cerebral resources to maintain motor performance relative to healthy persons, we hypothesize that subjects with MS are less able than healthy controls (HC) to successfully divide and reallocate adequate attentional resources during the dual-task of walking and talking (i.e., cognitive processing), resulting in impaired gait performance and/or cognitive performance. The goals of the current study are to: 1.) investigate whether gait differences in MS and HC subjects exist; 2.) investigate whether the dual-task of walking and talking exacerbates these differences, and 3.) determine whether walking has a more negative effect on cognition in subjects with MS relative to controls.
Clinical Significance: The current research will inform researchers and therapists about dual-task functioning in more “real life” scenarios in which persons perform multiple tasks such as walking (W) and walking and talking (WT) simultaneously.
Methods: Six subjects (3 MS, 3 HC) gave informed consent to participate in the study, approved by the Institutional Review Board at the Kessler Foundation Research Center. A homogeneous pool of Relapsing-Remitting MS subjects (female, aged 30-55) was recruited based on the following inclusion criteria: no other neurologic disease, no exacerbation of MS within 30 days, no current use of corticosteroid medication, no use of an assistive device for walking, and a Berg Balance Scale (BBS) between 41-56. Age-matched HCs, with no history of neurological disease, a BBS of 41-56 and an Expanded Disability Status Scale (EDSS) of 0.0, were recruited for comparison (mean pair-wise difference: Age 2.33 ± 0.58 y, Height 0.04 ± 0.02 m, Weight 11.11 ± 8.61 kg, Self-Selected (SS) Speed 0.42 ± 0.58 m/s, EDSS 1.33 ± 0.29, BBS 2.67 ± 4.62). Subjects completed over ground walking trials to assess their SS walking speed for data collection on a treadmill. A 7-camera Vicon system collected 3D gait data (60Hz) for the following 30-second trials: 1.) walking at SS speed; and 2.) walking at SS speed while talking (cognitive processing - counting backwards by 3’s). Eight trials were collected for each subject (4 W, 4 WT). Subjects also performed the talking/cognitive task during quiet stance as a reference point from which to judge the effect of walking on cognition.
Results: Temporal-Spatial Results - During W trials, the standard deviation for all temporal-spatial outputs between paired-subjects was greater for those with MS (Table 1). Results for the WT condition are similar. When comparing MS with HC subjects during both W (Table 1) and WT, initial and terminal double stance (IDS and TDS) occurs for a larger percentage, while single stance (SS) and the SWING phase occurs for a smaller percentage of the gait cycle (%).
Kinematics Results - When comparing conditions (W, WT), there was a minimal increase in knee (0.64±0.66º) and hip flexion (0.86±0.24º) during WT in subjects with MS, while HCs experienced a decrease in these parameters (-0.63±0.46º and -0.63±0.32º respectively). When comparing paired-subjects, majority of subjects with MS (2 of 3 pairs) had greater internal
463

rotation (12.01±4.58º) with minimal change in hip sagittal range of motion (ROM) (2.63±1.41º) compared to HC during both conditions. A representative hip kinematics profile is shown (Fig1).
Cognitive Results – Subjects with MS showed a 9±11% decline in cognitive performance during walking relative to standing, more than double the decline exhibited by healthy controls (4±9%).
Table 1. Temporal-Spatial Results (W). IDS, SS, TDS, SWING: reported as % of gait cycle; Step Length and Width, and Stride Length are recorded in mm. Average±StDev is reported.
Pair-wise HC-1 MS-1 HC-2 MS-2 HC-3 MS-3 IDS 11.4±0.9 13.1±1.7 11.6±1.2 14.0±1.3 12.5±0.9 20.0±2.5 SS 36.9±1.3 36.5±2.0 38.5±1.1 36.8±1.4 37.2±1.1 31.0±2.5 TDS 13.2±1.2 13.5±1.9 11.5±0.9 13.8±2.3 12.5±0.9 17.8±3.0 SWING 38.4±0.9 36.8±1.7 38.4±1.0 35.5±2.1 37.8±0.8 31.2±2.1 Step L 675.0±9.8 643.6±14.9 636.5±9.6 654.3±11.7 568.8±9.6 204.6±20.4 Step W 99.8±19.8 114.2±20.3 92.5±17.5 108.6±10.6 82.4±13.1 55.8±14.5 Stride L 1333.2±15.6 1304.0±27.5 1261.6±17.0 1329.7±20.4 1141.9±15.6 434.1±28.0
Figure 1. WT Hip Kinematics. Average (±StDev) hip flexion (+) (black) and internal (+)/ external rotation (-) (white). X-axis: Percentage of gait cycle (1-100%); Y-axis: Angle (degrees).
Discussion: Large standard deviations in temporal spatial data observed during treadmill walking (W) does suggest an impaired and inconsistent stepping pattern for subjects with MS compared to HC, prior to performing a dual-task. In addition, there is a trend to show that the dual-task does negatively affect cognitive performance and not treadmill gait performance for individuals with MS. Our study is limited by the small sample size and the potential insensitivity of the outcome measures to discriminate how the dual task will affect treadmill walking. A more challenging dual-task could also further discriminate differences between HC and subjects with MS. Studies with larger sample size and outcome measures to directly evaluate stability and coordination are warranted to examine the effect of dual tasks on dynamic stability and fall risk in persons with a diagnosis of MS.
References: 1. Cattaneo, D., et al. Arch Phys Med Rehabil, 2002. 83(6): p. 864-7. 2. Paltamaa, J., et al. J Rehabil Med, 2006. 38(6): p. 339-45. 3. Pantano, P., et al. Brain, 2005. 128(9): p. 2146-53.
Acknowledgments: The contents of this abstract were developed under a grant from the Department of Education, H133P070007. However, those contents do not necessarily represent the policy of the Department of Education, and you should not assume endorsement by the Federal Government. Support for the work was also provided by a fellowship training grant from the National Multiple Sclerosis Society (MB0003), as well as support from the Kessler Foundation.
-30
40
1 100
-30
40
1 100
MS-1 HC-1
464

Dynamic knee joint stiffness after total knee arthroplasty
Vassilios Vardaxis1,2, Julian Rivera2, & Craig Mahoney3
1Doctor of Physical Therapy Program, 2Human Performance Lab of Des Moines University; 3Iowa Orthopaedic Center & Mercy Hospital, Des Moines, IA, USA
E-mail: [email protected] Introduction
Dynamic knee joint stiffness during gait is defined as the slope of the regression line through the knee joint moment versus the knee joint angle data over the initial part of the gait cycle (loading response). Individuals with knee stability issues or pain tend to adopt strategies that reduce the knee flexion excursion while transferring their body weight on the supporting leg, a neuromuscular strategy that ensures control of the knee under load, and pain reduction due to articular joint movement reduction. Patients with knee osteoarthritis (OA) have been shown to utilize co-activation of the knee flexor and extensor muscles1,2 to reduce pain in the joint, also shown increased dynamic knee joint stiffness3,4 which seemed to increase with walking speed3. Rehabilitation following total knee arthroplasty (TKA) focuses on regaining ROM, strength, and function, however, at 3 months after total knee arthroplasty the dynamic knee joint stiffness seems to me maintained despite that the main contributing factor (pain) has been significantly reduced4. The long term persistence of this “stiff knee gait pattern” following TKA has not been investigated, and the consequences of this altered gait mechanics have not been addressed as it potentially alters significantly the load in the knee and the adjacent joints. Clinical Significance
Precise evaluation of the knee function/load (and the lower extremity in general) in the short and long term following TKA is of particular importance for assessment of outcomes of specific TKA procedures and the determination of the adequacy, effectiveness or further need for rehabilitation of TKA patients. Methods
Twenty three patients, with terminal unilateral knee osteoarthritis, slated for TKA (7M & 16F) and twelve age- and gender-matched controls were recruited so far for the present study. A self-assessment questionnaire (SF-36) and a total body gait analysis protocol were used to assess quality of life and gait mechanics. The control subjects were evaluated on two separate sessions (3 months apart). The total knee patients were evaluated on four separate sessions: Pre, within a month prior to surgery (TKA_P, N=23); and at three, six, and twelve months post surgery (TKA_3m, N=18; TKA_6m, N=12, and TKA_12m, N=12, respectively). An eight-camera Motion Analysis system (Santa Rosa, CA, USA) and 2 force-plates (AMTI, Watertown, MA, USA) were used to record kinematic and kinetic data. Inverse dynamic analysis was performed using OrthoTrak on five trials per session per subject. Dynamic knee joint stiffness (K) was calculated separately for each trial, defined as the slope of the regression line between the knee joint moment and the knee joint angle over the initial weight transfer period of the gait cycle, using in house written software (MATLAB). Independent samples t-Test was used to test for group differences and an one-way ANOVA repeated measures design was used to test for changes over time in the gait characteristics of the TKA patients, using the GLM repeated measures procedure of SPSS 17.
Table 1. Descriptive statistics for subject demographics and gait spatio-temporal characteristics of the control and the THA patients at each testing session pre and post surgery.
Control (N=12) TKA (N=23) PRE & 3m TKA_P
(N=23)TKA_3m
(N=18)TKA_6m
(N=12) TKA_12m
(N=12)Age (years) 54.8 (±4.4) 62.4 (±7.2)Height (m) 1.75 (±.09) 1.68 (±.08)
Weight (kg) 85.0 (±19.9) 98.6 (±17.5)Gait Speed (m/s) 1.21 (±.14) 0.82 (±.17) ‡ 0.92 (±.14) ‡ 0.96 (±.17) *‡ 0.97 (±.15) *‡
Stride Length (m) 1.31 (±.08) 0.99 (±.16) ‡ 1.06 (±.12) ‡ 1.09 (±.15) *‡ 1.09 (±.15) *‡ Cadence (st/min) 111.3 (±11.7) 100.0 (±11.1) ‡ 103.4 (±11.1) 106.0 (±10.2) * 106.9 (±8.6) *
Step Width (m) 0.12 (± .02) 0.16 (± .04) ‡ 0.14 (± .03) 0.14 (± .03) 0.14 (± .03)* Within Subjects contrast to TKA_P @ P < .05
‡ Independent Samples t-Test effect to Control @ P < .05
465

Results Before the TKA surgery the terminal osteoarthritic patients walked with significantly slower speed,
shorter stride length and slower cadence, and with larger step width than the controls. At 3, 6 and 12 months post surgery the TKA patients continue to exhibit significantly slower walking speed and shorter stride length than the control group (Table 1), despite the fact that their self-assessed quality of life data (SF-36 scores – not reported here) have improved to the level of the control group. The knee kinematics on the sagittal plane of the TKA patients remained unchanged also exhibiting limited range of motion during stance. The dynamic knee joint stiffness of the TKA patients remained high throughout the 12 month post surgery period, significantly greater than the controls at all 3 post surgery time intervals (Figure 1).
Figure 1. Dynamic knee joint stiffness calculated during loading response in gait. Control and Pre, 3, 6, and 12 month post TKA data is shown (Independent samples, t-Test level of significance vs. control are shown). Discussion
Dynamic knee joint stiffness was calculated during the loading response phase of gait in total knee arthroplasty (TKA) patients (pre and 3, 6 and 12 months post surgery) and compared to controls, walking at self selected speed. Greater dynamic knee joint stiffness was observed in individuals slated for TKA and was shown here to persist for 12 months following TKA. TKA patients walked with significantly greater dynamic knee joint stiffness than the controls, while walking slower, contrary to what expected even under pain free conditions.3The altered knee joint mechanics observed before surgery do not seem to resolve, with usual care, over the 12 months post surgery period. The higher and potentially detrimental effect of high dynamic knee joint stiffness in light of its persistence should be further explored. Closer consideration should be given to potential differences in the altered gait mechanics specific to the TKA procedure and the post TKA rehabilitation regiment used and/or adhered. These data show that altered gait mechanics as reflected by dynamic knee joint stiffness does not seem to be affected by usual care with respect to the long term practiced habitual patterns developed prior to surgery as a pain avoidance mechanism.
References 1. Hubley-Kozey C et al, (2008). Muscle co-activation patterns during walking in those with severe knee
osteoarthritis. Clinical Biomechanics 23: 71-80. 2. Vardaxis VG et al, (2009a). Periarticular muscle co-activation in total knee arthroplasty patients
and controls during gait. Gait & Posture 30(2): S21.3. Zeni JA & Higginson JS, (2009). Dynamic knee joint stiffness in subjects with a progressive increase in
severity of knee osteoarthritis. Clinical Biomechanics 24: 366-71 4. Vardaxis VG et al, (2009b). Altered gait mechanics in knee osteoarthritis patients before and
after surgery. Gait & Posture 30(2): S124-S125
Acknowledgments This work was supported in part by the IOER-R&G research fund of Des Moines University.
466

Determination of Hip-Hiking Scale Based on Gait Analysis and Physical Therapist
Observation
Barri L. Schnall, MPT, Haley Q. Houde-Walter, BS, Erik J. Wolf, PhD
Walter Reed Army Medical Center Biomechanics Laboratory, Washington, DC
Introduction While the concept of hip-hiking is well known and widely observed in lower limb
amputees, an objective measure of severity has yet to be developed. The cause of hip-hiking
and determinants have been hypothesized but not exclusively proven.
Hip-hiking is considered to be an adaptation of the subject for the purpose of toe
clearance of the amputated limb (Sjodahl, 2003; Gard 2006). It can be described by
observational analysis or via pelvic obliquity data collected through motion capture. In
previous studies, observations such as increased peak and shifted phase of pelvic obliquity in
effected amputees have been documented (Ruhe, 2005; Su, 2007). Severity remains
subjective, hence the need for development of an objective rating scale.
Clinical Significance Development of a repeatable scale of severity and objective determination of factors
that define hip-hiking can serve as a valid outcome measure for research purposes as well as a
repeatable outcome measure for rehabilitation. If efficiency is compromised due to gait
deviations (e.g. increased pelvic obliquity) then a measure of severity can assist with gauging
clinical/rehabilitation progress and should correlate with increased efficiency.
Methods
Digital video and gait analysis of 60 active military subjects were recorded. The
experimental group consisted of 45, otherwise healthy soldiers who sustained traumatic lower
extremity amputations: 15 unilateral transtibial, 15 unilateral transfemoral, and 15 bilateral LE
amputees. The control group was composed of 15 uninjured military beneficiaries. Gait data
was collected using 8 Eagle series motion capture cameras/system (Motion Analysis
Corporation, Santa Rosa, CA) and 2 AMTI forceplates (Watertown, MA). Subjects were
asked to walk at a self selected pace across an 8 meter walkway. Kinematic data was
analyzed using Orthotrak™ software.
Based on previous literature and examination of pelvic obliquity curves, it was
determined that the Swing Phase Maximum minus Average (SPM-average) and the Toe-Off
Timing Ratio (TOTR) would be evaluated as outcome measures. The SPM-average is a
metric describing the elevation of the pelvis above neutral during the swing phase. It is
calculated by subtracting the average of the pelvic obliquity curve from the maximum of the
curve during the swing phase. The TOTR measure describes a shift in the minimum
excursion of the pelvis during the gait cycle. It is the ratio of the time (in percent of the gait
cycle) from the minimum excursion of the pelvis to the maximum excursion of the pelvis
divided by the time from toe-off to the maximum excursion of the pelvis.
The digital videos for the subjects with amputations were randomized and shown to
physical therapists (PT), who were asked to rate the severity of hip-hike based on a visual
analog scale (VAS) 10 centimeters in length. To evaluate the effectiveness of the developed
467

metrics, the hip hiking outcome measures SPM-average and TOTR were compared against
the PT rating scores, which is the current means for rating the severity of hip-hiking.
Results
SPM-Average (Figure 1) trend toward an increase with level of injury. TOTR (Figure
2) trends similarly with the exception of transfemoral and bilateral amputees. For the
uninjured control group the average (standard deviation) values of the SPM-average and the
TOTR are 0.76 (±1.08) and 0.85 (±0.10) respectively. Initial evaluation comparing the
Physical Therapist rating scores to these outcome variables revealed a positive correlation,
with the SPM-Average showing a stronger relation than the TOTR.
Figure 1 – SPM-Average for all subjects Figure 2 – TOTR for all subjects
Discussion
The SPM-Average shows a clear trend as a function of injury and has less variability
among groups. The TOTR displays a difference between controls and transtibial amputees
versus transfemoral and bilateral amputees. The latter group shows a greater deviation from
control timing patterns of the pelvic obliquity curve. For the SPM-Average, those with
bilateral amputations had a large standard deviations. Additional trends may be observed if
this group is further separated by level of injury. The positive correlation of PT rating scores
and outcome variables was expected; it is easier to observe pelvic motion as opposed to
timing.
The SPM-Average and TOTR data reveals that as level of injury increases so does hip
hiking severity. Further examination is required to compare how these variables relate to the
PT rating scores which is the current standard of practice for documenting hip hiking. The
goal is to develop and validate an objective tool to evaluate the presence, severity, and
evolution of hip hiking during the course of rehabilitation.
References
[1] Sjodahl, CG, et al. (2003). Prosthet Orthot Int 27(3): 227-37
[2] Gard,SA ( 2006). Prosthet Orthot Int 18(6): 93-104
[3] Ruhe, BL (2005). AAOP: Proceedings
[4] Po-Fu Su, (2007). JRRD 44(4): 491-502
468

Longitudinal section of lower extremities in sagittal view of patients with Juvenile idiopath-ic arthritis
Kreuzpointner, F.1, Hartmann, M.2, Haas, J.P.2, Haefner, R.2, Schwirtz, A.1 1Department of Biomechanics in Sport, Technische Universität München 2German Center for pediatric and adolescent rheumatology, Garmisch-Partenkirchen
Introduction Juvenile idiopathic Arthritis (JIA) is a form of chronic Arthritis in childhood and adolescence characterized by joint inflammation, pain, swelling, and restriction in function. One of the main topics in therapy is the complete re-establishment of joint functions and –axes. Miller et al. (1999) presented in a study with 88 school aged children that the functional ability is significant impaired referring to healthy children. Gait “is one of the most fundamental physical functions of the human being” (Brostrom et al. 2004, p.609). Therefore it is essential for patients with JIA to accomplish physical therapy to maintain the way of walking.
Clinical Significance Research of longitudinal information about motor skills of children with JIA has been lacking over the years (van der Net 2008). Due to the chronic development of the disease it is essential to monitor the patients longitudinal.
Methods The kinematic data for the sagittal view were captured with a 6 camera Vicon motion analysis system (120Hz). The patient group (pg) includes 15 probands with JIA (12,5±2.8yr, 146.5±13.3mm, 38.8±13.8kg (all data at t1)) and the control group (cg) consists of 20 probands (17.9±6.5yr, 159.2±13.5mm, 53.8±15,0kg). There was 20 month of average between the mea-surements (t1 and t2) of the pg. Within the 20 month all patients had to pass individualized rheuma specific physical therapy. To determine joint range of motions (ROM), minima and max-ima from the lower extremity were taken into account (see figure1): the absolute minima and maxima of the pelvis movement, the hip ROM with the maximum flexion during stance phase to the maximum extension, for the knee ROM with the first and the second flexion (dashes black lines) and the first extension (black line) and the subtalar joint according to the knee joint. The statistical measurements included within comparison of the repeated measurement (t1 and t2) and between comparison of patient and control group (t2 and cg).
Figure1: Shows the mean and SD of the four large joints from the cg (from left to right: pelvis, hip, knee, and subtalar joint) of the lower extremities during a gait cycle (x-axis: % of gait cycle, y-axis: degree). The red circles represent minimum and maximum of the particular ROM.
469

Results The ROM of the second plantarflexion of the subtalar joint is the only parameter in the within comparison which enlarged statistical significant from t1 22.9±8.1° to t2 27.3±8.0° (right side) and from t1 23.1±6.1° to 27.8±5.3° (left side). Nevertheless the cg (31.3°) is also more frequent-ly than random. In the between comparison all significant results are shown in table1.
Table 1: Shows all significant results in the sagittal plane of the comparison between pg and t2. The specific points are shown in figure1. The data is presented for left and right as the pg shows statistical significance between the left and the right measurement of the hip ROM.
hip knee (1st extension) knee (2nd flexion) subtalar (2nd plantar-flexion)
right (pg/cg) [°] 38.3/43.6 9.9/15.9 47.4/57.0 22.9/31.3 left (pg/cg)[°] 40.0/44.4 11.0/15.7 48.8/56.4 23.1/30.6
Another interesting aspect is the distribution of the variance at minima and maxima. Apart from the pelvis, 1st flexion of subtaler joint (left) and 2nd flexion subtalar joint (right) all other parame-ters in t2 have a statistical lower significant variance than t1.
Discussion The 2nd plantarflexion in subtalar joint is taking place during the pre-swing phase. The functional role of the pre-swing phase in subtalar joint is the initiation for knee flexion during swing phase. The significant enlargement of the subtalar joint arouses a bigger knee flexion. Extended flexion of the knee joint will enable detachment of the toes from the ground. About 60° knee flexion is required to realize the detachment (Perry 2003). So the enlargement of the subtalar joint ROM helps the patient to realize a quite normal gait functions.
Nevertheless, JIA-patients showed a number of limitations (cf. table1). All patients got an indi-vidualized rheuma specific physical therapy. All selected parameters had a better outcome, but no statistical significance. Data are supposed to be more conclusive if patients will get device orientated training to examine the exact joint position. Therefore we intend to introduce the pa-tients to biofeedback training in the future with markers placed onto the lower extremity to con-trol the ROM. As a consequence an audio feedback will be implemented into the setting to sig-nalize patients reaching the chosen ROM.
The smaller variation in minima and maxima shows a precise accomplishment of gait cycles. There is more consistency within the pg at t2 compared to t1. Errors in measurement protocol can be excluded due to the same assessor.
References Brostrom, E., S. Hagelberg, et al. (2004). Acta Paediatr 93(7): 906-10. Miller, M. L., A. M. Kress, et al. (1999). Arthritis Care Res 12(5): 309-13. Perry, J. (2003). München, Jena, Urban & Fischer. van der Net, J., van der Torre, P., Engelbert, R., Engelen, V., Zon, F., Takken, T., Helders, P.
(2008). Pediatric Rheumatology 6(2).
Acknowledgements The authors wish to thank the German foundation for children’s rheumatism for supporting this study.
470

Orthoses mediated changes in hemiplegic gait patterns Arvind Ramanujam 1, Krupa K. Savalia 2, Karen J. Nolan 1,3,
1Kessler Foundation Research Center, West Orange, NJ, USA 2University of Nebraska Medical Center, Omaha, NE
3UMDNJ - New Jersey Medical School, Newark, NJ, USA
Introduction Hemiplegia is seen in fifty percent of stroke survivors and can cause decreased mobility and functional disturbances in healthy walking patterns leading to limitations in activities of daily living and long term disability. Ankle foot orthotics (AFOs) are often prescribed to individuals with motor deficits as a result of stroke to assist with ambulation 1-3. Functional ambulation measures such as walking speed, step length and cadence have been used as the key determinants of orthotic effectiveness 4. More importantly, changes in whole body center of mass (CoM) that are directly affected by orthotic intervention are often overlooked, but they are significant factors related to the improvement of mobility of individuals with hemiplegia. The objective of this investigation was to study the effect of AFOs on human steady-state walking through the characterization of whole-body CoM (excursion, velocity and momentum) and changes in temporal-spatial (TS) parameters. Clinical Significance The significance of this study is to identify specific mechanisms which optimize transfer of momentum during gait that can be altered through orthotic interventions (AFO) and expand these assessment measures to better evaluate changes in functional ambulation in order to elucidate biomechanical mechanisms behind orthoses mediated changes in gait patterns.
Methods Six individuals with hemiplegia (age 54 ± 12 y, height 1.73 ± 0.09 m, mass 84 ± 20 kg), secondary to cerebrovascular incident with symptoms lasting more than 6 months currently using an AFO during ambulation (at least 50% time) were recruited for participation. Subjects performed five walking trials at a self selected pace, in two conditions: 1) AFO – with AFO and 2) BARE - without AFO. Kinematic data was collected at 120Hz (Vicon, Oxford Metrics, Oxford, UK). The order of conditions was randomly assigned. The main outcome measures were temporal-spatial parameters, walking speed, whole body 3-D CoM excursion and velocity.
Results Temporal-Spatial: Mean SS time on the paretic limb increased 9.30%, however, mean TDS time reduced -19.73% with the orthotic intervention. Also, step length with the AFO increased more on the healthy limb 26.09 ± 47.99% than on the paretic limb 7.89 ± 9.6% and stride length increased with the AFO 12.86 ± 10.17%. However, step width with the
Figure 1. 3-D CoM normalized components
IDS (Initial Double Support) – Paretic Loading/Healthy Unloading; SS (Single Support) – Paretic Loading; TDS (Terminal Double Support) – Healthy Loading/Paretic Unloading; SWING – Healthy Loading
471

orthotic intervention decreased -9.88 ± 13.51%. Average gait speed increased with the AFO 18.66 ± 25.59% thus indicative of the increased step and stride lengths. CoM: During the stance phase of the gait cycle (IDS+SS+TDS) the mean whole body CoM with the AFO tended to be more posterior -2.63 ± 1.73% with it being the maximum during IDS -4.05 ± 0.62%. During paretic limb loading (IDS+SS) and healthy limb loading (TDS+SWING) the CoM with the AFO was relatively more medial, 2.01 ± 1.15% (away from the paretic side) and -2.34 ± 2.02% (away from the healthy side) respectively. Also, the mediolateral CoM range of motion (RoM) during the entire gait cycle decreased -3.17% after wearing the AFO, thus indicative of reduced sway in either direction. The mean CoM forward velocity increased from 0.64 ± 0.04 m/s (BARE) to 0.71 ± 0.06 m/s (AFO) – 9.92 ± 3.07% change. A definite shift in the forward CoM velocity is seen in the CoM velocity hodographs (Figure 2). No significant changes were seen in other directions.
Discussion The increase in walking speed after the orthotic intervention was associated with an increase in step length and stride length but a decrease in step width. Potentially the increase in walking speed resulted from the greater postural shift in forward CoM velocity with the AFO by facilitating better push-off. It is important to note the large population variability for functional ambulation outcomes; future analysis will concentrate on the mechanisms underlying the variability. CoM characterization and ambulation speed can serve as novel important clinical markers to demonstrate recovery in gait after rehabilitation using a clinical intervention such as AFO prescription.
References 1. Jutai J., et al (2007) Arch Phys Med Rehabil. 88(10):1268-1275. 2. Gok H., et al (2003) Clin Rehabil. 17(2):137-139. 3. Danielsson A., et al (2004) J Rehabil Med. 36(4):165-168. 4. Leung J., et al (2003) Physiotherapy. 89(1):39-55. Acknowledgements: NIDRR Mary E. Switzer Fellowship Grant #H133F070028; Kessler Foundation, West Orange, NJ
Figure 2. 3-D CoM velocity hodographs
472

Gait Analysis of Aquatic Walking with Additional Weight in People Post-Stroke
Ryota Nishiyori, Charalambos Charalambous, MS, Dokyeong Lee, MS, Konstantinos
Vrongistinos PhD.,Shane Stecyk PhD., ATC and Taeyou Jung PhD., ATC
Center of Achievement, Department of Kinesiology, California State University, Northridge
INTRODUCTION
Aquatic therapy settings can be an effective gait rehabilitation mode for people with
hemiparesis after stroke. Water buoyancy helps bear less body weight and reduces the impact
force while walking in water1, 2
. However, limbs that are not under complete neuromotor
control are inclined to float or show compensatory movements during aquatic walking. Cuff
weights (CW) are frequently used by aquatic therapy providers in their attempt to minimize
the unwanted floatation of the affected limb and other uncontrolled limb movements. The
purpose of this study was to investigate the differences in gait patterns when using a CW on
the affected limb of people post-stroke during pool-floor walking.
CLINICAL SIGNIFICANCE
The study findings provide scientific understanding of how individuals with hemiparetic gait
can benefit from using a cuff weight during aquatic gait rehabilitation. The results can allow
aquatic therapy providers to design more effective gait training programs for individuals post-
stroke or those with similar gait impairments.
METHODOLOGY A repeated measures comparative design was used to investigate the differences in gait
patterns when a CW was applied to the affected limb. A total of 21 individuals post-stroke (5
females/16 males; mean age 66.1±11 years) participated in this study. Participants walked
across 8-meter walkway in chest-depth level water adjusted by a movable floor pool (KBE,
Germany, 2002). Three walking conditions were compared at maximal speeds: a) CW at
distal shank (immediately above the ankle), b) CW at proximal shank (immediately below the
knee), and c) no CW. Each participant completed 3 trials for each condition with 1-minute
resting periods in between trials. Each participant was asked to walk at his or her maximal
speed for all testing conditions and the order of testing conditions were randomized. The
underwater three-dimensional motion analysis system incorporated six underwater lenses
(Coach Cam, Underwater Camera Co., San Diego 2005) which were placed in the water to
capture all lower extremity movements from each testing trial. Underwater lenses were
connected to six digital video recorders (Canon, Japan, 2006) that were located on the pool
deck. A total of 15 waterproof markers (10mm) were placed on bony landmarks of the lower
extremities using the Helen Hayes marker set (Kadaba, 1990). Captured video clips were
imported to a PC and gait data were digitized and processed using Vicon Motus v 9.2 (Vicon
Ltd., Oxford, UK, 2007). Experimental variables included spatiotemporal variables (cadence,
stride time, stride length, and stance phase percentage) and lower extremity joint kinematic
parameters (hip, pelvis, knee, and ankle).
RESULTS Statistically significant differences were found in walking speed and stride length when a CW
was applied either at the knee or the ankle positions as compared to no weight. When
473

compared with no weight, knee weight significantly increased stride time of the affected limb
and ankle weight increased stance phase percentage of non-affected limb. No significant
differences were found in the pelvic, hip, knee and ankle kinematics across the 3 testing
conditions during pool-floor walking.
DISCUSSION
The results suggest that placing a cuff weight on either knee or ankle of the affected limb
increases walking speed and stride length of people with hemiparesis during pool-floor
walking. It appears the additional load on the shank may contribute to accelerating the limb
swing through water resistance during aquatic walking. Our findings also illustrate that the
use of knee weight can help increase the stride time of the affected limb while using ankle
weight can assist the non-affected limb with increasing stance phase percentage. The results
imply that an additional weight can enhance stability of stance phase, which may contribute to
training gait symmetry for people with hemiparesis. Although we found no statistically
significant difference in the gait kinematics among the 3 test conditions, we noted kinematic
trends that hip and knee excursions were slightly increased with the use of an additional
weight. Further investigation is warranted to reveal kinematic strategies for faster walking
with an additional weight.
REFERENCES
1. Barela, A., et al., Journal of Electromyography and Kinesiology; 16(3), 250-256
2. Bates, A. and Hanson, A., Aquatic Exercise Therapy. Philadelphia: Saunders; 1996
Variables NW KNEE ANKLE P value
NW v
KNEE
NW v
ANKLE
KNEE v
ANKLE
Speed (m/s) 0.657 1.516 1.491 0.000
* 0.000
* 0.000
* 0.306
Cadence (steps/min) 22.675 22.297 22.266 0.801 0.622 0.594 0.953
Stride Length (m) 0.394 0.4010 0.411 0.000
* 0.000
* 0.000
* 0.924
Stride Time (s) 5.601 5.598 5.724 0.807 0.000
* 0.319 0.543
Stance Phase Percentage (%cycle) 56.859 58.756 56.972 .301 .174 .933 .210
Stance Phase Percentage (%cycle) Non-Affected limb 69.268 71.057 71.749 .020
* .036
* .017
* .431
ROM Hip Flexion Extension (deg) 35.556 38.892 38.667 0.145 0.085 0.141 0.909
ROM Hip Abduction Adduction (deg) 13.084 15.576 14.599 0.241 0.160 0.254 0.418
ROM Knee Flexion Extension (deg) 44.455 47.223 48.653 0.403 0.435 0.277 0.431
ROM Ankle Dorsiflexion Plantar-flexion (deg) 22.433 22.249 22.415 0.966 0.662 0.907 0.912
ROM Pelvic Tilt (deg) 8.845 11.092 10.982 0.419 0.399 0.072 0.949
ROM Pelvic Obliquity (deg) 9.829 10.790 10.172 0.456 0.341 0.609 0.296
ROM Pelvic Rotation (deg) 13.070 14.851 15.676 0.640 0.448 0.455 0.756
Table 1. Gait Data of affected limb (Except stance phase percentage non-affected
limb) NW: No Weight. KNEE: Knee weight. ANKLE: Ankle Weight
474

A BIOMECHANICAL COMPARISON AXILLARY CRUTCH SWING-THROUGH GAIT
WITH AND WITHOUT TOUCH-DOWN
Jeffrey B. Casebolt, Kunal Singhal, Moon-Seok Kwon, Kris Ring, Elaine Jackson, Young-Hoo
Kwon
Texas Woman’s University, Department of Kinesiology, Denton, TX, USA
EMAIL: [email protected]
INTRODUCTION:
One of the most common assistive walking devices prescribed is the axillary crutch,
which allows the patient to support up to 100% of their body weight (BW) with their upper
extremities.1
Swing-through gait with a three-point contact (3SG), is typically employed when
using axillary crutches. However, variations of the traditional 3SG have been proposed to reduce
the burden on the upper extremities and increase stability.1 One such alternative is a touch-down
(TD) with the impaired limb, during the axillary gait cycle. A TD has been defined as 10-15%
body weight (BW) on the impaired limb.2 Even though 3SG is the preferred method of
locomotion using axillary crutches, not being able to support one’s BW with their upper
extremities presents a problem. Joint reaction forces acting at the impaired hip during 3SG have
been approximated as the equivalent of 1 BW.3
It was also suggested that a 10-15% BW TD will
neutralize the joint reaction forces of the impaired hip, further suggesting some relief for the hip
joint of the impaired limb. The purpose of this study is to investigate shoulder and hip torque
during three-point swing-through gait without and with TD at varying percentages of BW: 0, 15,
30, 50, 75, & 100%
CLINICAL SIGNIFICANCE:
A developed understanding of torques acting at the shoulder and hip joints during crutch
walking with and without touchdown of the impaired limb for the possible reduction of burden
on the upper body, impaired hip, and improved the stability.
METHODS:
Participants
Ten adult individuals between with the average age of 29.1 ± 9.0 years were recruited for
the study with an average height, weight and corresponding BMI of 1.71 ± 0.07 m, 69.8 ± 11.0
kg, and 23.7 ± 2.4, respectively. All participants were healthy experienced crutch users, and
injury free for the last six months.
Data collection
The crutches were properly fit per prescribed specification.4 A warm-up and
familiarization period for both crutch and testing conditions were required. A 3D analysis was
conducted. Forty-nine reflective markers placed over anatomical landmarks. Motion video was
captured using eight camcorders. Ground reaction force was recorded by force plates imbedded
within a 10 m walkway for the lower body and distal tips of the axillary crutches. Kwon3D XP
motion analysis system was used in capturing video and acquiring ground reaction force data.
Each participant performed three trials for five crutch walking conditions with varying
percentages of BW TD and NG condition for 18 trials total. The increments of BW percentages
were 0, 15, 30, 50, and 75% with 3SG serving as 0% BW and normal walking representing
100% BW. All trials were randomized and deemed good if all points of contact were recorded by
the appropriate force plate and the percentage of BW fell within ± 5% of the desired condition.
475

Data reduction and processing Image-plane coordinates of the reflective markers were obtained through automatic
tracking. The 3D marker coordinates were computed through the reconstruction process based on the image plane coordinates of the markers and the camera parameters. The reconstructed marker coordinated were filtered by a Butterworth low-pass filter (4th order zero phase-lag filter) with a 6 Hz cut-off frequency.
Hip (support and impaired) and shoulder (dominant and non-dominant) resultant joint moments were computed using inverse dynamics using VGRF data and the motion data. The joint moment data were normalized to the body mass.
A repeated measures ANOVA with Sidak correction was applied to determine significance. The significance level was set at α = 0.01 and all analyses were performed with SPSS for Windows. RESULTS:
Figure 1: Shoulder and Hip RJM for AC, 15, 30, 50, 75% BW and NG conditions. There were no significant differences in crutch gait velocity. Walking speed has a significant effect on RJM.5 However, normal gait velocity was significantly increased when compared to all crutch conditions. SUMMARY/CONCLUSIONS:
The shoulder RJM were consistently greater for the dominant arm when compared to the non-dominant arm across all conditions ranging from 28.4 – 48.7% increased. Surprisingly, the increase did not follow a trend moving from most demanding to least with the 50% BW condition producing the greatest amount of torque on the dominant arm when compared to the non-dominant.
When comparing hip RJM, it has been reported that 50% BW touchdown conditions produced joint loads similar to those of 3-point swing through crutch gait.3 The current research supports previous trends within the research in that the burden placed on the impaired limb produces similar torques at the hip for both 3SG and 50% BW. REFERENCE: [1] Joyce & Kirby, American Family Physician, 43(2) Feb. 1991, 535-543. [2] Kathrins & O’Sullivan, Physical Therapy, 64(1) 1984, 14-18. [3] Frankel & Nordin, Basic Biomechanics of the Skeletal System, Lea & Febiger, Philadelphia, 1980. [4] Flood, The Physician and Sportsmedicine, Mar. 1983, 75-79. [5] Thompson, Ralston, & Todd, Human Walking, Williams & Wilkins, Baltimore, 1981.
0
0.1
0.2
0.3
0.4
0.5
0.6
0.7
0.8
0.9
0% TD 15% TD 30% TD 50% TD 75% Normal Gait
Trial Conditions
Sh
ou
lder
RJM
(N
m/k
g)
Right Shoulder Left Shoulder
0.0
0.2
0.4
0.6
0.8
1.0
1.2
1.4
1.6
1.8
Axillary Crutch TD 15% BW TD 30% BW TD 50% BW TD 75% BW Normal Gait
Trial Conditions
Hip
RJM
(Nm
/kg
)
Impaired Hip Support Hip
476

KNEE KINEMATICS MEASUREMENT ON TRANSFEMORAL AMPUTEES DURING
GAIT IN REAL-LIFE ENVIRONMENTS USING INERTIAL AND MAGNETIC
MEASUREMENT UNITS
Garofalo P.1, Cutti AG.
2, Raggi M.
2, Schipper L.
3
1 DEIS, Department of Electronics, Computer Science and Systems, University of Bologna (BO), Italy
2 I.N.A.I.L. Prostheses Centre, Vigorso di Budrio (BO), Italy
3 Xsens Technologies B.V., Enschede, The Netherlands
Introduction A protocol was developed to easily measure on amputees the thorax-pelvis and lower-limb 3D
kinematics during gait in free-living conditions [1], by means of Inertial and Magnetic
Measurement Units (IMMUs), such as MTx (Xsens Technologies, The Netherlands). The
evaluation of the accuracy was carried out on healthy subjects, but the presence of ferromagnetic
materials inside of the lower limb prostheses may limit the use of the IMMU for representing the
proper prosthetic limb kinematics. The aims of this work were to (1) evaluate the dynamic
accuracy of MTx compared with Vicon, assumed as gold standard, when an above-knee amputee
is fitted with a C-Leg (Ottobock, Germany) electronic knee and (2) test a new method for
improving the dynamic accuracy and correctly representing the knee kinematics of the prosthetic
limb.
Clinical Significance
The use of instrumental gait analysis is limited to dedicated laboratories and the acquisition of a
subject’s gait is restricted to few strides per trial, in conditions which can be far from steady
state. The acquisition of gait in an unfamiliar and artificial environment can psychologically
condition the subject, who will over perform with respect to his/her every-day-life ability. The
measurement of the prosthetic knee kinematics through IMMUs potentially allows to perform
clinical evaluations during spontaneous walking in real-life environments.
Methods
An above-knee amputee fitted with a C-Leg electronic knee prosthesis participated in the
experiment after giving his informed consent. Combined acquisitions of 5 walking trials were
measured inside of the laboratory, running Xsens and Vicon simultaneously [2]. For both the
limbs, segment kinematics in terms of quaternions were compared as described in [3].
Furthermore, 130 walking strides were acquired through the Xsens system out of the laboratory
and knee joint kinematics was represented applying C.A.S.T. [4] to the Xsens data, following
[2]. 3D kinematics was automatically subdivided in gait cycles using the SEAG algorithm [5].
Confidence bands of joint kinematics pattern were then created following [6]. For (2) a new
method developed by Xsens, named KiC (Kinematic Coupling) [7], soon to be released, was
applied to the MTx orientations of the prosthetic limb, obtaining new confidence bands.
Results
Segment kinematics comparison among the 5 walking trials between Xsens and Vicon showed
mean RMSE values for thigh and shank segment of the prosthetic limb of respectively 2.4° ±
477

1.2° and 2.3° ± 1.8°. For the prosthetic limb, knee kinematics presented large confidence bands for ab-adduction and internal-external rotation angles, respectively from -12.5° to 12.5° and from – 15° to + 15° . When applying the KiC method, the bands for ab-adduction and internal-external rotation were restricted to [ -2° , 0.7° ] and [ -2.3° , 1.7° ] . In Figure 1, differences in knee joint angles when comparing Xsens and Xsens after applying KiC, sharing the CAST technique, are presented during the outside walking trials.
Discussion Results for the prosthetic knee during the outside walking confirmed the inaccuracy problems found in the segment kinematics. Although knee flexion-extension angle seems to be well represented, it is worth to notice that the prosthetic knee joint is designed as an hinge joint, i.e. ab-adduction and internal-external rotation angles must be theoretically null. This characteristic is correctly described by KiC method which was proved to be effective in improving the accuracy of knee kinematics representation during gait.
Figure 1 - Knee joint angles when comparing Xsens+CAST (blue curves) and Xsens+KiC+CAST (red curves) during the outside walking trial
References [1] Cutti et al., Med Biol Eng Comput. 2009 Nov 13. [Epub ahead of print] [2] Ferrari et al., Med Biol Eng Comput. 2009 Nov 13. [Epub ahead of print] [3] Cutti et al., Med Bio Eng Comput 46, pp. 169–178, 2008 [4] Cappozzo et al., Clin Biomech, 10(4), pp. 171-178, 1995 [5] Raggi et al., Gait Posture 28, S26-27-31-32, 2008 [6] Garofalo et al., Med Biol Eng Comput, 47(5), pp. 475-86, 2009 [7] Schipper et al, submitted to this conference
478

Effect of Novel CAD Designed Pedorthosis for Children with Clubfoot
Liu, X.C., 1Rizza, R., Thometz, J., Lyon, R., Tassone, C., 2Tarima, S. Dept. of Orthopaedic Surgery, 2Dept. of Biostatistics, Medical College of Wisconsin
Milwaukee, WI, 1Dept. of Mechanical Engineering, Milwaukee School of Engineering, Milwaukee, WI
Introduction: A customized dynamic pedorthosis has been developed in our institutions that may be able to prevent recurrence of the treated clubfoot [1]. This new pedorthosis was developed using our OrthoticPro™, a software package that utilizes dynamic plantar pressure data, and computer aided engineering tools. The pedorthosis is constructed using rapid prototyping technologies (RP). However, the effectiveness of this custom pedorthosis for ambulating children remains to be investigated. The purpose of this research was to: 1) compare the pressure metrics between barefoot in regular shoes and the pedorthosis, and 2) quantify the deviation of the center of pressure (COP) trajectory from the normal trajectory with and without the use of the pedorthosis. Clinical Significance: Not only is the dynamic pedorthosis a unique modality to prevent the relapse of the clubfoot but it is efficiently fitted, digitally optimized, simply replaceable and quickly constructed. Methods: Five typically developing children (average age 7.2 years, 2 girls and 3 boys) and five clubfoot patients with (average age 6 years 1 girl and 4 boys) were recruited. The finite element model was generated using CT based geometry and plantar pressure (Emed, Novel Inc., MN). The pedorthosis was constructed from the CAD model and manufactured using the RP (Stereolitography). Eight-pedorthtoses were fitted to the children with clubfoot and the children were measured during walking with and without orthotics using the Pedar insole pressure system (Novel Inc., MN). Results: There was significant reduction of the average COP deviation following the use of the pedorthosis (Figure 1). The maximum reduction of the average COP deviation occurred in the forefoot (7.87%) and then the midfoot (4.00%).
479

There are no significant differences of any pressure measurements at the midfoot, medial forefoot, and entire toes. Significant reduction of maximal force, peak pressure, and loading at the heel and the lateral forefoot are identified following the use of the new pedorthosis (P<0.05) (Figure 1).
Figure 1: Average deviation of the COP trajectory from the normal trajectory in the hindfoot, midfoot and forefoot regions following the use of the new pedorthosis.
Discussion: The results indicate that the new pedorthosis attenuates the impact on the heel and transfer the loading from the lateral to the medial forefoot in conjunction with a significant reduction of the COP deviation at the forefoot. This kinetic change may imply a reduced supination of the forefoot in children with residual clubfoot. Our short-term follow-up demonstrates that the pedorthosis improves the dynamic misalignments in the residual clubfoot.
References: [1] R.Rizza, XC.Liu, J.Thometz, R. Lyon, S. Kamara, C.Tassone, and G. Harris. Simulation of Dynamic Pedorthosis Using Computer Modeling in the Treatment of Clubfoot. The Rehabilitation Engineering and Assistive Technology Society of North American (RESNA), June 26-30th, 2008, Washington, DC, Arlington, VA.
Acknowledgements: This study was funded by the NIDRR grant #H133G060142. Thanks to Dr. G. Harris, OREC, Marquette University for his advice.
480

A STUDY OF THE EFFECTS OF GEL LINER THICKNESS ON IN SOCKET RESIDUAL LIMB PRESSURES IN TRANS-TIBIAL PROSTHESIS USERS
Rebecca Stine, MS (1-2), Andrew Hansen, PhD (2-3), Erin Boutwell, MS (2),
Kerice Tucker, BS (2), Mark Edwards, CP, MHPE (4-5), Steven Gard, PhD (1-2, 4)
1. Jesse Brown VA Medical Center, Dept. of Veterans Affairs, Chicago, IL USA 2. Northwestern University Prosthetics Research Laboratory and Rehabilitation
Engineering Research Program, Chicago, Il USA 3. Minneapolis VA Medical Center, Dept. of Veterans Affairs, Minneapolis, MN USA 4. Northwestern University Prosthetic Orthotic Center, Chicago, IL USA 5. Otto Bock Health Care, Minneapolis, MN USA Introduction Polliak et al.
1 pointed out that measuring pressure at the interface between the residual
limb and the prosthetic socket could provide valuable information in the process of socket fabrication, modification, and fit. Previous studies have investigated the effects on interface pressure as a result of changes to prosthetic alignment,
2 adaptable ankle-foot
components,3 and walking surfaces (ramps/stairs).
3,4 It is also likely that changes to the
socket or liner will affect interface pressure. For example, liner thickness may affect interface pressures by altering pressure distribution, but its effect has not been previously investigated. Therefore, the purpose of the current study is to examine the effects of gel liner thickness (3mm and 9mm) on residual limb pressures. Clinical Significance Prosthetic sockets form the interface between the residual limb and the prosthesis and are important for the transmission of forces and distribution of pressure in persons with amputation.
5 They also contribute substantially to socket comfort, a constant problem for
persons with amputation.6 Liners may improve comfort by more evenly distributing
pressure. Methods Eight subjects with unilateral trans-tibial amputations agreed to participate in the study and signed IRB-approved consent forms. All subjects were between the ages of 18-70 with at least 6 months experience using a prosthesis and were able to walk without undue fatigue. Two Alpha® prosthetic gel (thermoplastic elastomer) liners (Ohio Willow Wood, Mt. Sterling, OH) were tested. Sockets for both gel liners were made for each subject using a computer aided manufacturing system developed in our laboratory called Squirt Shape.
7 All other prosthetic components including the feet were standardized for all
subjects. The same certified prosthetist fit and aligned the socket to each subject. Subjects were given an accommodation period of at least two weeks on each prosthesis prior to testing. A gait analysis was performed with the person walking at his normal self-selected speed for each gel liner condition. Mean walking speed across all subjects and all conditions was 1.14 ± 0.14 m/sec. Prior to each gait evaluation, 6cm x 3cm pressure sensors (Pliance, Novel Electronics, Inc.) were placed over the patellar tendon region, the anterior distal tibia, and the fibular head. Pressure data were synchronized with the motion data and recorded at 120 Hz. Results Mean maximum pressure curves averaged over multiple gait cycles for a representative subject are shown in Figure 1. Mean peak pressure values for each sensor matrix during stance phase are shown in Table 1. Pressure over the fibular head was either reduced with
481

the 9mm liner or did not exhibit a change. Pressure data over the patellar tendon area was reduced in 5 subjects, increased in 1 subject, and showed no change in 1 subject. Over the anterior distal tibia, 5 subjects showed a decrease in pressure with the 9mm liner, while 1 subject exhibited an increase in pressure and 1 subject showed no change.
Table 1. Peak Pressure Values (kPa)
Patellar Tendon Distal Tibia Fibular Head Subject
3mm 9mm 3mm 9mm 3mm 9mm
1 273.05 191.02 413.29 272.49 521.61 487.38
2 326.81 229.89 344.71 277.66 624.74 473.66
3 229.49 161.69 127.85 266.02 112.36 80.12
4 541.16 227.79 186.36 196.09 461.87 143.71
5 212.23 126.89 N/A N/A 327.46 179.26
6 78.30 122.48 301.03 235.91 215.32 138.57
7 265.06 244.07 390.15 287.64 399.19 304.04
8 N/A N/A 165.23 139.09 182.46 187.85
N/A – not applicable; data missing due to technical problems.
Discussion Gel liner thickness affected pressure most noticeably over the fibular head, likely due to the redistribution of pressure to more load tolerant areas away from the bony prominence. Pressure was also reduced in many of the subjects over the patellar tendon and distal tibia regions. The greater variation in the redistribution of pressures at these regions could be due to minor changes in socket fit or alignment between the two experimental conditions. Another potential variable is the amount of soft tissue on the residual limb which itself may serve to distribute pressure. References 1Polliack et al., Prosthetics Orthotics International 24(1):63-73(2000).
2Seelen et al., Clinical Rehabilitation 17:787-796(2003).
3Wolf et al., Clinical Biomechanics 24 (10):860-865(2009).
4Dou et al., Clinical Biomechanics 21(10):1067-1073 (2006).
5Mak et al., Journal of Rehabilitation Research & Development, 38(2):161-74 (2001).
6Gailey et al., Journal of Rehabilitation Research & Development, 45(1):15-30 (2008).
7Rolock et al., 2
nd National VA Rehabilitation Research & Development Conf; Feb. 2000.
Acknowledgments This work was supported by the Department of Veterans Affairs (Grant #A3518R), Rehabilitation Research and Development Service, and is administered through the Jesse Brown VA Medical Center, Chicago, IL.
Figure 1. Mean maximum pressures over successive gait cycles for subject #2.
482

483

484

Comparison of Over the Ground and Treadmill Propulsion Patterns of Manual Wheelchair Users with Tetraplegia
Christina L. Stephens and
Program in Occupational Therapy Jack R. Engsberg
Washington University School of Medicine, St. Louis, MO. Introduction Wheelchair propulsion investigations have been conducted for the past 25 years (Sanderson & Sommer, 1985). Studies have been conducted on different aspects of wheelchair propulsion to determine if the way an individual propels his or her manual wheelchair has an impact on stress and chronic overuse injuries to the upper extremity (e.g., Boninger et al., 2005; Sanderson & Sommer, 1985). The commonality between these studies is the use of treadmills (belted or roller) (e.g., de Groot et al., 2006). Little is known about whether the propulsion data collected on the treadmill surfaces is representative of propulsion over the ground. It is worthwhile to note that kinematic comparisons of over the ground and treadmill walking in ambulatory participants
have reported differences in lower extremity joint angles, cadence and stance time (e.g., Riley et al., 2007). No studies have been found that test the validity of using treadmills for examining mechanics and injury related factors associated with wheelchair propulsion. The purpose of this investigation is to compare wheelchair propulsion kinematics of manual wheelchair users on treadmills and over the ground.
Statement of Clinical Significance Assuming treadmills are a valid method in wheelchair propulsion research may be incorrect and the conclusions made regarding propulsion mechanics and chronic injuries from the studies may not be justifiable. Methods A sample of 8 otherwise healthy participants with tetraplegia aged 32.5±9.5 years were recruited for a single test session. Participants used a manual wheelchair as their primary method of mobility over the ground. Surface markers were placed on upper extremity, trunk and wheelchair. A 6-camera video motion capture system was used to collect kinematic data as the participants wheeled over the ground, and on roller and belted treadmills (randomly selected) at their freely chosen speed. Data of the wrist marker were tracked and used to produce sagittal plane patterns for each subject wheeling over the different surfaces (e.g., Shamada et al., 1998). Specific variables were quantified for each surface (Figure 1). Two variables will be reported here: 1) the area of the large loop (Area, lg loop), and 2) the maximum height (Max Height) to maximum length (Max Length) percentage (Max Height/Max Length*100 [H/L%]). A repeated measures ANOVA was used to test for significant differences between the 3 surfaces (p<0.05). Marginally nonsignificant results at p-values between 0.05 to 0.1 are also reported. Effect sizes were calculated. Results The results showed a significant (p = 0.024) difference in H/L% when comparing propulsion over the ground and propulsion on treadmill surfaces (Table 1). We noted marginally nonsignificant (p = 0.089) differences in area (cm²) when comparing overground propulsion to
485

treadmill propulsion. There were large effect sizes for treadmill versus overground propulsion for area (����0.89) and H/L% (�������.
DiscussionLimitations of this study include the small sample size (n=8) and the lack of homogeneity in the subject pool due to the inherent nature of tetraplegia. Our study adds to the body of knowledge pertaining to manual wheelchair propulsion in at least two ways. The present study is the first to look at a series of discrete variables that appear to objectively describe propulsion patterns. Further work is necessary to investigate the effectiveness of the variables in other conditions (e.g., paraplegia). However, these variables may provide a more robust objective method of quantifying propulsion patterns. The current study presented differences between the patterns individuals made over the ground versus the patterns they made on treadmills. One of the reasons researchers use treadmills to collect data is to simplify the data collection process. The participant remains in a single location in the data collection volume and continues to propel him or herself. In over the ground data collection, propulsion may be limited by lab space and data collection volume. It is suggested that caution be used in extrapolating conclusions related to mechanics and chronic injuries from treadmill propulsion techniques to over the ground propulsion techniques.
References1. Sanderson et al. Kinematic features of wheelchair propulsion. J Biomech 1985;18:423-9.
2. Boninger et al., Pushrim biomechanics and injury prevention in spinal cord injury: Recommendations based on CULP-SCI investigations. J of rehabR&D 2005;42:9-20.3. de Groot et al.,Standardization of measuring power output during wheelchair propulsion on a treadmill, Pitfalls in a multi-center study. Med Engineering & Physics 2006;28:604-612.4. Riley et al., A kinematic and kinetic comparison of overground and treadmill walking in healthy subjects. Gait & Posture2007;26:17-24.5. Shamada et al.,Kinematic Characterization of Wheelchair Propulsion. Jrehab R&D 1998;35:210.
Table 1: Means and standard deviations (SD).Surface H/L% Area, lg loopBelted L-hand 27.7(8.7) 392.5(290.6)
R-hand 34.9(14.2) 453.9(262.5)Roller L-hand 30.9(11.2) 414.1(267.5)
R-hand 33.5(12.8) 460(243.4)Over the ground L-hand 20(15.3)* 258.5(302.1)**
R-hand 21.3(16.5)* 312.8(292.5)***Significantly different from belted and roller treadmill (p<0.05)**Marginally nonsignificant from belted and roller treadmill
(0.05<p< 0.1)
486

Title: Acceptable Levels of Forceplate Error in Gait Analysis
Author: Andrew Lewis, Adam Shortland.
Affiliations: One Small Step Gait Laboratory, Guy’s & St. Thomas’ Foundation Hospital Trust,
London. UK.
Introduction
A calibration check of forceplates is an important quality control measure in the motion analysis
laboratory. Centre of pressure (CoP) and ground reaction force (GRF) measurements are used to
calculate joint kinetics, and errors in these measurements could lead to misleading results. Both
static and dynamic techniques have been proposed to assess the accuracy of these measurements
(Hall et al (1996), Fairburn et al (2000), Baker (1997), Rabuffetti et al (2003), Holden et al
(2003) and Lewis et al (2007)). However, there is little work reported that defines the level of
acceptable errors. In this paper, we simulate errors in the CoP and the direction of the GRF and
quantify the deviation in joint kinetics that result.
Clinical Significance
Treatment decision making and successful research relies upon data quality. It is important to
know the acceptable magnitude of errors from the laboratory equipment when conducting
calibration checks of equipment.
Method
Three spastic diplegic cerebral palsy subjects, aged 10-12 years old, were selected at random
from our gait laboratory motion capture database. One trial with a clear right foot force-plate
strike was chosen from each subject and processed with the standard plug-in-gait biomechanical
model (Vicon, Oxford, UK). Software written in Microsoft Excel Visual Basic with C3DServer
functions (Motion Lab. Systems Inc., USA) was used to alter the force-plate data stored in the
analog channels of the Vicon C3D files to simulate sixteen typical CoP and GRF errors. The
altered trials were then re-processed and RMS Z-scores were calculated for seven kinetic
parameters. The change in kinetics (∆Z) from each error mode was then quantified as the difference between the error mode trial and the original trial. A ∆Z value of 0.5 (a change in the RMS value of the stance phase kinetic data by 0.5 standard deviations of the laboratory control
population) was assigned as the threshold of acceptability above which changes in the joint
kinetics could influence treatment decision making..
Results
Table 1 shows the ∆Z values that occurred from all sixteen force-plate error modes. It can be seen clearly that, as expected, the changes in kinetics are larger with increasing error in CoP and
GRF angle and the pattern of errors match with the orientation of the laboratory coordinate
system (antero-posterior and medio-lateral). Figure 1 show the changes to the hip
abduction/adduction data for one of the subjects for the four GRFy error values.
Discussion
This aim of this project was to answer the question of how inaccurate do the CoP or GRF need to
be to produce clinically relevant changes in gait kinetics? Looking at Table 1 and using the ∆Z threshold of 0.5, the acceptable force-plate errors suggested by this analysis are approximately
CoP < 20mm and GRF < 2º. Known force-plate errors, as measured by Lewis et al (2007), were
487

��������������� ����������������������������������������������� �!��"���������������������������������������������������������������������������� #��������!�������������#�����#���������������������������������������������������$%������#�����&�������������������#�'�����#����(�������������������������������������������������)����*���������+��������'"��������������������#�������'���!�����'������������������������#���*��'������������ #������#������������������������������#�� #������������������������ �������������������������������������'���������������#����������*���������'�����������������������������������������!�������������������������������'��������������������!����#������!�� ������������(��#����� ������������%��#������������������������#�'���������#������������!��#����������������������������!������������������'������'������������������������������
�� � ����,����-��.� � ����,����-��.� �������(,�(��-/.� ������,����-/.�
�� 01� 0��� 0��� 01�� 01� 0��� 0��� 01�� 0�� 0�� 01� 0��� 0�� 0�� 01� 0���
���������� ���� ���� ���� ���� ���� ���� ���� ��2� ���� ���� ���� ���� ���� ���� ���� ���� ��1�
���������� ���� ���� ���� ���� ���� ���� ���� ���� ��3� ���� ���� ��3� ���� ��3� ���� ���� ����
����������� ���� ���� ���� ���� ���� ���� ���� ��2� ���� ���� ��3� ���� ���� ���� ���� ���� ��3�
���������� ! � ���� ���� ���� ��2� ���� ��3� ���� ���� ���� ���� ��2� ���� ���� ���� ���� ����
����!�"�#� ���� ���� ���� ���� ���� ���� ���� ���� ���� ��3� ���� $��� ���� ���� ��3� ����
�����!�"�#� ���� ���� ���� ���� ���� ���� ���� ��2� ���� ���� ��3� ���� ���� ���� ���� ����
�����!�"�#� ���� ���� ���� ���� ���� ��3� ���� ���� ���� ���� ���� ��2� ���� ���� ���� ��3�
4�������5��6�������������������7�����������������!�������������*�������!����������4�����!��#�����������#������������������#����!��������������������������6�!��#�����!����1������� ����������
�����������8�*������ -�99:.�4��� *���4���;�%�<�������*� ��������� ����%��#���'���=��������������>������� ������ ������;�::7�:?�������#��� "� �������"�@�'�� �A"���������<"�A����<��-����.�%� ���'��� <'����� ��� 4������ ����� ������� >'������ ������������� ������ ������$;�1733�������B"���������"�>����B"�B������*�<"� �#��A��-�99C.�<������������#������������������� �����������������������$%-1.;C197CC1�������� A"� <������ <"� <������� <�� -���3.� %� ������ 4���� ��<#����� ���� ��������� B!������ %���'���� &������'�%������������ ��������� ������ �������;��17��3��&� ���%"�<�� �����"� ������D"�4��!��'���A��-���:.�>�!�������������+����#������� ���4�������E�������������&������'�$#����'�����*��� ���� �����$�;3�:53�������#������� B"� ��������� B"� B�FF����� "� 8��!��#��� �"� ������%�-���3.� G��������� ����#��� ��� ���� ����������� �� ���� ����� �������&��������� ������ ���"���;:17?��
�
�� �� �� �� �� �� � � �� �� ���
� ��
� ��
� ��
� ��
� ��
� ��
��������������
����������� !"�#���$"�%&�
�'(��#&���)**!*���!+��,-�.�/
��
��#��� �� 5� ������ ��� ���� ��,���#����������� ���� ���������� ���� ����� ����7������������
���0!�������#��1�!*�&�#����*����2!������#�/�1��**!*�"!��/�
488

PHARMACOLOGICAL TREATMENT FOR INTERMITTENT CLAUDICATION DOES
NOT SIGNIFICANTLY AFFECT GAIT IMPAIRMENTS DURING CLAUDITION PAIN
Jennifer M Yentes1, Jessie M Huisinga1, Sara A Myers1,
Iraklis I Pipinos2, 3, Jason M Johanning2, 3, Nicholas Stergiou1, 4
1Nebraska Biomechanics Core Facility, University of Nebraska at Omaha, Omaha, NE
2Department of Surgery, University of Nebraska Medical Center, Omaha, NE 3Veterans Affairs Medical Center, Omaha, NE
4College of Public Health, University of Nebraska Medical Center, Omaha, NE
Email: [email protected] Web: http://biomech.unomaha.edu/
INTRODUCTION
Peripheral arterial disease (PAD) affects up to 20% of older adults in the United States and is a
manifestation of atherosclerosis leading to decreased blood flow to the legs [1]. The characteristic
symptom of PAD is intermittent claudication, which is pain or cramping caused by insufficient
blood flow during physical activity [5]. Currently, two medications are approved by the FDA for
treatment of intermittent claudication, cilostazol and pentoxifylline.
CLINICAL SIGNIFICANCE Current research has demonstrated that PAD patients have altered ground reaction forces, joint
kinematics and kinetics, and time-distance parameters as compared to controls [2,3,6]. In addition,
limited analysis of gait in PAD patients suggests pharmacological interventions do not lead to
improved gait patterns when taking cilostazol or pentoxifylline [4]. The present investigation
extends this work to the evaluation of joint torques and powers during claudication pain after
pharmacological treatment.
METHODS
Twenty four PAD patients were enrolled (67.8 + 9.6 years); 14 participants were prescribed
cilostazol and 10 participants were prescribed pentoxifylline. Subjects were asked to walk on a
treadmill at 0.67 m/s at a 10% incline until the presence of claudication pain. Once the onset of
pain was felt, subjects walked at their self-selected pace along a ten meter pathway while
kinematics (60 Hz; Motion Analysis, Santa Rosa, CA) and kinetics (600 Hz; Kistler Instrument
Corp., Winterthur, Switzerland) were recorded. Five trials were collected for each affected limb
during claudication pain with no breaks between trials. Group means of gait velocity, as well as
peak joint torques and powers from the hip, knee, and ankle joints during stance phase were
subjected to a 2x2 fully repeated measures ANOVA (Treatment group (cilostazol vs.
pentoxifylline) x Therapy (pre treatment vs. post treatment); Table 1).
RESULTS
Results are presented in Table 1 below.
DISCUSSION
In total, only 3 of 36 comparisons were significantly different. Overall, these data demonstrate
that neither Therapy (pre vs. post) nor Treatment group (pentoxifylline vs. cilostazol) had an
overall significant effect on gait impairments in PAD patients during claudication pain. However,
it should be mentioned that gait velocity slightly improved with pharmacotherapy. This
489

improvement is probably associated with the improvements found in hip power generation in late
stance that possibly compensated for the disappointing results at the ankle. These slight
improvements were more obvious for the cilostazol. In conclusion, overall our results are in
agreement with our previous findings demonstrating that pharmacological treatment did not
have an effect on gait biomechanics prior to the onset of claudication pain [4]
. The lack of
significant changes in additional gait parameters following therapy during claudication pain
indicates that both groups had overall similar gait patterns before and after 12-weeks of
pharmacological treatment. Although patients benefit symptomatically with increased walking
distance with the two drugs [7], the current study suggests the mechanism is not likely an
improvement in muscle function or improvement in overall gait mechanics.
REFERENCES
1. American Heart Association. (2007). “Heart Disease and Stroke Statistics - 2007 Update”.
2. Celis et al. (2009). Journal of Vascular Surgery, 49: 127-132.
3. Chen et al. (2008). Journal of Biomechanics, 41:2506–2514.
4. Huisinga et al. (2009). Journal of Applied Biomechanics, In Press.
5. Rosamond et al. (2007). Circulation, 115(5): e69-171.
6. Scott-Pandorf et al. (2007). Journal of Vascular Surgery, 46(3): 491-9.
7. Dawson et al. (1998). Circulation, 98(7): 678-686.
ACKNOWLEDGEMENTS
Support was provided by the NIH/NIA/Ruth L. Kirschstein National Research Fellowship and the
Nebraska Research Initiative.
Table 1: Group means + standard deviation for the stance phase of walking.
Dependent Variable Pre
Cilostazol
Post
Cilostazol
Pre
Pentoxifylline
Post
Pentoxifylline
Gait Velocity (m/s) * § 1.05 + 0.14 0.97 + 0.11 1.11 + 0.16 1.08 + 0.13
Ankle ROM (degrees) 20.18 + 1.09 19.67 + 0.58 19.79 + 0.73 19.80 + 0.65
Knee ROM (degrees) 9.64 + 1.30 9.69 + 1.31 9.96 + 1.72 9.28 + 1.42
Hip ROM (degrees) 35.29 + 1.50 35.83 + 1.28 35.93 + 2.11 35.38 + 1.83
Ankle Dorsiflexor Torque (N*m/kg) -0.35 + 0.02 -0.28 + 0.04 -0.32 + 0.03 -0.27 + 0.4
Ankle Plantarflexor Torque (N*m/kg) 1.24 + 0.06 1.12 + 0.08 1.36 + 0.08 1.32 + 0.06
Knee Extension Torque(N*m/kg) 0.66 + 0.06 0.73 + 0.10 0.82 + 0.12 0.67 + 0.06
Knee Flexor Torque (N*m/kg) -0.17 + 0.05 -0.14 + 0.07 -0.11 + 0.04 -0.06 + 0.03
Hip Extensor Torque (N*m/kg) 0.84 + 0.06 0.82 + 0.10 0.89 + 0.06 0.88 + 0.10
Hip Flexor Torque (N*m/kg) -0.85 + 0.10 -1.08 + 0.17 -0.89 + 0.11 -0.94 + 0.07
Ankle power absorption mid-stance (W/kg) -0.38 + 0.06 -0.32 + 0.03 -0.40 + 0.06 -0.45 + 0.12
Ankle power generation late stance (W/kg) * 2.02 + 0.16 1.70 + 0.14 2.54 + 0.17 2.47 + 0.18
Knee power absorption early stance (W/kg) -0.73 + 0.09 -0.81 + 0.13 -0.66 + 0.11 -0.74 + 0.14
Knee power generation early stance (W/kg) 0.33 + 0.06 0.42 + 0.09 0.51 + 0.11 0.35 + 0.06
Knee power absorption late stance (W/kg) § † -0.59 + 0.06 -1.36 + 0.27 -0.69 + 0.09 -0.66 + 0.09
Hip power generation early stance (W/kg) 0.54 + 0.05 0.59 + 0.13 0.50 + 0.08 0.55 + 0.12
Hip power absorption mid-stance (W/kg) -0.64 + 0.09 -0.96 + 0.16 -0.75 + 0.11 -0.74 + 0.06
Hip power generation late stance (W/kg) § 0.51 + 0.06 0.79 + 0.12 0.68 + 0.08 0.71 + 0.08
Note:
* p < 0.05, significant main effect for Treatment group (cilostazol vs. pentoxifylline) §
p < 0.05, significant main effect for Therapy (pre vs. post)
† p < 0.05, significant interaction
490

Potential for end-effector based rehabilitation robotics for theanalysis of healthy and pathological gait
Sami Hussein, Dimitar Shterev, Jochen Radmer, Henning Schmidt, Jörg KrügerRehabilitation Robotics Group (Fraunhofer IPK/TU Berlin), 10587 Berlin, Germany
1 IntroductionThe use of robotic devices in gait rehabilitation has proven be-
Figure 1: Patient on HapticWal-ker
neficial in the rehabilitation of stroke patients in several clinicalstudies [3]. Furthermore the use of these devices also provideshuge potential in the field of rehabilitation assessment and gaitanalysis. Various types of integrated sensors provide valuabledata for gait and treatment analysis. Inherently end-effector ba-sed robotic gait devices enable the measurement of ground reac-tion forces (GRF) via integrated force/torque sensors imposingdefined constraints and guidance on foot motion while leavingthe remaining parts of the body unrestricted. Furthermore thesedevices are an ideal platform for the integration of camera ba-sed motion tracking systems which provide information on e.g.knee, hip and torso motion. This work is focused on the benefitsdrawn from the measurement of GRF using end-effector basedrobots in rehabilitation.
2 Clinical SignificanceGait analysis data can provide very useful information for rehabilitation training assessment andplanning. However conventionally collecting GRF and motion tracking data is very elaborateespecially in patients. The presented approach using end-effector based robot assisted therapyinherently includes the acquisition of GRF data over the complete training period and along allspatial degrees of freedom. These measurements can be used to support therapy planning andallow for quantitative methods to assess the progress and success of the treatment.
3 MethodsThe device used in this work is the robotic walking simulator HapticWalker (see fig. 1). The feetare tightly fixed on two footplates equipped with force-torque sensors. Currently data has beencollected and analyzed in a so called position controlled mode. Here the device imposes desiredwalking movements on the feet and the resulting forces can be measured at the footplates. Tocompare the GRF in healthy gait to those present in free walking 10 subjects were investigated.The mean vertical GRF during robot assisted walking where compared to forces in free walkingfrom literature [1]. In a single case study with one chronic stroke patient GRF data was recordedover 3 weeks of training (floor walking/stair climbing). The progress of the patient was qualita-tively evaluated by our clinical partners [2] using the data of the healthy subjects as reference.The outcome was now compared to the progress seen in GRF toward the patterns observed inhealthy subjects using typical timing and amplitude parameters of the GRF signals as well asthe parameter free Fourier analysis and PCA.
491

4 ResultsCompared to free walking the GRF curves during HapticWalker training of healthy subjectsshowed a subset of characteristic parameters, especially the peaks for heel strike and push offand the minimum in mid stance with comparable amplitudes but delayed timing [1]. The ana-lysis of the training data yielded that a parameter based analysis lacks robustness of parameterextraction. Therefore parameter free methods, namely Fourier analysis and PCA were applied tothe mean force signals. Especially for floor walking the PCA analysis revealed the improvementstated by the clinical test (see fig. 2). The Fourier analysis is able to show the amount of loading
Figure 2: PCA: patient (circle) in early (left) and late (right) treatment phase vs. healthy subjects (cross)
of the legs in the constant component and the principle shape of the force pattern in the first sineand cosine coefficient for anterior-posterior and vertical forces respectively. These also reflectedthe positive outcome.
5 DiscussionThe goal of this work was to find out if the progress qualitatively observed during three weeksof robot assisted therapy in a single case study could be supported by quantitative measures.To achieve a quantitative measure of therapy progress the GRF gathered were compared againstreference data from healthy subjects. Therefore, parameter based (e.g. symmetry) and parameterfree (e.g. PCA) methods where investigated. The parameter based methods proved to be signi-ficantly less robust than parameter free methods. Using mainly the parameter free methods thepatients’ improvement found in clinical test could also be seen in quantitative results from GRF.To find a GRF based scale to rate therapy progress more data is needed. A weighted combinationof selected analysis methods, which leads to a single or a small set of values, is expected to leadto the best results. The development must be done in cooperation with clinicians and take intoaccount existing clinical scales.
References[1] Sami Hussein, Henning Schmidt, Stefan Hesse, and Jörg Krüger. Effect of different training modes
on ground reaction forces during robot assisted floor walking and stair climbing. In Proceedings ofthe IEEE International Conference on Rehabilitation Robotics, ICORR 2009, June 2009.
[2] Sami Hussein, Henning Schmidt, Mirjam Volkmar, Frank Piorko, Stefan Hesse, and Jörg Krüger.Roboterunterstütztes treppensteigen in der neurologischen gangrehabilitation. In Gemeinsame Jah-restagung der DGNKN und DGNR, page 32, Saarbrucken, Germany, December 2-5 2007.
[3] J. Mehrholz, C. Werner, J. Kugler, and M. Pohl. Electromechanical-assisted training for walking afterstroke. Cochrane Database of Systematic Reviews, 4, 2007.
492

Inverse dynamics-based musculoskeletal models of rectus femoris tendon transfers
Michael Skipper Andersen1, Bruce MacWilliams2 & John Rasmussen1 1Aalborg University, Aalborg, Denmark
2Shriners Hospital for Children, Salt Lake City, Utah, USA
Introduction A frequently observed lower extremity dysfunction in children with Cerebral Palsy (CP) is stiff-knee gait, characterized by diminished knee flexion during swing, and/or delayed peak knee flexion1. Stiff-knee gait is often caused by a combination of tight hamstrings and abnormal firing of the Rectus Femoris (RF) in early swing, preventing normal knee flexion.
If it has been determined that abnormal firing of RF is contributing to stiff-knee gait, RF tendon transfer (RFTT) surgery2 may be performed. However, RFTTs are not always successful3. In some patients, the post-operative gait pattern may show insignificant changes or even worsening. Currently, it is not understood why these poor outcomes occur and what are the fundamental differences between good and poor outcome patients. Therefore, in this retrospective study, we created musculoskeletal gait models of both a good and a poor outcome RFTT patient. It is hypothesized that scar tissue development post-operatively is a cause of the poor outcome and this is tested with the model.
Clinical significance Musculoskeletal modeling holds the potential to enable model-based surgical planning. As a pre-requisite, validated models of musculoskeletal dysfunction need to be developed. This paper reports preliminary results of a RFTT model.
Methods Inverse dynamics-based models of the patients’ gait were constructed in the AnyBody Modeling System v. 3.0 from measured marker trajectories, ground reaction forces and EMG using the Twente Lower Extremity Model4. The kinematics and anthropometric model scaling were established using the method of Andersen et al (2009)5, assuming uniform segment scaling. The spastic RF muscle was modeled as two parts: 1) one muscle part which corresponds to the transferred muscle with insertion on the posterior side of the thigh similar to how the muscle was transferred during surgery and 2) a scar tissue ‘muscle’ still connected to patella. The forces in the scar tissue connection and RF were estimated from the measured EMG by assuming a linear relationship between the EMG envelope and the muscle force. As both the strength of the transferred RF muscle and the amount of scar tissue in the patients were unknown, combinations of muscle strength were tested in a parametric study. RF strength was varied from 20%-120% in steps of 20% of normal and carrying ratios between the transferred RF muscle and the scar tissue ‘muscle’ were varied from 0%-100% in steps of 20%.
493

Results In Figure 1, the computed muscle activities for gastrocnemius and vastus medialis are shown for the situation where RF is assumed to be very strong (1.2 times normal strength) and with varying degrees of assumed scar tissue for both the good and poor patients. Comparisons with EMG of semitendenosus and tibialis anterior were also conducted. It can be seen in the figure that only when it is assumed that there is a strong connection between RF and patella though scar tissue (black and pink curves) for the poor outcome patient, that the computed muscle activities match the EMG envelope by demonstrating two peaks for the gastrocnemius. For the good outcome patient, only a good agreement between EMG and computed muscle activities for vastus medialis are obtained when little or no scar tissue is assumed.
Figure 1: Computed muscle activities and EMG. Red (0.0) refers to the case of no scar tissue and black (1.0) to that RF was not transferred. The intermediate values are the cases were the estimated RF force is transferred along both branches. Top row: Poor outcome patient. Bottom row: Good outcome patient.
Discussion The best agreement between the computed muscle activities and measured EMG were obtained when no scar tissue connection was modeled in the good outcome patient and when significant force transference through scar tissue was modeled in the poor outcome patient. During a later revision surgery, it was confirmed that the developed scar tissue was indeed the cause of the poor outcome and it is encouraging that the model lead to the same conclusion as what was found in this patient.
References [1] Riewald et al. 1997. Dev. Med. Child Neuro. 39, 99-105. , [2] Perry 1987. Dev. Med. Child Neuro. 29, 153-158., [3] Reinbolt et al. 2009. Gait Posture 30, 100-105. [4] Klein Horsman et al. 2007. Clin. Biomech. 22(2), 239-247., [5] Andersen et al. 2009. Comput. Meth. Biomech. Biomed. Eng. (In Press).
494

Comparison of Electromyography and Joint Moment as Indicators of Co-contraction Brian A. Knarr1, Joseph Zeni, PhD1, Jill S. Higginson, PhD1
1Center for Biomedical Engineering Research, University of Delaware Introduction Persons with knee osteoarthritis (OA) demonstrate abnormal muscle coordination strategies, particularly increased antagonist muscle activity around the knee joint1. Increased antagonistic muscle activity, or co-contraction, can amplify the axial forces at the knee joint2. These excessive forces may subsequently lead to the initiation and progression of cartilage degeneration3. Therefore an accurate assessment of muscle-induced alterations in joint forces and moments is critical in understanding the biomechanical variables that may expedite the progression of knee OA. Clinical significance Assessing antagonistic muscle activity enables us to estimate the magnitude of muscle forces, which are directly related to the internal forces of the knee joint4. The purpose of this study was to compare a co-contraction index obtained from simulated gait to a co-contraction index derived from experimentally measured muscle activity in healthy subjects and persons with OA. Methods Experimental A subset of one healthy, one moderate OA subject (Kellgren-Lawrence grade 2-3) and one severe OA subject (Kellgren-Lawrence grade 4) was selected from a larger study1 for comparison of experimental electromyographic (EMG) co-activation and joint moments.
EMG data from the vastus lateralis and semimembranosous were collected at a sampling rate of 1080 Hz during walking trials. An instrumented split-belt treadmill (Bertec Corp., Columbus, OH, USA) was used to obtain the ground reaction forces,
free moment, and center of pressure while the subjects walked at self-selected speed. Retroreflective markers were used to determine joint angles (Orthotrak, EvaRT). EMG data were filtered using a 20-400 Hz bandwith filter. The data were rectified then filtered with a 4th order zero-phase shift Butterworth filter with a cut-off frequency of 30 Hz. Joint kinematics were filtered at 6 Hz. EMG and joint moment data were time-normalized to 100 points representing a complete gait cycle. These data were then normalized to the respective maximum point for the trial.
The co-contraction index5 was chosen to describe the temporal and magnitude components of the EMG signals Eq. (1):
(1)
where LEMG is the magnitude of the EMG signal for the less active muscle, and HEMG is the magnitude of EMG signal for the higher active muscle at a given time. Modeling The OpenSim software package was used to build 3D musculoskeletal models for the walking trials. The model contains 54 actuators and 13 degrees of freedom. Inverse kinematics and residual reduction algorithms were run on the trial data to calculate the model joint kinematics. Computed muscle control6 (CMC) was run to calculate the muscle excitations and resultant forces to recreate the trial kinematics. Minimization of the weighted sum of the muscle stresses squared was used to solve the problem of muscle redundancy. Muscle analysis was run on the model using the OpenSim analysis tool set to obtain the joint
495

moments generated at the knee for each muscle based on the activations solved during CMC. Muscle moment values were normalized to the maximum moment during the walking trial. Using the normalized muscle joint moments, the co-contraction index was modified for the model quadriceps (Vastus Intermedius) and hamstrings (Biceps Femoris Long/Short Head) and calculated using Eq. 2:
(2) where LM is the magnitude of the joint moment for the smaller moment muscle, and HM is the magnitude of the joint moment for the larger moment muscle at a given time. A descriptive comparison of the CCI and MCCI was performed to assess the two methods. Results The co-contraction index for EMG (Figure 1) and joint moment (Figure 2) show similar patterns and normalized magnitudes across all three subjects. The largest EMG co-contraction occurs shortly after heel strike at ~10% of the gait cycle.
Peak joint moment co-contraction occurs slightly later, at~15%. The normalized magnitude of the two indices are also
similar, with a peak of 1.25-1.5 for all three subjects.
Discussion The CCI from both methods were similar, suggesting that simulated muscle moments may realistically describe the antagonistic muscle forces of the knee in persons with and without knee OA. Slight differences in the timing can be attributed to electromechanical delay. Differences may also be attributed to the fact that muscle moments include passive forces, which are not reflected in EMG analysis. The combination of EMG and joint moment co-contraction analysis gives a more complete description of muscle activity and joint loads then either method can provide on its own. Acknowledgements NIH P20-16458 and NIH R01-055383 References 1. Zeni JA. J Electromyogr Kinesiol 2009. 2. Lu TW. J Biomech 1998; 31: 63-69. 3. Griffin TM. Exerc Sport Sci Rev 2005; 33:
195-200. 4. Mesfar W. Knee 2005; 12: 424-434. 5. Rudolph KS. Knee Surg Sports Traumatol
Arthrosc 2000; 8: 262-269. 6. Thelen DG. J Biomech 2006; 39:1107-
1115.
Figure 2. Co-contraction Index generated from joint moments of the quadriceps and hamstrings muscles.
Figure 1. Co-contraction Index generated from EMG signals of the quadriceps and hamstrings muscles.
496

Is the Gait Magnetometer System a valid tool for the measurement of gait parametersduring walking?
Alison Clarke*, Grad Dip Phys, MCSP
*Clinical Specialist Physiotherapist in Movement Analysis and Research, Mobility andSpecialised Rehabilitation Centre, Sheffield Teaching Hospitals NHS Foundation Trust,Northern General Hospital, Sheffield, S57AU, England. [email protected]
IntroductionThe purpose of this pilot study was to evaluate the concurrent criterion validity of a GaitMagnetometer System (GMS) against the VICON (Oxford Metrics Ltd) motion capturesystem, when measuring spatio-temporal parameters in a cohort of healthy subjects.Additionally, the author wished to assess the potential of the GMS for use in clinicalenvironments.The GMS was designed and built by Dr T.J. Healey in the Clinical Engineering Department atthe Royal Hallamshire Hospital, Sheffield and is an adaptation of a standard technique thatuses magnetic fields to track human movement. Although utilised for many other motiontracking applications (Foxlin 2002), the usefulness of magnetometry in rehabilitation has notbeen widely investigated.
Clinical SignificanceMeasurement has become pivotal to clinical healthcare practice (Hammond 2002)(Department of Health 2008). However, the measurement of kinematics during gait isnotoriously difficult in hospital and community environments, where there are often limitedsophisticated measurement facilities. Whilst parameters such as joint angles, foot orientation,cadence and speed can be effectively measured in a gait laboratory, with equipment such asthe VICON Motion Capture System (Oxford Metrics Limited), there are not currently any‘gold standard’ systems for measurement in other clinical work-areas, day centres or thecommunity (Pearson et al 2004).The concept for this study arose following consultation with medical and therapy colleagueswho expressed a desire to have accurate, quantitative information from equipment that ismore portable and simpler to use than is currently available. The GMS had the potential to beideal for this role, but had not yet been validated for that use.
MethodsA convenience sample of 15 healthy subjects participated (7 females and 8 males, mean age43 +/- 11 years). On attending the Gait and Motion Analysis Laboratory, Northern GeneralHospital each subject had retro-reflective markers on the lower limbs (standard markerplacement for the Vicon system) and a small magnetic field sensor, based on three orthogonalcoils, on the dorsal aspect of each foot (the tracking device for the GMS) They thencompleted 3 walking trials on one visit and gait data was recorded concurrently by the GMSand VICON systems. Mean right and left step lengths and speed were calculated for eachsubject. Intra-class correlation was calculated, and Bland-Altman plots constructed, for eachparameter, to evaluate the accuracy of recording by the GMS relative to the VICON.
497

ResultsPearson’s correlation coefficient was significant for the measurement of walking speed (0.93)and left step length (0.79) but not right step length (0.19). Cronbach’s Alpha (significant atvalues >0.7) was similarly significant for the measurement of speed (0.96) and left steplength (0.74) but not that of the right (0.31).Bland-Altman plots initially appeared to show good agreement in the measurement of all thegait parameters, but further examination of the standard deviations indicated that there waslittle clinical significance in the measurement of the left step.
DiscussionThe limitations of the study are identified and discussed, with regard to subjects and dataanalysis.It would appear, from the Pearson’s analysis, that a strong correlation existed when measuringspeed of walking, a fair relationship when measuring left step length but no correlation whenmeasuring the right step length. Further analysis of the data using Cronbach’s Alpha indicatedthat there was also good agreement between the GMS and VICON for speed and left stepmeasurement but not for right step. This is an unexpected result as all measures, for eachsubject, were taken concurrently. The most likely explanation for this is an anomaly in themagnetometer receiver on the right foot.The Bland-Altman plots explored the degree to which the GMS actually differed from theVICON, by removing much of the variability between subjects, thus leaving only anymeasurement error. Additional examination of these for the data indicated clinicalacceptability for the measurement of walking speed but some variability in that for steplength.
The GMS appears to have a potential clinical use in the measurement of gait speed. However,it has not been substantiated as an accurate tool for the measurement of step length.Additional work is required to further develop the equipment accuracy, measure additionalgait parameters and examine the application in other clinical environments.
ReferencesDepartment of Health (2008) Clinical Governance. Available athttp://www.dh.gov.uk/en/Publichealth/Patientsafety/Clinicalgovernance/DH_081604. Lastaccessed 5th December 2009
Foxlin E (2002) Handbook of Virtual Environment Technology. Edited by Stanney, K.Lawrence Erlbaum Associates.
Hammond R (2002) Evaluation of Physiotherapy by Measuring the Outcome.Physiotherapy 86(4): 170-172
Pearson O, Busse M, Van Deursen R, Wiles C (2004) Quantification of walking mobility inneurological disorders. QJM 97: 463-475
498

RECOGNITION OF HEALTH PROBLEMS THROUGH THE AUTOMATIC GAIT ANALYSIS
Bogdan Pogorelc1,2, Matjaž Gams1,2 1Department of Intelligent Systems, Jožef Stefan Institute, Ljubljana, Slovenia
2Špica International d.o.o., Ljubljana, Slovenia
Introduction Due to aging of population, less people are capable of taking care for elderly. We propose an intelligent and ubiquitous care system for monitoring elderly in order to recognize a few of the most common and important health problems, observ-able through the movement. Movement is captured with wear-able infra-red motion capture system, whose outputs are posi-tions of tags at each moment. According to our approach po-sitions of tags are transformed into specific features, relevant to the observed health problems, making the modeling of the health problems patterns more accurate. For the modeling, Support Vector Machines (SVM) machine learning algorithm is used, which classifies walking of user into walking with hemiplegia, Parkinson’s disease, pain in the back, pain in the leg or nothing of those. The obtained classification accuracy is 85-95%. Also, the study of the impact of tag placement and noise level on the accuracy of detection of health problems is presented, as a guidance for future research. Clinical significance We propose an intelligent and ubiquitous care system for monitoring elderly in order to recognize a few of the most common and important health problems, observ-able through the movement. MethodsIn related work, recognition of health problems is usually done in the way that motion capture systems are used for cap-turing of movement which is later examined by the medical experts by hand [1,2]. Our goal was to make the detection automatic. For this pur-pose, user wears 12 tags attached to shoulders, elbows, wrists, hips, knees and ankles. His/her movement is captured with wearable infra-red motion capture system, whose outputs are positions of tags at each moment. The movement is modeled with SVM. Because with time-series of positions of tags for feature vectors performance of model was not sufficiently good, we constructed specific features, according to the fea-tures observed by the physicians. Examples of the constructed features are average frequencies of joints moving, which are crucial for detecting Parkinson’s disease. After evaluation of features we kept 13 features, used for feature vectors for the SVM. Also other machine learning algorithms were used but SVM outperformed them. To test the robustness of the ap-proach, we added varying degree of Gaussian noise to the raw coordinates. To make the variation of noise more genuine, the Ubisense Real-Time Locating System noise was added to the tag coordinates, with its standard deviation 4.36 cm horizon-tally and 5.44 vertically. We hereafter refer to the levels of noise in multiples of the Ubisense noise. Since wearing the full complement of 12 tags may be annoy-ing to the user, we investigated ways to reduce the number of tags. We started with all 12 tags and then removed them in the order that achieved the best performance. In addition, the interplay between tag placement and noise level was studied. The
499

experimental results were obtained by leave-one-person-out method, which means that the recordings of all the per-sons but one were used for training and the recordings of the remaining person for testing. ResultsAccording to Figure 1 the classification accuracy of 95 % is just out of reach at Ubisense noise, and to exceed 90 %, at least 6 tags are needed. In the upper left corner of the graph there is an area with an extremely high accuracy. It requires more tags and low noise.
Figure 1. Impact of tag number and noise level on the accuracy. DiscussionWe presented the system for automatic recognition of health problems of elderly, manifesting in movement pattern. Al-though automatic detection of health problems is rarely ad-dressed, our results are quite promising. We have also studied the impact of tag placement and noise level on the accuracy of detection of health problems. In general more noise and fewer tags resulted in lower accuracy, as expected. References 1. Ribari� S., Rozman J., “Sensors for measurement of tremor type joint movements”, Informacije MIDEM 37(2007)2, Ljubljana, pp. 98-104. 2. Moore ST, et al., Long-term monitoring of gait in Parkinson’s disease, Gait Posture (2006), doi:10.1016/j.gaitpost.2006.09.01
500

Reduction in Push Off Power During Gait in Children with Type I Osteogenesis
Imperfecta
Adam Graf, Joseph Krzak, Sahar Hassani, Ann Flanagan, Angela Caudill, Gerald Harris,
Peter Smith
Shriners Hospitals for Children, Chicago, IL, USA.
Introduction: Children with type I Osteogenesis Imperfecta (OI) generate significantly
reduced ankle push off power during gait [1]. Reduced push off power may be associated
with the following factors:
• Lever Arm Dysfunction (LAD)– Malalignment of the bony anatomy in the lower
extremities altering the moment arm of the triceps surae [2].
• Flat Foot Deformity (FFD) – A collapse of the medial arch limits the progression
of the center of pressure into the forefoot.
• Weakness – Triceps surae unable to generate adequate force for propulsion during
gait.
• Conservative Gait Pattern – A gait pattern of reduced velocity and stride length
with increased double support and stability.
This study aims to identify the contributions to reduced ankle push off power in children
with type I OI by testing the factors listed above.
Methods: This is a prospective study of 22 patients with type I OI (11 F, 11M, mean age
12.6 ± 3.2y) who ambulate independently. LAD and FFD were examined using a
pedobarography system (Novel, Munich, Germany). The location and duration of the
center of pressure progression (COPP) was tracked through each segment of the foot
(hindfoot, midfoot and forefoot) during stance phase [2]. The medial longitudinal arch
angle was also calculated from the maximum pressure picture of the foot. Weakness was
assessed by measuring ankle plantarflexion strength using a Biodex System III (Shirley,
New York). Gait was assessed using a 3-Dimensional Motion Capture system (VICON;
Oxford, UK) with AMTI (Newton, MA) force plates embedded in the walkway. Bone
mineral density tests were performed using a DEXA scan. Pain was measured on the day
of testing using a Faces Pain Scale – Revised. Several parameters were compared to a
Control group of 22 age-group matched controls using a student t-test and also, withing
the OI Group, statistical analysis was performed to check for correlation to peak ankle
power.
Results: A valgus foot deformity of at least one segment was found in 38 of 44 feet in
the OI group with 47% of feet in hindfoot valgus, 35% in midfoot valgus and 13% in
forefoot valgus. The duration of the COPP in the forefoot and midfoot segments was also
significantly less than normal. The arch angle was greater, representing a more depressed
arch, for the OI group (136°) versus normal (110°). Plantarflexion strength in the OI
group was significantly less compared to controls (74.0 N-m/kg and 101.7 N-m/kg
respectively). Gait analysis revealed a significant reduction in walking speed, cadence,
stride length, an increase in double support and a delay in foot off compared to normals.
There was also a reduction in peak ankle plantarflexion motion during third rocker with
501

the peak occurring later in the gait cycle. Foot progression angle was within normal
limits. The highest correlations between the various parameters and push off power were
in the percentage of the gait cycle (%GC) the COP was located in the forefoot segment
and the walking speed (Table 1). Using a test of independence, a chi-squared value was
calculated to compare incidence of a valgus COPP with reduced push of power. No
identifiable association was observed between incidence of valgus COPP in the foot and
push off power (Table 2).
Conclusion: The reduction in ankle push off power appears to be associated with a
conservative gait pattern. The absence of any correlation between severity of valgus
deformity, subarch angle and foot progression angle to reduced push off power may mean
that LAD and FFD are not contributing factors. Although the plantarflexor strength is
significantly less than age-matched normals the OI group has more than adequate
strength for generating the moment necessary for push off during normal gait (~1.5 N-
m/kg). There is also a lack of correlation between plantarflexor strength and ankle push
off power; therefore muscle weakness is not likely the cause. The evidence for a
conservative gait pattern is found in a reduced walking speed, cadence and step length
along with an increase in double support and delayed foot off. There is also a significant
reduction in the amount of time the COP is located in the distal segment of the foot
during stance.
Significance: The OI group is physically capable of a normal gait pattern but many
subjects with type I OI choose to use a conservative walking pattern for ambulation,
perhaps in an attempt to reduce the high forces that could cause pain and fracture.
Table 1: Correlation of Parameters to Peak Ankle
Push Off Power
Parameter R-Squared
Value
Walking Speed 0.76
%GC COP within Forefoot Segment 0.75
Plantarflexor Strength 0.31
Foot Progression Angle 0.27
Subarch Angle 0.12
Z-Score (Bone Mineral Density) 0.014
Table 2: Association of Valgus to Peak
Ankle Push Off Power
Parameter Chi-Squared
Value (P-Value)
Hindfoot Valgus 0.07 (0.79)
Midfoot Valgus 0.96 (0.33)
Forefoot Valgus 0.40 (0.53)
References:
1. Graf, A., Hassani, S., Krzak, J., Caudill, A., Flanagan, A., Bajorunaite, R.,
Harris, G., Smith, P., Gait Characteristics and Functional Assessment of
Children with Type I Osteogenesis Imperfecta. J Orthop Res, 2009. 27: p.
1182-1190.
2. Jameson, E.G., et al., Dynamic pedobarography for children: use of the center
of pressure progression. J Pediatr Orthop, 2008. 28(2): p. 254-8.
502

A METHOD FOR GAIT ANALYSIS USING INERTIAL SENSORS
Schipper L.1, Roetenberg D.
1, Garofalo P.
2, Cutti A.G.
3, Luinge H.J.
1
1 Xsens Technologies B.V., Enschede, The Netherlands,
2 DEIS, Department of Electronics, Computer Science and Systems, University of Bologna (BO), Italy
3 I.N.A.I.L. Prostheses Centre, Vigorso di Budrio (BO), Italy
Introduction Inertial sensors have been proposed and successfully applied for ambulatory gait analysis.
Although inclination can be measured with high accuracy using gyroscopes and accelerometers,
heading tracking can be challenging for some applications. A common way to estimate absolute
heading is by adding complementary sensors, usually magnetometers. Locations in which gait
analysis is performed do not always have a homogenous magnetic field which in turn leads to
incorrect heading estimates [1]. However, because only the relative orientation between two
segments is required to compute the joint angle, there is no need for an absolute heading
reference. This abstract presents a novel method for stable and accurate tracking of 3D joint
angles that does not reference to the local magnetic field.
Clinical_Significance Gait analysis using miniature inertial sensors can accurately be measured using the so-called
Kinematic Coupling (KiC) algorithm. It does not use magnetometers or the local magnetic field
to stabilize heading. Therefore, this method is suitable to determine the gait pattern for many
consecutive strides in any daily live environment without the need for a fixed infra-structure.
Methods
The KiC algorithm estimates the orientation of three adjacent segments with the joints modeled
as ball-and-socket joints containing some laxity. The gyroscopes are used to predict the change
in angle of each segment. The gravity vector measured with the accelerometers is used for
inclination estimation of each segment. With known distances between sensors and joints, the
relative heading is estimated by assuming that the sensors attached to the segments measure the
same joint acceleration when the joint is subject to acceleration.
The lower limb kinematics of the unimpaired limb of a transfemoral amputee during walking
were measured with Xsens sensors and with an optical system Vicon (trial 1). For details about
the setup and how the two kinematics were compared, see [2]. With this set-up, the soft tissue
artefacts are equal for both systems. A second trial was recorded with Xsens sensors only, while
the subject was walking in a straight line for more than 20 successive strides. The Cast protocol
[2] was applied as calibration method to align sensors to segments.
Results
The knee and ankle joint angles for trial 1 and 2 are shown in Figure 1 and 2. The mean RMS
difference between KiC and the optical system over all joint angles for 10 strides is 2.0 degrees.
The 20 successive strides show a high repeatability and no drift.
503

Discussion From Figure 1, it can be concluded that the KiC algorithm is an accurate method for ambulatory
gait analysis. Based on the used measurement set-up, the observed differences are in the order of
the accuracy of the optical system. Furthermore, the computed joint angles show high
repeatability as can be seen in Figure 2. The stride-to-stride variation can be explained by the
natural variation within a normal gait pattern.
Figure 1: 3D knee and ankle joint angles for one typical stride during walking, in black the KiC algorithm and in gray the optical
system. The mean RMS difference between KiC and the optical system over all joint angles for 10 strides is 2.0 degrees which is
in the order of the accuracy of the optical system.
Figure 2: 3D knee and ankle joint angles for 20 consecutive strides during walking using KiC show stable and consistent tracking
of joint angles. Variations over steps can be explained by small stride-to-stride variation and do not contain outliers.
References
[1] de Vries WHK, et al., Gait & Posture (2009), 29(4): 535- 54.
[2] Ferrari A., et al., Medical & Biological Engineering & Computing (2009), Nov 13.
20 60 100-105
50
70
KN
EE
F(+)E(-) (deg)
20 60 100-10
0
15
25 Ab(+)Ad(-) (deg)
20 60 100-25
-15
-5
5 I(+)E(-) (deg)
20 60 100-40
-20
0
15
Stride (%)
AN
KL
E
20 60 100-20-15
-5
5
Stride (%)
20 60 1005
10
20
35
Stride (%)
20 60 100-105
50
70
KN
EE
F(+)E(-) (deg)
20 60 100-10
0
15
25 Ab(+)Ad(-) (deg)
20 60 100-25
-15
-5
5 I(+)E(-) (deg)
20 60 100-40
-20
0
15
Stride (%)
AN
KL
E
20 60 100-20-15
-5
5
Stride (%)
20 60 1005
10
20
35
Stride (%)
504

Can the reliability of gait kinematics be improved by using functionally determined joint centers? Chandra H. Lloyd, Michael B. Pohl, Reed Ferber University of Calgary, Calgary, AB, Canada Historically, three dimensional (3D) motion capture techniques require the skilled palpation of anatomical landmarks to create meaningful, and repeatable, anatomical coordinate systems. Recently, researchers have begun using functional methods to calculate joint centers [1]. Functional joint center determination could be valuable in reducing error associated with manual palpation of anatomical landmarks, making them useful in repeated measures studies. However, the reliability of these functional techniques has not been reported when used to calculate all three lower extremity joint centers. Moreover, reliability data from gait studies are often reported as indices such as intraclass correlation coefficients, making it difficult to decide whether the techniques are sufficient to detect clinical changes [4]. There is a lack of studies comparing the reliability of gait analysis techniques in terms of absolute errors (e.g. degrees) that are directly related to the kinematic variable. Therefore, the purpose was to compare between-day reliability for a manual palpation model (MAN) and a functional model (FUN), using traditional reliability indices as well as absolute measures. We expected that FUN would demonstrate improved between-day reliability compared to MAN. CLINICAL SIGNIFICANCE: Reliable gait analysis techniques are required for clinical repeated measures investigations. Should functional joint methods improve the between-day reliability of gait analyses, they would increase the odds of detecting clinical changes in gait over time. METHODS: Ten healthy subjects (7F, 3M, 27±7 years of age) visited the laboratory twice, an average of five days apart. The same tester performed both data collections. Retro-reflective markers were attached to anatomical locations on the right leg and pelvis, and rigid shells with four markers were secured to each segment to use as tracking markers. Specific functional movements were performed with the ankle, knee, and hip joints to determine functional joint centers, after which walking data was captured while walking on a treadmill at 1.1 m/s. Five strides were collected for each subject.
Two custom models were created using Visual 3D software (C-motion Inc, Germantown, MD, USA). The MAN model was based entirely on manually placed skin markers. The hip joint center was predicted based on the inter-ASIS breadth using the methods described by Bell [2]. The knee joint and ankle joint centers were defined as the midpoint between the medial and lateral markers placed at each joint.
The FUN model used methods based on Schwartz and Rozumalski [1]. Briefly, the calculation used rotations between two rigid segments to calculate an instantaneous axis of rotation (AoR) between each pair of time points. The intersection point of these AoRs gives an approximate center of rotation (CoR), which is called the joint center. Both MAN and FUN models used the proximal joint center as the proximal end of the segment, and the distal joint center for the distal end.
Three waveform characteristics of the three joints (ankle, A; knee, K; hip, H) for each planar motion (sagittal, x; frontal, y; transverse, z) were compared between days for
505

each model separately, to determine between-day reliability. The shape of the waveforms was compared using a coefficient of multiple correlation (CMC) with the average daily value subtracted from each curve [3]. The absolute offset of curves was determined by calculating the root mean square (RMS) between days, giving us the average offset in degrees. Finally, the difference in amplitude between waveforms (range of motion, ROM) was calculated by subtracting the minimum from the maximum value in each curve, then finding the absolute difference in degrees between the two collections. RESULTS: Both models produced very good CMC values (MAN: r=0.95-1.00, FUN: r=0.94-1.0), with the lowest CMC values found in Kz for MAN and Ky for FUN. Waveform offsets were similar between the two models (MAN: RMS=1.4-4.2deg, FUN: RMS=1.4-5.0deg). The largest offsets were found in Hz and Kz, with large offsets also apparent in Hx. For ROM amplitude, both models performed equally well, with moderate differences between days (ROM: MAN=1.1-2.2deg, FUN=1.1-3.0deg). The largest differences in ROM were seen in Ky. DISCUSSION: The reliability of the functional model was comparable to that of the more traditional manual palpation model, in terms of waveform patterns as well as absolute differences. Therefore, functional joint calculations can be successfully used in all three joints of the lower extremity simultaneously. Our CMC values are higher in both models than has been previously reported in the literature [3, 4]; however, our subjects walked on a treadmill rather than overground. Treadmill walking has the potential to improve reliability because the patient is walking at a constant speed and will not alter their gait to target a forceplate.
It was surprising that the FUN model was not more reliable than MAN. It is worthy to note that the tester was highly experienced in terms of placing anatomical markers on patients. It is possible that FUN techniques rely less on the skill of the tester, but this requires further investigation. Additionally, although FUN removes the error due to marker placement, the functional joint center calculations are highly dependent on the ability of the patient to perform the movement correctly. As a result, caution must be used when employing these methods with clinical populations. While both MAN and FUN models performed similarly, the functional approach has the potential to significantly reduce patient preparation time by reducing the number of anatomical markers needed. REFERENCES: 1. Schwartz & Rozumalski, Journal of Biomechanics 38, 107-116, 2005 2. Bell et al., Human Movement Science 8, 3-16, 1989 3. Growney et al., Gait and Posture 6, 147-162, 1997 4. Besier et al., Journal of Biomechanics 36, 1159-1168, 2003 ACKNOWLEDGEMENTS: The Alberta Heritage Foundation for Medical Research provided the funding necessary for this study.
506

KINEMATIC PERFORMANCE OF A 6DOF HAND MODEL FOR USE IN OCCUPATIONAL BIOMECHANICS
Buczek F.L., Sinsel E.W., Gloekler D.S., Wimer B.M., Warren C., Wu J.Z. National Institute for Occupational Safety & Health (NIOSH), Morgantown WV, USA
INTRODUCTION Carpal-tunnel-syndrome (CTS) and hand-arm-vibration-syndrome (HAVS) adversely affect many workers who use powered hand tools [1,2], where injury severity is related to gripping mechanics. The need exists to develop models of the hand that provide comprehensive biomechanics during a variety of occupational tasks. The metacarpophalangeal joint (MCP) allows flexion/extension and abduction/adduction, while the proximal and distal interpha-langeal joints (PIP, DIP) allow only flexion/extension [3]; accessory motions include rotations and translations other than these primary rotations. Previous optical motion capture studies used a single tracking marker on the dorsal aspect of the finger joints, allowing calculation of one and two degree-of-freedom (DOF) angles; additional algorithms were needed to estimate joint centers and the volar surface of the fingers [4,5]. To overcome these limitations, we propose a 6DOF method to obtain unconstrained kinematics of finger segments, modeled as frusta of right circular cones. To evaluate kinematic performance, we hypothesize that accessory motions at the MCP, PIP, and DIP joints will be small (less than 5 deg rotations, less than 2 mm translations) if segment anatomical reference frames are aligned correctly.
CLINICAL SIGNIFICANCE Kinematics obtained from the proposed model can quantify exposures to repetitive stress in a variety of workplace tasks (e.g., typing, small parts assembly, powered hand tool operation). Coupled with pressure data mapped to volar finger surfaces during gripping activities (beyond the scope of this abstract), a first approximation of joint kinetics and tissue loads will be possible [6], increasing our understanding of the aetiology and mitigation of CTS and HAVS.
METHODS Twenty adults were enrolled in the study. Following informed consent, anthropometric measurements were taken, and motion capture markers were applied (Figure). A static calibration was obtained with the hand in a fully extended posture. Dynamic trials involved lightly gripping a cylindrical handle (30mm diameter), that prompted 40 – 80 deg of flexion at the MCP, PIP, and DIP joints. Marker trajectories were obtained at 100 Hz using a 14-camera Vicon Nexus system; 6DOF joint kinematics were obtained using Visual3D (C-Motion, Inc.), and averaged across subjects at the midpoint of a nearly static, five second, gripping action.
RESULTS With only a few exceptions, accessory motions were small across all joints (Table). The MCP joint permitted greater internal/external rotation than expected at F2 and F3 (Calibration), and at F3, F4, F5 (Natural Grip). The PIP joint permitted greater than 5 deg of external rotation only at F2 and F3 (Calibration and Natural Grip). The DIP joint permitted greater than 5 deg of abduction only for F5 (Calibration and Natural Grip). Superior translations were greater than 2 mm only for F2 PIP, F3 PIP, and F3 DIP (Natural Grip).
DISCUSSION AND CONCLUSIONS Overall, the model performed very well. Spurious internal/external rotations calculated at all joints may be related to missed axes of rotation, as calibration markers applied to the dorsal
507

and volar aspects of the joint lines were used to predict these axes. Unexpectedly large external rotations calculated at the MCP joints (greater than 10 deg) likely reflect the non-rigid behavior of the more proximal hand segment (i.e., the aggregate of metacarpals) during the gripping action. PIP and DIP translations between 2 and 3 mm are likely due to a combination of missed axes of rotation during calibration, and skin movement during the gripping action. Because the vast majority of accessory motions (74 of 88) were small by our definition, we conclude that this 6DOF approach appropriately models joints of the fingers. We will next develop the mapping of pressure data to volar surfaces of the modeled fingers.
REFERENCES
(a) (b)
Figure. Marker Configuration. (a) Calibration markers (4mm) are applied to the dorsal and volar joint lines to calculate joint centers; three additional markers track each finger and hand segment. (b) Frusta of right circular cones approximate the volar surface of the fingers.
1. Marras et al. (2009) Appl Ergon40(1), 15-22.
2. NIOSH Publication No. 97-141. Musculoskeletal Disorders and Workplace Factors.
3. Netter (1991) The CIBA Collection of Medical Illustrations, Vol.8,Part 1, p. 73.
4. Zhang et al. (2003) J Biomechanics36, 1097-1102.
5. Lee et al. (2005) J Biomechanics 38, 1591-7.
6. Wu et al. (2007) Med Eng Phys29(6), 718-27.
Table. Rotational and Translational Degrees of Freedom (labels indicate positive sense for each DOF)
F2 MCP -7.8 (7.0) -10.2 (7.4) 8.3 (4.7) 49.8 (10.7) 7.1 (4.9) 3.9 (7.0)PIP 3.3 (8.4) 4.8 (3.0) -5.1 (3.3) 76.4 (4.6) 1.7 (3.1) -6.8 (4.2)DIP -4.3 (7.4) 2.8 (3.5) 0.5 (0.7) 38.1 (10.3) 1.5 (4.7) 2.9 (3.2)
F3 MCP -7.5 (7.2) -2.9 (4.8) 7.9 (4.5) 67.3 (8.9) 4.5 (4.0) -11.8 (5.9)PIP 1.8 (10.5) 2.7 (2.1) -5.3 (4.0) 69.7 (5.4) 3.6 (4.4) -6.9 (4.0)DIP -5.1 (7.6) 2.8 (3.3) 0.0 (0.9) 47.7 (8.5) 0.4 (3.5) 2.3 (2.6)
F4 MCP -11.5 (8.6) 6.3 (5.2) 5.0 (4.0) 70.9 (9.8) 4.9 (4.4) -15.2 (6.4)PIP 4.7 (10.3) -2.0 (3.4) -1.0 (3.4) 66.5 (6.0) -0.7 (5.7) -0.5 (3.2)DIP -3.9 (5.5) -2.0 (2.5) 0.1 (0.7) 44.1 (9.4) -1.0 (3.3) 2.7 (3.0)
F5 MCP -17.8 (12.8) 19.4 (9.2) 0.5 (7.8) 68.7 (11.6) 4.3 (6.6) -20.9 (9.4)PIP 10.3 (10.0) -3.5 (4.0) -3.0 (4.9) 50.0 (7.4) -2.0 (6.2) -2.1 (5.7)DIP -2.2 (6.0) -5.7 (3.0) -1.1 (1.6) 40.4 (9.0) -5.4 (3.3) 1.2 (2.9)
F2 PIP 0.00 (0.10) 0.07 (0.17) -0.04 (0.13) -0.21 (0.85) 1.08 (1.36) 2.75 (1.19)DIP 0.00 (0.08) 0.02 (0.13) 0.04 (0.13) -0.26 (0.46) -1.26 (0.90) 1.97 (0.63)
F3 PIP -0.03 (0.10) 0.01 (0.11) 0.02 (0.09) -1.62 (0.79) 1.36 (1.17) 3.04 (1.13)DIP 0.02 (0.14) 0.02 (0.09) 0.02 (0.07) -0.72 (0.46) -0.89 (1.12) 2.01 (0.79)
F4 PIP 0.06 (0.27) 0.08 (0.20) -0.01 (0.08) -0.75 (0.92) 1.63 (1.13) 1.49 (0.83)DIP -0.03 (0.10) 0.05 (0.10) 0.03 (0.09) -0.33 (0.48) -0.44 (1.10) 1.76 (0.76)
F5 PIP 0.09 (0.44) 0.06 (0.20) -0.04 (0.25) -0.52 (0.92) 0.55 (0.80) -0.09 (1.06)DIP -0.03 (0.18) 0.09 (0.16) 0.04 (0.16) -0.42 (0.40) -0.93 (0.60) 1.36 (0.69)
Data are means and (standard deviations) for twenty adult subjects, with the fingers fully extended (Calibration), and lightlygripping a cylindrical handle (Natural Grip). F2-F5 refer to index, middle, ring, little fingers. MCP = metacarpophalangeal joint.PIP/DIP = proximal/distal interphalangeal joints. No translational data are available for the MCP joints because of modelingaspects of the more proximal hand segment. By definition, translations should be be zero for the Calibration trials.
Internal Rtn (deg)
Lateral (mm) Anterior (mm) Superior (mm) Lateral (mm) Anterior (mm) Superior (mm)
Calibration Natural GripFlexion (deg) Adduction (deg) Internal Rtn (deg) Flexion (deg) Adduction (deg)
508

DEVELOPMENT OF A KINEMATIC TRUNK MODEL FOR ROUTINE CLINICAL USEBates J. MSc1, Stebbins J. DPhil1, Theologis T. FRCS1
1 Oxford Gait Laboratory, Nuffield Orthopaedic Centre, Oxford, UK
INTRODUCTIONA number of kinematic trunk models have been proposed over recent years, but there is no consensus as to the most appropriate model for routine clinical use. We have found someproblems with currently available models, especially with marker placement on females.Specifically, the marker on the xiphoid process can cause embarrassment and the 10th thoracic vertebra marker is often at the level of the bra strap, which can cause problems with tracking.Moreover, existing models have not established their practicality in offering meaningful clinical information for routine use.
The aim of this study was to test trunk model variations, and define a model which met thefollowing criteria: 1. a single segment model which represents thoracic trunk motion, 2. doesnot require marker placement which causes embarrassment to female subjects, 3. minimisesinter-subject variation, 4. uses markers which best conform to rigid body assumptions.
The possible anatomical landmarks on the trunk are the spinous processes of the vertebrae,the sternum, clavicles, acromion processes and scapulae. Markers on the shoulders and 7th
cervical vertebra have been shown to move more relative to the other markers and to allow shoulder or neck movement to affect the measured trunk movement (1,2,3). It was therefore thought appropriate to use a combination of markers on the sternum and thoracic vertebrae.
Baker (3) described a model with markers on the 2nd and 10th thoracic vertebrae and the manubrium. Since the 10th thoracic vertebra can cause problems, we decided to investigate whether using markers on the 6th or 12th thoracic vertebrae would give comparable results.
CLINICAL SIGNIFICANCEMotion of the trunk can have a significant effect on gait, particularly in the presence of pathology. Modelling the trunk allows better understanding of kinematic and kineticabnormalities in the lower limbs. Compensatory movements of the trunk can be adequately recorded and understood. Proximal weakness or deformity can be monitored and its influence on gait patterns better analysed. A practical model which allows reliable data collection without embarrassment to subjects (particularly females) would facilitate routine data collection and could be used in conjunction with lower limb gait analysis.
METHODSData were collected during level walking using a 12 camera Vicon MX system. 4 healthy adults (3 female, 1 male, aged 22-33 years) walked with markers on the following landmarks:7th cervical (C7), 2nd, 6th, 10th and 12th thoracic vertebrae (T2, T6, T10, T12), manubrium(CLAV) and xiphoid process (STRN). The output of 5 different models using these markers were compared (Table 1). The results informed more extensive data collection on children.Level walking data at self-selected speed were then collected on 22 healthy children (14 female, 8 male, mean age 11 years (range 5 – 16 years)). Three different models (2, 4 and 5 from Table 1) were compared, using a single, representative walking trial for each subject.
509

Model 1 Plug- in-Gait(Vicon, Oxford)
2Baker (3)
3T12 model
4T6 model
5T6 + offset model
Markers C7, T10, CLAV, STRN
T2, T10, CLAV
T2, T12, CLAV
T2, T6, CLAV
T2, T6, CLAVT12 (static only)
Table 1: Trunk models used and their markers. Apart from the Plug- in-Gait model, all models used T2 as the origin and had their primary axis from the more distal vertebra marker to T2.
RESULTSInitial data collection on adults, and verified by that on older children, showed that T10 andT12 could both be difficult to place on females and track dynamically, depending on the individual and type of bra worn. It would therefore be preferable not to use these landmarks.
In the preliminary (adult) data, the mean forward tilt varied between models, with the T6 model having the greatest tilt (18.5° compared with 3.6 to 12.2° for other models), due to the marker being positioned on the apex of the thoracic kyphosis. There was also increased inter-subject variability, presumably due to different amounts of kyphosis between subjects (mean standard deviation (SD) of mean of all subjects throughout the gait cycle of 6.2° compared with 3.3 to 4.3° for other models). Also, it was thought that the axis was not therefore aligned with the true overall axis of the spine, which would introduce some cross-planar effects.
In order to reduce this variability, while maintaining the ease and practicality of the T6 marker set, a sagittal plane offset was calculated in the static trial using the T12 marker. This offset was then applied in the dynamic trials (in which the T12 marker was not required).This reduced the average tilt to 8.5° and the SD of the average of all subjects to 4.2°, so they are comparable with the other models.
In both the adult and children’s data, the coronal and transverse plane data were very similar.The children’s data had the same trends as the adults’ data, although the differences between models were not as great. The T6 model had increased variability of trunk tilt (mean SD of average 5.5° compared with 4.9° (Baker model) and 5.1° (T6 with offset model). The mean tilt was 13.3° with the T6 model compared to 7.8° (Baker) and 5.9° (offset).
DISCUSSIONA trunk model using markers on the 2nd and 6th thoracic vertebrae and the manubrium of the sternum, along with a marker on the 12th thoracic vertebra used only in the static trial, gave results with comparable variability and pattern to the more established models (Plug-in-Gaitand Baker’s). From a clinical perspective, the advantage of this model is that female subjects may wear a strappy vest top during data collection, with just the back rolled up to T12 level for the static trial. This improves subjects’ comfort and therefore allows routine analysis of trunk motion during gait. The model offers meaningful information that can be used in the clinical setting.
REFERENCES1. Nguyen TC & Baker R. 2004. Clinical Biomechanics 19, p1060-10652. Armand S, Sangeua M, Hoffmeyer P, Baker R. 2009. Gait & Posture 30 (S2), pS543. Baker R. 2006. from Seminar at JEGM meeting, Amsterdam.
510

Methodology for Simulating Upper ExtremityFunctional Activities using Haptic Interfaces
Nalini Vishnoi, Cody Narber, Naomi Lynn Gerber, Zoran DuricGeorge Mason University, Fairfax, VA
{nvishnoi, cnarber, ngerber1, zduric}@gmu.edu
IntroductionHaptic devices have been used extensively in video games and robotics research.
These devices provide a proprioceptive input in the form of force feedback through whicha person can perceive movement and location of a limb in 3D space. Substantial workhas been done to improve hand functions by training using haptics. The major limitationof these approaches is that the trajectory is devised from a set of primitive movementcomponents or someone else’s movement, recorded earlier on the haptic. We present anovel approach of haptic training using the ‘free form’ movement of a person withoutdisability, recorded by a motion tracker and then translating it to the haptic workspace.
Clinical SignificanceOur technique allows the clinicians to teach the patients with upper extremity dys-
fuction, the trainer’s trajectory, as gathered from unencumbered data. This method willthen allow the training process to feel as natural as possible to the user.
MethodsWe have used and electromagnetic sensing system,the MotionStar Wireless®2, also
called Flock of Birds (FoB), for recording 3D gross motor functional activities, to de-termine positional data, from which we generate force trajectory. These trajectories aretranslated to the coordinate system of the haptic device, a Phantom® Premium 3.0/6DoF.These translations create the force trajectories designed to move the upper extremity.
We have recorded motion from subjects using the FoB, performing three functionalgross motor activities: feeding, brushing hair and raising the hand above the shoulder.All the activities are translated to the Premium’s workspace.
The FoB system captures the position and orientation of the sensor, placed over theend- effector, with respect to the FoB transmitter. The plots of the trajectories comparingunencumbered movement to haptic generated movement are shown in the first columnof the figure, and they clearly demonstrate the difference in performance on two devices.The subjects are required to learn the trainer’s trajectory, as gathered from unencumbereddata. For accomplishing this task, we have translated the movement from FoB workspaceto haptics workspace. Since it is not possible to use the FoB and Phantom®Premiumsimultaneously, we have collected data from two instruments separately and then trans-formed the data into an intermediate Cartesian frame attached to the subjects body. Letus call this intermediate frame attached to the body a moving frame. In our notation,frames fixed to the FoB and/or haptics are static. When an activity is repeated, theend effector/hand moves in the same manner with respect to the body. Given a point Pmeasured in the FoB frame, its coordinates p measured in the haptic frame are given asp = Rh × (RT
f P − df ) + dh, where df and dh are the displacement vectors associatedwith the intermediate frame in the FoB and the haptic coordinate systems, respectively.Rh and Rf are the rotation matrices defining the transformation of the coordinates fromthe intermediate frame to the coordinate system of the haptic and FoB.
To remove noise from FOB data we used three approaches: low pass filtering, cubicspline and polynomial fitting to smooth the median filtered data. A comparison of the first
511

order derivative using three smoothing techniques is as shown in the middle column of thefigure. Polynomial curve fitting outperforms the rest. We used linear least square fittingto approximate strokes (x(t) y(t) z(t))T by polynomials. We implemented an automaticcomputation of the order of the polynomial for given data points. We used the methoddescribed in [4] to find the order of the polynomial that minimizes the prediction risk.Once the best fit order of the polynomial is estimated, the best fit curve is computed forthe given trajectory.
Once the data points are converted to haptic space, a proportional derivative con-troller is used to guide the user’s hand through the motion. The error term is given bythe distance between the haptic’s current position and the target point on the measuredtrajectory. The target point is updated when the error term becomes less than a setthreshold. Users reported this scheme to feel natural and fluid.
ResultsThe third column of the figure shows the translation of free form data from the FoB
to the haptic. The task performed here is the simulation of an eating activity. It hasbeen separated into two strokes as shown in the figure. The first stroke represents themovement of taking the end-effector close to the mouth and the second stroke representsthe backward movement, coming to the start position again. The order of the polynomialsfitted in x, y and z dimensions for the first stroke are [5 6 4] and those for the secondstroke are [6 5 6].
� �� ��� ��� ��� ��������
�����
����
�����
�����
�
����
����
���
�
�
��� �������������
������� ����
��������������
50
100
150
200
250
300
350
400
150
200
250
1st
2nd
ConclusionsWe have successfully translated upper extremity functional movements to the haptic
from free form movement using the FoB as a 3D motion capture device. These data were‘rough’ and described a noisy trajectory, which converted to haptic movements that wereexperienced as ‘jerky’ with obvious transition points. We designed a unique approach tosmooth the data using polynomial curve fitting. Polynomial fitting smoothes the datato a point at which even the second order derivatives are regular. After the process ofsmoothing and interpolation, the haptics were able to guide a subject’s hand throughthe desired trajectory. Our methodology simulated movement in a fashion that wasexperienced as ‘natural’ by the subjects.
References
1. David A. Winter Biomechanics and Motor Control of Human Movement. 2004.2. Y. Kim et al. (2009) In IEEE 3D User Interfaces, 145-146.3. Xing-Dong Yang et al. (2008) In Symposium on Haptic Interfaces for Virtual Environment
and Teleoperator Systems, 129-135.4. V. Cherkassky (2002) In Natural Computing: An International Journal, Kluwer, 109-133.
512

Markerless Identification of Dissimilarities in Gait Sequences
Wallace Lawson, Nalini Vishnoi, Naomi Lynn Gerber, Zoran DuricGeorge Mason University, Fairfax, VA
{nvishnoi, wlawson, ngerber1, zduric}@gmu.edu
IntroductionGait Analysis has been an area of active research for biomechanics. Standard ap-
proaches to gait recording and analysis use carefully calibrated laboratory setups of infra-red cameras with reflective markers placed on anatomical landmarks. Dedicated labora-tories need to be set up for these kind of studies and recording data becomes a tedioustask. As a consequence, obtaining reliable gait data outside a dedicated laboratory is verydifficult.
Gait analysis using computer vision techniques have primarily focused on recoveringinformation on a few determinants (such as hip and knee motion in the sagittal plane)[2]. One of the primary reasons for this is due to variability of appearance and lighting innatural environments, which makes recovering all determinants challenging. We proposea novel method of comparing gait sequences which automatically aligns sequences andshows area where the gait is similar and where the gait is different.
Clinical SignificanceThe analysis done using computer vision methods allows markerless and unencum-
bered video capture of human locomotion. It is useful in comparing gait to a baseline,showing change of gait over a period of time to evaluate a course of treatment. This canalso be used to perform clinical assessment over the internet, potentially of use for agingpopulation and people with disabilities.
Methods
We decompose the body into small patches and determine the motion using the mo-tion orthogonal to edges [5], or the Normal Flow. The motion is modeled using threeparameters, specifying the principal direction of motion, translation in the principal di-rection, and rotation around an axis orthogonal to the patch. Valid ranges for theseparameters are established empirically, although these could theoretically be adaptedfrom kinematics [3].
The best matching model for each patch is found by comparing the observed motionto the predetermined valid motion models. To compare observed motion with a modelinformation is generated using the model as a guide. The residual error (the observedmotion that cannot be explained by a given model) gives information regarding the qualityof the fit. A model that is very likely will produce low residuals, whereas a model that isnot very likely will produce high residuals.
Features describing motion are obtained using Independent Components Analysis [1]of translational motion. The architecture selected for this application decomposes themotion into (typically small) regions that are moving in a highly correlated manner. ICcoefficients are a compact description of observed motion. Comparing IC coefficientsprovides an assessment of similarity of both shape and the motion.
This similarity measure is used to align sequences by selecting frames where thesubject is in the same stance. To provide introspection into why the gait is the same ordifferent, we perform an additional evaluation on each patch. The degree of dissimilarityprovided by each patch is evaluated by removing each patch in turn from considerationand examining the difference in similarity score. If a similarity score decreases when apatch is removed from consideration, it was one of the reasons the sequences were similar.
513

If the similarity score increases when a patch is removed from consideration, it was oneof the reason the sequences were different.
Results
We evaluate our approach using subjects from the University of Southampton (SO-TON) gait database [4]. The database is composed of approximately 112 healthy adultsfilmed while walking on a treadmill oriented perpendicular to the camera, permitting aclear view of the sagittal plane of motion. Filming was performed at 24 frames per second,in a laboratory with controlled lighting and background.
We have successfully applied this approach to align the gait cycles of many of subjectsin the database. Aligned subjects that have high similarity have striking similarities.Many of which have similar footwear and pose in addition to gait style. One exampleis shown in the figure below. The top two rows of figure shows one individual filmed atdifferent times, wearing different clothes. As would be expected, there is a high overallsimilarity between these sequences. The bottom row shows the difference over time. Whatcannot be clearly seen with the eye becomes quite apparent. First, the subjects head is ina slightly different position, and the trailing leg (right leg) is moving forward at a fasterspeed in the later sequence.
ConclusionsWe have demonstrated the use of our approach to compare and align two gait se-
quences. It is important to note that we are still limited only to the sagittal plane ofmotion, although it is feasible that this technique would generalize to other planes ofmotion as well. This makes the approach potentially useful in a number of applications,from biometrics to athletic performance analysis to clinical applications.
References
[1] A. Hyvarinen. A fast and robust fixed-point algorithm for independent component analysis.IEEE Transactions on Neural Networks, 3:626–634, 1999.
[2] M. Nixon and J. Carter. Automatic recognition by gait. Proceedings of the IEEE,94(11):2013–2024, 2006.
[3] J. Perry. Gait Analysis: Normal and Pathological Function. SLACK Incorporated, 1992.
514

[4] J. Shutler, M. Grand, M. Nixon, and J. Carter. On a large sequence-based human gaitdatabase. In Proc. 4th International Conference on Recent Advances in Soft Computing,pages 66–71, 2002.
[5] E. Trucco and A. Verri. Introductory Techniques for 3-D Computer Vision. Prentice Hall,Upper Saddle River, New Jersey, 1998.
515

Markerless 3-D Human Motion Capturing Using a Stereo Camera Nguyen Duc Thang1, Young-Koo Lee1, Yoon-Hyuk Kim2, Tae-Seong Kim3
1Department of Computer Engineering, 2Shool of Advanced Technology, 3Department of Biomedical Engineering, Kyung Hee University, South Korea
1. Introduction In this work, we present a new markerless human motion capture system using a stereo camera. Most traditional motion capture systems use markers and multiple cameras to capture human movement in 3-D. They are commonly used in sports, entertainment, and medicine. However due to their inconvenience and high cost, recently markerless approaches are receiving more attention. Our developed system uses a stereo camera, capable of simultaneously taking two images. From the image pairs, we estimate the displacements of an object and reconstruct 3-D information. With a 3-D human body model defined by a set of ellipsoids, by fitting the model to the 3-D data, we estimate the kinematic parameters of the joint angles of the model. With these estimated parameters from a time-series stereo images, we have captured human body motion in 3-D.
2. Clinical significanceThe motion capture system in clinical medicine is commonly utilized in the treatment of the disease related to patient’s gaits such as Parkison’s disease, cerebellar ataxia, or neuromuscular disorder. It is also used to evaluate the effectiveness of prosthetic limbs and monitor the physical rehabilitation process of athletes in the treatment of sport injuries. In order to be applied to clinical applications, a motion capture system should be flexible to work in free environments and this requirement is hardly satisfied with the conventional approaches which use markers and multiple cameras. Our markerless motion capture system with a single camera is much more convenient, inexpensive, and less restrictive to users, thus providing a better way of capturing human motion for the aforementioned applications.
3. Methods Our developed algorithm is based on a model-based approach. We have created our 3-D human model as a set of connected ellipsoids and parameterized by kinematic joint angles. First of all, the stereo computation algorithm [1] is performed to reconstruct the 3-D information of the human body appeared in stereo image pairs. Then, the angular kinematic angles are adjusted to fit the 3-D model to the 3-D data with two main steps: - Lableling: During the model co-registration to the 3-D data, each point of the 3-D data is
cast into one body part (i.e., ellipsoid) of the 3-D human model. The labeling step estimates the label assignment (i.e., each label corresponds to one body part) of each 3-D point based on the Euclidean distance between the point with the ellipsoid of the model. We also utilize the algorithms to detect the face and torso in images to provide extra information to identify the labels. Moreover, some constraints are established to avoid the incorrect label assignments: the geodesic constraint requires two points with their corresponding label pair (e.g., hand and torso) cannot be too far or too closed; the smoothness constraint drives the label of each point and those of its neighbors toward the same value. The label assignments for a large number of points are efficiently found by the variational method with the mean field approach [2].
- Model fitting: With the label assignment found from the labeling step, the model fitting step
516

attempts to fit each point to its corresponding ellipsoid by minimizing the distance between them using the damped least square estimator.
The co-registration is iterated to minimize the differences between the 3-D model and the observed data. Finally, the algorithm estimates the correct human posture on a frame-by-frame basis.
4. Results We have performed our experiments with stereo data captured by a stereo camera (Bumblebee 2.0 of Point Grey Research). Figure 1 shows the results of reconstructing human body movement from a walking sequence. As shown in Fig. 1 (b), we have successfully captured 3-D human motion of walking reflected on our 3-D body model from the taken images on the stereo camera in Fig. 1 (a).
(a)
(b)
Fig.1 (a) The right images of stereo image pairs and (b) the reconstructed human postures of a walking sequence.
5. Discussion The experimental results with real data have shown that our method is capable of capturing human motion in 3-D from a sequence of stereo images. Due to the flexibility of the stereo camera, our system is suitable for a broad range of clinical applications. In future research, integrating our algorithm with the motion pattern learned from a motion database might be useful to improve the accuracy and speed of our system.
References [1] J. Cech and R.Sara, “Efficient sampling of disparity space for fast and accurate matching”, In IEEE Conf. on Computer Vision and Pattern Recognition, pages 1-8, Minneapolis, MN, US, June 2007. [2] T. Toyoda and O. Hasegawa, “Random field model for integration of local information and global information”, IEEE Transactions on Pattern Analysis and Machine Intelligence, 30(8):1483-1489, 2008.
Acknowledgements This work was supported by the MKE (Ministry of Knowledge Economy), Korea, under the ITRC (Information Technology Research Center) support program supervised by the IITA (Institute of Information Technology Advancement) (IITA 2009-(C1090-0902-0002)).
517

������������ ������ �������������������������������
������������������
������� ������������������� �������!�����������"�������"�����������!��������#�$�����
����������� ����������� �������������������������������� !���������"����#���$% �
���#$�����"�&����'������(�)���$**���$+���$�'�����
����������
����� ����������������������� �� ������� ���� �������%������&�� �����������'���� �� �����
�����������(������%���������������'������������������)*�+������������������,�����%�
$�������������(�����(��������������*������-������� ����������%������������������������
��������������������������������*���,��$�����$����������� ������ ������
������$�������������(��������,���(���
��� ������ ��
����������(�� ������ ������ �����*��������'������ ������������������$�����������
�����������������������(������������������������������,���(����������'������������
�������
-�������%����$�������,���$%�������������������,����$�������������,�������������
��,����$�����
��,������������)�.��������/� �����+���������������������������*������������
'���������������������� ������������������%�����(�������-����������(���������������
�.��%����������������������'�����������$����������$������$������0������������
��,����� � �������%� � ����(���� � � � ��� � ����� � '��� ����� � �&���� � � �1*������
*& ���������������������������������$'���������� ������������������ �����,���������������
��$�%�������������$�������������$���������������'����������������������������(�
�������������������2����)2�����*& �����34+��%�����������������������������������
)���..!5+�����,�������(�������(������������ ��������������������(���������-6�
�����������)�...!5+�$������������� ��������� ��������������������������,���������������
������7�������������������������������(��$�������%���0�8����������������
���(�����������%��%����������������...!5�
4������� � � � ������� � ���� � �������� � ���( � ��� � 2��� � 9���(:� � (��; � ������ � � � ��:
������������&������������� �������0�8���(��������������� �������������������(�
�����(������� ��������$��������(�������,������������&������������������(�����(���
�%��������������������������������� ���������(��:������������� �����;������������ �����
,��$��������*2�� �������������,��$����)� ���2�������<+�
�������
-������(��� ���������������/.�)�"�=�=+�����(������������.�>?�@������������%�
(���������AA�@���������������(������ ��������:�������������������� �������*��
(�����������������-$������
518

���������� ������������������������ ���!"#�$���!� �!��%�#&�'�(!��#��)��**"+ �!��
�!��� ��� �����,�-!�� �.�#/00��(!����*�� ��+���!��� ��� �����-!�� �1�
�!�+!� ��+ �!� � ��*�+�� � (!� � ��*��� � ��* � �� ���� � 2��� ����� � ��* � 3"�*�4 � �5#�����* � ���
0/$��"�/�����������4 �6����078�00�����*����9���*�0:,�007�� �� �����9� (!�� 2���((�+ �*�
)���.�070�007����*����9���*�078�007���� �����9�(!�� 2��"��((�+ �*�)�����2���3"�$���� �
$��"���(!�� 2��+!� �!���6����0�:�00�����*����9���*�0�:�00����� �����9���((�+ �*�)������*�
+!� �!��#/00�.�"��((�+ �*�)������*�+!� �!���#/00�.��((�+ �*���*�"��((�+ �*�)����#/00���
�2� � �� ���� � +!�+!� ��+ �!� � ��*�5 � ��* � 2� � #��) � �**"+ �!� � �!��� � 6��� � �! � +!����� �*�
�;7&00<�4 �62����� � 2���� ���� �+!�+!� ��+ �!� ���*�5���*� 2����*�� ��+���**"+ �!���!��� �
+!����� �*�6�����;7&08:�
����������
� 2!"�2� 2���((�+ �*��"�-�+ ������2�*�!��9��������-!�� �� 4����!����� ���������� �6������������
2��2�#����*�)�����!(��! 2���������6���������� �"�)��! �!�����#�� �+"���4�+!�!����#�������*�
� ��+���!��� ��6���������(�+�� �9����� ��4���*�#��)��!��� ��6������������*��#� �� 2��������
*�((����+� � �� � ��� � �#��* � �� 6��� � 2� � ��!"#� � ��!���� � 2��� ���� � ��* � 3"�*��+�#� � +!�
+!� ��+ �!��!++"������� �����9����#� ��� �6� 2��������-!�� �� �
��+�����*���*�!��� ����� �"�)��!$���� ��������+!�����*�+!�#���� !�9�� �� ��9����)����� �
��*���9���� 2� �+�"�� �!( � 2� ����!���� �2�#���*�+!� ����� ���� �)��� � �!�*��� �(!"�*� �� � 2���
� "*9�47�=�+2���+���(�+ !�����9�#��9���#�� ���� 2��*�$��!#��� �!(��"� �#���-!�� �� :�>"� 2���
��$�� ��� �!���� !� 2���#2��!���!�����6����� �*���*���9����*� !���#�!$���� ����� 2���!���
����!" +!���(!�� 2����#� ��� ��
����� �� � ��
�2��� "*9�6���("�*�*��9������� �(!��?<,00�(�!�� 2��;�����+2���*�@�$��!#��� �*�#�� ��� �
!(� 2���!� 2�A������B'���"� ��2���������!�+!�(��+ ��!(��� ���� � !�*�+����
� � � �� �
�� '2�)!!���4�C�!+)�D 4�'2! �'4������DE��!����*!��F$!�" �!��!(�F�*�' ������ �!�� 2�� ���
!(� 2��G!6���G����������������7007.,8��7�4�#:�H�I:�H�
�� '2�)!!���4�B"�6� J�@F4�C�!+)�D 4�'2! �'4������DE� �9��� ��+������G!�*�������
*$��+�*����� �����B�#��� �!�� 2�� ���������������,H�8��700:�#���8I��8�
�� C������4�'�9*���=�+)����G�E�!5�����K�� � *�# � �!������=�*���������� � ��������
����7<����700��#<H�H:
�� ="�*������� 4�@9��9�� 4� �*���++2���E�'�+!�*��9�K�� ��2���������E� ��� ��A� 2�
=�*�����!�#�� ��� �������� �!�� 2�� ���������������7����700��#7H:�I7H,,
�!� �!��
����
�!� �!��
B�#
((�+ �*�
����
��((�+ �*�
����
�#���� �����
B�#
�!� ���� �����
B�#
E��)�
�**"+ �!��
�!��� �
08,
�008�
0H�
�00<�
0��
�008�
0,<
�008�
0<:
�00��
0<:
�00H�
=�*�� ��+��
�**"+ �!��
�!��� �
0�,
�00:��
0,0
�00,��
0,,
�00H�
0::
�008�
08,
�008�
08�
�00H�
519

The relationship between spine rotation and ball speed in adolescent
baseball pitchers.
Melany Westwell, MS, PT, Sylvia Õunpuu, MSc, Matthew Solomito, BSBE, Carl Nissen, MD Center for Motion Analysis, CT Children’s Medical Center, Farmington, CT, USA
E-mail: [email protected] Web: www.ccmckids.org
Introduction The coiling and uncoiling that occurs through the entire body is generally considered the most important aspect of energy transfer from the legs to the arm during a baseball pitch. Efficient energy transfer is believed to lead to optimal performance in terms of creating ball speed. Spine rotation is a primary component of the coiling pattern. The purpose of this study was to determine the impact of spine rotation on ball velocity during pitching.
Clinical Significance There is an increasing incident rate of injuries in youth pitchers. Injury rates could be reduced and performance could be optimized by identifying those parameters that maximize ball speed while minimizing the forces on upper extremity joints.
Methods The fastball pitching motion of 27 adolescent baseball pitchers was assessed using a VICON 512 system. Data analysis was limited to the arm-cocking phase (lead foot contact (FC) to maximum glenohumeral external rotation (GH-MER)), arm-acceleration phase (GH-MER to ball-release (BR)), and arm-deceleration phase (BR to maximum glenohumeral internal rotation (GH-MIR)). The pitching cycle from FC to GH-MIR was time normalized to 100% (Figure 1).
Transverse plane spine rotation kinematics were analyzed throughout the pitching cycle (Figure 2). Spine rotation was defined as the transverse plane joint angle between the pelvis and thorax segments. The spine rotation angle was negative when the thorax was externally rotated relative to the pelvis, and positive when internally rotated relative to the pelvis (i.e. the spine angle would equal -90° if the thorax was facing third base and the pelvis was facing home plate). Total spine rotation (TOT-SP-ROT) was calculated as the amount of spine rotation at FC minus spine rotation at BR. Peak spine rotation velocity (PK-SP-VEL) and timing (%PC PK VEL) were defined as the magnitude and timing of the maximum rotational velocity between FC and BR. Pearson linear correlation values and goodness of fit analysis (linear regression analysis) were performed to evaluate relationships between dependent variable ball velocity and independent variables: spine rotation at FC (SP-ROT-FC), at MER (SP-ROT-MER), at BR (SP-ROT-BR), TOT-SP-ROT, PK-SP-VEL, PK-SP-VEL and %PC PK VEL. Significance level was set at p<0.01.
Results Subjects averaged 12.5 ± 1.2 years of age (range 8.8 to 14.7) and weighed an average of 50.8 ± 16.1 kg (range 28.5 to 87.1). Ball velocity averaged 23.0 ± 3.3 m/s (range 16.6 – 28.9 m/s or 37.1-64.6 mi/hr). The pitchers consistently demonstrated a pattern of spine uncoiling between FC and MER. The greatest amount of spine rotation was present at FC (SP-ROT-FC = -50 ± 7°,
520

thorax externally rotated relative to pelvis), with progression to a nearly neutral alignment by MER (SP-ROT-MER = 1 ± 6°, thorax and pelvis aligned in transverse plane by MER). From MER to BR the thorax continued to rotate internally relative to the pelvis (SP-ROT-BR = 7± 6°, thorax internally rotated towards first base). The average TOT-SP-ROT demonstrated in this group of adolescent pitchers was 35° ±11° (range of 16° to 58°). The average PK-SP-VEL was 472°/s ± 148.9°/s (range of245 to 782°/s) and occurred at 58 ± 11% of the pitching cycle (%PC PK VEL range 35-90%). TOT-SP-ROT (r = 0.52), SP-ROT-FC (r = 0.50), %PC PK VEL (r = 0.34) and PK-SP-VEL (r = 0.30), were all significantly associated with ball velocity. The combination of TOT-SP-ROT and PK-SP-VEL yielded the greatest predictive power accounting for 32.5% of the variability in ball velocity (p<0.01).
Discussion As spine rotation increased in both magnitude and velocity, ball velocity increased in this group of young pitchers. This data confirms that spine rotation plays a role in generating ball velocity but accounts for only about 1/3 of the variability in this parameter (32.5%).Controlling the motion of spine rotation may be a learned strategy. All of the youth pitchers in this study demonstrated peak spine rotation at foot contact. Aguinaldo et al, reported that professional pitchers demonstrated peak spine rotation at 34% of PC[1].This strategy may lead to greater spine velocity and increased ball velocity.
Figure 1: Pitching Cycle (PC)
Figure 2: Spine Kinematics: Spine Rotation Angle and Spine Rotation Velocity References 1. Aguinaldo, A., J. Buttermore, et al., Effects of upper trunk rotation on shoulder joint torque
among baseball pitchers of various levels. J Appl Biomech 2007. 23(1): p. 42-51
521

The relationship among knee alignment, knee function and strength, and hopping performance with emphasis on patellar tendon length and the degree of knee version after ACL reconstruction Chen WL 1, Chen YT 1, Li CH 1, Yang CY 21 School and Graduate Institute of Physical Therapy, National Cheng-Kung University, Tainan, Taiwan 2 Department of Orthopaedics, National Cheng-Kung University, Tainan, Taiwan
Introduction: Anterior knee pain after ACL reconstruction (ACLR) has been associated with postoperative flexion contracture and quadriceps muscle weakness. [1] Immediate restoration of full hyperextension after ACLR has long been emphasized in the rehabilitation process to avoid anterior knee pain. [2] However, little has been done to provide direct link of patellar tendon length (PTL) or knee version alignment (KV) to knee strength or hopping performance in patients with ACLR. The purpose of this study is to determine the correlation between leg function including hopping performance and knee alignment with special emphasis on the measurement of PTL and KV after ACL reconstruction. Clinical significance: This study has provided direct evidence to support the importance of restoration of full hyperextension after ACLR. Hopping strategies adopted by patients with ACLR for self-protection or performance improvement were also analyzed and discussed. Methods: 27 patients with ACLR were recruited to undertake kinematic analysis during one leg-hop tests, knee strength measurements, knee function assessment by IKDC questionnaire, ACL laxity evaluation by anterior stress radiography and KT 1000 for both affected and sound legs. MRI measurements were also arranged for the reconstructed legs to quantify PTL and KV. KV referred to the degree of internal rotation in tibial component relative to femoral component. PTL was expressed in a ratio after normalized by patellar length. Pearson product moment correlation coefficients were then determined for all the variables measured.
Results: In this study, PTL was found to significantly correlate to knee strength (knee extensors: r= -0.52; knee external rotators: r= -0.60, see Fig.1) and ACL laxity. (r=0.55, see Fig.2) KV was also found to significantly correlate to the degree of knee internal rotation at landing instant during one-leg hop tests. (r= -0.46) In addition, significantly negative correlation was noted between ACL laxity and the strength of knee extensors (r=-0.29) or hopping distance (r=-0.32). Hopping distance was found to significantly correlate to the strength of knee external rotators, (r=0.37) maximal knee flexion angle after landing, (r=0.51) and time duration to reach maximal knee flexion after landing. (r=0.33) Finally, knee function was found to significantly correlated to hopping distance (r=0.35), maximal knee flexion angle at the beginning of the preparatory phase before taking off, (r= 0.28) and the average
522

velocity of knee extension in the preparatory phase (r= -0.34) during one-leg hop tests.
Discussion: We found that subjects exhibiting longer patellar tendon showed significantly increased ACL laxity (r=0.55) and significantly weaker knee strength for extensors (r= -0.52) and external rotators. (r= -0.60) The results have provided direct evidence to support the rehabilitation protocols of immediate restoration of full hyperextension after ACLR.[2] The strategies to maintain full hypertension after ACLR might provide a possibility to avoid patellar tendon lengthening so as to reduce the risk for anterior knee pain, loosen ACL, and weaker knee strength. In addition, the results that subjects with more KV alignment exhibited significantly less knee internal rotation at the instant of landing (r= -0.46) might suggest a self-protective landing strategy to keep from excessive knee internal rotation for ACLR knees with more internally rotated alignment. This study also proved that subjects with increased ACL laxity exhibited significantly weaker knee extensors (r= -0.29) and significantly shorter hopping distance. (r= -0.32) Besides, significantly positive correlation was found between the strength of knee external rotators and hopping distance. (r=0.37). These findings reveal that strengthening programs for knee external rotators after ACLR should not be overlooked. At last, the findings that patients with worse knee function hopped with significantly shorter distance (r=0.35) and significantly smaller maximal knee flexion angle (r= 0.28) in the preparatory phase before taking-off. The control of knee flexion for hopping legs in the preparatory phase might be crucial and further study is needed.
References 1. Sachs RA, et al. Am J Sports Med 17 760-765, 1989 2. Shelbourne KD et al. Source American Journal of Sports Medicine. 25(1):41-7, 1997 Acknowledgements: This study was financially supported by National Science Council, Taiwan
Knee strength (N
)
Patellar tendon length
Fig 1. The relationship between patellar tendon length and knee strength
External rotator
Extensor
Fig 2. The relationship between patellar tendon length and ACL laxity
Patellar tendon length
AC
L laxity (mm
)
523

THE EFFECT OF IMMEDIATE CHANGES IN BODY DIMENSIONS ON THE WALKING PATTERN OF
TODDLERS BETWEEN 15 AND 36 MONTHS.
Van Dam M1, Hallemans A, PhD
1, Segers V, PhD2, Prof. Aerts P, PhD
1,2
1. Laboratory for Functional Morphology, University of Antwerp, Antwerp, Belgium,
2. Department of Movement and Sport Sciences, University of Ghent, Belgium.
INTRODUCTION
This study is part of a research program that aims at a better understanding of the influence of
individual morphological differences and physical growth on the development of walking in
toddlers. In the first three years of life human infants not only experience profound changes in
movement capacity but also undergo dramatic changes in body dimensions. In addition the
growth pattern is not linear but consists of growth spurts [1]. The question that arises is: how is
the walking pattern of toddlers affected when they have to cope with immediate changes in their
body dimensions?
METHODS
Nine healthy toddlers between 15 and 36 months of age participated in the study. 3D gait
analysis was performed by using VICON motion systems (6 camera’s, Mcam 460, 120 Hz). The
ground reaction forces (GRF) were recorded with two force platforms (AMTI, 0.5 x 0.4m,
1080Hz). An adjusted version of the Helen-Hayes marker setup was used for measuring full
body kinematics. The 30 retro-reflective markers were adjusted to a tight fitting suit to prevent
marker plucking. The children were asked to walk normal in three conditions: an unloaded
condition, a legs loaded condition and a trunk loaded condition. In the legs loaded condition the
legs were loaded with 540g (on average 5% of body weight). The load was equally distributed
over the legs in 12 small weights of 45g (6 weights per leg). In the trunk loaded condition six
weights of 45g were attached on the front side of the trunk, six on the back. The weights were
firmly attached to the suit with Velcro. Anthropometric data and individual inertial properties [2]
were used to create a personalized model for each child. Data were analyzed using Visual3D
software.
RESULTS
The results of nine toddlers indicate significant differences in step-time parameters between
normal walking and walking with legs loaded. In the legs loaded condition, children walk slower
and use a shorter stride length, lower cadence and longer double support period, compared to
normal walking. On the contrary, no differences were found between the step-time parameters
of the trunk loaded condition and the normal walking pattern or the legs loaded condition.
Preliminary results of 1 child indicate differences in kinematic and kinetic time profiles between
the conditions as shown in the graphs in Figure 1. The kinetic time profiles were normalized to
body weight.
524

Figure 1: Kinematic and kinetic time profiles of one child in the normal, legs loaded and trunk
loaded condition (Legend: Full dark line = Normal condition; Full grey line = Legs loaded
condition; Dotted line = Trunk loaded condition).
DISCUSSION
According to the results, loading of the legs or trunk affects the gait pattern of young children. In
order to draw conclusions more data and detailed analyses are necessary.
REFERENCES
1. Adolph K. & Avolio A. Human perception and performance. 26:1148-1166, 2000.
2. Crompton RH. et al. Am J Phys Anthropol. 99: 547-550, 1996.
ACKNOWLEDGEMENTS
Our thanks go to the toddlers and parents for their enthusiastic participation in this research. This
study was funded by a PhD grant of the Institute for the Promotion of Innovation through
Science and Technology in Flanders (IWT).
-30.00
-20.00
-10.00
0.00
10.00
20.00
1 9
17 25 33 41 49 57 65 73 81 89 97
Ankle Flexion/Extension
-0.20
0.00
0.20
0.40
0.60
0.80
1.00
1 9
17 25 33 41 49 57 65 73 81 89 97
Ankle Moment
-1.00
0.00
1.00
2.00
3.00
1 9 17 25 33 41 49 57 65 73 81 89 97
Ankle Power
-20.00
0.00
20.00
40.00
60.00
80.00
1 9
17 25 33 41 49 57 65 73 81 89 97
Knee Flexion/Extension
-0.60
-0.40
-0.20
0.00
0.20
1 9
17 25 33 41 49 57 65 73 81 89 97
Knee Moment
-2.00
-1.00
0.00
1.00
2.00
1 9 17 25 33 41 49 57 65 73 81 89 97
Knee Power
-40.00
-20.00
0.00
20.00
40.00
60.00
1 9
17 25 33 41 49 57 65 73 81 89 97
Hip Flexion/Extension
-1.00
-0.50
0.00
0.50
1.00
1 9
17
25
33
41
49
57
65
73
81
89
97
Hip Moment Flexion/Extension
-2.00
-1.00
0.00
1.00
2.00
1 9 17 25 33 41 49 57 65 73 81 89 97
Hip Power
-10.00
-5.00
0.00
5.00
10.00
15.00
20.00
1 9
17 25 33 41 49 57 65 73 81 89 97
Hip Abduction/Adduction
-0.50
0.00
0.50
1.00
1.50
1 9
17
25
33
41
49
57
65
73
81
89
97
Hip Moment Abdduction/Adduction
525

Cognitive Demands of Stair Ascent and Descent in Able Bodied Adolescents and Adults A Schepmyer1, J Chee1,2, L Dade4, KF Zabjek1,2,3,4
1. Faculty of Medicine, University of Toronto; 2. Graduate Department of Rehabilitation Science, University of Toronto; 3. Department of Physical Therapy, University of Toronto; 4.
Bloorview Kids Rehab
Introduction The maintenance of postural stability and balance during walking is critical for completing our activities of daily living. Previously, walking was believed to be a largely automatic process that required little attention. However, recently there has been a growing body of literature suggesting that gait is an attention-demanding process. This is typically demonstrated using dual-task paradigms, where two tasks believed to use the same attentional resources are completed as single tasks and then simultaneously1. If the two tasks do compete for the same cognitive resources, it is expected that completing them concurrently will lead to a decline in performance on one or both of the tasks2. The types of primary walking tasks used in these studies vary from simple tasks, such as walking along an unobstructed pathway, to more complex tasks requiring subjects to step over or around obstacles3,4. This pilot study fits within a larger initiative aimed at understanding the ability of people with neurological conditions to function and maintain mobility in their activities of daily living. This larger initiative includes both pediatric populations (e.g. children with cerebral palsy) and adult populations (e.g. patients with traumatic brain injuries). The specific objective of the present pilot study is to evaluate the attentional demands of ascending and descending steps in healthy young adolescents and adults. We hypothesize that both adults and children will perform more poorly on cognitive tasks when they are simultaneously completing a locomotor task. Clinical Significance Clinical assessment evaluating mobility during the performance of simple, complex and attentionally-demanding tasks is important for determining safety in activities of daily living. Understanding variance in performance, in terms of cognitive and physical demands, will also assist in the planning and focus of treatment interventions. Methods Participants in this ongoing pilot study were 6 healthy adults (aged 20-28 years) and 2 adolescents (aged 8-17 years). Exclusion criteria included: a history of neuromuscular or orthopaedic injury or disease, inability to follow English instructions, or inability to negotiate standard-sized stairs without the use of a handrail. Participants performed a Choice Reaction Time Task (CRT), and a Mobility task. The CRT included 5 to 7 high- (1000 Hz) or low- (500 Hz) pitched auditory tones played at random intervals over a 45-second period. Participants responded as quickly as possible by saying “high” or “low” following a high or low tone respectively. The mobility task consisted of level-ground walking (3 meters), followed by ascending 2 steps (stair height 10 cm), walking across a platform (1 meter), and descending 2 steps. The CRT and mobility tasks were completed first as single tasks and then simultaneously as a dual task. In the dual-task condition, CRT tones were randomized and played during the stair ascent, platform crossing, and/or stair descent phases of the mobility task. A 3-camera Vicon MX Motion capture system recorded the displacement of participants during the mobility task. We used a Panasonic RR-US470 audio recorder to capture the CRT
526

data, and Panasonic Voice Studio and Matlab for analysis. Walking velocity and mean response time were the primary outcome measures.
ResultsParticipants demonstrated a general trend where there was an overall decrease in walking velocity when walking and performing the CRT (730 mm/s±152 mm/s) vs. when walking alone (816 mm/s ± 93 mm/s). (See Figure 1) The overall CRT also decreased when walking (0.504 s ± 0.088 s) vs. the baseline seated condition (0.595 s ±0.058 s). (See Figure 2)
Figure 1 (Left): Walking velocity. Figure 2 (Right): Choice Reaction Time (CRT).
DiscussionThese initial results reveal an overall decrease in walking velocity accompanied by a faster CRT in response to an auditory stimulus. This is in keeping with previous work that has observed similar trends when investigating postural control5 and simple reaction time, as well as CRT when exercising on a stationary bicycle6. Our aim is to expand the current sample size to allow for future age-specific comparisons.
References1. Yogev-Seligmann G, Hausdorff JM, Giladi N. The role of executive function and attention
in gait. Mov Disord 2008;23:329-42.2. Pashler, H, et al. Attentional Limitations in Dual-Task Performance. In: Pashler, H., ed.
Attention. Hove: Psychology Press Ltd., 1998.3. Vallée M, et al. Effects of environmental demands on locomotion after traumatic brain
injury. Arch Phys Med Rehabil. 2006 Jun;87(6):806-13.4. Gage WH et al. The allocation of attention during locomotion is altered by anxiety.Exp
Brain Res. 2003 Jun;150(3):385-94. Epub 2003 Apr 18.5. Müller ML, et al. Effect of preparation on dual-task performance in postural control. J Mot
Behav. 2004 Jun;36(2):137-46.6. Yagi Y, et al. Effects of aerobic exercise and gender on visual and auditory P300, reaction
time, and accuracy. Eur J Appl Physiol Occup Physiol. 1999 Oct;80(5):402-8.
Acknowledgements:The authors would like to acknowledge the support of the Comprehensive Research Experience for Medical Students and the Canadian Institute of Health Research (CIHR) for Andrew Schepmyer, and the Ontario Neurotrauma Foundation and the Quebec Rehabilitation Research Network for Justin Chee.
0
100
200
300
400
500
600
700
800
900
1000
Walking Alone Walking + CRT
Wal
king
Vel
ocity
(mm
/s)
0.000
0.100
0.200
0.300
0.400
0.500
0.600
0.700
CRT CRT + Walking
Cho
ice
Rea
ctio
n Ti
me
(s)
527

A Comparison of Lifting TechniquesAgouris I, Hancock E, Ingram J, Nicol J, Joseph S.
School of Health Sciences, Robert Gordon University, Aberdeen
Corresponding Author:
Ioannis Agouris, PhDBiomechanical EngineerSenior Research FellowSchool of Health SciencesFaculty of Health & Social CareThe Robert Gordon UniversityRoom H321, Garthdee RoadAberdeen, AB10 7QGTel: +44 (0) 1224 263277Cel: +44 (0) 7734 432502Fax: +44 (0) 1224 263290E-mail: [email protected]
528

IntroductionFacing increasing costs from poor manual handling practice, many hospital trusts haveemployed moving and handling advisors to train their staff in manual handling. Thelifting techniques most widely practiced are the ‘back straight – knees bent’ (BSKB) andthe ‘neuromuscular’ (NM) lifts. The ‘BSKB’ approach involves the traditional squat lift,where the knees are bent and the spine is kept erect, while the NM approach advocates alift that occurs from the crouched position. Leskinen et al (1983) and Troup et al (1983)carried out single-plane analysis of the two techniques. These studies found that the NMlift produced the highest peak compression force at the lumbosacral joint (L5/S1).However, it was also found that the ‘bskb’ lift was only advantageous when the load washeld close to the body. This study aimed to perform a 3-dimensonal biomechanicalanalysis and comparison of these lifting movements.
Clinical SignificanceMore than half of the British National Health System (NHS) workplace accidentsreported are due to manual handling. Often the result of poor manual handling is backpain, and a study conducted by the Institute of Employment Studies in 1996 revealed thatone third of respondents reported having time off work with back pain or injury.However, minimal research has been done to determine the most efficient lifting method.
MethodsThree-dimensional motion analysis data was collected with a Vicon MX system (ViconMotion Systems, Oxford). Ground reaction forces were recorded by two Kistler forceplates (Kistler, Hampshire, UK). Kinematics and kinetics were calculated using 3-Dmodelling. The subjects were 25 therapists, trainers, facilitators, and advanced keyhandlers, employed or trained by the NHS, the local Universities or local council. Eachsubject was asked to lift 3 times a 7 kg box using both techniques.
ResultsThe highest peak compression force at L5/S1 was 6316±715 N in the NM lift and 6817 ±412 N in the BSKB lift. The maximum shear loads were 740±110 N and 580±95 Nrespectively. The speed of lift was 0.95±0.12 m/s in the NM lift and 0.92±0.09 m/s in theBSKB. The NM lift was more variable between trials (ICC<0.5) and between subjects(ICC<0.35)
DiscussionThe BSKB lift produced significantly higher peak compression force at the lumbosacraljoint L5/S1 (t-test, p<0.05). The NM lift produced slightly higher shear force, but thisdifference was not statistically significant (t-test, p>0.05). Therefore, the NM lift wasconsidered superior. The neuromuscular lift was more variable between subjects andfurther manual handling advising is required in order to achieve standardisation.
ReferencesComparison of intra-abdominal pressure increases, hip torque, and lumbar vertebral compressionin different lifting techniques. Troup et al, Human Factors 1983, 25(5), 517-526.A dynamic analysis of spinal compression with different lifting techniques. Leskinen et al,Ergonomics 1983, 26(6), 595-604.
529

Fig 1. Dynamometer placement on the Lofstrand crutches
NOVEL CRUTCH SYSTEM TO ASSESS UPPER EXTREMITY KINETICS DURING
LOFSTRAND CRUTCH-ASSISTED GAIT
Neha Bhagchandani1, 2
, Brooke Slavens1-3
, Mei Wang1, 2
, Peter Smith3 and Gerald Harris
1-3
1Orthopaedic and Rehabilitation Engineering Center (OREC), Milwaukee, WI
2Department of Biomedical Engineering, Marquette University, Milwaukee, WI
3Shriners Hospitals for Children, Chicago, IL
E-mail: [email protected]
INTRODUCTION: It is estimated that there are 36,000 pediatric crutch users in the United
States [1]. Due to long term assistive device usage this population could develop upper
extremity (UE) pathologies. Evaluating the UE dynamics of crutch users may ultimately help
to prevent injuries caused by excessive loading or inappropriate gait patterns. Previous studies
have not been able to fully define the UE joint kinetics due to limitations in their approaches
[2, 3]. Our goal was to develop a novel crutch system for evaluating the complete set of
kinematics and kinetics of the UE joints during Lofstrand crutch-assisted gait. System
geometry, verification and data collection techniques are described. This system can be used
to study various pathologies such as osteogenesis imperfecta (OI), spinal cord injury,
myelomeningocele and cerebral palsy.
METHODS: The UEs were modeled using seven rigid body segments
(thorax, upper arms, forearms and hands) and 28 reflective markers
placed on bony landmarks and crutches. The kinematic model was
developed based on previous studies [2-4]. Each crutch was instrumented
with two 6-axis dynamometers (AMTI, Watertown, MA) placed above
and below the handle to measure applied reaction forces and moments
Fig 1. This placement of the dynamometers allowed description of tri-
axial forces and moments at the wrist and the cuff. The system was
verified using static and dynamic validation protocols.
Data was collected on a 16 year old female type I OI subject who was
asked to walk at a self-selected pace and crutch pattern, on a 6-meter
walkway for 4 trials. The subject’s height and weight were 1.4 m and
43.8 kg respectively. A Vicon motion analysis system, with 14 infrared
cameras, was used to capture 3D motion of the reflective markers. For
evaluating the forces and moments, the Newton-Euler force and moment
equations were used for computing joint dynamics:
Hrr iii 1i1i1i1ii FFM M and 0amgmFF
where vectors
F and M are the forces and the moments acting at a distance of r on a
segment i where i represents the distal joint and i+1 represents the proximal joint and H
represents the inertial moment of the segment. m is the segment mass.
g is the acceleration
due to gravity and
a is the acceleration of the ith
segment [4, 5]. The gait cycle was defined to
begin and end at heel strike of the right leg and time normalized to 100%. Forces and
moments were expressed as percent body weight (%bw) and percent body weight multiplied
by height (%bw*h), respectively.
530

-10
0
10
20
Forc
e (%
bw)
Sup.
(+)/
Inf.(
-)
-2
-1
0
1
Mom
ent (
%bw
*h)
Flex
.(+)/
Ext.(
-)
Shoulder
-10
0
10
20
Forc
e (%
bw)
Sup.
(+)/
Inf.(
-)
-2
-1
0
1
Mom
ent (
%bw
*h)
Flex
.(+)/
Ext.(
-)
Wrist
-10
0
10
20
Forc
e (%
bw)
Sup.
(+)/
Inf.(
-)
-2
-1
0
1
Mom
ent (
%bw
*h)
Flex
.(+)/
Ext.(
-)
Elbow
0 20 40 60 80 100% Gait Cycle
RHS
RC
LHS
LC
RESULTS: The axial joint reaction forces and moments observed at the wrist, elbow and shoulder are displayed in Fig 2. The mean and standard deviations were evaluated over 4 trials. Crutch loading was observed for about 60% of the gait cycle. Maximum forces and moments were seen at the elbow and shoulder joint. DISCUSSION: The model demonstrated the ability in preliminary tests to effectively evaluate UE joint reaction forces and moments during crutch-assisted gait. This system has been technically validated under static and dynamic conditions. Maximum joint reaction forces were observed at the elbow and shoulder joint. Moments were highest at the shoulder followed by elbow and wrist. Previous studies have failed to take account of forearm crutch contact effects in the kinetic analysis [3, 4]. Limitations have included the number of sensors, sensor location, and sensor characteristics. Results from the current study support continued use of the crutch system to characterize UE joint dynamics during crutch-assisted gait. Further study with this system may offer valuable insight for crutch prescription, placement patterns (reciprocal, swing-through, swing-to) and long term usage effects. REFERENCES: 1. Kaye HS, et al. (2000). In, Disability Statistics Report (14). US Department of Education. 2. Nguyen TC, Baker R (2004). Two methods of calculating thorax kinematics in children with myelomeningocele. Clinical Biomechanics, 19(10), 1060–1065. 3. Slavens BA, et al. (2009). Upper extremity dynamics during Lofstrand crutch-assisted gait in children with myelomeningocele. Gait and Posture, 30, 511-517. 4. Requejo PS, et al. (2005). Upper extremity kinetics during Lofstrand crutch-assisted gait. Medical Engineering and Physics, 27, 19-27. 5. V.M. Zatsiorsky (2002). Kinetics of Human Motion. Champaign, IL: Human Kinetics. ACKNOWLEDGEMENTS: This work is supported by the Orthopedic and Rehabilitation Engineering Center, (OREC), Shriners Hospitals for Children and Dr. Ralph and Marian Falk Medical Trust.
Fig 2. Mean and (±) std. for the forces and moments occurring at the wrist, elbow and shoulder. Black (Solid) and blue (dashed) lines represent the right and left extremity respectively. RHS and LHS are right and left heel strike. RC and LC are right and left crutch contact periods.
531

Acknowledgements: Funded by NIH grant R01 HD049774
Intersegmental dynamics during manual wheelchair propulsion in persons with
paraplegia: influence of gender and shoulder muscle strength
Sara Mulroy, Philip Requejo, Puja Ruparel, Patricia Hatchet, Lisa Haubert, Valerie Eberly
Pathokinesiology Laboratory, Rancho Los Amigos National Rehabilitation Center Contact: [email protected]
Introduction: The prevalence of shoulder pain is high after spinal cord injury (SCI)
negatively impacting mobility and quality of life. Rotator cuff tendonitis/tears are the most
common diagnoses for those with shoulder pain after SCI. This pathology has been attributed
to repetitive upper extremity (UE) weight bearing activities including manual wheelchair
propulsion (WCP). Women are at a particularly high risk of developing shoulder pain after
SCI. The purpose of this study was to characterize the UE kinetics and intersegmental
dynamics during WCP and to identify the impact of shoulder muscle strength and gender.
Statement of Clinical Significance: A closer look at the influences of gender and shoulder
muscle strength on shoulder joint dynamics during WCP may help identify causative factors
of UE pain, and therefore assist with preventative efforts to avoid and/or reduce pain.
Methods: Individuals with paraplegia from SCI who were free of shoulder pain were
recruited from the outpatient clinics at Rancho Los Amigos National Rehabilitation Center.
Bilateral peak isometric shoulder torques during flexion, adduction, and external rotation were
assessed using Biodex System 3. Thirty individuals (from a total of 223) were selected for
analysis including the 10 men with highest (strong men) and the 10 men with lowest (weak
men) average of shoulder torques (normalized by body weight) and the first 10 women tested
(out of 23). Average age was 33 years and time since injury was 9 years. Hand forces were
collected with an instrumented handrim (SmartWheel) along with 3-D kinematic (CODA)
data from the upper extremities and trunk during 3 conditions of WCP (free, fast, graded) on a
stationary ergometer. Propulsion speed, cadence, and push-phase duration were calculated.
Kinematics and hand force data from multiple propulsion cycles were used to calculate
shoulder net joint forces, net joint moments, and the components: the moment created by the
force of gravity acting at the center of mass of the UE segments (gravitational), the moment
generated at the shoulder by the velocities and accelerations of the UE segments (inertial), and
the moment created by the reaction force applied to the hand (reaction force). The peaks of
the shoulder joint reaction forces, net joint moments, and components of the shoulder
moments during the push phase were compared between groups (strong men, weak men, and
women) using a one-way analysis of variance with statistical significance set at p < 0.05.
Results: Women and weak men had significantly lower shoulder torques (less than 50%)
compared to the strong men for all muscle groups. Normalized shoulder torques were similar
between weak men and women except for shoulder adduction and extension where the
women had significantly higher torques than the weak men (25 to 35% greater). Strong men
had faster propulsion speed than women in fast and graded WCP and faster speed than weak
men during graded propulsion (Table). Cycle distance was longer in the strong men than in
both the weak men and women in all 3 conditions. During the push phase, the peak shoulder
net joint reaction forces were similar in the 3 subject groups both for absolute forces and
when normalized by body weight. Peak total flexion moments, however, were significantly
lower in the women compared to strong men in all 3 conditions and compared to weak men in
532

free and graded propulsion (Fig 1). The differences in total moments in the push phase were
due primarily to differences in the moment created by the weight bearing reaction force. The
moments created by inertia of the limb during the push phase also were lower in women than
both strong and weak men during free and fast propulsion and lower than weak men only in
graded propulsion. When normalized by body weight, the total net joint moments and reaction
force moments were greater in strong men than both weak men and women.
Strong Men Weak Men Women p value
Velocity Free (m/sec) 68 +/- 18 60 +/- 14 52 +/- 14 .085
Fast 127 +/- 30 105 +/- 23 85 +/- 24* .005
Graded 89 +/- 30 52 +/- 9* 42 +/- 15* .001
Cycle Distance Free (m) 1.31 +/- 0.4 0.91 +/- 0.2* 0.79 +/-0.2* .002
Fast 1.90 +/- 0.7 1.13 +/- 0.3* 0.98 +/-0.2* .0001
Graded 0.95 +/- 0.2 0.58 +/- 0.1* 0.54 +/-0.1* .0001
Superior Force Free (n) -4.8 +/- 9 -15.8 +/- 14 -9.7 +/- 32 .494
Fast 2.3 +/- 14 0.2 +/- 36 2.72+/- 25 .981
Graded 14.3 +/- 17 50.0 +/- 40 31.7 +/- 52 .144
0 20 40 60 80 100-10
0
10
20
30
FR
EE
0 20 40 60 80 100-20
0
20
40
FA
ST
0 20 40 60 80 100-20
0
20
40
60
GR
AD
ED
0 20 40 60 80 100-10
0
10
20
30
0 20 40 60 80 100-20
0
20
40
0 20 40 60 80 100-20
0
20
40
60
0 20 40 60 80 100-10
0
10
20
30
0 20 40 60 80 100-20
0
20
40
0 20 40 60 80 100
-20
0
20
40
60
STRONG MEN WEAK MEN WOMEN
% CYCLE
Figure 1: Total net join moment = solid gray line, reaction force moment = solid black line, Inertial moment = thick black dashed line, gravity moment = thin gray dashed line
Discussion: Shoulder muscle strength significantly impacted distance traveled for each push.
Weak men mitigated the effect of shorter cycle distance on speed by increasing cadence.
Despite slower speeds and weaker shoulder muscles in women than in strong men, the
shoulder joint forces were similar. The superiorly directed shoulder forces during the weight-
bearing push phase of WCP are those that increase the potential for subacromial
impingement. With lower strength in the rotator cuff muscles, the women and weak men
533

would be less able to counter the upward forces in the push phase to prevent translation of the
humeral head on the glenoid. Acknowledgements: Funded by NIH grant R01 HD049774
534

The Reach of a Mobile Robot Modelled Mathematically to Stabilise Velocity Estimate from Accelerometers:
Implications in Stroke Rehabilitation
Nour Shublaq1, Penny Probert Smith1, Julie Stebbins21Institute of Biomedical Engineering, University of Oxford, Oxford, UK
2Oxford Gait Laboratory, Nuffield Orthopaedic Centre NHS Trust, Oxford, UK
Introduction 3D accelerometers are cheap and wearable, and have been used to measure movement by several studies [1, 2]. However the readings are dominated by gravity, leading to integration drift in velocity estimation. The work described here exploits a simple cyclic model of repetitive reach movement to improve the reliability of velocity estimation. A mobile robot is programmed to simulate a healthy upper limb reach movement (with comparable velocity profile and range). This ensures the reach is kept relatively repeatable and any sensor motion artefacts due to skin movement are eliminated. An extended Kalman filter is used to reduce integration drift using accelerometer readings from a device placed on the robot. The results are compared with an accurate Vicon motion capture system.
Clinical Significance According to UK Department of Health, stroke is the largest single cause of severe disability with over two-thirds of stroke patients impaired in activities of daily living due to partial paralysis of the upper limb [3]. From various metrics to monitor performance during exercise therapy; movement velocity is found particularly useful as it relates to temporal efficiency, motor control strategy adopted, and overall quality of movement. Our ultimate aim is to improve estimation of upper limb movement velocity from wearable accelerometers for stroke patients.
535

MethodsA 12-camera Vicon (MX F40) system is used to capture a mobile robot reaching. 3 (9 mm) passive reflective markers are placed on the robot in addition to a device containing 3D accelerometers; the latter also tracked by Vicon by 4 markers placed on it. Velocity estimate of the robot along its longitudinal axis is calculated using both systems as well as from our Kalman filter, and the results compared. ResultsEarly results in Fig. 1 show that velocity estimation using Kalman filtering (in red) better matches Vicon’s computation (in green) than a standard numerical integration method (in blue). Integration drift in velocity is significantly reduced.
Fig. 1 Comparison of velocity estimate from the Vicon system with the standard integration method (left) and Kalman filter (right)
Discussion Gravity can distort sensor acceleration measurements, with substantial effect when the movement is performed slowly. Eliminating this effect is not straightforward due to the inevitable mis-alignment between the sensor local vertical axis and gravity introduced mainly by sensor mounting errors. This leads to integration drift when estimating movement velocity. However, by applying a proper Kalman filter, drift can be reduced and velocity estimate stabilised.
0 5 10 15 20 25 30-0.4
-0.3
-0.2
-0.1
0
0.1
0.2
0.3
0.4
0.5
Time [secs]
Vel
ocity
x (m
/s)
References 1. Zheng et al. SMART Rehabiliation, 2007. 2. Zhou et al. J. Informat Technol, 13, 1-14, 2007. 3. Caimmi et al. Neurorehabil. Neural Repair, 22, 31-39, 2008. Acknowledgements Our thanks go to the Engineering and Physical Sciences Research Council, UK for funding this work.
0 5 10 15 20 25-0.4
-0.3
-0.2
-0.1
0
0.1
0.2
0.3
0.4
0.5
Time [secs]
Vel
ocity
x (m
/s)
536