Gait analysis in the science of rehabilitation - Wikimedia ...
134
RC 376.. 5 I G33 1998 I 1 Gait Analysis in the Science of Rehabilitation
-
Upload
khangminh22 -
Category
Documents
-
view
2 -
download
0
Transcript of Gait analysis in the science of rehabilitation - Wikimedia ...

RC376.. 5 I
G331998 I
1 .
Gait Analysis in the
Science of Rehabilitation

Gait Analysis in the Science of Rehabilitation


Department ofW Veterans Affairs
.Gait Analysis in the Science of Rehabilitation.
Joel A. DeLisa, M.D.
:MWM. MTfTiTES Of HE.UTH I
mn ueiMY
SEP I 7 2005|
i
BtDGis, lacEHTaea... :
: :
Department of Veterans AffairsVeterans Health Administration
Rehabilitation Research and Development ServiceScientific and Technical Publications Section

Department ofVeterans Affairs
I Gait Analysis in the Science of Rehabilitation
John R. Feussner, M.D.
Chief Research and Development Officer
Veterans Health Administration
Department of Veterans Affairs
Jon S. Peters, Director
Baltimore Rehabilitation Information & Technology Administrative Center (BRITAC),
Rehabilitation Research and Development Service
Tamara T. Sowell, Editor
SCIENTIFIC AND TECHNICAL PUBLICATIONSSECTION MANAGEMENTJon S. Peters, Acting Program Manager, STPSTamara T. Sowell, Editor
PRODUCTION STAFFNeil McAleer, Managing Editor
Barbara G. Sambol, Senior Technical Publications Editor
Don Martin, Technical Publications Editor
June R. Terry, Program Assistant
Celeste Anderson, Program Assistant
Marcia Nealey, Program Clerk
INFORMATION RESOURCE UNIT
Frank L. Vanni, Visual Information Specialist
Nick Lancaster, Scientific and Technical Photographer
Address correspondence to: Editor, Scientific and Technical Publications Section, Baltimore Rehabilitation Information and Technology Administrative Center,
103 South Gay Street, Baltimore, MD 21202-4051.
The opinions of the authors are their own and are not necessarily those of the Department of Veterans Affairs.
Contents of this Monograph are within the public domain, with the exception of material which was already under copyright when received and appears here
with the permission of the copyright owner. No portions may be reproduced in any form without the written permission of the copyright holders.
The contents of this publication do not necessarily reflect the views of the Department of Veterans Affairs and do not imply endorsement by the U S.
Government.
iii

CONTENTS
Gait Analysis in the Science of Rehabilitation
Monograph 002, 1998
Joel A. De Lisa, MD
Before You Readthis Monograph vii
Editorial
Joel A. De Lisa, MD ix
Introduction/Prologue
Casey K. Kerrigan, MD xii
Section I Clinical Observation
Gerard Malanga, MD and Joel A. De Lisa, MD 1
Section II Instrumented Gait Analysis (Review of
Instrumented Gait Analysis Systems)
Ernest Bontrager, PhD 11
Chapter 1 EMG Dynamics
Jacquelin Perry, MD 33
Chapter 2 Motion Analysis and Biomechanics
Robert W. Soutas-Little, PhD 49
Section III Value of Information Resulting from
Instrumented Gait Analysis
Chapter 1 The Physiatrist
Andrew J. Gitter, MD and Robert McAnelly, MD 69
Chapter 2 The Physical Therapist
Sue Ann Sisto, PhD, PT 76
Section IV Future Directions in Gait Analysis
Kenton Kaufman, PhD, PE 85


Before You Read This Monograph
This monograph, Gait Analysis in the Science of Rehabilitation, neither attempts to cover all
instrumented gait analysis systems nor is to be considered a text on gait analysis. Other
excellent source texts have been written and are referenced at the end of most chapters. It
does, however, offer a solid foundation in understanding the availability and importance of
instrumented gait analysis systems and how they work.
The intent of the chapter authors is to inform clinicians of the options open to them in their
diagnosis and evaluation of pathological gait problems and what they might prescribe to
improve or correct these deviations from the norm. This text has been designed so as to help
clinicians find a way to reach an in-depth level of gait analysis in a clinical environment that
may enable them to prescribe a quicker corrective solution, be it via an orthosis, a surgical
procedure, or medication, thereby resulting in a speedier rehabilitation, discharge, and re-entry
into independent living, which is the ultimate goal of both the clinician and the client.
Tamara T. Sowell, Editor

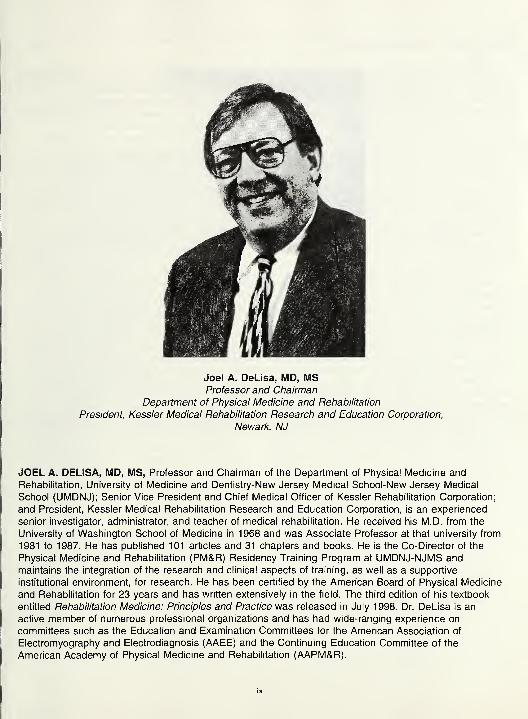
Joel A. DeLisa, MD, MSProfessor and Chairman
Department of Physical Medicine and Rehabilitation
President, Kessler Medical Rehabilitation Research and Education Corporation,
Newark, NJ
|JOEL A. DELISA, MD, MS, Professor and Chairman of the Department of Physical Medicine and
Rehabilitation, University of Medicine and Dentistry-New Jersey Medical School-New Jersey Medical
!
School (UMDNJ); Senior Vice President and Chief Medical Officer of Kessler Rehabilitation Corporation;
and President, Kessler Medical Rehabilitation Research and Education Corporation, is an experienced
senior investigator, administrator, and teacher of medical rehabilitation. He received his M.D. from the
, University of Washington School of Medicine in 1968 and was Associate Professor at that university from
1981 to 1987. He has published 101 articles and 31 chapters and books. He is the Co-Director of the
Physical Medicine and Rehabilitation (PM&R) Residency Training Program at UMDNJ-NJMS and
i maintains the integration of the research and clinical aspects of training, as well as a supportive
institutional environment, for research. He has been certified by the American Board of Physical Medicine
and Rehabilitation for 23 years and has written extensively in the field. The third edition of his textbook
entitled Rehabilitation Medicine: Principles and Practice was released in July 1998. Dr. DeLisa is an
active member of numerous professional organizations and has had wide-ranging experience on
committees such as the Education and Examination Committees for the American Association of
Electromyography and Electrodiagnosis (AAEE) and the Continuing Education Committee of the
American Academy of Physical Medicine and Rehabilitation (AAPM&R).
ix
RRDS Gait Analysis in the Science of Rehabilitation
Dr. DeLisa has been the Chairman of the Ad Hoc Committee on the Resident Matching Program of
the Association of Academic Physiatrists (AAP) and a member of the AAPM&R/AAP Research
Committee. He is past President of the AAEE, past President of the AAP, and past President of the
American Paraplegia Society. He was an associate written examiner for the American Board of Physical
Medicine and Rehabilitation (ABPM&R), is one of its 14 directors, and is its chairman. He is on the
executive committee of the American Board of Medical Specialties and was a member of the Scientific
Advisory Board of the Paralyzed Veterans of America and the National Multiple Sclerosis Society. Hewas on the Editorial Board of Muscle and Nerve and is currently a member of the following Editorial
Boards: the American Journal of Physical Medicine and Rehabilitation,the Journal of Spinal Cord
Medicine, and the European Journal of Physical Medicine and Rehabilitation. Among his many honors
are The Special Advancement Award, in 1985, from the Seattle VAMC, for the development of the Spinal
Cord Injury Program; The prestigious Gold Key Award, in 1991, from the American Congress of
Rehabilitation Medicine; the Excellence Award, in 1995, from the American Paraplegia Society; the
Outstanding Service Award from the Association of Academic Physiatrists; and the Charles L. Brown
New Jersey Medical School Alumni Award in 1996. Dr. DeLisa was elected faculty member Alpha OmegaAlpha in 1994.
From 1974 to 1987, Dr. DeLisa was affiliated with the Department of Veterans Affairs (then called
the Veterans Administration) in the following capacities: from September 1974 to June 1975 as consultant
in Rehabilitation Medicine at the American Veterans Hospital, Tacoma, WA; from June 8, 1975 to June
1982 as Assistant Chief of Rehabilitation Medicine Service, VA Medical Center, Seattle, WA; from
October 7, 1979 to June 1982 as Associate Chief of Staff for Education, VA Medical Center, Seattle; and
from August 20, 1984 to June 15, 1987 as Chief of the Spinal Cord Injury Service, also at the Seattle
VAMC. He has served as liaison to the VA from 1993 to the present, as a member of the Special Medical
Advisory (SMAG) to the Department of Veterans Affairs from 1992 to the present, and he has served on
the VA congressional mandated Prosthetics and Assistive Devices Committee from 1991 to the present.
On November 6, 1998, Dr. DeLisa is scheduled to be the guest lecturer at the 31st annual Walter J.
Zeiter Luncheon and Lecture, AAPM&R, which will be held at the Washington State Convention and
Trade Center. This annual lectureship is awarded to a physiatrist who shares Dr. Zeiter’s qualities of
statesmanship, scholarship, executive leadership, and warm friendship. It is sponsored by the Physical
Medicine and Rehabilitation Education and Research Fund (PM&R-ERF), AAPM&R.
EDITORIAL
by Joel A. DeLisa, MD, MS
I had the pleasure of doing my residency
in physiatry under Justus Lehmann, MD, Profes-
sor, Department of Rehabilitation Medicine, at the
University of Washington in Seattle, and, for myfirst five years on their faculty, taught functional
anatomy to undergraduate physical therapy, occu-
pational therapy, and prosthetic/orthotic students.
Functional anatomy included the teaching of
kinesiology and biomechanics, which became pre-
dominant as I taught both normal and abnormal
gait to these students.
Locomotion is the process by which we movefrom one position to another. This process is a
continuum from standing to walking to running and
involves starting, stopping, changing directions,
and altering speed. Most mammals are quadrupe-
dal, but man is bipedal. The mastering of erect
bipedal locomotion appears to be a learned activity
and thus, each of us displays peculiarities that are
superimposed on the basic pattern of bipedal loco-
motion. Therefore, on analyzing human gait, one
should explain the similarities as well as the dis-
similarities and then describe how these variations
may represent an impairment.
In putting together this gait analysis mono-graph, I divided it into four sections: 1) clinical ob-
servation; 2) review of the instrumental gait analy-
sis systems; 3) the value of information resulting
from instrumented gait analysis from the perspec-
tive of a physiatrist, an orthopedic surgeon, and a
physical therapist; and 4) discussion of future
trends for gait laboratories. The authors were se-
lected as experts from multiple rehabilitation spe-
cialties to give the readers an understanding of
how gait analysis can be used to evaluate a per-
son’s walking abilities to maximize function and
maintain or improve quality of life.
It is my belief that instrumented gait analysis
systems offer objective evaluation of the effective-
ness of the various rehabilitation treatments that
are aimed at improving gait disabilities. Current
recognized uses are in the gait patterns of persons
with spastic paralysis to evaluate various orthope-
dic procedures such as tendon transfers,
tenotomies, and rhizotomies pre- and postopera-
tively. In adults with other neurologic disorders and
who exhibit spastic gait, quantitative analysis of-
fers us objective data to evaluate therapeutic mo-
dalities and treatments such as strengthening and
stretching exercises, biofeedback, functional elec-
trical stimulation, various orthoses, and nerve or
intramuscular neurologic blocks. One of the limits
to its widespread use has been the limited repro-
ducibility and usefulness of the data. Improvement
in the computer technology, as well as the simplifi-
cation of the systems, allows a much faster acqui-
sition of kinematic data and analysis.
Clinicians will demand outcome studies with
respect to who should be referred for these quanti-
tative studies. Standardization of data collection
and reporting procedures need to be implemented
so that the cost-effectiveness relative to functional
outcome can be established. Evidence-based
practice is becoming a key driving force in medi-
cine. This approach needs to be embedded in the
determination of effective quantitative gait labora-
tories.
It is my hope that physicians and therapists in
practice, as well as students at various levels of
training, will find this monograph to be a user-
friendly, valuable teaching tool.
I wish to thank the Department of Veterans
Affairs Rehabilitation Research and Develop-
ment Service for giving me this opportunity to
organize and edit this monograph. I also want to
thank Philip Melchiorre, MD, Assistant Professor
of Physical Medicine and Rehabilitation, Univer-
sity Hospital, New Jersey Medical School, whowas good enough to add his critique to the
chapters.
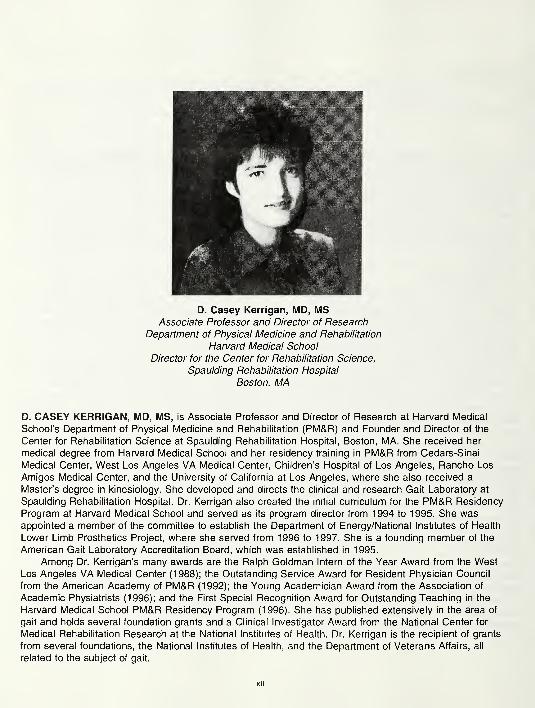
D. Casey Kerrigan, MD, MSAssociate Professor and Director of Research
Department of Physical Medicine and Rehabilitation
Harvard Medical School
Director for the Center for Rehabilitation Science,
Spaulding Rehabilitation Hospital
Boston, MA
D. CASEY KERRIGAN, MD, MS, is Associate Professor and Director of Research at Harvard Medical
School’s Department of Physical Medicine and Rehabilitation (PM&R) and Founder and Director of the
Center for Rehabilitation Science at Spaulding Rehabilitation Hospital, Boston, MA. She received her
medical degree from Harvard Medical School and her residency training in PM&R from Cedars-Sinai
Medical Center, West Los Angeles VA Medical Center, Children’s Hospital of Los Angeles, Rancho Los
Amigos Medical Center, and the University of California at Los Angeles, where she also received a
Master’s degree in kinesiology. She developed and directs the clinical and research Gait Laboratory at
Spaulding Rehabilitation Hospital. Dr. Kerrigan also created the initial curriculum for the PM&R Residency
Program at Harvard Medical School and served as its program director from 1994 to 1995. She wasappointed a member of the committee to establish the Department of Energy/National Institutes of Health
Lower Limb Prosthetics Project, where she served from 1996 to 1997. She is a founding member of the
American Gait Laboratory Accreditation Board, which was established in 1995.
Among Dr. Kerrigan’s many awards are the Ralph Goldman Intern of the Year Award from the WestLos Angeles VA Medical Center (1988); the Outstanding Service Award for Resident Physician Council
from the American Academy of PM&R (1992); the Young Academician Award from the Association of
Academic Physiatrists (1996); and the First Special Recognition Award for Outstanding Teaching in the
Harvard Medical School PM&R Residency Program (1996). She has published extensively in the area of
gait and holds several foundation grants and a Ciinicai investigator Award from the National Center for
Medical Rehabilitation Research at the National Institutes of Health. Dr. Kerrigan is the recipient of grants
from several foundations, the National Institutes of Health, and the Department of Veterans Affairs, all
related to the subject of gait.
xii

INTRODUCTION/PROLOGUE
by D. Casey Kerrigan, MD, MS
Modern-day quantitative gait analysis,
including kinematic or joint motion measurement,
kinetic or joint torque assessment, and dynamic
electromyographic (EMG) recording, is one of the
few, if not the only, measurement systems that
quantify functional limitation, along with impairment
and disability. Clearly, quantitative gait analysis
allows an objective evaluation of the effectiveness
of various rehabilitation treatments aimed at
improving gait disability. For instance, quantitative
gait analysis, as a functional assessment tool, has
been used to show the benefits of various
orthopedic surgical procedures and rhizotomy
techniques in persons with neurological
impairment. It has also been used to assess the
biomechanical effects of bracing, prosthetic
components, and other rehabilitative modalities.
However, functional assessment, or outcome
measurement, is but one small role that
quantitative gait analysis can play in the science of
rehabilitation. If we expand the definition of gait
analysis to include interpreting the significance of
quantitative gait data, then the most promising
aspect of gait analysis is that ultimately we will
understand the complex relationships between
impairment, functional limitation, and gait disability.
An understanding of these relationships should
vastly improve our rehabilitation treatment
strategies.
The use of quantitative gait analysis in the
rehabilitation setting has increased only recently.
Gait analysis methodology has been around for
over 100 years; however, work to improve gait
analysis technology and repeatability has occurred
only over the past 10 years. Often in the past, the
technical details of gait analysis made clinical gait
analysis extremely cumbersome and time-
consuming. Two major factors made the routine
use of gait analysis impractical, particularly in
individuals with poor walking ability. The first factor
was the time and effort required for setting up and
testing a subject and the associated burden to that
person. Depending on a particular protocol,
obtaining kinematics with video capture could
require that the individual not use an assistive
device or that he or she walk with his or her arms
crossed. The apparatus attached to the person
was frequently heavy and constricted joint
movement. The second major limitation was the
time and effort required to process and analyze
the data. Also, unreliability of data acquisition and
processing methods required an inordinate numberof trials, burdening both the people being tested
and the staff. Such limitations undoubtedly
prohibited gait analysis on a regular clinical basis.
There is a growing acceptance of the clinical
use of gait analysis in the rehabilitation setting.
Fortunately, in recent years many technical
difficulties have been overcome. Recent advances,
such as improved computer processing and the
development of passive as opposed to active
marker systems, have enabled the faster
acquisition of kinematic data without heavy
encumbering attachments and wires trailing from
the subject. Also, with improved computer
integration and software, kinetic data are moreautomatically obtained from a combination of
kinematic and force plate data. Although once
impractical, a modern-day gait laboratory can nowallow for routine assessment of gait in standard
rehabilitation settings.
Currently, the most common clinical use of
gait analysis is the assessment of spastic paretic
gait. Analysis allows us to understand the dynamic
implications of a particular impairment, such as
spasticity or weakness, in a particular muscle
group. For instance, in some individuals, spastic
paretic stiff-legged gait, defined as reduced knee
flexion during the swing period of the gait cycle,
may be the result of quadricep spasticity. In fact, a
standard, static evaluation may reveal spasticity in
the quadriceps. A gait analysis, however, may or
may not demonstrate inappropriate activity in the
quadriceps during the critical phases of the gait
cycle when the knee should be flexing in
preparation for and during swing. In this way, gait
xiii
xiv
RRDS Gait Analysis in the Science of Rehabilitation
analysis allows us to determine the functional
implication of an impairment. In some cases, by
using gait analysis we may observe an impairment
or functional limitation that is not at all appreciable
with static evaluation. For instance, despite normal
tone and the absence of spasticity in a particular
muscle group such as the quadriceps, gait
analysis may reveal inappropriate activity in that
same muscle group.
With gait analysis, we have the potential to
determine those impairments and functional
limitations that probably contribute to the walking
disability. Although a gait disability may be
phenotypically similar from one individual to
another, the impairments are typically distinct
between individuals. Probably no two sets of
quantitative gait data from two individuals are the
same, no matter how visually similar their gait
disability appears. Logically, the optimal treatment
for a given individual will be the one that
addresses the impairments and functional
limitations that are most likely contributing to the
walking disability. Gait analysis should provide this
information, thereby allowing an effective
rehabilitation management program. That gait
analysis can help define the appropriateness of a
number of rehabilitative modalities is probably its
most important potential contribution to
rehabilitation science.
By defining the causative impairments and
functional limitations, a gait analysis can be used
to focus and optimize rehabilitation treatment
including the prescription, for instance, of specific
strengthening or stretching exercises, EMGbiofeedback, functional electrical stimulation,
orthotics, or nerve or intramuscular neurolytic
blocks. A quantitative gait evaluation may identify
which muscles are firing appropriately and which
are not, based on the kinematics, dynamic EMG,and kinetics. Gait analysis especially fills a void in
upper motor neuron pathology, where traditional
static evaluation measures are not effective in
measuring either muscle strength or spasticity, at
least from a functional standpoint. By providing
information as to which muscle groups needstrengthening (or electrical stimulation, or bracing),
and which need relaxation (or stretching or
intramuscular neurolysis), gait analysis can lead to
a more optimal, methodical, and directed
rehabilitation protocol.
By helping to pinpoint the causative
impairments and functional limitations, gait
analysis could be quite useful in optimizing
experimental protocols involving a number of
rehabilitation treatments. For instance, an
experimental EMG biofeedback or functional
electrical stimulation experimental protocol that
was based on information obtained from
quantitative gait analysis undoubtedly would be
more likely to be successful than one that was not.
Similarly, a program to test therapeutic modalities
aimed at reducing spasticity would be more likely
to be effective if it were based on information
obtained from quantitative gait analysis. For
example, a program to reduce tone in the
quadriceps to improve stiff-legged gait would be
functionally helpful only if gait analysis revealed
that the quadriceps really were inappropriately
active during gait. Gait analysis is thus potentially
quite useful in optimizing, and thereby increasing,
the likelihood of demonstrating the general
effectiveness of a number of innovative, as well as
standard, rehabilitation treatments. Of course,
quantitative gait analysis, by providing objective
functional assessment information, also can be
helpful in assessing the outcomes of these specific
rehabilitation programs.
The future of gait analysis in the science of
rehabilitation is bright. Undoubtedly, its technology
will continue to improve with new developments in
computer vision, artificial intelligence,
computational methods, and computer power. In
addition, the models used to interpret gait analysis
data will be refined and standardized. Perhaps the
most exciting area of development is that of
forward dynamic or robotic modeling, in which
much work has already been done. Ultimately, weought to be able to input kinetics that are
measured with current gait analysis technology
into a computerized robotic model. Inputting an
individual’s measured kinetics into the robotic
model would result in a kinematic gait pattern that
is similar to the individual’s actual kinematic
pattern. Then, we could predict the effect of
changing the kinetic inputs; changing them in the
robotic model would be the equivalent in the actual
individual to some rehabilitation treatment that
would alter an impairment, such as strengthening
a particular muscle. We would be able to alter
kinetic inputs in the model and observe the “would
XV
Introduction/Prologue
be” kinematic pattern changes. The ability to
model and predict the effect of a treatment would
not only provide a better understanding of the
mechanisms of various gait disabilities, it would
allow each person more precise individualized
rehabilitation prescriptions for treatment.
With improved measurement techniques, gait
analysis will continue to provide us with a better
understanding of biomechanical and
neurophysiologic function, both normal and
abnormal, which may transcend to other activities
of daily living. The role of gait analysis in the
science of rehabilitation is much larger than simply
a functional assessment tool as it can help us
determine the complex relationships between
impairment, functional limitation and disability. By
defining these relationships, we not only will be
able to design more optimal studies of the general
effectiveness of a number of current rehabilitation
treatment strategies, but will also be in a better
position to consider new rehabilitation treatment
strategies.

'
SECTION ONE
Clinical Observation
by Gerard Malanga, MD and Joel A. DeLisa, MD
Dr. Malanga is Director of Spine and Occupational Medicine at Kessler Institute for Rehabilitation and Assistant
Professor of Physical Medicine and Rehabilitation at the University of Medicine and Dentistry-New Jersey Medical
School. Dr. DeLisa is Professor and Chairman of the Department of Physical Medicine and Rehabilitation at the
University of Medicine and Dentistry-New Jersey Medical School and is the President of Kessler Medical
Rehabilitation Research and Education Corporation.
INTRODUCTION
The ability to walk upright is a defining character-
istic of man. Gait is the manner in which walking is
performed and can be normal, antalgic, or unsteady.
Gait analysis can be assessed by various techniques but
is most commonly performed by clinical evaluation
incorporating the individual’s history, physical examina-
tion, and functional assessment. Gait abnormalities can
be more precisely examined through the use of gait
laboratories. These laboratories utilize surface EMGactivity of muscles, force plates, and kinematic evalua-
tion of the lower limbs. They are highly specialized
units that assess various gait abnormalities from indi-
viduals with neuromuscular disorders to high-level
athletics. While some clinical impressions have been
shown to be incorrect by the use of gait lab technology,
the clinical evaluation still remains the essential compo-
nent in determining the etiology and the treatment plan
for gait problems. A proper clinical evaluation should
always precede any gait lab assessment.
Normal Gait
The determination of abnormal gait requires one to
first have an understanding of the basic physiology and
biomechanics of normal gait (1,2,3). The gait cycle is a
time interval or sequence of motion occurring from
heelstrike to heelstrike of the same foot. The gait cycle
has been broadly divided into two phases: stance phase
and swing phase. These phases can then be further
subdivided and discussed in terms of percentage of each
within the gait cycle. This is diagrammatically repre-
sented in Figure 1, by Verne T. Inman, MD, PhD.
The stance phase is 60 percent of the gait cycle and
can be subdivided into double-leg and single-leg stance.
In double-leg stance, both feet are in contact with the
ground. At an average walking speed, it represents 10
percent of the entire gait cycle, but decreases with
increased walking speed and ultimately disappears as
one begins to run. At slower walking velocities the
double-leg support times are greater. Single-leg stance
comprises up to 40 percent of the normal gait cycle. The
muscles that are active during the stance phase act to
prevent buckling of the support limb. These include the
tibialis anterior, the quadriceps, the hamstrings, the hip
abductors, the gluteus maximus, and the erector spinae
(1,4,5).
The swing phase is described when the limb is not
weight bearing and represents 40 percent of a single gait
cycle. It is subdivided into three phases: initial swing
(acceleration), midswing, and terminal swing (decelera-
tion). Acceleration occurs as the foot is lifted from the
floor and, during this time, the swing leg is rapidly
accelerated forward by hip and knee flexion along with
ankle dorsiflexion. Midswing occurs when the accelerat-
ing limb is aligned with the stance limb. Terminal swing
then occurs as the decelerating leg prepares for contact
with the floor and is controlled by the hamstring
muscles.
Determinants of Gait and Energy Conservation
During gait, three main events occur in which
energy is consumed. This includes controlling forward
i

2
RRDS Gait Analysis in the Science of Rehabilitation
LA I LO I I AARIGHT LEFT LEFT RIGHT RIGHT LEFTINITIAL PRE-SWING INITIAL PRE-SWING INITIAL PRE-SWING
CONTACT CONTACT CONTACT
Time, percent of cycle
I supportR Sin0le SUpport ~+\ Support
1 Sin9,e supp° rt “HDouble I
supportI
jo%|
15%I
45% 6p% 1Q0%
• R. Stance phase - R Swing phase
l. Swing phase -35 L. Stance phase
40% 55% lQO%
Figure 1.
Time dimensions of the gait cycle. (Reprinted, with permission, from a chapter by V.T. Inman et al., which
appeared on page 26 of Human Walking, edited by Rose and Gamble and published by Williams & Wilkins,
Baltimore, MD; 1981.)
movement during deceleration toward the end of swing
phase, shock absorption at heelstrike, and propulsion
during push off, when the center of gravity is propelled
up and forward (6,7). Muscle activity used during the
gait cycle is noted in Table 1.
A human’s center of mass (COM) is located just
anterior to the second sacral vertebra, midway between
both hip joints. The least amount of energy is required
when a body moves along a straight line, with the COMdeviating neither up nor down, nor side to side. Such a
straight line would be possible in normal gait if man's
lower limbs terminated in wheels instead of feet. This
obviously is not the case, thus, our COM deviates from
the straight line in vertical and lateral sinusoidal
displacements.
With respect to vertical displacement: the COMgoes through rhythmic upward and downward motion as
it moves forward. The highest point occurs at
midstance, the lowest point occurs at time of double
support. The average amount of vertical displacement in
the adult male is approximately 5 cm.
With respect to lateral displacements: As weight is
transferred from one leg to the other, there is shift of the
pelvis to the weight-bearing side. The oscillation of the
COM amounts to side-to-side displacement of approxi-
mately 5 cm. The lateral limits are reached at mid-
stance.
In his classic article, Inman describes the compo-
nents of gait (8). These are referred to as the six
determinants of gait (Table 2). He describes several
mechanical factors that help to flatten the arc in the
vertical and horizontal (lateral) planes reducing dis-
placement of the body’s COM and thereby reducing the
energy expenditure. The net effect is a smooth,
sinusoidal translation of the COM through space along a
path that requires the least amount of energy. Anypathology that increases the vertical distance between
the high and low points, increases the energy cost of
ambulation.
First determinant: pelvic rotation in the horizontal
plane. This allows the swinging hip to move forward
faster than the stance hip (1 -3,8,9). Pelvic rotation

3
Section One: Clinical Observation
Table 1.
Primary muscular activity during the gait cycle.
Muscular Activity Muscles Period
Shock Absorbers Quadriceps
Dorsiflexors
Weight-Loading
Stabilizers Gluteus Maximus, Medius, & Minimus
Tensor Fascia Lata
Erector Spinae
Stance-Phase
Foot Lift Off Flexor Digitorum Longus
Flexor Hallucis Longus
Gastrocnemius
Peroneus Longus and Brevis
Soleus
Tibialis Posterior
Weight-Unloading
Accelerators Adductor Longus and Magnus
Iliopsoas
Sartorius
Weight-Unloading
Foot Controllers Extensor Digitorum Longus
Extensor Hallucis Longus
Tibialis Anterior
Swing-Phase
Decelerators Gracilis
Semimembranosus
Semitendinosus
Biceps Femoris
Swing-Phase
mid-swing to initial-contact
Table 2.
Determinants of Gait.
Determinant COM Displacement Effect
First Pelvic Rotation
About the vertical axis, alternating to
the right and to the left relative to line
of progression
Decreased 4° of each side from a total
of 8°
Reduces the drop in COM during
double limb support
Energy conservation saves the COMdrop at its lowest point 6/16 inch
(elevates end or arc)
Second Pelvic Tilt
At horizontal axis at midstance
Reduces the peak of COM during
single limb support
Energy conservation by shortening the
pendulum of the leg (3/16 inch) at the
high part of arc (depresses summit arc)
Third Knee flexion in stance High point of COM further reduced
by knee flexion in midstance
Energy conservation by decreasing rise
of arc (7/16 inch) by walking over a
bent knee
(depresses summit arc)
Fourth & Fifth Foot and ankle mechanism Combination of foot and ankle motion
with knee motion smoothes the COMchange in direction
Flattens and slightly reverses arc of
translation (decreased 3/16 inch)
Sixth Lateral displacement of pelvis Must bring COM above support point
to balance on one leg
Lateral displacement of the pelvis is
largely abolished by the presence of
the tibial-femoral angle. There is a
side-to-side sway of 1 .7 inch radius
COM = Center of Mass

4
RRDS Gait Analysis in the Science of Rehabilitation
occurs anteriorly on the swinging limb and posteriorly
during midstance. It is maximal just before heelstrike
with a total motion of pelvic rotation of 3-5° to each
side. Pelvic rotation also produces a longer stride length
for the same amount of hip flexion of the advancing leg
and hip extension of the retreating leg. Thus, it allows
for longer steps without changing the COM displace-
ment significantly.
Second determinant: pelvic tilt in the frontal plane.
As the pelvis on the swing leg is lowered, the hip
abductors of the stance hip control pelvic tilt. During
normal gait, the pelvis drops 4-5° away from the stance
leg and toward the swing leg. This pelvic dip decreases
horizontal displacement of the COM during single limb
support.
Third determinant: knee flexion, which acts to
decrease vertical displacement of the COM. This occurs
during midstance, as knee flexion to approximately 15°
occurs under the control of eccentric quadriceps con-
traction and remains flexed until the foot is flat on the
ground. These first three determinants save one inch of
vertical displacement with each stride.
Fourth and Fifth determinants: involve control of
the knee-ankle-foot motion. This synchronized move-
ment results in eccentric control of plantar flexion of the
ankle and knee flexion, which occurs during the first
portion of the stance phase. These factors help to avoid
abrupt changes of the lowest portion of COM arc,
producing a smooth, sinusoidal curve instead of an
arched pattern.
Sixth determinant: lateral pelvic movement. This is
the lateral sway or side-to-side oscillation that occurs
with each step. This defines the motion of the COM in
the horizontal plane. The shifting of the pelvis occurs
over the supporting foot to provide stability during the
stance phase. The extent of sway is determined by the
base of support. Normal knee valgus between the femur
and tibia helps to reduce the amount of pelvic shifting
required for stability and allows the feet to be closer
together during forward progression.
Murray et al. (10) determined parameters of gait in
nondisabled men. They found that the mean duration of
the gait cycle was 1.03 seconds. The steps per minute
were 117 (90-120 steps) and the average comfortable
walking speed was 2.8 miles per hour. The average
stride length was 70-82 cm and the average stride width
was 8 cm, with a foot angle of 6.1°. Ostrosky et al.
compared gait characteristics in young and old subjects
and found that older people demonstrate less knee
extension and a shorter stride length compared with
younger people (5).
The clinical evaluation of gait occurs within the
context of a detailed history and physical examination.
The history may reveal complaints of pain, weakness, or
instability. In addition, it is important to know the
individual’s past medical history to be aware of
underlying neurologic or musculoskeletal problems. The
examination must include a detailed musculoskeletal
and neurologic examination. It must address an evalua-
tion of the person’s muscle strength, joint range of
motion, tone, and proprioception. The musculoskeletal
examination should include, at a minimum, the joint
above and below the area of complaint. The entire
kinetic chain, which includes the spine and the upper
limb, should be considered. The history and physical are
helpful in focusing the differential diagnosis of the
complaint. The observation and evaluation of gait can
occur either before or after the physical examination
and is included as a part of the physical examination. It
is the authors’ preference to evaluate the individual’s
gait after a detailed history and physical examination.
Figure 2 and Table 3 summarize the main muscle
actions and their timing during the gait cycle.
GAIT ANALYSIS
The observation of gait begins with a general
assessment, noting symmetry and smoothness of move-
ments of the various body parts (Table 4). The clinician
should take note of the cadence (steps/minute), base
width, stride length, arm swing, movement of the trunk,
and rise of the body. The observer must then look at the
individual segments of the kinetic chain as the subject
ambulates, including the head, shoulders, arms, trunk,
pelvis, hips, knees, ankles, and feet. Specifically, the
clinician examines the head position, whether the
shoulders are depressed, elevated, protracted, or re-
tracted. The amount of arm swing can be categorized as
normal, increased, or decreased. The trunk may have a
forward or backward lurch or a list to the right or left.
The pelvis may be hiked, level, dropped, or fixed. The
hip may demonstrate increased extension, flexion,
rotation, circumduction, or an adducted or abducted
posture. The knee is observed for proper flexion,
extension, and general stability in the various phases of
the gait cycle. The ankle is examined for plantarflexion
and dorsiflexion, as well as eversion and inversion.
5
Section One: Clinical Observation
HeelJ
/
Strike no
Gluteus Maximus
Vastus Medialis
Tibialis Posterior
Soleus
Flexor Digitorum
Longus
Flexor Hallicus Longus
Gastrocnemius (Lateral He,
Peroneus Longus
Peroneus Brevis
Stance Phase
-19-23-26-29^ 37-
Percentage of Walking Cycle 10
Extends ssmi : i :
Flexes''' "\ Extends |ll|f§ Flexes
l 1 J
1 T1 pLsI
" ' Dorsiflexes PI. Flexes|
Swing Phase
30 40 50 Toe-off 70 90
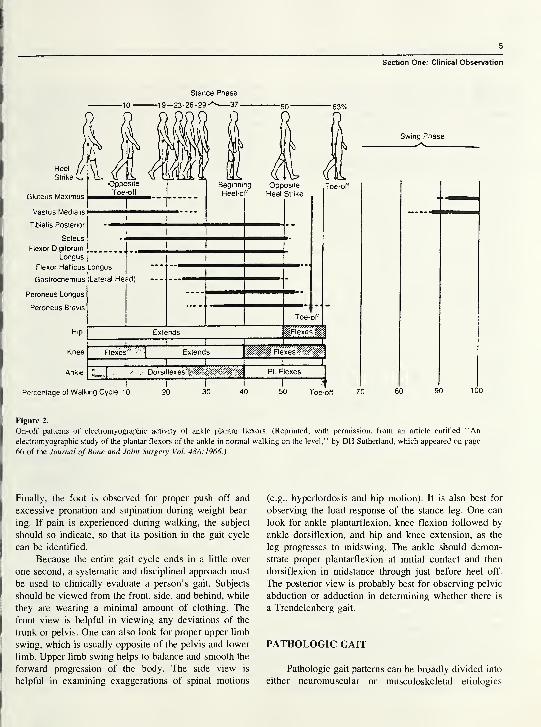
Figure 2.
On-off patterns of electromyographic activity of ankle plantar flexors. (Reprinted, with permission, from an article entitled “An
electromyographic study of the plantar flexors of the ankle in normal walking on the level,” by DH Sutherland, which appeared on page
66 of the Journal of Bone and Joint Surgery Vol. 48A.1966.)
Finally, the foot is observed for proper push off and
excessive pronation and supination during weight bear-
ing. If pain is experienced during walking, the subject
should so indicate, so that its position in the gait cycle
can be identified.
Because the entire gait cycle ends in a little over
one second, a systematic and disciplined approach must
be used to clinically evaluate a person’s gait. Subjects
should be viewed from the front, side, and behind, while
they are wearing a minimal amount of clothing. The
front view is helpful in viewing any deviations of the
trunk or pelvis. One can also look for proper upper limb
swing, which is usually opposite of the pelvis and lower
limb. Upper limb swing helps to balance and smooth the
forward progression of the body. The side view is
helpful in examining exaggerations of spinal motions
(e.g., hyperlordosis and hip motion). It is also best for
observing the load response of the stance leg. One can
look for ankle plantarflexion, knee flexion followed by
ankle dorsiflexion, and hip and knee extension, as the
leg progresses to midswing. The ankle should demon-
strate proper plantarflexion at initial contact and then
dorsiflexion in midstance through just before heel off.
The posterior view is probably best for observing pelvic
abduction or adduction in determining whether there is
a Trendelenberg gait.
PATHOLOGIC GAIT
Pathologic gait patterns can be broadly divided into
either neuromuscular or musculoskeletal etiologies

RRDS Gait Analysis in the Science of Rehabilitation
Table 3.
Main muscle function for unimpaired ambulation.
Muscle Gait Cycle Function
Gastrocnemius and soleus Midstance to heelstrike
Gluteus maximus Heelstrike to midstance
Gluteus medius and minimus Heelstrike to toe off
Hamstrings Midswing to heelstrike
Iliopsoas and adductors Toe off to midswing
Quadriceps Heelstrike to midstance
Toe off to midswing
Tibialis anterior and peroneals Heelstrike to foot flat
Toe off to heelstrike
Table 4.
Gait: Major points of observation.
1 . Cadence
a. Symmetrical
b. Rhythmic
6. Pelvic
a. Anterior or posterior tilt
b. Hike
c. Level
2. Pain
a. Where
b. When
7. Knee
a. Flexion, extension
b. Stability
3. Stride
a. Even/uneven
8. Ankle
a. Dorsiflexion
b. Everison, inversion
4. Shoulders
a. Dipping
b. Elevated, depressed,
protracted, retracted
9. Foot
a. Heelstrike
b. Push off
5. Trunk
a. Fixed deviation
b. Lurch
10. Base
a. Stable/variable
b. Wide/narrow
(3,5,1 1,12). Gait deviations may be a result of structural
abnormalities of the bone, joints, or soft tissue. Limita-
tions of lower limb joint mechanisms will usually be
compensated by increased motion at the joints above
and below (12). Other general causes of pathologic gait
include neuromuscular and myopathic conditions or
painful segments of the lower limb kinetic chain.
Generally, as the efficiency of the gait pattern is
reduced, the energy expenditure is increased.
Common Musculoskeletal Causes of Pathologic Gait
Hip Pathology
Osteoarthritis is the most common abnormality of
the hip resulting in gait abnormalities. The first changes
noted are diminished hip range of motion especially in
internal rotation and flexion. This often results in
exaggerated compensatory motion in the lumbar spine
and the opposite unaffected hip. In severely restricted
hip joints, there will be a reduction in hip flexion in the
swing phase and in hip extension during the stance
phase. These restrictions will be somewhat compensated
by other joints (e.g., hip hiking on the unaffected side or
“tiptoeing” on the affected side).
The antalgic gait is the most common pattern seen
in individuals with a painful hip. This is characterized
by avoidance of weight bearing on the affected side and
a decrease in the stance phase on that limb in an attempt
to unload the mechanical stresses on the painful hip
joint. In addition, a trunk lurch toward the painful hip of
the stance leg brings the COM over the joint and
decreases the mechanical stress across the joint. This is
done by dipping the shoulder on the affected side,
elevating the opposite shoulder and shifting the pelvis
over the stance leg during the stance phase of the gait
cycle. During the swing phase, the hip is slightly flexed,
externally rotated, and abducted in order to relax the
joint capsule and ligaments to reduce joint tension.
Heelstrike tends to be avoided in persons with a painful
hip in order to prevent jarring and excess loading of the
joint.
Knee Pathology
In general, a painful knee is maintained in slight
flexion throughout the gait cycle. This is especially true
if there is an intra-articular effusion, as slight flexion
reduces the tension on the knee joint capsule (12).
Compensation for knee flexion involves the avoidance
of heelstrike and toe walking on the affected side. This
type of antalgic gait may result from any painful
condition of the knee joint including a meniscal tear,
loose body, fracture, infection, or inflammatory
synovitis.
Ligamentous instability of the knee can result in
variable gait presentations depending on the liga-
ment involved. The most common gait pattern seen
in ligamentous laxity, hyperextension, or “recurva-
tum,” is a result of a loss of muscular control of the
knee secondary to various neuromuscular problems.
In these cases, the knee must rely on the static
stabilizers (i.e., the ligaments and joint capsule), which
become stretched and lax over time. During the stance
phase of the gait cycle, the knee hyperextends, which,
over time, leads to degenerative changes of the knee
joint.
7
Section One: Clinical Observation
Another abnormal gait pattern associated with
instability of the knee ligaments is the varus thrust gait
pattern seen in persons with injuries of the posterior-
lateral comer of the knee. These injuries usually involve
a combined injury to the posterior cruciate ligament,
lateral collateral ligament, posterior joint capsule, and
the popliteus tendon. The combined injuries, can lead to
significant functional impairment requiring reconstruc-
tive surgery. The gait pattern seen in these people is
characterized by varus thrust, which occurs at the knee
during the stance phase of gait. They should be
differentiated from isolated injuries of the lateral
collateral or posterior cruciate ligaments, which gener-
ally have a good prognosis with nonoperative treatment.
The quadriceps avoidance gait occurs in those whohave suffered an injury to their anterior cruciate
ligament (ACL). The quadriceps muscle provides an
anterior force to the tibia, which becomes a problem in
someone with an ACL deficiency, as the tibia is prone
to anterior subluxation. The person will attempt to
decrease the load response phase on the affected limb
by decreasing the stride length and avoiding knee
flexion during the mid-portion of stance (13,14).
Knee-joint contractures will also lead to abnormal
gait patterns. A flexion contraction of the knee will
cause signs of a short leg limp. A flexion contracture of
less than 30° becomes more pronounced with faster
walking speeds, while contractures of more than 30° are
apparent with normal walking speeds (12). The gait is
characterized by toe walking on the affected side and a
steppage gait or hip hiking on the unaffected side.
Foot and Ankle Pathology
Painful conditions of the foot and ankle from
trauma, inflammatory disorders, degenerative arthritis,
and so forth, will result in an antalgic gait pattern. There
will be an attempt to limit weight bearing through the
affected area. The stride length will be greatly shortened
and normal heel-to-toe motion will be lost. If the
problem involves the forefoot, the person will tend to
avoid plantarflexion and toe off. If the problem involves
the ankle or hindfoot, then the person will avoid
heelstrike at initial contact and will ambulate with a
tiptoeing gait on the affected side with compensations
on the unaffected side.
People with ankle instability will have great
difficulty with supporting body weight during initial
contact on the stance leg. At contact, the unstable ankle
will often buckle with a resultant antalgic gait limiting
the load response phase on the affected side.
Joint contractures of the ankle are often seen after
trauma, immobilization, and neurologic problems affect-
ing the muscles of the ankle and foot. The most
common contracture seen in clinical practice is
contracture of the gastrocsoleus complex or “heel
cord.” A tight or contracted heel cord will result in a
steppage type gait pattern. There will be a loss of
normal heel contact and heel-to-toe motion, along with
exaggerated hip and knee flexion during the swing
phase in order to clear the toe. In long-standing
contracture, hyperextension of the ipsilateral knee mayoccur as plantarflexion at the ankle causes an extension
moment at the knee.
Problems of the hindfoot, particularly of the
calcaneus, will produce a similar gait pattern (e.g.,
elimination of heelstrike and a promotion of toe contact
during stance). These problems include calcaneal frac-
tures, plantar fasciitis, stress fractures of the ankle or
calcaneus, and so forth. An antalgic or avoidance gait
with a decrease in the loading of the heel is the typical
pattern. In contrast, problems of the forefoot (sprain,
fracture, arthritis, metatarsalgia, etc.) will result in an
antalgic gait, which minimizes loading on the forefoot
by decreasing plantarflexion during the stance phase
and push off. People with these problems will tend to
increase loading to the heel and hindfoot, and shorten
the time of forefoot loading.
Leg Length Discrepancy
Leg length discrepancy can be the result of various
factors affecting any segment of the kinetic chain
including scoliosis and contracture of the hip, knee, and
ankle, and is termed a “relative” leg length discrep-
ancy. A true leg length discrepancy is the result of
asymmetry in length of the pelvis, femur, or tibia. In
either case, a leg length discrepancy can result in pelvic
obliquity with a drop of the pelvis, decreased hip and
knee flexion, ankle plantarflexion, and/or hyperprona-
tion, which all occur ipsilateral to the shortened side. It
is important to determine the etiology of the leg length
discrepancy and to properly treat the underlying cause
rather than treating all leg length discrepancy with a
heel lift. In leg length discrepancy of less than 1 .27 cmduring the entire stance phase, one sees dipping of the
shoulder on the affected side and a compensatory pelvic
drop. There is an apparent elevation of the shoulder on
the opposite (swing side) and an exaggerated flexion of
the hip, knee and ankle on the ipsilateral side. For
shortening more than 3.81 cm, he or she will walk on

RRDS Gait Analysis in the Science of Rehabilitation
tiptoes on the shortened limb during the stance phase
with full knee extension.
Neurologic Causes of Abnormal Gait
Any dysfunction of the central nervous system,
spinal cord, peripheral nerve(s), or muscle(s) can result
in an abnormal gait (2,3,12). It is important to know the
segmental innervation of the trunk and lower limbs to
evaluate for abnormal gait patterns, particularly the
peripheral nerve innervation of each muscle and region.
In addition, neurologic injury may result in changes in
motor tone and control. The more common disease
problems leading to pathologic gait will be reviewed.
Hemiplegic Gait
Cerebrovascular injuries commonly result in vari-
ous gait abnormalities, the most common of which is
the hemiplegic gait. It is characterized by abnormal arm
swing with the arm carried in adduction with flexion at
the shoulder, elbow, wrist, and fingers. Also, in manypeople, there is an extensor synergy of the affected
lower limb, consisting of extension, adduction, and
internal rotation at the hip, extension at the knee, and
plantarflexion and inversion of the ankle and foot. This
synergy pattern is often initiated by weight bearing over
the involved limb and can be useful in supporting the
subject. The hemiplegic gait tends to be quite slow with
a decrease in step length and an increase in the stance
phase with circumduction to allow toe clearance.
Compensatory changes include hip hiking from lack of
knee flexion of the stance leg, a decreased lateral shift
over the affected side, a lack of heelstrike secondary to
the plantarflexion of the ankle, and recurvatum of the
affected knee. The extension moment at the knee is
created by the plantar flexion moment occurring at the
ankle. Swing phase is characterized by an absent or
markedly reduced knee flexion due to quadriceps
spasticity. The flexor synergy gait occurs less com-
monly and consists of hip flexion, abduction and
external rotation, knee flexion, and ankle dorsiflexion.
This synergy pattern does not allow the person to stand,
thereby eliminating ambulation potential.
Spastic Gait
A spastic gait can develop from an insult to the
central nervous system that affects motor tone, particu-
larly of the lower limbs. This can result in “scissoring”
of the lower limbs from over-activity of the hip
adductors and a narrow, crossing base. There is
associated tiptoeing to maintain balance and great effort
is exerted to swing the legs forward, all of which create
an unsteady fatiguing gait. In addition, isolated muscles
or muscle groups may develop increased tone and
spasticity. For example, spasticity of the tibialis poste-
rior, a powerful plantarflexor and inverter of the foot,
causes significant changes in gait during both the stance
and swing phases. During stance phase, the initial
contact will occur on the lateral aspect of the foot and
plantar flexion at the ankle results in an extension
moment at the knee. Plantarflexion will also result in a
relative lengthening of the limb; often causing dragging
of the toes and requiring increased hip and knee flexion.
Parkinsonian Gait
Parkinson’s disease results from lesions of the
basal ganglia affecting motor control and function
bilaterally. It is characterized by a paucity of movement
of the facial, trunk, and upper and lower limb muscles.
This results in a gait that is slow and shuffling with
short rapid steps described as being festinating. The
trunk is flexed forward and the person may have
difficulties with stops and turns, appearing to chase after
his or her COM (12). Joint motion is reduced due to
rigidity and there is usually little or no arm swing to
help in balancing the individual, with falls being a
common result.
Ataxic Gait
Injury to the cerebellum or its pathways maydisrupt the normal coordination and precision of motor
function. The gait of these individuals will be unsteady
and associated with a broad standing base and a
lurching or staggering of the trunk and lower limbs.
Movements are uncoordinated and appear exaggerated
(4). Leg placement will be variable and reproducibility
is lost. An ataxic gait may also be seen in persons with
sensory deficits of the lower limb. In these people, the
base is wide, and there may be slapping of their feet as
they hit the ground. In addition, these individuals will
tend to look at their feet due to the lack of propriocep-
tive feedback and, therefore, have more problems at
night or in the dark.
Isolated Motor Weakness Gait Problems
Gluteus Maximus (Lurch) Gait
The gluteus maximus, a major hip extensor and
stabilizer of the trunk, prevents the trunk from falling
forward as the COM moves forward at heelstrike. In
weakness of the gluteus maximus, the hip is supported
by the ligament of Bigelow, which becomes taut in
9
Section One: Clinical Observation
hyperextension. The individual will throw the hip
backward with a “lurch” using abdominal and
paraspinal muscle activation just after heelstrike on the
affected side. The backward trunk lurch persists
throughout stance to maintain the gravitational force
line behind the hip axis locking the hip in extension.
There is an apparent forward protrusion of the affected
hip due to the exaggerated trunk motion and the person
may also hold the shoulders backward to keep the
center of gravity behind the hip joint. The hamstring
muscles will often compensate for isolated gluteus
maximus weakness resulting in a near normal gait
pattern; however, these muscles are often affected
together (e.g., in S-l radiculopathy).
Gluteus Medius (Trendelenberg) Gait, Uncompensated
or Compensated
In uncompensated gluteus medius weakness, there
is a drop of the pelvis more than the usual 5° on the
unaffected side beginning with heelstrike on the af-
fected side and continuing until heelstrike on the
unaffected side. There is also a lateral protrusion of the
affected hip. In compensated gluteus medius gait due to
severe or total paralysis of the hip abductors, the pelvic
drop appears to be less as the subject laterally bends the
trunk over the hip and drops the shoulder on the
affected side. This serves to keep the center of gravity
over the hip, which decreases the muscle force required
to stabilize the pelvis. With both compensated and
uncompensated gait, because the affected leg becomes
functionally longer, there is an increase in hip and knee
flexion and ankle dorsiflexion. This steppage gait allows
for toe clearance.
Hip Flexor Weakness
Hip flexors are the major accelerators in the swing
phase of gait. Weakness of the hip flexors results in a
limp starting during the stance phase of gait at push off
persisting throughout the swing phase of the affected
side. The subject will demonstrate a trunk lurch
backward and toward the unaffected side from push off
to midswing. This results in locking of the hip joint on
its ligaments, with further extension of the trunk as a
unit from push off to midswing carrying the affected leg
forward. The inertia generated from trunk and hip
activity carries the limb into flexion. The stride thus
becomes shortened on the affected side.
Quadriceps Weakness
Weakness of the quadriceps is most apparent
during heelstrike through the stance phase of gait.
However, the limp affects all phases of the gait cycle.
The affected knee must be locked in hyperextension at
or preceding heelstrike by compensatory activity of the
gluteus maximus extending the femur and the soleus,
which extends the tibia. Extension at the femur results
in flexion of the trunk and an extension moment at the
knee. Some people place their hand on their thigh at
heelstrike and stance to assist the knee into this
extended position. With rapid walking, the affected leg
lags during swing phase resulting in excessive heel rise.
Repetitive hyperextension of the knee results in stretch-
ing of the ligaments and capsule of the knee and
resultant recurvatum of the knee during the stance
phase.
Ankle Dorsiflexor Weakness (Drop Foot, Slap Foot, or
Steppage Gait)
With mild weakness, the gait abnormality will be
noted at heelstrike and results in loss of plantarflexion
control. Heelstrike to foot-flat phase occurs rapidly and
the foot may slap at heelstrike, as eccentric control of
the dorsiflexors is decreased. In severe weakness or
paralysis, the foot will fall into plantarflexion during
swing phase, presenting as a footdrop. Heelstrike is
absent and the person comes down with the toes first or
with the entire foot. This will cause a relative lengthen-
ing of the limb, compensated for by exaggerated hip and
knee flexion to allow for toe clearance (steppage gait).
Gastrocsoleus Weakness
Gastrocsoleus weakness results in loss of ankle
dorsiflexion control. Heel off will be delayed and the
push off phase will be decreased. This results in a lag of
forward movement of the pelvis on the unaffected side
at the time of heelstrike and on the affected side during
push off. There will be a shortening of the stride on the
unaffected side due to the delay of forward movementof the ipsilateral hip. Altered ground reactive forces lead
to a flexion moment behind the knee, which can result
in knee buckling (10).
CONCLUSION
The ability to walk upright is a key functional
activity which, when performed abnormally, impacts
adversely on activities of daily living. The clinical
evaluation of gait abnormalities, performed in conjunc-
tion with a thorough history and physical examination,
is an important undertaking. These gait abnormalities
10
RRDS Gait Analysis in the Science of Rehabilitation
result from various neuromusculoskeletal disorders and
can often be detected during the screening evaluation.
Making the proper diagnosis is important in allowing
for appropriate rehabilitation and/or orthotic strategies.
Occasionally, for managing complicated spasticity or
for determining surgical correction, a formal gait
laboratory evaluation may be necessary.
REFERENCES
1. Lehmann JF, de Lateur BJ, Price R. Biomechanics of normal
gait. Phys Med Rehabil Clin North Am 1992;3:125-38.
2. Magee DJ. Orthopedic physical assessment, 3rd ed. Philadel-
phia: W.B. Saunders; 1997.
3. Schneck C. Normal and abnormal gait. Ninth Annual Review
Course in Physical Medicine and Rehabilitation, 1998, March
6-15, West Orange, NJ. West Orange; NJ: Kessler Institute
for Rehabilitation, p. 2-1 to 2-9.
4. Lehmann JF, Condon SM, de Lateur BJ, Smith JC. Gait
abnormalities in tibial nerve paralysis: a biomechanical study.
Arch Phys Med Rehabil 1985;66:80-5.
5. Ostrosky KM, VanSwearingen JM, Burdett RG, Gee Z. Acomparison of gait characteristics in young and old subjects.
Phys Ther 1994;74:637-46.
6. Klopsteg PE, Wilson PD, editors. Human limbs and their
substitutes. New York: McGraw-Hill; 1954.
7. Inman VT. Conservation of energy in ambulation. Arch Phys
Med Rehabil 1967;47:484-8.
8. Inman VT. Human locomotion. Can Med Assoc J
1966;94:1047-54.
9. Saunders JB, Inman VT, Eberhart HD. The major determi-
nants in normal and pathological gait. J Bone Joint Surg
1953;35A:543-58.
10. Murray MP, Drought AB, Kory RC. Walking patterns of
normal men. J Bone Joint Surg 1964;46:335-60.
1 1 . Gyory AN. Chao EYS, Stauffer RN. Functional evaluation of
normal and pathologic knees during gait. Arch Phys MedRehabil 1976;57:571-7.
12. Lehmann JF, de Lateur BJ, Price R. Biomechanics of
abnormal gait. Phys Med Rehabil Clin North Am 1 992;3: 1 25—
38.
13. Andriacchi TP. Dynamics of pathological motion: applied to
the anterior cruciate deficient knee. J Biomech 1990;23 (Suppl
1 ):99— 1 05.
14. Berchuck M, Andriacchi TP, Bach BR, Reider B. Gait
adaptations by patients who have a deficient anterior cruciate
ligament. J Bone Joint Surg Am 1 990;72A:87 1—7.
GERARD MALANGA, M.D. is currently an Assistant Professor in
the Department of Physical Medicine and Rehabilitation at the
University of Medicine and Dentistry-New Jersey Medical School.
Newark, NJ, and is Director of Spine and Occupational Medicine
at Kessler Institute for Rehabilitation. After undergraduate training.
Dr. Malanga attended UMDNJ-New Jersey Medical School and
completed his residency training in physical medicine and rehabil-
itation. He then completed a Fellowship in Sports Medicine at
Mayo Clinic. He was Senior Associate Consultant and Assistant
Professor at Mayo Clinic from 1993 through 1996. Dr. Malanga
has authored and co-authored a number of publications regarding
various topics in musculoskeletal medicine, ranging from fine
wire EMG analysis of rotator cuff muscles to injuries occurring from
in-line skating. He continues to have research interests regard-
ing outcomes in musculoskeletal problems as well as a non-opera-
tive treatment of shoulder injuries. Dr. Malanga has lectured on
a local and national level at numerous meetings and continues to
be active in the teaching of medical students, residents, and fel-
lows.
JOEL A. DELISA, M.D. is Professor and Chairman of the
Department of Physical Medicine and Rehabilitation at UMDNJ-New Jersey Medical School. He is also the President of Kessler
Medical Rehabilitation Research and Education Corporation, as
well as Senior Vice President and Chief Medical Officer of the
Kessler Rehabilitation Corporation. He earned his medical degree
from the University of Washington and completed his physical
medicine and rehabilitation residency at that institution. He is the
editor-in-chief of Rehabilitation Medicine: Principles and Practice,
which is in its third edition and he has published over 100 articles
and about 50 books and chapters. He is the past president of the
American Association of Electrodiagnostic Medicine, the American
Paraplegia Society, and the Association of Academic Physiatrists.
He is very active in undergraduate, graduate, and continuing medical
education.

SECTION TWO
i
I
Instrumented Gait Analysis Systems
by Ernest L. Bontrager, MS
Mr. Bontrager is Associate Director of Engineering Research in the Pathokinesiology Service at Rancho Los Amigos
Medical Center in Downey, California.
INTRODUCTION
The measurement of human gait has come a long
way in the past 40 years. Modern gait analysis started
with the work of Inman and Eberhart (1-3) in the 1950s
and became a useful clinical tool through the pioneering
efforts of Perry (4-7) and Sutherland (8,9). These
pioneers were able to show the clinical value of relating
muscle function to joint motion and phases of the gait
cycle, which resulted in surgical procedures to improve
the gait of those suffering from spastic paralysis and
other neuromuscular disorders.
That these early researchers obtained clinically
useful results is all the more amazing when one
considers the basic instrumentation available to them.
Most of the instruments were pieced together from
various sources (10) and/or developed “in house.” Joint
motion was measured from custom-made electrogoni-
ometers or laboriously digitized by hand from motion
picture films (9). Raw electromyography (EMG) was
recorded on analog tape recorders and displayed with
footswitch timing information on “Visicorder” strip
charts. Hand measurement of footswitch timing from
these records was used to calculate temporal gait
parameters. A roomfull of strip chart albums at the
Pathokinesiology Laboratory of Rancho Los Amigos
Medical Center testifies that, with proper dedication and
effort, a lot can be done with less than optimal tools.
The computer age has brought with it a much
brighter picture for today’s clinician who wishes to
perform clinical gait analyses. From relatively inexpen-
sive devices to very costly systems, the necessary tools
are readily available to equip a modern gait lab. The
large number of vendors provides many options from
which to choose when selecting gait instrumentation
(Table 1). Unfortunately, with all these suppliers,
confusion can arise as to how to spend gait instrumenta-
tion dollars.
The purpose of this article is to provide informa-
tion on the types of gait instrumentation that are
commercially available and give some criteria for
selecting the appropriate instrumentation. Also included
are unique and/or key features of each manufacturer’s
products. This will not be a “Consumer Report” type
of article, as I have not used or tested all the instruments
reported here. Instead, this report is based on myunderstanding of gait instrumentation in general, the
material provided to me by the manufacturers, and
personal communication with other engineers and users
of these systems.
PICTURE VIDEO
Techniques have been developed to enable a
trained observer to make critical judgments about an
individual’s gait, by viewing a video recording of the
person walking (11). Hence, one of the simplest pieces
of gait instrumentation also is one of the most useful. Apicture video system allows the clinician to record a
person’s gait prior to applying any instrumentation
(EMG electrodes, footswitches, motion markers, and so
forth) that might alter the gait patterns. It provides
visual documentation of what occurred during the
instrumented tests and is the only way of resolving
differences when the recorded footswitches or motion
data do not correspond to the clinician’s visual image of
the subject.
ii
12
RRDS Gait Analysis in the Science of Rehabilitation
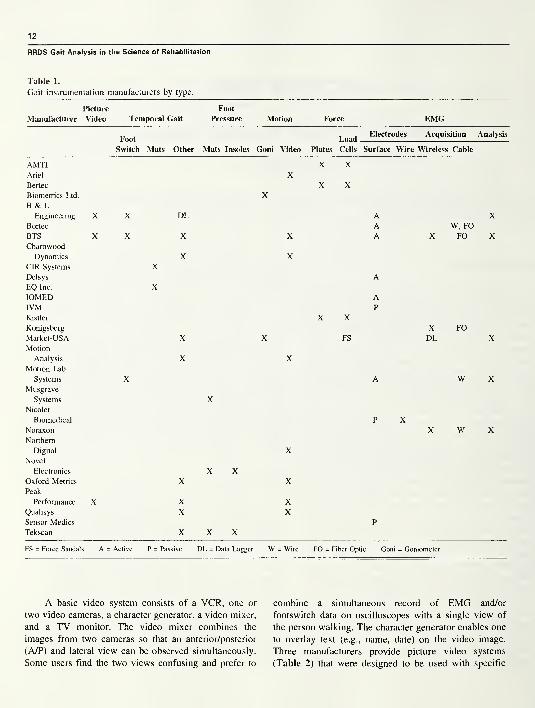
Table 1.
Gait instrumentation manufacturers by type.
Picture Foot
Manufacturer Video Temporal Gait Pressure Motion Force EMG
Foot LoadElectrodes Acquisition Analysis
Switch Mats Other Mats Insoles Goni Video Plates; Cells Surface Wire Wireless Cable
AMTIAriel X
X X
Bertec
Biometrics Ltd.
B & LX
X X
Engineering X X DL A XBortec A W, FOBTSCharnwood
X X X X A X FO X
Dynamics X XCIR Systems
Delsys
XA
EQ Inc.
IOMEDX
AIVMKistler
Konigsberg
X XP
X FOMarket-USA
Motion
X X FS DL X
Analysis
Motion Lab
Systems
Musgrave
Systems
Nicolet
X
X
X
X
A W X
Biomedical
Noraxon
Northern
P XX W X
Digital XNovel
Electronics
Oxford Metrics
Peak
XX X
X
Performance X X XQualisys
Sensor Medics
X XP
Tekscan X X X
FS = Force Sandal s A = Active P = Passive DL = Data Logger W = Wire FO = Fiber Optic Goni = Goniometer
A basic video system consists of a VCR, one or
two video cameras, a character generator, a video mixer,
and a TV monitor. The video mixer combines the
images from two cameras so that an anterior/posterior
(A/P) and lateral view can be observed simultaneously.
Some users find the two views confusing and prefer to
combine a simultaneous record of EMG and/or
footswitch data on oscilloscopes with a single view of
the person walking. The character generator enables one
to overlay text (e.g., name, date) on the video image.
Three manufacturers provide picture video systems
(Table 2) that were designed to be used with specific
13
Section Two: Instrumented Gait Analysis
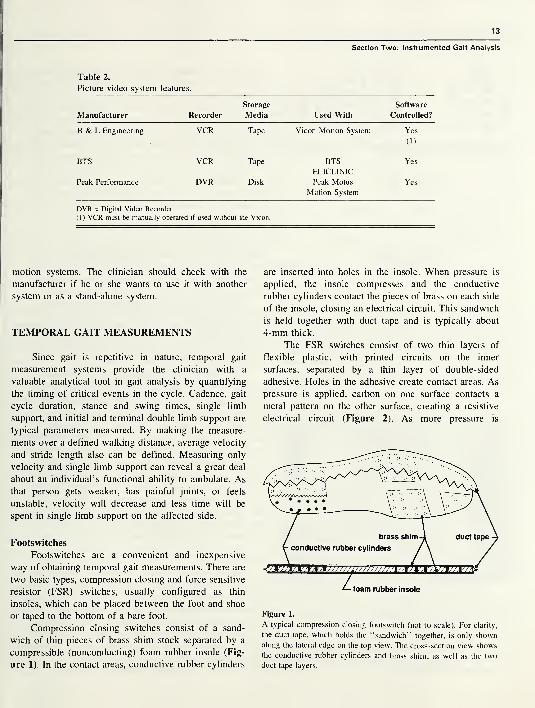
Table 2.
Picture video system features.
Storage Software
Manufacturer Recorder Media Used With Controlled?
B & L Engineering VCR Tape Vicon Motion System Yes
(1)
BTS VCR Tape BTS Yes
ELICLINIC
Peak Performance DVR Disk Peak Motus Yes
Motion System
DVR = Digital Video Recorder
(1) VCR must be manually operated if used without the Vicon.
motion systems. The clinician should check with the
manufacturer if he or she wants to use it with another
system or as a stand-alone system.
TEMPORAL GAIT MEASUREMENTS
Since gait is repetitive in nature, temporal gait
measurement systems provide the clinician with a
valuable analytical tool in gait analysis by quantifying
the timing of critical events in the cycle. Cadence, gait
cycle duration, stance and swing times, single limb
support, and initial and terminal double limb support are
typical parameters measured. By making the measure-
ments over a defined walking distance, average velocity
and stride length also can be defined. Measuring only
velocity and single limb support can reveal a great deal
about an individual’s functional ability to ambulate. As
that person gets weaker, has painful joints, or feels
unstable, velocity will decrease and less time will be
spent in single limb support on the affected side.
Footswitches
Footswitches are a convenient and inexpensive
way of obtaining temporal gait measurements. There are
two basic types, compression closing and force sensitive
resistor (FSR) switches, usually configured as thin
insoles, which can be placed between the foot and shoe
or taped to the bottom of a bare foot.
Compression closing switches consist of a sand-
wich of thin pieces of brass shim stock separated by a
compressible (nonconducting) foam rubber insole (Fig-
ure 1). In the contact areas, conductive rubber cylinders
are inserted into holes in the insole. When pressure is
applied, the insole compresses and the conductive
rubber cylinders contact the pieces of brass on each side
of the insole, closing an electrical circuit. This sandwich
is held together with duct tape and is typically about
4-mm thick.
The FSR switches consist of two thin layers of
flexible plastic, with printed circuits on the inner
surfaces, separated by a thin layer of double-sided
adhesive. Holes in the adhesive create contact areas. As
pressure is applied, carbon on one surface contacts a
metal pattern on the other surface, creating a resistive
electrical circuit (Figure 2). As more pressure is
Figure 1.
A typical compression closing footswitch (not to scale). For clarity,
the duct tape, which holds the “sandwich” together, is only shown
along the lateral edge on the top view. The cross-section view shows
the conductive rubber cylinders and brass shim, as well as the two
duct tape layers.
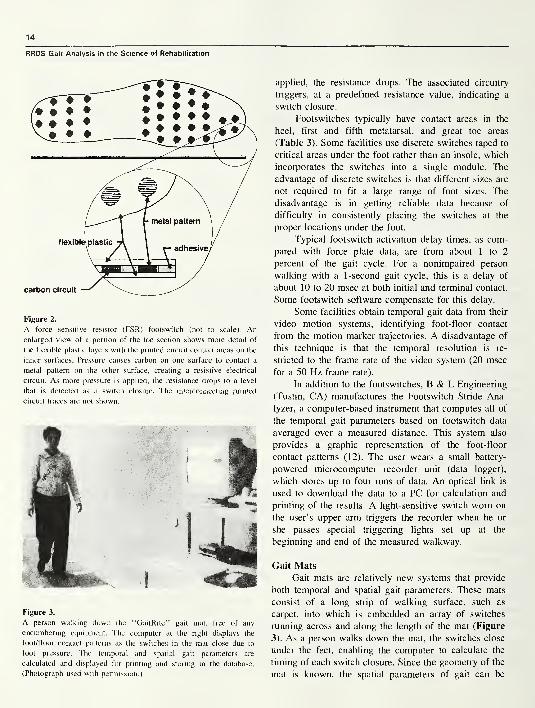
14
RRDS Gait Analysis in the Science of Rehabilitation
Figure 2.
A force sensitive resistor (FSR) footswitch (not to scale). Anenlarged view of a portion of the toe section shows more detail of
the flexible plastic layers with the printed circuit contact areas on the
inner surfaces. Pressure causes carbon on one surface to contact a
metal pattern on the other surface, creating a resistive electrical
circuit. As more pressure is applied, the resistance drops to a level
that is detected as a switch closure. The interconnecting printed
circuit traces are not shown.
Figure 3.
A person walking down the “GaitRite” gait mat, free of any
encumbering equipment. The computer at the right displays the
foot/floor contact patterns as the switches in the mat close due to
foot pressure. The temporal and spatial gait parameters are
calculated and displayed for printing and storing in the database.
(Photograph used with permission.)
applied, the resistance drops. The associated circuitry
triggers, at a predefined resistance value, indicating a
switch closure.
Footswitches typically have contact areas in the
heel, first and fifth metatarsal, and great toe areas
(Table 3). Some facilities use discrete switches taped to
critical areas under the foot rather than an insole, which
incorporates the switches into a single module. The
advantage of discrete switches is that different sizes are
not required to fit a large range of foot sizes. The
disadvantage is in getting reliable data because of
difficulty in consistently placing the switches at the
proper locations under the foot.
Typical footswitch activation delay times, as com-
pared with force plate data, are from about 1 to 2
percent of the gait cycle. For a nonimpaired person
walking with a 1 -second gait cycle, this is a delay of
about 10 to 20 msec at both initial and terminal contact.
Some footswitch software compensate for this delay.
Some facilities obtain temporal gait data from their
video motion systems, identifying foot-floor contact
from the motion marker trajectories. A disadvantage of
this technique is that the temporal resolution is re-
stricted to the frame rate of the video system (20 msec
for a 50 Flz frame rate).
In addition to the footswitches, B & L Engineering
(Tustin, CA) manufactures the Footswitch Stride Ana-
lyzer, a computer-based instrument that computes all of
the temporal gait parameters based on footswitch data
averaged over a measured distance. This system also
provides a graphic representation of the foot-floor
contact patterns (12). The user wears a small battery-
powered microcomputer recorder unit (data logger),
which stores up to four runs of data. An optical link is
used to download the data to a PC for calculation and
printing of the results. A light-sensitive switch worn on
the user’s upper arm triggers the recorder when he or
she passes special triggering lights set up at the
beginning and end of the measured walkway.
Gait Mats
Gait mats are relatively new systems that provide
both temporal and spatial gait parameters. These mats
consist of a long strip of walking surface, such as
carpet, into which is embedded an array of switches
running across and along the length of the mat (Figure
3). As a person walks down the mat, the switches close
under the feet, enabling the computer to calculate the
timing of each switch closure. Since the geometry of the
mat is known, the spatial parameters of gait can be

15
Section Two: Instrumented Gait Analysis
Table 3.
Footswitch features.
Manufacturer Type
Areas of
Contact
Thickness
(mm) Size
B & L Engineering Compression
Closing (Insole)
Heel
5 th Met
1st Met
Great Toe
3 All Standard
Male &Female
Sizes (1)
BTS FSR(Insole)
Heel
Lat Foot
Med Foot
2 140,191, 216
& 267 mmlong
Motion Lab Systems FSR(Discrete)
User
Selected
0.5 18 & 28 mmdia.
FSR = Force Sensitive Resistor
made to user selected sizes.
Met = Metatarsal Lat = Lateral Med = Medial (1) Can be custom
calculated. Besides step length measurements, the ad-
vantages of these systems are the elimination of any gait
encumbering attachments, low cost, and portability. The
major disadvantages are the spatial resolution due to the
finite size of the switches and the temporal resolution
due to limitations in the scan rate. Both systems (Table
4) provide an extensive database and have provisions
for editing the raw data file if desired.
FOOT PRESSURE
Capacitive and FSR transducers are the two basic
types in use today for plantar pressure measurement.
The capacitive transducers consist of two capacitor
plates separated by a compressible rubber dielectric
material. As pressure is applied, the capacitor plates are
pushed closer together resulting in increased capaci-
tance, which is calibrated in units of pressure. The FSRtransducers are fabricated in a manner similar to that
described for the FSR footswitches. As pressure is
applied to the transducer, the electrical resistance
decreases, indicating an increase in pressure. The
accuracy of these systems is dependent on the ability to
reliably calibrate them, as the transducers tend to be
nonlinear. Pneumatic pressure bladder calibration sys-
tems generally are used. Since the area of the transduc-
ers is known, the applied force can be calculated by
adding up the force computed from each active sensor
at a given point in time. These systems are valuable.
because they provide a method of quickly determining
the areas of high pressure on the plantar surface of the
foot, areas that may be subject to tissue breakdown.
Two types of systems, mats and insole devices, are
available commercially.
Pressure Mats
A pressure mat is placed in the center of the
walkway and used much like a force plate, with the
subject stepping on it as he or she walks down the
walkway. It provides a quick and easy way of obtaining
a plantar pressure picture, as nothing needs to be
attached to the individual. However, if the effects of
shoe insoles or various orthoses are to be evaluated, an
insole pressure-measuring device must be used. All
three pressure mat systems listed (Table 5) are factory
calibrated and have software that includes color pres-
sure pictures, gait lines, force and pressure versus time,
force and pressure/time integrals, and masks for detailed
analysis of selected areas of the foot.
Pressure Insoles
Pressure insoles were designed to provide the same
kind of data available from pressure mats, with the
added advantage of in-shoe measurement and multiple
cycles. Dynamic measurement of footwear and orthoses
is possible with these insoles. One can quickly and
easily compare the plantar pressure distribution with
different shoe inserts and/or orthoses. With special care,
barefoot data can also be obtained by lightly taping the
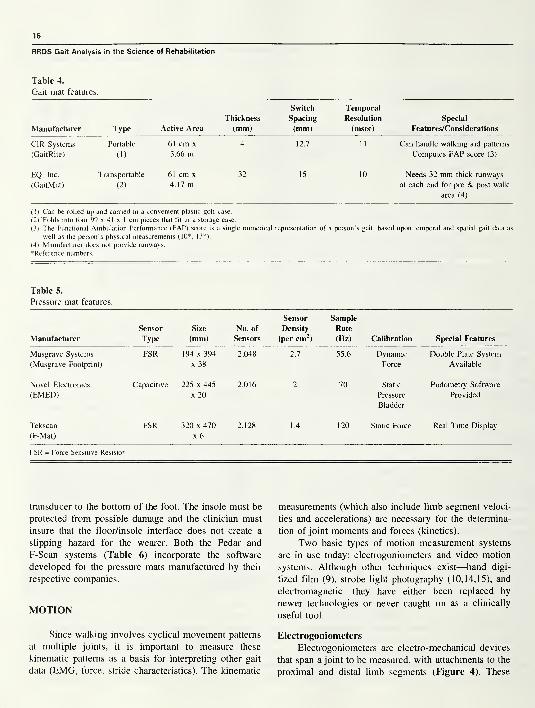
16
RRDS Gait Analysis in the Science of Rehabilitation
Table 4.
Gait mat features.
Manufacturer Type Active Area
Thickness
(mm)
Switch
Spacing
Temporal
Resolution
(msec)
Special
Features/Considerations
CIR Systems
(GaitRite)
Portable
(1)
61 cm x
3.66 m4 12.7 11 Can handle walking aid patterns
Computes FAP score (3)
EQ, Inc.
(GaitMat)
Transportable
(2)
61 cm x
4.17 m32 15 10 Needs 32 mm thick runways
at each end for pre & post walk
area (4)
(1) Can be rolled up and carried in a convenient plastic golf case.
(2) Folds into four 99 x 41 x 1 cm pieces that fit in a storage case.
(3) The Functional Ambulation Performance (FAP) score is a single numerical representation of a person’s gait, based upon temporal and spatial gait data as
well as the person’s physical measurements (10*, 13*).
(4) Manufacturer does not provide runways.
^Reference numbers.
Table 5.
Pressure mat features.
Manufacturer
Sensor
Type
Size
(mm)
No. of
Sensors
Sensor
Density
(per cm2)
Sample
Rate
(Hz) Calibration Special Features
Musgrave Systems
(Musgrave Footprint)
FSR 194 x 394
x 38
2,048 2.7 55.6 Dynamic
Force
Double Plate System
Available
Novel Electronics
(EMED)
Capacitive 225 x 445
x 20
2,016 2 70 Static
Pressure
Bladder
Podometry Software
Provided
Tekscan
(F-Mat)
FSR 320 x 470
x 6
2,128 1.4 120 Static Force Real Time Display
FSR = Force Sensitive Resistor
transducer to the bottom of the foot. The insole must be
protected from possible damage and the clinician must
insure that the floor/insole interface does not create a
slipping hazard for the wearer. Both the Pedar and
F-Scan systems (Table 6) incorporate the software
developed for the pressure mats manufactured by their
respective companies.
MOTION
Since walking involves cyclical movement patterns
at multiple joints, it is important to measure these
kinematic patterns as a basis for interpreting other gait
data (EMG, force, stride characteristics). The kinematic
measurements (which also include limb segment veloci-
ties and accelerations) are necessary for the determina-
tion of joint moments and forces (kinetics).
Two basic types of motion measurement systems
are in use today: electrogoniometers and video motion
systems. Although other techniques exist—hand digi-
tized film (9), strobe light photography (10,14,15), and
electromagnetic—they have either been replaced by
newer technologies or never caught on as a clinically
useful tool.
Electrogoniometers
Electrogoniometers are electro-mechanical devices
that span a joint to be measured, with attachments to the
proximal and distal limb segments (Figure 4). These
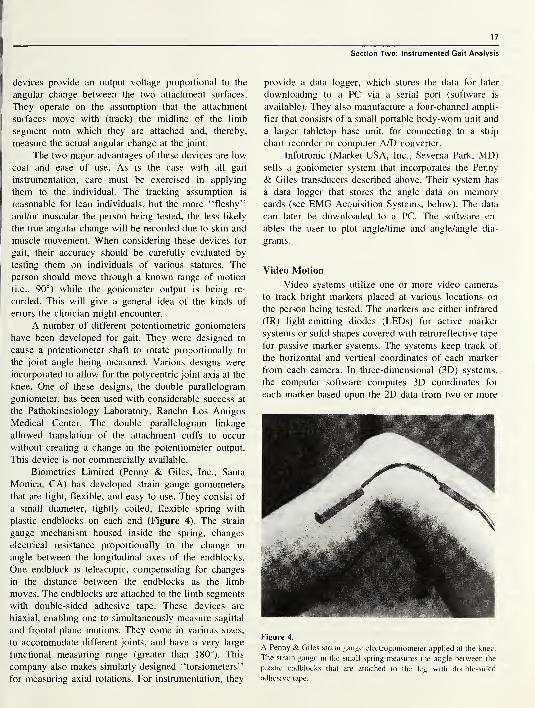
17
devices provide an output voltage proportional to the
angular change between the two attachment surfaces.
They operate on the assumption that the attachment
surfaces move with (track) the midline of the limb
segment onto which they are attached and, thereby,
measure the actual angular change at the joint.
The two major advantages of these devices are low
cost and ease of use. As is the case with all gait
instrumentation, care must be exercised in applying
them to the individual. The tracking assumption is
reasonable for lean individuals, but the more “fleshy”
and/or muscular the person being tested, the less likely
the true angular change will be recorded due to skin and
muscle movement. When considering these devices for
gait, their accuracy should be carefully evaluated by
testing them on individuals of various statures. The
person should move through a known range of motion
(i.e., 90°) while the goniometer output is being re-
corded. This will give a general idea of the kinds of
errors the clinician might encounter.
A number of different potentiometric goniometers
have been developed for gait. They were designed to
cause a potentiometer shaft to rotate proportionally to
the joint angle being measured. Various designs were
incorporated to allow for the polycentric joint axis at the
knee. One of these designs, the double parallelogram
goniometer, has been used with considerable success at
the Pathokinesiology Laboratory, Rancho Los Amigos
Medical Center. The double parallelogram linkage
allowed translation of the attachment cuffs to occur
without creating a change in the potentiometer output.
This device is not commercially available.
Biometrics Limited (Penny & Giles, Inc., Santa
Monica, CA) has developed strain gauge goniometers
that are light, flexible, and easy to use. They consist of
a small diameter, tightly coiled, flexible spring with
plastic endblocks on each end (Figure 4). The strain
gauge mechanism housed inside the spring, changes
electrical resistance proportionally to the change in
angle between the longitudinal axes of the endblocks.
One endblock is telescopic, compensating for changes
in the distance between the endblocks as the limb
moves. The endblocks are attached to the limb segments
with double-sided adhesive tape. These devices are
biaxial, enabling one to simultaneously measure sagittal
and frontal plane motions. They come in various sizes,
to accommodate different joints, and have a very large
functional measuring range (greater than 180°). This
company also makes similarly designed “torsiometers”
for measuring axial rotations. For instrumentation, they
Section Two: Instrumented Gait Analysis
provide a data logger, which stores the data for later
downloading to a PC via a serial port (software is
available). They also manufacture a four-channel ampli-
fier that consists of a small portable body-worn unit and
a larger tabletop base unit, for connecting to a strip
chart recorder or computer A/D converter.
Infotronic (Market-USA, Inc., Sevema Park, MD)sells a goniometer system that incorporates the Penny
& Giles transducers described above. Their system has
a data logger that stores the angle data on memorycards (see EMG Acquisition Systems, below). The data
can later be downloaded to a PC. The software en-
ables the user to plot angle/time and angle/angle dia-
grams.
Video Motion
Video systems utilize one or more video cameras
to track bright markers placed at various locations on
the person being tested. The markers are either infrared
(IR) light-emitting diodes (LEDs) for active marker
systems or solid shapes covered with retroreflective tape
for passive marker systems. The systems keep track of
the horizontal and vertical coordinates of each marker
from each camera. In three-dimensional (3D) systems,
the computer software computes 3D coordinates for
each marker based upon the 2D data from two or more
Figure 4.
A Penny & Giles strain gauge electrogoniometer applied at the knee.
The strain gauge in the small spring measures the angle between the
plastic endblocks that are attached to the leg with double-sided
adhesive tape.
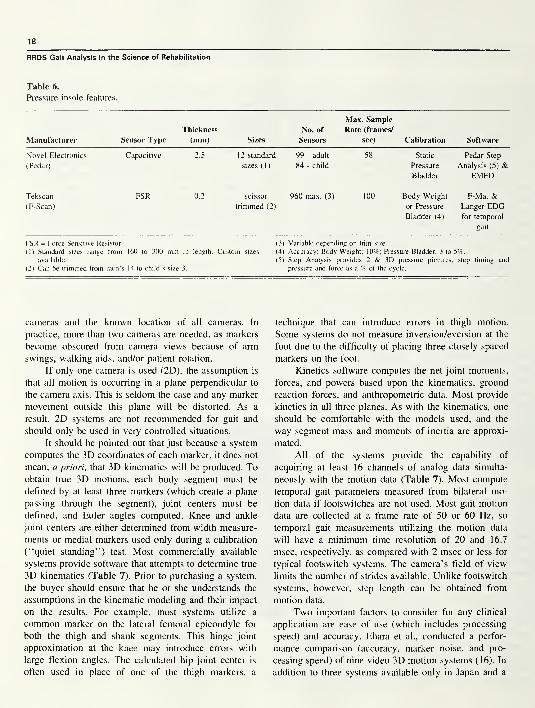
18
RRDS Gait Analysis in the Science of Rehabilitation
Table 6.
Pressure insole features.
Manufacturer Sensor Type
Thickness
(mm) Sizes
No. of
Sensors
Max. Sample
Rate (frames/
sec) Calibration Software
Novel Electronics
(Pedar)
Capacitive 2.5 12 standard
sizes (1)
99 - adult
84 - child
58 Static
Pressure
Bladder
Pedar Step
Analysis (5) &EMED
Tekscan
(F-Scan)
FSR 0.2 scissor
trimmed (2)
960 max. (3) 100 Body Weight
or Pressure
Bladder (4)
F-Mat &Langer EDGfor temporal
gait
FSR = Force Sensitive Resistor
( 1 ) Standard sizes range from
available.
(2) Can be trimmed from men’s
in length. Custom sizes
14 to child’s size 3.
(3) Variable depending on trim size.
(4) Accuracy: Body Weight; 10%; Pressure Bladder, 3 to 5%.
(5) Step Analysis provides 2 & 3D pressure pictures, step timing and
pressure and force as a % of the cycle.
cameras and the known location of all cameras. In
practice, more than two cameras are needed, as markers
become obscured from camera views because of arm
swings, walking aids, and/or patient rotation.
If only one camera is used (2D), the assumption is
that all motion is occurring in a plane perpendicular to
the camera axis. This is seldom the case and any marker
movement outside this plane will be distorted. As a
result, 2D systems are not recommended for gait and
should only be used in very controlled situations.
It should be pointed out that just because a system
computes the 3D coordinates of each marker, it does not
mean, a priori, that 3D kinematics will be produced. Toobtain true 3D motions, each body segment must be
defined by at least three markers (which create a plane
passing through the segment), joint centers must be
defined, and Euler angles computed. Knee and ankle
joint centers are either determined from width measure-
ments or medial markers used only during a calibration
(“quiet standing”) test. Most commercially available
systems provide software that attempts to determine true
3D kinematics (Table 7). Prior to purchasing a system,
the buyer should ensure that he or she understands the
assumptions in the kinematic modeling and their impact
on the results. For example, most systems utilize a
common marker on the lateral femoral epicondyle for
both the thigh and shank segments. This hinge joint
approximation at the knee may introduce errors with
large flexion angles. The calculated hip joint center is
often used in place of one of the thigh markers, a
technique that can introduce errors in thigh motion.
Some systems do not measure inversion/eversion at the
foot due to the difficulty of placing three closely spaced
markers on the foot.
Kinetics software computes the net joint moments,
forces, and powers based upon the kinematics, ground
reaction forces, and anthropometric data. Most provide
kinetics in all three planes. As with the kinematics, one
should be comfortable with the models used, and the
way segment mass and moments of inertia are approxi-
mated.
All of the systems provide the capability of
acquiring at least 16 channels of analog data simulta-
neously with the motion data (Table 7). Most compute
temporal gait parameters measured from bilateral mo-
tion data if footswitches are not used. Most gait motion
data are collected at a frame rate of 50 or 60 Hz, so
temporal gait measurements utilizing the motion data
will have a minimum time resolution of 20 and 16.7
msec, respectively, as compared with 2 msec or less for
typical footswitch systems. The camera’s field of view
limits the number of strides available. Unlike footswitch
systems, however, step length can be obtained from
motion data.
Two important factors to consider for any clinical
application are ease of use (which includes processing
speed) and accuracy. Ehara et al., conducted a perfor-
mance comparison (accuracy, marker noise, and pro-
cessing speed) of nine video 3D motion systems (16). In
addition to three systems available only in Japan and a
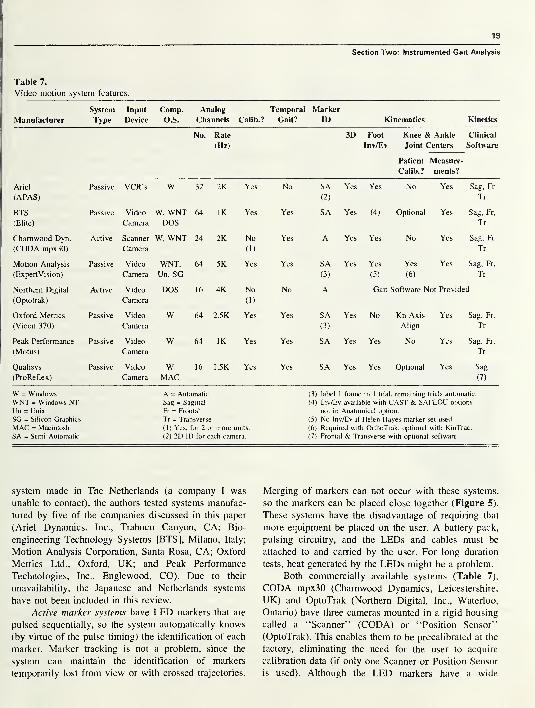
19
Table 7.
Video motion system features.
Section Two: Instrumented Gait Analysis
Manufacturer
System
Type
Input
Device
Comp.
O.S.
Analog
Channels Calib.?
Temporal
Gait?
Marker
ID Kinematics Kinetics
No. Rate
(Hz)
3D Foot
Inv/Ev
Knee & Ankle
Joint Centers
Patient Measure-
Calib.? ments?
Clinical
Software
Ariel Passive VCR’s W 32 2K Yes No SA Yes Yes No Yes Sag, Fr
(APAS) (2) Tr
BTS Passive Video W, WNT 64 IK Yes Yes SA Yes (4) Optional Yes Sag, Fr,
(Elite) Camera DOS Tr
Charnwood Dyn. Active Scanner W, WNT 24 2K No Yes A Yes Yes No Yes Sag, Fr
(CODA mpx30) Camera (1) Tr
Motion Analysis Passive Video WNT, 64 5K Yes Yes SA Yes Yes Yes Yes Sag, Fr,
(ExpertVision) Camera Un, SG (3) (5) (6) Tr
Northern Digital Active Video DOS 16 4K No No A Gait Software Not Provided
(Optotrak) Camera (1)
Oxford Metrics Passive Video W 64 2.5K Yes Yes SA Yes No Kn Axis Yes Sag, Fr,
(Vicon 370) Camera (3) Align Tr
Peak Performance Passive Video W 64 IK Yes Yes SA Yes Yes No Yes Sag, Fr,
(Motus) Camera Tr
Qualisys Passive Video W 16 1.5K Yes Yes SA Yes Yes Optional Yes Sag
(ProReflex) Camera MAC (7)
W = Windows A = Automatic (3) label 1 frame in 1 trial, remaining trials automatic.
WNT = Windows NT Sag = Sagittal (4) Inv/Ev available with CAST & SAFLOU options
Un = Unix Fr = Frontal not in Anatomical optiion.
SG = Silicon Graphics Tr = Transverse (5) No Inv/Ev if Helen Hayes marker set used.
MAC = Macintosh (1) Yes, for 2 or more units. (6) Required with OrthoTrak, optional with KinTrac.
SA = Semi-Automatic (2) 2D ID for each camera. (7) Frontal & Transverse with optional software.
system made in The Netherlands (a company I was
unable to contact), the authors tested systems manufac-
tured by five of the companies discussed in this paper
(Ariel Dynamics, Inc., Trabuco Canyon, CA; Bio-
engineering Technology Systems [BTS], Milano, Italy;
Motion Analysis Corporation, Santa Rosa, CA; Oxford
Metrics Ltd., Oxford, UK; and Peak Performance
Technologies, Inc., Englewood, CO). Due to their
unavailability, the Japanese and Netherlands systems
have not been included in this review.
Active marker systems have LED markers that are
pulsed sequentially, so the system automatically knows
(by virtue of the pulse timing) the identification of each
marker. Marker tracking is not a problem, since the
system can maintain the identification of markers
temporarily lost from view or with crossed trajectories.
Merging of markers can not occur with these systems,
so the markers can be placed close together (Figure 5).
These systems have the disadvantage of requiring that
more equipment be placed on the user. A battery pack,
pulsing circuitry, and the LEDs and cables must be
attached to and carried by the user. For long duration
tests, heat generated by the LEDs might be a problem.
Both commercially available systems (Table 7),
CODA mpx30 (Charnwood Dynamics, Leicestershire,
UK) and OptoTrak (Northern Digital, Inc., Waterloo,
Ontario) have three cameras mounted in a rigid housing
called a “Scanner” (CODA) or “Position Sensor”
(OptoTrak). This enables them to be precalibrated at the
factory, eliminating the need for the user to acquire
calibration data (if only one Scanner or Position Sensor
is used). Although the LED markers have a wide
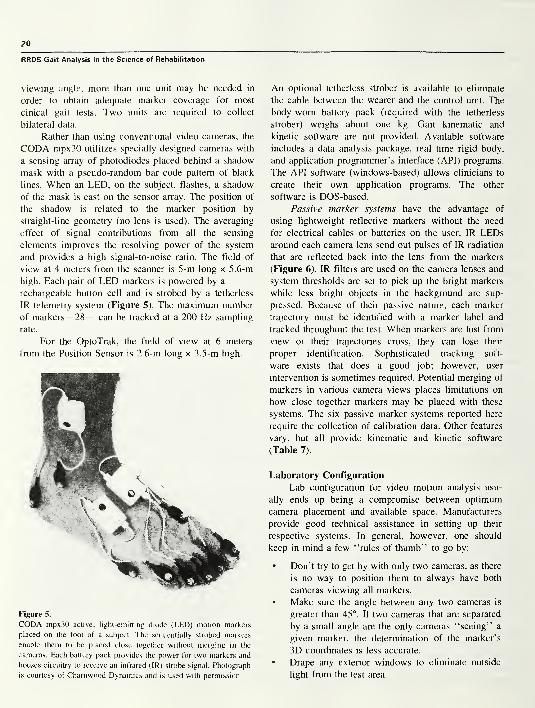
20
RRDS Gait Analysis in the Science of Rehabilitation
viewing angle, more than one unit may be needed in
order to obtain adequate marker coverage for most
cinical gait tests. Two units are required to collect
bilateral data.
Rather than using conventional video cameras, the
CODA mpx30 utilitzes specially designed cameras with
a sensing array of photodiodes placed behind a shadow
mask with a pseudo-random bar code pattern of black
lines. When an LED, on the subject, flashes, a shadow
of the mask is cast on the sensor array. The position of
the shadow is related to the marker position by
straight-line geometry (no lens is used). The averaging
effect of signal contributions from all the sensing
elements improves the resolving power of the system
and provides a high signal-to-noise ratio. The field of
view at 4 meters from the scanner is 5-m long x 5.6-m
high. Each pair of LED markers is powered by a
rechargeable button cell and is strobed by a tetherless
IR telemetry system (Figure 5). The maximum number
of markers—28— can be tracked at a 200 Hz sampling
rate.
For the OptoTrak, the field of view at 6 meters
from the Position Sensor is 2.6-m long x 3.5-m high.
Figure 5.
CODA mpx30 active, light-emitting diode (LED) motion markers
placed on the foot of a subject. The sequentially strobed markers
enable them to be placed close together without merging in the
cameras. Each battery pack provides the power for two markers and
houses circuitry to receive an infrared (IR) strobe signal. Photograph
is courtesy of Chamwood Dynamics and is used with permission.
An optional tetherless strober is available to eliminate
the cable between the wearer and the control unit. The
body-worn battery pack (required with the tetherless
strober) weighs about one kg. Gait kinematic and
kinetic software are not provided. Available software
includes a data analysis package, real time rigid body,
and application programmer’s interface (API) programs.
The API software (windows-based) allows clinicians to
create their own application programs. The other
software is DOS-based.
Passive marker systems have the advantage of
using lightweight reflective markers without the need
for electrical cables or batteries on the user. IR LEDsaround each camera lens send out pulses of IR radiation
that are reflected back into the lens from the markers
(Figure 6). IR filters are used on the camera lenses and
system thresholds are set to pick up the bright markers
while less bright objects in the background are sup-
pressed. Because of their passive nature, each marker
trajectory must be identified with a marker label and
tracked throughout the test. When markers are lost from
view or their trajectories cross, they can lose their
proper identification. Sophisticated tracking soft-
ware exists that does a good job; however, user
intervention is sometimes required. Potential merging of
markers in various camera views places limitations on
how close together markers may be placed with these
systems. The six passive marker systems reported here
require the collection of calibration data. Other features
vary, but all provide kinematic and kinetic software
(Table 7).
Laboratory Configuration
Lab configuration for video motion analysis usu-
ally ends up being a compromise between optimum
camera placement and available space. Manufacturers
provide good technical assistance in setting up their
respective systems. In general, however, one should
keep in mind a few “rules of thumb’’ to go by:
• Don’t try to get by with only two cameras, as there
is no way to position them to always have both
cameras viewing all markers.
• Make sure the angle between any two cameras is
greater than 45°. If two cameras that are separated
by a small angle are the only cameras “seeing” a
given marker, the determination of the marker’s
3D coordinates is less accurate.
• Drape any exterior windows to eliminate outside
light from the test area.
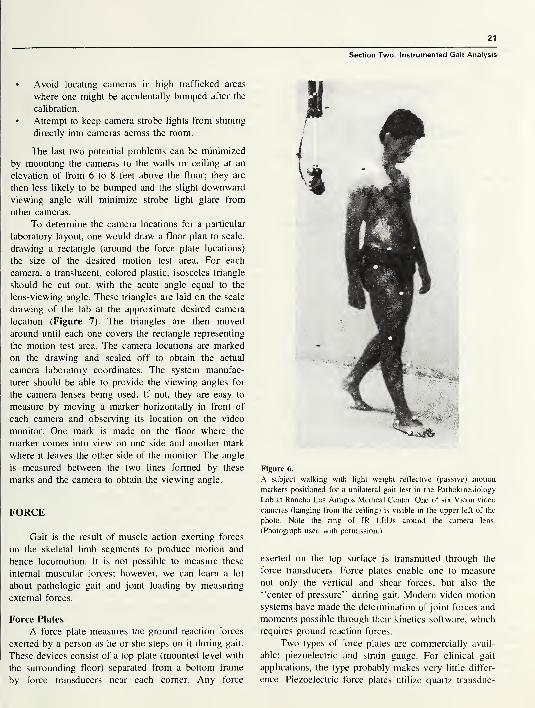
21
Section Two: Instrumented Gait Analysis
• Avoid locating cameras in high trafficked areas
where one might be accidentally bumped after the
calibration.
• Attempt to keep camera strobe lights from shining
directly into cameras across the room.
The last two potential problems can be minimized
by mounting the cameras to the walls or ceiling at an
elevation of from 6 to 8 feet above the floor; they are
then less likely to be bumped and the slight downward
viewing angle will minimize strobe light glare from
other cameras.
To determine the camera locations for a particular
laboratory layout, one would draw a floor plan to scale,
drawing a rectangle (around the force plate locations)
the size of the desired motion test area. For each
camera, a translucent, colored plastic, isosceles triangle
should be cut out, with the acute angle equal to the
lens-viewing angle. These triangles are laid on the scale
drawing of the lab at the approximate desired camera
location (Figure 7). The triangles are then moved
around until each one covers the rectangle representing
the motion test area. The camera locations are marked
on the drawing and scaled off to obtain the actual
camera laboratory coordinates. The system manufac-
turer should be able to provide the viewing angles for
the camera lenses being used. If not, they are easy to
measure by moving a marker horizontally in front of
each camera and observing its location on the video
monitor. One mark is made on the floor where the
marker comes into view on one side and another mark
where it leaves the other side of the monitor. The angle
is measured between the two lines formed by these
marks and the camera to obtain the viewing angle.
FORCE
Gait is the result of muscle action exerting forces
on the skeletal limb segments to produce motion and
hence locomotion. It is not possible to measure these
internal muscular forces; however, we can learn a lot
about pathologic gait and joint loading by measuring
external forces.
Force Plates
A force plate measures the ground reaction forces
exerted by a person as he or she steps on it during gait.
These devices consist of a top plate (mounted level with
the surrounding floor) separated from a bottom frame
by force transducers near each corner. Any force
Figure 6.
A subject walking with light weight reflective (passive) motion
markers positioned for a unilateral gait test in the Pathokinesiology
Lab at Rancho Los Amigos Medical Center. One of six Vicon video
cameras (hanging from the ceiling) is visible in the upper left of the
photo. Note the ring of 1R LEDs around the camera lens.
(Photograph used with permission.)
exerted on the top surface is transmitted through the
force transducers. Force plates enable one to measure
not only the vertical and shear forces, but also the
“center of pressure” during gait. Modern video motion
systems have made the determination of joint forces and
moments possible through their kinetics software, which
requires ground reaction forces.
Two types of force plates are commercially avail-
able: piezoelectric and strain gauge. For clinical gait
applications, the type probably makes very little differ-
ence. Piezoelectric force plates utilize quartz transduc-

22
RRDS Gait Analysis in the Science of Rehabilitation
Figure 7.
Gait lab floor plan showing a method of determining camera
locations to cover desired test area (light gray). Isosceles triangles
represent the viewing angle of cameras labeled Cl through C6.
Triangles for Cl and C6 are shown in different shades of gray for
clarity. The triangles are moved until they just cover the desired test
area. The point of the acute angle then represents the location of the
respective camera. Two force plates are shown in the center of the
test area.
ers, which generate an electric charge when stressed.
They do not require a power supply to excite the
transducers; however, special charge amplifiers and low
noise coaxial cables are required to convert the charge
to a voltage proportional to the applied load. The trans-
ducers are calibrated at the factory and no recalibration
is necessary. In general, piezoelectric force plates are
more sensitive and have a greater force range than strain
gauge types. They do have some slow drift, which
requires resetting of the charge amplifiers just prior to
data acquisition. Strain gauge force plates utilize strain
gauges to measure the stress in specially machined alu-
minum transducer bodies (load cells) when a load is ap-
plied. They do not require the special cabling and
charge amplifiers of the piezoelectric type; however,
they do require excitation of the strain gauge bridge
circuit.
Three manufacturers (Table 8) produce a large
variety of force plates for use in gait analysis. In
addition to their own force plates, Kistler also sells the
Bertec line.
Force Plate Installation
Considerable planning is required prior to install-
ing the force plates, unless one intends to use un-
mounted force plates (a technique I do not recommend
for gait testing). The top of the force plate(s) must be
level with, yet not touch, the surrounding floor. In
addition, the mounting structure (e.g., pylon, frames)
should be as rigid as possible. Ideally, the force plate(s)
should be mounted on a concrete pylon completely
separate from the building. In most instances, however,
basements or second and subsequent floor installations
make this impossible. As a result, I am restricting myremarks to installations on an existing floor. This will
require an elevated runway or floor for the gait testing
so the force plate(s) can be mounted on the existing
floor. An ideal method is to install a “computer access
floor,” such as the Tate ConCore 1250 access floor1
.
This floor has 610-mm square removable steel floor
panels with a cementitous core material, which adds
stiffness and minimizes the hollow sound when it is
walked upon.
For fixed installations, the force plate mounting
frame or frames (available from the manufacturer)
should be anchored to the existing concrete floor with
threaded anchors and nonshrinkable grout. Different
manufacturers have slightly different recommendations
and will provide assistance. For multiple force plates,
the locations must be carefully planned to provide the
widest range of testing. If set up for testing children, the
configuration will probably be unsuitable for adults and
vice versa. For this reason, many labs have gone to
moveable force plate installations.
Movable installations require a large custom-made
mounting plate with predrilled mounting holes at
discrete locations (anchored similarly to that for fixed
installations) or a large flat surface on which air bearing
force plate carriers can operate to provide infinite
adjustment of force plate locations (17). In this latter
technique. Stanhope and Jarrett used an optical bench as
the flat mounting surface.
We have adopted this optical bench method in our
new gait lab installation (currently under construction).
We are using a less expensive 1.07x1.68 mxl02-mmthick, model CS-46-4, optical breadboard
2, which has
slightly reduced flatness and stiffness specifications as
opposed to an optical bench (Figure 8). The optical
breadboard is being grouted to the concrete floor, with a
non-shrinkable grout, to increase the rigidity and
stiffness of the installation. Air bearings3(Flying Carpet
Model “A” Floating Air Platform) are used to levitate
the force plates for moving, and magnetic locks2
(Newport Corp., model 150) lock them into place for
testing4(Figure 9). A simple floor panel cutout scheme
has been devised that allows two force plates to be
iocated in multiple configurations (Figure 10). Comer
1
Tale Access Floors, Inc., 7510 Montevideo Rd., Jessup, MD 20794.
2 Newport Corporation, 1791 Deere Ave., Irvine, CA 92606.
2 C&H Precision Tools, Inc., 194-20 Morris Ave., Holtsville, NY I 1742.
APersonal communication with Steven J. Stanhope, PhD, January 27, 1997.
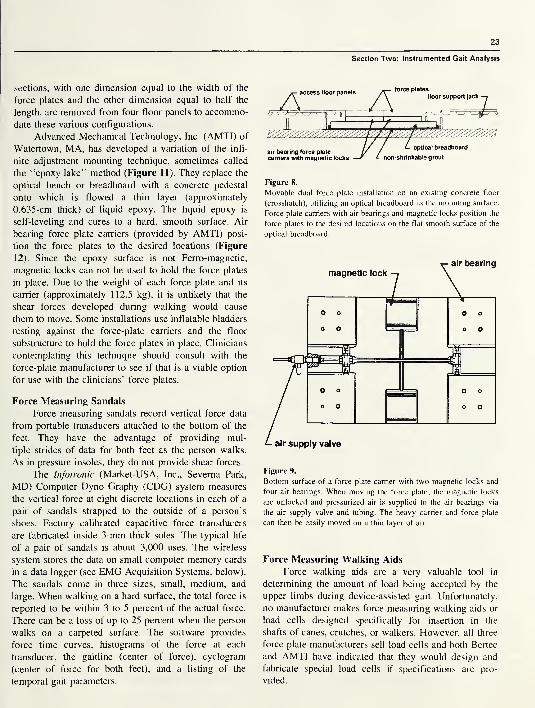
23
sections, with one dimension equal to the width of the
force plates and the other dimension equal to half the
length, are removed from four floor panels to accommo-
date these various configurations.
Advanced Mechanical Technology, Inc. (AMTI) of
Watertown, MA, has developed a variation of the infi-
nite adjustment mounting technique, sometimes called
the “epoxy lake” method (Figure 11). They replace the
optical bench or breadboard with a concrete pedestal
onto which is flowed a thin layer (approximately
0.635-cm thick) of liquid epoxy. The liquid epoxy is
self-leveling and cures to a hard, smooth surface. Air
bearing force plate carriers (provided by AMTI) posi-
tion the force plates to the desired locations (Figure
12). Since the epoxy surface is not Ferro-magnetic,
magnetic locks can not be used to hold the force plates
in place. Due to the weight of each force plate and its
carrier (approximately 112.5 kg), it is unlikely that the
shear forces developed during walking would cause
them to move. Some installations use inflatable bladders
resting against the force-plate carriers and the floor
substructure to hold the force plates in place. Clinicians
contemplating this technique should consult with the
force-plate manufacturer to see if that is a viable option
for use with the clinicians’ force plates.
Force Measuring Sandals
Force measuring sandals record vertical force data
from portable transducers attached to the bottom of the
feet. They have the advantage of providing mul-
tiple strides of data for both feet as the person walks.
As in pressure insoles, they do not provide shear forces.
The Infotronic (Market-USA, Inc., Sevema Park,
MD) Computer Dyno Graphy (CDG) system measures
the vertical force at eight discrete locations in each of a
pair of sandals strapped to the outside of a person’s
shoes. Factory calibrated capacitive force transducers
are fabricated inside 3-mm thick soles. The typical life
of a pair of sandals is about 3,000 uses. The wireless
system stores the data on small computer memory cards
in a data logger (see EMG Acquisition Systems, below).
The sandals come in three sizes, small, medium, and
large. When walking on a hard surface, the total force is
reported to be within 3 to 5 percent of the actual force.
There can be a loss of up to 25 percent when the person
walks on a carpeted surface. The software provides
force time curves, histograms of the force at each
transducer, the gaitline (center of force), cyclogram
(center of force for both feet), and a listing of the
temporal gait parameters.
Section Two: Instrumented Gait Analysis
force plates
air bearing force
.
carriers with magnetic locks
Figure 8.
Movable dual force plate installation on an existing concrete floor
(crosshatch), utilizing an optical breadboard as the mounting surface.
Force plate carriers with air bearings and magnetic locks position the
force plates to the desired locations on the flat smooth surface of the
optical breadboard.
Figure 9.
Bottom surface of a force plate carrier with two magnetic locks and
four air bearings. When moving the force plate, the magnetic locks
are unlocked and pressurized air is supplied to the air bearings via
the air supply valve and tubing. The heavy carrier and force plate
can then be easily moved on a thin layer of air.
Force Measuring Walking Aids
Force walking aids are a very valuable tool in
determining the amount of load being accepted by the
upper limbs during device-assisted gait. Unfortunately,
no manufacturer makes force measuring walking aids or
load cells designed specifically for insertion in the
shafts of canes, crutches, or walkers. However, all three
force plate manufacturers sell load cells and both Bertec
and AMTI have indicated that they would design and
fabricate special load cells if specifications are pro-
vided.
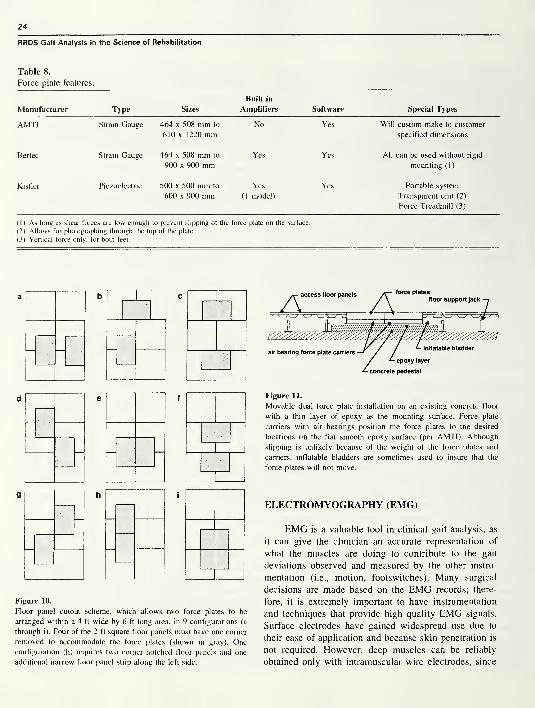
24
RRDS Gait Analysis in the Science of Rehabilitation
Table 8.
Force plate features.
Manufacturer Type Sizes
Built in
Amplifiers Software Special Types
AMTI Strain Gauge 464 x 508 mm to No Yes Will custom-make to customer
610x1 220 mm specified dimensions
Bertec Strain Gauge 464 x 508 mm to Yes Yes All can be used without rigid
900 x 900 mm mounting (1)
Kistler Piezoelectric 500 x 500 mm to Yes Yes Portable system
600 x 900 mm (1 model) Transparent unit (2)
Force Treadmill (3)
(1) As long as shear forces are low enough to prevent slipping of the force plate on the surface.
(2) Allows for photographing through the top of the plate.
(3) Vertical force only, for both feet.
d e f f
Figure 10.
Floor panel cutout scheme, which allows two force plates to be
arranged within a 4-ft wide by 6-ft long area, in 9 configurations (a
through i). Four of the 2-ft square floor panels must have one corner
removed to accommodate the force plates (shown in gray). One
configuration (h) requires two comer notched floor panels and one
additional narrow floor panel strip along the left side.
Figure 11.
Movable dual force plate installation on an existing concrete floor
with a thin layer of epoxy as the mounting surface. Force plate
carriers with air bearings position the force plates to the desired
locations on the flat smooth epoxy surface (per AMTI). Although
slipping is unlikely because of the weight of the force plates and
carriers, inflatable bladders are sometimes used to insure that the
force plates will not move.
ELECTROMYOGRAPHY (EMG)
EMG is a valuable tool in clinical gait analysis, as
it can give the clinician an accurate representation of
what the muscles are doing to contribute to the gait
deviations observed and measured by the other instru-
mentation (i.e., motion, footswitches). Many surgical
decisions are made based on the EMG records; there-
fore, it is extremely important to have instrumentation
and techniques that provide high quality EMG signals.
Surface electrodes have gained widespread use due to
their ease of application and because skin penetration is
not required. However, deep muscles can be reliably
obtained only with intramuscular wire electrodes, since
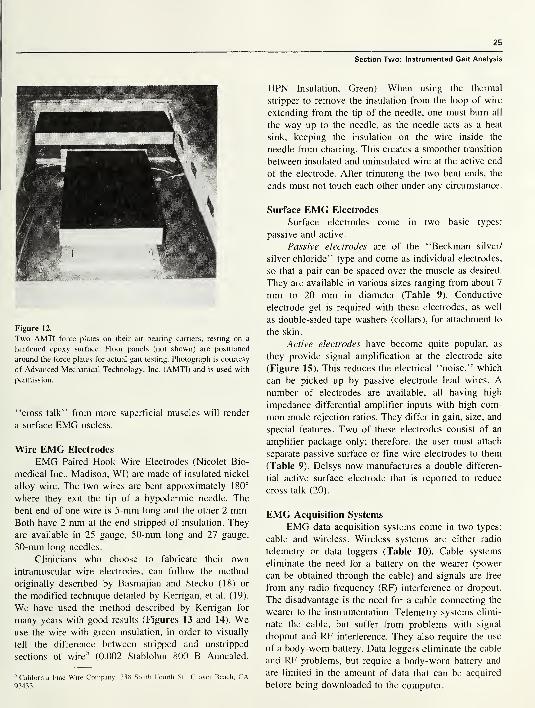
25
Section Two: Instrumented Gait Analysis
Figure 12.
Two AMTI force plates on their air bearing carriers, resting on a
hardened epoxy surface. Floor panels (not shown) are positioned
around the force plates for actual gait testing. Photograph is courtesy
of Advanced Mechanical Technology, Inc. (AMTI) and is used with
permission.
“cross talk’’ from more superficial muscles will render
a surface EMG useless.
Wire EMG Electrodes
EMG Paired Hook Wire Electrodes (Nicolet Bio-
medical Inc., Madison, WI) are made of insulated nickel
alloy wire. The two wires are bent approximately 180°
where they exit the tip of a hypodermic needle. The
bent end of one wire is 5-mm long and the other 2 mm.Both have 2 mm at the end stripped of insulation. They
are available in 25 gauge, 50-mm long and 27 gauge,
30-mm long needles.
Clinicians who choose to fabricate their own
intramuscular wire electrodes, can follow the method
originally described by Basmajian and Stecko (18) or
the modified technique detailed by Kerrigan, et al. (19).
We have used the method described by Kerrigan for
many years with good results (Figures 13 and 14). Weuse the wire with green insulation, in order to visually
tell the difference between stripped and unstripped
sections of wire5
(0.002 Stablohm 800 B Annealed,
5California Fine Wire Company. 338 South Fourth St., Grover Beach, CA
93433.
HPN Insulation, Green). When using the thermal
stripper to remove the insulation from the loop of wire
extending from the tip of the needle, one must burn all
the way up to the needle, as the needle acts as a heat
sink, keeping the insulation on the wire inside the
needle from charring. This creates a smoother transition
between insulated and uninsulated wire at the active end
of the electrode. After trimming the two bent ends, the
ends must not touch each other under any circumstance.
Surface EMG Electrodes
Surface electrodes come in two basic types:
passive and active.
Passive electrodes are of the “Beckman silver/
silver chloride” type and come as individual electrodes,
so that a pair can be spaced over the muscle as desired.
They are available in various sizes ranging from about 7
mm to 20 mm in diameter (Table 9). Conductive
electrode gel is required with these electrodes, as well
as double-sided tape washers (collars), for attachment to
the skin.
Active electrodes have become quite popular, as
they provide signal amplification at the electrode site
(Figure 15). This reduces the electrical “noise,” which
can be picked up by passive electrode lead wires. Anumber of electrodes are available, all having high
impedance differential amplifier inputs with high com-
mon mode rejection ratios. They differ in gain, size, and
special features. Two of these electrodes consist of an
amplifier package only; therefore, the user must attach
separate passive surface or fine wire electrodes to them
(Table 9). Delsys now manufactures a double differen-
tial active surface electrode that is reported to reduce
cross talk (20).
EMG Acquisition Systems
EMG data acquisition systems come in two types:
cable and wireless. Wireless systems are either radio
telemetry or data loggers (Table 10). Cable systems
eliminate the need for a battery on the wearer (power
can be obtained through the cable) and signals are free
from any radio frequency (RF) interference or dropout.
The disadvantage is the need for a cable connecting the
wearer to the instrumentation. Telemetry systems elimi-
nate the cable, but suffer from problems with signal
dropout and RF interference. They also require the use
of a body-worn battery. Data loggers eliminate the cable
and RF problems, but require a body-worn battery and
are limited in the amount of data that can be acquired
before being downloaded to the computer.
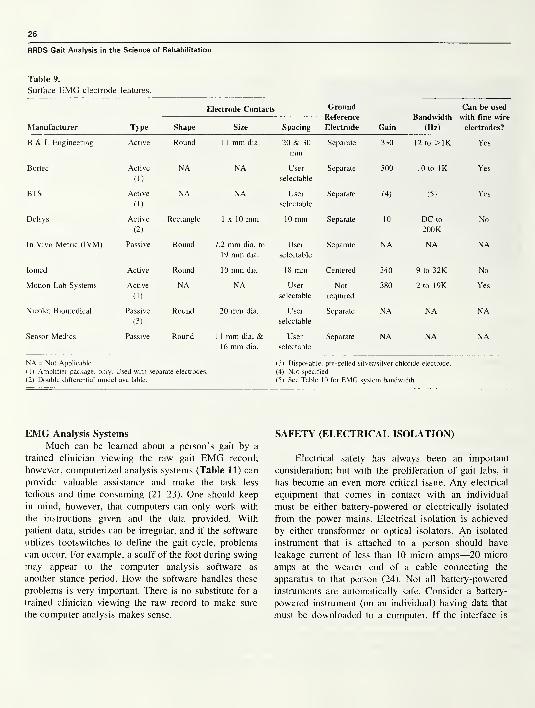
26
RRDS Gait Analysis in the Science of Rehabilitation
Table 9.
Surface EMG electrode features.
Electrode Contacts Ground
Reference
Electrode
Bandwidth
(Hz)
Can be used
with fine wire
electrodes?Manufacturer Type Shape Size Spacing Gain
B & L Engineering Active Round 1 1 mm dia. 20 & 30
mmSeparate 330 12 to >1K Yes
Bortec Active
(1)
NA NA User
selectable
Separate 500 10 to IK Yes
BTS Active
(1)
NA NA User
selectable
Separate (4) (5) Yes
Delsys Active
(2)
Rectangle 1x10 mm 10 mm Separate 10 DC to
200K
No
In Vivo Metric (IVM) Passive Round 7.2 mm dia. to
19 mm dia.
User
selectable
Separate NA NA NA
Iomed Active Round 10 mm dia. 18 mm Centered 340 9 to 32K No
Motion Lab Systems Active
(1)
NA NA User
selectable
Not
required
380 2 to 19K Yes
Nicolet Biomedical Passive
(3)
Round 20 mm dia. User
selectable
Separate NA NA NA
Sensor Medics Passive Round 1 1 mm dia. &16 mm dia.
User
selectable
Separate NA NA NA
NA = Not Applicable (3) Disposable, pre-gelled silver/silver chloride electrode.
( 1 ) Amplifier package, only. Used with separate electrodes. (4) Not specified.
(2) Double differential model available. (5) See Table 10 for EMG system bandwidth.
EMG Analysis Systems
Much can be learned about a person’s gait by a
trained clinician viewing the raw gait EMG record;
however, computerized analysis systems (Table 11) can
provide valuable assistance and make the task less
tedious and time consuming (21-23). One should keep
in mind, however, that computers can only work with
the instructions given and the data provided. With
patient data, strides can be irregular, and if the software
utilizes footswitches to define the gait cycle, problems
can occur. For example, a scuff of the foot during swing
may appear to the computer analysis software as
another stance period. How the software handles these
problems is very important. There is no substitute for a
trained clinician viewing the raw record to make sure
the computer analysis makes sense.
SAFETY (ELECTRICAL ISOLATION)
Electrical safety has always been an important
consideration; but with the proliferation of gait labs, it
has become an even more critical issue. Any electrical
equipment that comes in contact with an individual
must be either battery-powered or electrically isolated
from the power mains. Electrical isolation is achieved
by either transformer or optical isolators. An isolated
instrument that is attached to a person should have
leakage current of less than 10 micro amps—20 micro
amps at the wearer end of a cable connecting the
apparatus to that person (24). Not all battery-powered
instruments are automatically safe. Consider a battery-
powered instrument (on an individual) having data that
must be downloaded to a computer. If the interface is

27
Section Two: Instrumented Gait Analysis
Table 10.
EMG acquisition system features.
Data TransmissionNumber of
Channels
Bandwidth/
{sample rate}
(Hz)
Filters
Manufacturer Wireless Cable Highpass (Hz) Lowpass (Hz)
Bortec 4 mm dia. wire or
Fiber Optic cable
8 EMG2 FSws
10 to IK None None
BTS FM Telemetry
(diversity
receiver)
Optional Fiber
Optic cable
8 EMG2 FSws
{5K} 1, 5 & 10 600, 400, 200,
none
Konigsberg PCMFM Telemetry
Optional Fiber
Optic cable
8 (any mix of
EMG, FSws &other)
{3K} DC & 2 user
defined settings
IK, 500, 250, 125,
62, 32, 16, 8
Market-USA Data Logger 1 6 each of EMG,Gonis & FS
{EMG-5K, 200
for Gonis & FS}
None None
Motion Lab
Systems
3 mm dia. wire
cable
10 EMG2 FSws
20 to 2.3K 20 to 170 5, 10, 40, 150,
300, 600, 1.3K,
2.5K
Noraxon Digitally Encoded
FM Telemetry
Optional 10 mmdia. wire cable
8 EMG or 4 EMG& 2 FSws or 4
EMG & 4 Gonis
16 to 500 (1) 500
FSws = Footswitches PCM = Pulse Code Modulated Gonis = Electrogoniometers FS = Force Sandals
(1) A micro chip in the transmitter package implements a specially designed analog, adaptive high pass filter for noise removal. This filter design enables the
low cutoff frequency to be very sharp, without ringing.
Table 11.
EMG analysis sytem features.
Onsets & Cessations
Manufacturer
Real time
Oscilloscope
Monitoring?
Normalize
EMG?
Display
RawEMG?
Linear
Envelopes?
Define
GC with
FSws?
As
%GC?
Compareto
Normal?
Spectral
Analysis? Other
B & L Engineering No To MMTor max
EMG
Yes Yes Yes Yes Yes (1) No (2)
BTS Yes To MMT Yes Yes Yes Yes Not in US No (3)
Market-USA No No Yes Yes No No No Yes (4)
Motion Lab Systems No To max
EMGYes Yes Yes No No Yes (5)
Noraxon Yes No Yes Yes Yes No No Optional
GC = Gait Cycle FSws = Footswitches MMT = Manual Muscle Test
(1) You can incorporate your own data in the normal database. (3) Database allows tracking of subject groups.
(2) Report defines whether onset & cessation of EMG was normal, (4) Histogram gives amplitude distribution,
premature, prolonged, or delayed and in which gait phase it occurred. (5) Allows editing of footswitch on and off times.

28
RRDS Gait Analysis in the Science of Rehabilitation
Figure 13.
An intramuscular wire EMG electrode being inserted (with a 25-gauge hypodermic needle) in a muscle of a subject.
not electrically isolated, the package must be removed
from that individual before it is connected to the
computer. Electrical instruments in the lab, whether
they come in contact with the person or not, must be
solidly grounded and the ground integrity should be
checked on a regular basis. The resistance from the
ground prong on the power plug to the chassis should
be less than 0.15 ohms. Similarly, the resistance from
the ground lead in the power receptacle to a knownground should be less than 0.15 ohms.
All accredited medical institutions have policies
and procedures relating to the purchase and safety
testing of instruments used in their facilities. Often,
Underwriters Laboratory (UL) or Canadian Standards
Association (CSA) testing and certification are required.
Obviously, small companies manufacturing instruments
for a very limited gait analysis market can not absorb
the costs of UL or CSA testing. Because of this, many
institutions have policies that allow other (less costly)
third-party testing. The facility policy manual should be
checked to determine what is and is not allowed at that
institution.
ACKNOWLEDGMENTS
The author would like to thank Sreesha Rao (for his
special help with the motion section) and other staff members
of the Pathokinesiology Service, Rancho Los Amigos Medi-
cal Center for their helpful suggestions and comments. Bob
Manuel and Ron Clark of the Rancho Medical Equipment
Repair Shop were very helpful with the safety issues. Thanks,
aiso to the vendors who provided technical information and
answered many questions about their respective systems.

29
Section Two: Instrumented Gait Analysis
Figure 14.
Hypodermic needle being removed from intramuscular wire EMG electrode following insertion in
the muscle. Note the loop of wire, which allows the wire to move as the muscle contracts. Used
with permission: Craig J. Newsam. Quantification of aquatic therapy water-based methods: Part II:
Fine wire electromyography. The Journal of Aquatic Physical Therapy 1996; 4(3): 13-7.
Figure 15.
A Delsys active surface EMG electrode placed over the quadriceps
muscle of a subject.
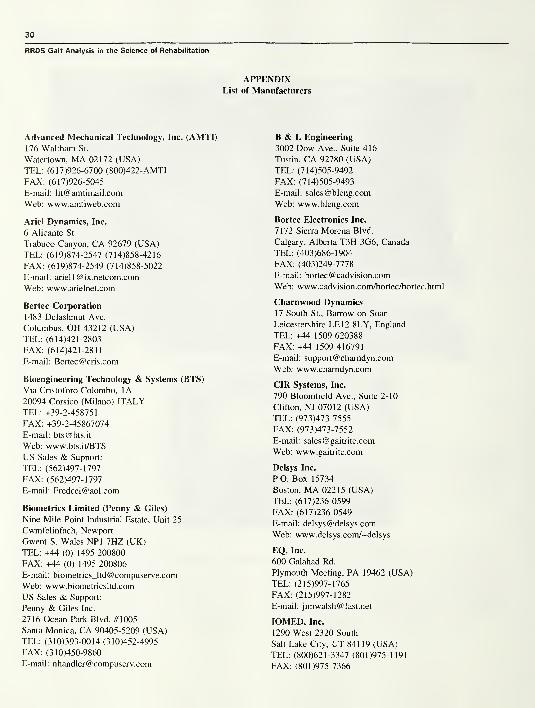
30
RRDS Gait Analysis in the Science of Rehabilitation
APPENDIXList of Manufacturers
Advanced Mechanical Technology, Inc. (AMTI)
176 Waltham St.
Watertown, MA 02172 (USA)
TEL: (617)926-6700 (800)422-AMTI
FAX: (617)926-5045
E-mail: [email protected]
Web: www.amtiweb.com
Ariel Dynamics, Inc.
6 Alicante St.
Trabuco Canyon, CA 92679 (USA)
TEL: (619)874-2547 (714)858-4216
FAX: (619)874-2549 (714)858-5022
E-mail: [email protected]
Web: www.arielnet.com
Bertec Corporation
1483 Delashmut Ave.
Columbus, OH 43212 (USA)
TEL: (614)421-2803
FAX: (614)421-2811
E-mail: [email protected]
Bioengineering Technology & Systems (BTS)
Via Cristoforo Colombo, 1A
20094 Corsico (Milano) ITALYTEL: +39-2-458751
FAX: +39-2-45867074
E-mail: [email protected]
Web: www.bts.it/BTS
US Sales & Support:
TEL: (562)497-1797
FAX: (562)497-1797
E-mail: [email protected]
Biometrics Limited (Penny & Giles)
Nine Mile Point Industrial Estate, Unit 25
Cwmfelinfach, Newport
Gwent S. Wales NP1 7HZ (UK)
TEL: +44 (0) 1495 200800
FAX: +44 (0) 1495 200806
E-mail : biometrics_ltd@ compuserve.com
Web: www.biometricsltd.com
US Sales & Support:
Penny & Giles Inc.
2716 Ocean Park Blvd. #1005
Santa Monica, CA 90405-5209 (USA)
TEL: (310)393-0014 (310)452-4995
FAX: (310)450-9860
E-mail: [email protected]
B & L Engineering
3002 Dow Ave., Suite 416
Tustin, CA 92780 (USA)
TEL: (714)505-9492
FAX: (714)505-9493
E-mail: [email protected]
Web: www.bleng.com
Bortec Electronics Inc.
7172 Sierra Morena Blvd.
Calgary, Alberta T3H 3G6, Canada
TEL: (403)686-1904
FAX: (403)249-7778
E-mail: [email protected]
Web: www.cadvision.com/bortec/bortec.html
Charnwood Dynamics
17 South St., Barrow on Soar
Leicestershire LEI 2 8LY, England
TEL: +44 1509 620388
FAX: +44 1509 416791
E-mail: [email protected]
Web: www.chamdyn.com
CIR Systems, Inc.
790 Bloomfield Ave., Suite 2-10
Clifton, NJ 07012 (USA)
TEL: (973)473-7555
FAX: (973)473-7552
E-mail: [email protected]
Web: www.gaitrite.com
Delsys Inc.
P.O. Box 15734
Boston, MA 02215 (USA)
TEL: (617)236-0599
FAX: (617)236-0549
E-mail: [email protected]
Web: www.delsys.com/~delsys
EQ, Inc.
600 Galahad Rd.
Plymouth Meeting, PA 19462 (USA)
TEL: (215)997-1765
FAX: (215)997-1282
E-mail: [email protected]
IOMED, Inc.
1290 West 2320 South
Salt Lake City, UT 841 19 (USA)
TEL: (800)621-3347 (801)975-1191
FAX: (801)975-7366

31
Section Two: Instrumented Gait Analysis
E-mail: [email protected]
Web: www.iomed.com
In Vivo Metric (IVM)
P.O. Box 249
Healdsburg, CA 95448 (USA)
TEL: (707)433-4819
FAX: (707)433-2407
Kistler Instrument Corp., USA75 John Glenn Drive
Amherst, NY 14228-2171 (USA)
TEL: (716)691-5100
FAX: (716)691-5226
E-mail: [email protected]
Web: www.kistler.com
Konigsberg Instruments, Inc.
2000 Foothill Blvd.
Pasadena, CA 91107-3294 (USA)
TEL: (626)449-0016
FAX: (626)449-1086
Market-USA (Infotronic)
523 Benfield Rd.
Sevema Park, MD 21146 (USA)
TEL: (410)647-2782
FAX: (410)647-5327
E-mail: [email protected]
Motion Analysis Corp.
3617 Westwind Blvd.
Santa Rosa, CA 95403-1067 (USA)
TEL: (707)579-6500 (847)945-1411
FAX: (707)526-0629
E-mail: [email protected]
Web: www.motionanalysis.com
Motion Lab Systems, Inc.
4326 Pine Park
Baton Rouge, LA 70809 (USA)
TEL: (504)928-GAIT
FAX: (504)928-0261
E-mail: [email protected]
Web: www.emgsrus.com
Musgrave Systems Ltd.
Redwither Tower, Redwither Business Park
Wrexham, LL13 9XT (UK)
TEL: +44 (0)1978-66 44 82
FAX: +44 (0)1978-66 44 83
E-Mail: [email protected]
Nicolet Biomedical Inc.
5225 Verona Road, Bldg. 2
Madison, WI 53711-4495 (USA)
TEL: (800)356-0007 (608)273-5000
FAX: (608)273-6841
E-mail: [email protected]
Web: www.biomed.nicolet.com
Noraxon USA Inc.
13430 N. Scottsdale Rd., Suite 104
Scottsdale, AZ 85254 (USA)
TEL: (602)443-3413
FAX: (602)443-4327
E-mail: [email protected]
Northern Digital, Inc.
403 Albert St.
Waterloo, Ontario N2L 3V2 Canada
TEL: (800)265-2741 (519)884-5142
FAX: (519)884-5184
E-mail: [email protected]
Web: www.ndigital.com
Novel GmbHBeichstrasse 8
80802 Munich, Germany
Tel: + 49 89 390102
FAX: + 49 89 337432
E-mail: [email protected]
US Sales & Support:
Novel Electronics Inc.
964 Grand Ave.
St. Paul, MN 55105 (USA)
TEL: (612)221-0505
FAX: (612)221-0404
E-mail: [email protected]
Web: www.novel.de
Oxford Metrics Ltd.
14, Minns Estate, West WayOxford OX2 OJB (UK)
TEL: +44 (0) 1865 261800
FAX: +44 (0) 1865 240527
E-mail: [email protected]
US Sales & Support:
Vicon Motion Systems
15455 Red Hill Ave., Suite CTustin, CA 92680 (USA)
TEL: (714)259-1232
FAX: (714)259-1509
E-mail: sales @vicon.com
Web: www.vicon.com
Peak Performance Technologies, Inc.
7388 S. Revere Pkwy. Suite 603
Englewood, CO 80112 (USA)
TEL: (800)PIK-PEAK (303)799-8686
FAX: (303)799-8690
E-mail: [email protected]
Web: www.peakperform.com
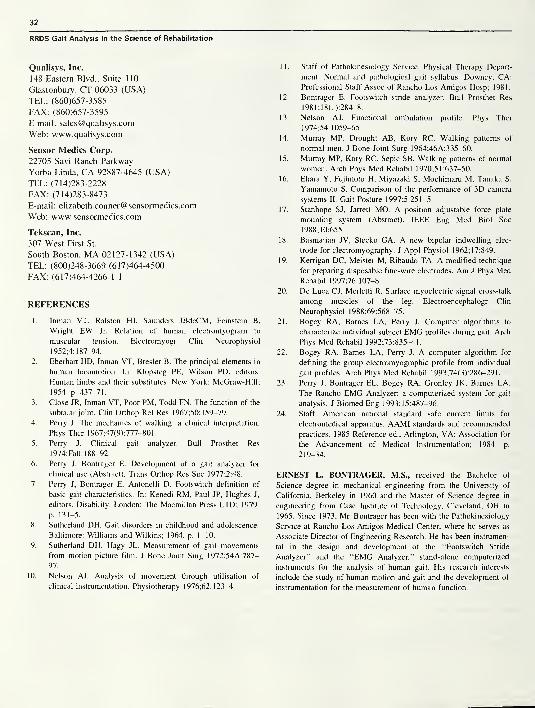
32
RRDS Gait Analysis in the Science of Rehabilitation
Qualisys, Inc.
148 Eastern Blvd., Suite 110
Glastonbury, CT 06033 (USA)
TEL: (860)657-3585
FAX: (860)657-3595
E-mail: [email protected]
Web: www.qualisys.com
Sensor Medics Corp.
22705 Savi Ranch Parkway
Yorba Linda, CA 92887-4645 (USA)
TEL: (714)283-2228
FAX: (714)283-8473
E-mail: [email protected]
Web: www.sensormedics.com
Tekscan, Inc.
307 West First St.
South Boston, MA 02127-1342 (USA)
TEL: (800)248-3669 (617)464-4500
FAX: (617)464-4266 1 1
REFERENCES
1. Inman VT, Ralston HJ, Saunders JBdeCM, Feinstein B,
Wright EW Jr. Relation of human electromyogram to
muscular tension. Electromyogr Clin Neurophysiol
1952;4:187-94.
2. Eberhart HD, Inman VT, Bresler B. The principal elements in
human locomotion. In: Klopsteg PE, Wilson PD, editors.
Human limbs and their substitutes. New York: McGraw-Hill;
1954. p. 437-71.
3. Close JR, Inman VT, Poor PM, Todd FN. The function of the
subtalar joint. Clin Orthop Rel Res 1967;50:159-79.
4. Perry J. The mechanics of walking: a clinical interpretation.
Phys Ther 1967;47(9):777-801
.
5. Perry J. Clinical gait analyzer. Bull Prosthet Res
1974;Fall: 188-92.
6. Perry J, Bontrager E. Development of a gait analyzer for
clinical use (Abstract). Trans Orthop Res Soc 1 977 ;2:48.
7. Perry J, Bontrager E, Antonelli D. Footswitch definition of
basic gait characteristics. In: Kenedi RM, Paul JP, Hughes J,
editors. Disability. London: The Macmillan Press LTD; 1979.
p. 131-5.
8. Sutherland DH. Gait disorders in childhood and adolescence.
Baltimore: Williams and Wilkins; 1964. p. 1-10.
9. Sutherland DH, Hagy JL. Measurement of gait movements
from motion picture film. J Bone Joint Surg 1972;54A:787-
97.
10.
Nelson AJ. Analysis of movement through utilisation of
clinical instrumentation. Physiotherapy 1976;62:123-4.
1 1 . Staff of Pathokinesiology Service, Physical Therapy Depart-
ment. Normal and pathological gait syllabus. Downey, CA:
Professional Staff Assoc of Rancho Los Amigos Hosp; 1981.
12. Bontrager E. Footswitch stride analyzer. Bull Prosthet Res
1981 ;1 8(1 ):284-8.
13. Nelson AJ. Functional ambulation profile. Phys Ther
1974;54:1059-65.
14. Murray MP. Drought AB, Kory RC. Walking patterns of
normal men. J Bone Joint Surg 1964;46A:335-60.
15. Murray MP, Kory RC, Sepic SB. Walking patterns of normal
women. Arch Phys Med Rehabil 1970;51:637-50.
16. Ehara Y, Fujimoto H, Miyazaki S, Mochimaru M, Tanaka S,
Yamamoto S. Comparison of the performance of 3D camera
systems II. Gait Posture 1997;5:251-5.
17. Stanhope SJ, Jarrett MO. A position adjustable force plate
mounting system (Abstract). IEEE Eng Med Biol Soc
1 988; 1 0:655.
18. Basmajian JV, Stecko GA. A new bipolar indwelling elec-
trode for electromyography. J Appl Physiol 1962:17:849.
19. Kerrigan DC, Meister M, Ribaudo TA. A modified technique
for preparing disposable fine-wire electrodes. Am J Phys MedRehabil 1997;76:107-8.
20. De Luca CJ, Merletti R. Surface myoelectric signal cross-talk
among muscles of the leg. Electroencephalogr Clin
Neurophysiol 1988;69:568-75.
21. Bogey RA, Barnes LA, Perry J. Computer algorithms to
characterize individual subject EMG profiles during gait. Arch
Phys Med Rehabil 1992;73:835-41.
22. Bogey RA, Barnes LA, Perry J. A computer algorithm for
defining the group electromyographic profile from individual
gait profiles. Arch Phys Med Rehabil 1 993;74(3):286—29 1
.
23. Perry J, Bontrager EL, Bogey RA, Gronley JK, Barnes LA.
The Rancho EMG Analyzer: a computerized system for gait
analysis. J Biomed Eng 1993;15:487-96.
24. Staff. American national standard safe current limits for
electromedical apparatus. AAMI standards and recommended
practices. 1985 Reference ed., Arlington, VA: Association for
the Advancement of Medical Instrumentation; 1984. p.
219-34.
ERNEST L. BONTRAGER, M.S., received the Bachelor of
Science degree in mechanical engineering from the University of
California, Berkeley in 1960 and the Master of Science degree in
engineering from Case Institute of Technology, Cleveland, OH in
1965. Since 1973, Mr. Bontrager has been with the Pathokinesiology
Service at Rancho Los Amigos Medical Center, where he serves as
Associate Director of Engineering Research. He has been instrumen-
tal in the design and development of the “Footswitch Stride
Analyzer” and the “EMG Analyzer,” stand-alone computerized
instruments for the analysis of human gait. His research interests
include the study of human motion and gait and the development of
instrumentation for the measurement of human function.

SECTION TWO
Chapter One
The Contribution of Dynamic Electromyography to
Gait Analysis
by Jacquelin Perry, M.D.
Dr. Perry is Director of the Pathokinesiology Lab at the Rancho Los Amigos Medical Center in Downey, California.
INTRODUCTION
The purpose of dynamic electromyography is to
accurately define the muscle action that controls joint
motion. While gross function of muscle groups can be
inferred from motion and moment calculations, specific-
ity of muscle function requires a more discriminating
technique.
The Functional Challenge
Walking relies on selective timing and intensity of
appropriate muscles at each joint to provide weight-
bearing stability, shock absorption, and progression over
the supporting foot during stance and to advance the
limb in swing. Energy is conserved by activating only
the muscles optimally aligned for each task and by
substituting momentum and passive tissue tension for
direct muscle activity wherever possible.
Throughout this sequence of functions, the muscles
perform in groups, as shown in Figure 1(1). While the
dominant motions of the lower limb occur in the sagittal
plane (i.e., flexion and extension for the demands of
progression), there also are significant actions in the
other two planes (coronal and transverse) to enhance
single limb balance and body rotations. Each muscle has
a unique three-dimensional (3D) effect determined by
its alignment across the joint or joints it crosses. In
addition, most muscles are members of two or more
Figure 1.
Normal sequence of synergistic activity of the major extensor
muscle groups during stance. Linear display of the EMG amplitudes
(vertical scale) of the individual muscles identify their relative
intensity and timing. Hamstrings (biceps femoris, semimembranosus,
semitendinosus); Vasti (intermedius, lateralis, medialis longus,
medialis oblique); Plantar flexors (soleus, gastrocnemius, tibialis
posterior [biphasic]). IC (initial contact) indicates onset of stance.
Note extensor muscles begin in late swing.
functional groups. This redundancy assures 3D balance
and serves to simplify the integration of adjacent joint
action. Relative intensity of action of a particular
33
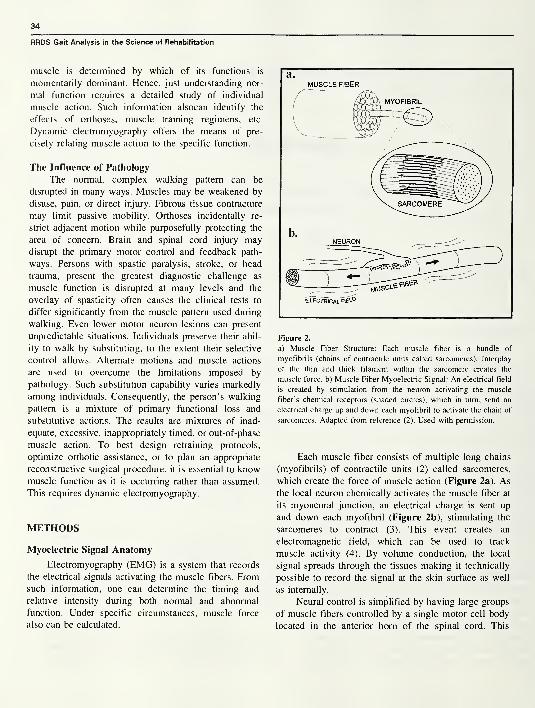
34
RRDS Gait Analysis in the Science of Rehabilitation
muscle is determined by which of its functions is
momentarily dominant. Hence, just understanding nor-
mal function requires a detailed study of individual
muscle action. Such information alsocan identify the
effects of orthoses, muscle training regimens, etc.
Dynamic electromyography offers the means of pre-
cisely relating muscle action to the specific function.
The Influence of Pathology
The normal, complex walking pattern can be
disrupted in many ways. Muscles may be weakened by
disuse, pain, or direct injury. Fibrous tissue contracture
may limit passive mobility. Orthoses incidentally re-
strict adjacent motion while purposefully protecting the
area of concern. Brain and spinal cord injury maydisrupt the primary motor control and feedback path-
ways. Persons with spastic paralysis, stroke, or head
trauma, present the greatest diagnostic challenge as
muscle function is disrupted at many levels and the
overlay of spasticity often causes the clinical tests to
differ significantly from the muscle pattern used during
walking. Even lower motor neuron lesions can present
unpredictable situations. Individuals preserve their abil-
ity to walk by substituting, to the extent their selective
control allows. Alternate motions and muscle actions
are used to overcome the limitations imposed by
pathology. Such substitution capability varies markedly
among individuals. Consequently, the person’s walking
pattern is a mixture of primary functional loss and
substitutive actions. The results are mixtures of inad-
equate, excessive, inappropriately timed, or out-of-phase
muscle action. To best design retraining protocols,
optimize orthotic assistance, or to plan an appropriate
reconstructive surgical procedure, it is essential to knowmuscle function as it is occurring rather than assumed.
This requires dynamic electromyography.
METHODS
Myoelectric Signal Anatomy
Electromyography (EMG) is a system that records
the electrical signals activating the muscle fibers. Fromsuch information, one can determine the timing and
relative intensity during both normal and abnormal
function. Under specific circumstances, muscle force
also can be calculated.
Figure 2.
a) Muscle Fiber Structure: Each muscle fiber is a bundle of
myofibrils (chains of contractile units called sarcomeres). Interplay
of the thin and thick filament within the sarcomere creates the
muscle force, b) Muscle Fiber Myoelectric Signal: An electrical field
is created by stimulation from the neuron activating the muscle
fiber’s chemical receptors (shaded circles), which in turn, send an
electrical charge up and down each myofibril to activate the chain of
sarcomeres. Adapted from reference (2). Used with permission.
Each muscle fiber consists of multiple long chains
(myofibrils) of contractile units (2) called sarcomeres,
which create the force of muscle action (Figure 2a). As
the local neuron chemically activates the muscle fiber at
its myoneural junction, an electrical charge is sent up
and down each myofibril (Figure 2b), stimulating the
sarcomeres to contract (3). This event creates an
electromagnetic field, which can be used to track
muscle activity (4). By volume conduction, the local
signal spreads through the tissues making it technically
possible to record the signal at the skin surface as well
as internally.
Neural control is simplified by having large groups
of muscle fibers controlled by a single motor cell body
located in the anterior horn of the spinal cord. This
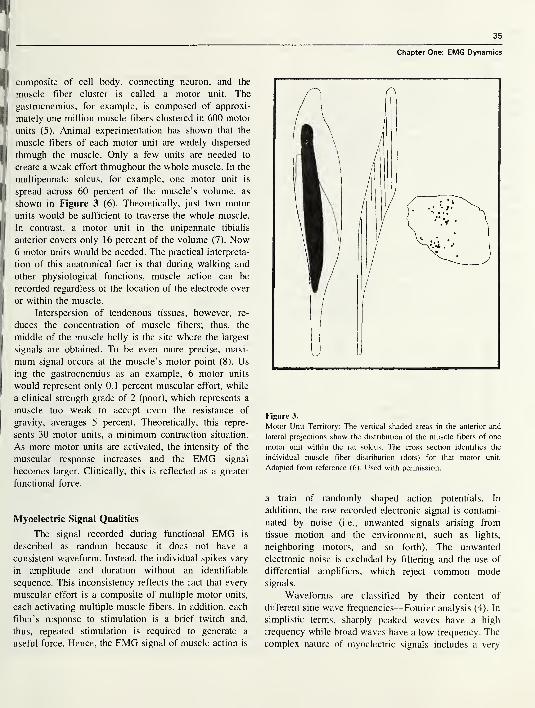
35
H|composite of cell body, connecting neuron, and the
muscle fiber cluster is called a motor unit. The
g gastrocnemius, for example, is composed of approxi-
[|mately one million muscle fibers clustered in 600 motor
units (5). Animal experimentation has shown that the
J muscle fibers of each motor unit are widely dispersed
II through the muscle. Only a few units are needed to
create a weak effort throughout the whole muscle. In the
j
multipennate soleus, for example, one motor unit is
I spread across 60 percent of the muscle’s volume, as
shown in Figure 3 (6). Theoretically, just two motor
units would be sufficient to traverse the whole muscle.
In contrast, a motor unit in the unipennate tibialis
' anterior covers only 16 percent of the volume (7). Now6 motor units would be needed. The practical interpreta-
I. tion of this anatomical fact is that during walking and
J other physiological functions, muscle action can be
recorded regardless of the location of the electrode over
!|or within the muscle.
Interspersion of tendonous tissues, however, re-
( duces the concentration of muscle fibers; thus, the
middle of the muscle belly is the site where the largest
signals are obtained. To be even more precise, maxi-
mum signal occurs at the muscle’s motor point (8). Us
ing the gastrocnemius as an example, 6 motor units
would represent only 0.1 percent muscular effort, while
a clinical strength grade of 2 (poor), which represents a
muscle too weak to accept even the resistance of
gravity, averages 5 percent. Theoretically, this repre-
sents 30 motor units, a minimum contraction situation.
As more motor units are activated, the intensity of the
muscular response increases and the EMG signal
becomes larger. Clinically, this is reflected as a greater
functional force.
Myoelectric Signal Qualities
The signal recorded during functional EMG is
described as random because it does not have a
consistent waveform. Instead, the individual spikes vary
in amplitude and duration without an identifiable
sequence. This inconsistency reflects the fact that every
muscular effort is a composite of multiple motor units,
each activating multiple muscle fibers. In addition, each
fiber’s response to stimulation is a brief twitch and,
thus, repeated stimulation is required to generate a
useful force. Hence, the EMG signal of muscle action is
Chapter One: EMG Dynamics
Figure 3.
Motor Unit Territory: The vertical shaded areas in the anterior and
lateral projections show the distribution of the muscle fibers of one
motor unit within the rat soleus. The cross section identifies the
individual muscle fiber distribution (dots) for that motor unit.
Adapted from reference (6). Used with permission.
a train of randomly shaped action potentials. In
addition, the raw recorded electronic signal is contami-
nated by noise (i.e., unwanted signals arising from
tissue motion and the environment, such as lights,
neighboring motors, and so forth). The unwanted
electronic noise is excluded by filtering and the use of
differential amplifiers, which reject common modesignals.
Waveforms are classified by their content of
different sine wave frequencies—Fourier analysis (4). In
simplistic terms, sharply peaked waves have a high
frequency while broad waves have a low frequency. The
complex nature of myoelectric signals includes a very
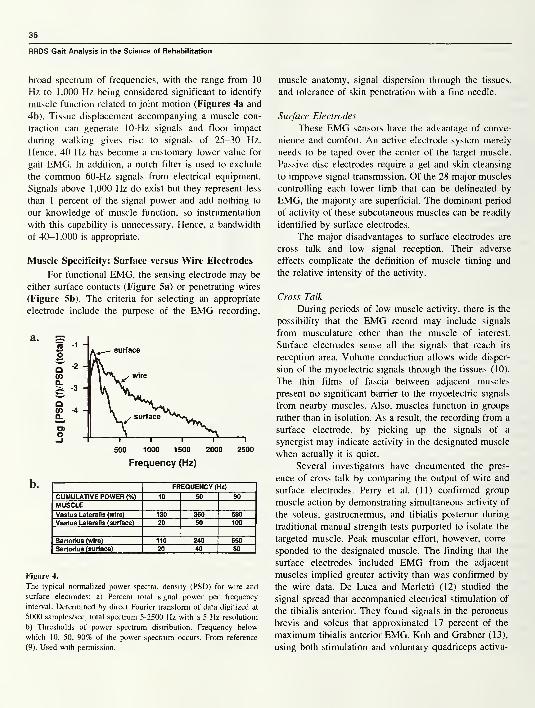
36
RRDS Gait Analysis in the Science of Rehabilitation
broad spectrum of frequencies, with the range from 10
Hz to 1,000 Hz being considered significant to identify
muscle function related to joint motion (Figures 4a and
4b). Tissue displacement accompanying a muscle con-
traction can generate 10-Hz signals and floor impact
during walking gives rise to signals of 25-30 Hz.
Hence, 40 Hz has become a customary lower value for
gait EMG. In addition, a notch filter is used to exclude
the common 60-Hz signals from electrical equipment.
Signals above 1,000 Hz do exist but they represent less
than 1 percent of the signal power and add nothing to
our knowledge of muscle function, so instrumentation
with this capability is unnecessary. Hence, a bandwidth
of 40-1,000 is appropriate.
Muscle Specificity: Surface versus Wire Electrodes
For functional EMG, the sensing electrode may be
either surface contacts (Figure 5a) or penetrating wires
(Figure 5b). The criteria for selecting an appropriate
electrode include the purpose of the EMG recording,
Frequency (Hz)
FREQUENCY (Hz)
CUMULATIVE POWER (%) 10 50 90
MUSCLEVastus Lateralis (wire) 130 360 580
Vastus Lateralis (surface) 20 50 100
Sartorlus (wire) 110 240 650
Sartorius (surface) 20 40 80
Figure 4.
The typical normalized power spectral density (PSD) for wire and
surface electrodes: a) Percent total signal power per frequency
interval. Determined by direct Fourier transform of data digitized at
5000 samples/sec, total spectrum 5-2500 Hz with a 5 Hz resolution;
b) Thresholds of power spectrum distribution. Frequency below
which 10, 50, 90% of the power spectrum occurs. From reference
(9). Used with permission.
muscle anatomy, signal dispersion through the tissues,
and tolerance of skin penetration with a fine needle.
Surface Electrodes
These EMG sensors have the advantage of conve-
nience and comfort. An active electrode system merely
needs to be taped over the center of the target muscle.
Passive disc electrodes require a gel and skin cleansing
to improve signal transmission. Of the 28 major muscles
controlling each lower limb that can be delineated by
EMG, the majority are superficial. The dominant period
of activity of these subcutaneous muscles can be readily
identified by surface electrodes.
The major disadvantages to surface electrodes are
cross talk and low signal reception. Their adverse
effects complicate the definition of muscle timing and
the relative intensity of the activity.
Cross Talk
During periods of low muscle activity, there is the
possibility that the EMG record may include signals
from musculature other than the muscle of interest.
Surface electrodes sense all the signals that reach its
reception area. Volume conduction allows wide disper-
sion of the myoelectric signals through the tissues (10).
The thin films of fascia between adjacent muscles
present no significant barrier to the myoelectric signals
from nearby muscles. Also, muscles function in groups
rather than in isolation. As a result, the recording from a
surface electrode, by picking up the signals of a
synergist may indicate activity in the designated muscle
when actually it is quiet.
Several investigators have documented the pres-
ence of cross talk by comparing the output of wire and
surface electrodes. Perry et al. (11) confirmed group
muscle action by demonstrating simultaneous activity of
the soleus, gastrocnemius, and tibialis posterior during
traditional manual strength tests purported to isolate the
targeted muscle. Peak muscular effort, however, corre-
sponded to the designated muscle. The finding that the
surface electrodes included EMG from the adjacent
muscles implied greater activity than was confirmed by
the wire data. De Luca and Merletti (12) studied the
signal spread that accompanied electrical stimulation of
the tibialis anterior. They found signals in the peroneus
brevis and soleus that approximated 17 percent of the
maximum tibialis anterior EMG. Koh and Grabner (13),
using both stimulation and voluntary quadriceps activa-
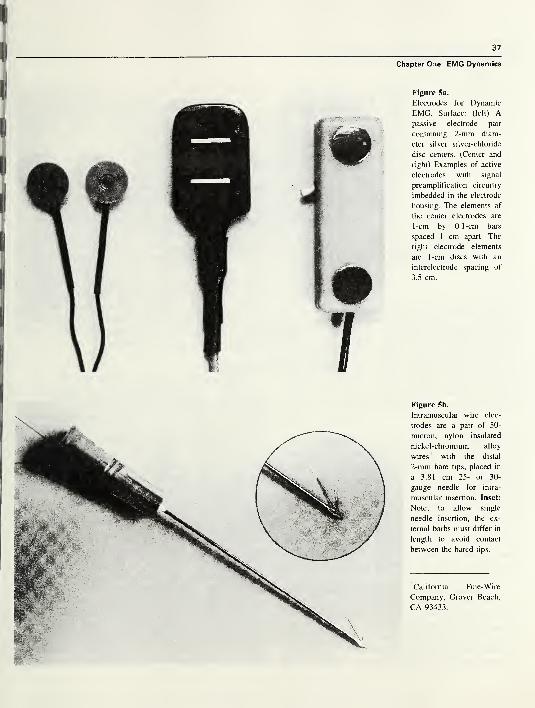
37
Chapter One: EMG Dynamics
Figure 5a.
Electrodes for Dynamic
EMG. Surface: (left) Apassive electrode pair
containing 2-mm diam-
eter silver silver-chloride
disc centers. (Center and
right) Examples of active
electrodes with signal
preamplification circuitry
imbedded in the electrode
housing. The elements of
the center electrodes are
1-cm by 0.1 -cm bars
spaced 1 cm apart. The
right electrode elements
are 1-cm discs with an
interelectrode spacing of
3.5 cm.
Figure 5b.
Intramuscular wire elec-
trodes are a pair of 50-
micron, nylon insulated
nickel-chromium alloy
wires' with the distal
2-mm bare tips, placed in
a 3.81 cm 25- or 30-
gauge needle for intra-
muscular insertion. Inset:
Note, to allow single
needle insertion, the ex-
ternal barbs must differ in
length to avoid contact
between the bared tips.
'California Fine-Wire
Company, Grover Beach,
CA 93433.
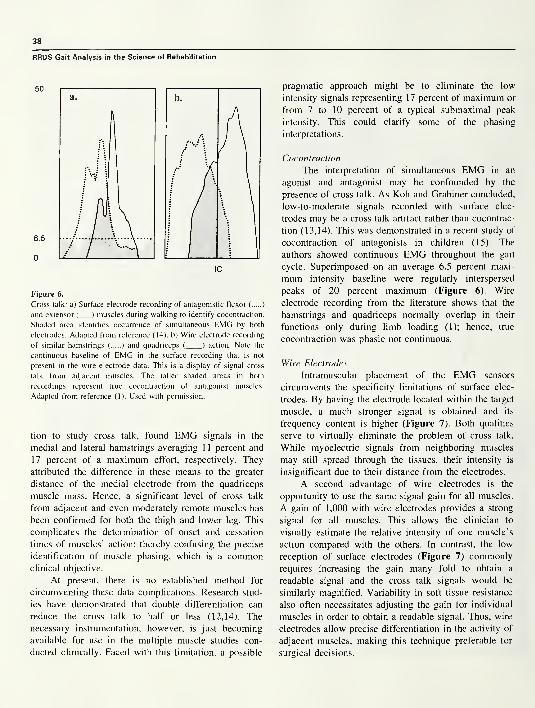
38
RRDS Gait Analysis in the Science of Rehabilitation
Figure 6.
Cross talk: a) Surface electrode recording of antagonistic flexor ( )
and extensor ( ) muscles during walking to identify cocontraction.
Shaded area identifies occurrence of simultaneous EMG by both
electrodes. Adapted from reference (14). b) Wire electrode recording
of similar hamstrings ( ) and quadriceps ( ) action. Note the
continuous baseline of EMG in the surface recording that is not
present in the wire electrode data. This is a display of signal cross
talk from adjacent muscles. The taller shaded areas in both
recordings represent true cocontraction of antagonist muscles.
Adapted from reference (1). Used with permission.
tion to study cross talk, found EMG signals in the
medial and lateral hamstrings averaging 11percent and
17 percent of a maximum effort, respectively. They
attributed the difference in these means to the greater
distance of the medial electrode from the quadriceps
muscle mass. Hence, a significant level of cross talk
from adjacent and even moderately remote muscles has
been confirmed for both the thigh and lower leg. This
complicates the determination of onset and cessation
times of muscles’ action; thereby confusing the precise
identification of muscle phasing, which is a commonclinical objective.
At present, there is no established method for
circumventing these data complications. Research stud-
ies have demonstrated that double differentiation can
reduce the cross talk to half or less (12,14). The
necessary instrumentation, however, is just becoming
available for use in the multiple muscle studies con-
ducted clinically. Faced with this limitation, a possible
pragmatic approach might be to eliminate the low
intensity signals representing 17 percent of maximum or
from 7 to 10 percent of a typical submaximal peak
intensity. This could clarify some of the phasing
interpretations.
Cocontraction
The interpretation of simultaneous EMG in an
agonist and antagonist may be confounded by the
presence of cross talk. As Koh and Grabiner concluded,
low-to-moderate signals recorded with surface elec-
trodes may be a cross talk artifact rather than cocontrac-
tion (13,14). This was demonstrated in a recent study of
cocontraction of antagonists in children (15). The
authors showed continuous EMG throughout the gait
cycle. Superimposed on an average 6.5 percent maxi-
mum intensity baseline were regularly interspersed
peaks of 20 percent maximum (Figure 6). Wire
electrode recording from the literature shows that the
hamstrings and quadriceps normally overlap in their
functions only during limb loading (1); hence, true
cocontraction was phasic not continuous.
Wire Electrodes
Intramuscular placement of the EMG sensors
circumvents the specificity limitations of surface elec-
trodes. By having the electrode located within the target
muscle, a much stronger signal is obtained and its
frequency content is higher (Figure 7). Both qualities
serve to virtually eliminate the problem of cross talk.
While myoelectric signals from neighboring muscles
may still spread through the tissues, their intensity is
insignificant due to their distance from the electrodes.
A second advantage of wire electrodes is the
opportunity to use the same signal gain for all muscles.
A gain of 1,000 with wire electrodes provides a strong
signal for all muscles. This allows the clinician to
visually estimate the relative intensity of one muscle’s
action compared with the others. In contrast, the low
reception of surface electrodes (Figure 7) commonly
requires increasing the gain many fold to obtain a
readable signal and the cross talk signals would be
similarly magnified. Variability in soft tissue resistance
also often necessitates adjusting the gain for individual
muscles in order to obtain a readable signal. Thus, wire
electrodes allow precise differentiation in the activity of
adjacent muscles, making this technique preferable for
surgical decisions.
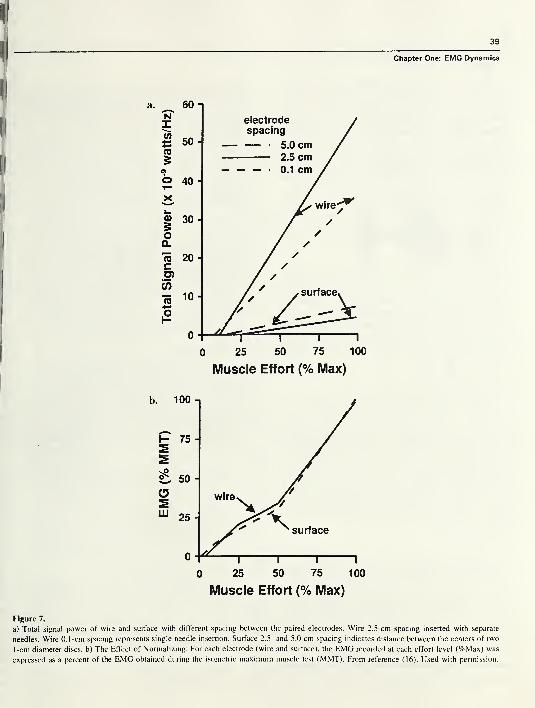
39
Chapter One: EMG Dynamics
Muscle Effort (% Max)
Figure 7.
a) Total signal power of wire and surface with different spacing between the paired electrodes. Wire 2.5-cm spacing inserted with separate
needles. Wire 0.1 -cm spacing represents single needle insertion. Surface 2.5- and 5.0-cm spacing indicates distance between the centers of two
1-cm diameter discs, b) The Effect of Normalizing: For each electrode (wire and surface), the EMG recorded at each effort level (%Max) was
expressed as a percent of the EMG obtained during the isometric maximum muscle test (MMT). From reference (16). Used with permission.
40
RRDS Gait Analysis in the Science of Rehabilitation
The disadvantage of wire electrodes is the need for
skin penetration as the wire electrodes are inserted into
the muscle with a fine needle (gauge 25-30). Unless the
subject has a bleeding tendency (which would
contraindicate wires), the only penalty is momentary
discomfort. This is minimized by tensing the skin,
knowing the desired location and making a rapid
insertion. Children as young as 4 years of age can be
successfully tested with wire electrodes. Basmajian and
Stecko’s technique of inserting both wires with a single
needle has simplified electrode location (17). A critical
factor, however, is electrode fabrication. The end of the
barbs must be of different lengths so that their bared
tips will not contact each other and short-out the signal
(Figure 5b, inset).
For both electrode systems, it is essential that the
location relative to the target muscle be accurately
determined. Following electrode application, activity of
the target muscle is determined by palpable contraction
and/or tension of its tendon during a low effort muscle
test. Wire electrodes also allow precise localization by
light electrical stimulation through the electrodes. Elec-
trodes must be moved until the desired muscle action
coincides with the EMG.
EMG Signal Timing
As each muscle provides a specific function, the
basic information to be gained by dynamic electro-
myography is phasing within the gait cycle. The fun-
damental question is the time of onset and cessation of
each muscle’s activity relative to the limb motion. Asecond common concern is the time of peak effort. Tomake these determinations, some type of event marker
must be included with the electromyographic recording
to permit phasing. A similarly timed record of limb
function is also needed. By itself, the EMG trace is a
meaningless sequence of action potentials.
Event Marker
There are basically two methods of identifying the
onset of the gait cycle, the use of a footswitch system or
a synchronizing indicator on the visible video, motion,
or force recordings. Either approach allows one to
designate timing as percentage points within the gait
cycle. It is customary to begin with initial floor contact
as 0 percent and end with next initial contact as 100
percent. The functional significance is made clearer
when the gait cycle is further divided into the functional
subphases.
Footswitches offer the most versatile approach.
While some normal gait studies use just a heel switch,
this is seldom adequate as there is no indicator
separating stance and swing. For pathological gait, a
minimum of four switches on each foot is needed to
accommodate the various modes of floor contact (18).
The critical sites are heel, medial and lateral forefoot,
and great toe. With this system, the basic phases of gait
can be determined. The initial double support period
identifies initial contact and the loading response phase.
Lifting the other foot (contralateral toe-off) identifies
single stance. Mid and terminal stance are distinguished
as each being half of single stance. One can also relate
the EMG pattern to the duration each foot segment is in
contact with the floor. Pathology can alter the heel
contact pattern in many ways with heel contact being
absent, curtailed, or prolonged. While toe-off is the
absolute endpoint of stance, a pathological toe drag mayobscure the onset of swing. This not uncommonsituation, contradicts using “toe-off” as the start of a
gait cycle, which some investigators propose (19).
Timing Interpretation
The accuracy of defining the period of significant
muscle function by electromyography varies with the
technique used. A gross estimate can be made from the
raw EMG tracing. This immediately introduces the
question of the minimum significant signal (i.e., howsmall a signal has functional meaning). Most muscle
action begins with small spikes representing preparatory
activation of a few fibers prior to an EMG record,
which progressively shows greater density and ampli-
tude as the effort builds up to the dominant intensity. At
the end of the action, there is a corresponding decre-
ment. The slower the action, the more prominent are
these small onset and termination packets. They are
absent with ballistic movements. In addition, there may
be scattered small spikes between the dominant EMGpatterns. The inconsistency of these small spikes and
amplitudes too small to represent more than trace
function imply that they are inconsequential.
With experience, one can learn to subjectively
filter out these small spikes by eye. Kaufman found
“good agreement” among experienced therapists if
they averaged 10 cycles2
. Di Fabio(20) found that
computer designation with established criteria produced
consistent reproducibility of onset times, whereas visual
2Personal communication, 1994.
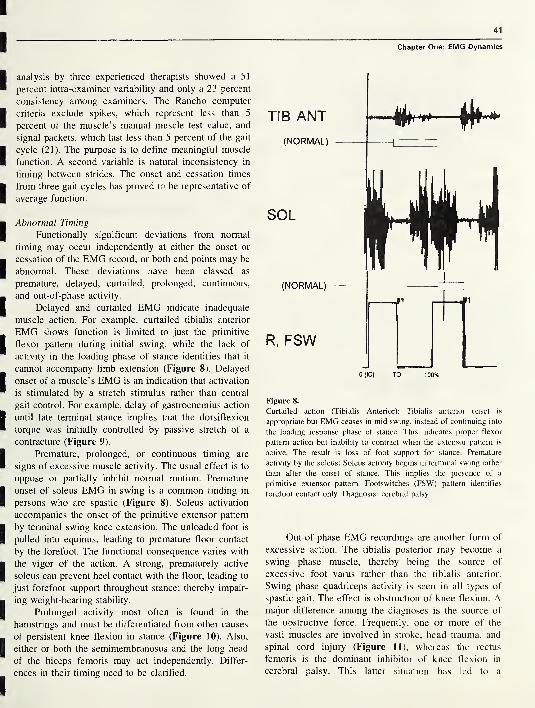
41
analysis by three experienced therapists showed a 51
percent intra-examiner variability and only a 23 percent
consistency among examiners. The Rancho computer
criteria exclude spikes, which represent less than 5
percent of the muscle’s manual muscle test value, and
signal packets, which last less than 5 percent of the gait
cycle (21). The purpose is to define meaningful muscle
function. A second variable is natural inconsistency in
timing between strides. The onset and cessation times
from three gait cycles has proved to be representative of
average function.
Abnormal Timing
Functionally significant deviations from normal
timing may occur independently at either the onset or
cessation of the EMG record, or both end points may be
abnormal. These deviations have been classed as
premature, delayed, curtailed, prolonged, continuous,
and out-of-phase activity.
Delayed and curtailed EMG indicate inadequate
muscle action. For example, curtailed tibialis anterior
EMG shows function is limited to just the primitive
flexor pattern during initial swing, while the lack of
activity in the loading phase of stance identifies that it
cannot accompany limb extension (Figure 8). Delayed
onset of a muscle’s EMG is an indication that activation
is stimulated by a stretch stimulus rather than central
gait control. For example, delay of gastrocnemius action
until late terminal stance implies that the dorsiflexion
torque was initially controlled by passive stretch of a
contracture (Figure 9).
Premature, prolonged, or continuous timing are
signs of excessive muscle activity. The usual effect is to
oppose or partially inhibit normal motion. Premature
onset of soleus EMG in swing is a common finding in
persons who are spastic (Figure 8). Soleus activation
accompanies the onset of the primitive extensor pattern
by terminal swing knee extension. The unloaded foot is
pulled into equinus, leading to premature floor contact
by the forefoot. The functional consequence varies with
the vigor of the action. A strong, prematurely active
soleus can prevent heel contact with the floor, leading to
just forefoot support throughout stance; thereby impair-
ing weight-bearing stability.
Prolonged activity most often is found in the
hamstrings and must be differentiated from other causes
of persistent knee flexion in stance (Figure 10). Also,
either or both the semimembranosus and the long head
of the biceps femoris may act independently. Differ-
ences in their timing need to be clarified.
Chapter One: EMG Dynamics
TIB ANT
(NORMAL)
—ei :~i
SOL
(NORMAL)
R, FSW
0(IC) TO 100%
Figure 8.
Curtailed action (Tibialis Anterior): Tibialis anterior onset is
appropriate but EMG ceases in mid swing, instead of continuing into
the loading response phase of stance. This indicates proper flexor
pattern action but inability to contract when the extensor pattern is
active. The result is loss of foot support for stance. Premature
activity by the soleus: Soleus activity begins in terminal swing rather
than after the onset of stance. This implies the presence of a
primitive extensor pattern. Footswitches (FSW) pattern identifies
forefoot contact only. Diagnosis: cerebral palsy.
Out-of-phase EMG recordings are another form of
excessive action. The tibialis posterior may become a
swing phase muscle, thereby being the source of
excessive foot varus rather than the tibialis anterior.
Swing phase quadriceps activity is seen in all types of
spastic gait. The effect is obstruction of knee flexion. Amajor difference among the diagnoses is the source of
the obstructive force. Frequently, one or more of the
vasti muscles are involved in stroke, head trauma, and
spinal cord injury (Figure 11), whereas the rectus
femoris is the dominant inhibitor of knee flexion in
cerebral palsy. This latter situation has led to a
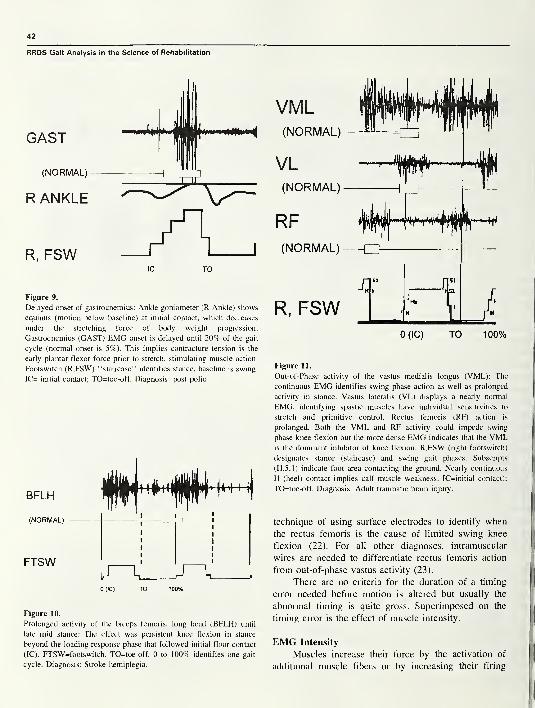
42
RRDS Gait Analysis in the Science of Rehabilitation
R, FSW
Figure 9.
Delayed onset of gastrocnemius: Ankle goniometer (R Ankle) shows
equinus (motion below baseline) at initial contact, which decreases
under the stretching force of body weight progression.
Gastrocnemius (GAST) EMG onset is delayed until 20% of the gait
cycle (normal onset is 5%). This implies contracture tension is the
early plantar flexor force prior to stretch, stimulating muscle action.
Footswitch (R,FSW) “staircase” identifies stance, baseline is swing.
IC= initial contact; TO=toe-off. Diagnosis: post polio.
Figure 10.
Prolonged activity of the biceps femoris, long head (BFLH) until
late mid stance: The effect was persistent knee flexion in stance
beyond the loading response phase that followed initial floor contact
(IC). FTSW=footswitch. TO=toe-off. 0 to 100% identifies one gait
cycle. Diagnosis: Stroke hemiplegia.
VML(NORMAL)
VL(NORMAL)
RF(NORMAL)
R, FSWXI
SI
IT')
X.t f
.f L r"
0 (IC) TO 100%
Figure 11.
Out-of-Phase activity of the vastus medialis longus (VML): The
continuous EMG identifies swing phase action as well as prolonged
activity in stance. Vastus lateralis (VL) displays a nearly normal
EMG, identifying spastic muscles have individual sensitivities to
stretch and primitive control. Rectus femoris (RF) action is
prolonged. Both the VML and RF activity could impede swing
phase knee flexion but the more dense EMG indicates that the VMLis the dominant inhibitor of knee flexion. R,FSW (right footswitch)
designates stance (staircase) and swing gait phases. Subscripts
(H,5,l) indicate foot area contacting the ground. Nearly continuous
H (heel) contact implies calf muscle weakness. IC=initial contact);
TO=toe-off. Diagnosis: Adult traumatic brain injury.
technique of using surface electrodes to identify when
the rectus femoris is the cause of limited swing knee
flexion (22). For all other diagnoses, intramuscular
wires are needed to differentiate rectus femoris action
from out-of-phase vastus activity (23).
There are no criteria for the duration of a timing
error needed before motion is altered but usually the
abnormal timing is quite gross. Superimposed on the
timing error is the effect of muscle intensity.
EMG Intensity
Muscles increase their force by the activation of
additional muscle fibers or by increasing their firing
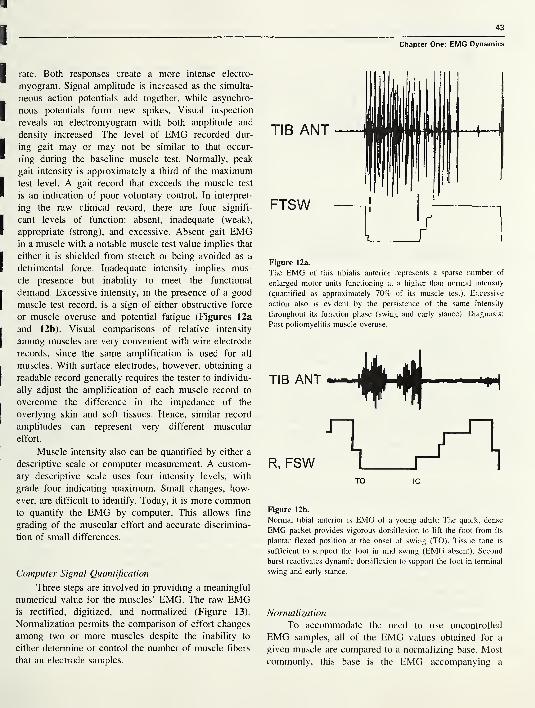
43
Chapter One: EMG Dynamics
rate. Both responses create a more intense electro-
myogram. Signal amplitude is increased as the simulta-
neous action potentials add together, while asynchro-
nous potentials form new spikes. Visual inspection
reveals an electromyogram with both amplitude and
density increased. The level of EMG recorded dur-
ing gait may or may not be similar to that occur-
ring during the baseline muscle test. Normally, peak
gait intensity is approximately a third of the maximumtest level. A gait record that exceeds the muscle test
is an indication of poor voluntary control. In interpret-
ing the raw clinical record, there are four signifi-
cant levels of function: absent, inadequate (weak),
appropriate (strong), and excessive. Absent gait EMGin a muscle with a notable muscle test value implies that
either it is shielded from stretch or being avoided as a
detrimental force. Inadequate intensity implies mus-
cle presence but inability to meet the functional
demand. Excessive intensity, in the presence of a good
muscle test record, is a sign of either obstructive force
or muscle overuse and potential fatigue (Figures 12a
and 12b). Visual comparisons of relative intensity
among muscles are very convenient with wire electrode
records, since the same amplification is used for all
muscles. With surface electrodes, however, obtaining a
readable record generally requires the tester to individu-
ally adjust the amplification of each muscle record to
overcome the difference in the impedance of the
overlying skin and soft tissues. Hence, similar record
amplitudes can represent very different muscular
effort.
Muscle intensity also can be quantified by either a
descriptive scale or computer measurement. A custom-
ary descriptive scale uses four intensity levels, with
grade four indicating maximum. Small changes, how-
ever, are difficult to identify. Today, it is more commonto quantify the EMG by computer. This allows fine
grading of the muscular effort and accurate discrimina-
tion of small differences.
Computer Signal Quantification
Three steps are involved in providing a meaningful
numerical value for the muscles’ EMG. The raw EMGis rectified, digitized, and normalized (Figure 13).
Normalization permits the comparison of effort changes
among two or more muscles despite the inability to
either determine or control the number of muscle fibers
that an electrode samples.
Figure 12a.
The EMG of this tibialis anterior represents a sparse number of
enlarged motor units functioning at a higher than normal intensity
(quantified as approximately 70% of its muscle test). Excessive
action also is evident by the persistence of the same intensity
throughout its function phase (swing and early stance). Diagnosis:
Post poliomyelitis muscle overuse.
R, FSWTO 1C
Figure 12b.
Normal tibial anterior is EMG of a young adult: The quick, dense
EMG packet provides vigorous dorsiflexion to lift the foot from its
plantar flexed position at the onset of swing (TO). Tissue tone is
sufficient to support the foot in mid swing (EMG absent). Second
burst reactivates dynamic dorsiflexion to support the foot in terminal
swing and early stance.
Normalization
To accommodate the need to use uncontrolled
EMG samples, all of the EMG values obtained for a
given muscle are compared to a normalizing base. Most
commonly, this base is the EMG accompanying a

44
RRDS Gait Analysis in the Science of Rehabilitation
Figure 13.
Computer quantification of EMG record: a) the raw analog data are
collected digitally by sampling the signal at 2500 Hz; b) the signals
then are rectified by transposing the negative values to positive; and
c) the data are normalized and summed over designated intervals
(usually \% of the gait cycle) to generate a linear envelope that
expresses the data as percents of the maximum EMG reference.
maximum effort by that muscle. Hence, the individual
test values are expressed as a percentage of the base
value (i.e., %MVC).To meet the time constraints of simultaneously
testing six or eight muscles in a clinical setting, the
manual muscle test maximum is the customary normal-
izing base (%MMT). The procedure consists of record-
ing the EMG during the maximum effort test, calculat-
ing the mean for the one second with the highest EMG,and then relating each functional EMG to that value
using a common time interval, generally 0.01 second or
1 percent of the gait cycle.
An alternate approach uses each muscle’s peak
EMG in the gait cycle as the normalizing base and all
other phase values are related to it. This is convenient
but it does not allow one to compare relative intensity
among muscles, since the peak effort for each is 100
percent. This most often is used in situations where poor
patient cooperation makes muscle testing difficult.
Electromechanical Delay
The time between the onset of the myoelectric
signal and the initiation of muscle tension is called the
electromechanical delay (EMD). This interval is as-
sumed to represent the propagation of the action
potential along the muscle, the excitation-contraction
coupling process, and stretching of the muscle’s series
elastic component by the contracting component (8).
This delay is significant only if one wants to precisely
relate EMG and motion in selected research studies. In
general clinical practice, however, the difference in
timing is inconsequential. As the following summary
identifies, it also involves a very short time period
(5,8,24-26).
The differences have been found to relate to three
variables: method of muscle activation, mode of record-
ing the signals, and the method of identifying muscle
tension. Voluntary effort created the longest delays, and
knee extension, which requires moving a larger mass
than elbow flexion, was slower. Significantly faster
stimulation was attained with a reflex hammer or an
electrical current (Figure 14). Among the methods of
identifying the onset of muscle tension, the slowest was
a gross exercise unit, such as a Kin-Corn or goniometer
(26). A load cell force transducer in intimate contact
with the leg registered a quick response (8,27), but the
most sensitive motion instrument was an accelerometer.
Involved in these differences are both the inertia of the
limb and the lag within the mechanical testing system
(8). Different effort levels and comparisons of isometric
and isotonic action showed only minor differences in
the electromechanical delay between onset times, but
increasingly higher target forces required proportionally
greater total time. The combination of tendon tap
stimulation of knee extension measured with a force
transducer registered an EMD of 25 ms and electrical
stimulation shortened the delay to 20 ms. The shortest
EMD (16 ms) was recorded by testing voluntary biceps
activation of elbow flexion using an accelerometer for
motion sensing and gross magnification of the record
for easier reading of the data. It was calculated that the
transport time involved only 10 ms (24). Returning to
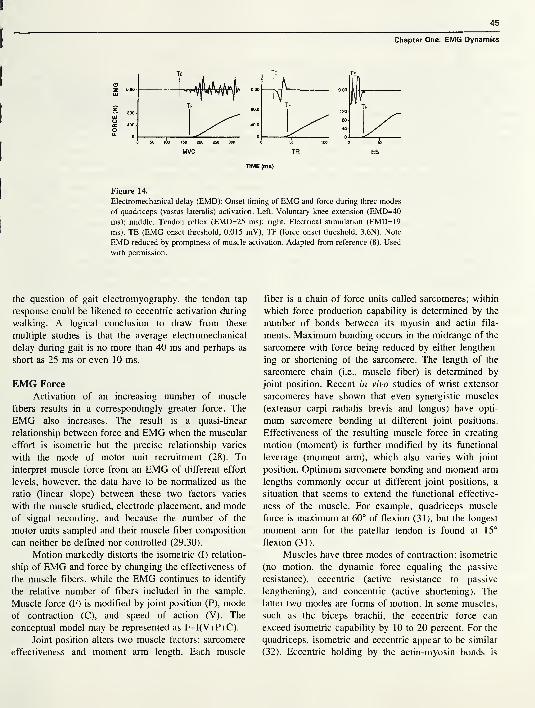
45
Chapter One: EMG Dynamics
Figure 14.
Electromechanical delay (EMD): Onset timing of EMG and force during three modes
of quadriceps (vastus lateralis) activation. Left. Voluntary knee extension (EMD=40
ms); middle. Tendon reflex (EMD=25 ms); right. Electrical stimulation (EMD=19
ms). TE (EMG onset threshold, 0.015 mV), TF (force onset threshold, 3.6N). Note
EMD reduced by promptness of muscle activation. Adapted from reference (8). Used
with permission.
the question of gait electromyography, the tendon tap
response could be likened to eccentric activation during
walking. A logical conclusion to draw from these
multiple studies is that the average electromechanical
delay during gait is no more than 40 ms and perhaps as
short as 25 ms or even 10 ms.
EMG Force
Activation of an increasing number of muscle
fibers results in a correspondingly greater force. The
EMG also increases. The result is a quasi-linear
relationship between force and EMG when the muscular
effort is isometric but the precise relationship varies
with the mode of motor unit recruitment (28). To
interpret muscle force from an EMG of different effort
levels, however, the data have to be normalized as the
ratio (linear slope) between these two factors varies
with the muscle studied, electrode placement, and mode
of signal recording, and because the number of the
motor units sampled and their muscle fiber composition
can neither be defined nor controlled (29,30).
Motion markedly distorts the isometric (I) relation-
ship of EMG and force by changing the effectiveness of
the muscle fibers, while the EMG continues to identify
the relative number of fibers included in the sample.
Muscle force (F) is modified by joint position (P), mode
of contraction (C), and speed of action (V). The
conceptual model may be represented as F=I(V+P+C).
Joint position alters two muscle factors: sarcomere
effectiveness and moment arm length. Each muscle
fiber is a chain of force units called sarcomeres; within
which force production capability is determined by the
number of bonds between its myosin and actin fila-
ments. Maximum bonding occurs in the midrange of the
sarcomere with force being reduced by either lengthen-
ing or shortening of the sarcomere. The length of the
sarcomere chain (i.e., muscle fiber) is determined by
joint position. Recent in vivo studies of wrist extensor
sarcomeres have shown that even synergistic muscles
(extensor carpi radialis brevis and longus) have opti-
mum sarcomere bonding at different joint positions.
Effectiveness of the resulting muscle force in creating
motion (moment) is further modified by its functional
leverage (moment arm), which also varies with joint
position. Optimum sarcomere bonding and moment arm
lengths commonly occur at different joint positions, a
situation that seems to extend the functional effective-
ness of the muscle. For example, quadriceps muscle
force is maximum at 60° of flexion (31), but the longest
moment arm for the patellar tendon is found at 15°
flexion (31).
Muscles have three modes of contraction: isometric
(no motion, the dynamic force equaling the passive
resistance), eccentric (active resistance to passive
lengthening), and concentric (active shortening). The
latter two modes are forms of motion. In some muscles,
such as the biceps brachii, the eccentric force can
exceed isometric capability by 10 to 20 percent. For the
quadriceps, isometric and eccentric appear to be similar
(32). Eccentric holding by the actin-myosin bonds is
46
RRDS Gait Analysis in the Science of Rehabilitation
enhanced by titin, a third protein (33). Concentric
contraction requires serial re-bonding of the actin and
myosin protein filaments as the muscle actively short-
ens. This is less efficient, resulting in a force approxi-
mately 20 percent less than isometric. Hence, for the
same EMG signal, the resulting force depends on
whether the effort is isometric, eccentric, or concentric;
while the EMG representative of muscle fiber involve-
ment remains unchanged (Figures 15a and 15b).
The velocity of motion influences the muscle force
of concentric effort but not eccentric activity. As actin -
myosin bonding is rate dependent, sarcomere stability is
reduced with fast shortening contractions, and muscle
force correspondingly decreases. During walking,
sarcomere sensitivity to speed relates only to swing
phase events. In stance, muscle action is primarily
isometric and eccentric; thus, there is a reliable relation-
ship between the normalized EMG and the muscle
forces being employed.
EMG Relationship to MomentsDuring walking, the amount of effort a muscle
must exert at any instant in time is determined by the
destabilizing influence that falling body weight has on
the joint controlled by that muscle. Engineers define this
destabilizing rotational force as a moment. The signifi-
cant factors are the magnitude of the falling body
weight force (measured as a ground reaction force) and
the perpendicular distance between that force line
(vector) and the joint center (moment arm). Stability is
preserved by an equal and opposite moment from
muscular action. This approach is an accurate represen-
tation of normal muscle group function. Antagonistic
cocontraction is minimal and there are no other
significant destabilizing forces. At the knee, for ex-
ample, the moment calculation is a good representation
of quadriceps effort during weight acceptance as the
period of hamstring activity at the onset of stance is
brief and of low intensity. At the same time, the
mechanics at the foot are contributing to the demand
moment. Hence, there are no hidden forces to impose
significant deviations in the moment calculations.
A commonly unrecognized problem, however, is
the assignment of muscle action to passive events.
Contrary to pure mechanics, the human body has an
acute feedback system (proprioception), which allows
intelligent use of passive mobility. Examples are mid
stance hip extension and late stance hip abduction
induced by the fall of body weight following the
swinging limb (34). In these instances, passive momen-tum has been used instead of muscle agonists (35).
Moment calculations have the added limitation of
identifying only group muscle action. Delineation of
individual muscle activity necessitates dynamic EMG.Pathology can impose serious compromises to the
prediction of muscle action with moments. In spastic
diseases, such as spastic paralysis or stroke, intense
cocontraction may exist. Prolonged cocontraction by the
hamstring muscles may require greater quadriceps
intensity than is indicated by moment calculations.
Faulty foot support by either prolonged heel only or
forefoot floor contact also can impose unrecognized
instability at the knee and hip, leading to additional
muscle action not evidenced by the calculated moment.
For example, persons with spastic paralysis who have a
crouch gait as the result of prolonged hamstring muscle
action, preserve balance over their flexed knee by
leaning forward. Associated limitations in ankle
dorsiflexion impose a toe stance. The resulting posture
is accompanied by EMG recordings showing strong
quadriceps and antagonistic hamstring activity. Simula-
tion of this posture in nonimpaired subjects confirmed
intense cocontraction of agonists and antagonists at both
the ankle and knee resulting from limb posture rather
than spasticity (36).
SUMMARY
Dynamic electromyography enables the clinician or
research investigator to define the timing and intensity
of individual muscle function during gait and other
functional activities. Moment calculations identify the
action of controlling muscle groups during normal
function, but may become inaccurate when pathology
alters the balance of passive and active forces. Wire
electrodes, by their placement within the designated
muscle, provide a more precise definition of both timing
and intensity of muscle action than do surface elec-
trodes, but require needle penetration of the skin.
Surface electrodes have the advantage of convenience.
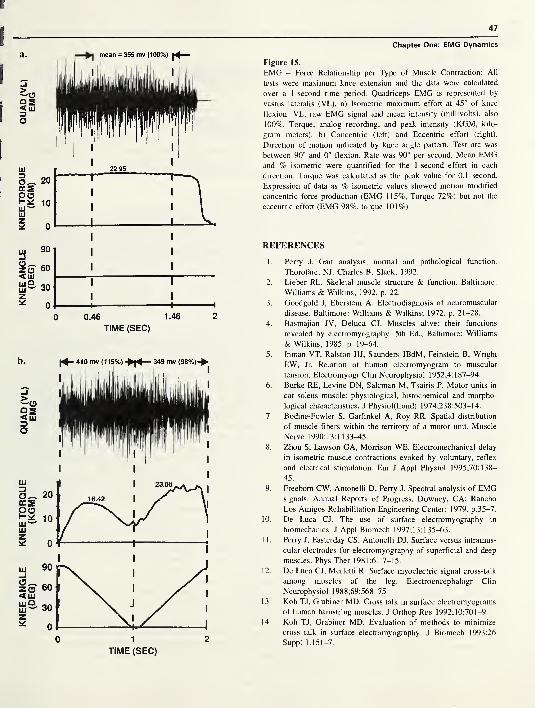
KNEE
ANGLE
KNEE
TORQUE
QUAD
(VL)
^
KNEE
ANGLE
KNEE
TORQUE
QUAD
(VL)
(DEG)
(KGM)
EMG
(DEG)
(KGM)
EMG
47
a.
901 I I
60 I I
30I I
0 1 1 1
0 0.46 1.46 2
TIME (SEC)
Chapter One: EMG Dynamics
Figure 15.
EMG - Force Relationship per Type of Muscle Contraction: All
tests were maximum knee extension and the data were calculated
over a 1 -second time period. Quadriceps EMG is represented by
vastus lateralis (VL). a) Isometric maximum effort at 45° of knee
flexion: VL. raw EMG signal and mean intensity (millivolts), also
100%. Torque, analog recording, and peak intensity (KGM, kilo-
gram meters), b) Concentric (left) and Eccentric effort (right).
Direction of motion indicated by knee angle pattern. Test arc was
between 90° and 0° flexion. Rate was 90° per second. Mean EMGand % isometric were quantified for the 1 -second effort in each
direction. Torque was calculated as the peak value for 0.1 second.
Expression of data as % isometric values showed motion modified
concentric force production (EMG 115%, Torque 72%) but not the
eccentric effort (EMG 98%, torque 101%).
REFERENCES
1. Perry J. Gait analysis, normal and pathological function.
Thorofare, NJ: Charles B. Slack; 1992.
2. Lieber RL. Skeletal muscle structure & function. Baltimore:
Williams & Wilkins; 1992. p. 22.
3. Goodgold J, Eberstein A. Electrodiagnosis of neuromuscular
disease. Baltimore: Williams & Wilkins; 1972. p. 21-28.
4. Basmajian JV, Deluca CJ. Muscles alive: their functions
revealed by electromyography. 5th Ed., Baltimore: Williams
& Wilkins; 1985. p. 19-64.
5. Inman VT, Ralston HJ, Saunders JBdM, Feinstein B, Wright
EW, Jr. Relation of human electromyogram to muscular
tension. Electromyogr Clin Neurophysiol 1952;4:187-94.
6. Burke RE, Levine DN, Salcman M, Tsairis P. Motor units in
cat soleus muscle: physiological, histochemical and morpho-
logical characteristics. J Physiol(Lond) 1974;238:503-14.
7. Bodine-Fowler S, Garfinkel A, Roy RR. Spatial distribution
of muscle fibers within the territory of a motor unit. Muscle
Nerve 1990;13:1133-45.
8. Zhou S, Lawson GA, Morrison WE. Electromechanical delay
in isometric muscle contractions evoked by voluntary, reflex
and electrical stimulation. Eur J Appl Physiol 1 995;70: 1 38—
45.
9. Freeborn CW, Antonelli D, Perry J. Spectral analysis of EMGsignals. Annual Reports of Progress. Downey, CA: Rancho
Los Amigos Rehabilitation Engineering Center; 1979. p.35-7.
10. De Luca CJ. The use of surface electromyography in
biomechanics. J Appl Biomech 1997;13:135-63.
1 1. Perry J, Easterday CS, Antonelli DJ. Surface versus intramus-
cular electrodes for electromyography of superficial and deep
muscles. Phys Ther 1981;61:7-15.
1 2. De Luca CJ, Merletti R. Surface myoelectric signal cross-talk
among muscles of the leg. Electroencephalogr Clin
Neurophysiol 1988;69:568-75.
13. Koh TJ, Grabiner MD. Cross talk in surface electromyograms
of human hamstring muscles. J Orthop Res 1992;10:701-9.
14. Koh TJ, Grabiner MD. Evaluation of methods to minimize
cross talk in surface electromyography. J Biomech 1993;26
Suppl 1:151-7.
48
RRDS Gait Analysis in the Science of Rehabilitation
15. Frost G, Dowling J, Dyson K, Bar-or O. Cocontraction in
three age groups of children during treadmill locomotion. J
Electromyogr Kinesiol 1997;7:179-86.
16. Perry J, Antonelli D. The dynamics of EMG, force, movement
relationships for knee extension. Annual Reports of Progress.
Downey, CA: Rancho Los Amigos Rehabilitation Engineering
Center; 1980. p. 45-8.
17. Basmajian JV, Stecko G. The role of muscles in arch support
of the foot. J Bone Joint Surg 1963;45A:1 184-90.
18. Bontrager E. Footswitch stride analyzer. Bull Prosthet Res
198 1 ; 1 8(1 ):284—8.
19. DiVita P. The selection of a standard convention for
analyzing gait data based on the analysis of relevant
biomechanical factors. J Biomech 1994;27:501-8.
20. DiFabio RP. Reliability of computerized surface electro-
myography for determining the onset of muscle activity. Phys
Ther 1987;67(l):43-8.
21. Perry J, Bontrager EL, Bogey RA, Gronley JK, Barnes LA.
The Rancho EMG Analyzer: a computerized system for gait
analysis. J Biomed Eng 1993;15:487-96.
22. Ounpuu S, DeLuca PA, Bell KJ, Davis RB. Using surface
electrodes for the evaluation of the rectus femoris, vastus
medialis and vastus lateralis in children with cerebral palsy.
Gait Posture 1997;5:211-6.
23. Agarwal GC, Gottlieb GL. Mathematical modeling and
simulation of the postural control loop, Part II. Crit Rev
Biomed Eng 1984;11:113-54.
24. Corcos DM, Gottlieb GL, Latash ML, Almeida GL, Agarwal
GC. Electromechanical delay: an experimental artifact. J
Electromyogr Kinesiol 1992;2:59-68.
25. Ralston HJ, Todd FN, Inman VT. Comparison of electrical
activity and duration of tension in the human rectus femoris
muscle. Electromyogr Clin Neurophysiol 1976;16:277-86.
26. Vos EJ, Harlaar J, Schenau GJVI. Electromechanical delay
during knee extensor contractions. Med Sci Sports
1998;23:1187-93.
27. Viitasalo JT, Komi PV. Interrelationships between electro-
myographic, mechanical, muscle structure and reflex time
measurements in man. Acta Physiol Scand 1981;111:97-103.
28. Solomonow M, Baratta R, Shoji H, D’Ambrosia R. The
EMG-force relationships of skeletal muscle; dependence on
contraction rate, and motor units control strategy. Electro-
myogr Clin Neurophysiol 1990;30:141-52.
29. Lawrence JH, De Luca CJ. Myoelectric signal versus force
relationship in different human muscles. J Appl Physiol
1983;54(6): 1653-9.
30. Perry J, Bekey GA. EMG-force relationships in skeletal
muscle. Crit Rev Biomed Eng 1 98 1 ;7( 1 ): 1 —22.
3 1 . Perry J, Antonelli D, Ford W. Analysis of knee-joint forces
during flexed-knee stance. J Bone Joint Surg 1975;
57A(7):961-7.
32. Smidt GL. Biomechanical analysis of knee flexion and
extension. J Biomech 1973;6:79-92.
33. Horowits R, Podolsky RJ. The positional stability of thick
filaments in activated skeletal muscle depends on sarcomere
length: evidence for the role of titin filaments. J Cell Biol
1987;105:2217-23.
34. Hardt DE. Determining muscle forces in the leg during
normal human walking: an application and evaluation of
optimization methods. J Biomed Eng 1978;100:72-8.
35. Lyons K, Perry J, Gronley JK, Barnes L, Antonelli D. Timing
and relative intensity of hip extensor and abductor muscle
action during level and stair ambulation: an EMG study. Phys
Ther 1983;63:1597-605.
36. Thomas SS, Moore C, Kelp-Lenane C, Norris C. Simulated
gait patterns: the resulting effects on gait parameters, dynamic
electromyography, joint moments and physiological cost
indices. Gait Posture 1996;4:100-7.
JACQUELIN PERRY, M.D., D.Sc. (HON), is the world’s leading
authority on the biomechanics of human locomotion. She has been a
Board Certified Orthopaedic Surgeon since 1958. She is a long-time
member of the American Academy of Orthopaedic Surgeons, as well
as of many medical societies. She served in the United States Army
as a physical therapist, from 1941 to 1945, after being certified in
physical therapy at Walter Reed Army General Hospital and is an
active member of the American Physical Therapy Association. She
has been a member of the Department of Veterans Affairs,
Rehabilitation Research and Development Service, Scientific Review
and Evaluation Board, since 1982, reviewing research grant propos-
als submitted to the VA.
Dr. Perry joined the Rancho Los Amigos Hospital staff as the
Chief of Orthopaedic Surgery of the Adult Poliomyelitis Service in
1955 and has been the Chief of Pathokinesiology Service, Director,
Quality Assurance Program since that time. Paralytic hand dysfunc-
tion led her to initiate a dynamic electromyography program in 1961
to study hand muscle phasing with intramuscular (wire) electrodes.
The same year, vaccine eradication of acute polio allowed Dr. Perry
to start a CVA Service. Inconsistencies between observed gait
deficits and clinical findings led to the initiation of a gait laboratory
to define muscle function by EMG. A foot switch system was
designed for timing. Motion analysis by video observation was later
augmented by kinematic and kinetic systems. Technical refinements
to allow clear delineation of adjacent muscle action and automated
EMG interpretation have been her major objectives.
Dr. Perry has over 300 publications, the most prominent being
her book Gait Analysis: Normal and Pathological Function. She has
received 27 formal honors for her work in orthopaedic surgery, gait
analysis, and rehabilitation.
In 1 998, Dr. Perry and her staff moved into the Jacquelin Perry
Neuro-Trauma Institute and Rehabilitation Center (JPI), a new
three-story, state-of-the-art hospital. She was awarded the honorary
degree of Doctor of Science by the University of California and the
Helen J. Hislop award for Outstanding Contributions to Professional
Literature at the 1998 APTA Annual National Conference Honors
and Awards ceremony. Her current status is emeritus professor of
orthopaedic surgery, emeritus professor of biokinesiology and
physical therapy, medical consultant for the Rancho Los Amigos
Pathokinesiology Service (which she established in 1968 for the
primary purpose of studying normal and pathological gait) and
Centinela Hospital biomechanics laboratory. Chief of the Post-Polio
Service, and gait consultant to the Traumatic Brain Injury Service.
SECTION TWO
Chapter Two
Motion Analysis and Biomechanics
by Robert W. Soutas-Little, Ph.D.
Dr. Soutas-Little is a Professor of Theoretical Mechanics and Director of both the Biomechanics Evaluation
Laboratory and Biodynamics Laboratory at Michigan State University in East Lansing, Michigan.
INTRODUCTION
Classical, or Newtonian, mechanics is the oldest
branch of physics devoted to the study of motion, the
forces that cause that motion, and the internal forces
that act within the body. Biomechanics is the applica-
tion of Newtonian mechanics to the study of the
neuromuscular skeletal system. Biomechanics has found
its greatest use in orthopaedics and physical medicine
and rehabilitation characterizing function and dysfunc-
tion of the muscular skeletal system. One branch of
biomechanics, gait analysis or motion analysis of human
gait, has developed since early studies in the late 1900s.
Motion analysis has been extended during the past two
decades to investigate many other activities in addition
to gait analysis. Currently, postural balance studies, stair
ascending, or descending, and upper limbs are all being
studied using motion analysis and the techniques of
biodynamics. Although motion analysis requires the use
of the mathematical techniques of dynamics, the presen-
tation here will be on a conceptual basis where possible.
TEMPORAL PARAMETERS OF THE GAITCYCLE
There are variations in the definitions of the
different phases of the gait cycle during walking but the
most commonly defined phases will be discussed here.
The gait cycle is defined as the period from heel contact
of one foot (for example, the left foot) to the next heel
contact of the same foot. This cycle is broken into two
parts, stance phase and swing phase. On the average, the
gait cycle is about one second in duration with 60
percent in stance and 40 percent in swing. The stance
phase is further divided into an initial double stance,
followed by a period of single stance and then a final
period of double stance. Double stance indicates that
both feet are in contact with the ground; single stance is
the period when only one foot is in contact with the
ground. When walking, there must be a period of
double stance and when running, this period is replaced
by a flight phase during which neither foot is in contact
with the ground. The walking gait cycle is illustrated in
Figure 1 . During the early part of stance phase, the heel
is in contact with the ground, progressing to foot-flat
during single stance and then to the forefoot contact
during the final double stance phase ending with toe-off.
This would be the normal contact areas of the plantar
surface of the foot with the ground but may vary greatly
with pathological gait. For example, equinus gait is
characterized by the forefoot striking the ground first
and then the contact area, progressing to the posterior in
some cases while in others the heel never contacts the
ground.
During double stance, the weight is transferred
from one foot to the other. During single stance, the
center of mass of the body passes over the foot in
49

50
RRDS Gait Analysis in the Science of Rehabilitation
A I A |Right swing Left swing
Figure 1 The Gait Cycle
Figure 1.
Temporal parameters of the gait cycle.
preparation for shifting to the other limb. Walking has
been described as a series of falls from one limb to the
other and it is obvious that the greatest danger of an
actual fall is during this period of transferring weight.
BODY SEGMENTS
It is important to understand the basic assumptions
that are made to analyze human motion using the
techniques of rigid body dynamics. The most basic
assumption is that body segments can be modeled as
rigid bodies, that is, the position and motion of the
underlying skeleton can be approximated by tracking
the position and motion of the surface tissue. The error
that arises is referred to as soft tissue motion error,
which is inherent in all motion analysis of human
subjects. Only a few research tests have been performed
to test the amount of error due to soft tissue movement
and these tests have involved invasive techniques of
putting pins in the bones and attaching markers to those
pins and comparing pin marker movement with that of
surface markers (1). Therefore, it is important to place
surface markers at points where soft tissue movement is
a minimum. Obviously, this can present problems when
testing individuals who are obese.
When a body is modeled as a rigid body, the
distance between any two points on that body is
constant. Consider a body segment such as the thigh
modeled as a single rigid body, as shown in Figure 2.
Three markers are shown on the body segment so that
they are non-collinear, that is, they do not lie on a line.
The markers form a triangle on the body segment and it
is assumed that the lines AB, BC, and CA do not
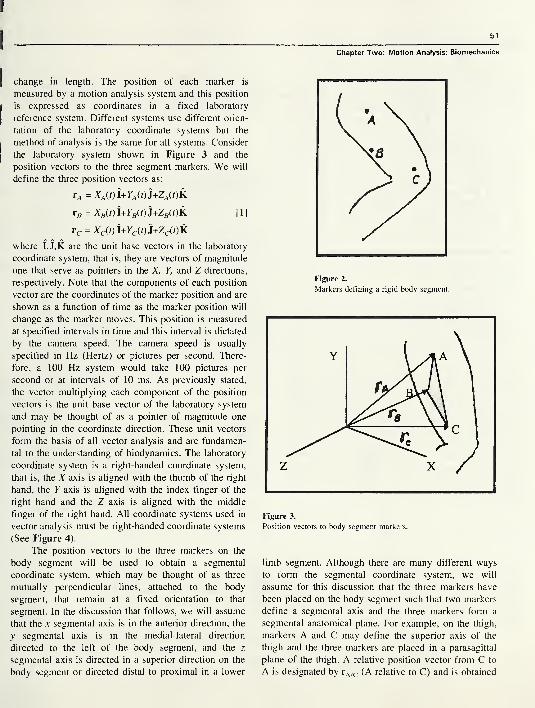
51
Chapter Two: Motion Analysis: Biomechanics
change in length. The position of each marker is
measured by a motion analysis system and this position
is expressed as coordinates in a fixed laboratory
reference system. Different systems use different orien-
tation of the laboratory coordinate systems but the
method of analysis is the same for all systems. Consider
the laboratory system shown in Figure 3 and the
position vectors to the three segment markers. We will
define the three position vectors as:
rA = XA(t)l+YA(t)3+ZA(t)k
r„ = X„W+YB(t)J+ZB(t)K [1]
rc = Xc(t)i+Yc(t)J+Zc(t)k
where I,J,K are the unit base vectors in the laboratory
coordinate system, that is, they are vectors of magnitude
one that serve as pointers in the X, Y, and Z directions,
respectively. Note that the components of each position
vector are the coordinates of the marker position and are
shown as a function of time as the marker position will
change as the marker moves. This position is measured
at specified intervals in time and this interval is dictated
by the camera speed. The camera speed is usually
specified in Hz (Hertz) or pictures per second. There-
fore, a 100 Hz system would take 100 pictures per
second or at intervals of 10 ms. As previously stated,
the vector multiplying each component of the position
vectors is the unit base vector of the laboratory system
and may be thought of as a pointer of magnitude one
pointing in the coordinate direction. These unit vectors
form the basis of all vector analysis and are fundamen-
tal to the understanding of biodynamics. The laboratory
coordinate system is a right-handed coordinate system,
that is, the X axis is aligned with the thumb of the right
hand, the Y axis is aligned with the index finger of the
right hand and the Z axis is aligned with the middle
finger of the right hand. All coordinate systems used in
vector analysis must be right-handed coordinate systems
(See Figure 4).
The position vectors to the three markers on the
body segment will be used to obtain a segmental
coordinate system, which may be thought of as three
mutually perpendicular lines, attached to the body
segment, that remain at a fixed orientation to that
segment. In the discussion that follows, we will assume
that the x segmental axis is in the anterior direction, the
y segmental axis is in the medial-lateral direction
directed to the left of the body segment, and the z
segmental axis is directed in a superior direction on the
body segment or directed distal to proximal in a lower
Figure 2.
Markers defining a rigid body segment.
Figure 3.
Position vectors to body segment markers.
limb segment. Although there are many different ways
to form the segmental coordinate system, we will
assume for this discussion that the three markers have
been placed on the body segment such that two markers
define a segmental axis and the three markers form a
segmental anatomical plane. For example, on the thigh,
markers A and C may define the superior axis of the
thigh and the three markers are placed in a parasagittal
plane of the thigh. A relative position vector from C to
A is designated by rA/c (A relative to C) and is obtained
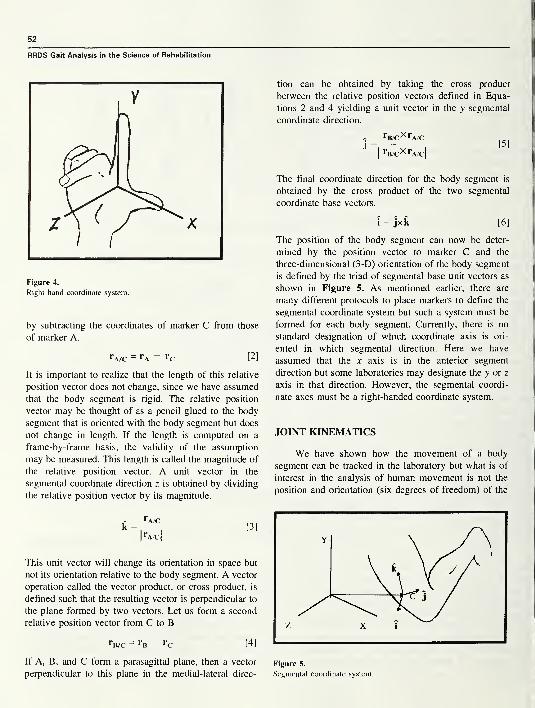
52
RRDS Gait Analysis in the Science of Rehabilitation
Figure 4.
Right hand coordinate system.
by subtracting the coordinates of marker C from those
of marker A.
rA/c = rA - «c [2]
It is important to realize that the length of this relative
position vector does not change, since we have assumed
that the body segment is rigid. The relative position
vector may be thought of as a pencil glued to the body
segment that is oriented with the body segment but does
not change in length. If the length is computed on a
frame-by-frame basis, the validity of the assumption
may be measured. This length is called the magnitude of
the relative position vector. A unit vector in the
segmental coordinate direction z is obtained by dividing
the relative position vector by its magnitude.
This unit vector will change its orientation in space but
not its orientation relative to the body segment. A vector
operation called the vector product, or cross product, is
defined such that the resulting vector is perpendicular to
the plane formed by two vectors. Let us form a second
relative position vector from C to B
rB/C = rB — rC [4]
If A, B, and C form a parasagittal plane, then a vector
perpendicular to this plane in the medial-lateral direc-
tion can be obtained by taking the cross product
between the relative position vectors defined in Equa-
tions 2 and 4 yielding a unit vector in the y segmental
coordinate direction.
- rB/C XrA/Cj
= pj
|
rB/CXrA/c|
The final coordinate direction for the body segment is
obtained by the cross product of the two segmental
coordinate base vectors.
i = jxk [6]
The position of the body segment can now be deter-
mined by the position vector to marker C and the
three-dimensional (3-D) orientation of the body segment
is defined by the triad of segmental base unit vectors as
shown in Figure 5. As mentioned earlier, there are
many different protocols to place markers to define the
segmental coordinate system but such a system must be
formed for each body segment. Currently, there is no
standard designation of which coordinate axis is ori-
ented in which segmental direction. Here we have
assumed that the x axis is in the anterior segment
direction but some laboratories may designate the y or z
axis in that direction. However, the segmental coordi-
nate axes must be a right-handed coordinate system.
JOINT KINEMATICS
We have shown how the movement of a body
segment can be tracked in the laboratory but what is of
interest in the analysis of human movement is not the
position and orientation (six degrees of freedom) of the
Figure 5.
Segmental coordinate system.
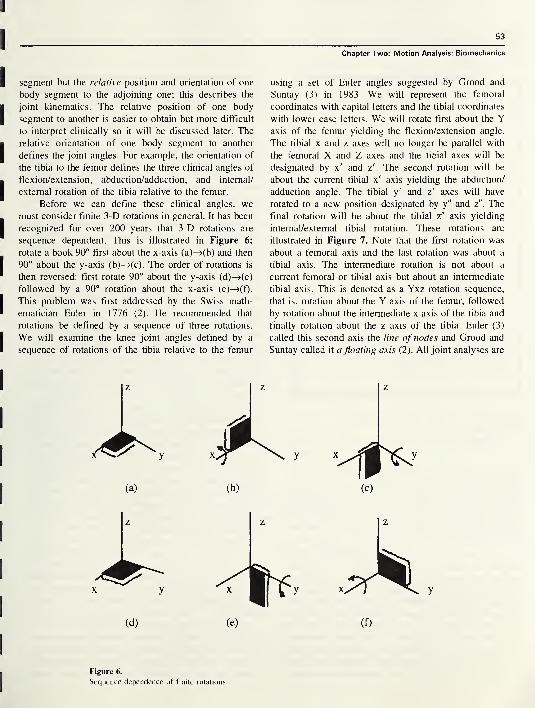
53
Chapter Two: Motion Analysis: Biomechanics
segment but the relative position and orientation of one
body segment to the adjoining one; this describes the
joint kinematics. The relative position of one body
segment to another is easier to obtain but more difficult
to interpret clinically so it will be discussed later. The
relative orientation of one body segment to another
defines the joint angles. For example, the orientation of
the tibia to the femur defines the three clinical angles of
flexion/extension, abduction/adduction, and internal/
external rotation of the tibia relative to the femur.
Before we can define these clinical angles, wemust consider finite 3-D rotations in general. It has been
recognized for over 200 years that 3-D rotations are
sequence dependent. This is illustrated in Figure 6;
rotate a book 90° first about the x-axis (a)—>(b) and then
90° about the y-axis (b)—>(c). The order of rotations is
then reversed: first rotate 90° about the y-axis (d)—>(e)
followed by a 90° rotation about the x-axis (e)—>(f).
This problem was first addressed by the Swiss math-
ematician Euler in 1776 (2). He recommended that
rotations be defined by a sequence of three rotations.
We will examine the knee joint angles defined by a
sequence of rotations of the tibia relative to the femur
using a set of Euler angles suggested by Grood and
Suntay (3) in 1983. We will represent the femoral
coordinates with capital letters and the tibial coordinates
with lower case letters. We will rotate first about the Yaxis of the femur yielding the flexion/extension angle.
The tibial x and z axes will no longer be parallel with
the femoral X and Z axes and the tibial axes will be
designated by x' and z'. The second rotation will be
about the current tibial x' axis yielding the abduction/
adduction angle. The tibial y' and z' axes will have
rotated to a new position designated by y" and z". The
final rotation will be about the tibial z" axis yielding
intemal/external tibial rotation. These rotations are
illustrated in Figure 7. Note that the first rotation was
about a femoral axis and the last rotation was about a
tibial axis. The intermediate rotation is not about a
current femoral or tibial axis but about an intermediate
tibial axis. This is denoted as a Yxz rotation sequence,
that is, rotation about the Y axis of the femur, followed
by rotation about the intermediate x axis of the tibia and
finally rotation about the z axis of the tibia. Euler (3)
called this second axis the line of nodes and Grood and
Suntay called it a floating axis (2). All joint analyses are
z z
(a) (b)
Figure 6.
Sequence dependence of finite rotations.
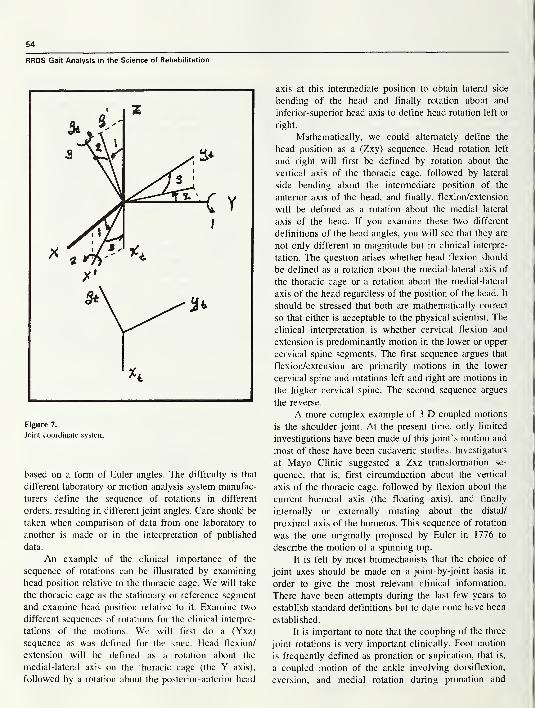
54
Figure 7.
Joint coordinate system.
based on a form of Euler angles. The difficulty is that
different laboratory or motion analysis system manufac-
turers define the sequence of rotations in different
orders, resulting in different joint angles. Care should be
taken when comparison of data from one laboratory to
another is made or in the interpretation of published
data.
An example of the clinical importance of the
sequence of rotations can be illustrated by examining
head position relative to the thoracic cage. We will take
the thoracic cage as the stationary or reference segment
and examine head position relative to it. Examine two
different sequences of rotations for the clinical interpre-
tations of the motions. We will first do a (Yxz)
sequence as was defined for the knee. Head flexion/
extension will be defined as a rotation about the
medial-lateral axis on the thoracic cage (the Y axis),
followed by a rotation about the posterior-anterior head
axis at this intermediate position to obtain lateral side
bending of the head and finally rotation about and
inferior-superior head axis to define head rotation left or
right.
Mathematically, we could alternately define the
head position as a (Zxy) sequence. Head rotation left
and right will first be defined by rotation about the
vertical axis of the thoracic cage, followed by lateral
side bending about the intermediate position of the
anterior axis of the head, and finally, flexion/extension
will be defined as a rotation about the medial lateral
axis of the head. If you examine these two different
definitions of the head angles, you will see that they are
not only different in magnitude but in clinical interpre-
tation. The question arises whether head flexion should
be defined as a rotation about the medial-lateral axis of
the thoracic cage or a rotation about the medial-lateral
axis of the head regardless of the position of the head. It
should be stressed that both are mathematically correct
so that either is acceptable to the physical scientist. The
clinical interpretation is whether cervical flexion and
extension is predominantly motion in the lower or upper
cervical spine segments. The first sequence argues that
flexion/extension are primarily motions in the lower
cervical spine and rotations left and right are motions in
the higher cervical spine. The second sequence argues
the reverse.
A more complex example of 3-D coupled motions
is the shoulder joint. At the present time, only limited
investigations have been made of this joint’s motion and
most of these have been cadaveric studies. Investigators
at Mayo Clinic suggested a Zxz transformation se-
quence, that is, first circumduction about the vertical
axis of the thoracic cage, followed by flexion about the
current humeral axis (the floating axis), and finally
internally or externally rotating about the distal/
proximal axis of the humerus. This sequence of rotation
was the one originally proposed by Euler in 1776 to
describe the motion of a spinning top.
It is felt by most biomechanists that the choice of
joint axes should be made on a joint-by-joint basis in
order to give the most relevant clinical information.
There have been attempts during the last few years to
establish standard definitions but to date none have been
established.
It is important to note that the coupling of the three
joint rotations is very important clinically. Foot motion
is frequently defined as pronation or supination, that is,
a coupled motion of the ankle involving dorsiflexion,
eversion, and medial rotation during pronation and
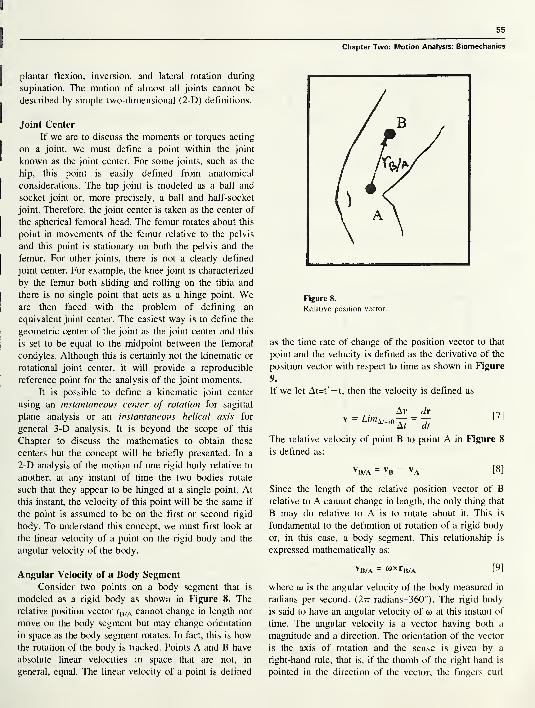
55
Chapter Two: Motion Analysis: Biomechanics
plantar flexion, inversion, and lateral rotation during
supination. The motion of almost all joints cannot be
described by simple two-dimensional (2-D) definitions.
Joint Center
If we are to discuss the moments or torques acting
on a joint, we must define a point within the joint
known as the joint center. For some joints, such as the
hip, this point is easily defined from anatomical
considerations. The hip joint is modeled as a ball and
socket joint or, more precisely, a ball and half-socket
joint. Therefore, the joint center is taken as the center of
the spherical femoral head. The femur rotates about this
point in movements of the femur relative to the pelvis
and this point is stationary on both the pelvis and the
femur. For other joints, there is not a clearly defined
joint center. For example, the knee joint is characterized
by the femur both sliding and rolling on the tibia and
there is no single point that acts as a hinge point. Weare then faced with the problem of defining an
equivalent joint center. The easiest way is to define the
geometric center of the joint as the joint center and this
is set to be equal to the midpoint between the femoral
condyles. Although this is certainly not the kinematic or
rotational joint center, it will provide a reproducible
reference point for the analysis of the joint moments.
It is possible to define a kinematic joint center
using an instantaneous center of rotation for sagittal
plane analysis or an instantaneous helical axis for
general 3-D analysis. It is beyond the scope of this
Chapter to discuss the mathematics to obtain these
centers but the concept will be briefly presented. In a
2-D analysis of the motion of one rigid body relative to
another, at any instant of time the two bodies rotate
such that they appear to be hinged at a single point. At
this instant, the velocity of this point will be the same if
the point is assumed to be on the first or second rigid
body. To understand this concept, we must first look at
the linear velocity of a point on the rigid body and the
angular velocity of the body.
Figure 8.
Relative position vector.
as the time rate of change of the position vector to that
point and the velocity is defined as the derivative of the
position vector with respect to time as shown in Figure
9.
If we let At=t'— t, then the velocity is defined as
vAr dr
dt
[7]
The relative velocity of point B to point A in Figure 8
is defined as:
VB/A = vB - VA [8]
Since the length of the relative position vector of Brelative to A cannot change in length, the only thing that
B may do relative to A is to rotate about it. This is
fundamental to the definition of rotation of a rigid body
or, in this case, a body segment. This relationship is
expressed mathematically as:
Angular Velocity of a Body Segment
Consider two points on a body segment that is
modeled as a rigid body as shown in Figure 8. The
relative position vector rB/A cannot change in length nor
move on the body segment but may change orientation
in space as the body segment rotates. In fact, this is howthe rotation of the body is tracked. Points A and B have
absolute linear velocities in space that are not, in
general, equal. The linear velocity of a point is defined
vB/a - wxrB/A [9]
where w is the angular velocity of the body measured in
radians per second. (2tt radians=360°). The rigid body
is said to have an angular velocity of u> at this instant of
time. The angular velocity is a vector having both a
magnitude and a direction. The orientation of the vector
is the axis of rotation and the sense is given by a
right-hand rule, that is, if the thumb of the right hand is
pointed in the direction of the vector, the fingers curl
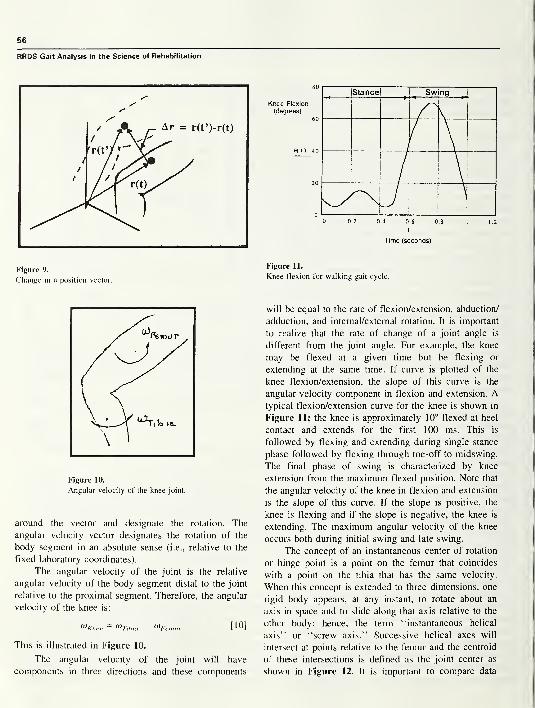
56
RRDS Gait Analysis in the Science of Rehabilitation
s'S'
S'
Figure 9.
Change in a position vector.
Figure 10.
Angular velocity of the knee joint.
around the vector and designate the rotation. The
angular velocity vector designates the rotation of the
body segment in an absolute sense (i.e., relative to the
fixed laboratory coordinates).
The angular velocity of the joint is the relative
angular velocity of the body segment distal to the joint
relative to the proximal segment. Therefore, the angular
velocity of the knee is:
<*Knee = Oi-nhia- MFemur [10]
This is illustrated in Figure 10.
The angular velocity of the joint will have
components in three directions and these components
0 0.2 0.4 0.6 0.8 1 1.2
I
Time (seconds)
Figure 11.
Knee flexion for walking gait cycle.
will be equal to the rate of flexion/extension, abduction/
adduction, and intemal/extemal rotation. It is important
to realize that the rate of change of a joint angle is
different from the joint angle. For example, the knee
may be flexed at a given time but be flexing or
extending at the same time. If curve is plotted of the
knee flexion/extension, the slope of this curve is the
angular velocity component in flexion and extension. Atypical flexion/extension curve for the knee is shown in
Figure 11; the knee is approximately 10° flexed at heel
contact and extends for the first 100 ms. This is
followed by flexing and extending during single stance
phase followed by flexing through toe-off to midswing.
The final phase of swing is characterized by knee
extension from the maximum flexed position. Note that
the angular velocity of the knee in flexion and extension
is the slope of this curve. If the slope is positive, the
knee is flexing and if the slope is negative, the knee is
extending. The maximum angular velocity of the knee
occurs both during initial swing and late swing.
The concept of an instantaneous center of rotation
or hinge point is a point on the femur that coincides
with a point on the tibia that has the same velocity.
When this concept is extended to three dimensions, one
rigid body appears, at any instant, to rotate about an
axis in space and to slide along that axis relative to the
other body; hence, the term “instantaneous helical
axis” or “screw axis.” Successive helical axes will
intersect at points relative to the femur and the centroid
of these intersections is defined as the joint center as
shown in Figure 12. It is important to compare data

57
Chapter Two: Motion Analysis: Biomechanics
only as the definition of a particular joint center is the
same in each analysis.
GROUND REACTION FORCES (GRF)
During gait, when the foot is in contact with the
ground it applies a force to the ground and a GRF is
developed that is equal and opposite to the force the
foot applies on the ground. We are interested in this
GRF because this is an external force acting on the
body while walking. The only other external force
acting on the body is gravitational attraction if wind
resistance or drag is neglected. The force the foot
applies to the ground is measured by a force plate or a
dynamometer that is mounted securely in the floor such
that its surface is flush with the floor (see Figure 13).
The force plate has an instrument center that is below
the floor and the resultant force and moment about this
instrument center is measured. These data are sampled
at a specific rate, usually 1000 Hz, or every millisecond.
The resultant force and moment are expressed in an
equivalent force system composed of the resultant force
acting at a specific point on the surface of the force
plate and a torque about the vertical axis. The resultant
ground-reaction force is divided into three components:
vertical, anterior/posterior, and medial/lateral. The
torque is called the ground reaction torque and the
unique point of the intercept of the GRF with the force
plate surface is called the center of pressure (COP) or
the center of force. The COP changes during stance
phase generally moving from the rear of the foot
anterior toward a point between the first and second
metatarsal heads. The path of the COP on the force
plate can be related to the path of the resultant
ground-reaction force on the plantar surface of the foot.
If an actual pressure distribution plot were obtained at
an instant during stance phase, the COP would be the
centroid of the pressure distribution. The COP path is
also generated in this manner when pressure mats are
used. Both pressure mats and force plates have been
discussed in the Introduction.
Let us consider each component of the GRFseparately; the largest is the vertical component and
accounts for the acceleration of the body’s center of
mass in the vertical direction during walking. A typical
plot of the vertical ground-reaction force is shown in
Figure 14 where the vertical reaction force is expressed
in percent of body weight (%BW). This curve is
sometimes called the M curve because it resembles that
Figure 12.
Intercepts of helical axes (HA).
Figure 13.
Force plate and center of pressure (COP).
Figure 14.
Vertical ground reaction force (GRF) during walking.
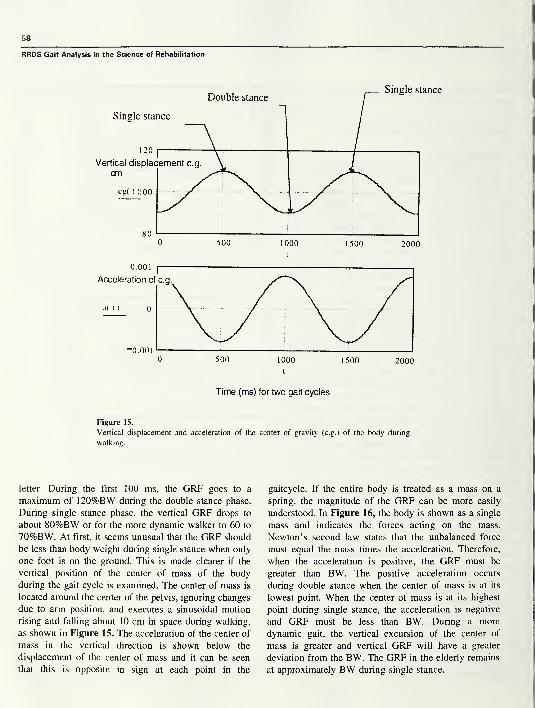
58
RRDS Gait Analysis in the Science of Rehabilitation
Figure 15.
Vertical displacement and acceleration of the center of gravity (c.g.) of the body during
walking.
letter. During the first 100 ms, the GRF goes to a
maximum of 120%BW during the double stance phase.
During single stance phase, the vertical GRF drops to
about 80%BW or for the more dynamic walker to 60 to
70%BW. At first, it seems unusual that the GRF should
be less than body weight during single stance when only
one foot is on the ground. This is made clearer if the
vertical position of the center of mass of the body
during the gait cycle is examined. The center of mass is
located around the center of the pelvis, ignoring changes
due to arm position, and executes a sinusoidal motion
rising and falling about 10 cm in space during walking,
as shown in Figure 15. The acceleration of the center of
mass in the vertical direction is shown below the
displacement of the center of mass and it can be seen
that this is opposite in sign at each point in the
gaitcycle. If the entire body is treated as a mass on a
spring, the magnitude of the GRF can be more easily
understood. In Figure 16, the body is shown as a single
mass and indicates the forces acting on the mass.
Newton’s second law states that the unbalanced force
must equal the mass times the acceleration. Therefore,
when the acceleration is positive, the GRF must be
greater than BW. The positive acceleration occurs
during double stance when the center of mass is at its
lowest point. When the center of mass is at its highest
point during single stance, the acceleration is negative
and GRF must be less than BW. During a more
dynamic gait, the vertical excursion of the center of
mass is greater and vertical GRF will have a greater
deviation from the BW. The GRF in the elderly remains
at approximately BW during single stance.
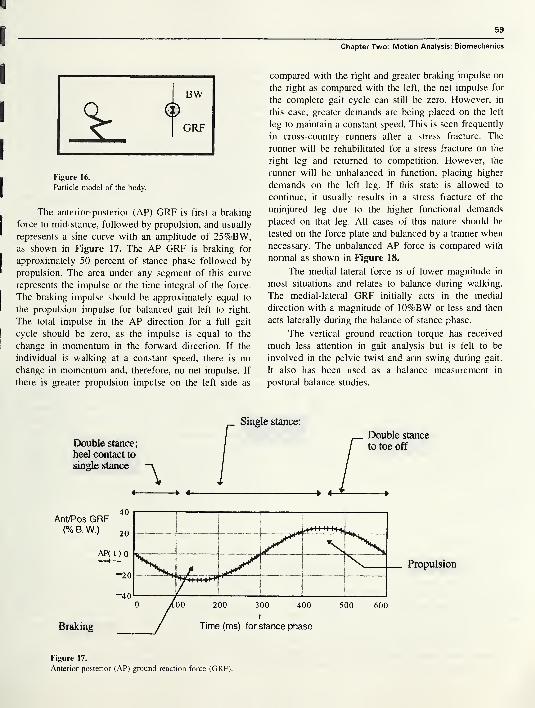
Chapter Two: Motion Analysis: Biomechanics
0
I
I
I
Figure 16.
Particle model of the body.
The anterior-posterior (AP) GRF is first a braking
force to mid-stance, followed by propulsion, and usually1
represents a sine curve with an amplitude of 25%BW,as shown in Figure 17. The AP GRF is braking for
j
approximately 50 percent of stance phase followed by
* propulsion. The area under any segment of this curve
represents the impulse or the time integral of the force.
The braking impulse should be approximately equal to
I the propulsion impulse for balanced gait left to right.
The total impulse in the AP direction for a full gait
I cycle should be zero, as the impulse is equal to the
I change in momentum in the forward direction. If the
individual is walking at a constant speed, there is no
i change in momentum and, therefore, no net impulse. If
|
there is greater propulsion impulse on the left side as
compared with the right and greater braking impulse on
the right as compared with the left, the net impulse for
the complete gait cycle can still be zero. However, in
this case, greater demands are being placed on the left
leg to maintain a constant speed. This is seen frequently
in cross-country runners after a stress fracture. The
runner will be rehabilitated for a stress fracture on the
right leg and returned to competition. However, the
runner will be unbalanced in function, placing higher
demands on the left leg. If this state is allowed to
continue, it usually results in a stress fracture of the
uninjured leg due to the higher functional demands
placed on that leg. All cases of this nature should be
tested on the force plate and balanced by a trainer when
necessary. The unbalanced AP force is compared with
normal as shown in Figure 18.
The medial-lateral force is of lower magnitude in
most situations and relates to balance during walking.
The medial-lateral GRF initially acts in the medial
direction with a magnitude of 10%BW or less and then
acts laterally during the balance of stance phase.
The vertical ground reaction torque has received
much less attention in gait analysis but is felt to be
involved in the pelvic twist and arm swing during gait.
It also has been used as a balance measurement in
postural balance studies.
Double stance;
heel contact to
single stance
4-
AF
Propulsion
Figure 17.
Anterior-posterior (AP) ground reaction force (GRF).
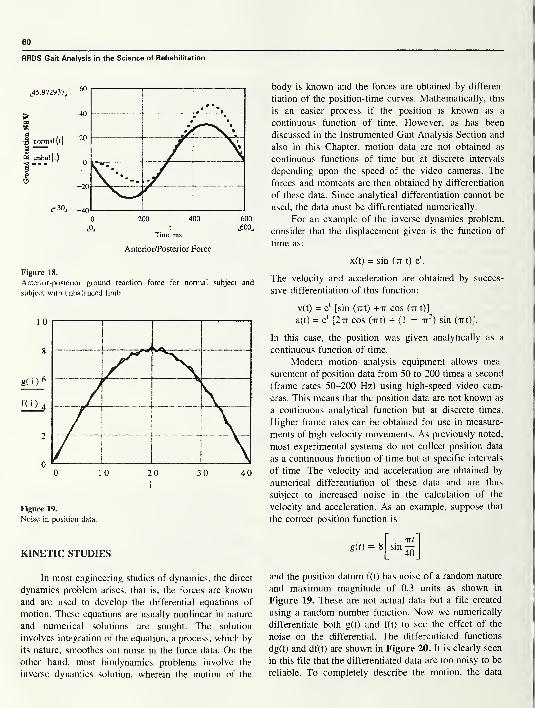
60
RRDS Gait Analysis in the Science of Rehabilitation
200 400
t
Time ms
Anterior/Posterior Force
600
,600,
Figure 18.
Anterior-posterior ground reaction force for normal subject and
subject with unbalanced limb.
Figure 19.
Noise in position data.
body is known and the forces are obtained by differen-
tiation of the position-time curves. Mathematically, this
is an easier process if the position is known as a
continuous function of time. However, as has been
discussed in the Instrumented Gait Analysis Section and
also in this Chapter, motion data are not obtained as
continuous functions of time but at discrete intervals
depending upon the speed of the video cameras. The
forces and moments are then obtained by differentiation
of these data. Since analytical differentiation cannot be
used, the data must be differentiated numerically.
For an example of the inverse dynamics problem,
consider that the displacement given is the function of
time as:
x(t) = sin (tt t) el
.
The velocity and acceleration are obtained by succes-
sive differentiation of this function:
v(t) = e‘ [sin (Tit) +tt cos (tt t)]
a(t) = el
[2tt cos (irt) + (1 - tt2) sin (-rrt)].
In this case, the position was given analytically as a
continuous function of time.
Modem motion analysis equipment allows mea-
surement of position data from 50 to 200 times a second
(frame rates 50-200 Hz) using high-speed video cam-
eras. This means that the position data are not known as
a continuous analytical function but at discrete times.
Higher frame rates can be obtained for use in measure-
ments of high velocity movements. As previously noted,
most experimental systems do not collect position data
as a continuous function of time but at specific intervals
of time. The velocity and acceleration are obtained by
numerical differentiation of these data and are thus
subject to increased noise in the calculation of the
velocity and acceleration. As an example, suppose that
the correct position function is
KINETIC STUDIESg(t) = 8
TXt
sinio
In most engineering studies of dynamics, the direct
dynamics problem arises, that is, the forces are known
and are used to develop the differential equations of
motion. These equations are usually nonlinear in nature
and numerical solutions are sought. The solution
involves integration of the equation; a process, which by
its nature, smoothes out noise in the force data. On the
other hand, most biodynamics problems involve the
inverse dynamics solution, wherein the motion of the
and the position datum f(t) has noise of a random nature
and maximum magnitude of 0.3 units as shown in
Figure 19. These are not actual data but a file created
using a random number function. Now we numerically
differentiate both g(t) and f(t) to see the effect of the
noise on the differential. The differentiated functions
dg(t) and df(t) are shown in Figure 20. It is clearly seen
in this file that the differentiated data are too noisy to be
reliable. To completely describe the motion, the data
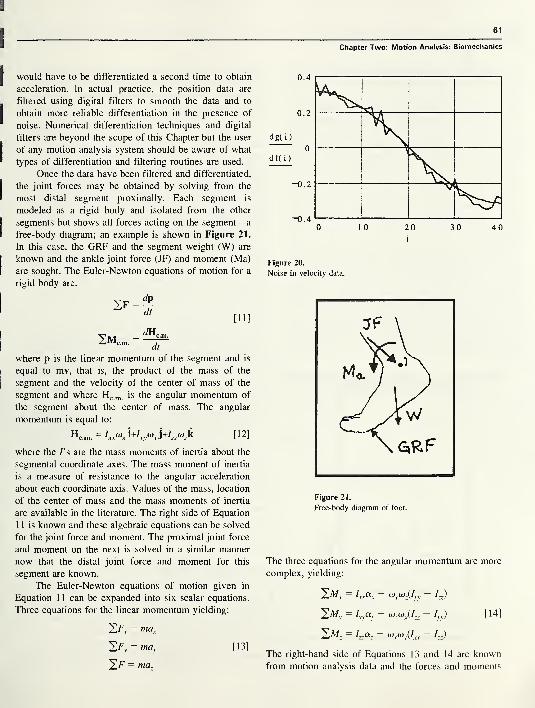
61
Chapter Two: Motion Analysis: Biomechanics
would have to be differentiated a second time to obtain
acceleration. In actual practice, the position data are
filtered using digital filters to smooth the data and to
obtain more reliable differentiation in the presence of
noise. Numerical differentiation techniques and digital
filters are beyond the scope of this Chapter but the user
of any motion analysis system should be aware of what
types of differentiation and filtering routines are used.
Once the data have been filtered and differentiated,
the joint forces may be obtained by solving from the
most distal segment proximally. Each segment is
modeled as a rigid body and isolated from the other
segments but shows all forces acting on the segment—
a
free-body diagram; an example is shown in Figure 21.
In this case, the GRF and the segment weight (W) are
known and the ankle joint force (JF) and moment (Ma)
are sought. The Euler-Newton equations of motion for a
rigid body are:
[ 11 ]
2Mc .m .
= ^Hc.r
dt
where p is the linear momentum of the segment and is
equal to mv, that is, the product of the mass of the
segment and the velocity of the center of mass of the
segment and where Hc m is the angular momentum of
the segment about the center of mass. The angular
momentum is equal to:
Hc .m .= Ixxo>x i+/
vva\,]+I
zzo)
zk [12]
where the /’ s are the mass moments of inertia about the
segmental coordinate axes. The mass moment of inertia
is a measure of resistance to the angular acceleration
about each coordinate axis. Values of the mass, location
of the center of mass and the mass moments of inertia
are available in the literature. The right side of Equation
1 1 is known and these algebraic equations can be solved
for the joint force and moment. The proximal joint force
and moment on the next is solved in a similar manner
now that the distal joint force and moment for this
segment are known.
The Euler-Newton equations of motion given in
Equation 1 1 can be expanded into six scalar equations.
Three equations for the linear momentum yielding:
^Fx = max
^Fy= ma
y [13]
^F = maz
0 1 0 20 30 40
Figure 20.
Noise in velocity data.
Figure 21.
Free-body diagram of foot.
The three equations for the angular momentum are more
complex, yielding:
2X = Z,A - (Jjytojjyy - /„)
= lyy
OLy~ (OjCO^ ~ M
Sat = I„az- 0)x(Oy(Ixx - /„)
The right-hand side of Equations 13 and 14 are known
from motion analysis data and the forces and moments
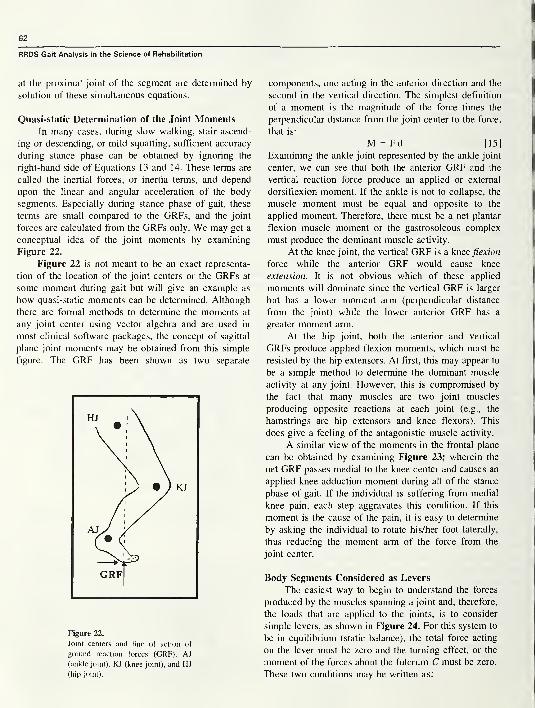
62
RRDS Gait Analysis in the Science of Rehabilitation
at the proximal joint of the segment are determined by
solution of these simultaneous equations.
Quasi-static Determination of the Joint MomentsIn many cases, during slow walking, stair ascend-
ing or descending, or mild squatting, sufficient accuracy
during stance phase can be obtained by ignoring the
right-hand side of Equations 13 and 14. These terms are
called the inertial forces, or inertia terms, and depend
upon the linear and angular acceleration of the body
segments. Especially during stance phase of gait, these
terms are small compared to the GRFs, and the joint
forces are calculated from the GRFs only. We may get a
conceptual idea of the joint moments by examining
Figure 22.
Figure 22 is not meant to be an exact representa-
tion of the location of the joint centers or the GRFs at
some moment during gait but will give an example as
how quasi-static moments can be determined. Although
there are formal methods to determine the moments at
any joint center using vector algebra and are used in
most clinical software packages, the concept of sagittal
plane joint moments may be obtained from this simple
figure. The GRF has been shown as two separate
Figure 22.
Joint centers and line of action of
ground reaction forces (GRF). AJ
(ankle joint), KJ (knee joint), and HJ
(hip joint).
components, one acting in the anterior direction and the
second in the vertical direction. The simplest definition
of a moment is the magnitude of the force times the
perpendicular distance from the joint center to the force,
that is:
M = F d [15]
Examining the ankle joint represented by the ankle joint
center, we can see that both the anterior GRF and the
vertical reaction force produce an applied or external
dorsiflexion moment. If the ankle is not to collapse, the
muscle moment must be equal and opposite to the
applied moment. Therefore, there must be a net plantar
flexion muscle moment or the gastrosoleous complex
must produce the dominant muscle activity.
At the knee joint, the vertical GRF is a knee flexion
force while the anterior GRF would cause knee
extension. It is not obvious which of these applied
moments will dominate since the vertical GRF is larger
but has a lower moment arm (perpendicular distance
from the joint) while the lower anterior GRF has a
greater moment arm.
At the hip joint, both the anterior and vertical
GRFs produce applied flexion moments, which must be
resisted by the hip extensors. At first, this may appear to
be a simple method to determine the dominant muscle
activity at any joint. However, this is compromised by
the fact that many muscles are two joint muscles
producing opposite reactions at each joint (e.g., the
hamstrings are hip extensors and knee flexors). This
does give a feeling of the antagonistic muscle activity.
A similar view of the moments in the frontal plane
can be obtained by examining Figure 23; wherein the
net GRF passes medial to the knee center and causes an
applied knee adduction moment during all of the stance
phase of gait. If the individual is suffering from medial
knee pain, each step aggravates this condition. If this
moment is the cause of the pain, it is easy to determine
by asking the individual to rotate his/her foot laterally,
thus reducing the moment arm of the force from the
joint center.
Body Segments Considered as Levers
The easiest way to begin to understand the forces
produced by the muscles spanning a joint and, therefore,
the loads that are applied to the joints, is to consider
simple levers, as shown in Figure 24. For this system to
be in equilibrium (static balance), the total force acting
on the lever must be zero and the turning effect, or the
moment of the forces about the fulcrum C must be zero.
These two conditions may be written as:
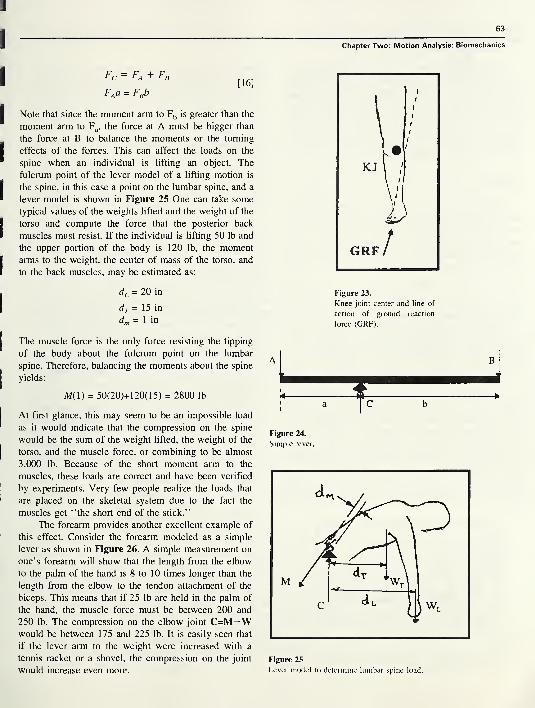
63
Chapter Two: Motion Analysis: Biomechanics
Fc = Fa + Fi
FAa = FBb[16]
Note that since the moment arm to Fb is greater than the
moment arm to Fa , the force at A must be bigger than
the force at B to balance the moments or the turning
effects of the forces. This can affect the loads on the
spine when an individual is lifting an object. The
fulcrum point of the lever model of a lifting motion is
the spine, in this case a point on the lumbar spine, and a
lever model is shown in Figure 25 One can take some
typical values of the weights lifted and the weight of the
torso and compute the force that the posterior back
muscles must resist. If the individual is lifting 50 lb and
the upper portion of the body is 120 lb, the moment
arms to the weight, the center of mass of the torso, and
to the back muscles, may be estimated as:
dL = 20 in
dT = 1 5 in
d,„ = 1 in
Figure 23.
Knee joint center and line of
action of ground reaction
force (GRF).
The muscle force is the only force resisting the tipping
of the body about the fulcrum point on the lumbar
spine. Therefore, balancing the moments about the spine
yields:
M( 1) = 50(20)+ 120(1 5) = 2800 lb
At first glance, this may seem to be an impossible load
as it would indicate that the compression on the spine
would be the sum of the weight lifted, the weight of the
torso, and the muscle force, or combining to be almost
3,000 lb. Because of the short moment arm to the
muscles, these loads are correct and have been verified
by experiments. Very few people realize the loads that
are placed on the skeletal system due to the fact the
muscles get “the short end of the stick.”
The forearm provides another excellent example of
this effect. Consider the forearm modeled as a simple
lever as shown in Figure 26. A simple measurement on
one’s forearm will show that the length from the elbow
to the palm of the hand is 8 to 10 times longer than the
length from the elbow to the tendon attachment of the
biceps. This means that if 25 lb are held in the palm of
the hand, the muscle force must be between 200 and
250 lb. The compression on the elbow joint C=M—Wwould be between 175 and 225 lb. It is easily seen that
if the lever arm to the weight were increased with a
tennis racket or a shovel, the compression on the joint
would increase even more.
Figure 24.
Simple lever.
Figure 25
Lever model to determine lumbar spine load.
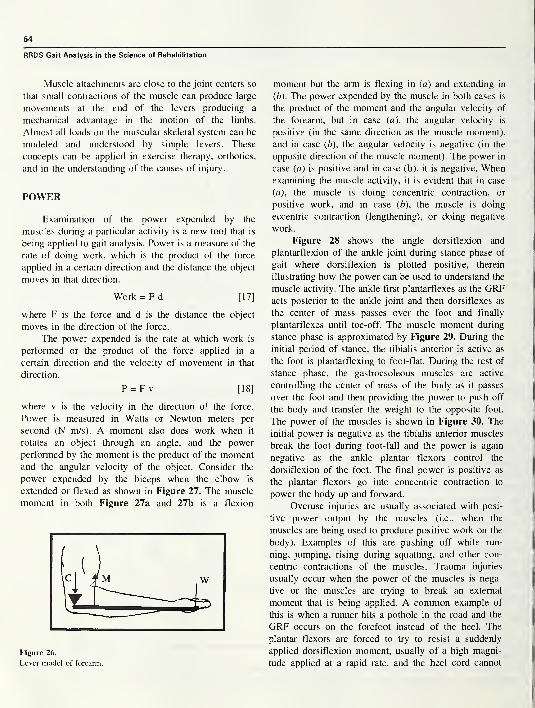
64
RRDS Gait Analysis in the Science of Rehabilitation
Muscle attachments are close to the joint centers so
that small contractions of the muscle can produce large
movements at the end of the levers producing a
mechanical advantage in the motion of the limbs.
Almost all loads on the muscular skeletal system can be
modeled and understood by simple levers. These
concepts can be applied in exercise therapy, orthotics,
and in the understanding of the causes of injury.
POWER
Examination of the power expended by the
muscles during a particular activity is a new tool that is
being applied to gait analysis. Power is a measure of the
rate of doing work, which is the product of the force
applied in a certain direction and the distance the object
moves in that direction.
Work = F d [17]
where F is the force and d is the distance the object
moves in the direction of the force.
The power expended is the rate at which work is
performed or the product of the force applied in a
certain direction and the velocity of movement in that
direction.
P = F v [18]
where v is the velocity in the direction of the force.
Power is measured in Watts or Newton meters per
second (N m/s). A moment also does work when it
rotates an object through an angle, and the power
performed by the moment is the product of the momentand the angular velocity of the object. Consider the
power expended by the biceps when the elbow is
extended or flexed as shown in Figure 27. The muscle
moment in both Figure 27a and 27b is a flexion
Figure 26.
Lever model of forearm.
moment but the arm is flexing in (a) and extending in
(b ). The power expended by the muscle in both cases is
the product of the moment and the angular velocity of
the forearm, but in case (a), the angular velocity is
positive (in the same direction as the muscle moment),
and in case (b), the angular velocity is negative (in the
opposite direction of the muscle moment). The power in
case (a ) is positive and in case (b), it is negative. Whenexamining the muscle activity, it is evident that in case
(a), the muscle is doing concentric contraction, or
positive work, and in case (b ), the muscle is doing
eccentric contraction (lengthening), or doing negative
work.
Figure 28 shows the angle dorsiflexion and
plantarflexion of the ankle joint during stance phase of
gait where dorsiflexion is plotted positive, therein
illustrating how the power can be used to understand the
muscle activity. The ankle first plantarflexes as the GRFacts posterior to the ankle joint and then dorsiflexes as
the center of mass passes over the foot and finally
plantarflexes until toe-off. The muscle moment during
stance phase is approximated by Figure 29. During the
initial period of stance, the tibialis anterior is active as
the foot is plantarflexing to foot-flat. During the rest of
stance phase, the gastrocsoleous muscles are active
controlling the center of mass of the body as it passes
over the foot and then providing the power to push off
the body and transfer the weight to the opposite foot.
The power of the muscles is shown in Figure 30. The
initial power is negative as the tibialis anterior muscles
break the foot during foot-fall and the power is again
negative as the ankle plantar flexors control the
dorsiflexion of the foot. The final power is positive as
the plantar flexors go into concentric contraction to
power the body up and forward.
Overuse injuries are usually associated with posi-
tive power output by the muscles (i.e., when the
muscles are being used to produce positive work on the
body). Examples of this are pushing off while run-
ning, jumping, rising during squatting, and other con-
centric contractions of the muscles. Trauma injuries
usually occur when the power of the muscles is nega-
tive or the muscles are trying to break an external
moment that is being applied. A common example of
this is when a runner hits a pothole in the road and the
GRF occurs on the forefoot instead of the heel. The
plantar flexors are forced to try to resist a suddenly
applied dorsiflexion moment, usually of a high magni-
tude applied at a rapid rate, and the heel cord cannot
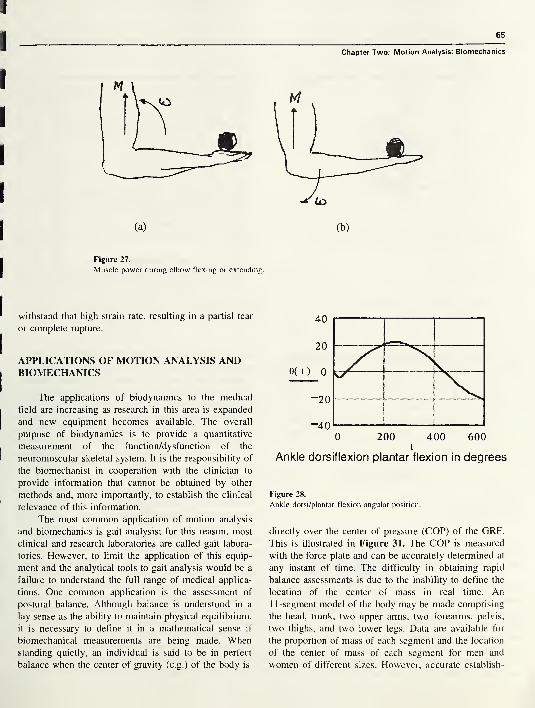
65
Chapter Two: Motion Analysis: Biomechanics
(a)
Figure 27.
Muscle power during elbow flexing or extending.
withstand that high strain rate, resulting in a partial tear
or complete rupture.
APPLICATIONS OF MOTION ANALYSIS ANDBIOMECHANICS
The applications of biodynamics to the medical
field are increasing as research in this area is expanded
and new equipment becomes available. The overall
purpose of biodynamics is to provide a quantitative
measurement of the function/dysfunction of the
neuromuscular skeletal system. It is the responsibility of
the biomechanist in cooperation with the clinician to
provide information that cannot be obtained by other
methods and, more importantly, to establish the clinical
relevance of this information.
The most common application of motion analysis
and biomechanics is gait analysis; for this reason, most
clinical and research laboratories are called gait labora-
tories. However, to limit the application of this equip-
ment and the analytical tools to gait analysis would be a
failure to understand the full range of medical applica-
tions. One common application is the assessment of
postural balance. Although balance is understood in a
lay sense as the ability to maintain physical equilibrium,
it is necessary to define it in a mathematical sense if
biomechanical measurements are being made. Whenstanding quietly, an individual is said to be in perfect
balance when the center of gravity (c.g.) of the body is
(b)
Figure 28.
Ankle dorsi/plantar flexion angular position.
directly over the center of pressure (COP) of the GRF.
This is illustrated in Figure 31. The COP is measured
with the force plate and can be accurately determined at
any instant of time. The difficulty in obtaining rapid
balance assessments is due to the inability to define the
location of the center of mass in real time. An1 1 -segment model of the body may be made comprising
the head, trunk, two upper arms, two forearms, pelvis,
two thighs, and two lower legs. Data are available for
the proportion of mass of each segment and the location
of the center of mass of each segment for men and
women of different sizes. However, accurate establish-
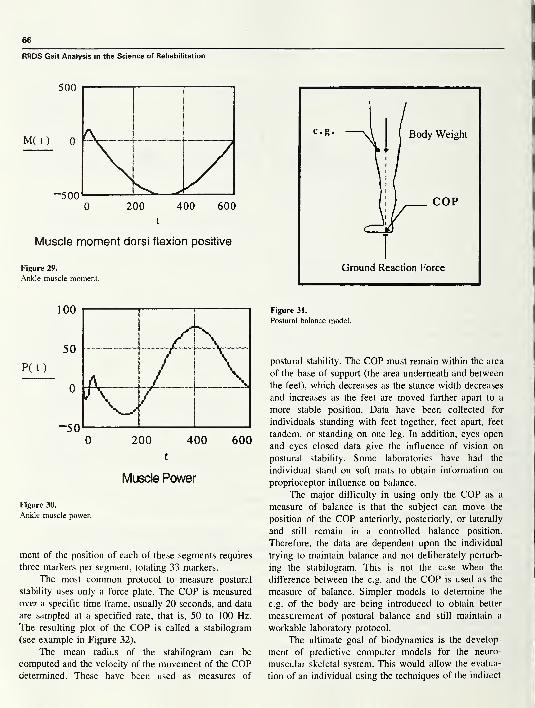
RRDS Gait Analysis in the Science of Rehabilitation
Muscle moment dorsi flexion positive
Figure 29.
Ankle muscle moment.
Muscle Power
Figure 30.
Ankle muscle power.
ment of the position of each of these segments requires
three markers per segment, totaling 33 markers.
The most common protocol to measure postural
stability uses only a force plate. The COP is measured
over a specific time frame, usually 20 seconds, and data
are sampled at a specified rate, that is, 50 to 100 Hz.
The resulting plot of the COP is called a stabilogram
(see example in Figure 32).
The mean radius of the stabilogram can be
computed and the velocity of the movement of the COPdetermined. These have been used as measures of
Figure 31.
Postural balance model.
postural stability. The COP must remain within the area
of the base of support (the area underneath and between
the feet), which decreases as the stance width decreases
and increases as the feet are moved farther apart to a
more stable position. Data have been collected for
individuals standing with feet together, feet apart, feet
tandem, or standing on one leg. In addition, eyes open
and eyes closed data give the influence of vision on
postural stability. Some laboratories have had the
individual stand on soft mats to obtain information on
proprioceptor influence on balance.
The major difficulty in using only the COP as a
measure of balance is that the subject can move the
position of the COP anteriorly, posteriorly, or laterally
and still remain in a controlled balance position.
Therefore, the data are dependent upon the individual
trying to maintain balance and not deliberately perturb-
ing the stabilogram. This is not the case when the
difference between the c.g. and the COP is used as the
measure of balance. Simpler models to determine the
c.g. of the body are being introduced to obtain better
measurement of postural balance and still maintain a
workable laboratory protocol.
The ultimate goal of biodynamics is the develop-
ment of predictive computer models for the neuro-
muscular skeletal system. This would allow the evalua-
tion of an individual using the techniques of the indirect
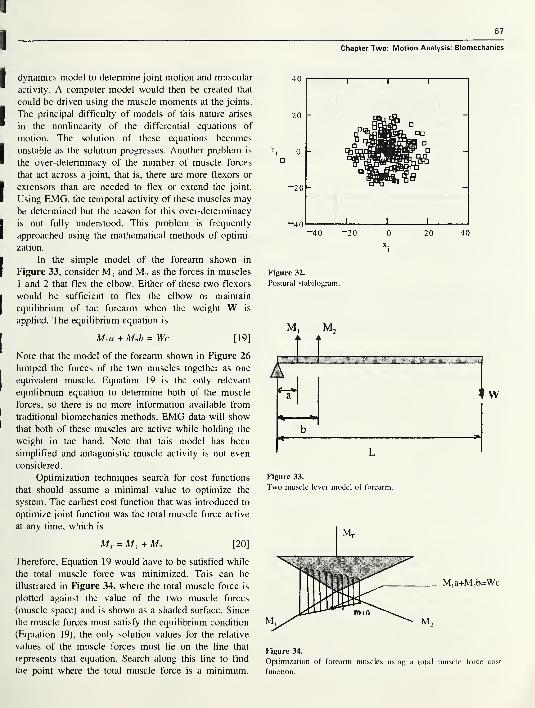
67
Chapter Two: Motion Analysis: Biomechanics
dynamics model to determine joint motion and muscular
activity. A computer model would then be created that
could be driven using the muscle moments at the joints.
The principal difficulty of models of this nature arises
in the nonlinearity of the differential equations of
motion. The solution of these equations becomes
unstable as the solution progresses. Another problem is
the over-determinacy of the number of muscle forces
that act across a joint, that is, there are more flexors or
extensors than are needed to flex or extend the joint.
Using EMG, the temporal activity of these muscles maybe determined but the reason for this over-determinacy
is not fully understood. This problem is frequently
approached using the mathematical methods of optimi-
zation.
In the simple model of the forearm shown in
Figure 33, consider M, and M2 as the forces in muscles
1 and 2 that flex the elbow. Either of these two flexors
would be sufficient to flex the elbow or maintain
equilibrium of the forearm when the weight W is
applied. The equilibrium equation is
+ M2b = Wc [19]
Note that the model of the forearm shown in Figure 26
lumped the forces of the two muscles together as one
equivalent muscle. Equation 19 is the only relevant
equilibrium equation to determine both of the muscle
forces, so there is no more information available from
traditional biomechanics methods. EMG data will show
that both of these muscles are active while holding the
weight in the hand. Note that this model has been
simplified and antagonistic muscle activity is not even
considered.
Optimization techniques search for cost functions
that should assume a minimal value to optimize the
system. The earliest cost function that was introduced to
optimize joint function was the total muscle force active
at any time, which is
Mt = A/, + M2 [20]
Therefore, Equation 19 would have to be satisfied while
the total muscle force was minimized. This can be
illustrated in Figure 34, where the total muscle force is
plotted against the value of the two muscle forces
(muscle space) and is shown as a shaded surface. Since
the muscle forces must satisfy the equilibrium condition
(Equation 19), the only solution values for the relative
values of the muscle forces must lie on the line that
represents that equation. Search along this line to find
the point where the total muscle force is a minimum.
Figure 32.
Postural stabilogram.
M, M2
Figure 33.
Two muscle lever model of forearm.
M,a+M2b=Wc
Figure 34.
Optimization of forearm muscles using a total muscle force cost
function.
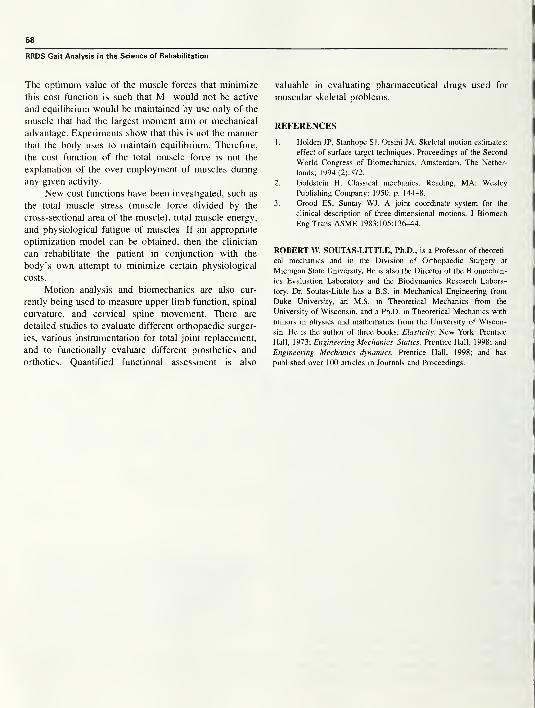
RRDS Gait Analysis in the Science of Rehabilitation
The optimum value of the muscle forces that minimize
this cost function is such that M, would not be active
and equilibrium would be maintained by use only of the
muscle that had the largest moment arm or mechanical
advantage. Experiments show that this is not the manner
that the body uses to maintain equilibrium. Therefore,
the cost function of the total muscle force is not the
explanation of the over-employment of muscles during
any given activity.
New cost functions have been investigated, such as
the total muscle stress (muscle force divided by the
cross-sectional area of the muscle), total muscle energy,
and physiological fatigue of muscles. If an appropriate
optimization model can be obtained, then the clinician
can rehabilitate the patient in conjunction with the
body’s own attempt to minimize certain physiological
costs.
Motion analysis and biomechanics are also cur-
rently being used to measure upper limb function, spinal
curvature, and cervical spine movement. There are
detailed studies to evaluate different orthopaedic surger-
ies, various instrumentation for total joint replacement,
and to functionally evaluate different prosthetics and
orthotics. Quantified functional assessment is also
valuable in evaluating pharmaceutical drugs used for
muscular skeletal problems.
REFERENCES
1. Holden JP, Stanhope SJ, Orsini JA. Skeletal motion estimates:
effect of surface target techniques. Proceedings of the Second
World Congress of Biomechanics, Amsterdam, The Nether-
lands; 1994:(2):372.
2. Goldstein H. Classical mechanics. Reading, MA: Wesley
Publishing Company; 1950. p. 144-8.
3. Grood ES, Suntay WJ. A joint coordinate system for the
clinical description of three-dimensional motions. J Biomech
Eng Trans ASME 1 983; 105: 1 36^44.
ROBERT W. SOUTAS-LITTLE, Ph.D., is a Professor of theoreti-
cal mechanics and in the Division of Orthopaedic Surgery at
Michigan State University. He is also the Director of the Biomechan-
ics Evaluation Laboratory and the Biodynamics Research Labora-
tory. Dr. Soutas-Little has a B.S. in Mechanical Engineering from
Duke University, an M.S. in Theoretical Mechanics from the
University of Wisconsin, and a Ph.D. in Theoretical Mechanics with
minors in physics and mathematics from the University of Wiscon-
sin. He is the author of three books: Elasticity. New York: Prentice
Hall, 1973; Engineering Mechanics-Statics. Prentice Hall, 1998; and
Engineering Mechanics-dynamics. Prentice Hall, 1998; and has
published over 100 articles in Journals and Proceedings.
SECTION THREE
Chapter One
The Value of Information Resulting fromInstrumented Gait Analysis:
The Physiatrist
by Andrew Gitter, MD and Robert McAnelly, MD
Dr. Gitter is an Associate Professor and Dr. McAnelly is an Assistant Professor, at the University of Texas Health
Science Center at San Antonio Rehabilitation Medicine, San Antonio, Texas.
INTRODUCTION
Gait analysis has a long history and tradition, from
the pioneering work of Muybridge and Inman continu-
ing through contemporary times with the development
of modern computer-based analysis systems capable of
describing the kinematic, kinetic, and muscle activation
patterns of gait in unusually rich detail. Over the past
several decades, instrumented gait analysis has emerged
as a powerful tool in the research setting. Through
descriptive and experimental studies, gait analysis has
advanced our understanding of normal gait, identified
and quantified the biomechanical and motor control
abnormalities of pathologic gait, and documented the
usefulness of various therapeutic interventions. In con-
trast to the established role that quantitative gait
analysis has achieved as a research tool, the clinical use
of gait laboratories and gait analysis by physiatrists and
other rehabilitation care providers is uncommon. With
the exception of diagnostic and surgical planning
purposes in children with spastic paralysis, which has
been largely driven by orthopedic surgeons, instru-
mented quantitative gait analysis has not been system-
atically adopted for the evaluation of gait in other
patient populations. In the rehabilitation literature, there
are intriguing case reports of gait analysis improving
patient care, and evidence that instrumented gait studies
can aid in the diagnosis and determination of the
pathomechanics of some gait abnormalities. However,
there is not a substantive body of data that clearly
identifies the groups of patients, or the gait abnormali-
ties commonly managed by physiatrists in which
instrumented studies are beneficial to overall care and
function. Perhaps because of this, efforts by proponents
to expand its role in the management of adults with
disabling gait problems from a variety of neurological
and musculoskeletal disorders has met with limited
success. Moreover, and perhaps more troubling, there is
little spontaneous interest or call for expanding the use
of this technology by most physiatrists.
The current state of clinical gait analysis in the
practice of medical rehabilitation raises several impor-
tant and timely issues that the physiatrist needs to
consider. These are best addressed by clearly separating
the research role of gait analysis from its use as a
clinical procedure. In light of the limited data and
uncertainty over the role of gait analysis in the care of
adults with impaired ambulation, this chapter will focus
on the important conceptual and practical barriers that
limit its clinical use by the physiatrist. The barriers and
limitations listed in Table 1 combine recommendations
from a recent National Center for Medical Rehabilita-
69
70
RRDS Gait Analysis in the Science of Rehabilitation
Table 1.
Barriers, limitations, and unanswered questions concerning
the use of clinical instrumented gait analysis by the
physiatrist.
Lack of objective data that instrumented gait analysis improves
patient function.
• Effect of gait analysis on diagnosis, clinical decision
making, and treatment selection is unclear
• Lack of cost-effectiveness information
Limited information or guidelines for selecting and applying
specific gait analysis techniques in evaluating and treating
different gait abnormalities.
• Is standardization of gait analysis protocols for different
disorders useful?
• Better definition of the patient populations and gait
problems that are benefited by instrumented gait analysis.
• Does instrumented “motion” analysis improve the care of
nonambulatory mobility problems or upper limb motor
disability?
Limited treatment options for use in the management of adult
gait disorders.
• Current physiatric interventions are empirically based and
have low morbidity, lessening the need for instrumented gait
analysis.
• Improved neuromuscular and musculoskeletal models of gait
needed to allow prediction of compensatory strategies and
treatment outcomes.
Limited understanding by clinicians of the data generated by
instrumented gait analysis.
• Better training of residents and clinicians in the complexities
of the kinematic, kinetic, and motor control features of gait
• Improved gait educational media
• Standardization of terminology to improve communication
tion Research sponsored workshop on the future of gait
analysis (1) with those of other researchers {2-4) and
personal observations. These barriers touch on multiple
aspects of gait analysis: basic technology concerns over
the ease and accuracy of data acquisition, uncertainty
regarding the value of different gait measures in various
disorders, and fundamental concerns over its clinical
effectiveness.
An initial, useful perspective can be gained by
reviewing the gait issues associated with the assessment
of children with cerebral palsy (CP), the disorder in
which gait analysis has achieved its greatest level of
clinical acceptance. By characterizing the reasons for its
relative success in this population, the limitations and
problems that have prevented its use in the adult
population become more clinically apparent.
The neuromuscular manifestations of CP are het-
erogeneous. A wide spectrum of clinical gait disorders
is present in children with CP that ranges from
unilateral spastic hemiplegic gait to the diplegic
crouched gait pattern (5,6). Altered central nervous
system motor control of gait is superimposed upon
varying degrees of muscle or joint contracture and
(mal)adaptive changes in skeletal growth and alignment.
The result is a dynamically evolving gait pattern in a
growing child caused by the complex interplay of
abnormal muscle timing and force generation, second-
ary limitations in joint range of motion, and altered
muscle force lever arms caused by skeletal adaptations
of the lower limb joints. Treatment of these abnormali-
ties involves the collaborative efforts of multiple health
care providers and may include: 1) various surgical
procedures done at appropriate times during the child’s
development, 2) the use of serial orthotic devices, 3)
both invasive and noninvasive spasticity management,
and 4) physical therapy. Successful optimization of a
child’s gait can lead to a lifetime of improved mobility,
function, and quality of life, while inappropriate treat-
ment may worsen disability.
In summary, the gait disorders experienced by
children with CP are heterogeneous, complex, and
involve invasive treatments, but can offer a lifetime of
improved function. The use of gait analysis to character-
ize a child’s walking pattern is intuitively rational and
improves the understanding and inter-relationships be-
tween multiple complex factors unique to each child.
Analysis allows the longitudinal tracking of the evolu-
tion of gait, and can assess treatment effects. There is
some evidence that supports the use of surgical
interventions in improving gait (7), demonstrates that
gait analysis alters surgical decision-making (8), and
improves clinical outcomes (9). Yet, despite the use of
gait analysis in spastic paralysis for the past decade and
strong advocacy supporting its use, considerable contro-
versy still exists over its true clinical value as high-
lighted in the recent editorials by Gage (2) and Watts
GO).
In many respects, CP gait encompasses a unique
constellation of clinical characteristics that is more
complex than the issues surrounding the management of
gait in most adult rehabilitation settings. Hemiplegic
gait following brain injury is likely the most common
central nervous system gait disorder that the physiatrist
must manage and serves as a useful model for
understanding the role of instrumented gait analysis.
Several major differences will be highlighted in this
71
Chapter One: Physiatrist
Chapter. First, studies have shown that the altered gait
motor control in hemiplegia usually falls into one of
three patterns: premature activation of the plantar-
flexors, reduced activity in one muscle or in muscles
groups, and co-contraction (11-13). As a result, the
adult hemiplegic gait pattern is more stereotypic than
the diversity of abnormalities seen in children with CP.
The resulting biomechanical deficits that compromise
walking primarily affect knee and ankle control. Suc-
cessful treatment strategies using combinations of foot,
ankle, and knee orthotic devices; upper limb assistive
aids; neurolytic procedures; and functional training have
long been accepted as the standard of care. The
principles underlying the use of orthoses and neurolytic
procedures are based on generally accepted but simpli-
fied biomechanics of moment generation at the ankle
and knee. While there has been some objective verifica-
tion of the effectiveness of current treatments (14,15),
we do not know if contemporary clinical practice
maximizes gait ability. Secondly, the bony adaptations
and developmental changes seen in the maturing
skeleton of the child with CP are not a clinical concern
in the adult. Thirdly, the surgical interventions used in
these children are only rarely used in adults. Finally,
expectations for what is an acceptable gait, perhaps not
always to the benefit of individuals, are lower in the
adult, especially the elderly person with stroke. This
combination of clinical features surrounding adult
hemiplegic gait has lead to a general acceptance of a
relatively nonaggressive, noninvasive treatment para-
digm that has not changed substantially for many years
and typically does not attempt to understand the gait
disorder with the degree of detail that can be obtained
with instrumented gait studies.
Issues That Must be Addressed Before Clinical Gait
Analysis Will be Used by Physiatrists in the Treat-
ment of Adult Gait Disorders
Lack of Objective Data that Instrumented Gait Analysis
Improves Diagnosis and Treatment Outcomes Over
Standard Visual Observation Techniques
The lack of convincing data that instrumented gait
analysis is more effective in improving diagnosis or
treatment outcomes than standard clinical visual obser-
vation techniques is one of the most important issues
that needs to be addressed. Visual observation of gait
is the clinical standard and trained observers typi-
cally believe they can recognize many gait deviations,
correctly assess the cause of the deviation, and infer
an appropriate treatment strategy (16). This is probab-
ly true in gait problems resulting from musculoskel-
etal or peripheral neurologic disorders isolated to a
single joint or nerve, but the reliability of visual
observation in the more complex gait disorder associ-
ated with central motor control abnormalities is prob-
ably poor. The limited number of studies on observa-
tional gait analysis supports this concern by consistently
showing that the interobserver reliability of visually
identified kinematic deviations is only fair to moderate
(17-19). If reliability is only fair in simply identifying
motion abnormalities, it is undoubtedly even less
reliable in accurately predicting the timing or pattern of
alterations in muscle activation and/or the joint kinetics
that underlie the movement disturbances (20). The
limited reliability of visual observation would argue,
empirically and intuitively, for an expanded role of
instrumented gait analysis. Before this can be accepted,
two issues need to be resolved: 1) whether instrument-
ed gait analysis is more reliable and reproducible
than visual gait analysis and 2) whether the increased
time, effort, and expense of instrumented gait analysis
affect treatment decision-making and functional out-
come.
The reliability and reproducibility of instrumented
gait analysis has received only limited study. Basic
intertest reproducibility of kinetic and kinematic mea-
surements appears to be adequate for clinical purposes
(21,22). Empirically and intuitively, it is believed that
quantitative gait information would improve interex-
aminer reliability in the identification of gait abnormali-
ties, but this has not been adequately studied. The
reliability of expert interpretation of gait studies and
subsequent treatment recommendations is unknown but
has been questioned (10).
Little published data directly address the effect of
gait analysis on changing treatment or altering func-
tional outcomes. While limited data exist showing that
gait analysis improves the management of children with
CP (8,9), clinicians must use case reports and indirect
evidence to determine the value of gait analysis in other
gait disorders. Case reports have highlighted the value
of gait analysis in selected individuals (23-25) but do
not constitute sufficient evidence to justify its wide-
spread, general use. Examples of indirect evidence
supporting the clinical use of gait analysis come from
studies that suggest quantitative gait examination can
identify abnormal and possibly injurious joint force
development (26), predict response to botulinum toxin
use in spasticity control during walking (11), and aid in
72
RRDS Gait Analysis in the Science of Rehabilitation
the choice of the most appropriate therapeutic technique
or orthotic intervention in stroke (20). The lack of a
substantive body of evidence of its clinical value is
surprising and somewhat worrisome given that it has
been available as a clinical procedure for nearly a
decade. This is especially problematic given the current
financial pressures on health care systems to justify the
use of any new or expensive intervention.
Limited Information and Guidelines for Selecting and
Applying Specific Gait Analysis Techniques in the
Evaluation and Treatment of Different Gait
Abnormalities
Gait analysis encompasses a wide range of mea-
surement technologies designed to capture and charac-
terize the temporal, spatial, kinematic, kinetic, and
muscle activation pattern of an individual’s gait. Kine-
matic procedures measure the motion of the body and
limb segments through space during representative
walking strides. Markers are placed over predefined
bony landmarks on the arms, trunk, pelvis, and legs.
The markers are used with a variety of image-capture
technologies to track the three-dimensional locations of
individual body segments throughout a gait cycle. Fromthis raw coordinate data, joint range of motion and
angular velocities are calculated for clinical analysis.
Kinetic analysis is used to determine the net forces
and torques (moment) exerted on the body as a result of
the combined effects of the ground reaction force,
inertia, and muscle contraction. Kinetic analysis re-
quires the simultaneous (i.e., during the same gait cycle)
collection of kinematic information and ground reaction
forces. Ground reaction forces are collected as subjects
walk over force plates embedded into the floor of the
laboratory. The calculation of the forces and moments
generated at each joint is based on inverse dynamics
physics and simplified models of the musculoskeletal
system.
Dynamic electromyography (EMG) is used to
determine the timing of muscle activation and to
crudely estimate the relative magnitude of muscle
contraction. EMG data can be collected using surface
electrodes or, when greater muscle specificity is needed,
intramuscular wire electrodes. The EMG signal is
amplified and transmitted via telemetry or cable to a
central computer where it is synchronized with kine-
matic and kinetic data, thus allowing inference about the
muscular sources of force and motion abnormalities.
Separating the cause(s) of an abnormal gait from
adaptive and potentially beneficial compensatory strate-
gies used by an individual is not necessarily straightfor-
ward. The multiplicity of the central and peripheral
mechanisms associated with the control of gait leads to
a degree of indeterminacy in understanding any particu-
lar gait pattern. This is made worse by the absence of
good models of the neuromuscular control strategies
adopted by persons with different disorders that affect
walking. Thus, there is a tendency to collect the entire
spectrum of gait information in order to maximize the
likelihood of measuring the relevant and important
discriminating kinematic, kinetic, and muscle-timing
features of a particular gait pattern. From a practical
standpoint, this adds to the cost, complexity, and time
required for gait analysis, especially in pathologic gait
situations where increased stride-to-stride variability,
balance deficits, and/or cognitive limitations interfere
with data collection. The relative importance of the
various subcomponents of gait analysis—kinematic,
kinetic, and EMG, either individually or in combina-
tions to the diagnosis or treatment of different gait
abnormalities—is unknown.
The situation is analogous to the electrodiagnostic
evaluation that is performed to “rule out neuromuscular
disease.” In the absence of a more specific clinical
question, testing tends to be extensive, poorly focused,
time consuming, and often of unclear clinical utility.
Instrumented gait analysis may achieve greater clinical
acceptance and be more cost effective if analyses can be
focused on answering specific clinical questions. As a
hypothetical example, consider the person with genu
recurvatum following a traumatic brain injury.
Recurvatum may result from several motor control
abnormalities (premature plantarflexor muscle activity,
prolonged quadriceps activation) or as overcompensa-
tion for absent quadriceps activity. To distinguish
between clinically relevant causes, a directed gait study
might only require dynamic EMG recording from the
quadriceps and plantarflexor muscles along with foot-
switch information to determine the timing of muscle
activation relative to heelstrike and toeoff. Such a gait
study would obviously not completely characterize the
individual’s gait or allow comment on other potentially
treatable abnormalities, but would be simple, require
little time, and would likely be more cost effective.
Limited Treatment Options for Use in the Management
ofAdult Gait Disorders
The interventions commonly recommended by
physiatrists for treating gait disorders can be broadly
classified into one of several approaches: 1) physical

73
Chapter One: Physiatrist
therapy based task training to improve functional skills;
2) orthotic, prosthetic, and assistive devices to improve
balance, alter biomechanical forces, or control joint
positioning; and 3) spasticity management with sys-
temic drugs or local neurolytic procedures.
Physical therapy is seldom if ever detrimental but
the selection of specific modalities or techniques is
empirical and not well-based on objective information.
It is not known whether gait analysis can help in
choosing the best treatment approach, predict response
to treatment, or determine if maximal recovery has
occurred. Lower limb orthotic devices have seen
substantial evolutionary advances in materials and
options over the past several decades but there has
been little fundamental improvement in their effect on
the abnormal biomechanical or neurophysiologic fea-
tures of gait. Prescription is based on well-accepted
biomechanical principles, which can be modified as
needed and, when clinical uncertainty exists, can
incorporate adjustable joints to allow empirical gait
optimization. How will gait analysis improve the
prescription of lower limb orthoses: better device
selection, defining optimal joint position, identifying
persons for whom orthoses are inappropriate? These are
questions for which answers do not yet exist. Neurolytic
procedures, while variably successful and difficult to
titrate, can be safely performed, especially if limited to
motor point or motor nerve blocks. The effects of
blocks are generally limited to months, lessening the
risk of any permanent unexpected adverse effects on
gait. When uncertainty exists, is it easier and more
efficient for patients and clinicians to perform tempo-
rary local anesthetic blocks that may give both diagnos-
tic and therapeutic information than to perform an
instrumented gait analysis? How much of the advantage
of “instrumented gait analysis” comes from quan-
titative measurements as compared with simply the
clinical evaluation by an experienced consultant/expert
in gait?
For the adult with a major disability, gait dysfunc-
tion is usually only one aspect of the overall im-
paired functioning. The emphasis and effort placed on
improving gait is more or less important depending on
other coexisting cognitive, sensorimotor, and pyscho-
social problems. When the clinical features of cur-
rently available rehabilitation interventions (low acute
morbidity, limited risk of long-term adverse sequalae,
empirical application, and variable impact on overall
function) are combined with uncertainty about the
effectiveness of gait analysis in improving treatment
and outcome, the current standard of care based on
simple clinical assessment and judgment appears clini-
cally rational and appropriate. The risk to continu-
ing this seemingly appropriate observational approach is
the lost ability and opportunity to critique and measure
our treatment effectiveness, to uncover their limitations,
and to encourage us to develop better therapeutic
strategies.
Justifying the use of instrumented gait analysis in
the vast majority of patients will be difficult until there
are better treatment options that either require greater
selectivity in their application, place individuals at
greater risk of injury or adverse effect, or are costly.
Surgical procedures for tendon lengthening, release, or
transfer have been recommended for selected adults but
their use is sporadic and not generally available. A more
systematic assessment of their utility in adults seems
warranted. Recently, two new treatment modalities have
become clinically available that may fit these criteria:
botulinum toxin for treating local muscle spasticity and
intrathecal baclofen pumps for use in persons with brain
disorders. While the role for these treatments are
currently being investigated, both potentially may be
important advances in our ability to improve gait and
mobility problems associated with increased muscle
tone. These treatments are expensive and, in the case of
baclofen pumps, invasive. The value of instrumented
gait analysis in these settings is largely untested but
may be useful in predicting therapeutic response (11) or
as a tool for objectively documenting effectiveness, thus
justifying the use or continued use of these interven-
tions.
Limited Understanding by Clinicians of the Kinematic,
Kinetic, and Electromyographic Data Generated by
Instrumented Gait Analysis
Instrumented gait analysis can generate an over-
whelming amount of data describing the complex
temporal, spatial, and kinetic aspects of an individual
gait pattern. Interpreting this information requires a
detailed understanding of gait biomechanics, normal and
abnormal patterns of motor control, and an ability to
relate these features to the pathological motion that is
observed during walking. Finally, integrating this under-
standing of the mechanisms underlying a gait abnormal-
ity into appropriate and useful clinical recommendations
requires substantial experience. Gait analysis reports,
even after being subjected to an interpretive summaryby an expert, tend to be long and difficult to understand
for the clinician without specific training or interest in
74
RRDS Gait Analysis in the Science of Rehabilitation
gait. This is not particularly unusual or unexpected for a
highly specialized medical test, but does serve to further
distance non-specialist clinicians from instrumented gait
analysis and places them in the position of needing to
act on information that they may not fully understand.
For physiatrists, this is unfortunate, since many of
the patient populations that constitute the core of
rehabilitation medicine have significant gait disability.
Assuring expertise in the evaluation, diagnosis, treat-
ment, and management of gait disorders is an important
and integral part of maintaining control over this aspect
of care. Achieving this level of expertise will require
that contemporary concepts of gait be incorporated into
training programs and continuing medical education
programs, facilitated through clinical interactions with
patients, and updated as new advances in gait therapeu-
tics are developed. Contemporary general rehabilitation
texts (27,28) that serve as a foundation for training and
clinical care all include chapters on gait analysis, but do
not adequately develop the necessary knowledge base
that physiatrists need to adequately evaluate and under-
stand the relationships between observational, kine-
matic, kinetic, and EMG aspects of gait. Instrumented
gait analysis offers a unique and powerful tool for
teaching these concepts and, in this context, is a vastly
underutilized educational resource. Experts in gait need
to develop more effective teaching methods and media
for clinician education with one possible approach being
the use of computer multimedia as demonstrated by
Smith (29).
Raising the general level of awareness of gait
biomechanics can improve clinical observational gait
analysis skills and, at the same time, increase the
awareness of the uncertainties inherent in current
clinical approaches to gait evaluation and the need for
more objective testing in selected individuals. Analternate approach to expanding the number of clini-
cians skilled in gait analysis is through the automation
of analysis using artificial intelligence based gait
diagnostic systems (30). This approach, while intrigu-
ing, will need to overcome the biases and difficulties
other expert systems have had in achieving clinical
acceptance and widespread use.
CONCLUSION
The research role of gait analysis in improving our
understanding of the basic neurobiology and mechanics
of gait and in assessing the value of new interventions
seems assured. However, the role of instrumented gait
analysis in the management of those individuals served
by physiatrists faces an uncertain future. As the health
care system finds itself under increasing pressure to
financially justify the use of expensive diagnostic tools
and treatment interventions, the lack of convincing data
that expanding the use of gait analysis will improve
patient function makes it difficult to argue forcefully for
its use at this time. The path to increasing the role of
clinical gait analysis lies in proving its value through
additional case studies but more importantly through
controlled studies demonstrating its effectiveness. Fur-
ther development in gait laboratory technology to
improve access, automation, ease of use, and cost is
needed. Improving the education of clinicians in the
quantitative pathomechanics of abnormal gait will not
only improve traditional clinical care but will force
clinicians into recognizing the ambiguities and limita-
tions of visual observation, especially when costly or
invasive treatments are involved.
REFERENCES
1 . Recommendation on the future of gait analysis. Gait Analysis
in Rehabilitation Medicine Workshop, National Center for
Medical Rehabilitation Research, September 26, 1996. Arling-
ton, VA.
2. Gage JR. The role of gait analysis in the treatment of cerebral
palsy. J Pediatr Orthop 1994;14:701-2.
3. Czemiecki JC, Gitter AJ. Gait analysis in the amputee: has it
helped the amputee or contributed to the development of
improved prosthetic components. Gait Posture 1996;4:258-68.
4. Rechtien JJ, Gelblum JB, Haig AJ, Gitter AJ. Technology
assessment: dynamic electromyography in gait and motion
analysis. Muscle Nerve 1996;19:396-402.
5. Gage JR, DeLuca PA, Renshaw TS. Gait analysis: Principle
and applications with emphasis on its use in cerebral palsy. J
Bone Joint Surg 1995;77A: 1607-23.
6. Sutherland DH, Davids JR. Common gait abnormalities of the
knee in cerebral palsy. Clin Orthop 1993;:288: 139-47.
7. Sutherland DH, Santi M, Abel MF. Treatment of stiff knee
gait in cerebral palsy: a comparison by gait analysis of distal
rectus femoris transfer versus proximal rectus release. J
Pediatr Orthop 1990;10:433-41.
8. DeLuca PA, Ounpuu S, Rose SA, Sirkin R. Alteration in
cerebral palsy surgical decision-making based on three-
dimensional gait analysis (Abstract). Dev Med Child Neurol
1994;S70:7-8.
9. Lee EH, Goh JCH, Bose K. Value of gait analysis in the
assessment of surgery in cerebral palsy. Arch Phys Med
Rehabil 1992;73:642-46.
10.
Watts HG. Gait laboratory analysis for preoperative decision
making in spastic cerebral palsy: is all it’s cracked up to be? J
Pediatr Orthop 1994;14:703-4.
75
Chapter One: Physiatrist
1 1 . Hesse S, Krajnik J, Luecke D, Jahnke MT, Gregoric M,
Mauritz KH. Ankle muscle activity before and after botulinum
toxin therapy for lower limb extensor spasticity in chronic
hemiplegic patients. Stroke 1996;27:455-60.
12. Knutsson E, Richards C. Different types of disturbed motor
control in gait of hemiparetic patients. Brain 1 979; 1 02:405—
30.
13. Shiavi R, Bugle HJ, Limbird T. Electromyographic gait
assessment, Part 2: preliminary assessment of hemiparetic
synergy patterns. J Rehabil Res Dev 1 987 ;24(2):24—30.
14. Lehmann JF, Condon SA, Price R, deLateur BJ. Gait
abnormalities in hemiplegia: their correction by ankle-foot
orthoses. Arch Phys Med Rehabil 1987;68:763-71
15. Ounpuu S, Bell KJ, Davis RB, DeLuca PA. An evaluation of
the posterior leaf spring orthosis using joint kinematics and
kinetics. J Pediatr Orthop 1996;16:378-84.
16. Harris GF, Wertsch JJ. Procedures for gait analysis. Arch
Phys Med Rehabil 1994;75:216-25.
17. Eastlack ME, Arvidson J, Snyder-Mackler L, Danoff JV,
McGarvey CL. Interrater reliability of videotaped obser-
vational gait-analysis assessments. Phys Ther 1991 ;7 1:465-
72.
18. Krebs DE, Edelstein JE, Fishman S. Reliability of observa-
tional kinematic gait analysis. Phys Ther 1985;65:1027-33.
19. Keenan AM, Bach TM. Video assessment of rearfoot
movements during walking: a reliability study. Arch Phys
Med Rehabil 1996;77:651-5.
20. Knutsson E. Can gait analysis improve gait training in stroke
patients. Scand J Rehabil Med 1994;30(Suppl):73-80.
21. Kirkpatrick M, Wytch R, Cole G, Helms P. Is the objective
assessment of cerebral palsy gait reproducible? J Pediatr
Orthop 1994;14:705-8.
22. Kadaba MP, Ramakrishnan HK, Wooten ME, Gainey J,
Gorton G, Cochran GVB. Repeatability of kinematic, kinetic
and electromyographic data in normal adult gait. J Orthop Res
1989;8:849-60.
23. Kerrigan DC, Glenn MB. An illustration of clinical gait
laboratory use to improve rehabilitation management. Am J
Phys Med Rehabil 1994;73:421-7.
24. Abdulhadi HM, Kerrigan DC. Camptocormia: a biomechani-
cal analysis. Am J Phys Med Rehabil 1996;75:310-3.
25. Forese L, Wootten M, Kadaba MP, McCann PD. Surgical
management of equinovarus deformity in the adult with head
injury. Orthop Rev 1993;22:1001-10.
26. Kerrigan DC, Deming LC, Holden MK. Knee recurvatum in
gait: a study of associated knee biomechanics. Arch Phys MedRehabil 1996;77:645-50.
27. Esquenazi A, Keenan MA. Gait analysis. In: DeLisa JA,
editor. Rehabilitation medicine: principles and practice. Phila-
delphia: Lippincott Co.;1993. p. 122-30.
28. Pease WS, Quesade PM. Kinematics and kinetics of gait. In:
Braddom RL, editor. Physical medicine and rehabilitation.
Philadelphia: W.B. Saunders Co.;1996. p.83-103.
29. Smith PJ, Simon SR. Development of a gait interpretation,
instruction, and report generation system. Rehabil R D Prog
Rep 1996;33:46-7.
30. Wientraub MA, Bylander T, Simon SR. QUAWDS: a
composite diagnostic system for gait analysis. Comput
Methods Programs Biomed 1990;32:91-106.
ANDREW GITTER, M.D. is currently an associate professor in the
Department of Rehabilitation Medicine, University of Texas Health
Science Center at San Antonio and co-director of the Human Motion
Analysis Laboratory. After undergraduate training in engineering. Dr.
Gitter attended the University of Michigan Medical School and
completed residency training in Physical Medicine and Rehabilita-
tion at the University of Washington in Seattle, Washington. While
on the faculty at the University of Washington, he was the
co-director of the Seattle VA Medical Center Gait Laboratory and
was involved in research studying the effects of lower limb
amputation on gait and the effects of prosthetic components and
modifications. He has authored and co-authored a number of
publications related to gait in a variety of rehabilitation and
biomechanics journals. In addition to his research activities. Dr.
Gitter has lectured frequently on gait and has participated in
numerous gait-related education programs for allied health students,
medical students, and residents. He recently joined the faculty at the
University of Texas where he continues to pursue clinical and
research interests in gait, clinical gait analysis, and amputation.
ROBERT McANELLY, M.D. is an assistant professor of Rehabili-
tation Medicine at the University of Texas Health Science Center at
San Antonio, and co-director of the Gait and Clinical Movement
Analysis Laboratory. Dr. McAnelly holds a B.S. in Engineering
(1979) and B.S. in Applied Physics (1980) from Cal Tech and
attended medical school at the University of Texas. Following
medical school training, he completed residency training in Physical
Medicine and Rehabilitation at the University of Kansas Medical
Center in 1991. He is a founding member of the North American
Society of Gait and Clinical Movement Analysis since 1995, and is
currently a member of the Educational Committee. Dr. McAnelly
has clinical expertise in biomechanics, rehabilitation of persons with
amputation, and evaluation of cerebral palsy gait. He is actively
involved in the study of gait disorders associated with basal ganglia
disorders and neurologic injury.

SECTION THREE
Chapter Two
An Overview of the Value of Information Resulting fromInstrumented Gait Analysis for the Physical Therapist
by Sue Ann Sisto, PhD, PT
Dr. Sisto is the Director of the Human Performance and Motion Analysis Laboratory at the Kessler Medical
Rehabilitation Research and Education Corporation.
INTRODUCTION
Instrumented gait analysis is frequently used today
for clinical applications. Its role has expanded beyond
the area of gait analysis to aid in clinical decision
making for rehabilitation, surgery, adaptive devices,
ergonomics, and athletics. Physical therapists are well
trained in the area of gait and movement analysis and
are, by definition, movement scientists. The evaluation
of gait, locomotion, and balance includes a series of
tests described in the Guide to Physical Therapy
Practice (1). Entry-level didactic requirements include
normal gait mechanics and pathological gait for nearly
all disabilities. Those in physical therapy training
primarily learn observational techniques for clinical gait
analysis. In addition, some academic programs provide
an introduction to various forms of instrumented gait
analysis and their potential to augment the physical
therapist’s knowledge of gait. Instrumented gait analysis
involves information about temporal and linear param-
eters during gait as well as joint angles, ground reaction
forces, and muscle firing patterns.
The purpose of this chapter is to review the scope
of quantitative gait analysis (QGA) as it pertains to the
practice of physical therapy. A brief background about
quantitative gait analysis is followed by a description of
how physical therapists evaluate gait. An overview of
gait analysis technology and goals of the information
obtained from QGA is discussed. Groups likely to
benefit from this information are presented. Limitations
of gait lab data and suggestions for improvement are
reviewed.
Background
Over the past 10 years, the clinical application of
gait analysis has grown rapidly in the United States, as a
result of several significant changes. The widespread
development of user-friendly software allows the clini-
cian to use instrumented gait analysis more easily.
Hardware has also been refined to allow faster data
acquisition and computing. These two advances have
permitted the clinician to improve his/her understanding
and interpretation of information provided by movement
analysis technology.
The evaluation of children with spastic paralysis
constitutes the onset of movement analysis for the
clinical arena and continues to be a large focus of
clinical gait analysis. Orthopedic surgeons frequently
needed objective information about the success of their
surgical interventions, compared to a pre-surgical as-
sessment (2). Other clinical applications of instrumented
gait analysis include the assessment of persons with
stroke, Parkinson’s disease and multiple sclerosis, spinal
and orthopedic injuries or disease, and amputations.
76
77
Chapter Two: Physical Therapist
Clinical use of the gait data takes the form of an
evaluation, ideally before some intervention, followed
by a summary of the biomechanical and neuromuscular
influences of gait after an intervention. The intervention
may be surgery, orthotic or prosthetic applications, and
pharmacological or physical therapeutic treatments. The
physical therapist can then interpret the clinical signifi-
cance of the change in gait impairment as a result of
such intervention.
METHODS
How Physical Therapists Evaluate Gait
Observational gait analysis (OGA) is defined as the
visual inspection of walking. The identification and
grading of gait deviations depends on the observer’s
experience and individual bias (3). The physical thera-
pist observer is trained to see a range of gait events. The
gross abnormalities are the most readily observed.
Frequently, these are made more pronounced if the
therapist asks the subject to walk at a higher velocity or
removes some physical or mechanical assistance. The
disadvantage of OGA over QGA is the tendency to
focus the eye on the gross gait deviations while
overlooking more subtle ones.
OGA is a preferable form of gait assessment whenconsidering the ease, time efficiency, and low cost;
however, several questions have been raised about its
limitations (4-8). Studies evaluating the reliability and
validity of OGA unanimously point to only a moderate
level of reliability for intra- and interrater assessments
(9). However, due to certain design differences in these
studies, it is likely too early to eliminate OGA as an
important clinical evaluation tool.
Systematic methods of gait analysis have been
described by Perry (10) to establish standardization
procedures within the field. Perry describes three steps
to carry out systematic OGA: 1) organization and
classification of the essential gait events, 2) anatomic
sequence of observation to sort the multiple events at
different joints, and 3) data interpretation for total limb
function and for gait cycle differentiation.
Often a physical therapist will start the observation
at the foot and assess distally to proximally as the foot
hits the ground. Interpretation includes the influence of
neuromusculoskeletal and/or behavioral factors that mayproduce a particular gait pattern, such as spasticity,
pain, contracture, or lack of motivation. When OGAprovides insufficient information about the etiology of
gait deviations, instrumented gait analysis may be
warranted.
Gait Analysis Terminology
There are several terms and definitions commonly
used when studying gait analysis: Gait kinematics refers
to the branch of mechanics that deals with joint angular
changes over the gait cycle. Kinematics is evaluated by
using external markers that can be observed by cameras.
Gait kinetics is defined as the forces, moments, and
powers that change over the gait cycle. These measure-
ments are captured by the use of force plates embedded
in a walkway. Dynamic electromyography (EMG) refers
to the evaluation of muscle activity throughout the gait
cycle. This is accomplished through the use of either
surface or needle electrodes.
Gait Measurement Technology
Two-Dimensional versus Three-Dimensional Gait
Analysis
Most of the current gait analysis systems today
convert the two-dimensional (2-D) data from several
cameras into three-dimensional (3-D) data to determine
joint centers. This method allows for the measurement
of gait when there is out-of-plane movement. Two-dimensional gait analysis is attractive to the clinician
because there are fewer markers and cameras needed for
data acquisition and processing time is significantly
reduced.
When 2-D motion data reduction methods are
employed for gait analysis, the assumption must be that
the motion is planar. For example, the knee motion for
the unimpaired person could be considered to move in a
single axis flexion/extension plane. However, if genu
valgus, or varus, or femoral, or tibial torsion is present,
there is a distortion of the data because the joint plane is
no longer parallel to the viewing plane.
Davis et al. (11) evaluated the differences between
2-D and 3-D gait analysis, determining that joint angles
for the hip and knee were the most consistent, since
these joints represent the smallest out-of-plane move-
ment during normal gait. The ankle, however, had the
greatest sensitivity between 2-D and 3-D gait analysis.
This is not surprising since the ankle is oriented out of
the sagittal plane externally by about 7-10°. Muchliterature on normal gait over the years must be
considered with caution because the conclusions drawn
were based on 2-D gait analysis. Davis and colleagues
also extend this caution to the kinetic analysis.
78
RRDS Gait Analysis in the Science of Rehabilitation
Kinematics
The evolution of gait analysis technology has
enabled the physical therapist to utilize the resultant
data to aid the interpretation of locomotor performance.
Since expensive motion analysis equipment is not likely
to be present in physical therapy clinics, therapists use
other methods of motion analysis, such as videotaping.
This method creates a permanent record of gait
performance that serves to document progress in
therapy but still relies on the therapist’s ability to
observe gait in a reliable way.
Instrumented gait analysis systems, though not
present in most physical therapy clinics, constitute the
most prevalent method of motion measurement avail-
able to physical therapists. While electrogoniometers
and accelerometers require less instrumentation, these
devices are more often used in academic or research
settings, because they are less user-friendly for the
clinician. Clinical gait laboratories are becoming more
widely present in hospital settings, and physical thera-
pists can benefit from such quantitative data. For
example, physical therapists are able to assess passive
and active range of motion (ROM). It may be difficult,
however, for the therapist to determine how this
available ROM is incorporated into gait. A subject maypresent with a simple knee-flexion contracture; how-
ever, QGA provides the complete knee trajectory
throughout the gait cycle to determine whether the
subject is using 100 percent of the available ROM. The
physical therapist can also determine to what degree the
limitation in knee motion has affected hip and ankle
motion at simultaneous time intervals. Figure 1 is an
example of the unimpaired and pathological knee
flexion/extension trajectory: the right limb demonstrates
excessive knee flexion at heel strike (0 percent) and
peak knee flexion during the swing phase (80 percent).
This pattern is indicative of insufficient quadriceps
control or hyperactivity of the hamstrings at heel strike
and insufficient dorsiflexion requiring excessive knee
flexion for toe clearance during swing. This can be
corroborated by examining the dynamic EMG at these
intervals.
Ground Reaction Measurement
Force platforms embedded in a walkway provide
information about the center of pressure or the point of
application of the ground reaction force vector. The
ground reaction force is the sum of all the forces of the
body segments while the foot is in contact with the
ground. Many gait labs are now equipped with foot
pressure systems in addition to force platforms. This
technology allows for the determination of how the load
is distributed on the plantar surface of the foot. This
information can be useful for individuals with orthope-
dic pathologies from foot/ankle fractures or those
relating to disease processes such as diabetic
neuropathy. Figure 2 is an example of the normal
ground reaction force during gait.
Another form of kinetic analysis involves the
evaluation of joint moments and powers. Joint moments
are the forces produced by muscles and ligaments acting
at a distance from the joint center. Joint power is the net
rate of generating (concentric contraction) or absorbing
(eccentric contraction) energy by all muscles crossing a
joint, and is the product of the joint moment and its
angular velocity. If the calculation of joint moments is
required, it is necessary to have a system that can have
both kinetics and kinematics. Several investigators have
used the examination of external joint moments to
predict muscle forces (12).
Temporal and Distance Parameters
Step time and length, stride time and length, and
walking velocity and cadence all fall under the defini-
tion of temporal and distance parameters of gait.
Because physical therapists spend a great deal of time
walking close to subjects to either provide verbal or
physical assistance, they have a keen awareness of
length and timing parameters, particularly when they are
asymmetrical. There is a variety of easy methods for
determining timing parameters when force platforms are
not available. These include the use of a stop watch to
determine walking velocity (distance over time), count-
ing the number of steps per minute (cadence) over a
known distance, chalking the soles of shoes or walking
on carbon impregnated paper to determine step and
stride lengths, or heel switches to determine step and
stride time intervals. The greatest challenge to using
heel switches is their placement when the subject does
not achieve heel strike during gait. In this case, the
distance parameters are distorted because the heel does
not strike the ground first, thereby lengthening the step
length parameter by a factor proportional to the length
of the hindfoot.
However, these methods pose clinical challenges;
namely, the clinician must have the time to obtain these
measurements. A laboratory staff experienced in data
collection and processing can provide the easiest
method to obtain QGA results. The physical therapist
can then be instrumental in the interpretation of

79
parameters such as asymmetry in joint trajectories and
their etiologies. The therapist also receives feedback on
how gait parameters change as a result of rehabilitation
techniques. For example, although the therapist may be
keenly aware of the impairments limiting asymmetry in
the temporal and linear components of gait, it may not
be obvious as to how much symmetry should be sought
during treatment and what rate of treatment progression
achieves the most efficient gait. Repeated measurements
of the temporal and distance parameters from QGA mayrelate to a particular progression of gait training and
may provide insight into optimal clinical practice
guidelines. These studies are sorely needed to validate
many interventions in the field of rehabilitation.
Dynamic Electromyography (EMG)Voltage potentials detected by surface or wire
electrodes provide information about the timing and
intensity of the muscle contraction. Physical therapists
know when muscle groups responsible for locomotion
should be active, but it is most difficult to observe
anything but gross muscle activity during gait; there-
fore, dynamic EMG can provide useful information
unavailable by observation. Timing of muscle activity is
the most frequently used parameter obtained from
dynamic EMG. Weakness or spasticity of one or two
joint muscles produces visible gait deviations, but it is
difficult to observe whether the activity is present at the
appropriate times. Neurological subjects who exhibit
spasticity walk with a stiff-legged gait, and QGAprovides information about which muscles are spastic
and when they are misfiring (13).
The intensity of muscle contraction obtained from
dynamic EMG is more controversial, because it must be
normalized for some maximal effort, such as a maximal
voluntary contraction. Instrumentation requires certain
dynamic EMG systems to have gain settings that mayalter the interpretation of the magnitude of the EMGsignal. If the subject demonstrates spasticity, the maxi-
mal contraction is an abnormal response to voluntary
contraction, making relative submaximal comparisons
of muscle activity difficult.
Goals of Quantitative Gait Analysis
Comparisons to the Disabled Populations
Probably the most common use of instrumented
gait analysis is the comparison of gait data from the
disabled population to that of the nondisabled. Anoccasion where this normative external standard may be
most useful is when there is an expectation for normal
Chapter Two: Physical Therapist
performance (2). The limitations of such comparisons
include issues of age, gender, walking velocity, and
anthropomorphic differences between the two groups.
For example, comparisons of data from subjects whowalk at different velocities from the normative stan-
dards have limited validity. Walking velocity is often
drastically reduced in disability, and the normative data
are most often collected at self-selected and faster-paced
speeds. The effect of speed may explain a large portion
of the group differences (14). We also know that menwalk differently from women of similar height and
Knee Flexion/Eitension Trajectory
Stance Pha»e Swing Phase
Flexion
(Degrees)
Extension
(Degrees)
40% 60%
Percent Gait Cycle
Figure 1.
Knee flexion and extension trajectory of a neurological subject
during level walking at self-selected walking speeds. Pathological
( ), Normal ( ).
Ve rtic a I G ro u n d Reaction Force
Figure 2.
Force output over a stride length (heel strike to heel strike on the
same side) of a 45.36 kg female striking the force plate with the left
limb while walking at a self-selected walking speed. Forces have
been normalized by dividing by the body weight. Time base is
normalized to 100% with toe-off at 60%.

RRDS Gait Analysis in the Science of Rehabilitation
weight and that age and maturation affect walking
patterns (15). Therefore, caution must be used when
making comparisons of disabled walking patterns to
normative databases.
Identification of Disability Levels
As our healthcare environment is more often
requiring outcomes that are quantitative, gait analysis
can be useful in identifying levels of disability or
functional loss. While therapists use measures of
impairment to plan and implement treatment (16), it is
important to relate these impairment measures to
disability levels. QGA is well suited to provide informa-
tion about the impact of impairments during a func-
tional movement. This is an important service, as
physical therapists make very well defined impairment
measures in a “static” position but have to interpret
how these impairments relate to functional problems in
walking.
Several studies have begun to address the identifi-
cation of disability levels using QGA. Knutsson (17)
used dynamic EMG to classify subjects with hemiplegia
through the assessment of spasticity patterns. Delitto et
al. (18) classified those with low back pain, and
Richards et al. (19) classified the recovery stage of
persons who had suffered a stroke, based on their
walking velocity. These studies effectively relate the
gait impairments to the disability outcome and makecomparisons within a very homogeneous group rather
than comparing the data with those of a normative
database.
Efficacy of Interventions
Currently, there is a great demand to shorten the
length of hospital stay and a concomitant demand to
increase function: these demands require practitioners to
seek the most effective treatment interventions. Physical
therapists have many treatment paradigms at their
disposal, but there is little information available regard-
ing the intensity and duration of treatment. Gait analysis
can be a valuable tool to determine the benefit of
mobility treatments and their transference to the func-
tional task of walking. QGA comparisons made before
and after treatment can aid in the determination of the
intensity and duration of treatment, and when the effect
of a treatment has reached a plateau. For example, using
QGA, conclusions may be drawn about which surgical
or physical rehabilitation techniques for the person with
anterior cruciate ligament deficiency (ACLD) are ben-
eficial. Sinkjaer and colleagues studied muscle coordi-
nation of ACLD subjects and classified those who were
good versus those who were poor compensators during
walking (20). These differences have important clinical
treatment implications but would not have been identi-
fied with a less sophisticated form of analysis.
Performance Enhancement
Physical therapists often render treatment to im-
prove normal performance, as is the case with athletes.
Williams et al. (21) conducted a study using gait
analysis coupled with oxygen consumption measure-
ments to compare recreational and elite runners. These
authors reported that gait analysis proved to be more
useful than the assessment of running efficiency.
Therefore, gait analysis may be a useful tool to predict
the incidence of injury in athletes. This predictive
information is extremely desirable to third party payers
and helps to justify prophylactic physical therapy
treatments and the promotion of wellness in the athletic
population.
Mechanisms of Gait Deviations
A major challenge for physical therapists in the
evaluation of gait is the determination of which
deviations are primary and which compensatory. Obser-
vational gait analysis provides one answer to the trained
observer; however, these judgments need to be corrobo-
rated by quantitative measures. For example, the
contribution of muscles to measured motion versus
passive movement during the gait cycle has been
evaluated. A study by Sutherland et al. (22) indicated
that the plantar flexors are accelerators, but only in
40-50 percent of the gait cycle and not at terminal
stance as was originally thought. From a therapeutic
point of view, it is quite possible to observe sufficient
plantar flexion that may be occurring later in the stance
phase (60 percent and beyond). This observation maylead the physical therapist to decide that there is
sufficient plantar flexion power, not realizing that the
plantar flexion is occurring late in the gait cycle and is
likely a result of the passive extension at pre-swing due
to a rapid unloading of the limb. Once the source of a
gait deviation is determined to be primary, a physical
therapist is better able to tackle the deficiency more
directly.
Groups Potentially to Benefit
Anterior Cruciate Ligament Injury
The literature suggests that gait analysis might be
helpful to physical therapists in determining whether an
81
Chapter Two: Physical Therapist
individual is a candidate for a knee orthosis, rehabilita-
tion, or surgery. Berchuck et al. (23) describe the gait
pattern of persons with ACLD, which condition resulted
in drastic changes in knee joint kinetics during level
walking in the absence of serious kinematic differences.
These researchers determined that a “quadriceps avoid-
ance” pattern was evident. Kadaba et al. (24), on the
other hand, describe the same phenomenon as
increased-stance knee flexion that was balanced by
quadriceps muscle activity. This activity was described
as a positive adaptation due to the absence of the ACL.However, it becomes even more crucial when an
anterior cruciate reconstruction fails over time. If
physical therapists could receive feedback from kinetic
analysis of the knee joint forces during weight-bearing
exercises, alterations could be made in the treatment
strategy to avoid overstretching a reconstructed ACL,and they could educate the patient as to proper
functional activities to avoid reinjury.
Geriatric
Understanding the mobility problems in the elderly
can point to rehabilitation strategies. Patla et al. (25)
describe methods for classification and characterization
of mobility performance, such as walking over a variety
of terrains. Gait analysis can be useful in determining
whether there are problems with the locomotor appara-
tus. The aging process is multifactorial; therefore,
sensory and visual systems must be screened as well.
Matching subjective reports with quantitative gait re-
sults may aid the physical therapist in determining
which factors are the most limiting. For example, if pain
is perceived during the stance phase and is correlated
with reduction in force output of the quadriceps muscles
or reduced knee moments and powers, the physical
therapist can be guided by this information as to which
impairments to address first in the rehabilitation pro-
gram.
Pediatrics
Spastic paralysis often requires surgical interven-
tion for the lengthening of spastic muscles and their
tendons in an attempt to reduce muscle contractures and
abnormal skeletal alignment. Without the knowledge of
abnormalities of muscle function, floor reaction forces,
and 3-D movements, functional outcomes had been
disappointing. With the advent of clinical gait analysis,
the American Academy for Cerebral Palsy and Devel-
opmental Medicine was the first to apply the results in
the care of these persons (26).
Stroke and Head Injury
Central nervous system disorders can produce a
mixture of spasticity, impaired motor control, and
primitive reflexes, all of which can result in contracture.
It is difficult to discern inappropriate muscle action
during gait, because of the mass firing patterns and the
compensatory efforts to control the limbs. Herein lies an
extremely powerful benefit to the output from QGA for
the physical therapist. The major muscle groups firing
for extended periods are usually obvious to the skilled
gait observer, but the relative contributions of muscles
crossing the pelvis, hip, knee, and ankle are harder to
determine. Dynamic EMG can clarify this relationship
and guide the therapist in emphasizing manual interven-
tions and gait training to reduce spasticity.
Gait EMG of spastic muscles has also helped in the
clinical decision making for pharmaceutical interven-
tions (27) such as Botulinum Toxin A (BTX). BTXparalyzes muscles firing at inappropriate times during
gait and allows for strengthening of the antagonist
muscle group and gait training without the influence of
spasticity on the biomechanics of gait. The equinovarus
deformity is a good example of the difficulty in
differentiating the primary offending muscle during gait.
The cause may be premature activity or contracture of
the soleus, while tibial muscles display normal function.
A blocking agent, such as BTX, used in a sequential
fashion can help tease out the cause. The commonassumption is that the tibialis posterior is the cause, but
Wills et al. (28) discovered that this muscle was the
primary cause in only 25 percent of the cases, while the
tibialis anterior was the more frequent cause (45
percent) in 50 children with spastic paralysis. The
physical therapist can use this diagnostic information to
improve the balance of the firing patterns between the
agonist and antagonist through neuromuscular re-
education, biofeedback, and/or strengthening.
Fatigue (Post-polio and Chronic Fatigue Syndromes
)
Persons who have functioned well for 20-30 years
since polio, are now experiencing disabling symptoms
that are most often attributed to overuse, but the
mechanisms are unclear (29). These individuals sponta-
neously substitute alternate muscles for the weak or
absent musculature. Persons who have post-polio syn-
drome are primarily hampered by fatigue; therefore, an
understanding of the intensity and firing pattern of the
lower limb muscles is more appropriate than joint angle
profiles. Typically, the firing patterns of muscle activity
in these people are prolonged in order to avoid
82
RRDS Gait Analysis in the Science of Rehabilitation
instability during gait. The physical therapist who is
aware of which muscles are particularly susceptible,
will educate the subject about paced activity and
provide gait-training techniques that incorporate as
many alternate strategies as possible. Only one study
has been conducted in the area of gait abnormalities in
Chronic Fatigue Syndrome (30). This study identified
gait abnormalities compared with sedentary healthy
controls. However, the authors were not able to identify
the causal factors for this apparent difference but
hypothesized them to be due to balance problems,
muscle weakness, or central nervous system dysfunc-
tion. Gait analysis has begun to characterize movement
dysfunction in this population, but further work is
needed to compare these deficits over prolonged exer-
cise where the influence of fatigue may be more
pronounced.
Prosthetics
Several studies have evaluated the effectiveness of
prosthetic feet (31,32), many of which are designed to
conserve energy. A study by Gitter and colleagues (32)
indicated an improvement in energy efficiency of
approximately 30-40 percent with the energy-storing
feet over the standard SACH foot for persons with
transtibial amputation walking at normal speed. How-ever, the authors found that despite this greater me-
chanical performance, there were no significant differ-
ences in the knee and hip powers for the two feet.
Typically, physical therapists and prosthetists will
recommend the latest prosthetic components to enhance
prosthetic gait, but may be unable to determine different
energy requirements for walking with each component.
Since physical therapists have an opportunity to assess
energy requirements from subjective reports during
prosthetic gait training, corroboration for this perceived
decreased energy requirement from the use of sophisti-
cated prosthetic components might be obtained from
QGA. Torbum et al. (33) indicated that while the
kinematic and kinetic patterns implied reduced energy
expenditure during gait, oxygen consumption increased
due to the increased intensity and duration of muscle
firing. Dynamic EMG coupled with kinematic and
kinetic gait analysis allows for a teasing out of discrete
components incorporated into gait. A physical therapist
is equipped to utilize this information to guide the
treatment program and provide input for optimal
prosthetic equipment.
Orthotics
Physical therapists commonly evaluate the appro-
priateness or effectiveness of an orthosis, particularly
when an individual is in the acute recovery phase of
rehabilitation. QGA, with and without the orthosis,
reveals the degree to which an orthosis may help
through the evaluation of temporal and linear param-
eters and kinematic trajectories. The physical therapist
must include in the interpretation the physical con-
straints of the orthosis in evaluating the kinematic
trajectories. For example, an ankle-foot orthosis mayprohibit plantar flexion at heel strike but provide
sufficient clearance during swing phase. The ankle
trajectories will appear abnormal, due to this physical
constraint. The decision about orthosis effectiveness
might be better based on ambulation speed or temporal
symmetry than on ankle trajectory that would appear
abnormal from the QGA results. Therefore, while QGAprovides information about gait performance, the inter-
pretation of these findings is critical. The physical
therapist can offer a therapeutic perspective as to
prioritization of the gait parameters to which the subject
is capable of adjusting during rehabilitation.
Limitations of Gait Lab Data
Improvement is needed in the quality of the data
collected in gait laboratories. For example, if there is
excessive soft tissue movement under the reflective
markers, information about joint angle profiles maycontain excessive variability that is not part of the
movement pattern. This error of measurement is magni-
fied when mathematical derivations are made to calcu-
late velocity and acceleration. Further work is needed to
improve the quality control efforts in practicing labora-
tories. Greater efforts must be made to standardize
marker placement and terminology across gait laborato-
ries to communicate effectively between clinical groups.
There must be a better understanding of the underlying
gait models utilized by commercial software, so that the
interpretation of gait data considers the proper assump-
tions made by gait models.
Finally, normalization procedures need to be stan-
dardized to optimize across subject comparisons, in
addition to the need for normative databases for
homogeneous disabled groups. A common clinical use
of gait analysis is to compare the performance of an
individual with normative data to describe how the
disabled gait differs from the “normal.” We know that
83
Chapter Two: Physical Therapist
certain anthropomorphic factors, such as weight and leg
length, can vary the walking performance in
nondisabled individuals. However, varying anthropo-
morphic features are not available in existing databases;
if they were, the gait pattern of a subject of a specific
stature could then be compared to a larger sample of
persons with similar physical characteristics.
More definitive research that determines the utility
of gait analysis in the clinical setting is needed. In most
cases, OGA suits the clinician well for gross gait
deviations. Even 2-D gait analysis may give sufficient
information about gait performance with less complex-
ity than is needed for 3-D analysis. Nevertheless, the
system of analysis depends on the kind of clinical
judgment the user intends to base on the data. If the
physical therapist requires discrete unobservable infor-
mation about walking performance, QGA will be
needed. Currently, this situation would require a referral
to a center where this level of analysis is performed,
since it is impractical for most clinical settings.
However, the more practitioners define a need for QGA,the more gait laboratories will be driven to provide
information useful to the clinician in a timely manner.
Clinicians seek to be successful with the patients under
their care; therefore, whatever information aids in the
planning of rehabilitation strategies will prove benefi-
cial to them.
CONCLUSIONS
As all diagnostic and treatment methods will be
under scrutiny during the medical economic readjust-
ments currently underway, gait laboratories will have
similar obligations. Clinical gait analysis will be obliged
to relate objective findings to functional measures and
outcomes. More importantly, in order for gait laborato-
ries to survive in this arena, they will have to address
how treatment progression can be guided by gait
analysis. Physical therapists routinely address functional
outcomes and are well equipped to assess the effective-
ness of guided treatment as a result of quantitative
findings about gait and movement analysis.
REFERENCES
1.
American Physical Therapy Association’s task force on
practice parameters. What types of tests and measures do
physical therapists use? Phys Ther 1997;77:1198-997.
2. Nene AV, Evans GA, Patrick JH. Simultaneous multiple
operations for spastic diplegia: outcome and functional
assessment of walking in 18 patients. 1993;75B(3):488-94.
3. Krebs DE, Edelstein JE, Fishman S. Reliability of observa-
tional kinematic gait analysis. Phys Ther 1985;65:1027-33.
4. Saleh M, Murdoch G. In defense of gait analysis observation
and measurement in gait assessment. J Bone Joint Surg
1985;67B:237-41.
5. Miyazaki S, Kubota T. Quantification of gait abnormalities on
the basis of continuous foot-force measurement: correlation
between quantitative indices and visual rating. Med Biol Eng
Comput 1984;22:70-6.
6. deBruin H, Russel DJ, Latter JE. Angle-angle diagrams in
monitoring and quantification of gait patterns for children
with cerebral palsy. Am J Phys Med 1982;61:176-92.
7. Patla AE, Clous SD. Visual assessment of human gait:
reliability and validity. Rehabil Res 1998;1:87-96.
8. Eastlack ME, Arvidson J, Snyder-Mackler L, Danoff JV,
McGarvey CL. Interrater reliability of videotaped observa-
tional gait-analysis assessments. Phys Ther 1991;71:465-72.
9. Malouin F. Observational gait analysis. In: Craik RL, Oatis
CA, editors. Gait analysis: theory and application. St. Louis:
Mosby-Year Book, Inc.; 1995. p. 112-24.
10. Perry J. Gait analysis systems. In: Gait analysis: normal and
pathological function. NY: McGraw-Hill, Inc.; 1992. p.
351-4.
1 1. Davis RB, Ounpuu S, Tyburski DJ, DeLuca PA. A compari-
son of two-dimensional and three-dimensional techniques for
the determination of joint rotation angles. Proceedings of the
International Symposium on 3-D Analysis of Human Move-
ment; 1991. p. 67-70.
12. Boccardi S, Pedotti A, Rodano R, Santambrogio GC. Evalua-
tion of muscular moments at the lower limb joints by an
on-line processing of kinematic data and ground reaction. J
Biomech 1981;14:35-45.
13. Kerrigan DC, Gronley J, Perry J. Stiff-legged gait in spastic
paresis: a study of quadriceps and hamstrings muscle activity.
Am J Phys Med Rehabil 1991;70:294-300.
14. Murray MP, Drought AB, Kory RC. Walking patterns of
normal men. J Bone Joint Surg 1964;46(A):335-60.
15. Finley RR, Cody KA, Finizie RV. Locomotion patterns in
elderly women. Arch Phys Med 1969;50:140-6.
16. Dekker J, van Baar ME, Curfs EC, Kerssens JJ. Diagnosis and
treatment in physical therapy: an investigation of their
relationship. Phys Ther 1993;73:568-77.
17. Knutsson E, Richards C. Different types of disturbed motor
control in gait of hemiparetic patients. Brain 1979; 102:405-
30.
18. Delitto A, Cibulka MT, Erhard RE, Bowling RW, Tenhula
JA. Evidence for use of an extensor mobilization category in
acute low back pain syndrome. A prescriptive validation pilot
study. Phys Ther 1993;73:216-22.
19. Richards CL, Mouluin F, Duman F, et al. Gait velocity as an
outcome measure of locomotor recovery after stroke. In: Craik
RL, Oatis CA, editors. Gait analysis: theory and application.
St. Louis: Mosby-Year Book, Inc.; 1995. p. 355-64.
20. Sinkjaer T, Arendt-Nielsen L. Knee stability and muscle
coordination in patients with anterior cruciate ligament
84
RRDS Gait Analysis in the Science of Rehabilitation
injuries: an electromyographic approach. J Electromyograph
Kinesiol 1991;1;209-17.
21. Williams KR, Cavanagh PR. Relationship between distance
running mechanisms, running economy and performance. J
Appl Physiol 1987;63:1236-45.
22. Sutherland DH, Cooper L, Daniel D. The role of the ankle
plantar flexors in normal walking. J Bone Joint Surg Am1980;62A:354-63.
23. Berchuck M, Andriacchi TP, Bach BR, Reider B. Gait
adaptations by patients who have a deficient anterior cruciate
ligament. J Bone Joint Surg Am 1990;72A:871-7.
24. Kadaba MP, Ramakrishnan HK, Gainey JC, et al. Gait
adaptation patterns in patients with ACL deficiency. Trans
Orthop Res Soc 1 993; 1 8(2):36 1-77.
25. Patla A. A framework for understanding mobility problems of
the elderly. In: Craik RL, Oatis CA, editors. Gait analysis:
theory and application. St. Louis: Mosby-Year Book, Inc.;
1995. p. 436-49.
26. Sutherland DH, Kaufman KR. Human motion analysis and
pediatric orthopedics. In: Harris GF, Smith PA, editors.
Human motion analysis, current applications and future
directions. Piscataway NJ: IEEE Press; 1996. p. 219-54.
27. Albany K. Physical and occupational therapy considerations
in adult patients receiving Botulinum toxin injections for
spasticity. Muscle Nerve 1997;Supp 6:S221—3 1
.
28. Wills CA, Hoffer MM, Perry J. A comparison of foot-switch
and EMG analysis of varus deformities of the feet of chil-
dren with cerebral palsy. Dev Med Child Neurol
1988;30:227-31.
29. Halstead LS, Rossi CD. Post-polio syndrome: clinical experi-
ence with 132 consecutive outpatients. In: Halstead LS,
Wiechers DO, editors. Research and clinical aspects of the
late effects of poliomyelitis. White Plains, NY: March of
Dimes Birth Defects Foundation; 1987. p. 13-26.
30. Boda WL, Natelson BH, Sisto SA, Tapp WN. Gait abnormali-
ties in chronic fatigue syndrome. J Neurol Sci 1995; 13 1:156-
61.
31. Burgess EM, Hittenberger DA, Forsgren SM, Lindh DV. The
Seattle prosthetic foot—a design for active sports: preliminary
studies. Orthot Prosthet 1 993;37( 1 ):25—3 1
.
32. Gitter A, Czemiecki JM, DeGroot DM. Biomechanical
analysis of the influence of prosthetic feet on below-knee
amputee walking. Am J Phys Med Rehabil 1991;70:142-8.
33. Torbum L, Perry J, Ayyappa E, Shanfield SL. Below-knee
amputee gait with dynamic elastic response prosthetic feet: a
pilot study. J Rehabil Res Dev 1 990;27(4):369—84.
SUE ANN SISTO, Ph.D., P.T. is currently a clinical assistant
professor in the Department of Physical Therapy in the School of
Health-Related Professions at the University of Medicine and
Dentistry of New Jersey and a Guest Lecturer at New York
University. Dr. Sisto is also the Director of the Human Performance
and Motion Analysis Laboratory at the Kessler Medical Rehabilita-
tion Research and Education Corporation. She completed her
bachelor’s degree at St. Louis University and her Master’s and
Doctoral degrees at New York University and has published on
various topics in the area of human performance in a variety of
rehabilitation populations, including studies of activity limitations,
exercise capacity, prosthetics and orthotics, and movement analysis.
Dr. Sisto continues to dedicate a full-time effort to research in the
area of human performance and gait analysis of individuals with
disabilities. She has lectured on the state and national levels and
continues to mentor graduate and post-doctoral fellows in the area of
rehabilitation research.

SECTION FOUR
Future Directions in Gait Analysis
by Kenton R. Kaufman, PhD, PE
Dr. Kaufman is Co-Director of the Biomechanics Laboratory, Associate Professor of Bioengineering, and Senior
Associate Consultant in the Department of Orthopedics at the Mayo Clinic, Rochester, MN.
INTRODUCTION
Gait analysis has advanced considerably over the
past century. Since the pioneering work of Braune and
Fisher (1), much effort has been put into developing the
needed technology for human movement analysis.
Automated movement tracking systems have replaced
hand digitization. Advances in the aerospace industry
have been utilized for the development of force plates
for kinetic analysis. Computerized electromyography
(EMG) systems have replaced hand palpitation. Cur-
rently, the technology and knowledge for gait analysis
have advanced to a level that permits rapid analysis.
During the past decade, health care delivery
systems have evolved at a pace that few expected. The
most visible change is the development of managed care
delivery systems. An increasing emphasis is being
placed on determining the outcome of various clinical
procedures. A number of approaches and methods are
applied by doctors, nurses, therapists, and other special-
ists to prevent a particular condition, ameliorate its
effects, or change a given state. A scientific basis for
clinical practice is being requested. An increasing
emphasis is being placed on obtaining accurate mea-
sures to determine the outcome of various clinical
procedures.
Gait laboratories can play a key role in these
managed care scenarios. The objective measurements
provided by gait analysis techniques are central to
measurement of the patient’s progress. The future of
This material is based on work supported in part by the National
Institutes of Health, Bethesda, MD.
Address all correspondence to: Kenton R. Kaufman, PhD, PE, Biomechanics
Laboratory, Guggenheim 128, Mayo Clinic, 200 First Street, SW, Rochester,
MN 55905; Phone: 507-284-2262, Fax: 507-284-5392, e-mail: kaufman.
gait analysis will depend upon advances made in
experimental, analytical, and interpretation techniques
for gait studies.
HEALTH CARE REFORM
Health care costs have risen dramatically over the
last 3 decades (Figure 1). In 1960, the national health
expenditure for health care was 5.3 percent of the gross
national product (2); by 1994, health care expenditure
had risen to 13.7 percent. The United States currently
spends almost three times more on health care than on
education or defense, as can be seen in Figure 2 (3).
The U.S. health care system is the most expensive in the
world (Figure 3). Health care expenditure in the United
States was approximately $950 billion in 1994 (2); this
is one-third more than any other industrialized nation. In
addition to being the most expensive system in the
world, U.S. health care costs are growing more rapidly
than those in any other industrialized nation. Personal
expenditures from medical care have increased over
three-fold in the past six decades (2). Initially, most of
the payment for personal health care was from out-of-
pocket payments (Figure 4), but this percentage has
decreased and the contribution from health insurance
has continued to increase throughout the decades.
Given these economic realities, much emphasis is
placed on systems for delivery of health care. These
delivery systems were set up to offer the potential for
controlling cost by providing coherent networks to
obtain discount pricing by integrating the financing
and delivery of medical care. Managed care, and
everything that it represents (cost containment, competi-
tion among providers, constraints on health services.
85
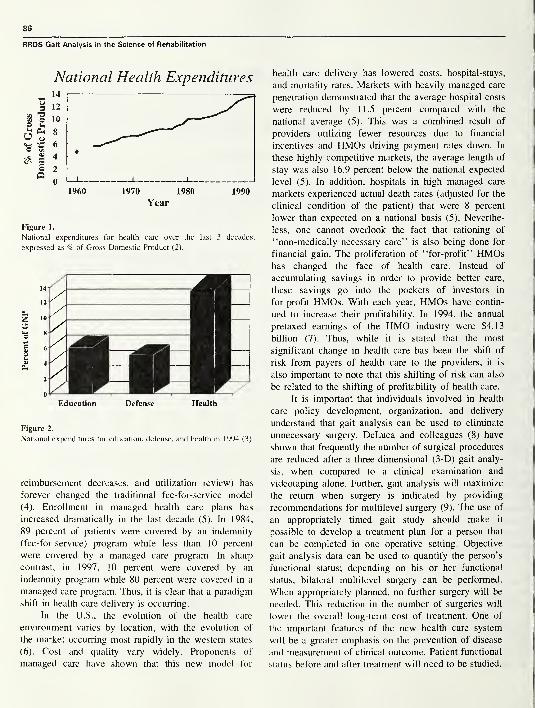
RRDS Gait Analysis in the Science of Rehabilitation
National Health Expenditures
I960 1970 1980 1990
Year
Figure 1.
National expenditures for health care over the last 3 decades,
expressed as % of Gross Domestic Product (2).
Education Defense Health
Figure 2.
National expenditures for education, defense, and health in 1994 (3).
reimbursement decreases, and utilization review) has
forever changed the traditional fee-for-service model
(4). Enrollment in managed health care plans has
increased dramatically in the last decade (5). In 1984,
89 percent of patients were covered by an indemnity
(fee-for-service) program while less than 10 percent
were covered by a managed care program. In sharp
contrast, in 1997, 10 percent were covered by an
indemnity program while 80 percent were covered in a
managed care program. Thus, it is clear that a paradigm
shift in health care delivery is occurring.
In the U.S., the evolution of the health care
environment varies by location, with the evolution of
the market occurring most rapidly in the western states
(6). Cost and quality vary widely. Proponents of
managed care have shown that this new model for
health care delivery has lowered costs, hospital-stays,
and mortality rates. Markets with heavily managed care
penetration demonstrated that the average hospital costs
were reduced by 11.5 percent compared with the
national average (5). This was a combined result of
providers utilizing fewer resources due to financial
incentives and HMOs driving payment rates down. In
these highly competitive markets, the average length of
stay was also 16.9 percent below the national expected
level (5). In addition, hospitals in high managed care
markets experienced actual death rates (adjusted for the
clinical condition of the patient) that were 8 percent
lower than expected on a national basis (5). Neverthe-
less, one cannot overlook the fact that rationing of
“non-medically necessary care” is also being done for
financial gain. The proliferation of “for-profit” HMOshas changed the face of health care. Instead of
accumulating savings in order to provide better care,
these savings go into the pockets of investors in
for-profit HMOs. With each year, HMOs have contin-
ued to increase their profitability. In 1994, the annual
pretaxed earnings of the HMO industry were $4.13
billion (7). Thus, while it is stated that the most
significant change in health care has been the shift of
risk from payers of health care to the providers, it is
also important to note that this shifting of risk can also
be related to the shifting of profitability of health care.
It is important that individuals involved in health
care policy development, organization, and delivery
understand that gait analysis can be used to eliminate
unnecessary surgery. DeLuca and colleagues (8) have
shown that frequently the number of surgical procedures
are reduced after a three-dimensional (3-D) gait analy-
sis, when compared to a clinical examination and
videotaping alone. Further, gait analysis will maximize
the return when surgery is indicated by providing
recommendations for multilevel surgery (9). The use of
an appropriately timed gait study should make it
possible to develop a treatment plan for a person that
can be completed in one operative setting. Objective
gait analysis data can be used to quantify the person’s
functional status; depending on his or her functional
status, bilateral multilevel surgery can be performed.
When appropriately planned, no further surgery will be
needed. This reduction in the number of surgeries will
lower the overall long-term cost of treatment. One of
the important features of the new health care system
will be a greater emphasis on the prevention of disease
and measurement of clinical outcome. Patient functional
status before and after treatment will need to be studied.
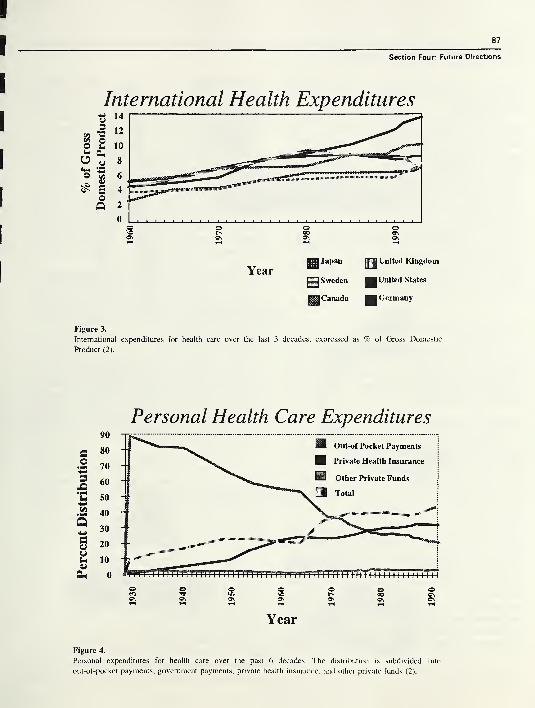
87
Section Four: Future Directions
International Health Expenditures
pi Japanjj|
United Kingdom
Yearjjjj
Sweden United States
gH Canada Germany
Figure 3.
International expenditures for health care over the last 3 decades, expressed as % of Gross Domestic
Product (2).
Personal Health Care Expenditures
Figure 4.
Personal expenditures for health care over the past 6 decades. The distribution is subdivided into
out-of-pocket payments, government payments, private health insurance, and other private funds (2).
RRDS Gait Analysis in the Science of Rehabilitation
Payors are turning their attention from short-term
savings to long-term predictable improvement in both
cost and quality.
Challenges exist to further evolve the science of
clinical gait analysis to make it effective as an
assessment tool. Currently, a clinical gait analysis study
consists of five broad areas (Figure 5). Initially, a
history and physical examination is performed on the
patient. If it is determined that he or she could benefit
from a gait analysis study, an evaluation is requested.
The gait study consists of data collection, data reduc-
tion, analysis, and interpretation of the results of the
study. This information is compiled in a clinical report
and recommendation is given for treatment. The future
of gait analysis will depend upon advances made in
experimental, analytical, and interpretation techniques.
Opportunities for future enhancements of gait studies
are outlined in the following sections.
EXPERIMENTAL TECHNIQUES
Advances in experimental techniques have been
made possible because of the advances in computer
technology, which need to be applied toward enhance-
ments of data collection, data presentation, and quantifi-
cation of muscle function.
Advances in Computer Power
Decreasing costs and simultaneous increases in the
computational capacity of computers have facilitated
many technological advances in scientific fields. In
1937, Howard H. Aiken of Harvard University con-
ceived the first large-scale automatic digital computer.
In the late 1960s, computers operated at an internal
speed about 20 to 100 times faster than their counter-
parts of 10 years earlier. By the 1980s, speeds were
1,000 times faster than in the 1960s. Over the same
period, storage capacities and computer memory in-
creased by comparable factors (10). Thus, since 1945
the speed of computers has approximately doubled
every 2 years. The exponential increases in the compu-
tational power of computers makes development and
visualization of biomechanical models of the
musculoskeletal system possible. The evolution of
performance of microcomputers has surpassed the
evolution of conventional supercomputers (Figure 6)*.
*Personal Communication with Lawrence Livermore National Laboratory,
Lovermore, CA, 1995.
The supercomputer curve shows a steady gradual
increase in performance over the last 15 years. In
contrast, dramatic improvements in integrated circuit
technology are allowing microprocessors to close the
performance gap with conventional supercomputers.
Beyond the purely technological improvements in
memory and speed, user interface improvements have
had an equally large effect on increases in productivity.
The interface between the human and the computer has
become easier to use and much more efficient. Com-puter programs of today feature pull-down menus,
mouse-driven applications, and graphical input and
display capabilities. These changes have resulted in user
friendly systems that aid in the visualization and
understanding of complicated biomechanical models.
Data Acquisition Systems for Movement Analysis
The techniques for motion analysis have pro-
gressed from motion photography, (11,12) and electro-
goniometry (13,14) to automated stereometric systems
(15-18). Motion data provides the information neces-
sary for calculation of the time/distance parameters of
walking (velocity, cadence, stance and swing times,
etc.) and the angular position of the person’s joints
(hips, knees, and ankles) during the different phases of
gait. The derived measurements indicate the degree of
normalcy (or abnormality) and the presence of compen-
satory patterns. Techniques that quantify deviation from
normal walking during the gait cycle are of greatest
clinical interest and treatment potential for people with
movement disabilities.
A number of technologies are in use today for the
capture of human motion. Each of the existing ap-
proaches has undesirable constraints that limit its
applicability for real-time modeling of full body motion
with the prerequisite for accuracy, scan rate, number of
sensors, and range, and without impingement of the
limited function of disabled individuals. The five
existing technology categories include the
• electromechanical linkage method• stereometric method• roentgenographic method
• accelerometric method• magnetic coupling method.
Each technique has disadvantages.
An exoskeleton apparatus is employed with the
electromechanical linkage method to measure joint
motion. The primary disadvantage for this technique is
the cumbersome nature of the instrument and, to a lesser

89
Section Four: Future Directions
Patient History &Physical Exam
^ Gait Study
Data Collection
Analysis
jflBl Interpretation
«m Clinical Report &Recommendations
Figure 5.
Sequence of events for a clinical gait analysis study.

90
RRDS Gait Analysis in the Science of Rehabilitation
Figure 6.
Evolution of performance of supercomputers and microcomputers
( 11 ).
extent, cross coupling of the sensor inputs and joint
motion. The requirement for the exoskeleton instrument
affects the motion of young subjects making it unusable
for clinical measurement.
The stereometric method is the most popular one
currently used for clinical gait analysis. It employs
visible markers attached to the skin on rigid segments of
the body structure and tracks their motion using
imaging equipment. This technique is implemented
using charge coupled device (CCD) cameras and
frame-grabber electronics to allow digital images to be
captured as the subject moves within the field of view.
Digital image analysis allows the physical location of
each marker to be computed, using triangulation of the
views from an array of camera systems. This technique
has minimal impact on the natural motion of the subject
and allows data capture without the need to tether the
subject to the data acquisition hardware. However, a
disadvantage of this approach is the increased image
analysis complexity resulting from tracking the apparent
position of the markers in a two-dimensional (2-D)
image on a per camera frame-to-frame basis and
correlating the position of each marker for the multiple
camera positions. Occlusion of markers from the camera
field of view and false readings caused by reflection
phantoms pose non-trivial, unresolved complications in
data capture. In addition, passive markers provide
unlabeled trajectory segments that must be manually
identified and resolved. This image analysis task
requires a significant amount of time for the data
gathering process. A second major disadvantage is the
reduction in resolution as the camera system is altered
to allow a larger field of view. The camera imaging
sensors have a fixed number of pixel elements and a
compromise must be reached between optical field of
view and pixel element resolution size, limiting the
clinical measurement volume to approximately a single
stride. It is not feasible to measure gait patterns or
variability with only one traversal of the instrument
walkway. Thus, multiple walking trials need to be
collected, which may fatigue the subject.
The biplanar roentgenographic method employs
metal markers and x-ray films for the measurement of
static positions of a body joint. This approach is not
appropriate for the study of dynamic joint motion. Due
to the use of ionizing radiation, it also represents a
potential health hazard to the subject.
The accelerometric approach employs sensors at-
tached to the rigid areas of the human subject that
measure accelerations in three dimensions. Joint motion
is then derived through integration of the accelerometer
waveforms given appropriate initial conditions. Integra-
tion of the waveforms produces velocities for each of
the sensor locations. A second integration step provides
the displacement as a function of time. This technique
can provide the kinematic motion measurement desired
but has been implemented with a tether to the subject
for the data acquisition; however, the tether affects the
motion of the subject and represents an undesirable
feature. In addition, this approach requires an accurate
estimate of initial conditions, which is difficult to
provide.
The magnetic coupling method employs a refer-
ence magnetic field source that surrounds the subject
with an array of magnetic field sensing elements
attached to the rigid segments of the subject. The
position of each sensor is estimated through analysis of
the magnetic field components passing through the
sensor. This technique has the potential for providing
complete six degree-of-freedom motion information, but
has been implemented by using a tether to each of the
sensors and the data collection system. The response of
the system is limited to 30 Hz, which is below the
required data acquisition rate for high fidelity measure-
ments. Further, the sensing elements are sensitive to
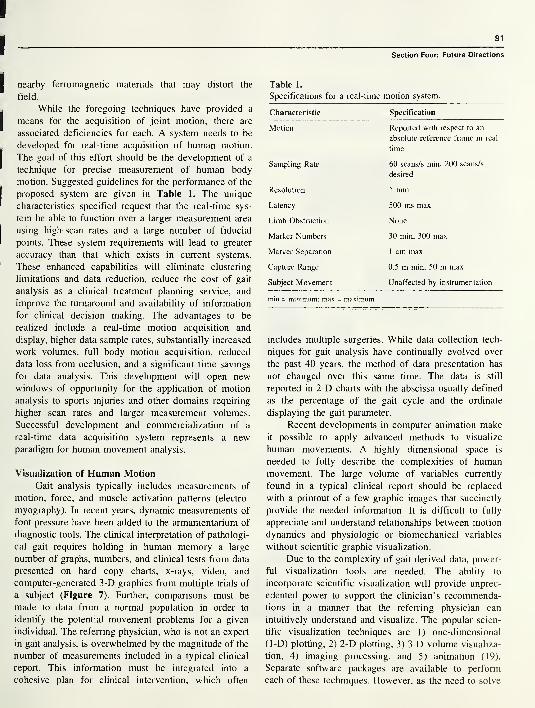
91
Section Four: Future Directions
nearby ferromagnetic materials that may distort the
field.
While the foregoing techniques have provided a
means for the acquisition of joint motion, there are
associated deficiencies for each. A system needs to be
developed for real-time acquisition of human motion.
The goal of this effort should be the development of a
technique for precise measurement of human body
motion. Suggested guidelines for the performance of the
proposed system are given in Table 1. The unique
characteristics specified request that the real-time sys-
tem be able to function over a larger measurement area
using high-scan rates and a large number of fiducial
points. These system requirements will lead to greater
accuracy than that which exists in current systems.
These enhanced capabilities will eliminate clustering
limitations and data reduction, reduce the cost of gait
analysis as a clinical treatment planning service, and
improve the turnaround and availability of information
for clinical decision making. The advantages to be
realized include a real-time motion acquisition and
display, higher data sample rates, substantially increased
work volumes, full body motion acquisition, reduced
data loss from occlusion, and a significant time savings
for data analysis. This development will open newwindows of opportunity for the application of motion
analysis to sports injuries and other domains requiring
higher scan rates and larger measurement volumes.
Successful development and commercialization of a
real-time data acquisition system represents a newparadigm for human movement analysis.
Visualization of Human Motion
Gait analysis typically includes measurements of
motion, force, and muscle activation patterns (electro-
myography). In recent years, dynamic measurements of
foot pressure have been added to the armamentarium of
diagnostic tools. The clinical interpretation of pathologi-
cal gait requires holding in human memory a large
number of graphs, numbers, and clinical tests from data
presented on hard copy charts, x-rays, video, and
computer-generated 3-D graphics from multiple trials of
a subject (Figure 7). Further, comparisons must be
made to data from a normal population in order to
identify the potential movement problems for a given
individual. The referring physician, who is not an expert
in gait analysis, is overwhelmed by the magnitude of the
number of measurements included in a typical clinical
report. This information must be integrated into a
cohesive plan for clinical intervention, which often
Table 1.
Specifications for a real-time motion system.
Characteristic Specification
Motion Reported with respect to an
absolute reference frame in real
time
Sampling Rate 60 scans/s min, 200 scans/s
desired
Resolution 1 mm
Latency 500 ms max
Limb Obstruction None
Marker Numbers 30 min, 300 max
Marker Separation 1 cm max
Capture Range 0.5 m min, 50 m max
Subject Movement Unaffected by instrumentation
min = minimum; max = maximum
includes multiple surgeries. While data collection tech-
niques for gait analysis have continually evolved over
the past 40 years, the method of data presentation has
not changed over this same time. The data is still
reported in 2-D charts with the abscissa usually defined
as the percentage of the gait cycle and the ordinate
displaying the gait parameter.
Recent developments in computer animation make
it possible to apply advanced methods to visualize
human movements. A highly dimensional space is
needed to fully describe the complexities of human
movement. The large volume of variables currently
found in a typical clinical report should be replaced
with a printout of a few graphic images that succinctly
provide the needed information. It is difficult to fully
appreciate and understand relationships between motion
dynamics and physiologic or biomechanical variables
without scientific graphic visualization.
Due to the complexity of gait-derived data, power-
ful visualization tools are needed. The ability to
incorporate scientific visualization will provide unprec-
edented power to support the clinician’s recommenda-
tions in a manner that the referring physician can
intuitively understand and visualize. The popular scien-
tific visualization techniques are 1) one-dimensional
(1-D) plotting, 2) 2-D plotting, 3) 3-D volume visualiza-
tion, 4) imaging processing, and 5) animation (19).
Separate software packages are available to perform
each of these techniques. However, as the need to solve
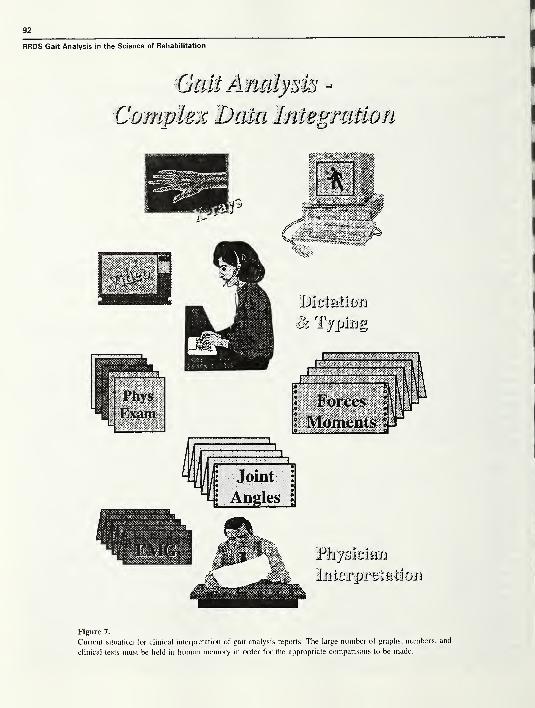
92
RRDS Gait Analysis in the Science of Rehabilitation
Gait Analysis -
Complex Data Integration
Ph/skibm
Imbrprviiiliun
Figure 7.
Current situation for clinical interpretation of gait analysis reports. The large number of graphs, numbers, and
clinical tests must be held in human memory in order for the appropriate comparisons to be made.
93
Section Four: Future Directions
complex problems becomes more acute, one package is
needed that provides all of these capabilities to enhance
productivity.
A scientific computing environment is needed that
will allow the rapid transmission, archival, retrieval, and
manipulation of images within a system equipped with
analytical tools useful for clinical and research pur-
poses. Tools are needed for data collection, analysis,
and visualization (Figure 8). A suitable database of
normal gait patterns is needed for comparison. The
ultimate goal of this scientific visualization workstation
is to provide a user-friendly, menu-driven environment
that will facilitate the reporting of biomechanical data
and integrate real-time animation of fully 3-D realistic
graphical depictions of articulated body segments. This
system should provide clinicians with the ability to
visualize the correlation between collected biomechani-
cal data and the actual human motion. Furthermore, this
system should provide the ability to simulate gait and
compare the computer-generated simulation with experi-
mentally collected data. The operator should be able to
examine the data from any viewing angle, to zoom in or
out, change the viewing perspective, or stop the motion.
This system should have the ability to superim-
pose normal gait on a subject’s gait in order to visual-
ize differences. The system should also be able to align
the bodies displayed to a common center of gravity or
to a common point in the gait cycle (20). It should be
capable of “removing” extremities in order to im-
prove visualization of other body segments. The two
most important goals are the realistic appearance of
the human figure and the convenient specification
of the biomechanical data. This application should be
user-friendly so that it can be used by colleagues whoare not necessarily programmers but have the exper-
tise in their respective fields (e.g., medical doctors).
The software environment should be capable of
quick and easy customization to serve very specific
needs.
Another key issue is the communication of the
results. The clinician must be able to select only the
most essential results for the communication to the
referring physician and the patient. Otherwise, the
individuals will be overwhelmed by the plethora of
numbers while comprehending little. Practical display of
data will provide an economical and efficient method of
communicating information (21). When graphical por-
trayal of data is limited by dimensionality (i.e., three
dimensions), other variations in the output such as
color, sound, and shape can be used to help overcome
this limitation. This application of technology should
provide a mechanism to integrate all aspects of gait
measurements and observations into a single tool for
physician interpretation, diagnosis, and treatment rec-
ommendations (Figure 9).
Muscle Force Measurement
Muscle forces reflect the underlying neurocontrol
processes responsible for observed movement patterns.
In addition, muscle forces play a major role in
determining stresses in bones and joints. Thus, a
knowledge of muscle forces is fundamental for improv-
ing the diagnosis and treatment of individuals with
movement disorders. Interpretation of muscle function
has routinely been based on analyses of electromyo-
graphic data obtained during gait studies (22-24). More
specific detailed knowledge of the muscle forces acting
on the body will allow us to improve our ability to
diagnose and treat persons with movement disabilities.
It will also increase our understanding of muscle
function during gait. Unfortunately, invasive techniques
for measuring muscle forces are highly objectionable.
Techniques such as electromyography (EMG) do
not provide the quantitative accuracy needed. A funda-
mental relationship exists between the tension that a
muscle is capable of developing and the length of the
muscle. The total muscle tension is composed of both
active and passive components. This well-known phe-
nomenon is described by Blix’s curve, which demon-
strates the relationship of total muscle force, passive
stretch force, and muscle contractile force to the length
of the muscle (25). Yet, the integrated electromyogram
can only be proportional to the active component and
will not account for the passive stretch of the muscle.
Use of the integrated electromyogram as an indicator of
the quantity of muscle contraction has another draw-
back. There is a significant delay between maximal
electric activity in the muscle and maximal tension. The
electromechanical delay has been estimated to be 30 to
90 ms (26-30), which would be approximately 3 to 9
percent of the gait cycle.
Measurement of intramuscular pressure is a con-
ceivable solution. Intramuscular pressure is a mechani-
cal variable that is proportional to muscle tension.
Investigators have shown in studies on animals (31-33)
and in humans (34-36) an approximately linear relation-
ship between intramuscular pressure and muscle force
during isometric muscle contraction. Further, estimation
of muscle force from intramuscular pressure is not
affected by changes in signal due to muscle fatigue
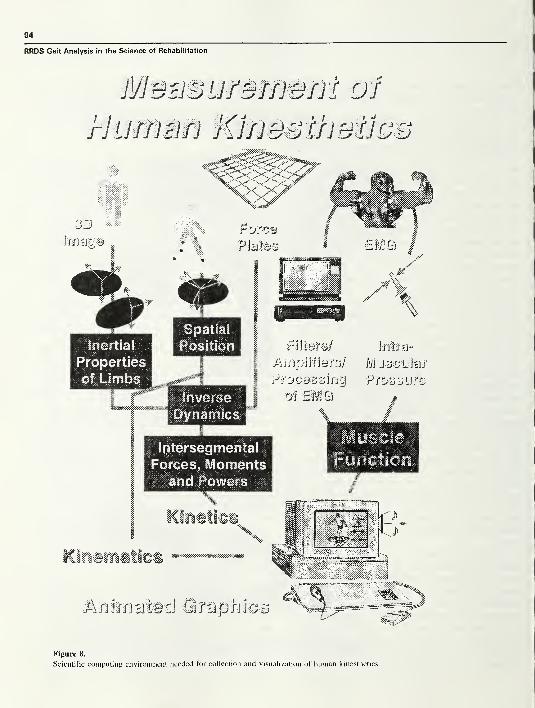
94
RRDS Gait Analysis in the Science of Rehabilitation
BUDurswem of
rhmwn Klfjoofhofjoo
Figure 8.
Scientific computing environment needed for collection and visualization of human kinesthetics.

95
Section Four: Future Directions
Figure 9.
User interface for graphical portrayal of gait analysis data.
(37,38). Nevertheless, the absolute intramuscular pres-
sure depends on the depth of the recording catheter
within the muscle (32,38), the shape of the muscle (39),
and the compliance of the surrounding tissue (40).
Baumann et al. (41) reported that intramuscular pressure
is related to the active and passive components of
muscle tension during gait. Kaufman and Sutherland
(42) have also reported that the intramuscular pressure
during walking parallels the electromyographic activity,
but also accounts for passive stretch of the muscle
(Figure 10). In the future, more work is needed in the
use of intramuscular pressure to quantify muscle force.
Improvements in microsensor technology can be used to
facilitate these measurements.

96
RRDS Gait Analysis in the Science of Rehabilitation
ANALYTICAL TECHNIQUES
A fundamental concern in the study of human
locomotion is a description of the kinematics and
kinetics involved. During the study of gait, a large
number of measurements are taken. The experimental
data are entered into an analytical model to obtain the
values of variables not directly measurable. The analyti-
cal model is a link segment model. The human body is
modeled as a system of articulated, rigid links, which
represent the lower limb segments and the upper body.
By modeling the body as an ensemble of rigid-body
segments, it is possible to calculate the movement and
loads at any articulation.
Kinematics
In order to establish a mathematically workable
model, Cartesian coordinate systems are established on
each body segment (43-47). These anatomically based
axis systems are fixed in each body segment and movewith it. The coordinates of bony landmarks are used to
build a right-handed orthogonal coordinate system. The
unique specification of anatomical coordinate systems
requires a minimum of three noncolinear points that are
defined with respect to surface landmarks associated
with each segment. In order to obtain the joint
movement, expressions have to be obtained relating the
position of each segment in the model with respect to
adjacent segments. Joint motions are usually 3D. The
anatomical description of the relative orientation of the
two limb segments can be conveniently obtained by
relating the two coordinate systems embedded in the
proximal and distal body segments. The ability to
describe joint orientation in 3-D space following
traditional rigid-body motion theory is essential. For
finite spatial rotation, the sequence of rotation is
extremely important and must be specified for a unique
description of joint motion. For the same amount of
rotation, different final orientations will result from
different sequences of rotation. However, with proper
selection and definition of the axes of rotation between
two bony segments, it is possible to make the finite
rotation sequence independent or commutative. In the
past 15 years, the concept of Eulerian angles has been
adopted in the field of biomechanics to unify the
definition of finite spatial rotation (48,49). If a unit
vector triad (I,J,K) is attached to a fixed segment along
the XYZ axes and another triad (ij,k) is fixed to the
moving segment along the xyz axes (Figure 11), the
relationship between them after any arbitrary finite
FS TO FS TO FS TO FS
EMG Right
OTOOFS
OTOOFS
i l
i i
1 l
OTOOFS
i i
i 1
1 1
Gastrocnemius(volts)
+0 5-
! i
i i
l i
i i
i l
1-J.I
i i
i i
i i
40.5-
i •IK1
i i
i i
_1 L
r-f-r1
1 1
1 1
1 1
—
<
IMP Right
Gastrocnemius
(mm HG)100
50-
0-.4l l
i l
i i
i i
vii i
1 1
1 1
1 1
1 1
1 1
1 Al1
/ V1y \
Figure 10.
Raw data for single subject during gait: EMG and intramuscular
pressure are being recorded from the gastrocnemius muscle. Stance
phase of gait occurs from FS to TO. Swing phase of gait occurs
from TO to FS and single-limb stance from OTO to OFS. Peaks in
intramuscular pressure during gait can be correlated with peaks of
active contraction and passive stretch of the gastrocnemius (42).
rotation can be expressed by a rotational matrix in terms
of three Eulerian angles, 4>, *!> as follows:
i C0C(/> cdc<f) — s 6 I
j= — CljjS(J)+ Sll^6c4) Ct//c4>+ Sl//S0S(/> Sl//C0 J
k S(/)St//+Ct/>S0C<£ — SljjC(f)+ c4ftdS(f) ClfjcO K
where s=sine and c=cosine. The Eulerian angles can be
calculated based on the known orientation of these unit
vector triads attached to the proximal and distal body
segments.
For a more general unconstrained movement in
space, three translations and three rotations are required
to describe the joint motion. The displacement of a rigid
body can take place along any one of an infinite number
of paths. It is convenient to describe the displacement in
terms of the simplest motion that can produce it. The
most commonly used analytic method for the descrip-
tion of six-degree-of-freedom rigid-body displacement
is the screw displacement axis (50-52). The motion of
the moving segment from one position to another can be
defined in terms of a simultaneous rotation, <F, around
and a translation, t, along a unique axis, called a screw
displacement axis, which is fixed in the fixed segment
(Figure 12). The screw displacement axis is a true
vector quantity. However, the amount of the finite
screw rotation is not a vector quantity, and the
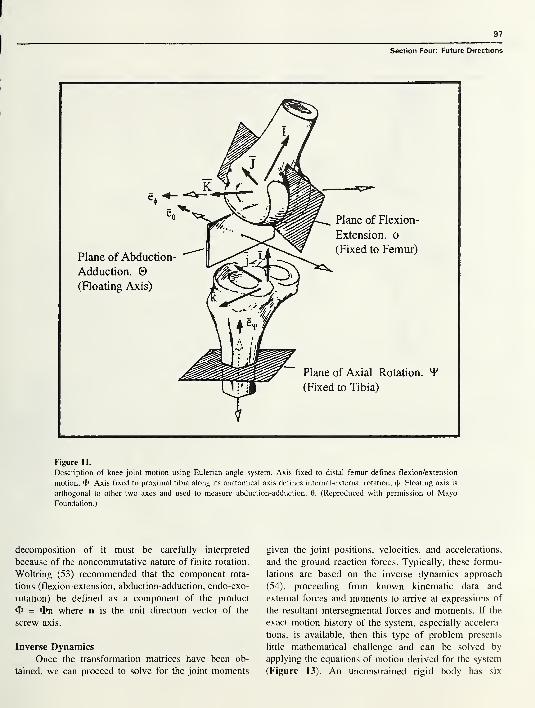
97
Section Four: Future Directions
Figure 11.
Description of knee joint motion using Eulerian angle system. Axis fixed to distal femur defines flexion/extension
motion, 4>. Axis fixed to proximal tibia along its anatomical axis defines internal-external rotation, 4»- Floating axis is
orthogonal to other two axes and used to measure abduction-adduction, 0. (Reproduced with permission of MayoFoundation.)
decomposition of it must be carefully interpreted
because of the noncommutative nature of finite rotation.
Woltring (53) recommended that the component rota-
tions (flexion-extension, abduction-adduction, endo-exo-
rotation) be defined as a component of the product
<t> = On where n is the unit direction vector of the
screw axis.
Inverse Dynamics
Once the transformation matrices have been ob-
tained, we can proceed to solve for the joint moments
given the joint positions, velocities, and accelerations,
and the ground reaction forces. Typically, these formu-
lations are based on the inverse dynamics approach
(54), proceeding from known kinematic data and
external forces and moments to arrive at expressions of
the resultant intersegmental forces and moments. If the
exact motion history of the system, especially accelera-
tions, is available, then this type of problem presents
little mathematical challenge and can be solved by
applying the equations of motion derived for the system
(Figure 13). An unconstrained rigid body has six

RRDS Gait Analysis in the Science of Rehabilitation
Figure 12.
Screw displacement axis can be used to describe general spatial
motion. Tibia moves from position 1 to position 2 by rotation about
screw axis by an amount and by translating along the screw axis
by an amount t. (Reproduced with permission of Mayo Foundation.)
degrees of freedom. Hence, six equations of motion are
needed to specify its configuration. Three equations can
be chosen to represent the translation of the rigid-body
center of mass and three equations to represent the
rotation about any point, A. In the case of the motion of
a rigid body in three dimensions, the fundamental
equations are:
XFa - md(rc)/dt
2Ma = Ha + m(rA X rc )
These fundamental equations express that the system of
external forces, SFa , and moments, 2Ma , acting at the
limb segment are equipollent to the system consisting of
the linear momentum vector, m d(rc)/dt, and the
moment of momentum vector, HA + m(rA x rc ). Using
measurements of the intersegmental load actions and the
relevant kinematics, it is possible to compute the energy
and power transmitted from one body segment to
another. The joint powers are obtained from the scalar
(dot) product of the intersegmental joint moment and
the joint angular velocity as well as the intersegmental
joint force and translational velocity. The rate of work
done (power) can be calculated from:
W = M • o> + F v
where W = mechanical power
M = intersegmental joint momentF = intersegmental joint force
oj = angular velocity and
v = translational velocity.
Frequently, the component due to translation is assumed
to be small and the second term (F- v) is rarely included
in joint power estimates for gait. This technique can be
used to predict the transfer of energy from body
segment to body segment through the muscles (55). The
muscles can either generate or absorb mechanical
energy by contracting concentrically or eccentrically,
respectively.
Body Segment Mass Inertial Estimates
Estimates of body segment mass, center of mass,
and moments of inertia are needed for these
biomechanical models. These body segment parameters
are used along with the segmental kinematics to
compute the linear and angular momentum of the body
segments. Estimates of these values are substituted into
the Newton-Euler equations of motion to obtain an
estimate of joint loads during physical activity. These
body segment estimates are a big source of error in
biomechanical models (56). Methods of obtaining iner-
tial parameters of body segments can be classified into
three groups:
• regression equations
• geometric approximation
• direct measurement
Regression equations have been developed based
on cadaver studies (57-59) and living subjects (60-62).
The equations have been developed through statistical
analysis of the data. The regression equations based on
cadaver studies typically lead to errors arising from
differences in tissue composition and morphology
between the cadaver samples and a given human subject
(63). The study by Chandler et al. (59) was the first
study to determine the segmental principal axes of

99
Section Four: Future Directions
Figure 13.
Solution process for inverse dynamics problem. Displacement information must be differentiated
twice to yield acceleration. Either Newtonian or Lagranian formulations can be used to formulate the
equations of motion. (Reproduced with permission of Mayo Foundation.)
inertia and provided verifiable comparisons of derived
photometric values and directly measured values. Onthe basis of these comparative relationships, a series of
predicted regression equations were developed for adult
males (61) and adult females (62). However, the sample
sizes of these studies have been relatively small.
The geometrical approximation method represents
the shape of different body segments with standard
geometric forms that are capable of simple mathemati-
cal description (64-68) or magnetic resonance imaging
(69,70). However, such techniques can involve high
radiation levels (computed tomography) and require
specialized, expensive instrumentation.
Future work should be aimed at obtaining inexpen-
sive, fast, noninvasive, individualized estimates of the
inertial properties of body segments based on direct
measurements. One possibility is a video-based system
(68). Error levels using this technique are on the order
of 5 percent. Another possibility is the use of high-
speed laser scanning. A 3-D laser scanner can obtain
digitized images of a subject’s limb in 10 seconds
(71,72). Markers placed near anatomic landmarks can
be used as reference points. These data can be used to
compute subject-specific body segment parameters.
Forward Dynamics
These biomechanical models of the musculoskel-
etal system have improved our understanding of the
complex processes underlying movement. Traditional
gait studies have typically been conducted to collect
experimental data and analyze movement and forces. In
the future, the forward dynamics model can be used
more extensively to study how the body actually
produces movement. The forward dynamics problem
provides the motion of a multibody system over a given
time period as a consequence of the applied forces and
given initial conditions. Solution of the forward dynam-
ics problem makes it possible to simulate and predict
the body segment’s motion. The resultant motion is a
result of the forces that produce it. Numerical computa-
tion of movements produced by applied forces can lead
to an improved understanding of the locomotor system.
Using models to synthesize gait can provide insight
into the relationship between muscle forces or joint
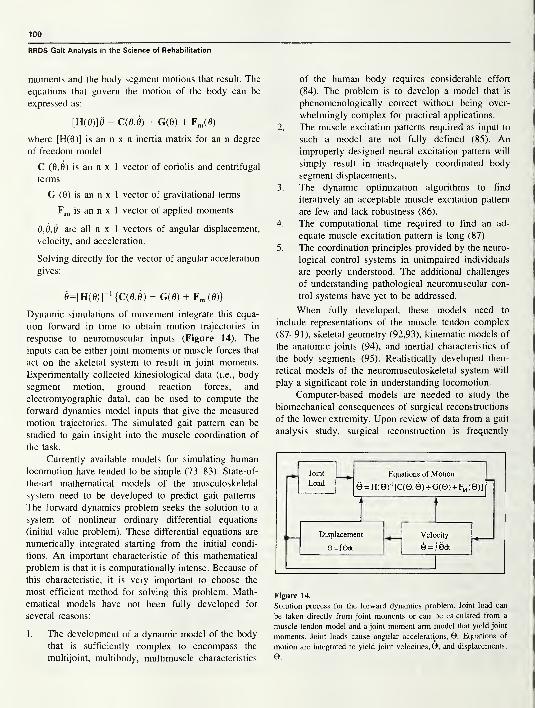
100
RRDS Gait Analysis in the Science of Rehabilitation
moments and the body segment motions that result. The
equations that govern the motion of the body can be
expressed as:
[H(0)]0 = C(0,0) + G(0) + Fm(0)
where [H(0)] is an n x n inertia matrix for an n degree
of freedom model
C (0,0) is an n x 1 vector of coriolis and centrifugal
terms
G (0) is an n x 1 vector of gravitational terms
Fm is an n x 1 vector of applied moments
6,0,6 are all n x 1 vectors of angular displacement,
velocity, and acceleration.
Solving directly for the vector of angular acceleration
gives:
0=[H(0)]“‘ {C(0,0) + G(0) + Fm (0)}
Dynamic simulations of movement integrate this equa-
tion forward in time to obtain motion trajectories in
response to neuromuscular inputs (Figure 14). The
inputs can be either joint moments or muscle forces that
act on the skeletal system to result in joint moments.
Experimentally collected kinesiological data (i.e., body
segment motion, ground reaction forces, and
electromyographic data), can be used to compute the
forward dynamics model inputs that give the measured
motion trajectories. The simulated gait pattern can be
studied to gain insight into the muscle coordination of
the task.
Currently available models for simulating human
locomotion have tended to be simple (73-83). State-of-
the-art mathematical models of the musculoskeletal
system need to be developed to predict gait patterns.
The forward dynamics problem seeks the solution to a
system of nonlinear ordinary differential equations
(initial value problem). These differential equations are
numerically integrated starting from the initial condi-
tions. An important characteristic of this mathematical
problem is that it is computationally intense. Because of
this characteristic, it is very important to choose the
most efficient method for solving this problem. Math-
ematical models have not been fully developed for
several reasons:
1
.
The development of a dynamic model of the body
that is sufficiently complex to encompass the
multijoint, multibody, multimuscle characteristics
of the human body requires considerable effort
(84). The problem is to develop a model that is
phenomenologically correct without being over-
whelmingly complex for practical applications.
2. The muscle excitation patterns required as input to
such a model are not fully defined (85). Animproperly designed neural excitation pattern will
simply result in inadequately coordinated body
segment displacements.
3. The dynamic optimization algorithms to find
iteratively an acceptable muscle excitation pattern
are few and lack robustness (86).
4. The computational time required to find an ad-
equate muscle excitation pattern is long (87).
5. The coordination principles provided by the neuro-
logical control systems in unimpaired individuals
are poorly understood. The additional challenges
of understanding pathological neuromuscular con-
trol systems have yet to be addressed.
When fully developed, these models need to
include representations of the muscle tendon complex
(87-91), skeletal geometry (92,93), kinematic models of
the anatomic joints (94), and inertial characteristics of
the body segments (95). Realistically developed theo-
retical models of the neuromusculoskeletal system will
play a significant role in understanding locomotion.
Computer-based models are needed to study the
biomechanical consequences of surgical reconstructions
of the lower extremity. Upon review of data from a gait
analysis study, surgical reconstruction is frequently
Figure 14.
Solution process for the forward dynamics problem. Joint load can
be taken directly from joint moments or can be calculated from a
muscle-tendon model and a joint moment arm model that yield joint
moments. Joint loads cause angular accelerations, 0. Equations of
motion are integrated to yield joint velocities,©, and displacements,
e.
101
Section Four: Future Directions
recommended. Sometimes the reconstructive procedure
compromises the capacity of muscles to generate forces
and moments about the joints. Computer models are
needed to predict the anticipated effects that surgical
alterations to the musculoskeletal system will have on a
person’s gait pattern. Relatively few researchers have
developed computerized musculoskeletal models to plan
orthopedic reconstructive surgeries for correcting patho-
logical gait. Johnson et al. (95) developed a computer
model of the hip to evaluate effects of surgical
alterations. Dul et al. (96) developed a biomechanical
computer model to simulate tendon transfer surgeries to
correct equinovarus. Lindgren and Seireg (97) studied
the effects of mediolateral deformity, tibial torsion, and
different centers of foot support during gait in persons
with varus deformity of the knee. Delp et al. (93)
developed a graphical model of the lower limb to
visualize the musculoskeletal geometry and manipulate
model parameters to study the biomechanical conse-
quences of orthopedic surgical procedures. Mann (98)
developed a surgical simulation model to determine the
effect of skeletal system alterations on subjects’ specific
gait patterns. Typically these surgical models compute
static changes to isometric conditions but do not extend
to dynamic movements such as gait. Future work is
required to enhance these models.
Future models should include the 3-D characteris-
tics of the musculoskeletal geometry, as well as
subjects’ specific parameters. The musculo-tendinous
aspects of the model need to be scaled to the individual
being studied. The numerical ability to predict ambula-
tion following changes to the musculoskeletal system is
imminently feasible. However, it has not currently been
implemented.
INTERPRETATION OF GAIT STUDIES
Despite the growing availability of technology, gait
analysis has not yet become a common tool for the
physician. Gait laboratories have been started when
individuals and institutions were willing to make the
investment in time, effort, and money to assemble and
operate gait laboratory systems. Gait laboratories have
flourished when a combination of physician input and
referral was coupled with day-to-day expertise in the
form of physical therapists or other health care special-
ists and with technical expertise in the form of
engineers and other technical staff (99). Several com-
mercial gait systems are on the market. Increasing
interest in gait analysis is emerging. Sixty-eight percent
of the clinical gait analysis laboratories in the United
States have been developed in the last 10 years (100).
This trend demonstrates that gait laboratories are
becoming recognized as an important clinical tool in the
assessment of gait abnormalities.
When new gait laboratories are started, they
frequently make a sizable investment in equipment.
Nevertheless, instrumentation alone cannot make gait
analysis clinically relevant. Clinical gait analysis in-
cludes the correlation and interpretation of the data.
Taking care of patients in a gait laboratory requires
turning data into information. The problem-solving
process requires questioning the patient; performing a
physical examination; obtaining kinematic, kinetic, and
electromyographic data; and linking the symptoms
(complaints), signs (physical exam), and test results
(gait data) to obtain a treatment plan (Figure 5). In this
process, it is important to distinguish between functional
deficits that contribute to the individual’s problem and
compensations that the patient adopts in an attempt to
walk more normally. The future of gait analysis lies in
the ability to process data quickly and identify the
patient’s functional deficits. Classification methods are
needed to characterize a person’s gait and direct the
clinician reading the gait study to the movement
abnormalities. The ability to develop computerized
classification techniques will make gait analysis acces-
sible to a wider audience with limited experience. The
initial step is to develop standards for collection,
reduction, and reporting of clinical gait data.
STANDARDIZATION OF GAIT ANALYSISTECHNIQUES
Standardization of gait analysis techniques must be
established so that data can be shared between laborato-
ries for expert consultation. Several national organiza-
tions are undertaking these endeavors. Standardized
techniques are being defined for appropriate studies in
various clinical settings. Measurement of normal and
pathological movement for the purpose of providing
recommendations for therapeutic treatment has been
successfully achieved by practitioners and laboratories.
However, approaches to data collection, reduction,
presentation, and interpretation have varied considerably
because of differences in equipment, facilities, person-
102
RRDS Gait Analysis in the Science of Rehabilitation
nel, and philosophy. The result is clusters of methodol-
ogy without specific guidelines for comparison and
communication.
The North American Society for Gait and Clinical
Movement Analysis recognizes the need to facilitate
communication and encourage the interchange of infor-
mation among the many professionals who assess the
problems of human movement. As a means for reducing
confusion, this society has established a Standards
Committee to define standards that can be adopted to
achieve uniformity in clinical movement analysis. The
Standards Committee was formed to achieve standard-
ization of
1. nomenclature use in the collection, reduction, and
presentation of data
2. approaches and techniques for data acquisition and
reduction
3. quality assurance techniques
4. the form for presentation of results
5. methods for interpretation and reporting clinical
findings
6. a format for sharing data between laboratories.
The Standards Committee intends to make contact
with and work in concert with any and all parallel
bodies that may exist in other specialty societies.
Accreditation is needed to assure quality and
achieve continuous improvement of clinical gait and
movement analysis. Accreditation attempts to assure
that laboratories provide patient care that is effective in
contemporary practice. Accreditation will publicly rec-
ognize those laboratories demonstrating a higher level
of performance, integrity, and quality, which entitles
them to complete confidence of the movement analysis
profession. Accreditation efforts are occurring at two
levels in North America.
The North American Society of Gait and Clinical
Movement Analysis has established an Accreditation
and Guidelines Committee. The Accreditation and
Guidelines Committee will
1 . serve as a liaison to nationally recognized accredi-
tation boards pertaining to gait and clinical move-
ment analysis
2. develop and recommend criteria for accreditation
that may be used to evaluate the quality of patient
care provided by laboratories involved in gait and
movement analysis
3. bring together practitioners, evaluators, and admin-
istrators in an activity directed toward the continu-
ous development and improvement in the quality
of clinical movement analysis throughout North
America
4.
establish a process for continuous self-study and
improvement of movement analysis professionals
and laboratories.
The Commission for Motion Laboratory Accredita-
tion has been formed as a non-profit organization. It
was developed to enhance the clinical care of persons
with disorders of human motion. These goals will be
achieved by
1. developing measurement standards to improve the
utilization of gait and human motion laboratories
for clinical diagnostic purposes
2. evaluating and requiring human motion laborato-
ries to meet a set of standard criteria that will
include clinical indication, measurement precision,
measurement accuracy, and uniformity of termi-
nology.
The Commission contains representatives from the
American Academy of Cerebral Palsy and Develop-
mental Medicine, Pediatric Orthopedic Society of North
America, American Society of Biomechanics, Ameri-
can Academy of Orthopedic Surgery, American Acad-
emy of Physical Medicine and Rehabilitation, North
American Society of Gait and Clinical Move-
ment Analysis, American Orthopedic Foot and Ankle
Society, and the American Physical Therapy Associa-
tion. The Commission will start to accredit laboratories
in 1998.
Similar efforts are underway in Europe. The
Computer-Aided Movement Analysis in a Rehabilita-
tion Context (CAMARC) project is being undertaken
under the Advanced Informatics in Medicine Action of
the Commission of the European Communities with
academic, industrial, public health, and independent
partners from Italy, France, the United Kingdom, and
The Netherlands.
The aims of the project are the
1. assessment of existing biomedical knowledge of
movement analysis
2. standardization of test protocols
3. assessment and implementation of relevant digital
signal processing algorithms
4. analysis of marketing potential of new instrumen-
tation
5. development of design criteria for new devices.
103
Section Four: Future Directions
It is the hope of this group to develop standards in the
appropriate interface between the instrumentation and
a suitable neuromusculoskeletal model. Accommoda-
tion of movement data and an appropriate model of
human movement are expected to provide meaning-
ful information for assessment of unimpaired and
pathological movement for diagnosis, treatment plan-
ning, pre- and post-treatment comparison, and long-term
follow-up.
CLASSIFICATION TECHNIQUES
One of the main obstacles to automated gait
analysis is the difficulty of distinguishing between
normal and abnormal movements. A person’s gait is
classified as abnormal when the person’s gait param-
eters deviate excessively from normal. The clinical
application of gait analysis is aimed at identifying these
inappropriate deviations. In its simplest form, the
problem of classifying gait disorders is a problem of
mapping a multivariate temporal pattern to the most
likely known disorder. Robust analysis of these data
requires consideration of interactions among a large
number of highly coupled variables, and the time
dependence of these variables. Two approaches have
been utilized: statistical techniques and artificial intelli-
gence techniques.
Statistical Techniques
Several statistical techniques have been applied to
the analysis of gait data. These include the “bootstrap”
method (99,101), the linear discriminant method (102—
104), principal component analysis (105), and cluster
analysis (106). The bootstrap technique (107) was used
to establish boundaries about the mean curve for
unimpaired subjects (controls) to mark the limits of
normal variability (99,101). These boundaries were
designated as prediction regions. This technique was
undertaken after initial attempts at setting boundaries
for the variability within normal subjects using en-
semble averages of one or two standard deviations
failed. Kelly and Biden (108) compared the results of
classification of knee motion by ensemble averaging
versus bootstrapping. The motion curves of 39 unim-
paired 5-year-old children were classified using both
techniques. The ensemble-averaging method utilizing
±2 standard deviations misclassified 16 of 39 normal
subjects as abnormal. In contrast, the bootstrapping
method classified all subjects as “normal.” Bootstrap
estimates of the prediction regions are of the form:
Fh (0) - mo-, (0) < Fh (0) < Fh (0) + morf (0)
where Fh (0) = the latest squares estimate of the sub-
ject’s sum of harmonic coefficients
<rf (0) = the standard deviation of the harmonics,
and
m = a positive number.
This technique has been applied clinically and has been
shown to have a high sensitivity (109).
Methods of discriminant analysis have been shown
to be effective in recognizing gait patterns of sound
subjects and persons with gait deviation following total
knee replacement surgery with a classification error rate
of about 2 percent (102). This technique has also been
used to develop knee and hip performance indices with
well-demonstrated utility (103,104).
Principal component analysis and cluster analysis
techniques have been used as a stepwise pattern-
recognition approach to identify patterns of gait devia-
tions. Principal component analysis is used to reduce
the enormous quantity of data obtained in a gait study to
a parsimonious set of features that describes gait
patterns accurately (105) and results in a reduction in
dimensionality of the original set of waveforms. Indi-
vidual waveforms can be reconstructed using a linear
combination of basis vectors modulated by weighting
coefficients. Numerical representation using principal
component analysis is important for two reasons (105):
first, it is a parsimonious representation of cyclic
subgroups within a larger patient population, and
second, it may be very useful in identifying and
classifying homogeneous subgroups within a larger
patient population. Cluster analysis is used to place
objects into groups or clusters suggested by the data, not
defined a priori. Subjects in a given cluster tend to be
similar to each other in some sense and subjects in
different clusters tend to be dissimilar. These techniques
have been used for classifying unimpaired subjects
(110), persons with spastic paralysis (111), and persons
with anterior cruciate ligament (ACL) deficiency (112).
Methods based on statistical analysis will continue
to play a role in the processing of gait data. The
strengths of statistical methods are that they provide a
mathematical foundation for the analysis, accept experi-
mental noise in the measurements, and offer robust
time-series analysis. The weaknesses of statistical meth-
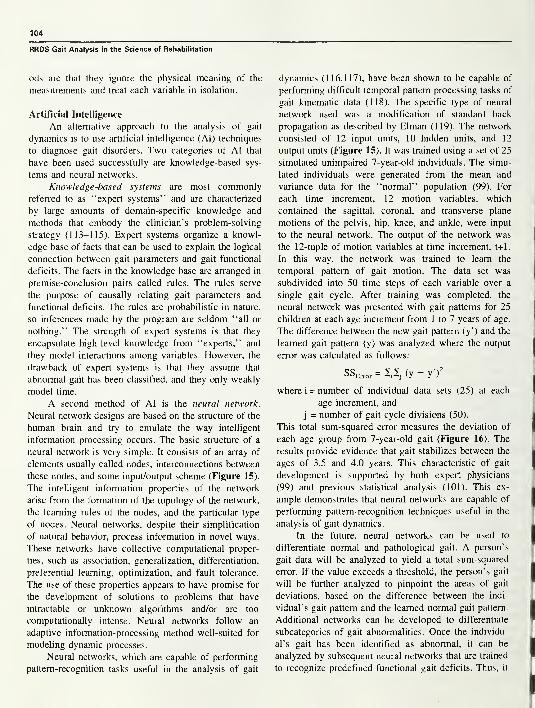
104
RRDS Gait Analysis in the Science of Rehabilitation
ods are that they ignore the physical meaning of the
measurements and treat each variable in isolation.
Artificial Intelligence
An alternative approach to the analysis of gait
dynamics is to use artificial intelligence (AI) techniques
to diagnose gait disorders. Two categories of AI that
have been used successfully are knowledge-based sys-
tems and neural networks.
Knowledge-based systems are most commonly
referred to as “expert systems” and are characterized
by large amounts of domain-specific knowledge and
methods that embody the clinician’s problem-solving
strategy (113-115). Expert systems organize a knowl-
edge base of facts that can be used to explain the logical
connection between gait parameters and gait functional
deficits. The facts in the knowledge base are arranged in
premise-conclusion pairs called rules. The rules serve
the purpose of causally relating gait parameters and
functional deficits. The rules are probabilistic in nature,
so inferences made by the program are seldom “all or
nothing.” The strength of expert systems is that they
encapsulate high-level knowledge from “experts,” and
they model interactions among variables. However, the
drawback of expert systems is that they assume that
abnormal gait has been classified, and they only weakly
model time.
A second method of AI is the neural network.
Neural network designs are based on the structure of the
human brain and try to emulate the way intelligent
information processing occurs. The basic structure of a
neural network is very simple. It consists of an array of
elements usually called nodes, interconnections between
these nodes, and some input/output scheme (Figure 15).
The intelligent information properties of the network
arise from the formation of the topology of the network,
the learning rules of the nodes, and the particular type
of nodes. Neural networks, despite their simplification
of natural behavior, process information in novel ways.
These networks have collective computational proper-
ties, such as association, generalization, differentiation,
preferential learning, optimization, and fault tolerance.
The use of these properties appears to have promise for
the development of solutions to problems that have
intractable or unknown algorithms and/or are too
computationally intense. Neural networks follow an
adaptive information-processing method well-suited for
modeling dynamic processes.
Neural networks, which are capable of performing
pattern-recognition tasks useful in the analysis of gait
dynamics (116,117), have been shown to be capable of
performing difficult temporal pattern processing tasks of
gait kinematic data (118). The specific type of neural
network used was a modification of standard back
propagation as described by Elman (119). The network
consisted of 12 input units, 10 hidden units, and 12
output units (Figure 15). It was trained using a set of 25
simulated unimpaired 7-year-old individuals. The simu-
lated individuals were generated from the mean and
variance data for the “normal” population (99). For
each time increment, 12 motion variables, which
contained the sagittal, coronal, and transverse plane
motions of the pelvis, hip, knee, and ankle, were input
to the neural network. The output of the network was
the 12-tuple of motion variables at time increment, t+1.
In this way, the network was trained to learn the
temporal pattern of gait motion. The data set was
subdivided into 50 time steps of each variable over a
single gait cycle. After training was completed, the
neural network was presented with gait patterns for 25
children at each age increment from 1 to 7 years of age.
The difference between the new gait pattern (y') and the
learned gait pattern (y) was analyzed where the output
error was calculated as follows:
SS Error = (y - y'f
where i = number of individual data sets (25) at each
age increment, and
j= number of gait cycle divisions (50).
This total sum-squared error measures the deviation of
each age group from 7-year-old gait (Figure 16). The
results provide evidence that gait stabilizes between the
ages of 3.5 and 4.0 years. This characteristic of gait
development is supported by both expert physicians
(99) and previous statistical analysis (101). This ex-
ample demonstrates that neural networks are capable of
performing pattern-recognition techniques useful in the
analysis of gait dynamics.
In the future, neural networks can be used to
differentiate normal and pathological gait. A person’s
gait data will be analyzed to yield a total sum-squared
error. If the value exceeds a threshold, the person’s gait
will be further analyzed to pinpoint the areas of gait
deviations, based on the difference between the indi-
vidual’s gait pattern and the learned normal gait pattern.
Additional networks can be developed to differentiate
subcategories of gait abnormalities. Once the individu-
al’s gait has been identified as abnormal, it can be
analyzed by subsequent neural networks that are trained
to recognize predefined functional gait deficits. Thus, it
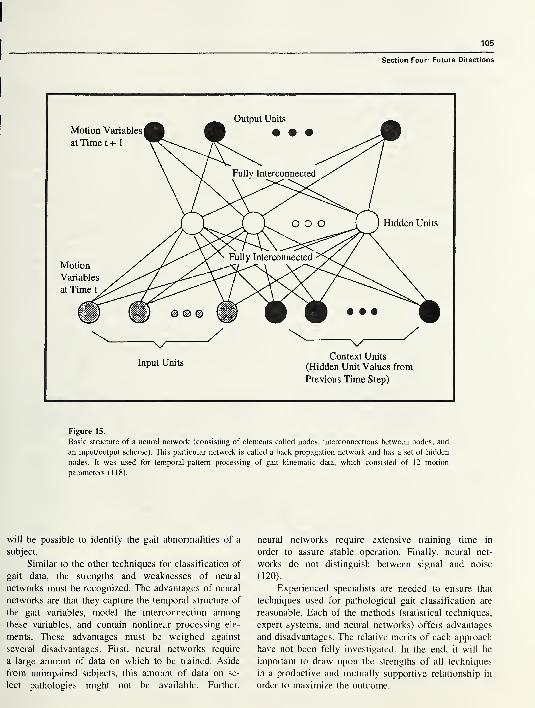
105
Section Four: Future Directions
Figure 15.
Basic structure of a neural network (consisting of elements called nodes, interconnections between nodes, and
an input/output scheme). This particular network is called a back propagation network and has a set of hidden
nodes. It was used for temporal-pattern processing of gait kinematic data, which consisted of 12 motion
parameters (118).
will be possible to identify the gait abnormalities of a
subject.
Similar to the other techniques for classification of
gait data, the strengths and weaknesses of neural
networks must be recognized. The advantages of neural
networks are that they capture the temporal structure of
the gait variables, model the interconnection among
these variables, and contain nonlinear processing ele-
ments. These advantages must be weighed against
several disadvantages. First, neural networks require
a large amount of data on which to be trained. Aside
from unimpaired subjects, this amount of data on se-
lect pathologies might not be available. Further,
neural networks require extensive training time in
order to assure stable operation. Finally, neural net-
works do not distinguish between signal and noise
(120).
Experienced specialists are needed to ensure that
techniques used for pathological gait classification are
reasonable. Each of the methods (statistical techniques,
expert systems, and neural networks) offers advantages
and disadvantages. The relative merits of each approach
have not been fully investigated. In the end, it will be
important to draw upon the strengths of all techniques
in a productive and mutually supportive relationship in
order to maximize the outcome.

106
RRDS Gait Analysis in the Science of Rehabilitation
TELECOMMUNICATION
Distributed data and computing resources need to
be incorporated in the scientific computing environment
of every motion analysis laboratory. Users must be able
to gain transparent access to data and computing
resources located anywhere in the world. Clinicians and
researchers scattered around the globe should be con-
nected via a network. Individuals operating computer
software environments residing on their desktops should
be able to communicate with leading centers in gait
analysis.
Once standards have been established, it will be
possible to share information among medical centers in
order to obtain additional expert opinions on difficult
cases. Currently, efforts are being made to create a
national information infrastructure—the so-called elec-
tronic superhighway. This electronic network will carry
voice, data, and video in digital form. At present, an
electronic network, the Internet, already exists. The
Internet was established in 1969 as an experimental
computer network organized and financed by the
Department of Defense and the National Science
Foundation. The network was created to facilitate the
research of a small number of scientists, engineers, and
researchers. No commercial usage was permitted at
first. Over time, the number of users of the Internet has
increased. Currently, it is estimated that there are over
15 million users (121). Most of these users are in the
United States but there are users in 134 other countries
as well (121). The number of commercial users is also
increasing. In early 1993, more than half of the
registered networks were private businesses (121).
A nationwide communication system can be used
in health care. High-performance computing and net-
working can be used to speed development of gait
interpretation techniques, facilitate diagnoses from re-
mote locations, and achieve enormous improvements in
efficiency by aiding multicenter studies on treatment
techniques. Major medical centers are obtaining state-
of-the-art telecommunication capabilities (122); this
includes the transmission of data, audio, and visual
information. Telecommunication networks have madepeople throughout the world accessible within a matter
of minutes or hours. It is no longer necessary for
collaborators to be near one another. Current telecom-
munication systems provide two-way video and two-
way audio. The image must be high-resolution and
obtained in real time so that medical examinations can
be performed. This connection will enable the transmis-
35 •
Age (years)
Figure 16.
Deviations of age group kinematic data from normal 7-year-old gait.
Deviations expressed as a sum-squared error. Differences determined
using a back propagation neural network. Results provide evidence
that gait kinematics stabilize between 3.5 and 4.0 years of age (118).
sion of information over high-bandwidth networks for
immediate physician-physician consultation on particu-
lar cases. The security of all transmissions must be
assured by scrambling the signal to maintain the
confidentiality of all patient information.
In the years ahead, fiber-optic transmission and
high-definition television will be among the advance-
ments that will strengthen the interchange of informa-
tion. Telecommunication will also enable the sharing of
digital data with large bandwidth requirements for
research purposes. The ability to share information will
facilitate the development of databases that will enable
clinicians to obtain knowledge for the treatment of
specific gait disorders.
A national database for motion analysis data must
be created. This national data repository can be used to
pool gait assessments from participating centers
throughout the United States. The database system
should be based upon commercially available database
software that can be used to maintain the data re-
pository. Interaction with the database from participat-
ing centers would be through a web interface. The trans-
mission of data would be protected through the secure
sockets layer (SSL) protocol. This provides both en-
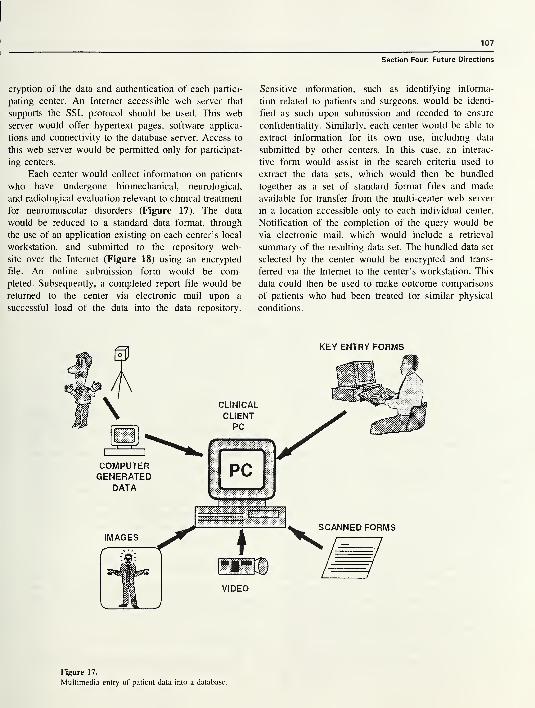
107
Section Four: Future Directions
cryption of the data and authentication of each partici-
pating center. An Internet accessible web server that
supports the SSL protocol should be used. This web
server would offer hypertext pages, software applica-
tions and connectivity to the database server. Access to
this web server would be permitted only for participat-
ing centers.
Each center would collect information on patients
who have undergone biomechanical, neurological,
and radiological evaluation relevant to clinical treatment
for neuromuscular disorders (Figure 17). The data
would be reduced to a standard data format, through
the use of an application existing on each center’s local
workstation, and submitted to the repository web-
site over the Internet (Figure 18) using an encrypted
file. An online submission form would be com-
pleted. Subsequently, a completed report file would be
returned to the center via electronic mail upon a
successful load of the data into the data repository.
Sensitive information, such as identifying informa-
tion related to patients and surgeons, would be identi-
fied as such upon submission and recoded to ensure
confidentiality. Similarly, each center would be able to
extract information for its own use, including data
submitted by other centers. In this case, an interac-
tive form would assist in the search criteria used to
extract the data sets, which would then be bundled
together as a set of standard format files and made
available for transfer from the multi-center web server
in a location accessible only to each individual center.
Notification of the completion of the query would be
via electronic mail, which would include a retrieval
summary of the resulting data set. The bundled data set
selected by the center would be encrypted and trans-
ferred via the Internet to the center’s workstation. This
data could then be used to make outcome comparisons
of patients who had been treated for similar physical
conditions.
KEY ENTRY FORMS
Figure 17.
Multimedia entry of patient data into a database.
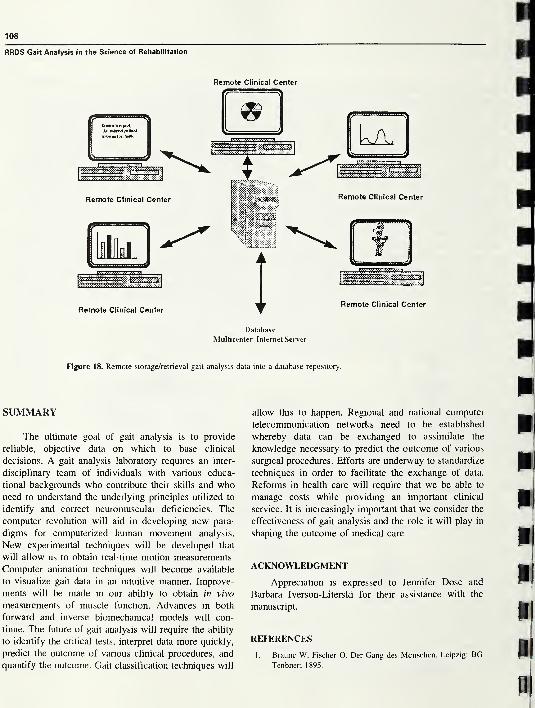
108
RRDS Gait Analysis in the Science of Rehabilitation
Remote Clinical Center
Figure 18. Remote storage/retrieval gait analysis data into a database repository.
SUMMARY
The ultimate goal of gait analysis is to provide
reliable, objective data on which to base clinical
decisions. A gait analysis laboratory requires an inter-
disciplinary team of individuals with various educa-
tional backgrounds who contribute their skills and whoneed to understand the underlying principles utilized to
identify and correct neuromuscular deficiencies. The
computer revolution will aid in developing new para-
digms for computerized human movement analysis.
New experimental techniques will be developed that
will allow us to obtain real-time motion measurements.
Computer animation techniques will become available
to visualize gait data in an intuitive manner. Improve-
ments will be made in our ability to obtain in vivo
measurements of muscle function. Advances in both
forward and inverse biomechanical models will con-
tinue. The future of gait analysis will require the ability
to identify the critical tests, interpret data more quickly,
predict the outcome of various clinical procedures, and
quantify the outcome. Gait classification techniques will
allow this to happen. Regional and national computer
telecommunication networks need to be established
whereby data can be exchanged to assimilate the
knowledge necessary to predict the outcome of various
surgical procedures. Efforts are underway to standardize
techniques in order to facilitate the exchange of data.
Reforms in health care will require that we be able to
manage costs while providing an important clinical
service. It is increasingly important that we consider the
effectiveness of gait analysis and the role it will play in
shaping the outcome of medical care.
ACKNOWLEDGMENT
Appreciation is expressed to Jennifer Dose and
Barbara Iverson-Literski for their assistance with the
manuscript.
REFERENCES
1. Braune W, Fischer O. Der Gang des Menschen. Leipzig: BGTenbner; 1895.
109
Section Four: Future Directions
>. National Center for Health Statistics. Health, United States,
1995. Hyattsville, MD: Public Health Service; 1996.
!. Lamm, RD. The ghost of health care future. Inquiry
3 1 (4):365-367, winter 1994/1995.
1. Gade C. Strategic Planning: Mayo faces changing times with
an unchanged focus: the patient. Mayo Alumni 1993;
29(2):4— 13.
5. Managed care raises quality and lowers hospital costs.
Managed Care. Thousand Oaks, CA: Cauman Publications;
August/September 1995. p.3.
». National Center for Health Statistics. Health, United States,
1994. Hyattsville, MD: Public Health Service; 1995.
'. Group Health Association of America. HMO industry profile.
Health Care Advisory Board analysis. 1994.
!. DeLuca PA, Ounpuu S, Rose SA, Sirkin R. Alterations in
cerebral palsy surgical decision-making based on three-
dimensional gait analysis. Dev Med Child Neurol 1993;35(9)
suppl 69:9.
'. Nene AV, Evans GA, Patrick JH. Simultaneous multiple
operations for spastic diplegia. J Bone Joint Surg Br 1993;
75-B(3):488-94.
L Robinson L. Encyclopedia Americana 7:473. Danbury, CT:
Grolier; 1988.
Murray MP, Drought AB, Kory RC. Walking patterns of
normal men. J Bone Joint Surg 1964;46A:335-60.
Sutherland DH, Hagy JL. Measurement of gait movements
from motion picture films. J Bone Joint Surg 1972;54A:787.
Chao E-YS. Justification of triaxal goniometry for the
measurement of joint rotation. J Biomech 1980;15:989-1006.
Lamoreux LA. Kinematic measurements in the study of
human walking. Bull Prosthet Res 1 97 1 ;3 : 1 0- 1 5 : 3—84.
Winter DA, Sidwall HG, Hobson DA. Television-computer
analysis of kinematics of human gait. Comp Biomed Res
1972;5:498-504.
Cappozzo A. Gait analysis methodology. Hum Mov Sci
1984;3:27-50.
Antonsson EK, Mann RW. Automatic 3-D gait analysis using
a Selspot centered system. Advances in bioengineering. NewYork: American Society of Mechanical Engineers; 1979. p.
51.
Andriacchi TP, Hampton SJ, Schultz AB, Gelante JO.
Three-dimensional coordinate data processing in human
motion analysis. J Biomech Eng 1979;101:279-83.
Elgie H. What is Scientific Visualization? Sci Comput Auto
March, 1993;34-5.
Morris T, Larson G, Donath M. Real time animation of
human walking for the evaluation of pathological gait.
Proceedings of the 9th Annual RESNA Conference, Minne-
apolis, MN. 1 986;233—5.
Tufte ER. The visual display of quantitative information.
Cheshire, CT: Graphics Press; 1983.
Perry J, Waters RL, Perrin T. Electromyographic analysis of
equinovarus following stroke. Clin Orthop 1978;131:47-53.
Sutherland DH, Cooper L, Daniel D. The role of the ankle
plantar flexors in normal walking. J Bone Joint Surg Am1980;62A:354-63.
Waters RL, Frazier J, Garland DE. Electromyographic gait
analysis before and after operative treatment for hemiplegic
equinus and equinovarus deformity. J Bone Joint Surg Am1982;64A:284-8.
25. Blix M. Die langrund die spennung des muskels. Skand Arch
Physiol 1894;5:149-206.
26. Cavanagh PR, Komi PU. Electromechanical delay in human
skeletal muscle under concentric and eccentric contractions.
Europ J Appl Physiol 1979;42:159-63.
27. Long C. Normal and abnormal motor control in the upper
extremities (thesis). Cleveland, OH: Case Western Reserve
University; 1970. p. 8.
28. Ralston HJ, Todd FN, Inman VT. Comparison of electrical
activity and duration of tension in the human rectus femoris
muscle. Electro Clin Neurophys 1976;16:277-86.
29. Norman RW, Komi PV. Electromechanical delay in skeletal
muscle under normal movement conditions. Acta Physiol
Scand 1979;106:241-8.
30. Vos EJ, Mullender MG, van Ingen Schenau GJ. Electrome-
chanical delay in the vastus lateralis muscle during dynamic
isometric contraction. Europ J Appl Physiol 1990;60:467-71.
31. Hill AV. The pressure developed in muscle during contrac-
tion. J Physiol 1948;107:518-26.
32. Kirkebo A, Wisnes A. Variation in tissure fluid pressure in rat
calf muscle during sustained contraction on stretch. Acta
Physiol Scand 1982;114:551-6.
33. Sutherland DH, Woo SLY, Schoon J, Jemmott G, Akeson
WH. The potential application of a small solid state pressure
transducer to measure muscle activity during gait. Trans
Orthop Res Soc 1977;2:289.
34. Hargans AR, Sejersted OM, Kardel KR, Bloom P, Harmansen
L. Intramuscular fluid pressure: a function of contraction force
and tissue depth. Trans Orthop Res Soc 1982;7:371.
35. Mubarak S, Hargans A, Owen C, Garetto L, Akeson W. The
Wick catheter technique for measurement of intramuscular
pressure. J Bone Joint Surg Am 1976;58A: 101 1—9.
36. Owen CA, Garetto LP, Hargens AR, Schmidt DA, Mubarak
SJ, Akeson WH. Relationship of intramuscular pressure to
strengthen muscular contraction. Trans Orthop Res Soc
1977;2:246.
37. Parker PA, Komer L, Kadefors R. Estimation of muscle force
from intramuscular total pressure. Med Bio Eng Comp1984;22:453-7.
38. Komer L, Parker P, Almstrom C, et al. Relationship of
intramuscular pressure to the force output and myoeclectric
signal of skeletal muscle. J Orthop Res 1984;2:289-96.
39. Jarvholm U, Palmerud G, Karlsson D, Herbertz P, Kadefors
R. Intramuscular pressure and electromyography in four
shoulder muscles. J Orthop Res 1991;9:609-19.
40. Garfin SR, Tipton CM, Mubarak SJ, Woo SLY, Hargens AR,
Akeson WH. Role of fascia in maintenance of muscle tension
and pressure. J Appl Physiol 1981;51:317-20.
41. Baumann JU, Sutherland DH, Hanggi A. Intramuscular
pressure during walking: an experimental study using the
Wick catheter technique. Clin Orthop 1979;145:292-9.
42. Kaufman KR, Sutherland DH. Dynamic intramuscular pres-
sure measurement during gait. Oper Tech Sports Med 1995;
3(4):250-5.
43. Davis RB, Ounpuu S, Tyburski D, Gage JR. A gait analysis
data collection and reduction technique. Hum Mov Sci
1 99 1 ; 1 0(5):575—87.
110
RRDS Gait Analysis in the Science of Rehabilitation
44. Kadaba MP, Ramakrishnan HK, Wootten ME. Measurement
of lower extremity kinematics during level walking. J Orthop
Res 1990;8:383-92.
45. Apkarian J, Naumann S, Cairns B. A three-dimensional
kinematic and dynamic model of the lower limb. J Biomech
1 989;22(2): 1 43—55.
46. Cappozzo A, Leo T, Pedotti A. A general computational
method for the analysis of human locomotion. J Biomech
1975;8:307-20.
47. Kaufman KR, An KN, Chao EYS. A dynamic mathematical
model of the knee joint applied to isokinetic exercise. In: 63.
Spilker RL, Simon BR, editors. Computational methods in
bioengineering. New York, NY: ASME: Biomechanical
Engineering Division; 1988:9. p. 157-67. 64.
48. Chao EYS. Justification of tri-axial goniometer for the
measurement of joint rotation. J Biomech 1980;13:989-1006.
49. Grood ES, Suntay WJ. A joint coordinate system for the 65.
clinical description of three-dimensional motions: application
to the knee. J Biomech Eng 1983;105:136-44.
50. Kinzel GL, Hall AS, Hillberry BM. Measurement of the total 66.
motion between two body segments: Part I— analytic
development. J Biomech 1972;5:93-105. 67.
51. Spoor CW, Veldpaus FE. Rigid-body motion calculated from
spatial coordinates of markers. J Biomech 1980;13:391-3.
52. Woltring HJ, Huiskes R, DeLange A, Veldpaus FE. Finite 68.
centroid and helical-axis estimation from noisy landmark
measurements in the study of human joint kinematics. J
Biomech 1 985; 1 8(5):379-89. 69.
53. Woltring HJ. Analytical body-segment photogrammetry. In:
Leo T, editor. Models, connection with experimental appara-
tus and relevant DSP techniques for functional movement 70.
analysis. Ancona, Italy: Dipartimento di Electronica ed
Automatica, Universita di Ancona; 1990.
54. Chao EYS. Determination of applied forces in linking systems 71.
with known displacements: with special application to
biomechanics (dissertation). Iowa City: University of Iowa; 72.
1971.
55. Robertson DGE, Winter DA. Mechanical energy generation, 73.
absorption and transfer amongst segments during walking. J
Biomech 1980;13:845-54. 74.
56. Cappozzo A, Berme N. Subject-specific segmental inertia
parameter determination—a survey of current methods. In:
Berme N and Cappozzo A, editors. Biomechanics of human 75.
movement: applications in Rehabilitation, sports and ergo-
nomics. Worthington, OH: Bertec Corp;1990. p. 179-85. 76.
57. Dempster WT. Space requirements of the seated operator.
WADC Technical Report 55-159. Wright-Patterson AFB; OH: 77.
AERO Medical Laboratory; 1955.
58. Clauser CE, McConville JT, Young JW. Weight, volume, and
center of mass of segments of the human body. AMRL-TR- 78.
69-70 (AD 710 622). Wright-Patterson AFB, OH: Aerospace
Medical Research Laboratory; 1969. 79.
59. Chandler RF, Clauser CE, McConville JR, Reynolds HM,Young JW. Investigation of inertial properties of the human
body. DOT HS-801. Washington, DC: National Highway 80.
Traffic Safety Administration; 1975. p. 430.
60. Drillis RJ, Contini R. Body segment parameters. Technical
Report No. 1 166.03 School of Engineering and Science, New 81.
York University; 1966.
61. McConville JT, Churchill TD, Calepis I, Clauser CE, Cuzzi J.
Anthropometric relationships of body and body segment
moments of inertia. Technical Report No. AFAMRL-TR-80-
119. Wright-Patterson AFB; OH: Aerospace Medical Re-
search Laboratory; 1980.
62. Young JW, Chandler RF, Snow CC, Robinette KM, Zehner
GF, Lofber MS. Anthropometric and mass distribution
characteristics of the adult female. Technical Report No.
FAA-AM-83-16. Oklahoma City, OK: FAA Civil Aeromedi-
cal Institute; 1983.
Yeadon RM, Morlock M. The appropriate use of regression
equations for the estimation of segmental inertial parameters.
J Biomech 1989;22:683-9.
Hanavan EP. A mathematical model for the human body,
Report No. AMRL-TR- 102. Wright-Patterson AFB; OH:
Aerospace Medical Research Laboratory; 1964.
Jensen RK. Estimation of the biomechanical properties of
three body types using a photometric method. J Biomech
1978;11:349-58.
Jensen RK. Body segment mass, radius, and radius of
gyration proportions of children. J Biomech 1986;19:359-68.
Hatze, HA. A mathematical model for the computational
determination of parameter values of anthropometric seg-
ments. J Biomech 1980;13:833-43.
Sarfaty O, Ladin Z. A video-based system for the estimation
of the inertial properties of body segments J Biomech
1993;26(8): 101 1-6.
Martin PE, Mungiole M, Marzke MW, Longhill LM. The use
of magnetic resonance imaging for measuring segment inertial
properties. J Biomech 1989;22:367-76.
Mungiole M, Martin PE. Estimating segment inertial proper-
ties: comparison of magnetic resonance imaging with existing
methods. J Biomech 1990;23: 1039^16.
Ashley S. Rapid prototyping for artificial body parts. Mech
Eng 1 983;50—3.
McMillan T. 3-D digitizing. Computer Graphics World
January; 1989.
Chow CK, Jacobson DH. Studies of human locomotion via
optimal programming. Math Biosci 1971;10:239-306.
Chow CK, Jacobson DH. Further studies of human locomo-
tion: postural stability and control. Math Biosci 1972;15:93-
108.
Townsend MA, Seireg A. The synthesis of bipedal locomo-
tion. J Biomech 1972;5:71-83.
Mochon S, McMahon TA. Ballistic walking: an improved
model. Math Biosci 1980;52:241-60.
Onyshko S, Winter DA. A mathematical model for
the dynamics of human locomotion. J Biomech 1980;
13:361-8.
Hatze HA. Quantitative analysis, synthesis and optimization
of human motion. Hum Mov Sci 1984;3:5-25.
Marshall RN, Jensen RK. A general Newtonian simulation of
an N-segment open chain model. J Biomech 1 985; 1 8(5):359—
67.
Nagurka ML. Theoretical approach for optimal motion
generation of a bipedal locomotion model. Advances in
Bioengineering, New York, NY: ASME; 1986. p. 1 15-6.
Pandy MG, Berme N. A numerical method for simulating the
dynamics of human walking. J Biomech 1988;21:1043-51.
Ill
Section Four: Future Directions
(2. Yamaguchi GT. Feasibility and conceptual design of func-
tional neuromuscular stimulation systems for the restoration
of natural gait to paraplegics based on dynamic musculo-
skeletal models (dissertation). Stanford, CA: Stanford Univer-
sity; 1989.
13. Meglan DA. Enhanced analysis of human locomotion (disser-
tation). Columbus, OH: Ohio State University; 1991.
14. Zajac FE. Muscle coordination of movement: a perspective. J
Biomech 1 993 ;26( 1 ) : 1 09-24.
15. Yamaguchi GT, Pandy MG, Zajac FE. Dynamic musculo-
skeletal models of human locomotion: perspectives on model
formulation and control. In: Patla A, editor. Adaptability of
human gait: implications for the control of locomotion.
Advances in Psychology Series No. 78. Amsterdam: Elsevier
Science Publishers; 1991. p. 205-40.
16. Pandy MG, Anderson FC, Hull DG. A parameter optimization
approach for the optimal control of large-scale musculo-
skeletal systems. J Biomech Eng 1992;114:450-60.
17. Zajac FE. Muscle and tendon: properties, models, scaling, and
application to biomechanics and motor control. In: Bourne JR,
editor. CRC Critical Reviews and Biomedical Engineering
Boca Raton, FL: CRC Press; 1989. 17(4):349-411.
18. Hoy MG, Zajac FE, Gordon ME. A musculoskeletal model of
the human lower extremity: the effect of muscle, tendon, and
moment arm on the moment-angle relationship of musculo-
tendon actuators at the hip, knee, and ankle. J Biomech
1990;23:157-69.
9. Kaufman KR, An KN, Chao EYS. Incorporation of muscle
architecture into the muscle length-tension relationship. J
Biomech 1989;22(8/9):943-9.
0. Lieber RL, Brown CG, Trestik CL. Model of muscle-tendon
interaction during frog semitendinosus fixed-end contractions.
J Biomech 1992;25:421-8.
1. Trestik CL, Lieber RL. Relationship between Achilles tendon
mechanical properties and gastrocnemius muscle function. J
Biomech Eng 1993;115:225-30.
2. Brand RA, Crowninshield RD, Wittstock CE. A model for
lower extremity muscular anatomy. J Biomech Eng
1982;104:304-10.
3. Delp SL, Loan JP, Hoy MG, Zajac FE, Topp EL, Rosen JM.
An interactive graphics-based model of the lower extremity to
study orthopedic surgical procedures. IEEE Trans Biomed
Eng 1990;37(8):757-67.
4. Yamaguchi GT, Zajac FE. A planar model of the knee joint to
characterize the knee extensor mechanism. J Biomech
1989;22:1-10.
5. Johnston RC, Brand RA, Crowninshield RD. Reconstruction
of the hip: a mathematical approach to determine optimum
geometric relationships. J Bone Joint Surg Am 1979;61A:
639-52.
6. Dul J, Shiavi R, Green N. Simulation of tendon transfer
surgery. Eng Med 1985;14:31-8.
7. Lindgren U, Seireg A. Influence of mediolateral deformity,
tibial torsion, and foot position on femoral tibial load:
prediction of a musculoskeletal computer model. Arch Orthop
Trauma Surg 1989;108:22-6.
8. Mann RW. Computer-aided surgery. Proceedings of the
8th annual RESNA conference, Memphis, TN; 1985:
26-35.
99. Sutherland DH, Olshen RA, Biden EN, Wyatt MP. The
development of mature walking, Bax M, editor. London:
MacKeith Press; 1988. p. 28-9.
100. Thomas SS. The gait analysis laboratory: an administrative
manual for physicians and administrators. Results of master’s
thesis. Proceedings of the 7th Annual East Coast Clinical Gait
Laboratory Conference, Richmond, VA, Oct 31 -Nov 2, 1991.
101. Olshen RA, Biden EN, Wyatt MP, Sutherland DH. Gait
analysis and the Boot Strap. Annal Stat 1989;1 7(4): 1419—40.
102. Donath M. Human gait pattern recognition for evaluation,
diagnosis and control (dissertation). Cambridge, MA: Massa-
chusetts Institute of Technology; 1978.
103. Laughman RK, Stauffer RN, Ilstrup DM, Chao EYS. Func-
tional evaluation of total knee replacement. J Orthop Res
1984;2:307-13.
104. Kaufman KR, Chao EYS, Callahan TD, Askew LJ, Bleimeyer
RR. Development of a functional performance index for
quantitative gait analysis. Biomed Sci Instrum 1987;23:49-55.
105. Wootten ME, Kadaba MP, Cochran GVB. Dynamic
electromyography I: numerical representation using principal
component analysis. J Orthop Res 1990;8:247-58.
106. Kadaba MP, Ramakrishnan HK, Jacobs D, Goode B,
Scarborough N. Relationships between patterns of knee and
ankle motion in spastic diplegic patients with dynamic ankle
equinus. Trans Orthop Res Soc 1 993; 1 8(2):364.
107. Efron B. The Jack Knife, the Bootstrap, and other resampling
plans. Philadelphia, PA: Society for Industrial and Applied
Math; 1982.
108. Kelly MF, Biden EN. A comparison of two classification
methods for gait data. Trans Orthop Res Soc 1989;14:241.
109. Sutherland DH, Kaufman K, Ramm K, Ambrosini D, Wyatt
M. Clinical use of prediction regions for motion data. Dev
Med Child Neurol 1996;38(9):773-81.
110. Wootten ME, Kadaba MP, Cochran GVB. Dynamic
electromyography II: normal patterns during gait. J Orthop
Res 1990;8:259-65.
111. Wong MA, Simon S, Olshen R. Statistical analysis of gait
patterns of persons with cerebral palsy. Stat Meth
1983;2:345-54.
112. Shiavi R, Zhang LQ, Limbird T, Edmondstone MA. Pattern
analysis of electromyographic linear envelopes exhibited by
subjects with uninjured and injured knees during free and fast
speed walking. J Orthop Res 1992;10:226-36.
113. Dzierzanowski JM, Bourne JR, Shiavi R, Sandell HSH, GuyD. Gaitspert: an expert system for the evaluation of abnormal
human locomotion arising from stroke. IEEE Trans Biomed
Eng 1985;32(1 1):935—42.
1 14. Simon SR, Bylander T, Weintraub M, Szolovits P, Hirsch DE.
Doctor gait: an expert system for gait analysis. Trans Orthop
Res 1989; 14:245.
1 15. Hirsch DE, Simon SR, Bylander T, Weintraub MA, Szolovits
P. Using causal reasoning in gait analysis. In: Home W,editor. Causal AI models: steps toward applications. NewYork, NY: Hemisphere Publications; 1989. p. 253-72.
116. Holzreiter SH, Kohle ME. Assessment of gait patterns using
neural networks, J Biomech 1 993 ;26(6):645—5 1
.
117. Sepulveda F, Wells DM, Vaughan CL. A neural network
representation of electromyography and joint dynamics in
human gait. J Biomech 1 993;26(2): 101 —9.

112
RRDS Gait Analysis in the Science of Rehabilitation
118. Biafore S, Cottrell G, Focht L, Kaufman K, Wyatt M,
Sutherland DH. Neural network analysis of gait dynamics.
Trans Orthop Res Soc 1 99 1 ; 1 6( 1 ):255.
119. Elman JL. Finding structure in time. Center for Research in
Language, Tech Report No. 8801. San Diego: University of
California; 1988.
120. Sartori DE. Neural networks, statistics and experimental
designs. Sci Comput Auto 1992;8(ll):4-6.
121. Schiller HI. Electronic highway to where? National Forum
1 994;74(2): 1 9—2 1
.
122. Parker BK, Telecommunication: when the sky’s the limit.
Mayo Mag 1 990;5( 1 ): 1 8-29.
KENTON R. KAUFMAN, Ph.D., P.E. is Co-Director of the
Biomechanics Laboratory, Associate Professor of Bioengineering,
and Senior Associate Consultant in the Department of Orthopedics at
the Mayo Clinic. He received his PhD in biomechanical engineering
from North Dakota State University in 1988. Dr. Kaufman was
employed as an Assistant Professor at North Dakota State University
from 1976 to 1986. From 1986 to 1989, he worked as a Visiting
Scientist and then as a Research Fellow in the Biomechanics
Laboratory at Mayo Clinic. From 1989 to 1996, he served as the
Director of Orthopedic Research in the Motion Analysis Laboratory
at Children’s Hospital, San Diego, and as an Adjunct Associate
Professor at the University of California, San Diego.
Dr. Kaufman’s research focuses on the biomechanics of human
movement. He has won several awards for his research efforts. He
was awarded the American Society of Biomechanics Young Investi-
gator Award in 1989. He received the Excellence in Research Award
in 1989 and the O’Donoghue Sports Injury Research Award in 1993
from the American Orthopedic Society for Sports Medicine. In 1996,
Dr. Kaufman was honored by receiving the Clinical Research Award
from the American Academy of Orthopedic Surgeons.
Dr. Kaufman has also served the biomechanics community in
several forms: he has served on NIH Special Review Committees in
1993, 1995, 1997, and 1998; he was on the Working Group on
Injury Prevention of the Armed Forces Epidemiological Board from
1994 to 1995; and is currently Chairman of the Subcommittee on
Gait Modeling of the North American Society for Gait and Clinical
Movement Analysis (NASGCMA). He also serves as a representa-
tive from NASGCMA on the Commission for Motion Laboratory
Accreditation.

1 0 Center DriveBethesda,MD 20892-1150
301 -496-1080

midJIH Lli
III1iiiiiiiiiiiiii
l 3 1496 01015 0111n H


![JU orSe.] - Wikimedia Commons](https://static.fdokumen.com/doc/165x107/631d4c356c6907d36801b2da/ju-orse-wikimedia-commons.jpg)