Color 3-D Imaging of Normal and Pathologic Intracranial Structures
Upload
independentCategory
view
0download
0
A Multivariate Analysis of Pathologic Prognostic Indicators in Large Bowel Cancer
THE0 WIGGERS, MD,' JAN WILLEM ARENDS, MD,t BERT SCHUTTE. P H D , ~ LEX VOLOVICS, P H D , ~ AND FRED T. BOSMAN, M D t
A multivariate analysis of the pathologic data of 350 patients with primary colorectal cancer was performed. In addition to conventional parameters such as shape and size of the primary tumor, central node involvement, angioinvasive growth, grade, and stage, new variables such as the immunoreactivity patterns of carcinoembryonic antigen (CEA), CA 19-9, mucin, serotonin, secretory component (SC), and the DNA index were tested for their potential prognostic value. Every variable except CA 19-9, seroto- nin, and DNA showed significant prognostic information in univariate analysis. However, in the multi- variate analysis stage was the predictive factor with the highest hazard ratio, but absence of central node involvement, tumors with diameters between 3.5 cm and 6 cm, exophytic tumor growth, welldifferen- tiated tumors, tumors with CEA immunoreactivity, absence for staining with serotonin, and diploid tumors also were included in the relative risk model. Thus, the afore mentioned variables appear to play a role in the establishment of a prognostic index.
Cancer 61:386-395, 1988.
ORPHOLOGICALLY, large bowel carcinomas repre- M sent a rather uniform group of tumors that show great variability and unpredictability. Traditionally, the stage' of the tumor extension combined with the pres- ence or absence of lymph node and distant metastases and, to a lesser extent the histologic grade,* have been used as parameters for the identification of patient sub- groups with a different prognosis. Other pathologic vari- ables such as shape and size of the tumor, the proportion of the bowel wall circumference involved, the degree of lymphocytic infiltration in the tumor stroma, angioin- vasive growth, and the number and location of lymph node metastases also have been used to obtain prognos- tic information.
From the Departments of *Surgery, $Internal Medicine, and +Pa- thology, University Hospital Maastricht. Maastricht. and the §Depart- ment of Statistics, University of Limburg. Maastricht, The Nether- lands.
Supported in part by Grant RUL 82-1 of The Netherlands Cancer Foundation.
The following institutions have participated in this study: University Hospital Maastricht, Maastricht; University Hospital Dijkzigt. Rotter- dam; lkazia Hospital, Rotterdam; St. Joseph Hospital, Eindhoven: St. Barbara Hospital, Geleen; St. Laurentius Hospital, Roermond; St. Gregorius de Grote Hospital. Brunssum; and De Wever Hospital, Heerlen, The Netherlands.
The authors thank Ms. M. Pijls, B. Engelen, and M. Reijnders for technical assistance: Ms. M. de Leeuw for statistical analyses; and Ms. M. van Puijenbroek for collwtion of the data and preparation of the manuscript.
Address for reprints: Theci Wiggers, MD, Department of Surgery. Dr. Daniel den Hoed Cancer Center, Groene Hilledijk 301, 3075 AE Rotterdam, The Netherlands.
Accepted for publication August 25, 1987.
Recently, new variables have been tested for their po- tential prognostic value. Of these, estimation of tumor cell DNA content by static3 or flow cytometric means: and the expression of antigens associated with large bowel cancer,' appeared to be of particular interest.
In previous studies we have shown that the DNA content of large bowel carcinomas is a prognostic indi- cator in Dukes' C-staged tumors.6 We also demon- strated a correlation between patient survival and the expression patterns of two large bowel carcinoma asso- ciated antigens, carcinoembryonic antigen (CEA)' and CA 19-9.* Similar associations were shown for secretory component,' serotonin," and mucin,' I products of nor- mal resorptive, enterochromaffin, and goblet cells, re- spectively. However, the prognostic significance of these parameters was determined by univariate analysis. Therefore, the question remains whether interrelation with other prognostic factors, such as tumor stage, ac- counts for the findings. The current study aims to evalu- ate, by means of a regression model, the prognostic rele- vance of tumor stage, grade, DNA content, and expres- sion patterns at a cellular level of the antigens mentioned above.
Patients and Methods
Patients
Colorectal tumor specimens for this study were de- rived mostly from patients entering two prospective multicenter trials from 1979 to 1981. One trial con-
386

No. 2 PATHOL~GIC PROGNOSTIC INDICATORS I N LARGE BOWEL CANCER Wiggers et al. 387
cerned colon cancer in which a conventional and a no- touch isolation resection technique were compared. The other was a trial concerning preoperative irradiation in rectal cancer. Although patients with distant metastases were excluded from the trials, some were included in the current study bringing the total number of patients to 350. Patients with previous malignancies were excluded. Extensive pre- and perioperative investigations have been performed to detect or exclude distant metastases.
Follow- Up
A standardized follow-up program was instituted in- cluding routine blood count and chemistry studies. The CEA level was observed every 3 months, and after 3 years every 6 months. Liver ultrasound, chest x-ray, and colonoscopy were performed annually.
Criteria for Recurrence
A11 patients were observed closely and both the dis- ease-free interval and survival data were obtained. For this analysis, only death due to recurrent disease was used, excluding postoperative mortality within 30 days and nondisease-related death.
Locat ion
Tumors of the cecum and ascending colon were clas- sified as right-sided tumors. Tumors of both flexures were included in the transversal colon. Left-sided tumors comprised the colon descendens and the sig- moid. The rectosigmoid and rectal tumors were taken together.
Histologic Specimens
Blocks of paraffin-embedded cancer tissues and lymph nodes were collected from the contributing hos- pitals and reviewed for stage, histologic grade, angioin- vasive growth, and immunoreactivity of the studied an- tigens according to following criteria:
Stage: A clinicopathologic staging derived from the Dukes' classification was used.I2 Stage A was a tumor confined to the bowel wall. Stage B was an extension outside the serosa and/or into the pericolic/rectal fat. Stage C was either Stages A or B with lymph node me- tastases. Stage D was infiltrative growth in adjacent organs or distant metastases.
Grade: The degree of differentiation was assessed ac- cording to a modification of the criteria used by Blen- kinsopp:13 (1) welldifferentiated (tumors consisting en- tirely of glandular formation having up to two layers of lining cells with preserved nuclear polarity), (2) poorly differentiated (tumors with greater than 10% of a solid growth pattern), and (3) moderately differentiated
(tumors covering the spectrum between well and poorly differentiated). The undifferentiated tumors (no glan- dular structures) were few in number and were put to- gether with the poorly differentiated tumors. At least two different sections of each tumor were reviewed, and grading was based on the least-differentiated areas ob- served.
Angioinvasive growth: Available hematoxylin and eosin (H & E) sections were studied for at least 20 min- utes to detect the presence of angioinvasive growth.
Antibodies: Five colorectal tissue reactive antibodies were used in this study. The polyvalent rabbit anti-CEA antibody and the antisecretory component antibody were from Dakopatts (Copenhagen, Denmark). The se- rotonin antiserum was raised in rabbits by repeated sub- cutaneous immunization with a formaldehyde-conju- gated serotonin-albumin complex. Details of this pro- cedure have been reported previously.'o Mucin presence was demonstrated with the high-iron diamine/alcian blue stain distinguishing between sialated and sulphated mucins. The antibody CA 19-9 was of monoclonal ori- gin. Details about this antigen and its source are de- scribed else~here. '~ '~
Immunohistochemistry: Details of the immunocyto- chemical procedures of most antibodies have been re- ported Briefly, one block of formalin- fixed, paraffin-embedded tumor tissue, containing pref- erably normal adjacent mucosa, was used for immunohistochemistry. The polyvalent antibodies were applied in the unlabeled peroxidase-antiperoxidase procedure using peroxidase-conjugated swine anti-rab- bit immunoglobulin (Ig) as a second antibody. The mouse. monoclonal antibody was used in an indirect peroxidase labeled antibody procedure, with rabbit anti-mouse Ig as a second layer. Routine tissue process- ing did not affect the results because staining patterns of frozen sections of colorectal cancers were comparable with those of trypsinized paraffin sections of the same tumors.
Immunoreactivity scoring: The immunoreactivity of most antibodies was scored semiquantitatively. Immu- noreactivity was considered positive if greater than 80% of the individual cells displayed the antigen, and nega- tive if less than 5% displayed the antigen. The pattern was scored positive focally if between 5% and 80% of the cancer cells showed immunoreactivity. For the anti- CEA antibody, tumors were classified as positive if the apical plasma membrane and/or the entire cytoplasm stained, and negative if immunoreactivity was among the individual cells focally. Tumors with immunoreac- tivity confined to the cell membrane were classified as membranous. Only a few tumors displayed the staining pattern mentioned last. Because these tumors were cor- related with a poor prognosis,' they were analyzed to-

388 CANCER January 25 1988 Vol. 61
gether with the tumor classified as negative. The mucin stains were subdivided into three groups: one group staining predominantly for sulphomucins, a second group staining mainly for sialomucins, and a rest group either staining negatively or displaying a mixed pattern.
Flow Cytometry
Details of the DNA flow cytometry with paraffin-em- bedded, tissue-derived nuclei have been published else- where.I5 Briefly, a slice of paraffin-embedded tissue was scraped off the block and rehydrated after clearing the paraffin. After trypsination and filtration, approxi- mately 2 to 3 X lo6 cells were stained according to the Vindelrav method.16 Cellular DNA content was mea- sured on a FACS IV cell sorter (Becton Dickinson, Sun- nyvale, CA). The DNA index was calculated as a ratio of the aneuploid peak to the diploid G 1 /O peak. Tumors were classified as diploid (DNA index, 1 .O) or aneuploid (DNA index, >lo). A special category was formed by tumors displaying a broad diploid peak, classified as 4.0.
Statistical Analvsis
The relative prognostic importance of all pathologic parameters, includng location of the primary tumor and age, was investigated using Cox’s regression model” and the BMDP2L computer program.” As for most parame- ters, a substantial number of values were missing. Two analyses were performed: one using the 225 patients with complete data records for the variables mentioned above, and one using a separate category called “miss- ing” for each parameter with missing values. Data in- spection showed no statistically significant associations between the parameters when dichotomized as “present” versus “missing” and survival.
In the Cox proportional hazards regression model, the outcome of all parameters (x , ,x2, . . . , xp) is measured at baseline for an individual patient (i). A prognostic score (S) for this patient can be written as
si = P l X , l + &Xi2 + &Xi3 + * * * + OPXiP.
Here, x,, is the value of the j-th prognostic variable ( j = 1,2, . . . , p) for the i-th patient (i = 1,2, . . . , n), and the parameter /3j denotes the difference in the S of pa- tients who differ by one unit in the j-th variable. All other prognostic variables for those patients were at the same level. A prognostic variable with two or more cate- gories of outcome is represented by a number of vari- ables and parameters equal to the number of its catego- ries, minus one. The reference category was not in- cluded as a variable. The Dukes’ classification, for example, is represented by three prognostic variables in the S: one representing Dukes’ B, the second represent- ing Dukes’ C, and the third representing Dukes’ D, with
respective parameters PI, pz, 0 3 . A patient i classified as Dukes’ B gets a Dukes’ contribution of 0, to his/her S, and a patient classified as Dukes’ A gets no Dukes’ con- tribution to his/her S because the A state is absorbed in the reference hazard.
The Si is related to the survival outcome by Ai(t) = A,(t) exp(Si), where Ai(t) represents the instantaneous risk or hazard of death at time t for patient i given that this patient was alive just before t. For each t > OAi(t) X h gives the probability of dying in a small interval t to t + h. The &(t) denotes a reference hazard, that is the hazard for patients with a S equal to zero.
Exp (02) denotes the excess risk for patient i, with respect to the references hazard if that patient is classi- fied as Dukes’ C, and 82 is the parameter associated with Dukes’ C in the S.
Results
Uni variat e Present at ions
Survival rates of the traditional pathologic parameters are summarized in Table I and shown in Figure I . Tumors with a diameter between 3.5 cm and 6 cm are related to a better survival than small and very large tumors ( P = 0.02). Ulcerative growth is associated with a poorer prognosis ( P = 0.01) than exophytic growth, al- though patients with sessile and polypoid tumors had a similar survival. Patients with a lack of angioinvasive growth showed significantly longer survival than those with it ( P = 0.00). Central node involvement was asso- ciated with significantly shorter survival ( P = 0.00). Prognosis was related strongly to staging (P = 0.00) and grading, although for the last variable only the poorly differentiated tumors discriminated with respect to the well and moderately differentiated carcinomas ( P = 0.00). There was no significant difference in survival according to location ( P = 0.34) and age (P = 0.26) (data not shown).
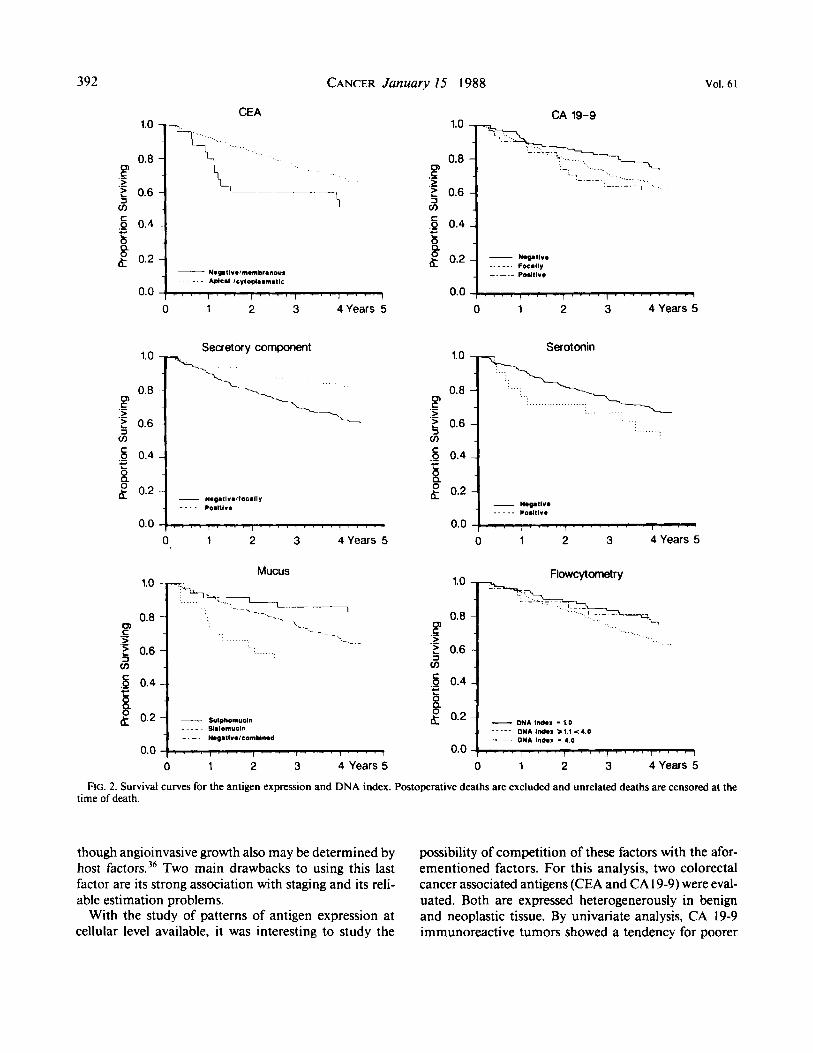
The new variables are summarized in Table 2 and plotted in Figure 2. There was a tendency for poorer survival in CEA negative tumors ( P = 0.06), focally and positive CA 19-9 staining tumors ( P = 0.1 1). serotonin positive tumors ( P = 0.12), and tumors with a DNA index greater than 1 .O ( P = 0.12). Positive staining for ( P = 0.01) and excessive sulphomucin ( P = 0.04) were as- sociated with a better survival, whereas differences in either extracellular or intracellular mucin production were of no significance ( P = 0.46).
Co-x Regression Analysis
The parameters derived from the regression models that offer independent prognostic information are sum- marized in Tables 3 and 4. Backward elimination using

No. 2 PATHOLOGIC PROGNOSTIC INDICATORS IN LARGE BOWEL CANCER Wiggers et al. 389
TABLE 1. Summary of the Traditional Variables Entered in the Regression Model
Variable Categories
Number of P value of Number of disease-related
observations deaths (W) log-rank test ~
Tumor size (cm)
Tumor shape
Angioinvasive growth
Central node involvement
Stage
Grade
Location
<3.5 3.5-6.0 >6.0 Polypoid Sessile Ulcerative Present Absent Positive Negative A B C D Well-differentiated Moderately differentiated Poorly differentiated Right-sided Trans v e rsa I Left-sided Rectosigmoid/rectal <60 60-70 >70
I18 I57 59 48 51
236 93
236 29
32 I 78
132 99 41 35
264 35 73 41
I10 126 97 90
163
42 (35.6) 37 (23.5) 22 (37.3)
8 (16.7) 10 (19.6) 84 (35.6) 45 (48.4) 56 (23.7) 20 (69.0) 95 (29.6)
6 (7.7) 31 (23.5) 44 (44.4) 34 (82.9)
8 (22.9) 79 (29.9) 18 (51.4) 25 (34.2) 18 (43.9) 32 (29.1) 40 (31.7) 3 I (32.0) 28 (31.1) 56 (34.3)
0.02
0.0 I
0.00
0.00
0.00
0.00
0.34
0.26
Wald and likelihood ratio tests was employed to select parsimonious models. Only parameters with P values less than 0.05 were included in the model with missing categories. In the model using complete records, param- eters with P values less than 0.10 were included. For- ward selection using Akaike's information criterion, and checking for inclusion of all remaining variables but adding only one, resulted in essentially the same models. Some category combinations were not represented in the data, and for this reason it was impossible to investi- gate systematically interactions so interaction terms are not included. The proportional hazards assumption was checked graphically for each parameter and appeared to be fulfilled adequately.
After the final set of prognostic variables (summarized in Tables 3 and 4) has been selected, the model fit may be evaluated by plotting survival curves predicted by the model against those obtained for the same patients by the Kaplan-Meier method (Fig. 3). The first step is to calculate the value of the prognostic index S = @,XI + 82x2 + . . * + BpXp for each patient in each treat- ment group. Prognostic scores may then be arranged in ascending order and divided into three risk groups. The predicted survival curve for each risk group is the weighted mean of the individual survival curves in that group. Any systematic deviations of the Kaplan-Meier curves from those predicted by the model might suggest the inappropriateness of the model to describe the data
adequately, and reflect consequently on prognostic index validity.
The relatively small overall sample size, combined with the relatively large number of missing values on some variables, made a split-sample evaluation of prog- nostic validity impracticable.
In summary, the selected models indicated a possible contribution to prognosis by the following parameters, when studied simultaneously: stage, grade, central nodal involvement, size and shape of the primary tumor, ex- pression patterns of CEA and serotonin, and flowcyto- metric analysis of the DNA index.
Discussion
To be of prognostic relevance, a variable should be assessable easily with a limited inter- and intraobserver variability and allow the identification of a number of patient groups with a clearly distinct prognosis. Prefera- bly, the variable also should be independent of other prognostic parameters.
Traditionally, tumor extension stage has emerged as a prognostic variable meeting most of these criteria. In this study, a multivariate analysis was performed in- cluding traditional parameters and the expression pat- tern of colon cancer associated antigens and the DNA index. The value of this type of analysis depends largely on data completeness and follow-up quality. Because

390
1.0
0.8
$ 0.6
._ 5 0.4 8 a
0 C > .- .-
cn
c
g 0.2
0.0
CANCER January 15 1988
,
Vol. 61
C > .- .- $ 0.6
.- c
g 0.2 . ... _ _
Size
\ x-.
* .
d 3 5
> 6 0 3 5 - 6 0
1..
- - I I
0 1 2 3 4 Years 5
1.0
0.8
5 0.6
.- P > .-
cn C .P 0.4
LB g 0.2
Central node invdvement --.-
0 1 2 3 4 Years 5
Stage (Dukes)
0.0 f . , , 1 " ' ' I ~ " ! " . . I 0 1 2 3 4 Years 5
- Polypold g 0.2
0.0 4 Years 5 0 1 2 3
1.0
0.8
? 0.6
.- 5 0.4 b a
0 C >
3 cn
.-
.-
c
g 0.2
Anglo-invasive
1 growth
-\
__ Absent .. .. Resent
$ . . . , . . . . ) . . , . I I 0.0 4 Years 5 0 1 2 3
1.0
0.8
5 0.6
0 C > .- .-
v)
Grade
I
FIG. I . Survival curves for traditional parameters. Postoperative deaths are excluded and unrelated deaths are censored at the time of death.
this study was part of a prospective trial with a prede- fined follow-up schedule, survival data regarding disease and not disease-related deaths can be considered reli- able. A central review of all pathologic specimens indi- cated stage and grade data completeness. However, antigen expression estimation and DNA index determi- nation had to be performed on blocks of paraffin-em- bedded material. There is a chance that representative
samples were not always obtained, moreover that suffi- cient material from every patient was not available for all determinations. This resulted in analyses with and without missing data as shown in Tables 3 and 4. The results of the two analyses do not agree completely. It is reassuring that the same prognostic variables were se- lected in both analyses. The only difference was the re- placement of grading with the expression pattern of

No. 2 PATHOLOGIC PROGNOSTIC INDICATORS IN LARGE BOWEL CANCER - Wiggers et a/. 39 I
TABLE 2. Summary of the New Variables Entered in the Regression Model
Number of Number of disease-related P value of
Variable Categories observations deaths (96) log-rank test
CEA Negative/mem branous
CA 19-9 Negative Apical/cytoplasmatic
Focally Positive
Positive
Positive
Sialomucin Sulphomucin Negative Focally Individual cells Positive
Howcytometry DNA index = 1.0 DNA index z 1 . 1 < 4 DNA index = 4.0
sc Negative/focall y
Serotonin Negative
Mucus Negative/combined
29 283 I12 I66 33
245 68
277 24
233 31 36
146 67 53 38 89
163 27
12 (41.4) 85 (30.0) 27 (24. I ) 59 (35.5) I2 (36.4) 86 (35.1) 12 (17.6) 85 (30.7) 10 (41.6) 77 (33.0) 12 (38.7) 6 (16.7)
48 (32.9) 23 (34.3) 16 (30.2) 8 (22.9)
19(21.3) 55 (33.7) 6 (22.2)
0.06 O.OO*
0.1 I 0.02* 0.01 o.oo* 0.12 0.09* 0.04 0.04*
0.46 0.02*
0.12 O.OO*
CEA: carcinwmbryonic antigen; SC: secretory component.
CEA when the cases with missing variables were in- cluded. The influence of a missing category might, how- ever, introduce a possible bias for any parameter.
Five traditional parameters were included in the prognostic index. In addition to staging, grading, central node involvement, size, and shape of the primary tumor are correlated with survival.
Exophytic growth, compared with ulcerative growth, was found to correlate with a better prognosis’’ but its strong relationship with stage” has limited its impor- tance. In our analysis, ulcerative tumor growth corre- lated with a poorer survival.
The impression that primary tumor size is an unim- portant prognostic indicator has been reported by others analyzing multiple prognostic factor^.^'-^^ No correla- tion was found between primary tumor diameter and lymph node metastases p r e s e n ~ e . ~ ~ . ~ ’ In our material, a subset of large tumors (3.5 cm through 6.0 cm) showed a better survival. This may agree with the observation of an inverse relationship between tumor volume, and stage24 and survival,26 respectively. However, it is diffi- cult to determine the relevance of this feature because the volume of colonic tumors is difficult to measure and different cutoff points are used in the literature. Spratt et a/.’’ have suggested that certain colorectal carcinomas may grow very large without metastasizing.
Central lymph node metastases presence is an impor- tant variable. Because sampling and determination of the most central node were performed by the local pa- thologist and surgeon, it is difficult to have good quality control. Considerable differences in the total number of
* Log-rank test including the missing values.
detected lymph nodes have been reported in multicenter studies.’4 The subclassification of the extent of lymph node metastases has caused a lot of c o n f ~ s i o n , ~ ~ - ~ ~ but Phillips et d3’ found both the absolute number of in- volved lymph nodes (cut point four) and the involve- ment of the apical node independent variables by multi- variate analysis.
Despite the substantial interobserver ~ariabil i ty,’~ grading remained as a prognostic factor independent of stage in several studies, consisting of a large number of cases with a prognostic factor independent from stage.23,30-32 Of seven grade-related factors analyzed in the material of St. Marks Hospital in London, only lym- phocytic infiltration, tubular configuration, and pattern of growth remained after a Cox regression analysis.” Introduction to the aforementioned analysis of stage-re- lated factors such as depth of tumor infiltration, node status, and lymphocytic infiltration left lymphocytic in- filtration as the only factor of interest. Our observation that poorly or undifferentiated carcinomas ( 10.5% of the total material) predicted a poor outcome agreed with the data of Philips et d3’ In order to compare data among series reliably, several blocks of the least-differentiated areasI3 should be studied, and characteristics to be scored should be defined e~actly.’~
The important role of staging has been reported in all other regression analyses21*23*30s34 except one.35 A possi- ble explanation for its significance may be that tumor stage reflects the interaction between the host and the tumor. The other conventional prognostic indicators are descriptors mainly of individual tumor cell biology, al-
392 CANCER January 15 1988 Vol. 61
CEA CA 19-9 1.0 1.0
0.8
5 0.6 cn C > .- .-
cn
0.8
5 0.6 .- F > .-
cn '1 .- 5 0.4
g 0.2 w
b Q
C .Q 0.4
Focmlly POII1IV.
I 0.0 0.0 7,
0 1 2 3 4 Years 5 0 1 2 3 4Years 5
1.0 Serotonin Secretory component
1.0
r > .- 5 0.6 m
0.8
5 0.6 .- F > .-
cn
0.0 1, 0 1 2 3 4 Years 5
0.0 0 1 2 3 4 Years 5
Mucus 1.0
FlowcVtometrv 1.0
0.8 .- F > .- 5 0.6 cn
0.8
2 5 0.6 cn
.- P
4 ,s 0.4 - i B g 0.2 - M A Indmx - 1.0
DNA Ind.1 > 1.1 < 4.0 __.._ 1 , ~ . ~ ; , DMA , Indmx , , , - , 4.0 , , , , , , , , , 0.0
0 1 2 3 4 Years 5 0 1 2 3 4 Years 5
FIG. 2. Survival curves for the antigen expression and DNA index. Postoperative deaths are excluded and unrelated deaths are censored at the time of death.
though angioinvasive growth also may be determined by host factors.36 Two main drawbacks to using this last factor are its strong association with staging and its reli- able estimation problems.
With the study of patterns of antigen expression at cellular level available, it was interesting to study the
possibility of competition of these factors with the afor- ementioned factors. For this analysis, two colorectal cancer associated antigens (CEA and CA19-9) were eval- uated. Both are expressed heterogenerously in benign and neoplastic tissue. By univariate analysis, CA 19-9 immunoreactive tumors showed a tendency for poorer

No. 2 PATHOLOGIC PROGNOSTIC INDICATORS IN LARGE BOWEL CANCER - Wiggers et al. 393
TABLE 3. Proportional Hazards Regression Model Based on 225 Patients With Complete Data Records
Standard Hazard Variable Category Coefficient error ratio
Stage
Central node Primary tumor
size (cm) Tumor shape
CEA Serotonin Flowcytometry
B 0.92 C I .43 D 2.96 Involved I .28
>6 0.52 Sessile -0.62 Ulcerative 0.19
Positive 0.7 I DNA index > 1.0 0.56 DNA index = 4.0 -0.43
3.5-6 -0.4 I
Positive -0.96
0.57 0.56 0.6 I 0.36 0.28 0.39 0.73 0.54 0.42 0.42 0.35 0.57
2.52 4. I1 19.29 3.59 0.66 I .68 0.54 2.19 0.38 2.03 I .76 0.65
CEA: carcinoembryonic antigen.
survival.' However, in the multivariate analysis no additional information was obtained including this pa- rameter.
The situation is somewhat more complex for CEA. Normal colonic luminal cells showed CEA immunore- activity at the apical brush border. Greater than 90% of the tumors showed extensive CEA expression, either cy- toplasmic diffusely or apical membrane bound. Some tumors display the antigen only focally or membrane bound, but with polarity loss. This last group of tumors showed significantly poorer survival than the group of extensively CEA immunoreactive t ~ m o r s . ~ In the re- gression model, this group (constituting 10% of the total population) remained a weak factor.
Secretory component is a product of the normal co- lumnar cells. The different expression patterns of SC (uniform, focal, or negative) are correlated with the his- tologic grade of colorectal tumors. Welldifferentiated tumors show more extensive SC expression than poorly differentiated tumors. Homogeneous SC expression was related to better survival,' but this effect disappeared in the regression analysis.
We tested further the prognostic significance of not only the distribution (defined as extra- or intracellular) of mucins, but also the shift from sulpho- to sialomucin production. In rectal cancer, data regarding stage and prognosis in relation to mucin production are contro- versial.*O A poorer prognosis in tumors with extensive mucus production (>60% of the tumor volume) was fo~nd.'~~' ' In our series using univariate analysis, the composition rather than the extent of mucin production appeared to be relevant because a predominance of sial- omucins were related to a poorer survival. However, in the Cox regression model this effect was no longer ap- parent.
TABLE 4. Proportional Hazards Regression Model Based on All 350 Patients Including Extra Categories for Missing Values
Standard Hazard Variable Category Coefficient error ratio
~~ ~
Stase
Central node Primary tumor
Tumor shape
Grade
Serotonin Rowcytometry
size
B C D Involved 3.5-6 >6 Sessile Ulcerative Moderately Poorly Positive DNA index > 1.0 DNA index = 4.0
I .03 1.81 3.28 1.12
-0.48 0.29 0.09 0.81 0.36 1.15 0.96 0.37
-0.27
0.46 2.79 0.46 6.08 0.49 26.47 0.3 1 3.07 0.24 0.62 0.31 I .33 0.53 1.10 0.4 1 2.24 0.39 I .44 0.47 3.14 0.35 2.62 0.29 1.45 0.5 I 0.75
Finally, we tested the prognostic significance of endo- crine differentiation by immunostaining for serotonin. Serotonin immunoreactive cells were detected in 8% of the large bowel carcinomas." In these cases, serotonin immunoreactive cells occurred as either focal clusters or occasional single cells. Neuroendocrine differentiation was associated with poorer survival and this effect was maintained in the regression analysis. This last feature may be explained by lack of relation with other factors such as stage, because the observation of this phenome- non is restricted to a few individual cells only.
So far, antigen expression determination at the cellu- lar level has been of limited value, except with CEA and serotonin. Two factors are of importance. First, malig- nant tumors are heterogeneic and consist of different
1.0
0.8
$ 0.6
CJ) C > .- .-
v)
.... u ...
Pr.dIc1.d ___-_. 0.0 1 , , 1 1 1 , 1 1 1 , 1 , 1 , 1 1 1 , 1 ( , , , , ,
0 1 2 3 4 Years 5
FIG. 3. Survival curves predicted by the proportional hazard regres- sion model and observed by the Kaplan-Meier method for three risk groups, defined by cut points 2.62 and 3.89 in the prognostic score distribution.

394 CANCER January 15 1988 Vol. 61
clones.39 The expression patterns of the antigens cur- rently studied always contain large numbers with mixed staining patterns classified as focal. Exclusion of focally staining tumors improves the discriminating properties for certain factors, but this exclusion is undesirable for factors that are part of a staging system. Second, the antigens currently studied are either colorectal carci- noma associated or end products of the mature cell, and in this regard are related strongly to grade. In fact, the study of antigen expression differences in biological be- havior of morphologic identical tumors is still in its ini- tial phase. Normal colonic cells in varying stages of mat- uration, fetal colonic cells, and cells from undifferen- tiated carcinomas may serve as immunogens for new antibody production.
Another approach was the analysis of the DNA con- tent of tumor cells in relation to prognosis. Earlier, Wolley el aL3 showed the DNA index to be of prognostic significance. In this study, newly developed techniques allowing DNA analysis on tissues rescued from paraffin block^^.'^ were used. The DNA index, calculated as the ratio of aneuploid to diploid G 1/0 peak channel, was divided into three groups. The group of patients with a DNA index greater than 1 .O (aneuploid) was related to a poorer survival in both the univariate and multivariate analysis. This confirms the observation by others of a correlation between aneuploidy and ~ tage~ ' .~ ' and sur- ~ i v a l . ~ , ~ ' A drawback of the flowcytometry is the classi- fication of tumors showing more than one abnormal peak4' and heterogeneity regarding the spot of sampling in colon and rectal carcinoma^.^^-^ More refined infor- mation may be derived from cell kinetic analysis by S phase fraction determination or bromodeoxyuridine in- corporation.
In conclusion, our results indicate that in multivariate analysis tumor stage is the most important prognostic factor in large bowel cancer. However, central node in- volvement, size, and shape of the primary tumor also may be included in a prognostic index, although their effect on survival will be limited because either the num- ber of cases in the discriminating subgroup is small (e.g., central node involvement) or the hazard ratio is low (e.g., tumor size over 6 cm).
Also, our results show that clinicopathologic staging can be refined with the introduction of new prognostic variables such as CEA expression, neuroendocrine dif- ferentiation, and DNA analysis. Finally, we have shown that the value of every new pathologic prognostic indi- cator needs to be evaluated in multivariate analysis.
REFERENCES 1. Lockhart-Mummery HE, Ritchie JK. Hawley PR. The results of
surgical treatment for carcinoma of the rectum at St Mark's Hospital from 1948 to 1972. Br J Slug 1976: 63:673-677.
2. Broders AC. Carcinoma: Grading and practical application. Arch Parhol Lab Med 1926; 2:376-381.
3. Wolley RC, Schreiber K, Koss LG. Karas M, Sherman A. DNA distribution in human colon carcinoma and its relationship to clinical behavior. J Natl Cancer Inst 1982; 69: 15-22.
4. Armitage NC, Robins RA, Evans DF, Turner DR, Baldwin RW, Hardcastle JD. The influence of tumour cell DNA abnormalities on survival in colorectal cancer. Br J Surg 1985; 72:828-830.
5 . Arends JW, Bosman FT, Hilgers J. Tissue antigens in large bowel carcinoma. Eiochim Biophys Acta 1985; 780: 1-1 9.
6. Blijham G, Schutte B, Reynders M ef al. Flowcytometric (FCM) determination of ploidy level and life cycle analysis on 279 paraffin embedded colorectal carcinoma specimens (Abstr). Proc Am Soc CIin Oncol 1985; 4:22.
7. WiggersT, Arends JW, Verstijnen C, Moerkerk PM, Bosman FT. Prognostic significance of CEA immunoreactivity patterns in large bowel carcinoma tissue. Br J Cancer 1986; 54409-4 14.
8. Arends JW, Wiggers T, Verstijnen C, Hilgers J, Bosman FT. Gastrointestinal cancer-associated antigen (GICA) immunoreactivity in colorectal carcinoma in relation to patient survival. Inr J Cancer
9. Arends JW, Wiggers T, Thijs CT, Verstijnen C. Swaen GJV, Bosman FT. The value of secretory component (CS) immunoreactiv- ity in diagnosis and prognosis of colomtal carcinomas. Am J CIin Pafhol 1984; 82:267-274.
10. Arends JW, Wiggers T, Verstijnen C, Bosman FT. The occur- rence and clinicopathological significance of serotonin immunoreac- tive cells in large bowel carcinoma. J Pafhol 1986; 149:97-102.
1984: 34:193-196.
1 1 . Arends JW. Unpublished data, 1987. 12. Turnbull RB Jr, Kyle K, Watson FR, Spratt J. Cancer of the
colon: The influence of the no-touch isolation technic on survival rates. Ann Surg 1967; 166:420-427.
13. Blenkinsopp WK, Stewart-Brown S, Blesovsky L, Kearney G. Fielding LP. Histopathology reporting in large bowel cancer. J CIin Pafhol 1981; 34509-513.
14. Koprowski H, Steplewski Z, Michell K. Colorectal carcinoma antigens detected by hybridoma antibodies. Somafic Cell Mol Genet
15. Schutte B, Reynders MMJ, Bosman IT, Blijham GH. Flow cytometric determination of DNA ploidy level in nuclei isolated from paraffin-embedded tissue. Cyfomefry 1985; 6:26-30.
16. Vindelev LL, Christensen IJ, Nissen NI. A detergent trypsin method for the preparation of nuclei for flow cytometric DNA analy- sis. C.vfomeiry 1983: 3:323-327.
17. Cox DR, Oakes D. Analysis of Survival Data. London: Chap man and Hall, 1984.
18. BMDP Statistical Software. Berkeley, CA: University of Califor- nia Press, 198 1.
19. Grinnell RS. The spread of carcinoma of the colon and rectum. Cancer 1950: 3:641-652.
20. Cohen AM, Wood WC, Gunderson LL, Shinnar M. Pathologi- cal studies in rectal cancer. Cancer 1980; 45:2965-2968.
21. Spratt JS, Spjut HJ. Prevalence and prognosis of individual clinical and pathologic variables associated with colorectal carcinoma. Cancer 1967; 20:1976-1985.
22. Chung CK, Zaino RJ, Stryker JA. Colorectal carcinoma: Evalu- ation of histologic grade and factors influencing prognosis. J Surg Oncol 1982; 21:143-148.
23. Chapuis PH, Dent OF, Fisher R ef a/. A multivariate analysis of clinical and pathological variables in prognosis after resection of large bowel cancer. Er J Surg 1985; 72:698-702.
24. Wolmark N, Cruz I, Redmond CK, Fisher B, Fisher ER. Tumor size and regional lymph node metastasis in colorectal cancer. Cancer
25. Sugarbaker PH. Carcinoma of the Colon: Prognosisand Opera- tive Choice. Current Problems in Surgery. Chicago: Year Book Medi- cal Publishers, 1981; 753-802.
26. Osnes SV. Carcinoma of the colon and rectum: A study of 353 cases with special reference to prognosis. Acra Chir Scand 1955;
1979; 5:957-972.
1983; 5 I : I3 15-1 322.
110:378-388.

No. 2 PATHOLUGIC PROGNOSTIC INDICATORS IN LARGE BOWEL CANCER Wiggers et al. 395
27. Gabriel WB, Dukes C, Bussey HJR. Lymphatic spread in cancer of the rectum. Br J Surg 1935; 23:395-413.
28. Astler VB, Coller FA. The prognostic significance of direct ex- tension of carcinoma of the colon and rectum. Ann Surg 1954;
29. Gastrointestinal Tumor Study Group. Adjuvant therapy of colon cancer Results of a prospectively randomized trial. N Engl J Med 1984; 310:737-734.
30. Phillips RKS, Hittinger R. Blesovsky L, Fry JS, Fielding LP. Large bowel cancer: Survival pathology and its relationship to survival. Er J Surg 1984; 7 1 :604-6 10.
3 I . Newland RC, Chapuis PH, Pheils MT, MacPherson JG. The relationship of survival to staging and grading of colorectal carcinoma: A prospective study of 503 cases. Cancer 198 I ; 47: 1424-1429.
32. Freedman LS, Macaskill P, Smith AN. Multivariate analysis of prognostic factors for operable rectal cancer. Lancet 1984; 733-736.
33. Jass JR, Atkin WS, Cuzick J et 01. The grading of rectal cancer Historical perspectives and a multivariate analysis of 447 cases. Histo-
34. Wied U, Nilsson T, Knudsen JB, Sprechler M, Johansen AA. Postoperative survival of patients with potentially curable cancer of the colon. Dis Colon Rectum 1985; 28:333-335.
35. Knudsen JB, Nilsson T, Sprechler M, Johansen A, Christensen N. Venous and nerve invasion as prognostic factors in postoperative survival of patients with resectable cancer of the rectum. Dis Colon Rectum 1983; 266 I 3-6 17.
139846-852.
pathology 1986; 10:437-459.
36. Talbot IC, Ritchie S, Leighton M, Hughes AO, Bussey HJR, Morson BC. Invasion of veins by carcinoma of rectum: Method of detection, histological features and significance. Hisropathology 198 1 :
37. Symonds DA, Vickery AL. Mucinous carcinoma of the colon and rectum. Cancer 1976; 36:1891-1900.
38. Umpleby HC, Ranson DL, Williamson RCN. Peculiarities of mucinous colorectal carcinoma. Br J Surg 1985; 72:7 15-7 18.
39. Fidler IJ, Kripke ML. Metastasis results from preexisting var- iant cells within a malignant tumor. Science 1977; 197:893-895.
40. Rognum TO, Thorud E, Elgio K, Brandtzaeg P, Ojasaeter H, Nygaard K. Large-bowel carcinomas with different ploidy, related to secretory component, IgA and CEA epithelium and plasma. Er J Cancer 1982; 45:921-934.
41. Tribukait B, Hammarberg C, Rubio C. Ploidy and proliferation patterns in colorectal adenocarcinomas related to Dukes' classification and to histological differentiation. Acta Pathol Microbiol Immunol Scand [ A ] 1983; 91:89-95.
42. Kokal W, Sheibani K, T e n J. Harada JR. Tumor DNA content in the prognosis of colorectal carcinoma. JAMA 1985; 255:3 123-3 127.
43. Petersen SE, Bichel P, Lorentzen M. Flowcytometric demon- stration of tumour cell subpopulations with different DNA content in human colo-rectal carcinoma. Eur J Cancer 1978; 15:383-386.
44. Hiddemann W, Von Bassewitz DB, Kleinemeier HJ ef al. DNA stemline heterogeneity in colorectal cancer. Cancer 1985; 58:258-263.
5: 141-163.
Copyright © 2022 FDOKUMEN