
Color 3-D Imaging of Normal and Pathologic Intracranial Structures
13
The overall feasibility of 3-D imaging for intracranial soft tissues depends on three vital areas: the display method, the display options, and the image processing system. Color 3-D Imaging of Normal and Pathologic Intracranial Structures Edward J. Farrell, IBM Thomas J. Watson Research Center Rosario Zappulla, Mt. Sinai Medical Center and Mt. Sinai School of Medicine Wen C. Yang, Beth Israel Medical Center and Mt. Sinai School of Medicine Three-dimensional imaging is potentially useful in several medical areas. This is particularly true in the study of the central nervous system, where the localiza- tion of anatomical structures is based on very specific references to planar coordinates. Similarly, the diagnosis and location of structural abnormalities of the central nervous system (i.e., tumor and vascular) require a specific reference to the position of the abnormality with respect to the surrounding anatomical structure. Conse- quently, a physician can improve his concept of the shape and size of the abnormality and can discuss and describe the scans with colleagues on the basis of a com- mon visible image of the 3-D relationships. In addition, 3-D images better reflect what is actually seen during surgery than a series of black-and-white scan images. Therefore, a 3-D representation of the anatomy of the involved area permits better preoperative planning of a surgical approach. Three-dimensional imaging has been applied to several specific areas with significant results. It has been suc- cessfully used by Vannier and Marsh for craniofacial surgical planning and evaluation on more than 400 patients.'"3 Vannier, Gado, and Marsh have also applied their method to assess intracranial soft-tissue structures.4 Dev, Wood, White, Young, and Duncan have in- vestigated an interactive graphics system for planning reconstructive surgery;5 the results of the 3-D reconstruc- tion have been used to drive a milling machine and pro- duce a skull model. Three-dimensional imaging has been used to evaluate spinal surgery and disk disease6'7 and the foot following surgical repair.8 Rose, Jacobs, Cook, and Rozran have used 3-D imaging methods to examine fractures in the lower extremities of 10 patients.9 Various stages of healing were investigated with histograms, CT cross sections, and 3-D reconstructions. In addition to displaying physical structures, 3-D imaging has been used to display radiation beams'°0"1 and isodose surfaces 12"3 for radiation therapy planning. Recently, the 3-D recon- struction methods used for CT scans have been applied to NMR'4 and ultrasound.'5",6 The basic imaging approach of other investigators is based on locating the surface of a structure in 3-D and then projecting the surface onto a 2-D image plane using hidden-surface removal, shading, transparency, etc. A standard method of locating the surface is to first locate surface edges in each slice plane. This is done manually with a coordinate digitizer'2 or by automatically using an edge extraction algorithm with editing.5 The structure surface is formed in 3-D by placing planar surface elements between the contours.'5 An alternative method of locating the surface of a structure in 3-D is based on a controlled search.'7 The result is a set of connected cubic elements in the data space. This cubic approach has several computational advantages.'8 The approach published elsewhere by Farrell is fundamentally different from these surface-based approaches;'9 rather than try- ing to isolate the surface of a structure, the objective is to interactively interpret the 3-D relationship of data value ranges using different colors. The approach can image very complex convoluted structures that may have dis- joint parts. Computations needed for hidden-object removal, shading, transparency, cutout, projection direction, contour lines, and stereo are simple. The ap- proach results in a very fast, interactive method to inter- pret the position, size, and shape of 3-D structures in CT scan data. Therefore, Farrell's approach is used for the studies presented in this article. The object of this investigation is to determine the overall feasibility of 3-D imaging for intracranial soft tissues, both normal and pathologic. This involves the display method, display options, and image processing system that together permit the user to dynamically in- 0272-1716/84/0900-0005$01.00 C 1984 IEEE September 1984 5
-
Upload
independent -
Category
Documents
-
view
1 -
download
0
Transcript of Color 3-D Imaging of Normal and Pathologic Intracranial Structures

The overall feasibility of 3-D imaging for intracranial soft tissuesdepends on three vital areas: the display method, the display options,
and the image processing system.
Color 3-D Imaging of Normal andPathologic Intracranial Structures
Edward J. Farrell, IBM Thomas J. Watson Research Center
Rosario Zappulla, Mt. Sinai Medical Center and Mt. Sinai School of Medicine
Wen C. Yang, Beth Israel Medical Center and Mt. Sinai School of Medicine
Three-dimensional imaging is potentially useful inseveral medical areas. This is particularly true in thestudy of the central nervous system, where the localiza-tion of anatomical structures is based on very specificreferences to planar coordinates. Similarly, the diagnosisand location of structural abnormalities of the centralnervous system (i.e., tumor and vascular) require aspecific reference to the position of the abnormality withrespect to the surrounding anatomical structure. Conse-quently, a physician can improve his concept of theshape and size of the abnormality and can discuss anddescribe the scans with colleagues on the basis of a com-mon visible image of the 3-D relationships. In addition,3-D images better reflect what is actually seen duringsurgery than a series of black-and-white scan images.Therefore, a 3-D representation of the anatomy of theinvolved area permits better preoperative planning of asurgical approach.
Three-dimensional imaging has been applied to severalspecific areas with significant results. It has been suc-cessfully used by Vannier and Marsh for craniofacialsurgical planning and evaluation on more than 400patients.'"3 Vannier, Gado, and Marsh have also appliedtheir method to assess intracranial soft-tissue structures.4Dev, Wood, White, Young, and Duncan have in-vestigated an interactive graphics system for planningreconstructive surgery;5 the results of the 3-D reconstruc-tion have been used to drive a milling machine and pro-duce a skull model. Three-dimensional imaging has beenused to evaluate spinal surgery and disk disease6'7 andthe foot following surgical repair.8 Rose, Jacobs, Cook,and Rozran have used 3-D imaging methods to examinefractures in the lower extremities of 10 patients.9 Variousstages of healing were investigated with histograms, CTcross sections, and 3-D reconstructions. In addition todisplaying physical structures, 3-D imaging has been used
to display radiation beams'°0"1 and isodose surfaces 12"3for radiation therapy planning. Recently, the 3-D recon-struction methods used for CT scans have been appliedto NMR'4 and ultrasound.'5",6
The basic imaging approach of other investigators isbased on locating the surface of a structure in 3-D andthen projecting the surface onto a 2-D image plane usinghidden-surface removal, shading, transparency, etc. Astandard method of locating the surface is to first locatesurface edges in each slice plane. This is done manuallywith a coordinate digitizer'2 or by automatically using anedge extraction algorithm with editing.5 The structuresurface is formed in 3-D by placing planar surfaceelements between the contours.'5 An alternative methodof locating the surface of a structure in 3-D is based on acontrolled search.'7 The result is a set of connected cubicelements in the data space. This cubic approach hasseveral computational advantages.'8 The approachpublished elsewhere by Farrell is fundamentally differentfrom these surface-based approaches;'9 rather than try-ing to isolate the surface of a structure, the objective is tointeractively interpret the 3-D relationship of data valueranges using different colors. The approach can imagevery complex convoluted structures that may have dis-joint parts. Computations needed for hidden-objectremoval, shading, transparency, cutout, projectiondirection, contour lines, and stereo are simple. The ap-proach results in a very fast, interactive method to inter-pret the position, size, and shape of 3-D structures in CTscan data. Therefore, Farrell's approach is used for thestudies presented in this article.The object of this investigation is to determine the
overall feasibility of 3-D imaging for intracranial softtissues, both normal and pathologic. This involves thedisplay method, display options, and image processingsystem that together permit the user to dynamically in-
0272-1716/84/0900-0005$01.00 C 1984 IEEESeptember 1984 5

(lb) Original CT scan.
(1c) Colored-range image of (a). (1 d) Colored-range image of (b).
Figure 1. Original scan images (a, b) and images based on colored ranges (c, d). Yellow points correspond to high-density regions (bone),and red points correspond to low-density regions (ventricles, edema).
(la) Original CT scan.
IFFE ( Ci&A6

teract with the data and accurately perceive the shape,size, and interrelationship of the various structures.Because of the complex shape and interrelations of thedifferent structures, a single presentation mode is notsufficient. Display options are needed to clarify theperception of the three-dimensional relationships. Theoptions, selected by interacting visually with the image ofthe 3-D structures on a high-resolution color monitor, in-clude the selection of effective colors.
In addition to structure perception, computation anddata storage requirements are also important aspects inevaluating feasibility. For clinical applications, it is oftendesirable to have a short response time-five to 10seconds-in order to try several image options and op-timize the visibility of the interesting structures. Further-more, the method, options, and system are strongly in-terdependent. The speed of a method depends on theprocessor speed and its data handling capabilities. Theavailability of different options depends on the optionsin the processor for data handling, masking, and storage.The overall speed and storage requirements for the pro-cessor depend on the data volume and the approach usedfor 3-D imaging. In this study, all three components ofoverall feasibility are considered: display method, op-tions, and image processing system. Clinical cases areused to illustrate the feasibility of 3-D imaging of normaland pathologic soft tissue.
Display method
The colored-range method is used to represent the CTscan data in three-dimensional space. The method isbased on the representation of all points whose values liein a specified range as a single color. For example, allpoints whose values lie between 10 and 57 are representedas red points, and all points whose values lie between 79and 105 are represented as green points. The 3-D dataspace then consists of groups or regions of coloredpoints. A two-dimensional image is obtained by takingslices through the colored ranges in the 3-D space; thedirection of the slices is determined by the specified pointof view. These colored slices are sequentially projectedonto the CRT display; they are offset diagonally to forman oblique projection of the colored ranges. The distanceof the slices from the observer is indicated by making col-ors lighter or darker: closer points have lighter colors ofthe same hue, e.g., lighter red and lighter green. Thecolored-range method has been described in detail byFarrell."9 The back-to-front increase in lightness resultsin pseudo shading.20
Figures la and lb contain two CT scans of a patientwith a ruptured arteriovenous malformation of the righttemporo-parietal lobe. The data consists of 26 transaxialscans taken with overlapping 10-mm slices and a 10-mmbeam collimator. The high-density lesion representshemorrhage as well as blood in the aneurysmal dilatationof the artery. In addition, an area of low density sur-rounds the pathologic area extending to the ventricularwall and represents edema. In Figures Ic and Id the col-ored ranges are shown with yellow corresponding tobone and red corresponding to low-density regions such
as cerebrospinal fluid inside the ventricles. The cor-
responding 3-D image is shown in Figure 2. The details ofthe data processing and management are discussed in thesection on the image processing system. The object at thelower left outside the skull is the headrest.The colored-range approach has four advantages.
First, different structures can be displayed with differentcolors. Second, as successive slices are overlaid on theCRT display, the relative position and size of variousstructures can be interpreted; information is obtainedduring the development of the final 3-D image. Third, itis fast, since the shading is not based on the computationof surface normals with light-source and viewer direc-tions. Also, the speed does not depend on which optionsare used (except for stereo, since two images are formed).The fourth key advantage of this approach is that dataneed not be continuous. Very irregular surfaces can bedisplayed as well as a disjoint collection of points. Withstereo, a cluster of colored points can be easily relatedspatially to other structures. The 3-D paths of vesselsfilled with contrast medium have been imaged eventhough there are only a few points in each transaxial sec-tion. The colored-range method is similar to a z-bufferapproach; the z position is implied in the order in whichthe data is stored.2'
Figure 2. A three-dimensional image is based on the colored-rangemethod. This image is based on the same data used In Figure 1.
September 1984 7

Color selection. Using color to display intracranialstructures has the advantage that several structures canbe displayed using different colors. In addition, a colordisplay has greater information capacity than a mono-chromatic display; each display point has three attributeswith color (hue, lightness, and saturation) and only oneattribute with a monochromatic display (lightness).However, color must be selected carefully for a clear andaccurate display of the structures.Each structure is displayed with a sequence of colors,
dark in back and light in front. The best color sequencefor a clear display of a structure depends on its shape andrelation to other colored structures. The perception of acolor is influenced by the surrounding colors. The userselects colors in terms of perceptual parameters: hue,lightness, and saturation (HLS). The transformationfrom HLS to operational variables of red, green, andblue for display on the CRT is described by Farrell."9Two sets of HLS values are required for each colored
range, a rear set and a front set. Linear interpolation isused to form the color sequence for successive slices. Inthe current system, the user selects an endpoint HLSvalue that he wants to change and makes the change withthe joystick. Joystick deflections in the x directionchange hue, and deflections in the y direction changelightness. Saturation is entered numerically; it is not veryinfluential in improving shape perception. The imagecolors change rapidly with a joystick deflection, since thecolor lookup table can be changed rapidly. Joystick en-try is very effective, since colors are selected visually onthe basis of structure shapes and their spatial relation-ship.
Display options
Because of the complex shape and interrelations ofvarious structures, a single presentation mode is not suf-ficient. Display options are used to enhance the percep-
tion of the three-dimensional relationships for the struc-tures of interest. Seven options are used interactively toimprove the interpretation of size, shape, and position:
0
0
S
6
S
S
S
colored ranges for multiple structures,point of view,angle of oblique projection,cutout,transparency,contours, andstereoscopy.
Using colored ranges to display multiple structures is abasic option of the method. As shown in Figure 2, theskull and ventricles are displayed as different colors.They can be displayed together as well as separately.Point of view is also important. The user can specify
the direction and location of the reconstructed imageplanes. Changing the direction changes the effectivepoint of view. Subsequently, by changing the directionand amount of offset per slice, small changes (less than20 degrees) in the viewpoint can be quickly made. Figure3 uses the same data as Figure 2 but is viewed from thesagittal direction, from the left side. The ventricularsystem (V) and some cerebrospinal fluid cisterns (C) arewell represented in this view. The left lateral ventricle(foreground), the right ventricle behind it, as well as thethird and fourth ventricles can be seen. Also seen in thebackground is the edema (E) behind the body of theright lateral ventricle. Only the central portion of thehead is imaged to limit the display to structures of in-terest. The object at the upper right is the headrest. Therotation is done in the host computer to form a series ofimage planes for the sagittal direction. Details of the pro-cessing will be described later.Changing the point of view can help to obtain a clear
perception of the size, shape, and position of apathology relative to normal structures. Figure 4 con-
Figure 3. A three-dimensional Image from a sagittal viewpoint (V, ventricular system; C, cistern; E, edema). The Image isbased on the same data used in Figure 2, rotated to form a sagittal view from the left side.
IEEE CG&A8

(4c) Sagittal image.
(4a) Original CT scan.
(4b) Original CT scan. (4d) Coronal image.Figure 4. An image of a meningioma at the left cerebropontine angle extends into the upper cervical spinal canal. (a) and (b) are originalCT scans. (c) and (d) are 3-D reconstructed sagittal and coronal images viewed 20 degrees from the left.
September 1984 9

tains images of a meningioma at the base of the skullfrom a sagittal view looking left and a coronal view look-ing forward. The data consists of 23 scans taken 5 mmapart with a 5-mm beam collimator. The bone is imagedin yellow and the meningioma in red; its extension intothe spinal canal can be clearly seen. The mandible,palate, and nasal septum can be seen in the sagittal view.In the coronal view the front of the head was not imaged.Three additional views are shown on the cover of thismagazine. In the rear view, meningioma can be seenthrough a craniotomy. The lateral views show how acomputer-generated skull cutout was used to expose thetumor under the skull. Because of the scanning-beamwidth, data points near the skull surface will reflect thedensity of bone and surrounding tissues. These pointshave apparent density values in the same range as thoseof the meningioma and appear as a red covering over thebone. Beam width is the major cause of reduced resolu-tion in sagittal and coronal views.The cutout, transparency, and contour options yield
new information that cannot be obtained from a singleimage regardless of the point of view. This is illustratedwith a detailed study of a patient with a calcified gliomain the right frontal lobe (Figures 5 and 6). The scan dataconsists of 13 scans taken 10 mm apart with a 10-mmbeam collimator. Figure 5 is a scan through the center ofthe glioma at the level of the frontal horns of the lateral
Figure 5. CT scan of a calcified glioma. The transverse scan was taken at ventricles. Note the glioma with edema and its relation-the level of frontal horns of the lateral ventricles. ship to the left frontal horn. Since the structures of in-
Figure 6. 3-D images of acalcified glioma, skull, andedema.
(6a) Skull (S, eye socket; F, mid-dle fossa; C, calcification).
to~ IEEE CG&A00
I10 IEEE CG&A

(6b) Glioma and skull (G, glioma;S, eye socket).
(6c) Glioma, skull, ventricles,and edema (E).
September 1984 I1I

terest lie in the upper half of the scans, only that portionis selected for use in the imaging. The use of subimagescan significantly reduce the computer processing time re-quired to obtain a 3-D image.Three colored ranges are used in Figure 6 to display the
skull, glioma, the right frontal horn, and edema from acoronal point of view seen from behind. The eye socket(S) and the floor of the frontal and middle fossa (F) areseen in the skull image and serve as a base of referencefor positioning the glioma. The left side of the skull is cutout to show the vertical location of the glioma (G) inrelation to the eye socket (S). A red color is used todisplay the glioma with its tentacle-like structures. Notethat the dense center of the glioma (calcification, C) has.the same density as the bone in the skull image. (Acutout is formed using a write mask; on each slice nearthe observer a mask with zeros in the selected region isused. The mask can be rectangular or circular, or it canbe entered with the joystick.) The ventricle and edema(E) are displayed in a transparent gold color to showtheir relation to the tumor without obstructing its presen-tation. (Transparency is formed by writing alternate im-age points in a checkerboard manner. This methodresults in a true admixture of colors. Prior approachesused a third color to represent the transparent mixture ofthe front and rear colors.'2'21) Note that the edema isanterior to the glioma and wraps around it. This is con-sistent with the 2-D scan image in Figure 5. These imagesalso demonstrate that color is essential to form a 3-D im-age involving several structures.
In Figure 7, contour lines give the observer a quan-titative measure of the height and width of the gliomaand its position relative to the skull. (Contour lines areformed by using a contrasting color in selected rows andcolumns of each 2-D image. The contrasting colors ap-pear as surface contours after forming the oblique pro-jection.) These options can also be useful in surgicalplanning, e.g., planning the bone flap and extent ofsurgical extension. Also for planning, a 3-D image can beformed from a surgical viewpoint. The glioma is imagedfrom a near sagittal view as seen from outside the head.A sequence of circular cutouts 40 mm in diameter are im-aged. The cutouts correspond to 30, 40, and 50 mm in-ward from the surface of the skull (see Figure 8). Notethe high-density calcified region (C) in the center of theglioma (G). The edema (E) is displayed as a dark,transparent red region behind the glioma. The bridge ofthe nose is at the lower right. The edema appears aroundthe glioma.For complex interrelated structures, stereoscopy is a
useful option. A stereoscopic pair is generated by form-ing two images with different horizontal angles ofoblique projection, usually 10 to 15 degrees apart. Areflecting stereoscope is used to view the images, orcross-eyed viewing will work. This method can be usedwith any monitor without modification. Methods usingPLZT electro-optical shutters on eyeglasses require theleft and right images to be alternately interlaced on thescreen.22 Also, PLZT shutters have a maximum lighttransmission of only 17 percent.
These patient studies illustrate the utility of variousdisplay options. Other patient studies yielded similar
results. The option used depends on what the user is in-vestigating. Clearly, a single display method does notallow the user to fully perceive the spatial interrelation-ships.
Image processing system
The image processing system has two basic com-ponents: the host computer and the image processingworkstation. The host performs data file management,selection of subimages, initial data smoothing, and 3-Ddata rotation. The workstation provides interactive 3-Dimaging with oblique projection, data cutout, trans-parency, smoothing, and color selection. For this studythe host computer is an IBM 370/168. The workstation isan IBM 7350 image processing system. The 7350 consistsof a color display monitor, a conversational monitor,and a control unit. The control unit is channel attachedto the host under standard VM support. Images areformed in a refresh buffer; the buffer entries aretransformed by a color lookup table and sent to the colormonitor, a 1024 x 1024 CRT with five bits for each color(red, green, blue). The color lookup table has 4096 en-tries. (To change a colored range used for a particularstructure with the joystick requires changes to only 100entries.) Our 7350 has six working-storage buffers of onemegabyte each; the refresh buffer is two megabytes.While transferring data between buffers, the image pro-cessor arithmetic logic unit can be used to do 16-bitarithmetic and Boolean operations on multiple buffer in-puts. Also, buffer data can be transformed with lookuptables before or after processing and transfer. The 7350has several window, mask, and selected-write featuresthat make it well suited to 3-D imaging applications. AMatrix color graphic camera attached to the colormonitor captures images for hard-copy output.A key problem in developing the image processing
software is to determine an effective distribution ofstorage and process between the host and image process-ing workstation. The following description pertains tothis study; a different system may require a differentdistribution of functions. The display software MDIPS iswritten in VS Fortran.
Host functions. As the scan frames are loaded into ac-tive memory, several operations can be performed. Thefirst and last frame numbers to be loaded are specifiedand a subimage can be selected. These two options cansignificantly reduce the storage used and the time re-quired to form an image in the 7350. The time requiredto form an image is directly proportional to the numberof picture elements. (All of the 2-D scans used in thisstudy are data arrays of 250 x 312 pixels.) This optionwas used in the glioma study and halved the imagingtime. Also, selecting a subimage clarifies the 3-D imageby eliminating objects that are not of interest. Thesubimages can then be smoothed. All of the data usedhere was smoothed with a 3 x 3 moving local average toreduce speckle noise. Since three points correspond to
IEEE CG&A12

approximately 2 mm, the structures of interest are notsignificantly distorted by the smoothing. This smoothingis required to reduce artifacts in a rotated view. For ex-ample, any transient value in the red threshold range ap-pears as a red point in a transaxial image, but it appearsas a red line in the sagittal view. The line length equalsthe beam width.
In some cases the input data may include only a fewscan frames; the reconstructed 3-D image will then ap-pear as discontinuous planes. Frames can be insertedwith linear interpolation. (For the images in this article,frame averaging was not used.) The resulting sequence ofscan frames is saved, forming the base for subsequentoperations. These images are a three-dimensional arrayof data with which the user interacts in terms of physicaldimensions, i.e., millimeters.The viewpoint can be changed by forming a new series
of scan frames corresponding to specified values ofazimuth and elevation viewing angles. The values at thepoints in the new scan frames are the values at the cor-responding closest points (toward the origin) of the inputscan frames. The user also specifies the number of newframes to be formed and the radial positions of the firstand last scan frames relative to the center of the data. Asthe new scans are formed, they are transmitted to the7350 and are not stored in the host. The elapsed timeranges from 15 to 30 seconds, depending on the host'suser load. The volume of data for these new scans can besignificantly greater than the original data volume. At
any step of 3-D image display and interpretation, theuser can request a new set of scans from the host.
Workstation functions. In the 7350 the 2-D scans canbe reviewed individually or in a rapid, animated fashion.Since all of the scan data is resident in the 7350 storagebuffers, 3-D images can be formed in 10 to 20 seconds.The options of cutout, transparency, and contour linesdo not increase the display time, since they are based onmasking functions performed in parallel with the imag-ing. These options, the thresholds for the colored ranges,and the angles for the oblique projection are entered viafull-screen menus. The angles of oblique projectiondetermine where successive frames are positioned as the3-D image is formed. By changing these angles, smallchanges are obtained in the effective viewpoint; to makelarge changes, a new set of slices must be formed in thehost. The image processor arithmetic logic unit can beused to smooth the scans and reduce the beam-widthstaircase artifact in sagittal or coronal views. The datawas smoothed with a moving local average over a 3 x 5region for a 5-mm beam and over 3 x 8 regions for a10-mm beam. A 3 x 5 region corresponds to 2.2 mm by3.7 mm, a 3 x 8 region to 2.2 mm by 5.9 mm.
Comparison of several approaches
Investigators take different approaches to 3-D imagingon the basis of their medical imaging requirements and
Figure 7. Image of a calcifiedglioma with contour lines.
September 1984 13
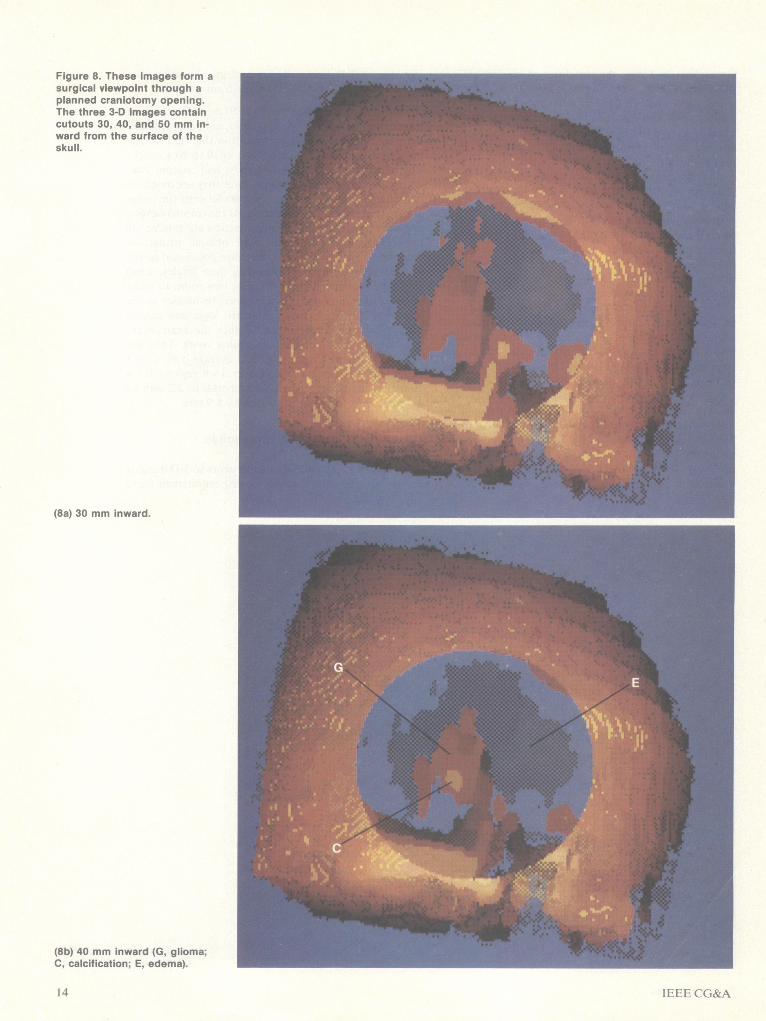
Figure 8. These images form asurgical viewpoint through aplanned craniotomy opening.The three 3-D images containcutouts 30, 40, and 50 mm in-ward from the surface of theskull.
(8a) 30 mm inward.
(8b) 40 mm inward (G, glioma;C, calcification; E, edema).
IEEE C G&A14

(8c) 50 mm inward.
display systems. The approach taken by Vannier, Marsh,and Warren is to use a standard CT scanner for process-ing and displaying raster gray-level 3-D images.t'2'8 Asimple threshold method is used effectively for planningand evaluation of craniofacial surgery. Reconstructionof a complete set of soft-tissue and bone contours re-quires approximately 10 minutes for a sequence of 40scans. A CADD system is also used; the major advan-tages are interactivity, measurement quantification, andmultiple image manipulation. Udupa also approaches3-D imaging with processing on a minicomputer in theCT scanner setup."8 The cuberille method that he uses tolocate surfaces has several computational advantages forhidden-surface removal, shading, and transparency. Oneto two minutes are required to form a 256 x 256 imagewith hidden-surface removal and shading when a DataGeneral Eclipse S200 machine and a Comtal 8000 displayprocessor are used. Images are displayed on a gray-levelmonitor. The approach taken by Cook, Dwyer, Batnit-zky, and Lee is to outline the structures of interest sliceby slice manually.'2 Tiled surfaces are formed by usingtriangular elements. A colored image of the 3-D surfacesis based on a hidden-surface algorithm with shading; sur-faces can be displayed transparently. This approach re-quires large-scale computations and consequently ap-pears less suitable for interactive structure interpretation.Meagher has implemented a solids imaging method basedon octree encoding.23 With a special-purpose computer,
very rapid 3-D rotations are performed, e.g., 72 CT scanseach 320 x 320 pixels rotated in one second.The approach taken in this investigation is to use an
image processing workstation and a color monitorcoupled directly to a host computer, and it offers severalbasic advantages. Since all of the scan data for each pa-tient study is stored locally in the workstation memory,images of multiple structures can be formed in secondsinstead of minutes. A wide range of options can be usedinteractively to clarify the interrelations of complexstructures. With a multiple workstation system, severalusers can image scans at different locations. Varioustypes of scans (CT, NMR, ultrasound) can be examinedsimultaneously for a wide variety of applications, such asdiagnosis, surgical planning, treatment evaluation, andradiation therapy planning. The host acts as a centralnode for data management and storage, providing an ef-fective means of communicating images between dif-ferent locations. With image processing in a workstationsystem, the scanning system remains available for patientscanning.The colored-range method described above is well
suited to an approach using a workstation. The basic im-age functions involve simple masking, logic, and arith-metic operations. An image of multiple 3-D structurescan be displayed in a few seconds. Options oftransparency, cutout, or contour lines do not increasethe display time, since they are formed by using masks.
September 1984 1 5

The software also has options to display the originalscans in eight-bit monochrome or pseudo color. Aselected scan is displayed, or all of the scans are sequen-tially displayed in a rapid animation fashion. A contrast-enhancing transformation is also an option with joystickentry. The studies presented above illustrate the overallfeasibility of the colored-range method, display options,and workstation processing system.The clinical examples presented in this article em-
phasize the increased diagnostic utility of CT scan datawhen processed to produce a 3-D representation. Sincethe technique produces 3-D localization of abnormalitiesin a single image, the time and error inherent in compar-ing multiple 2-D CT images for localization aresignificantly reduced. This permits physicians to discussmore concretely and exactly the location and extent ofabnormality. The 3-D images presented above are basedon CT scans 5 or 10 mm wide. The quality of the 3-Dreconstructions is significantly improved with finer slices,e.g., 2 or 1.5 mm. The time needed to form a 3-D imageis proportional to the number of slices. In clinical prac-tice, fine slices are used to image small structures; 20 to30 can cover the region of interest. Hence, the total timeneeded to form a 3-D image based on fine slices (smallstructures) is comparable to the time required for wideslices (large structures).The ability to chromatically separate structures on the
basis of density ranges is valuable for selectively studyingthose structures of interest (signal) while not beingdistracted by surrounding structures (noise). In addition,the type of a structural abnormality, for example tumoror vascular, can be highlighted with this technique, andthis can be of value when planning surgical biopsy.Of particular importance is the potential of this tech-
nique for preoperative planning. As illustrated in Figure7, the extent of craniotomy and the expected depth ofsurgical excision can be mapped out prior to surgery.This would be an important adjunct to surgical ar-mamentarium, which has increased in sophistication overthe last decade. U
Acknowledgments
Discussions with C. N. Liu of IBM and his assistanceduring the course of our study added materially to thisarticle, and we appreciate his contribution. Mike Felix,John Fritz, and Walt Schmid of IBM provided valuableassistance with the installation of the IBM 7350 systemand program implementation. A. Zinger of IBM alsomade a helpful contribution during the initial phase ofthis study. Steve Fasman assisted with the programmingof the three-dimensional rotation function in the host. Aportion of image display development was supported bythe National Science Foundation University/IndustryJoint Research Grant ECS80-17683 with the Universityof Rochester, New York. For this grant, C. N. Liu andRobert Wagg of the University of Rochester are the prin-cipal investigators.
References
1. M. W. Vannier, J. L. Marsh, W. G. Stevens, and D. M.Dye, "Surface Reconstruction and Computer-AidedDesign of Craniofacial Surgical Procedures Based on CTScans," Proc. Fifth Ann. Conf. Nat'l Computer GraphicsAssoc., Vol. II, 1984, pp. 116-130.
2. M. W. Vannier, J. L. Marsh, and James 0. Warren,"Three Dimensional Computer Graphics for CraniofacialSurgical Planning and Evaluation," Computer Graphics(Proc. Siggraph 83), Vol. 17, No. 3, 1983, pp. 263-273.
3. J. L. Marsh and M. W. Vannier, "The Third Dimension inCraniofacial Surgery," Plastic Reconstructive Surgery,Vol. 71, No. 6, 1983, pp. 759-767.
4. M. W. Vannier, M. H. Gado, and J. L. Marsh, "Three-Dimensional Display of Intracranial Soft-Tissue Struc-tures," Am. J. Neuroradiology, Vol. 4, No. 5, 1983, pp.520-521.
5. P. Dev, S. Wood, D. N. White, S. W. Young, and J. P.Duncan, "An Interactive Graphics System for PlanningReconstructive Surgery," Proc. Fourth Ann. Conf. Nat'lComputer Graphics Assoc., 1983, pp. 130-135.
6. G. Herman, "Application of Three-Dimensional Com-puter Graphics to Surgical Planning and Evaluation," Pro-c. Fifth Ann. Conf. Nat'l Computer Graphics Assoc., Vol.II, 1984, pp. 66-74.
7. G. Herman and C. G. Coin, "The Use of Three-Dimen-sional Computer Display in the Study of Disk Disease," J.Computer Assisted Tomography, Vol. 4, No. 4, 1980, pp.564567.
8. J. L. Marsh and M. W. Vannier, "Surface Imaging fromComputerized Tomographic Scans," Surgery, Vol. 94, No.2, 1983, pp. 159-165.
9. B. Rose, R. R. Jacobs, L. Cook, and R. Rozran, "Com-puter Graphic Analysis of Computed Tomograms in BoneHealing," Proc. Fourth Ann. Conf. Nat'l ComputerGraphics Assoc., 1983, pp. 94-97.
10. P. Bloch and J. K. Udupa, "Application of ComputerizedTomography to Radiation Therapy and Surgical Plan-ning," Proc. IEEE, Vol. 71, No. 3, 1983, pp. 351-355.
11. D. L. McShan, S. Moffitt, and A. S. Glicksman, "Com-puter Graphics for Radiotherapy Treatment Planning,"Proc. Fifth Ann. Conf. Nat'l Computer Graphics Assoc.,Vol. II, 1984, pp. 88-95.
12. L. T. Cook, S. J. Dwyer III, S. Batnitzky, and K. R. Lee,"A Three-Dimensional Display System for Diagnostic Im-aging Applications," IEEE Computer Graphics and Ap-plications, Vol. 3, No. 5, Aug. 1983, pp. 13-19.
13. G. T. Y. Chen, S. Pitluck, and T. Richards, "Three-Dimensional Graphics in Radiation Therapy," Proc. FifthAnn. Conf. Nat'l Computer Graphics Assoc., Vol. II,1984, pp. 61-65.
14. L. Axel, G. T. Herman, J. K. Udupa, P. A. Bottomley,and W. A. Edelstein, "Three-Dimensional Display ofNuclear Magnetic Resonance (NMR) Cardiovascular Im-ages," J. Computer Assisted Tomography, Vol. 7, No. 1,1983, pp. 172-174.
15. M. W. Vannier, G. L. Melson, and J. Barbier, "Efficient3-Dimensional Surface Reconstruction from Real TimeB-Scan Mode Sonography," J. Ultrasound in Medicine,Vol. 2, No. 10, 1983, p. 72.
16. E. J. Farrell, C. N. Liu, R. C. Waag, and R. M. Lerner,"Color Display of Three Dimensional Ultrasound Data,"J. Ultrasound in Medicine, Vol. 2, No. 10, 1983, p. 70.
IEEE CG&A16

17. E. Artzy, G. Frieder, and G. T. Herman, "The Theory,Design, Implementation and Evaluation of a Three-Dimensional Surface Detection Algorithm," ComputerGraphics (Proc. Siggraph 80), Vol. 14, No. 3, 1980, pp.2-9.
18. J. K. Udupa, "Display of 3D Information in Discrete 3DScenes Produced by Computerized Tomography," Proc.IEEE, Vol. 71, No. 3, 1983, pp. 420-431.
19. E. J. Farrell, "Color Display and Interactive Interpretationof Three-Dimensional Data," IBM J. Research and Devel-opment, Vol. 27, No. 4, 1983, pp. 356-366.
20. N. 1. Badler, J. O'Rourke, and H. Toltzis, "A SphericalRepresentation of a Human Body for Visualizing Move-ment," Proc. IEEE, Vol. 67, No. 10, 1979, pp. 1397-1403.
21. P. R. Atherton, "A Method of Interactive Visualization ofCAD Surface Models on a Color Display," ComputerGraphics (Proc. Siggraph 81), Vol. 15, No. 3, 1981, pp.279-287.
22. J. A. Roese, L. E. McCleary, and A. S. Khalafalla, "3-DComputer Graphics Using PLZT Electro-optic Ceramics,"SID Int'l Symp. Digest Tech. Papers, 1978, pp. 16-17.
23. D. J. Meagher, "Interactive Solids Processing for MedicalAnalysis and Planning," Proc. Fifth Ann. Conf. Nat'lComputer Graphics Assoc., Vol. II, 1984, pp. 96-106.
Edward J. Farrell is a research and staffmember at the IBM Thomas J. WatsonResearch Center. From 1959 to 1964 andfrom 1966 to 1968, he was with Univac.Farrell was at the Research Division ofControl Data Corporation from 1964 to1966. His current interests include display
~ tand interpretation methods for multidi-mensional data, animation, color selectionfor displaying scientific data, menu and
computer interface, and workstation and system design. Hereceived his BS from the University of Minnesota with a majorin physics and subsequently completed his doctoral course workin mathematical statistics.
Farrell's address is IBM Thomas J. Watson Research Center,PO Box 218, Yorktown Heights, NY 10598.
R. A. Zappulla is an assistant professor inthe Department of Neurosurgery at TheMount Sinai Medical Center. His researchinterests include electrophysiology, and heis presently involved in computer-aided ac-quisition and analysis of electrophysio-logic responses to sensory stimulation.This work is being carried out for clinicaldiagnosis as well as for assessment ofblood brain barrier disruption.
Zappulla received a BA in biology from the Seton HallUniversity and an MD from the University of Maryland.Recently, he received his PhD in psychology from The City Col-lege of The City University of New York. He is a member ofseveral groups, including the American Association of Neuro-logical Surgeons.
Zappulla's address is Neurosurgery Department, Mt. SinaiMedical Center and Mt. Sinai School of Medicine, New York,NY 10029.
Wen C. Yang is chief of neuroradiology atthe Beth Israel Medical Center, New York,and an associate professor of radiology atthe Mount Sinai School of Medicine, CityUniversity of New York. His current re-search interests include computed tomog-
_ raphy of the head, neck, and spine. Yangis a graduate of National Taiwan Univer-sity and has received formal training ingeneral radiology and neuroradiology in
the US. He is a member of the American Society of Neuro-radiology, the Radiological Society of North America, theAmerican College of Radiology, and the American RoentgenRay Society.
Yang's address is Beth Israel Medical Center, 10 Nathan D.Perlman Place, New York, NY 10003.
OFII~
Contributions explore the cutting edgeof the CAD/CAM field, with emphasison integrated design systems. Publishedproceedings incorporates the top 40 sub-mitted papers, as judged by reviewersand the Program Committee. Topics in-clude testing, simulation, physicaldesign, systems design, and software andarchitectural design automation.
Order #542Proceedings 1984 ACM IEEE
Design Automation ConferenceJune 25.27,1984
Nonmembers-$60.00Members-$30.00
Handling charges extraOrder from IEEE Computer Society
Order Dept.PO Box 80452, Worldway Postal Center
Los Angeles, CA 90080 USA(714) 821-8380
September 1984 17