Photosynthetic acclimation of Nannochloropsis oculata investigated by multi wavelength chlorophyll...
37
Accepted Manuscript Photosynthetic acclimation of Nannochloropsis oculata investigated by multi- wavelength chlorophyll fluorescence analysis Milán Szabó, Kieran Parker, Supriya Guruprasad, Unnikrishnan Kuzhiumparambil, Ross McC. Lilley, Bojan Tamburic, Martin Schliep, Anthony W.D. Larkum, Ulrich Schreiber, John A. Raven, Peter J. Ralph PII: S0960-8524(14)00890-6 DOI: http://dx.doi.org/10.1016/j.biortech.2014.06.046 Reference: BITE 13580 To appear in: Bioresource Technology Received Date: 18 March 2014 Revised Date: 11 June 2014 Accepted Date: 13 June 2014 Please cite this article as: Szabó, M., Parker, K., Guruprasad, S., Kuzhiumparambil, U., Lilley, R.M., Tamburic, B., Schliep, M., Larkum, A.W.D., Schreiber, U., Raven, J.A., Ralph, P.J., Photosynthetic acclimation of Nannochloropsis oculata investigated by multi-wavelength chlorophyll fluorescence analysis, Bioresource Technology (2014), doi: http://dx.doi.org/10.1016/j.biortech.2014.06.046 This is a PDF file of an unedited manuscript that has been accepted for publication. As a service to our customers we are providing this early version of the manuscript. The manuscript will undergo copyediting, typesetting, and review of the resulting proof before it is published in its final form. Please note that during the production process errors may be discovered which could affect the content, and all legal disclaimers that apply to the journal pertain.
Transcript of Photosynthetic acclimation of Nannochloropsis oculata investigated by multi wavelength chlorophyll...
Accepted Manuscript
Photosynthetic acclimation of Nannochloropsis oculata investigated by multi-wavelength chlorophyll fluorescence analysis
Milán Szabó, Kieran Parker, Supriya Guruprasad, UnnikrishnanKuzhiumparambil, Ross McC. Lilley, Bojan Tamburic, Martin Schliep,Anthony W.D. Larkum, Ulrich Schreiber, John A. Raven, Peter J. Ralph
PII: S0960-8524(14)00890-6DOI: http://dx.doi.org/10.1016/j.biortech.2014.06.046Reference: BITE 13580
To appear in: Bioresource Technology
Received Date: 18 March 2014Revised Date: 11 June 2014Accepted Date: 13 June 2014
Please cite this article as: Szabó, M., Parker, K., Guruprasad, S., Kuzhiumparambil, U., Lilley, R.M., Tamburic, B.,Schliep, M., Larkum, A.W.D., Schreiber, U., Raven, J.A., Ralph, P.J., Photosynthetic acclimation ofNannochloropsis oculata investigated by multi-wavelength chlorophyll fluorescence analysis, BioresourceTechnology (2014), doi: http://dx.doi.org/10.1016/j.biortech.2014.06.046
This is a PDF file of an unedited manuscript that has been accepted for publication. As a service to our customerswe are providing this early version of the manuscript. The manuscript will undergo copyediting, typesetting, andreview of the resulting proof before it is published in its final form. Please note that during the production processerrors may be discovered which could affect the content, and all legal disclaimers that apply to the journal pertain.
1
Photosynthetic acclimation of Nannochloropsis oculata investigated by multi-
wavelength chlorophyll fluorescence analysis
Milán Szabóa,*, Kieran Parkera, Supriya Guruprasada, Unnikrishnan Kuzhiumparambilb,
Ross McC. Lilleya, Bojan Tamburica, Martin Schliepa, Anthony W.D. Larkuma, Ulrich
Schreiberc, John A. Ravena,d, Peter J. Ralpha
aPlant Functional Biology and Climate Change Cluster, University of Technology
Sydney, Broadway NSW 2007 Australia
bCentre for Forensic Science, University of Technology Sydney, Broadway NSW 2007
Australia
cJulius-von-Sachs Institut für Biowissenschaften, Universität Würzburg, Julius-von-
Sachs Platz 2, 97082 Würzburg, Germany
dDivision of Plant Sciences, University of Dundee JHI, The James Hutton Institute,
Invergowrie, Dundee DD2 5DA, UK1
1Permanent address of John A. Raven
*Corresponding Author. Milán Szabó, Plant Functional Biology and Climate Change
Cluster, University of Technology, Sydney, PO Box 123, Broadway NSW 2007
Australia, email: [email protected], Phone: +61-2-9514-4162
2
Abstract
Multi-wavelength chlorophyll fluorescence analysis was utilised to examine the
photosynthetic efficiency of the biofuel-producing alga Nannochloropsis oculata,
grown under two light regimes; low (LL) and high (HL) irradiance levels. Wavelength
dependency was evident in the functional absorption cross-section of Photosystem II (σII
(λ)), absolute electron transfer rates (ETR(II)), and non-photochemical quenching
(NPQ) of chlorophyll fluorescence in both HL and LL cells. While σII(λ) was not
significantly different between the two growth conditions, HL cells upregulated ETR(II)
1.6 to 1.8-fold compared to LL cells, most significantly in the wavelength range of 440-
540 nm. This indicates preferential utilisation of blue-green light, a highly relevant
spectral region for visible light in algal pond conditions. Under these conditions, the HL
cells accumulated saturated fatty acids, whereas polyunsaturated fatty acids were more
abundant in LL cells. This knowledge is of importance for the use of N. oculata for fatty
acid production in the biofuel industry.
Keywords: biofuels, chlorophyll fluorescence, Nannochloropsis spp., non-
photochemical quenching, photosynthetic electron transport rate
3
1. Introduction
Industrial scale production of microalgae for biofuels requires that the culture
conditions are maximised for both growth rate and biomass. A critical factor in
optimising these two is the quantity and quality of the light incident on the culture. This
imposes constraints on the configuration of outdoor ponds and enclosed
photobioreactors, as well as the geographical location of the pond. Other important
factors are mixing, aeration, carbon dioxide delivery and supply of nutrients. Many
configurations have been tested for industrial production, the most successful and highly
developed of which is the raceway-type pond (Rogers et al. in press).
Understanding the plasticity of algal physiology and photosynthetic capability under
variable incident irradiances is essential to predict the utility of candidate algal species
for either open (algal ponds, raceway tanks) or closed (photobioreactor) systems. Ponds
are usually optimised to yield the highest level of lipid for the particular species of algae
selected. Several species of microalgae are promising sources of lipids when grown for
large-scale biomass and biofuel production, including the green alga Desmodesmus sp.,
the cyanobacteria Oscillatoria sp. and Arthrospira sp. grown in wastewaters (Komolafe
et al., 2014), the green algae Botryococcus sp. and Chlorella vulgaris (Huang et al.,
2013, 2014) and the eustigmatophycean Nannochloropsis oculata (Sukenik et al.,
1989). The effect of various environmental factors, such as pH, concentration of carbon
dioxide in the medium, and irradiance were shown to impact on lipid production of
microalgae (Huang et al., 2014). Beyond these environmental parameters, the
application of nanomaterials (such as CaO and MgO nanoparticles) has been found to
be effective catalysts of lipid synthesis and lipid extraction procedures (Zhang et al.,
2013). One of the most important environmental factors that drive primary production
4
via photosynthesis and fatty acid methyl ester (FAME) production is light (Sukenik et
al., 1989; Pal et al., 2011), where the flux density and spectral distribution of
photosynthetically active radiation are both important factors. Therefore, innovations in
light delivery and subsequent capture have the potential to revolutionise the biofuel
industry. Spectral modification of incident light in a photobioreactor by
photoluminescent phosphors increased the rate of biomass production in
Haematococcus pluvialis (Wondraczek et al., 2013). Genetic engineering of light
harvesting antennae to enhance light absorption is a major topic in Chlamydomonas
reinhardtii research (Ort et al., 2011). The practicability of such approaches for
enhancing growth of algae for large-scale biofuel production remains to be established
both technically and economically, but will require a complete understanding of the
acclimation potential of the cultured alga to be able to predict the optimum spectral
distribution of light energy required by the cells.
1.1 Physiology and acclimation potential of Nannochloropsis spp. under natural
light conditions
Nannochloropsis is a member of the class Eustigmatophyceae of unicellular yellow-
green coloured algae within the phylum Heterokontophyta; thus being more closely
related to brown algae and diatoms than to green algae, although containing only
chlorophyll (Chl) a as a major photosynthetic pigment and lacking the accessory
chlorophyll, Chl c. This alga has small coccoid cells (approx. 3 µm diameter) containing
one plastid (Murakami and Hashimoto, 2009). Nannochloropsis plays a significant role
in aquaculture, where it is grown widely in outdoor ponds as a food for rotifers (Ferreira
et al., 2009). The robust nature of Nannochloropsis, its ability to accumulate
intracellular oil (Kromkamp et al., 2009), and its recently discovered suitability for
5
targeted genetic manipulation based on efficient homologous recombination (Kilian et
al., 2011), make it a promising algal candidate for large-scale biofuel production.
For outdoor growth of microalgae in shallow ponds, the photon flux density (PFD)
can vary from the midday peak of sunlight (~2,000 µmol photons.m-2
.s-1
, 400-700 nm)
to relatively low light levels (~20 µmol photons.m-2
.s-1
) early and late in the day. Hence
the algae must utilise PFDs ranging over two orders of magnitude. The PFD incident at
the surface of such ponds is not available to all algal cells in the culture due to factors
such as self-shading (where algal cells near the surface absorb light leaving lower PFDs
for the cells beneath), attenuation of light by particles in the medium, as well as
reflection and refraction at surfaces (Ritchie and Larkum, 2012). Under excess light
conditions, photosynthetic electron transport becomes inhibited at the acceptor side of
PSII as a result of limitation of reductant and ATP use by the capacity of the Calvin-
Benson cycle; this restricts the electron flow from PSII. As a consequence, several
photoprotective mechanisms are activated, such as compensatory increases in
photosynthetic electron transport rates to acceptors other than carbon dioxide
(Behrenfeld et al., 1998), adjustment of the photosynthetic light harvesting capability
via effective absorption cross-section of photosynthetic reaction centres, mainly PSII
(Falkowski and Kolber, 1995), and activation of excess energy dissipation mechanisms
via the xanthophyll cycle, accompanied by non-photochemical quenching (NPQ) of
chlorophyll fluorescence (reviewed in Raven, 2011).
The acclimation potential of Nannochloropsis spp. to highly variable light
environments has been the subject of many laboratory studies, including recent
investigations by Kromkamp et al. (2009) and Sforza et al. (2012). This alga also
showed significant diurnal variation in its photosynthetic parameters under natural light
6
conditions, with the characteristics of sun and shade-acclimated behaviour under two
essentially different photobioreactor configurations (Kromkamp et al., 2009; Sukenik et
al., 2009; Tamburic et al., 2014). However, the specific impact of spectral quality of the
incident light on photosynthetic reactions of Nannochloropsis spp. has not been
investigated. The current study provides the first determination of photosynthetic
parameters of N. oculata grown at two different irradiance levels, resolved in a
wavelength-dependent manner. This information is essential for photobioreactor (PBR)
applications using narrow bandwidth irradiance; the identification of regions where the
spectrum of photosynthetically available radiation maximises the biomass of biofuel-
producing algae.
1.2 Novel multi-wavelength chlorophyll fluorescence analysis on Nannochloropsis
spp.
A broadly applied, non-invasive method to assess photosynthetic capability and
light-acclimation state of microalgae is based on variable fluorescence of Chl a (e.g.
Schreiber, 2004). The effective quantum yield of PSII can be readily determined at a
given wavelength with pulse amplitude modulated (PAM) fluorometry (Genty et al.,
1989) and based on incident photon flux density of a particular wavelength a relative
rate of photosynthetic electron transport can be calculated. Problems arise when the
rates of fluorescence derived electron transport which have been generated by different
coloured lights are compared (Schreiber et al., 2012). In this case, the relative
efficiencies with which differently coloured light is absorbed by PSII have to be taken
into account. The term ‘functional absorption cross-sectional area of PSII’ was
introduced by Ley and Mauzerall, 1982 and the method of fast-repetition rate
fluorometry (FRRf) was developed to provide estimates of the optical cross-sectional
7
area of PSII (called σPSII in the dark- acclimated state and σPSII` in the light-acclimated
state, see e.g. Falkowski and Kolber, 1995). Based on σPSII estimates, several numerical
models were developed to define absolute electron transport rates that could also
provide reliable estimates of chlorophyll fluorescence-based photosynthetic productivity
(Suggett et al., 2009). A spectrum of optical absorption cross-section of
Nannochloropsis has recently been reported (Kandilian et al., 2013); this is based on the
extinction coefficient of Chl a and, therefore, cannot be considered specific for PSII. On
the other hand, chlorophyll fluorescence provides specific information on the functional
wavelength-dependent absorption cross-sectional area of PSII (σII(λ)), which is essential
for estimating overall electron transport rates from chlorophyll fluorescence parameters
(Schreiber et al., 2012). With the knowledge of incident photosynthetically available
radiation (PAR) and of σII(λ), the actual PSII photon absorption rate, PAR(II), can be
readily calculated. Based on PAR(II) and the effective PSII quantum yield determined
for the same wavelength of light, Y(II), the absolute electron turnover rate of
Photosystem II, ETR(II), an absolute, chlorophyll fluorometry-based measure of
photosynthetic performance can be determined (Schreiber et al., 2012). In the current
study, the acclimation potential of photosynthetic electron transport processes in
Nannochloropsis oculata is analysed when grown at two different PFDs of white
growth light, both below the usual midday peak solar irradiances, but differing 15-fold
in absolute irradiance levels. As an estimate of accumulation of energy storage products,
the fatty acid composition of the alga is determined under both growth conditions to
better understand the potential effects of growth light intensity when N. oculata is
utilised for biofuel production.
8
2. Materials and Methods
2.1 Inoculum strain and stock cultures
The microalga Nannochloropsis oculata (Australian National Algae Culture
Collection, ANACC, strain CS-179) was grown in f/2 seawater medium, according to
ANACC protocols), as suspended cultures in 250 mL Erlenmeyer flasks. These stock
cultures were housed in an incubator (Labec Temperature Cycling Chamber, Labec
Laboratory Equipment Pty Ltd., Australia) at 20 ˚C under fluorescent illumination (TLD
18W/54 fluorescent tubes, Philips) at PFD of 40 µmol photon.m-2
.s-1
with a 12 h/12 h
light/dark cycle.
2.2 Experimental cultures
All cultures were grown as replicates (n=4) in 200 mL f/2 medium in flat-sided
plastic culture vessels (19 x 11 x 3.5 cm), laid on their side and illuminated from above.
The depth of the culture was 10 mm, minimising self-shading. Each flask was
inoculated with 2 mL of stock culture, which was in stationary growth phase. The
cultures were aerated with laboratory air using a small air pump via a stainless steel tube
(outer and inner diameters of 0.95 and 0.4 mm respectively) at a rate of approximately
30 mL.min-1
into the culture at its centre. All cultures were grown under white LED
lights (IronHorse, WLED80, Arlec, Blackburn, Australia). Two PFDs were used: low
light (LL; 20 µmol photon.m-2
.s-1
) and high light (HL; 300 µmol photon.m-2
.s-1
) with a
12 h/12 h light/dark cycle provided as a square wave oscillation. The growth
experiments were performed in a controlled environment room with temperature
maintained at ~21 ˚C. For chlorophyll fluorescence measurements, cultures were
sampled in the early exponential growth phase (four days post-inoculation), the Chl a
concentrations were about 300 µg.L-1 or 0.3 µg.cm-2 surface area in the case of both HL
9
and LL cells. This was equivalent to basic Chl a fluorescence (F0) values of 0.53±0.045
V with measuring light wavelength of 440 nm, intensity 1, gain 1, recorded using the
Multiple Excitation Wavelength Chlorophyll Fluorescence Analyzer (MC-PAM, Heinz
Walz GmbH, Germany, see below). Samples were adjusted to similar F0 values to
ensure that samples were taken at approximately the same Chl a content, 300 µg.L-1
(determined as described below).
2.3 Determination of chlorophyll content
Chl a content of Nannochloropsis oculata cultures was determined according to the
magnesium-saturated ethanol solvent procedure of (Ritchie, 2008). Cell suspensions
were extracted with 100% ethanol, stored at -20 ˚C for 24 h, and centrifuged (Labogene
1580R) for 1 min at 21,000 g. The absorbance of the pigment extracts was determined
at the wavelengths of 632, 649 and 665 nm using a UV-VIS spectrophotometer (Varian
Cary 50 Bio, Palo Alto, CA, USA).
2.4 Multicolour PAM (Multiple Excitation Wavelength Chlorophyll Fluorescence
Analyzer) measurements
2.4.1 Chlorophyll fluorescence measurement procedure
The Multiple Excitation Wavelength Chlorophyll Fluorescence Analyzer (MC-PAM;
Heinz Walz GmbH, Germany) was used. Measurements were performed for each of
five different colours at wavelengths of 440, 480, 540, 590 and 625 nm. Replicate
samples (1.4 mL) were taken from stock cultures about four days after inoculation when
the value of F0 was ~0.53 V in the case of both HL and LL cultures (see above).
Samples were placed in a quartz, 1 cm path-length cuvette, housed in the optical unit
(ED-101US/MD) of the MC-PAM. Homogeneous distribution of the samples within the
cuvette was maintained by a magnetic flea driven by a stirrer unit integrated into the

10
bottom of the optical unit. Cells were dark-acclimated for 10 min in the presence of far-
red (FR) background light (setting 10). These conditions were found to be ideal to
obtain the highest achievable maximal quantum efficiency of PSII (Y(II)max) for all
wavelengths of measuring light in the present study and ensured complete oxidation of
the photosynthetic electron transport chain to provide consistent measurements of
Y(II)max and σII (λ) (Schreiber et al., 2012). After dark acclimation, the maximal
quantum yield of PSII (Y(II)max, corresponding to FV/FM in pigment state 1) was
determined, using a saturating pulse (SP setting 12, width 0.6 s). For Y(II)max
measurements, the measuring light (ML) and Gain settings were adjusted to obtain
similar F0 values for the different colours (F0 = 0.53±0.045 V, n=20). After the Y(II)max
measurement, a further 1 min dark acclimation was applied before a measurement
sequence was started to determine σII (λ). A pre-programmed script was used according
to Schreiber and Klughammer, (2013) to determine σII (λ) consecutively within one
minute at all the five wavelengths. After this sequence, dark-acclimation in the
presence of FR light (setting 10, see above) was re-applied for a further 5 min to return
the photosynthetic electron transport chain to the reference re-oxidised state. An
automated steady-state light curve (SSLC) measurement was then performed at each
wavelength to determine the relative electron transport rates (rETR, see below). From
these and the σII(λ) values, the absolute rates of PSII turnover (ETR(II)) were calculated.
2.4.2 Determination of the PFD for each wavelength (establishing the PAR list)
The US-SQS/WB Spherical Micro Quantum Sensor (Heinz-Walz GmbH, Germany)
was placed centrally in the quartz cuvette containing f/2 medium. The quantum sensor
was directly connected to the MCP-C Control Unit of the MC-PAM and an automated
routine by the PamWin-3 software was used to obtain the “PAR lists” for all
11
wavelengths, which was saved and used for all measurements performed in the current
communication. Based on these lists the PamWin-3 user software of the instrument
automatically calculates the PFD values for all settings and wavelengths of pulse-
modulated measuring light, continuous AL and multiple turnover pulses.
2.4.3 Optimisation procedure for measurements of σII(λ)
In order to determine the absorption cross-sectional area of PSII, consecutive
measurements of the O-I1 fluorescence rise kinetics were performed for each
wavelength under reference conditions. A pre-programmed fast kinetic trigger file
(Sigma1000.FTM) was used including triggering of a saturating single turnover pulse
(ST, duration of 50 µs) at the end of a 1 ms illumination period with strong actinic light
(AL) of various colours (Schreiber et al., 2012). Minimal fluorescence yield (designated
as ‘O’ in the fast fluorescence terminology) with all PSII reaction centres open was
measured during a 100 µs period preceding onset of actinic illumination. Sufficiently
high light intensities were used to assure substantial closure of PSII reaction centres
during the standard 1 ms long actinic illumination period. The saturating multi-colour
ST at the end of this period served for full closure of PSII and determination of the
corresponding fluorescence level (I1-level). Consecutive O-I1 rise kinetics was recorded
for each wavelength using special script files. ML intensity and gain were adjusted to
obtain similar F0 values and the AL intensities were adjusted to obtain similar initial rise
kinetics for all wavelength.
2.4.4 Steady-state light curve (SSLC)
SSLCs were recorded according to Schreiber et al. (2012). Light response curves of
relative ETR (rETR) were recorded using the Light Curve Program files in PamWin-3.
In general, the same wavelength was used for ML and AL. Step width at each intensity

12
setting was 3 min. The low-intensity steps were covered by ML at high settings of pulse
frequency. New cell suspensions were used for each new set of measurements after a
different matching wavelength of ML and AL was applied.
2.5 Calculation of photosynthetic electron transport rates
Relative electron transport rates were calculated as
rETR�Y�II*PAR*ETRfactor (1)
where rETR is the relative electron transport rate, Y(II) is the effective quantum yield
(defined as Y(II)max in the dark-adapted state as maximal quantum efficiency of PSII),
PAR is the incident irradiance based on the PAR list of the instrument (in µmol
photons. m-2. s-1) and ETR factor is the fraction of light absorbed by the sample and
distributed to PSII (for rETR calculations, ETR factor of 0.42 was used arbitrarily, since
true PSII absorption requires quantitative information on the PSII absorption cross-
section).
The photon absorption rate (PAR(II)) was calculated as
����II � ����λ∗ L ∗ PAR (2)
Where PAR(II) is the photon absorption rate (in photons.PSII-1
.s-1
), σII(λ) is the
absorption cross-sectional area of PSII (in nm2), L is Avogadro`s constant and PAR is
the incident irradiance based on the PAR list of the instrument (in µmol
photons.m-2
.s-1
).
The electron turnover rate of PSII (ETR(II), expressed as electrons.PSII-1
.s-1
) is
calculated as:
13
������ � ������ ∗ [����/����!"#] (3)
where Y(II) is the effective quantum yield and Y(II)max is the maximal quantum
efficiency of PSII.
2.6 Fatty acid extraction and analysis
N. oculata cells (200 mL) were harvested from flat-sided plastic culture flasks (n=3) by
centrifugation at 3600 g for 10 minutes. Cells were washed by three repeated cycles of
centrifugation and re-suspension in the same volume of 0.1 M phosphate buffer,
followed by freeze drying. Lyophilized biomass was weighed to calculate the amount of
biomass for each treatment. Direct transesterification of biomass containing a known
amount of heptadecanoic acid (internal standard; Sigma Aldrich, NSW, Australia) using
methanol:chloroform:hydrochloric acid mixture (10:1:1 v/v) was carried out as
described in Dunstan et al. (2007). Following transesterification, the upper organic layer
containing fatty acid methyl esters (FAME) was extracted and evaporated to dryness
under nitrogen. The residue was used to calculate total FAME per g biomass and further
reconstituted in 200 µL of hexane and was analysed using an GC-MS (Agilent 7890
series GC coupled to an Agilent quadrupole MS (5975N)) on a HP-5MS fused silica
capillary column (5%-phenyl-methylpolysiloxane, 30 m long, 0.25 mm i.d., film
thickness 0.25 µm, Agilent Technologies). Samples were injected in splitless mode at an
inlet temperature of 280 ˚C. The GC temperature programming rates were followed
according to Dunstan et al. (2007). Peaks were identified using high purity fatty acid
(99.9%) standards (Sigma Aldrich, NSW, Australia) and quantified using software
(Agilent Mass Hunter).

14
3. Results and Discussion
3.1 Wavelength-dependent absorption cross-sectional area of PSII in N. oculata
The wavelength-dependent absorption cross-sectional area of PSII (σII (λ)) values
(Fig. 1) were maximal at 440 nm (mostly related to the blue absorption band of Chl a,
but also to carotenoids) and decreased towards minimal values at 540 nm. From 540
nm they increased progressively towards 625 nm. Compared with the σII(λ) spectrum of
the green alga Chlorella sp. (Schreiber et al., 2012), that of N. oculata shows some
differences, especially the much smaller value at 480 nm. This is a consequence of the
absence of accessory chlorophylls, such as Chl c in N. oculata, which typically absorb
at 460-480 nm when present. σII(480) is determined mainly by the xanthophylls
violaxanthin and vaucheriaxanthin, that act as light-harvesters in N. oculata (Whittle
and Casselton, 1975; Chrystal and Larkum, 1986). The spectra of σII(λ) were essentially
identical for LL and HL-grown N. oculata, apart from the apparent slightly higher value
for σII(440) in HL cells. This suggests that acclimation to different PAR during growth
does not involve adjustments in the cross-sectional area of PSII of N. oculata between
480 and 625 nm. These findings for σII(λ) are in agreement with a recent study showing
that the optical cross-sectional area of N. oculata is largely independent of the incident
irradiance during growth (Kandilian et al., 2013), performed under optical conditions
similar to those applied in the current study. However, this cross-sectional area was
normalised to total Chl a content, and therefore cannot be interpreted as an intrinsic
property of the photon absorption into PSII. Here, the O-I1 kinetics-based derivation of
cross-sectional area of PSII has the great advantage of being independent of Chl a
content (in optically thin suspensions); moreover, no substantial differences in Chl a
content or F0 values between HL and LL cells were observed. Thus, σII(λ) can be

15
considered an intrinsic property of PSII units with their sample-specific antenna system
rather than an optical cross-section of Chl a molecules, and changes in σII(λ) do not play
a role in the adjustment of light-harvesting capability in N. oculata cells during light
intensity acclimation. In this context, it has to be considered that σII(λ) is defined for a
quasi-dark adapted reference state and that any short-term adaptive changes occurring
during illumination will be reflected in the ratio of effective to maximal PSII quantum
yield, Y(II)/Y(II)max (Schreiber et al., 2012).
3.2 Photochemical efficiency and photoprotective capability of N. oculata assessed
at different wavelengths
In order to characterise the quantum efficiency of photosystem II and the
photoprotective capability of Nannochloropsis oculata grown under different light
regimes, steady-state light curve measurements of the fluorescence parameters Y(II) and
NPQ using MC-PAM with the same optical configuration and at the same wavelengths
used for σII(λ) measurements were recorded (Fig. 2).
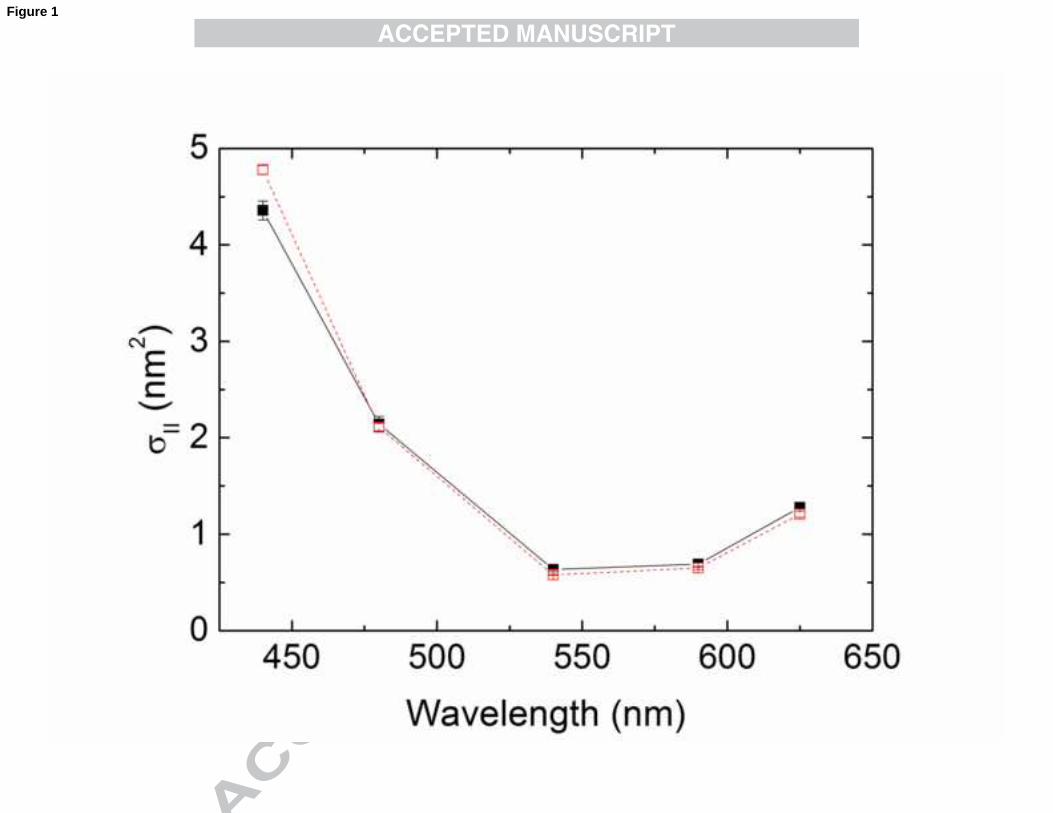
The effective quantum yield of PSII (Y(II)) declined as a function of irradiance,
when measured at 440 (Fig. 2a) and at 540 nm (Fig. 2b), at which wavelengths the
maximal and minimal σII was observed, respectively. At both wavelengths, the Y(II) of
LL cells declined more rapidly than HL, due to the fact that LL cells were acclimated to
15-fold lower PFD (20 µmol photon.m-2.s-1) than HL cells (300 µmol photon.m-2.s-1).
Both HL and LL cells became saturated at much higher PAR when 540 nm light was
used as compared to 440 nm excitation light, which is in agreement with the fact that
440 nm light is the most absorbed, whereas 540 nm is the least absorbed PSII light
(according to σII(λ), Fig. 1). Non-photochemical quenching (NPQ) parameters,
16
calculated from the same light curves as the Y(II) plots are also shown in Fig. 2.
Distinctly higher NPQ values were induced by the 440 nm light (Fig. 2c) than the 540
nm light (Fig. 2d), for both HL and LL cells. Although the induction of NPQ occurred
at somewhat higher PAR values of 440 nm AL in HL cells than in LL cells, the
maximum NPQ differed only minimally between the two cell types. For 540 nm light, a
much higher PAR was necessary to induce any NPQ, especially in HL cells.
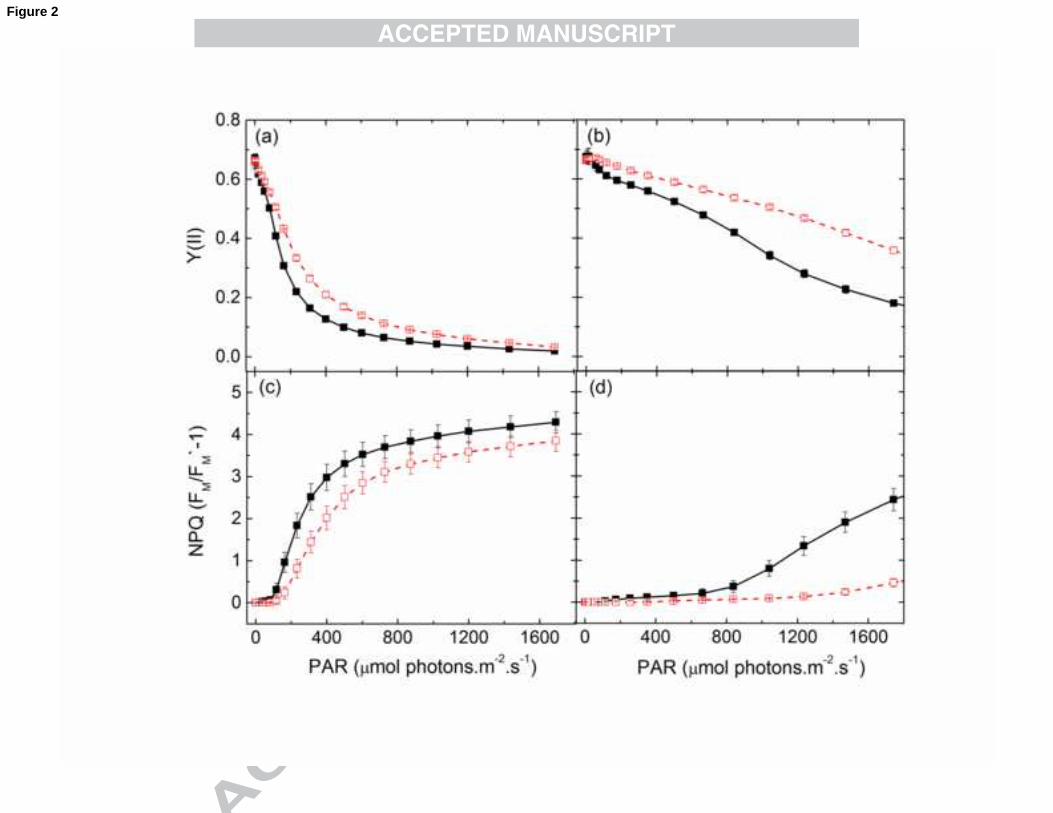
In order to compare parameters Y(II) and NPQ at all wavelengths available with the
MC-PAM, these parameters are plotted at two irradiance levels (300 and 1200 µmol
photons.m-2.s-1) , i.e. at sub-saturating and saturating irradiances as a function of
wavelength (Fig. 3). In the case of Y(II) plots (Fig. 3a), the values recorded at the
beginning of the SSLC measurements (in dark-adapted state, Y(II)max) are also shown.
Values of Y(II)max approaching 0.7 at all wavelengths would indicate that maximal
quantum efficiency of PSII was obtained for all wavelengths in the dark-adapted state;
the same reference state that was applied for the σII(λ) measurements. Both in LL and
HL cells, the highest values of Y(II) during steady-state illumination could be observed
at 540 nm, with progressively lower values at 590 and 625 nm, and a more pronounced
decline as wavelength decreased at 480 and 440 nm. While this tendency was already
apparent with moderate AL (300 µmol photons.m-2.s
-1), the largest differences were
observed with high AL (1200 µmol photons.m-2.s-1), applied towards the end of SSLC
measurement. The smaller decline of Y(II) in the case of HL cells indicates their
greater electron transport capacity acquired during growth at high irradiance. The plot
of NPQ as a function of wavelength (Fig. 3b) reveals that at moderate AL (300 µmol
photons.m-2
.s-1
), substantial NPQ was induced only by blue AL (440 nm) with HL cells
and by 440 and 480 nm light with LL cells. At high AL irradiance levels, large NPQ
17
values were induced in both LL and HL cells by 440 and 480 nm light, and distinctly
lower values at 590 and 625 nm, with NPQ minima at 540 nm, in accordance with the
σII(λ) spectrum shown in Fig. 1.
Earlier studies suggested that Nannochloropsis spp. exhibits limited capacity for
NPQ, indicating that this microalga does not utilise NPQ as a major photoprotective
mechanism (Kotabova et al., 2011). However, the multi-wavelength approach shows
clearly that N. oculata can exhibit large NPQ values that are distinctly greater with 440
nm than with 625 nm light, which can be readily explained by the fact that PSII
absorption at 625 nm is only about a quarter of that at 440 nm (Fig. 1). Therefore, when
blue light is used as an actinic source, NPQ is activated at much lower PAR and can
reach a value of 3.5 to 4, indicating that the blue-green region of the PAR does induce
efficient photoprotective mechanisms in Nannochloropsis oculata.
3.3 Relative electron transport rates (rETR) of N. oculata
The relative rate of photosynthetic electron transport (rETR) is useful for
characterising the light-acclimation state of photosynthetic organisms and for providing
estimates of photosynthetic efficiency and capacity, which can be done with standard
equipment even under field conditions. Provided that the same organism is investigated
using the same wavelength of light under different physiological states, there is no need
to quantify ETR in absolute units. However, large differences in rETR light response
curves have to be expected when the responses to differently coloured light are
compared (Schreiber et al., 2012).
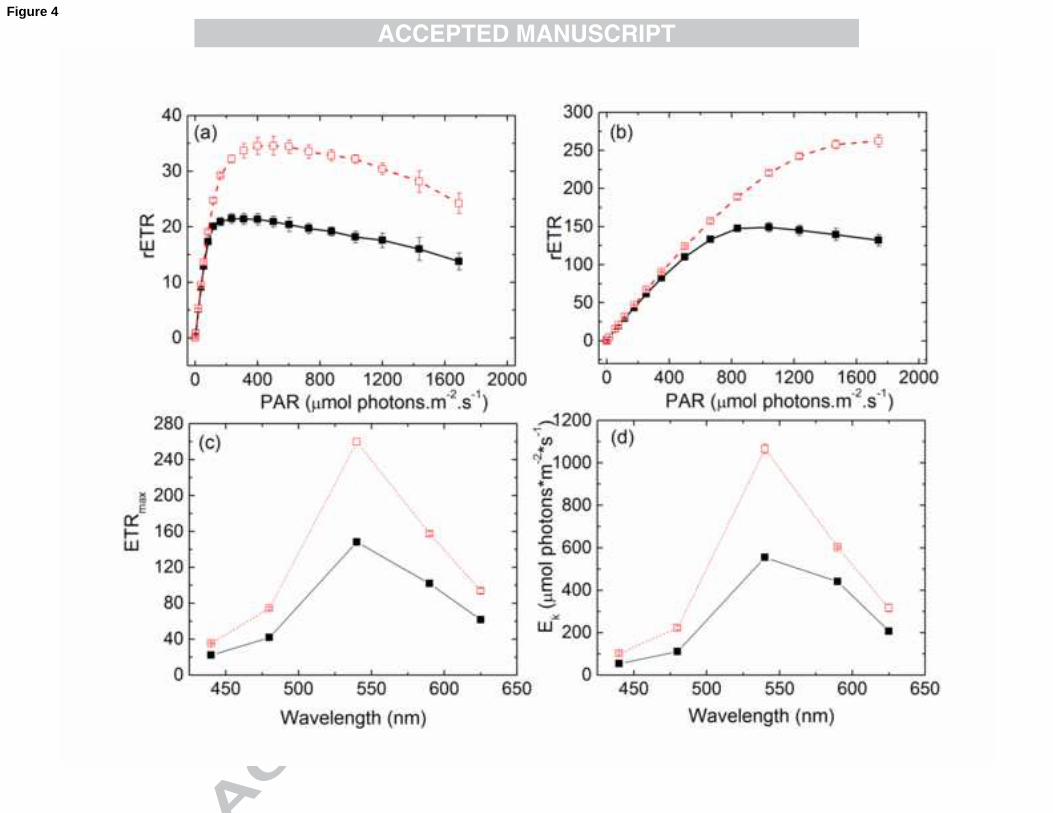
The maximal electron transport rates (rETRmax) and the light intensities at which the
saturation of the SSLC occur (Ek) are shown in Figures 4a and 4b, respectively. The
18
spectra of both rETRmax (Fig. 4c) and Ek (Fig. 4d) are the inverse of the spectrum of
σII(λ), meaning that the saturation and maximal rates of electron transport rates are
minimal at 440 nm (where the absorption cross-section is the highest) and maximal at
540 nm (where the absorption cross-section is the lowest). Cells grown at HL show an
approximately 1.6-fold higher rETRmax and Ek value, indicating the different light
acclimation status to LL cells. It has to be noted however, that rETR parameters at a
given wavelength cannot be used as true values for electron turnover rates of PSII,
unless the cross-sectional area of PSII determined at the same wavelength (fulfilled in
this study), and the photon absorption rate of PSII (PAR(II)) is calculated (see below).
Since there are minor differences in σII(λ) between HL and LL treatments, PAR(II) was
calculated to enable a better comparison between absolute electron transport rates of
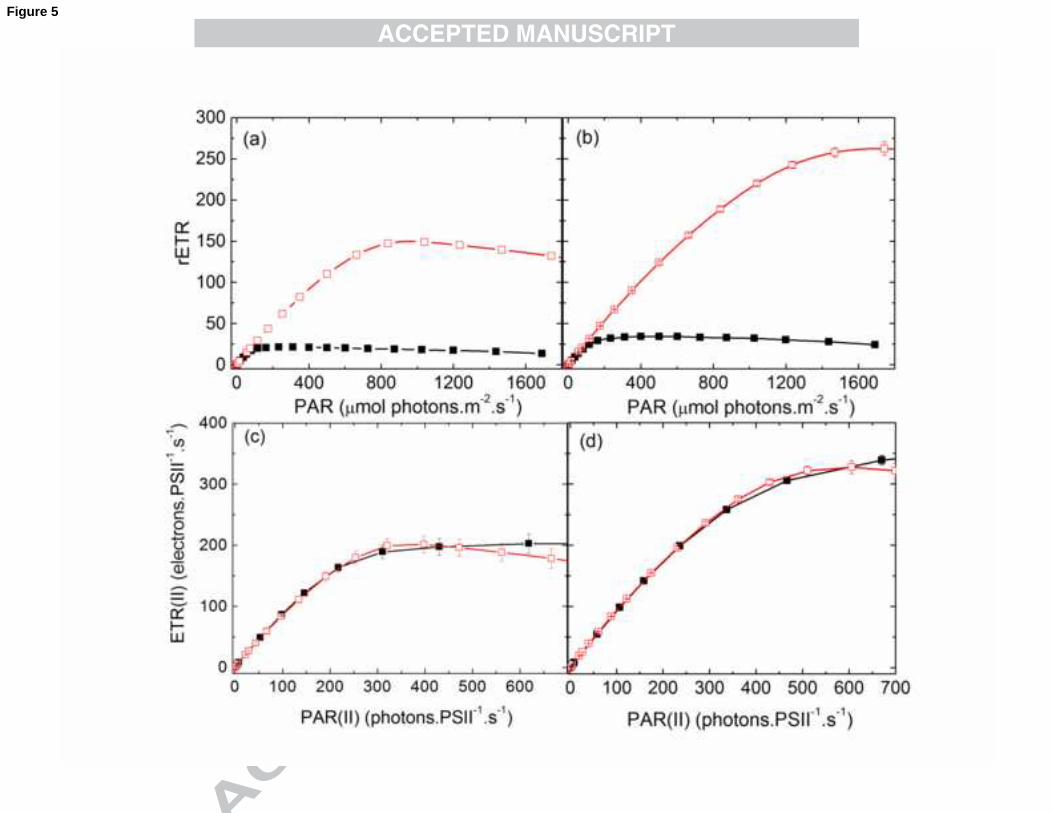
PSII. The relative and absolute electron transfer rates are compared in Fig. 5 at the two
wavelengths, 440 and 540 nm, absorbed to a maximal and minimal extent, respectively.
It is apparent that the large differences in the light response curves of rETR with 440
and 540 nm illumination (Fig. 5, panels a and b) almost disappeared when ETR(II) is
plotted vs. PAR(II). On one hand, this finding suggests that the overall rate of
photosynthetic electron transport in N. oculata is determined by PAR(II), independently
of the wavelength. The deviations between the 540 and 440 nm ETR(II) light response
curves at high light intensities (above 300 µmol photons.m-2
.s-1
) could be due to
differences in PSI excitation. Equal rates of quantum absorption by PSII are not
necessarily paralleled by equal rates of quantum absorption by PSI. Differences may
become apparent when excess light can be utilized by PSI for e.g. cyclic electron
transport. However, other explanations may apply (see below).

19
3.4 Wavelength-dependent electron turnover rates of photosystem II in N. oculata
Identical PAR values of the irradiance applied during the course of a light response
curve may correspond to widely different rates of quantum absorption by PSII,
depending on the wavelength of light. At the same PAR, PSII absorption of 440 nm
light is about seven times higher than of 540 nm light, as reflected by the σII(λ) values
(Fig. 1). When σII(λ) values are known, PAR values can be readily transformed into
PAR(II) values, ie. the rate of quantum absorption by PSII (in units of
photons.PSII-1.s-1), forming the basis for the calculation of absolute electron transfer
rates (ETR(II)) (Fig. 5). ETR(II) curves can be fitted similarly to rETR curves, and the
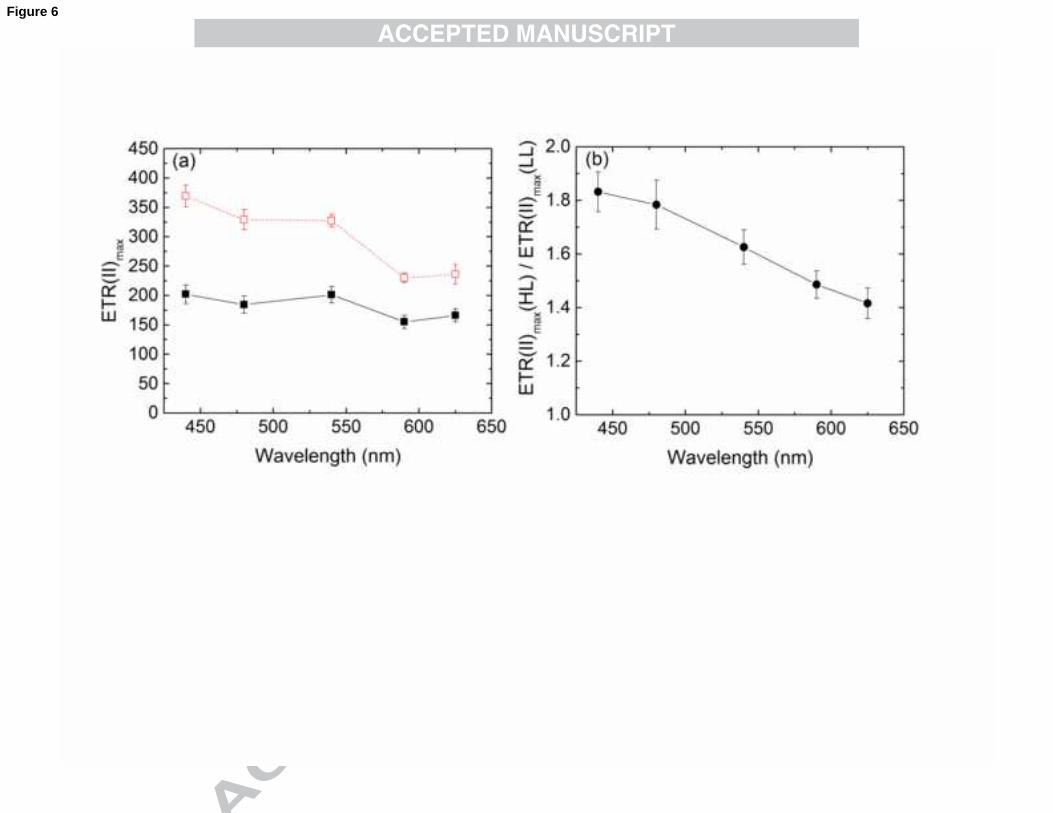
maximal electron transfer rates (ETR(II)max) can be calculated (Fig. 6a).
The ETR(II)max values of LL cells were between 160 and 200 electrons.PSII-1
.s-1
.
This means that N. oculata cells, growing near their limit of quantum requirement for
photosynthesis are still capable of displaying relatively high electron turnover rates that
are similar to those of Chlorella sp. (Schreiber et al., 2012), indicating efficient light
utilisation at rather low growth irradiance levels. Most importantly, HL cells increased
their ETR(II)max by about 1.4-1.8 times, exhibiting a pronounced wavelength
dependency. To compare the changes in electron transport rates between HL and LL
cells, the ratio of the ETR(II) in HL and LL cells is plotted in Fig. 6b.
While on average, the electron transport rate was ~1.6-fold higher in HL-grown than
in LL-grown N. oculata, there was a clear trend for the HL/LL ETR(II) ratio to decrease
from about 1.8 at 440 nm to about 1.4 at 625 nm. This suggests that acclimation of the
cells to HL conditions not only enhancing electron transport efficiency, but also some
specific changes such as enhancing the efficiency of light in the blue-green region of the
spectrum. As the observation was already pointed out in the discussion of the data in

20
Fig.5, the large differences between 540 and 440 nm light curves of rETR mostly
disappear, when ETR(II) is plotted vs. PAR(II). As apparent from Fig. 6a; however,
substantial differences remain particularly in the case for HL cells, when
ETR(II)max(440) is compared with ETR(II)max(625). This observation is closely linked
with the notion that HL conditions are particularly effective in enhancing the capacity of
overall electron transport upon illumination with blue light. While the mechanistic
details of such enhancement are not known and have to be clarified by future work, it
may be speculated that HL conditions change the PSII/PSI ratio and that 440 nm
photons may be more strongly absorbed in PSI than photons at other wavelengths. It
should be noted that HL refers to a high intensity of white LED light, the spectrum of
which displays a pronounced peak at around 450 nm. Hence two types of “acclimation
pressure” on the organism should be considered, the first being electron pressure
(caused by limiting dark reactions) and the second, photoinhibition (caused by excess
light), with the second being enhanced by the first. From the data presented in the
current study, the extent of photoinhibition using the various wavelengths of PAR
cannot be estimated. Recently an action spectrum of photoinhibition was determined
for Chlorella using the MC-PAM (Schreiber and Klughammer, 2013), which differs
substantially from a σII spectrum (i.e. PSII action spectrum) by additional action in the
blue spectral region. If, as suggested in this previous study, this additional action
reflects direct photodamage of the Mn-cluster of the oxygen evolving complex (Hakala
et al., 2005), this damage may be unavoidable, but may be compensated by efficient
repair. A complete action spectrum of N. oculata across all PAR wavelengths is
therefore required. Further experiments will be necessary to determine the extent of net
photoinhibition at various wavelengths in N. oculata. It is proposed that relatively
21
higher values of ETR(II) of HL cells in the blue spectral region is linked with a photo-
acclimative change in response to increased irradiance in the blue region.
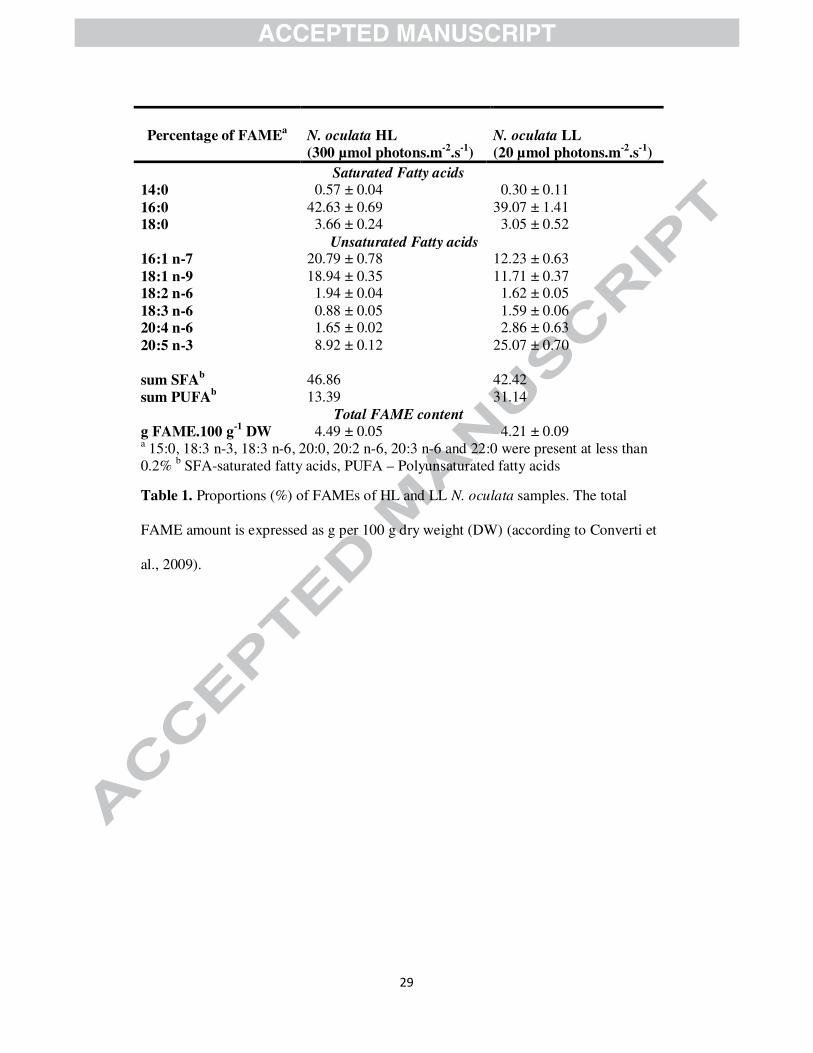
3.5 Fatty acid methyl ester (FAME) composition of N. oculata
The FAME composition of N. oculata grown under the two different light regimes is
presented in Table 1. The major fatty acids were 16:0, 16:1 n-7, 18:1 n-9 and 20:5 n-3
with minor presence of 18:0, 18:2 n-6, 18:3 n-6, 18:2 n-3 and 20:4 n-6, in agreement
with previous findings (Sukenik et al., 1989). The proportions of saturated fatty acids
were slightly higher in HL cells, as was the proportion of 16:0, 18:0, 16:1 and 18:1
FAMEs. The percentage of 20:5 n-3 FAME was substantially lower in HL cells. These
results indicate that N. oculata cells, exhibiting relatively higher absolute electron
transport rates (HL conditions, Fig. 6a), are optimal sources of saturated fatty acids
whereas, under LL conditions, PUFA production is higher. FAME content of HL and
LL cells were similar (Table 1). The total amount of FAMEs compares with the total
lipid content of 7.9 g.100 g-1 dry weight measured on N. oculata cells grown at 20 ˚C
and 70 µmol photons.m-2.s-1 (Converti et al., 2009), probably indicating that lipid
classes other than fatty acids were present. Nevertheless, the two light regimes clearly
affected the FAME composition of the cells.
Conclusion
The productivity of N. oculata and other algal species is ultimately determined by the
effectiveness of their photosynthesis. This study presents new insights into the
photosynthetic capabilities and lipid production of microalgae that experience order of
magnitude differences in growth irradiance, both as light absorption and quantitative
measure of photosynthetic electron transport rate. Elevated growth irradiance was found
22
to be ideal for both enhanced photosynthetic activity and production of saturated fatty
acids, preferred for biofuel production. Additionally, Nannochloropsis oculata has the
potential to selectively acclimate to distinct spectral regions of photosynthetically
available radiation, with strong preference to blue-green light.
Supplementary material
The experimental setup and the spectrum of the LED source that was used for the
experiments (Section 2.2) are depicted in Supplementary material.
Acknowledgements
The University of Dundee is a registered Scottish charity, no SC 015096. The authors
thank David Bishop and Ronald Shimmon for their timely help and technical support.
References
[1] Behrenfeld, M.J., Prasil, O., Kolber, Z.S., Babin, M., Falkowski, P.G. 1998.
Compensatory changes in Photosystem II electron turnover rates protect
photosynthesis from photoinhibition. Photosynth. Res. 58(3), 259-268.
[2] Chrystal, J., Larkum, A.W.D. 1986. Pigment-protein complexes and light harvesting
in eustigmatophyte algae, in: Biggins J. (Ed.), Progress in Photosynthesis
Research. Martinus Nijhoff, Dordrecht, pp. 189-193.
[3] Converti, A., Casazza, A.A., Ortiz, E.Y., Perego, P., Del Borghi, M., 2009. Effect of
temperature and nitrogen concentration on the growth and lipid content of
Nannochloropsis oculata and Chlorella vulgaris for biodiesel production. Chem.
Eng. Process.: Process Intensif. 48(6), 1146-1151.
[4] Dunstan, G.A., Elliott, N.G., Appleyard, S.A., Holmes, B.H., Conod, N., Grubert,
M.A., Cozens, M.A. 2007. Culture of triploid greenlip abalone (Haliotis
23
laevigata Donovan) to market size: Commercial implications. Aquaculture. 271,
130–141.
[5] Eilers, P.H.C., Peeters, J.C.H. 1988. A Model for the relationship between light-
intensity and the rate of photosynthesis in phytoplankton. Ecol. Model. 42(3-4),
199-215.
[6] Falkowski, P.G., Kolber, Z. 1995. Variations in chlorophyll fluorescence yields in
phytoplankton in the world oceans. Aust. J. Plant Physiol. 22(2), 341-355.
[7] Ferreira, M., Coutinho, P., Seixas, P., Fabregas, J., Otero, A. 2009. Enriching
Rotifers with "Premium" Microalgae. Nannochloropsis gaditana. Mar.
Biotechnol. 11(5), 585-595.
[8] Genty, B., Briantais, J.M., Baker, N.R. 1989. The relationship between the quantum
yield of phyotosynthetic electron-transport and quenching of chlorophyll
fluorescence. Biochim. Biophys. Acta 990(1), 87-92.
[9] Hakala, M., Tuominen, I., Keranen, M., Tyystjarvi, T., Tyystjarvi, E. 2005.
Evidence for the role of the oxygen-evolving manganese complex in
photoinhibition of Photosystem II. Biochim. Biophys. Acta-Bioenerg. 1706(1-
2), 68-80.
[10] Huang, Y.T., Lee, H.T., & Lai, C.W. 2013. Engineering of the growth environment
of microalgae with high biomass and lipid productivity. J. Nanosci.
Nanotechnol. 13(3), 2117-2121.
[11] Huang, Y.T., Su, C.P. 2014. High lipid content and productivity of microalgae
cultivating under elevated carbon dioxide. Int. J. Environ. Sci. Technol. 11(3),
703-710.
24
[12] Kandilian, R., Lee, E., Pilon, L. 2013. Radiation and optical properties of
Nannochloropsis oculata grown under different irradiances and spectra.
Bioresour. Technol. 137, 63-73.
[13] Kilian, O., Benemann, C.S.E., Niyogi, K.K., Vick, B. 2011. High-efficiency
homologous recombination in the oil-producing alga Nannochloropsis sp. Proc.
Natl. Acad. Sci. 108(52), 21265-21269.
[14] Komolafe, O., Velasquez Orta, S.B., Monje-Ramirez, I., Noguez, I.Y., Harvey,
A.P., Orta Ledesma, M.T. 2014. Biodiesel production from indigenous
microalgae grown in wastewater. Bioresour. Technol. 154, 297-304.
[15] Kotabova, E., Kana, R., Jaresova, J., Prasil, O. 2011. Non-photochemical
fluorescence quenching in Chromera velia is enabled by fast violaxanthin de-
epoxidation. Febs Lett. 585(12), 1941-1945.
[16] Kromkamp, J.C., Beardall, J., Sukenik, A., Kopecky, J., Masojidek, J., van
Bergeijk, S., Gabai, S., Shaham, E., Yamshon, A. 2009. Short-term variations in
photosynthetic parameters of Nannochloropsis cultures grown in two types of
outdoor mass cultivation systems. Aquat. Microb. Ecol. 56(2-3), 309-322.
[17] Ley, A.C., Mauzerall, D.C. 1982. Absolute absorption cross-sections for
Photosystem-II and the minimum quantum requirement for photosynthesis in
Chlorella vulgaris. Biochim. Biophys. Acta 680(1), 95-106.
[18] Murakami, R., Hashimoto, H. 2009. Unusual Nuclear Division in Nannochloropsis
oculata (Eustigmatophyceae, Heterokonta) which May Ensure Faithful
Transmission of Secondary Plastids. Protist 160(1), 41-49.
25
[19] Pal, D., Khozin-Goldberg, I., Cohen, Z., Boussiba, S. 2011. The effect of light,
salinity and nitrogen availability on lipid production by Nannochloropsis sp.
Appl. Microbiol. Biotechnol. 90, 1429–1441.
[20] Ort, D.R., Zhu, X., Melis, A. 2011. Optimizing Antenna Size to Maximize
Photosynthetic Efficiency. Plant Physiol. 155(1), 79-85.
[21] Raven, J.A. 2011. The cost of photoinhibition. Physiol. Plant. 142(1), 87-104.
[22] Ritchie, R.J. 2008. Universal chlorophyll equations for estimating chlorophylls a,
b, c, and d and total chlorophylls in natural assemblages of photosynthetic
organisms using acetone, methanol, or ethanol solvents. Photosynthetica 46(1),
115-126.
[23] Ritchie, R.J., Larkum, A.W.D. 2012. Modelling photosynthesis in shallow algal
production ponds. Photosynthetica 50(4), 481-500.
[24] Rogers, J.N., Rosenberg, J.N., Guzman, B.J., Oh, V.H., Mimbela, L.E., Ghassemi,
A., Betenbaugh, M.J., Oyler, G.A., Donohue, M.D. In press. A critical analysis
of paddlewheel-driven raceway ponds for algal biofuel production at
commercial scales. Algal Res.
[25] Schreiber, U. 2004. Pulse-amplitude-modulation (PAM) fluorometry and saturation
pulse method: An overview, in: Papageorgiou, G.C. (Ed.), Chlorophyll a
Fluorescence: Signature of Photosynthesis. Springer, pp. 279-319.
[26] Schreiber, U., Klughammer, C., Kolbowski, J. 2012. Assessment of wavelength-
dependent parameters of photosynthetic electron transport with a new type of
multi-color PAM chlorophyll fluorometer. Photosynt. Res. 113(1-3), 127-144.
26
[27] Schreiber, U., Klughammer, C. 2013. Wavelength-dependent photodamage to
Chlorella investigated with a new type of multi-color PAM chlorophyll
fluorometer. Photosynth. Res. 114(3), 165-177.
[28] Sforza, E., Simionato, D., Giacometti, G.M., Bertucco, A., Morosinotto, T. 2012.
Adjusted Light and Dark Cycles Can Optimize Photosynthetic Efficiency in
Algae Growing in Photobioreactors. Plos One 7(6).
[29] Suggett, D.J., Moore, C.M., Hickman, A.E., Geider, R.J. 2009. Interpretation of
fast repetition rate (FRR) fluorescence: signatures of phytoplankton community
structure versus physiological state. Mar. Ecol. Prog. Ser. 376, 1-19.
[30] Sukenik, A., Beardall, J., Kromkamp, J.C., Kopecky, J., Masojidek, J., van
Bergeijk, S., Gabai, S., Shaham, E., Yamshon, A. 2009. Photosynthetic
performance of outdoor Nannochloropsis mass cultures under a wide range of
environmental conditions. Aquat. Microb. Ecol. 56(2-3), 297-308.
[31] Sukenik, A., Carmeli, Y. and Berner, T. 1989. Regulation of fatty acid composition
by irradiance level in the eustigmatophyte Nannochloropsis sp. J. Phycol. 25,
686–692.
[32] Tamburic, B., Guruprasad, S., Radford, D.T., Szabo, M., Lilley, R.M., Larkum,
A.W.D., Franklin, J.B., Kramer, D.M., Blackburn, S.I., Raven, J.A., Schliep, M.,
Ralph, P.J. 2014. The Effect of Diel Temperature and Light Cycles on the
Growth of Nannochloropsis oculata in a Photobioreactor Matrix. Plos One 9(1).
[33] Whittle, S.J., Casselton, P.J. 1975. The chloroplast pigments of the algal classes
Eustigmatophyceae and Xanthophyceae. I. Eustigmatophyceae. Br. Phycol. J.
10, 192-204.
27
[34] Wondraczek, L., Batentschuk, M., Schmidt, M.A., Borchardt, R., Scheiner, S.,
Seemann, B., Schweizer, P., Brabec, C.J. 2013. Solar spectral conversion for
improving the photosynthetic activity in algae reactors. Nat. Commun. 4.
[35] Zhang, X.L., Yan, S., Tyagi, R.D., Surampalli, R.Y. 2013. Biodiesel production
from heterotrophic microalgae through transesterification and nanotechnology
application in the production. Renew. Sustain. Energy Rev. 26, 216-223.
Figure captions
Fig. 1. σII(λ) in dilute suspensions of N. oculata (see Section 2.2) grown either at LL
(closed symbols, solid line) or HL (open symbols, dashed line) conditions. σII(λ) was
derived from automated measurements of five consecutive O–I1 rise curves in the
presence of far-red background light. Time between consecutive O–I1 measurements
was 10 s. Values are shown as averages (n=4) ± S.E. (standard errors)
Fig. 2. Effective quantum yield (Y(II)) (a, b) and non-photochemical quenching (NPQ)
(c, d) in N. oculata grown either at LL (closed symbols, solid line) or HL (open
symbols, dashed line) conditions based on steady-state light curve measurements using
440 nm (a, c) and 540 nm (b, d) excitation light. NPQ was calculated as FM/FM`-1.
Values are shown as averages (n=4) ± S.E.
Fig. 3. Effective quantum yield of PSII (Y(II)) (a) and non-photochemical quenching
(NPQ) (b) in N. oculata grown either at LL (closed symbols, solid line) or HL (open
symbols, dashed line) conditions as a function of wavelength at 300 µmol
photons.m-2.s-1 (circles) and 1200 µmol photons.m-2.s-1 (squares). Dark-adapted,
maximal quantum efficiency of PSII (termed as Y(II)max, triangles) is shown in panel
(a). NPQ was calculated as FM/FM’ -1. Values are shown as averages (n=4) ± S.E.
28
Fig. 4. Steady-state light curves of rETR using 440 nm (a) and 540 nm (b) irradiance
measured with a dilute suspension of N. oculata (see Methods) grown either at LL
(closed symbols, solid line) or HL (open symbols, dashed line) conditions. Illumination
time at each intensity setting was 3 min. Wavelength-dependent parameters of rETR,
the maximal electron transport rates (rETRmax, c) and light intensity at onset of
saturation (Ek, d). rETRmax and Ek parameters were obtained by fitting the light curves
using a PamWin-3 software routine based on the model of (Eilers & Peeters, 1988).
Values are shown as averages (n=4) ± S.E.
Fig. 5. Comparison of relative (a, b) and absolute ETR (ETR(II)) (c, d) values in LL (a
and c) and HL (b and d) at excitations of 440 nm (closed symbols) and 540 nm (open
symbols). rETR data was replotted from Fig. 4 a, b. ETR(II) curves were derived from
rETR by transformation of the PAR-scale into a PAR(II) scale according to Schreiber et
al (2012). The σII(λ) values applied for 440 and 540 nm are plotted in Fig. 1. Values are
shown as averages (n=4) ± S.E.
Fig. 6. Calculated ETR(II)max values of N. oculata grown either at LL (closed symbols,
solid line) or HL (open symbols, dashed line) as a function of the wavelength of actinic
light (a) and the HL/LL ratios of ETR(II)max (circles) as a function of the wavelength of
actinic light (b). Values are shown as averages (n=4) ± S.E.
Footnote. Abbreviations: Ek, light intensity at onset of saturation; ETR(II), absolute
electron turnover rate of PSII; MC-PAM, multi-colour pulse amplitude modulated
chlorophyll fluorometer; NPQ, non-photochemical quenching; PAR(II), PSII photon
absorption rate; rETR, relative rate of PSII turnover; rETRmax, maximal relative rate of
PSII turnover; σII(λ), wavelength-dependent absorption cross-section of PSII; SSLC,
steady-state light curve
29
Percentage of FAMEa
N. oculata HL
(300 µmol photons.m-2.s-1) N. oculata LL
(20 µmol photons.m-2.s-1)
Saturated Fatty acids
14:0 0.57 ± 0.04 0.30 ± 0.11
16:0 42.63 ± 0.69 39.07 ± 1.41 18:0 3.66 ± 0.24 3.05 ± 0.52
Unsaturated Fatty acids
16:1 n-7 20.79 ± 0.78 12.23 ± 0.63
18:1 n-9 18.94 ± 0.35 11.71 ± 0.37 18:2 n-6 1.94 ± 0.04 1.62 ± 0.05
18:3 n-6 0.88 ± 0.05 1.59 ± 0.06 20:4 n-6 1.65 ± 0.02 2.86 ± 0.63
20:5 n-3 8.92 ± 0.12 25.07 ± 0.70
sum SFAb 46.86 42.42
sum PUFAb 13.39 31.14
Total FAME content
g FAME.100 g-1
DW 4.49 ± 0.05 4.21 ± 0.09 a 15:0, 18:3 n-3, 18:3 n-6, 20:0, 20:2 n-6, 20:3 n-6 and 22:0 were present at less than 0.2%
b SFA-saturated fatty acids, PUFA – Polyunsaturated fatty acids
Table 1. Proportions (%) of FAMEs of HL and LL N. oculata samples. The total
FAME amount is expressed as g per 100 g dry weight (DW) (according to Converti et
al., 2009).

30
Highlights
1. Multi-wavelength chlorophyll fluorescence on Nannochloropsis oculata was
analysed.
2. Wavelength-specific light acclimation was found under varying growth
irradiances.
3. Elevated absolute electron transfer rates were found under high growth
irradiance.
4. Optimal photosynthetic productivity occurs in the blue-green spectral region.
5. Variations in growth irradiance affected the fatty acid composition.