Based Computational Model. I. Descending Systems Circuits Generating Corticomuscular Coherence...
13
Innovative Methodology Measurement of Time-Dependent Changes in the Irregularity of Neural Spiking Ronnie M. Davies, 1 George L. Gerstein, 2 and Stuart N. Baker 3 1 The Clinical School, Addenbrooke’s Hospital, Cambridge, United Kingdom; 2 Department of Neuroscience, University of Pennsylvania, Philadelphia, Pennsylvania; and 3 University of Newcastle upon Tyne, Sir James Spence Institute, Royal Victoria Infirmary, Newcastle upon Tyne, United Kingdom Submitted 30 September 2005; accepted in final form 9 March 2006 Davies, Ronnie M., George L. Gerstein, and Stuart N. Baker. Measurement of time-dependent changes in the irregularity of neural spiking. J Neurophysiol 96: 906 –918, 2006. First published March 22, 2006; doi:10.1152/jn.01030.2005. Irregularity of firing in spike trains has been associated with coding processes and information transfer or alternatively treated as noise. Previous studies of irregularity have mainly used the coefficient of variation (CV) of the interspike interval distribution. Proper estimation of CV requires a constant underlying firing rate, a condition that most experimental situations do not fulfill either within or across trials. Here we introduce a novel irregularity metric based on the ratio of adjacent intervals in the spike train. The new metric is not affected by firing rate and is very localized in time so that it can be used to examine the time course of irregularity relative to an alignment marker. We characterized properties of the new metric with simulated spike trains of known characteristics and then applied it to data recorded from 108 single neurons in the motor cortex of two monkeys during performance of a precision grip task. Fifty-six cells were antidromically identified as pyramidal tract neu- rons (PTNs). Sixty-one cells (30 PTNs) exhibited significant temporal modulation of their irregularity during task performance with the contralateral hand. The irregularity modulations generally differed in sign and latency from the modulations of firing rate. High irregularity tended to occur during the task phases requiring the most detailed control of movement, whereas neural firing became more regular during the steady hold phase. Such irregularity modulation could have important consequences for the response of downstream neurons and may provide insight into the nature of the cortical code. INTRODUCTION When quantifying features of an experimentally recorded spike train, the firing rate is the most commonly used measure. However, other properties may also be of interest; one of these is the regularity of the discharge— how variable the interspike intervals are during periods of stationary rate. Irregularity of timing in spike trains has been has recently been the subject of considerable discussion in the literature in the context of rate coding versus temporal coding of the represented information (Shadlen and Newsome 1998; Softky and Koch 1993). In particular, it is not known whether irregularity can change in time in a similar way to firing rate. Such modulation of irregularity along a behavioral sequence could indicate the presence of temporal coding. However, measurement of irreg- ularity from experimental data is a challenging problem. Fur- ther progress requires the development and application of new metrics and is the purpose of this paper. Previous measurement of irregularity has largely been con- fined to evaluation of the coefficient of variation (CV) of the intervals, which is the ratio of the SD of the intervals to their mean. Physiological data on CV are available for the somato- sensory system (Werner and Mountcastle 1963), muscle spin- dles (Burke et al. 1979; Nordh et al. 1983; Stein and Matthews 1965), auditory system (Stabler et al. 1996; Young et al. 1988), visual system (Holt et al. 1996), and motor system (Prut and Perlmutter 2003; Stern et al. 1997). Possible sources of spike timing irregularity have been sought at the membrane and synaptic levels both in experimental (Mainen and Sejnowski 1995) and modeling studies (Salinas and Sejnowski 2001; Stein 1965 for a review). Modeling studies have examined the effects of membrane excitability on CV and output interspike interval structure (Gutkin and Ermentrout 1998), and of statis- tical assumptions about multiple synaptic inputs with regard to excitation and inhibition balance (Christodoulou and Bugmann 2000, 2001; Feng and Brown 1998) and correlation (Feng and Brown 1999 2000; Salinas and Sejnowski 2000, 2002; Svirkis and Rinzel 2000). However, the CV is not an ideal metric. We wish to study spike train irregularity when the data consist of some number of trials aligned to stimulus or behavioral events with the goal of a time-resolved measure conceptually similar to the peri- stimulus time histogram (PSTH) for firing rate. The CV could be used to characterize the distribution of intervals taken within a particular time bin and across trials. However, it will then measure not only the spike firing irregularity but also the extent to which firing rate varies across trials. Such trial-to-trial rate variation is a common feature of experimental data (Baker et al. 2001). In this paper, we examine several alternative metrics of irregularity that are independent of firing rate, only slightly affected by firing rate slope (both across and along trials) and have good time resolution. We characterize one such metric in considerable detail before applying it to data recorded from neurons in monkey motor cortex during a behavioral task. METHODS Definition and evaluation of irregularity metrics We define metrics of irregularity in the context of spike train data taken under conditions of repeated trials involving stimulus or behav- ioral events. The data may then be represented as a raster where each trial is a line of spike times, and all trials are aligned on a particular Address for reprint requests and other correspondence: S. N. Baker, Uni- versity of Newcastle upon Tyne, Sir James Spence Institute, Royal Victoria Infirmary, Newcastle upon Tyne NE1 4LP, UK (E-mail: stuart.baker@ ncl.ac.uk). The costs of publication of this article were defrayed in part by the payment of page charges. The article must therefore be hereby marked “advertisement” in accordance with 18 U.S.C. Section 1734 solely to indicate this fact. J Neurophysiol 96: 906 –918, 2006. First published March 22, 2006; doi:10.1152/jn.01030.2005. 906 0022-3077/06 $8.00 Copyright © 2006 The American Physiological Society www.jn.org
-
Upload
independent -
Category
Documents
-
view
1 -
download
0
Transcript of Based Computational Model. I. Descending Systems Circuits Generating Corticomuscular Coherence...

Innovative Methodology
Measurement of Time-Dependent Changes in the Irregularity ofNeural Spiking
Ronnie M. Davies,1 George L. Gerstein,2 and Stuart N. Baker3
1The Clinical School, Addenbrooke’s Hospital, Cambridge, United Kingdom; 2Department of Neuroscience, University of Pennsylvania,Philadelphia, Pennsylvania; and 3University of Newcastle upon Tyne, Sir James Spence Institute, Royal Victoria Infirmary,Newcastle upon Tyne, United Kingdom
Submitted 30 September 2005; accepted in final form 9 March 2006
Davies, Ronnie M., George L. Gerstein, and Stuart N. Baker.Measurement of time-dependent changes in the irregularity of neuralspiking. J Neurophysiol 96: 906–918, 2006. First published March 22,2006; doi:10.1152/jn.01030.2005. Irregularity of firing in spike trainshas been associated with coding processes and information transfer oralternatively treated as noise. Previous studies of irregularity havemainly used the coefficient of variation (CV) of the interspike intervaldistribution. Proper estimation of CV requires a constant underlyingfiring rate, a condition that most experimental situations do not fulfilleither within or across trials. Here we introduce a novel irregularitymetric based on the ratio of adjacent intervals in the spike train. Thenew metric is not affected by firing rate and is very localized in timeso that it can be used to examine the time course of irregularityrelative to an alignment marker. We characterized properties of thenew metric with simulated spike trains of known characteristics andthen applied it to data recorded from 108 single neurons in the motorcortex of two monkeys during performance of a precision grip task.Fifty-six cells were antidromically identified as pyramidal tract neu-rons (PTNs). Sixty-one cells (30 PTNs) exhibited significant temporalmodulation of their irregularity during task performance with thecontralateral hand. The irregularity modulations generally differed insign and latency from the modulations of firing rate. High irregularitytended to occur during the task phases requiring the most detailedcontrol of movement, whereas neural firing became more regularduring the steady hold phase. Such irregularity modulation could haveimportant consequences for the response of downstream neurons andmay provide insight into the nature of the cortical code.
I N T R O D U C T I O N
When quantifying features of an experimentally recordedspike train, the firing rate is the most commonly used measure.However, other properties may also be of interest; one of theseis the regularity of the discharge—how variable the interspikeintervals are during periods of stationary rate. Irregularity oftiming in spike trains has been has recently been the subject ofconsiderable discussion in the literature in the context of ratecoding versus temporal coding of the represented information(Shadlen and Newsome 1998; Softky and Koch 1993). Inparticular, it is not known whether irregularity can change intime in a similar way to firing rate. Such modulation ofirregularity along a behavioral sequence could indicate thepresence of temporal coding. However, measurement of irreg-ularity from experimental data is a challenging problem. Fur-ther progress requires the development and application of newmetrics and is the purpose of this paper.
Previous measurement of irregularity has largely been con-fined to evaluation of the coefficient of variation (CV) of theintervals, which is the ratio of the SD of the intervals to theirmean. Physiological data on CV are available for the somato-sensory system (Werner and Mountcastle 1963), muscle spin-dles (Burke et al. 1979; Nordh et al. 1983; Stein and Matthews1965), auditory system (Stabler et al. 1996; Young et al. 1988),visual system (Holt et al. 1996), and motor system (Prut andPerlmutter 2003; Stern et al. 1997). Possible sources of spiketiming irregularity have been sought at the membrane andsynaptic levels both in experimental (Mainen and Sejnowski1995) and modeling studies (Salinas and Sejnowski 2001;Stein 1965 for a review). Modeling studies have examined theeffects of membrane excitability on CV and output interspikeinterval structure (Gutkin and Ermentrout 1998), and of statis-tical assumptions about multiple synaptic inputs with regard toexcitation and inhibition balance (Christodoulou and Bugmann2000, 2001; Feng and Brown 1998) and correlation (Feng andBrown 1999 2000; Salinas and Sejnowski 2000, 2002; Svirkisand Rinzel 2000).
However, the CV is not an ideal metric. We wish to studyspike train irregularity when the data consist of some numberof trials aligned to stimulus or behavioral events with the goalof a time-resolved measure conceptually similar to the peri-stimulus time histogram (PSTH) for firing rate. The CV couldbe used to characterize the distribution of intervals taken withina particular time bin and across trials. However, it will thenmeasure not only the spike firing irregularity but also the extentto which firing rate varies across trials. Such trial-to-trial ratevariation is a common feature of experimental data (Baker etal. 2001). In this paper, we examine several alternative metricsof irregularity that are independent of firing rate, only slightlyaffected by firing rate slope (both across and along trials) andhave good time resolution. We characterize one such metric inconsiderable detail before applying it to data recorded fromneurons in monkey motor cortex during a behavioral task.
M E T H O D S
Definition and evaluation of irregularity metrics
We define metrics of irregularity in the context of spike train datataken under conditions of repeated trials involving stimulus or behav-ioral events. The data may then be represented as a raster where eachtrial is a line of spike times, and all trials are aligned on a particular
Address for reprint requests and other correspondence: S. N. Baker, Uni-versity of Newcastle upon Tyne, Sir James Spence Institute, Royal VictoriaInfirmary, Newcastle upon Tyne NE1 4LP, UK (E-mail: [email protected]).
The costs of publication of this article were defrayed in part by the paymentof page charges. The article must therefore be hereby marked “advertisement”in accordance with 18 U.S.C. Section 1734 solely to indicate this fact.
J Neurophysiol 96: 906–918, 2006.First published March 22, 2006; doi:10.1152/jn.01030.2005.
906 0022-3077/06 $8.00 Copyright © 2006 The American Physiological Society www.jn.org

selected stimulus or behavioral event. The time coordinate of theraster can later be binned. We seek metrics of irregularity the perfor-mance of which is comparable to that of a PSTH so that we can obtaina time-resolved average measure of irregularity relative to the align-ment event. Obviously adequate estimation of any metric will involveaveraging over some number of interspike intervals. Such averagescan be taken along trials (horizontally in the raster); this loses timeresolution relative to the alignment marker. Alternatively the averagecan be taken within a time bin but across trials (vertically in theraster); this preserves the desired time resolution but may createestimation difficulties if the trials are statistically different (for exam-ple in underlying firing rate). The desired irregularity metric shouldtherefore be independent of firing rate and also insensitive to firingrate change, i.e., d(rate)/dt.
A metric that meets the above requirements and uses two adjacentintervals (Ii and Ii�1) is
mi � �log�Ii� � log�Ii � 1�� (1)
or alternatively for computational convenience
mi � �log�Ii/Ii � 1�� (2)
where � � � denotes absolute value, and log is the natural logarithm. Thevalue of the metric applies over the entire time span of the twoadjacent intervals; however, for computational convenience, we willtreat it as a point event at the time of the middle spike. To avoid lossof data by binning, we first calculate the metric for each (overlapping)pair (i.e., intervals 1,2 then 2,3, etc) along each line of the raster,assigning each value to the time of the corresponding middle spike.After this is done for each trial of the raster, time bins can be imposed.In this way, even though a given interval pair straddles a time binboundary, its irregularity metric value will be assigned to the appro-priate bin, and all available interval pairs in the data will have beenused. At this stage, we may examine the probability distributionfunction, average and SD of the metric within any time bin and acrossall trials. We will abbreviate the average metric as IR, where IR �mean(m). Characterization of the performance of IR as a measure ofirregularity follows in RESULTS. Although we have performed numer-ical investigations of the properties of IR using intervals chosen froma gamma distribution, IR is independent of firing rate for interspikeintervals that follow any arbitrary probability distribution functionf(I). Formally, the expected value of IR for intervals distributedaccording to f(I) is the same as for intervals distributed according tof(kI).
We have examined a number of other metrics that are similarlyindependent of the average firing rate but less localized in time, so thatmodulation of rate either within or across trials can make the metricvalues problematic. An example of such a metric depends on a singleinterval (Ii) and local mean taken over n adjacent intervals on eitherside
mi � �Ii �1
2n � 1 �j�i�n
j�i�n
Ij�� 1
2n � 1 �j�i�n
j�i�n
Ij (3)
or alternatively for computational convenience
mi � ��Ii� 1
2n � 1 �j�i�n
j�i�n
Ij�� 1� (4)
Depending on details of individual datasets, there may be problemsin calculating the local mean interval. Maximum time resolutionwould be attained by using three adjacent intervals (n � 1 in Eqs. 3and 4; the irregularity metric then relates to the middle interval), andaveraging across trials within time bins. Although not explicitlyshown in this paper, in many stationary cases, the second irregularitymetric produces results very similar to the first metric. However, we
prefer the metric of Eqs. 1 and 2, since it is better localized and morerate insensitive. A further possible metric is that introduced byShinomoto et al. (2003) to calculate a measure they refer to as LV
mi �3�Ii � Ii � 1�
2
�Ii � Ii � 1�2 (5)
Like the metric of Eq. 2, this relies only on an interval pair and is thuswell localized. It was not the aim of this paper to compare theperformance of different metrics but rather to characterize one indetail. The remainder of this paper will therefore use the metricdefined in Eq. 2.
Investigation of the measures we developed required generation ofspike trains with known properties. For this purpose, we simulatedpoint processes with gamma-distributed intervals. The gamma densityhas previously been used to describe interval distributions because ithas two parameters that allow both rate and regularity (the “order” ofa gamma distribution) to be independently varied. At an order valueof one, the gamma interval distribution is exponential (as for a Poissonprocess, the most irregular case). At high order values �20, thedistribution is narrow and almost symmetric about its mean interval(i.e., 1/rate); this corresponds to the intervals produced by a pace-maker neuron (the regular case). In this paper, the rate and/or order ofthe gamma distribution was modulated, using simulation methodspreviously described (Baker and Gerstein 2000).
To determine how the irregularity measure was affected by corre-lation between successive interspike intervals, we produced simulatedspike trains as follows. N gamma distributed intervals were generated,and the median of the first M of these was determined. Denote ki as theindices of those intervals that are smaller than the median, and ji as theindices of those that are larger than or equal to the median. Theintervals were then reordered according to
I�2i � Iki
I�2i�1 � Iji i � 1 . . M/2 (6)
The remaining (N � M) intervals were left in their original order. Thismethod has the advantage that the interspike interval histogram isunchanged, whereas a negative serial correlation is introduced into theinterval sequence. The magnitude of this correlation was varied bychanging the fraction M/N from 0 to 50% in 10% steps.
After characterizing the measure properties with simulated data,they were applied to data from experimental recordings. All calcula-tions were carried out in the MATLAB language (Mathworks) onstandard PC Windows computers.
Behavioral task
Experimental data in this paper were recorded from two femalemacaque monkeys (monkey T, 6.1 kg; monkey E, 5.4 kg), purpose-bred for research and trained to perform a precision-grip task for foodreward. The behavioral task was a bilateral version of that used byBaker et al. (2001). The animal sat facing two precision-grip manipu-landa. Access to these manipulanda was initially obstructed by clearplastic barriers. A trial was initiated by placing each hand on homepad switches, located just in front of these barriers. After a delay, acue indicated whether left, right, or bimanual performance would berequired on that trial; these three possibilities were chosen at randomwith equal probability. The cue (0.5- to 1-s duration) consisted of a6-Hz vibration of the barrier and flashing light-emitting diodes(LEDs) on the relevant side or sides. After the cue was an instructeddelay period (0.5- to 1-s long), during which the animal had tomaintain both hands on the home pads. Both barriers then droppedallowing access to the manipulanda (the go cue). The animal wasrequired to reach out with the cued hand or hands and squeeze thelevers between finger and thumb in a precision grip. Both levers hadto be moved more than a criterion distance and held with this
Innovative Methodology
907MODULATION IN FIRING IRREGULARITY
J Neurophysiol • VOL 96 • AUGUST 2006 • www.jn.org

displacement for 1 s before they could be released to obtain a foodreward. The levers were attached to optical encoders that measuredlever displacement and torque motors that provided a resisting force.Under computer control, the motors simulated the action of a spring.A 0.15-N force was required to move each lever from its end stop;further movement produced increased resisting force with a springconstant of 0.03 N/mm of lever displacement. Auditory feedback ontask performance was provided using tones that indicated the differenttask phases. Early release of a home pad switch, or movement of anarm that had not been cued, resulted in failure of that trial and a returnto the initial condition. In this paper, we report only data fromunimanual trials. We refer to the trials as contralateral or ipsilateral,indicating whether the hand contralateral or ipsilateral to the recordedneurons was moving. All analysis was aligned to the end of the holdphase of the task. Trials were discarded from analysis if the animalmoved out of target prior to successful completion of the hold phase,if the delay between the go cue and entry into the target zone was�0.95 s, or if the delay between the end of the hold phase and leverrelease was �0.65 s.
Surgical preparation
Once behavioral training was complete, the animals were implantedwith a stainless steel headpiece to allow atraumatic head fixation(Lemon 1984). A recording chamber was placed over a craniotomycentered at stereotaxic coordinates A13 L18, providing access to thehand representation of primary motor cortex. Finally, fine stimulatingelectrodes (Microprobe, type LF01G) were inserted into the pyramidaltract (PT) at the level of the medulla, to permit antidromic identifi-cation of pyramidal tract neurons (PTNs) (see Baker et al. 1999;Lemon 1984). After recordings were complete in this chamber, asecond chamber was implanted at the same coordinates on the otherside, with corresponding PT electrodes, and further data were gath-ered from that hemisphere. All surgical operations were performedunder deep general anesthesia (2–2.5% isoflurane in 50:50 O2:N2O)using aseptic technique and were followed by a full course ofantibiotic (co-amoxiclav 140/35, 1.75 mg/kg clavulanic acid, 7 mg/kgamoxycillin, Synulox, Pfizer) and analgesic (buprenorphine; Veterge-sic, 10 �g/kg, Reckitt and Colman Products) treatment. At the end ofthe experiment, the animals were killed by overdose of anesthetic andperfused through the heart with fixative. Subsequent histologicalprocessing of the tissue confirmed that recording and stimulatingelectrodes had been correctly located. All procedures were carried outunder appropriate licenses from the UK Home Office.
Single-unit recordings
Single-unit activity was recorded from the motor cortex using a16-channel “Eckhorn” microdrive (Eckhorn and Thomas 1993;Thomas Recording, Giessen, Germany). After amplification (2–10 Kgain) and filtering (band-pass 300 Hz to 10 kHz), signals werecontinuously sampled at 25 kHz and stored for off-line analysis. Cellsthat responded antidromically to PT stimulation were confirmed asPTNs using a collision test (Baker et al. 1999). Spike waveforms werediscriminated into the occurrence times of single-unit action potentialsusing custom-written cluster cutting software. Only units with con-sistent spike waveforms and no interspike intervals �1 ms were usedfor subsequent analysis.
R E S U L T S
We first characterize properties of the two-interval irregu-larity metric m; we will abbreviate its mean value over someappropriate set of intervals as IR [IR � mean(m); see METH-ODS]. Using intervals simulated using gamma distributions ofconstant rate and order, the dependence of IR and CV (coef-
ficient of variation) on gamma order is shown in Fig. 1A.Exactly the same curves are obtained for any value of constantrate, demonstrating that IR and CV are both independent ofconstant firing rate value. Both IR and CV values change mostrapidly between low gamma orders and change very littlebetween gamma orders �15. The direct relation of IR to CVvalues is shown in Fig. 1B along with a diagonal line thatwould denote equality. Note that for gamma distributed inter-vals the CV is 1order. The difference between the utility ofIR and CV becomes apparent when we consider the estimationproblem. Estimation of mean and SD of intervals, as requiredfor CV, requires that the sample intervals be drawn from aprocess of constant rate. However, in real data, firing ratevaries both along and across trials, making it generally impos-sible to estimate CV. By contrast, estimation of IR requiresonly that firing rate be constant during the two adjacentintervals used in the m metric; it is essentially a local measurein time that is not affected by firing rate variations within oracross trials. Problems with IR estimation do arise if there arevery fast rate variations along a trial so that rate constancy overtwo adjacent intervals is violated; we will examine that situa-tion below and in Fig. 2.
Analytically or by simulation we can obtain the probabilitydensity function (PDF) of the m metric. This is shown for twovalues of gamma order in Fig. 1C; the curve is one-sidedbecause the m metric is defined by the absolute logarithm of theadjacent interval ratio. The highest probability occurs at an mvalue of 0, which corresponds to identical adjacent intervals.The probability rapidly decreases as adjacent intervals differ.Sample means from such a PDF are not normally distributedand have a long tail. This is shown in Fig. 1D, which shows theIR distribution over many samples of 10 values drawn from theorder 4 PDF in Fig. 1C. Vertical lines indicated the mean and2.5 and 97.5% points.
To satisfy our goal of a time resolved irregularity measure,we will average the irregularity metric values for intervalswithin a particular time bin over many aligned trials. Anytrial-to-trial variation of underlying rate will not affect thislocal estimate of the IR. The confidence limits of the IRestimate [mean(m) in the bin] will obviously depend on N, thenumber of interval pairs across trials in the particular time bin.A complicating factor, however, is that in computing the IR weuse overlapping interval pairs (1,2; 2,3; 3,4;. . .), thus introduc-ing some dependence into successive samples. Although de-tailed numbers and effects of this dependence will vary frombin to bin, on average there are twice as many interval pairs ina bin with the overlap calculation as there would be with acalculation that used independent samples by jumping (1,2;3,4; 5,6;. . .). We evaluated the upper and lower confidencelimits for the overlap case using simulation. Figure 1E showsthese results for 95 and 99% confidence limits as a function ofN, the number of interval pairs in the bin. Although the figureshows results using data simulated with gamma order 4, thecurves were similar for other orders. The figure is expressed asmultipliers of the quantity Q � SD(m)/N for the bin. If wewere dealing with independent and normally distributed val-ues, this quantity would be the SE for N independent events,and the multiplier would be 1.98 for the 95% confidence limit.In the present situation, N is twice what it would be forindependent interval pairs, and the SD of m is smaller. Q istherefore smaller than the corresponding SE for independent
Innovative Methodology
908 R. M. DAVIES, G. L. GERSTEIN, AND S. N. BAKER
J Neurophysiol • VOL 96 • AUGUST 2006 • www.jn.org

interval pairs. Thus although the multiplier values in Fig. 1Eare larger than the values appropriate for the independentsituation, the overall confidence limits will be smaller than ifnonoverlapping interval pairs had been used. The curve for theupper 95% confidence limit multiplier is well fitted by [1.21/log(N) � 2.29]. The multiplier for the corresponding lowerconfidence limit has a constant value of 2.25 for n � 5. Forgamma orders 4 and 8, the actual upper and lower 95%confidence limits as a function of N per bin are shown in Fig.1F. The asymmetry of the PDF mean distribution in Fig. 1Dunderlies the difference between upper and lower confidencelimits. Figure 1F provides an estimate of the sensitivity of themeasure: it shows the smallest change in IR that will bedetectable given a certain size of dataset.
An alternative method of computing IR would be to averageover a fixed number of values rather than using however manyvalues fall in a fixed time bin. This would mean that thetemporal resolution changed depending on the firing rate:during periods of high firing rate, a narrow time window wouldbe used, whereas at low rates, the temporal smearing would begreater. However, unlike the current method, the confidence
limits on IR would be of relatively constant size throughout.We prefer the current approach using a fixed bin width, ratherthan using a fixed number of intervals, because it is straight-forward to show a variable-sized confidence limit on a standardline plot. It is much harder to show clearly a variable timewindow associated with each IR estimate.
Although the irregularity metric is independent of firing rate(Fig. 1A), because it measures a ratio of two adjacent intervals,it is possible that its value could depend on the derivative ofrate d(rate)/dt. This is addressed in Fig. 2, where we illustratethe effects on the metric of different profiles of rate change—inall cases, data were simulated using a Gamma process ofconstant order 4 so that irregularity of firing was actually fixedthroughout. Figure 2A shows a step change in rate from 20 to200 Hz. The IR measure (Fig. 2B) is artifactually increased inthe single bin which encompasses the rate step (thick line).Note that the confidence limits are narrower after the step, asthe higher firing rate yields more spikes per bin.
Figure 2C illustrates a ramp rise in firing rate (from 20 to400 Hz in 0.5 s). The time resolved IR (Fig. 2D, thick line) isessentially flat except for a positive error in the single bin near
FIG. 1. A: average metric (IR) and coefficientof variation (CV) measures for Gamma distributedintervals of various orders. The same curves areobtained for any rate. See text for different esti-mation requirements. B: IR measure plottedagainst CV for the same set of Gamma intervaldistributions as A. The diagonal line (dashed)indicates equality. C: probability density function(PDF) of the m metric for Gamma order 4 and 8.D: asymmetric distribution of the IR measure[mean(m)] calculated for many draws of 10 sam-ples from the PDF of C. The mean is indicated bythe bold line, the 95% confidence limits by thedotted lines. E: coefficient to be applied to stan-dard error of the mean (SE) for confidence limitson the IR measure. This is required because of thepartial overlap of successive interval pairs as the mmetric is evaluated. F: actual 95% IR confidencelimits as a function of N, the number of m valuesaveraged, for Gamma interval distributions of or-der 4 (thin line) and 8 (thick line).
Innovative Methodology
909MODULATION IN FIRING IRREGULARITY
J Neurophysiol • VOL 96 • AUGUST 2006 • www.jn.org

the ramp onset. The critical variable here is the underlying ratechange over the time of the two adjacent intervals used forevaluating the m metric. Thus although the rate derivative isconstant throughout the ramp, the nonstationarity only perturbsthe metric significantly at low firing rates. The thin lines in Fig.2, B and D, shows the result of applying a correction procedurethat will be described in the following text. For the step ratechange, this effectively compensates for the error; for the rampchange, it results in an underestimate of the irregularity.
Figure 2, A—D, pertains to IR values in a bin near a ratedisturbance. To obtain greater insight into how rate changeseffect the IR measure, we examined the metric m obtained inthe immediate vicinity of a step rate change. We evaluated mfor each of the two interval pairs that involve the distortedinterval, one pair with the last normal interval before the step,one with the first normal interval after the step (see Fig. 2E).Averaging many such step events produces Fig. 2F, whichshows the corresponding error in the IR measure versus theratio of the rate before to the rate after the step. The error hasbeen calculated as the difference between the IR measured
from the distorted intervals (Fig. 2E), and the IR which ismeasured from pairs of intervals generated with stationary rateand the same gamma order (as in Fig. 1A). The top curve showsresults for the interval pair on the high rate side of the step, andthe bottom for the pair on the low rate side of the step; theirmean is also shown. The ordinate is the error. The errorincreases as the step size increases and is larger on the high rateside of the step. We have verified that the curves in Fig. 2F areindependent of the gamma order used in the simulation and ofthe absolute rate values used for the step; only the rate ratio isrelevant.
As an aside, note that even at a step rate ratio of one(corresponding to no rate change), there is a small positiveerror in m. This is an artifact of the method used to calculatethis figure. The middle interval (I2 in Fig. 2E) has been selectedas the one that straddles the assumed rate step. The process ofselecting an interval based on a fixed time biases the distribu-tion toward longer intervals. The intervals on either side (I1 andI3 in Fig. 2E) will show no such bias, and the result is a slightlyelevated value of the metric m, even if there is no actual rate
FIG. 2. IR measure errors caused by rapid firingrate changes, and correlation between successiveintervals. A and B: step rate profile and IR measurein 100-ms bins. Only the bin straddling the rate stepis in error. C and D: ramp rate profile and IRmeasure. Only values near start of the ramp are inerror. Thin curves in B and D show results of acorrection described in text. Gamma-distributed in-tervals of order 4 were used throughout. Horizontaldotted lines in B and D show the expected IR valuecalculated from stationary gamma distributed inter-vals of this order 4. E: schematic showing how a ratestep will corrupt two m metrics as the step falls intothe middle of 3 intervals, and m is evaluated for rightand left interval pairs. F: effects of rate steps on them metric. Top curve is for the interval pair at thehigh rate side of the step, bottom curve for the pairat the low rate side of the step. The middle curve isthe mean of the right and left pair calculation. G:example of joint interval scattergram for simulateddata with gamma order 8, and correlation betweensuccessive intervals of r � �0.30. H: dependence ofIR measure on size of joint interval correlation, forgamma orders 2, 4, 8, and 16.
Innovative Methodology
910 R. M. DAVIES, G. L. GERSTEIN, AND S. N. BAKER
J Neurophysiol • VOL 96 • AUGUST 2006 • www.jn.org
step. This effect is not seen when we average all metric valuesfalling within a certain bin, which is how we will normally usethe irregularity measure.
A further potential source of error in the IR measure is ifsuccessive intervals are correlated because the metric m de-pends on the joint probability distribution of Ii and Ii�1 (Eq. 2).To assess the effect of this, we simulated data with differentlevels of serial correlation, using the interval reorderingmethod described in METHODS. Figure 2G shows a joint-intervalscatter plot for such a simulation using gamma order 8, inwhich the first 50% of the intervals had been reordered. Forthese data, the correlation between successive intervals soproduced was r � �0.30. Figure 2H illustrates the effect ofdifferent levels of interval correlation on the IR measure forspike trains generated with varying underlying regularity. In-creasing the magnitude of the correlation elevates the estimateof IR; the numerical size of this effect is greatest for the mostirregular spike train (gamma order 2). Note, however, that evenwith interval correlations spanning the relatively high rangefrom r � 0 to �0.3, the curves relating to gamma orders 2, 4,8, and 16 have nonoverlapping values of IR.
Figure 2 indicates that the IR measure can be substantiallyaffected by rate steps; rate ramps by contrast are less problem-atic except when they start from low initial rates. Several
features of experimental data will act to lessen the IR errorscaused by such rate nonstationarities. First, because metricvalues are averaged in a bin, there will be a “dilution” effect:metrics corrupted by rate changes will be only a fraction ofthose averaged within the bin. This dilution will be greater athigh firing rates as more uncorrupted intervals will fall withina single bin. Second, real data are also likely to exhibit latencyjitter, such that the timing of the rate step is not precise relativeto the alignment marker. This will further dilute the IR error.However, it is clear that some caution must be exercised ininterpreting IR values in the presence of rapid rate changes.
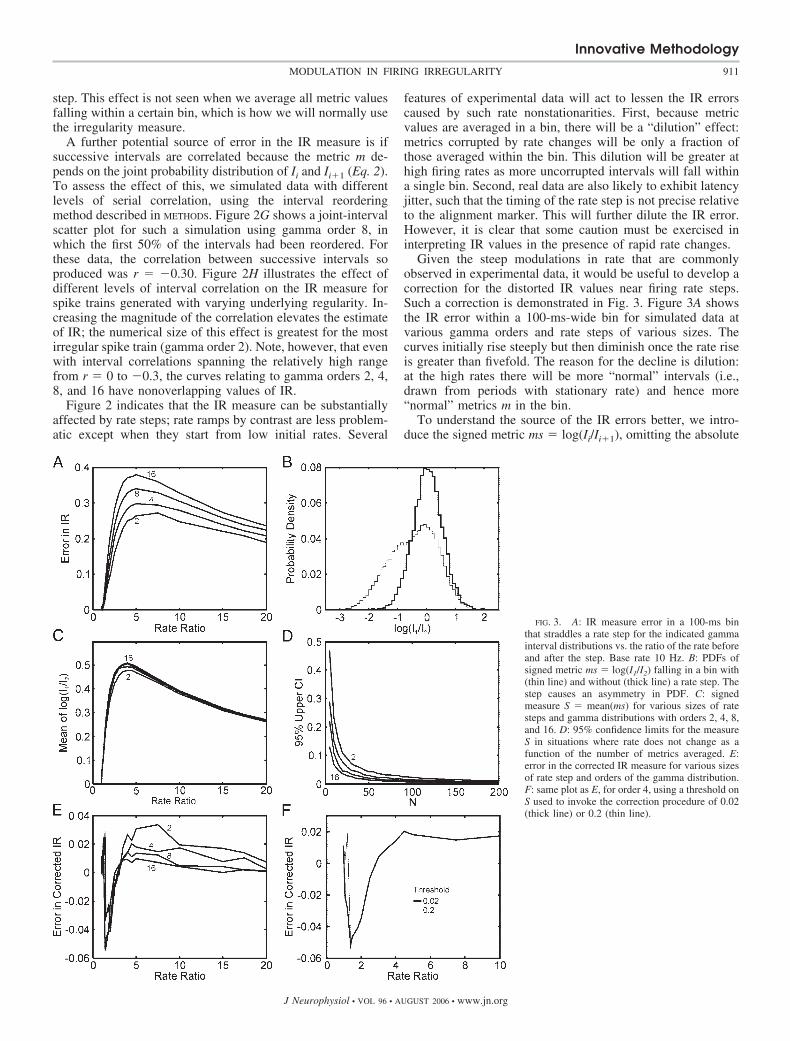
Given the steep modulations in rate that are commonlyobserved in experimental data, it would be useful to develop acorrection for the distorted IR values near firing rate steps.Such a correction is demonstrated in Fig. 3. Figure 3A showsthe IR error within a 100-ms-wide bin for simulated data atvarious gamma orders and rate steps of various sizes. Thecurves initially rise steeply but then diminish once the rate riseis greater than fivefold. The reason for the decline is dilution:at the high rates there will be more “normal” intervals (i.e.,drawn from periods with stationary rate) and hence more“normal” metrics m in the bin.
To understand the source of the IR errors better, we intro-duce the signed metric ms � log(Ii/Ii�1), omitting the absolute
FIG. 3. A: IR measure error in a 100-ms binthat straddles a rate step for the indicated gammainterval distributions vs. the ratio of the rate beforeand after the step. Base rate 10 Hz. B: PDFs ofsigned metric ms � log(I1/I2) falling in a bin with(thin line) and without (thick line) a rate step. Thestep causes an asymmetry in PDF. C: signedmeasure S � mean(ms) for various sizes of ratesteps and gamma distributions with orders 2, 4, 8,and 16. D: 95% confidence limits for the measureS in situations where rate does not change as afunction of the number of metrics averaged. E:error in the corrected IR measure for various sizesof rate step and orders of the gamma distribution.F: same plot as E, for order 4, using a threshold onS used to invoke the correction procedure of 0.02(thick line) or 0.2 (thin line).
Innovative Methodology
911MODULATION IN FIRING IRREGULARITY
J Neurophysiol • VOL 96 • AUGUST 2006 • www.jn.org

value in the definition of the normal irregularity metric m (seeMETHODS). Define a new measure by S � mean[log(Ii/Ii�1)]over an appropriate set of interval pairs as in a time bin. ThePDF of ms is strongly modified by presence of a rate step.Figure 3B compares this PDF for a gamma 8 process with andwithout a 5 rate step. Without the rate step the PDF issymmetric about zero, with the rate step, there is considerableasymmetry that is the source of the IR error. Note, however,that the distorted PDF values are on the negative side in thisexample. The PDF on the positive side is similar in shape tothat with no step change. The mean S will differ from zero dueto the asymmetry caused by the rate step. Absolute values ofsuch deviations from zero are shown (for a typical 100-ms binand many trials) in Fig. 3C. As in Fig. 3A, after the initialincrease up to a rate ratio of 5, there is a decrease for larger ratesteps; this again is simply the dilution by normal intervalsfalling within the bin. Figure 3D shows the upper 95% confi-dence limits for measure S, for the situation where there is nochange in rate, as a function of the number of metrics averaged.This indicates the limits within which we can expect S toremain if there is no rate change.
The one-sided distortion of the PDF of ms shown in Fig. 3Bsuggests a simple way to correct the IR error for bins contain-ing a rate step. Whenever the measure S exceeds some positiveor negative threshold, the IR will be computed using only theintervals and ms metric values that fell into the unscathed halfof the ms PDF. Thus for the 5 step condition shown in Fig.3B we would compute the IR using only interval pairs corre-sponding to the right half of the PDF. In each case we take theabsolute value of this estimate. The procedure reduces thenumber of metric values to be averaged, usually by over half,and therefore the confidence limits at such a bin will be widerthan at adjacent bins where the correction is not necessary.
The correction procedure strongly reduces the IR error asshown for various gamma orders and step sizes in Fig. 3E.Note that the maximum span of the error is about 1/10 of thatfor the uncorrected IR values in Fig. 3A. The choice ofthreshold value on S to trigger the correction procedure isarbitrary, but Fig. 3F demonstrates that the correction proce-dure is relatively insensitive to the chosen value.
Application of the IR measure to experimental data recordedfrom monkey motor cortex during performance of a precisiongrip task is shown in Figs. 4–6. In each case, trials have beenaligned on the end of the hold phase of the task, indicted byzero on the time scale (see METHODS). A bin width of 0.1 s wasused, chosen to be sufficiently small to represent the profile ofIR modulation but also large enough to yield narrow confi-dence limits on the IR estimates. The columns show averagedfinger and thumb position trace (Fig. 4A), the spike raster (B),PST histogram (C), time-resolved S measure (D), time-re-solved IR measure (with and without correction, thick and thinlines respectively, E), and comparison of the interval histo-grams from shaded regions of the IR graph (F). The shadedregion in Fig. 4D marks the threshold for IR correction. WhenS falls within this range, the IR measure is the average of allavailable m metrics. If S is lower than threshold, only positivem values contribute to the corrected IR; if S is above threshold,only negative m values contribute. In either case, the number ofm values available for averaging is reduced; the confidencelimits for the corrected bins are therefore wider than theadjacent uncorrected bins. For this cell, there were profound
step changes in firing rate, which produced large artifactualchanges in the uncorrected IR value around 1.1 s before the endhold marker. These were successfully removed by the correc-tion procedure. The time course of firing rate (Fig. 4C) wasquite different from the time course of the IR (Fig. 4E). Furtherconfirmation that firing regularity did indeed change in atask-dependent way was provided by examining interval his-tograms from different regions of the task (shaded regions inFig. 4E). Figure 4F plots these histograms; the abscissa islog(I) � log(I), which effectively normalizes the intervals for
FIG. 4. Analysis of a motor cortical neuron during task execution. Allpanels are aligned on the end of hold phase (0 on the time axis). A: averagedfinger and thumb lever displacements during the task. B: spike raster. C:peristimulus time histogram (PSTH). D: signed measure S. Gray shadingindicates the threshold for invoking the IR correction procedure. E: time-resolved IR measure corrected where necessary (thick line with error barsshowing 95% confidence limits). The uncorrected IR values shown by thin lineand circles. Vertical lines mark the 1-s-long hold period of the task. F:normalized interval histograms of activity from the 2 shaded regions in E. n �57 trials. Cell 10E01-130-1. This neuron was an antidromically identifiedpyramidal tract neuron (PTN; antidromic latency: 1.1 ms, threshold: 350 �A).
Innovative Methodology
912 R. M. DAVIES, G. L. GERSTEIN, AND S. N. BAKER
J Neurophysiol • VOL 96 • AUGUST 2006 • www.jn.org
firing rate. The interval distributions clearly differ in shape:intervals from region (a) in Fig. 4E, where IR is low, are morenarrowly distributed than those from the region with high IR(b).
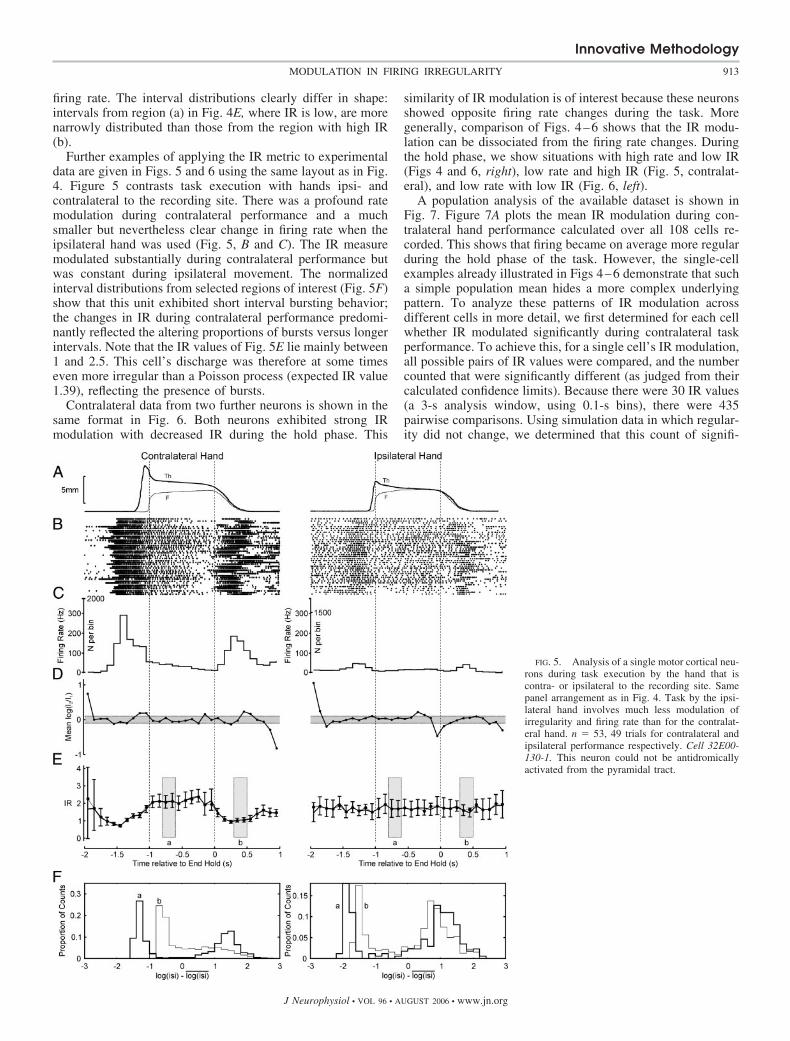
Further examples of applying the IR metric to experimentaldata are given in Figs. 5 and 6 using the same layout as in Fig.4. Figure 5 contrasts task execution with hands ipsi- andcontralateral to the recording site. There was a profound ratemodulation during contralateral performance and a muchsmaller but nevertheless clear change in firing rate when theipsilateral hand was used (Fig. 5, B and C). The IR measuremodulated substantially during contralateral performance butwas constant during ipsilateral movement. The normalizedinterval distributions from selected regions of interest (Fig. 5F)show that this unit exhibited short interval bursting behavior;the changes in IR during contralateral performance predomi-nantly reflected the altering proportions of bursts versus longerintervals. Note that the IR values of Fig. 5E lie mainly between1 and 2.5. This cell’s discharge was therefore at some timeseven more irregular than a Poisson process (expected IR value1.39), reflecting the presence of bursts.
Contralateral data from two further neurons is shown in thesame format in Fig. 6. Both neurons exhibited strong IRmodulation with decreased IR during the hold phase. This
similarity of IR modulation is of interest because these neuronsshowed opposite firing rate changes during the task. Moregenerally, comparison of Figs. 4–6 shows that the IR modu-lation can be dissociated from the firing rate changes. Duringthe hold phase, we show situations with high rate and low IR(Figs 4 and 6, right), low rate and high IR (Fig. 5, contralat-eral), and low rate with low IR (Fig. 6, left).
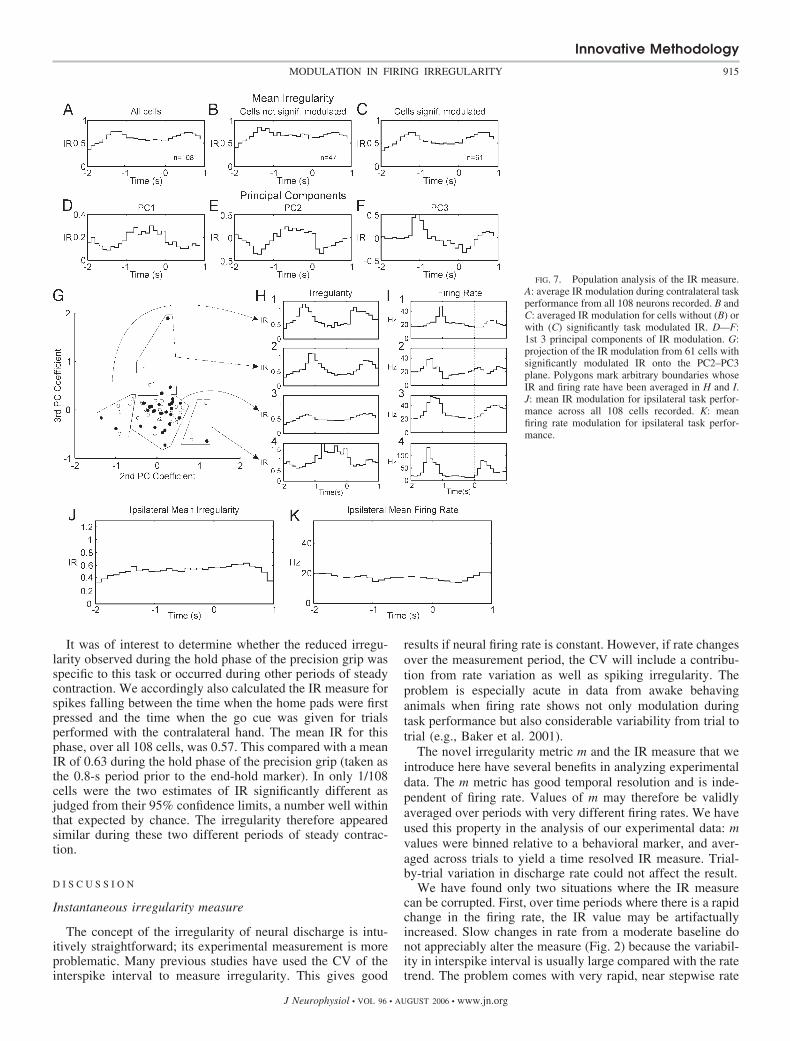
A population analysis of the available dataset is shown inFig. 7. Figure 7A plots the mean IR modulation during con-tralateral hand performance calculated over all 108 cells re-corded. This shows that firing became on average more regularduring the hold phase of the task. However, the single-cellexamples already illustrated in Figs 4–6 demonstrate that sucha simple population mean hides a more complex underlyingpattern. To analyze these patterns of IR modulation acrossdifferent cells in more detail, we first determined for each cellwhether IR modulated significantly during contralateral taskperformance. To achieve this, for a single cell’s IR modulation,all possible pairs of IR values were compared, and the numbercounted that were significantly different (as judged from theircalculated confidence limits). Because there were 30 IR values(a 3-s analysis window, using 0.1-s bins), there were 435pairwise comparisons. Using simulation data in which regular-ity did not change, we determined that this count of signifi-
FIG. 5. Analysis of a single motor cortical neu-rons during task execution by the hand that iscontra- or ipsilateral to the recording site. Samepanel arrangement as in Fig. 4. Task by the ipsi-lateral hand involves much less modulation ofirregularity and firing rate than for the contralat-eral hand. n � 53, 49 trials for contralateral andipsilateral performance respectively. Cell 32E00-130-1. This neuron could not be antidromicallyactivated from the pyramidal tract.
Innovative Methodology
913MODULATION IN FIRING IRREGULARITY
J Neurophysiol • VOL 96 • AUGUST 2006 • www.jn.org

cantly different pairs would not exceed 50 more than 5% of thetime by chance. Sixty-one cells had a pair count �50 and weretherefore assumed to have a significantly task-modulated IRvalue (P � 0.05). Figure 7B shows the average IR for theremaining 47 cells that were not significantly modulated. Thisaverage still shows a small modulation, consistent with thatfrom the significantly modulated population (Fig. 7C). It islikely therefore that some of the “unmodulated” cells did infact change their firing regularity with the task, but that it wastoo small relative to the noise level to be detectable.
To investigate the variation of IR modulation around thepopulation mean, a principal component analysis was carriedout. This used the IR modulation during contralateral taskperformance of the significantly modulated cells. The firstthree principal components are shown in Fig. 7, D—F; to-gether, these accounted for 75% of the variance in the IRmodulation. Figure 7G shows the projection of the IR modu-lation data onto the second and third principal component axes.Both identified PT neurons (F) and unidentified cells (E) areshown. Although no clear clustering was apparent, it is instruc-tive to view how rate and the IR measure modulate for differentsubsets of the population indicated by the rather arbitraryboundaries in 7G. This allows a concise overview of thediversity of patterns in modulation across the population,
without exhaustively presenting results from all cells. Thepanels of Fig. 7, H and I, show this; each plot corresponds todifferent regions (3) in Fig. 7G. The firing rate patterns fromFig. 7I, 1–4 are fairly similar with elevated firing during themovements before and after the hold portion of the task. Theassociated mean IR patterns in Fig. 7H, 1–4, show consider-able variety: irregularity may be lower during hold than duringpre- and post-movements (H, 1–3) or more rarely, irregularitymay be higher during hold (H4). The rises in IR values aroundtime –1 s also show considerable latency differences that arenot in step with the associated latency differences in the firingrate panels. Thus in H1 and I1, the initial IR peak is earlier thanthe rest of the population, whereas the initial firing rate peak islater. The reverse situation pertains for H2 and I2. Clearly theprecise details of these plots would be altered by changing thelocation of the boundaries placed on Fig. 7G. However, the keyconclusion is that irregularity changes do not simply mirror therate modulation.
A similar analysis was carried out for the IR modulationduring ipsilateral task performance. Only 15/108 cells showeda significantly modulated IR measure. The mean IR (Fig. 7J)and mean firing rate (Fig. 7K) across the entire population ofrecorded cells showed little modulation.
FIG. 6. Analysis of 2 further motor cortex neu-rons, using the same layout of panels as in Figs. 4and 5, during task performance with the contralat-eral hand. n � 48, 53 trials left and right panels,respectively. Left: cell was an antidromically iden-tified PTN (antidromic latency: 1.0 ms, threshold:90 �A); right: cell could not be antidromicallyactivated.
Innovative Methodology
914 R. M. DAVIES, G. L. GERSTEIN, AND S. N. BAKER
J Neurophysiol • VOL 96 • AUGUST 2006 • www.jn.org
It was of interest to determine whether the reduced irregu-larity observed during the hold phase of the precision grip wasspecific to this task or occurred during other periods of steadycontraction. We accordingly also calculated the IR measure forspikes falling between the time when the home pads were firstpressed and the time when the go cue was given for trialsperformed with the contralateral hand. The mean IR for thisphase, over all 108 cells, was 0.57. This compared with a meanIR of 0.63 during the hold phase of the precision grip (taken asthe 0.8-s period prior to the end-hold marker). In only 1/108cells were the two estimates of IR significantly different asjudged from their 95% confidence limits, a number well withinthat expected by chance. The irregularity therefore appearedsimilar during these two different periods of steady contrac-tion.
D I S C U S S I O N
Instantaneous irregularity measure
The concept of the irregularity of neural discharge is intu-itively straightforward; its experimental measurement is moreproblematic. Many previous studies have used the CV of theinterspike interval to measure irregularity. This gives good
results if neural firing rate is constant. However, if rate changesover the measurement period, the CV will include a contribu-tion from rate variation as well as spiking irregularity. Theproblem is especially acute in data from awake behavinganimals when firing rate shows not only modulation duringtask performance but also considerable variability from trial totrial (e.g., Baker et al. 2001).
The novel irregularity metric m and the IR measure that weintroduce here have several benefits in analyzing experimentaldata. The m metric has good temporal resolution and is inde-pendent of firing rate. Values of m may therefore be validlyaveraged over periods with very different firing rates. We haveused this property in the analysis of our experimental data: mvalues were binned relative to a behavioral marker, and aver-aged across trials to yield a time resolved IR measure. Trial-by-trial variation in discharge rate could not affect the result.
We have found only two situations where the IR measurecan be corrupted. First, over time periods where there is a rapidchange in the firing rate, the IR value may be artifactuallyincreased. Slow changes in rate from a moderate baseline donot appreciably alter the measure (Fig. 2) because the variabil-ity in interspike interval is usually large compared with the ratetrend. The problem comes with very rapid, near stepwise rate
FIG. 7. Population analysis of the IR measure.A: average IR modulation during contralateral taskperformance from all 108 neurons recorded. B andC: averaged IR modulation for cells without (B) orwith (C) significantly task modulated IR. D—F:1st 3 principal components of IR modulation. G:projection of the IR modulation from 61 cells withsignificantly modulated IR onto the PC2–PC3plane. Polygons mark arbitrary boundaries whoseIR and firing rate have been averaged in H and I.J: mean IR modulation for ipsilateral task perfor-mance across all 108 cells recorded. K: meanfiring rate modulation for ipsilateral task perfor-mance.
Innovative Methodology
915MODULATION IN FIRING IRREGULARITY
J Neurophysiol • VOL 96 • AUGUST 2006 • www.jn.org

changes particularly from low firing rates (Fig. 2). To over-come this problem, we have introduced an additional proce-dure based on the unsigned ms metric, which identifies andlargely compensates for such errors.
Second, if there is a correlation between successive in-terspike intervals, this can elevate the IR measure (Fig. 2G).Although experimental data often show a nonzero jointinterval correlation, this is usually positive and caused bythe profound task-dependent rate modulations. Short inter-vals occur during periods of high firing rate and hence areusually surrounded by short intervals; likewise, long inter-vals come from task phases with low firing rate and arepredominantly preceded or succeeded by long intervals.Such correlation due to rate modulation will not effect IR,which is robust even if rate changes greatly. No currentmethod exists to measure experimental interval correlationwhile correcting for modulating rate, and so it remainsuncertain if the sensitivity of IR to correlated intervals is apractical concern. However, it could be argued that negativeinterval correlation (as in Fig. 2, G and H) is just a furtherform of irregularity. In this case, the fact that it elevates IRcould be seen as an advantage of the method.
The time-resolved nature of the IR measure makes it wellsuited to analyses that seek to generate “surrogate” data; suchsurrogates are used to define the expected results of a particularnovel analysis method. Previous work (Baker and Lemon2000) has used surrogates with a firing rate that modulated asin the experimental data, and gamma distributed intervals offixed regularity. These surrogates were then used to determinethe number of spatiotemporal repeating patterns expected ina given dataset by chance. Our present results demonstrateconclusively that irregularity is not fixed (in a similar task tothat used by Baker and Lemon 2000) but modulates duringtask performance. The instantaneous irregularity measurecould be used to refine the gamma-based surrogate genera-tion process so that surrogates matched not only the single-trial firing rates of the experimental data but also thetrial-averaged modulation in irregularity. We note that othermethods of surrogate generation based on spike time dith-ering (Date et al. 1998, 2000) automatically preserve bothrate and irregularity profiles (G. L. Gerstein, unpublishedobservations). How better surrogates would affect the pre-dicted number of spatiotemporal repeating patterns (if at all)remains to be seen (Hatsopoulos et al. 2001).
An alternative potential method for assessing irregularityis to fit the observed spike train to a parametric model (e.g.,a gamma process as in Baker and Lemon 2000). Onceoptimal model parameters have been determined (Kass et al.2005; Truccolo et al. 2005), their values directly measureregularity. During the exploratory phase of this project, weinitially tried several such model-based approaches. Nonewere as practically effective as the metric-based analysisreported in this paper, and all were computationally morecomplex. In addition, it is theoretically more attractive tocarry out analysis in a model-free framework if possible,because even relatively good models such as the gammaprocess are unlikely to represent fully the subtleties of anexperimental spike train.
Causes of task-dependent changes
The high variability in interspike intervals that is commonlyseen in central neurons results from random fluctuations insynaptic inputs (Shadlen and Newsome 1998; Softky and Koch1992; Stein 1965). During the precision grip task performedwith the contralateral hand, many cells showed more regularfiring during the hold phase compared with the movementphase. This probably implies a reduction in the transmembranesynaptic voltage noise during holding compared with move-ment. Two distinctly different factors could contribute toproduce this.
First, the amount of synaptic input occurring per unit timecould be reduced. The average firing rate of many of theseneurons was reduced during the hold phase (Figs. 4–7), so thata reduction in excitatory drive to the motor cortical cells duringthis period appears reasonable. However, the synaptic noisewill depend on the total number of synapses active, bothexcitatory and inhibitory; it is not clear how the level ofinhibitory input might change during the hold phase. Second,the voltage noise will depend on the input conductance of theneuron, which determines the size of voltage excursion gener-ated by a single synaptic activation. It is conceivable that thecomplex interplay of voltage-gated channels responsible forthe afterhyperpolarization (AHP) in these cells could producea change in input conductance during the time of lowest firingrate.
Two other factors could contribute to the observed changesin firing irregularity. Wetmore and Baker (2004) and Chen andFetz (2005) recently showed that many motor cortical neuronshave a depolarizing peak in their membrane potential 10–60ms after a spike. At both low and high rates, spiking from sucha cell will be relatively unconstrained, yielding irregular firing.However, if the cell fires at intermediate rates, the meaninterval will coincide with the postspike potential peak. In thissituation, spikes will occur preferentially over the narrow rangeof intervals around the peak, resulting in more regular dis-charge. The average firing rate often fell to �25 Hz during thehold phase (Figs. 4–7). This is in the correct range for intervalsto align with the membrane potential peaks, and the lowirregularity seen during the hold phase may be partly caused bythis biophysical mechanism.
However, not all of the modulations in irregularity seen canbe explained as a biophysical byproduct of the profound ratemodulations that occur during task performance. For example,a subset of cells showed a significant increase in irregularityduring the hold phase of the task (Figs. 5 and 7); the rate profilefor these cells, as for many others, was low during the holdcompared with the movements before and after.
An alternative explanation for irregularity changes is that thecortical network has entered a different state. During steadycontractions, the motor cortex can generate synchronous burstsof oscillations, at frequencies around 10, and 15–35 Hz (Bakeret al. 1997; Kilner et al. 2000; Murthy and Fetz 1992; Stancakand Pfurtscheller 1996). During the hold phase of the precisiongrip task, a considerable fraction of the input to motor corticalneurons is synchronized to these network oscillations (Baker etal. 2003). As mentioned in the preceding text, the averageneural firing rate in the hold phase is �25 Hz. Cells that spikearound the peak of one network oscillation cycle will thereforebe coming close to threshold just as the next oscillation peak
Innovative Methodology
916 R. M. DAVIES, G. L. GERSTEIN, AND S. N. BAKER
J Neurophysiol • VOL 96 • AUGUST 2006 • www.jn.org

arrives. The range of intervals will then be contracted to lieclose to the oscillation period, and the discharge will becomemore regular. Interestingly, a similar modulation in networkoscillation amplitude is seen during performance of a precisiongrip with the ipsilateral as the contralateral hand (Kilner et al.2003). Our data, however, show far less modulation of irreg-ularity in this situation (Figs. 5 and 7). This implies thatnetwork oscillations are not the only explanation for the reg-ularity modulation which we report.
Impact of irregularity changes on downstream neurons
The changes in irregularity that we have observed areinteresting in their own right as they reflect the changing stateof the cortical network. However, they may also have impor-tant effects on downstream neurons receiving synaptic inputfrom these cells. Irregularity is unlikely to exert an effect whendownstream neurons simply sum over many inputs. The unionof a large number of spike trains with gamma-distributedinter-spike intervals tends toward a Poisson process (i.e.,highly irregular), regardless of the regularity of the summedinputs (Tiesinger 2004). However, the synapses made by thecortical cells may display history-dependent modulation of thepostsynaptic potential amplitude. In this case, irregularity willbecome important, as it will influence the relative proportionsof long and short intervals seen at a given firing rate.
One important class of neurons receiving input from thecells reported here is other cortical cells, both locally and indistant areas. Cortical neurons show an exquisite repertoire ofhistory-dependent modulation of synaptic efficacy (reviewed inThomson 2003), including facilitation, augmentation, depres-sion, and selective enhancement after inter-spike intervalsfalling in a narrow window (the “notch filter”). The relativeimportance of these history effects depends on both the type ofpre- and postsynaptic cell. Additional complications to theeffectiveness of a particular cortico-cortical connection cancome from the “state” of the postsynaptic cell as influenced byits other inputs (Petersen et al. 2003; Sachdev et al. 2004). Themodulation in irregularity reported here is therefore very likelyto alter the firing of other cortical neurons.
In addition, the motor cortical neurons that modulated theirirregularity included identified PTNs, which make monosyn-aptic connections to spinal motoneurons (Porter and Lemon1993). Motoneurons show a facilitation of synaptic inputs forshort interspike intervals (Porter 1970), although the reportedtime constant of this effect is �10 ms. Because the PTNs thatwe report generally fire at rates �100 Hz, there are usually fewvery short intervals for either regular or irregular neurons. Anexception would be when bursting is present (as in the uniden-tified cell illustrated in Fig. 5); changes in irregularity causedby alterations in the burst probability will almost certainly havean effect on the magnitude of excitatory postsynaptic potentials(EPSPs) produced in target motoneurons.
One report (Lemon and Mantel 1989) suggested that thecorticomotoneuronal synapse might show selective facilitationfor interspike intervals from 40 to 70 ms. If correct, themodulation in irregularity that we have observed could greatlyinfluence motoneurons. The mean firing rate during the holdphase of our task is �25 Hz (Fig. 7I), and changes in irregu-larity will alter the fraction of interspike intervals in theenhanced 40- to 70-ms range. However, Lemon and Mantel
(1989) pointed out that their indirect results could also beexplained by cortical synchronization rather than a property ofthe corticomotoneuronal synapse. Direct evidence for a “notchfilter” at the corticomotoneuronal synapse is lacking. Jacksonet al. (2006) recently reported spinal monosynaptic field po-tentials after paired corticospinal tract stimulation; these didnot show any significant enhancement for intervals �50 ms. Ittherefore remains uncertain whether changes in irregularitycould have functional significance for motoneuron activation.
Importance of irregularity changes for cortical computation
There are currently two conflicting theories of how neuronsencode and processes information. Conventionally, it is as-sumed that a neuron’s firing rate encodes information (Lettvinet al. 1959). To read this code, a downstream neuron musteffectively count spikes. Irregular firing introduces noise, re-quiring averaging over longer counting windows and multipleneurons to decode the information accurately (Shadlen andNewsome 1998). On this view, the periods of low firingirregularity are when the neuron is best able to transmitinformation with high signal-to-noise ratio.
By contrast, more recent work has suggested that precisespike timing may carry information (Abeles 1991; Gerstein etal. 1989). The observed variability in the interval distributionthen represents not superfluous noise but temporal encoding ofthe signal. Highly regular neural discharge then corresponds toa limited encoding space, and more information can be trans-mitted if a wide range of interspike intervals are permitted(irregular discharge). The relatively irregular discharge seen incortical neurons has been used as evidence to support both thetemporal and rate coding hypotheses by different authors(Shadlen and Newsome 1994; Softky and Koch 1992).
The predicted consequences of the irregularity changes ob-served here therefore depend on the model of neural represen-tation that is adopted. Although our present data cannot di-rectly resolve which model is correct, the task relationship ofthe irregularity changes is of interest. Our task incorporatescomplex and highly skilled motor acts, involving targetedreaching, fractionated hand shaping, and lever squeezing. Afterlever release, the hand is reshaped and reaches out for thereward. During these most-demanding phases of the task, themotor cortical discharge is on average most irregular. It be-comes regular only during the hold phase, which is by contraststraightforward: the animal must merely maintain a steadycontraction for a criterion time that leads to reward. Our resultstherefore associate periods of irregular discharge with complexmotor processing. This is contrary to the prediction of the ratecoding hypothesis but agrees with what would be expected ifthe motor cortex were using temporal coding during the solu-tion of this demanding motor problem.
A C K N O W L E D G M E N T S
The authors thank D. Soteropoulos, S. Rhodes, D. Wetmore, and R. Pyperfor assistance in gathering the experimental data described in this report.
G R A N T S
This work was funded by The Wellcome Trust to S. N. Baker and NationalInstitutes of Health Grants MH-46428 and DC-01249 to G. L. Gerstein.
R E F E R E N C E S
Abeles M. Corticonics. Neural Circuits of the Cerebral Cortex. Cambridge,UK: Cambridge Univ. Press, 1991.
Innovative Methodology
917MODULATION IN FIRING IRREGULARITY
J Neurophysiol • VOL 96 • AUGUST 2006 • www.jn.org
Baker SN and Gerstein GL. Improvements to the sensitivity of gravitationalclustering for multiple neuron recordings. Neural Comput 12: 2597–2620, 2000.
Baker SN and Lemon RN. Precise spatiotemporal repeating patterns inmonkey primary and supplementary motor areas occur at chance levels.J Neurophysiol 84: 1770–1780, 2000.
Baker SN, Olivier E, and Lemon RN. Task dependent coherent oscillationsrecorded in monkey motor cortex and hand muscle EMG. J Physiol 501:225–241, 1997.
Baker SN, Philbin N, Spinks R, Pinches EM, Wolpert DM, MacManusDG, Pauluis Q, and Lemon RN. Multiple single unit recording in thecortex of monkeys using independently moveable microelectrodes. J Neu-rosci Methods 94: 5–17, 1999.
Baker SN, Pinches EM, and Lemon SN. Synchronisation in monkey motorcortex during a precision grip task. II. Effect of oscillatory activity oncorticospinal output. J Neurophysiol 89: 1941–53, 2003.
Baker SN, Spinks R, Jackson A, and Lemon RN. Synchronization inmonkey motor cortex during a precision grip task. I. Task-dependentmodulation in single-unit synchrony. J Neurophysiol 85: 869–885, 2001.
Burke D, Skuse NF, and Stuart DG. The regularity of muscle spindledischarge in man. J Physiol 291: 277–290, 1979.
Chen D and Fetz EE. Characteristic membrane potential trajectories inprimate sensorimotor cortex neurons recorded in vivo. J Neurophysiol 94:2713–2725, 2005.
Christodoulou C and Bugmann G. Near Poisson-type firing produced byconcurrent excitation and inhibition. Biosystems 58: 41–48, 2000.
Christodoulou C and Bugmann G. Coefficient of variation (CV): vs meaninterspike interval (ISI) curves: what do they tell us about the brain?Neurocomput 38- 40: 1141–1149, 2001.
Date A, Bienenstock E, and Geman S. On the temporal resolution of neuralactivity. Technical Report, Division of Applied Mathematics, Brown Uni-versity. www.dam.brown.edu/people/elie/publications.html, 1998.
Date A, Bienenstock E, and Geman S. A statistical technique for thedetection of fine temporal structure in multi-neuronal spike trains. SocNeurosci Abstr 25: 1411, 1999.
Date A, Bienenstock E, and Geman S. A statistical tool for testing hypothesisabout the temporal resolution of neural activity. Soc Neurosci Abstr 26:828.6, 2000.
Eckhorn R and Thomas U. A new method for the insertion of multiplemicroprobes into neural and muscular tissue, including fiber electrodes, finewires, needles, and microsensors. J Neurosci Methods 49: 175–179, 1993.
Feng J and Brown D. Impact of temporal variation and the balance betweenexcitation and inhibition on the output of the perfect integrate-and-firemodel. Biol Cybern 78: 369–376, 1998.
Feng JF and Brown D. Coefficient of variation of interspike intervals greaterthan 0.5. How and when? Biol Cybern 80: 291–297, 1999.
Feng J and Brown D. Impact of correlated inputs on the output of theintegrate- and-fire model. Neural Comput 12: 671–692, 2000.
Gerstein GL, Bedenbaugh P, and Aertsen AMHJ. Neuronal assemblies.IEEE Trans Biomed Eng 36: 4–14, 1989.
Gutkin BS and Ermentrout GB. Dynamics of membrane excitability determineinterspike interval variability: a link between spike generation mechanismsand cortical spike train statistics. Neural Comput 10: 1047–1065, 1998.
Hatsopoulos NG, Amarasingham A, Bienenstock E, Geman S, and Dono-ghue J. Assessing precise temporal patterns of spikes among corticalneurons. Soc Neurosci Abstr 27: 63.1, 2001.
Holt GR, Softky WR, Koch C, and Douglas RJ. Comparison of dischargevariability in vitro and in vivo in cat visual cortex neurons. J Neurophysiol75: 1806–1814, 1996.
Jackson A, Baker SN, and Fetz EE. Tests for presynaptic modulation ofcorticospinal terminals from peripheral afferents and pyramidal tract in themacaque. J Physiol 573: 107–120, 2006.
Kass RE, Ventura V, and Brown EN. Statistical issues in the analysis ofneuronal data. J Neurophysiol 94: 8–25, 2005.
Kilner JM, Baker SN, Salenius S, Hari R, and Lemon RN. Human corticalmuscle coherence is directly related to specific motor parameters. J Neurosci20: 8838–8845, 2000.
Kilner JM, Salenius S, Baker SN, Jackson A, Hari R, and Lemon RN.Task-dependent modulations of cortical oscillatory activity in human sub-jects during a bimanual precision grip task. Neuroimage 18: 67–73, 2003.
Lemon RN. Methods for Neuronal recording in Conscious Animals. IBROHandbook Series: Methods in Neurosciences. London: Wiley, 1984.
Lemon RN and Mantel GWH. The influence of changes in the dischargefrequency of corticospinal neurons on hand muscles in the monkey.J Physiol 413: 351–378, 1989.
Lettvin JY, Maturana HR, McCulloch WS, and Pitts WH. What the frog’seye tells the frog’s brain. Proc Inst Radio Eng 47: 1940–1951, 1959.
Mainen ZF and Sejnowski TJ. Reliability of spike timing in neocorticalneurons. Science 268: 1503–1506, 1995.
Murthy VN and Fetz EE. Coherent 25- to 35-Hz oscillations in the sensori-motor cortex of awake behaving monkeys. Proc Natl Acad Sci USA 89:5670–5674, 1992.
Nordh E, Hulliger M, and Vallbo AB. The variability of inter-spike intervalsof human spindle afferents in relaxed muscles. Brain Res 271: 89–99, 1983.
Petersen CC, Hahn TT, Mehta M, Grinvald A, and Sakmann B. Interactionof sensory responses with spontaneous depolarization in layer 2/3 barrelcortex. Proc Natl Acad Sci USA 100: 13638–13643, 2003.
Porter R. Early facilitation at corticomotoneuronal synapses. J Physiol 207:733–745, 1970.
Porter R and Lemon RN. Corticospinal Function and Voluntary Movement. Phys-iological Society Monograph Series. Oxford, UK: Oxford Univ. Press, 1993.
Prut Y and Perlmutter SI. Firing properties of spinal interneurons duringvoluntary movement. I. State-dependent regularity of firing. J Neurosci 23:9600–9610, 2003.
Sachdev RN, Ebner FF, and Wilson CJ. Effect of subthreshold up and downstates on the whisker-evoked response in somatosensory cortex. J Neuro-physiol 92: 3511–3521, 2004.
Salinas E and Sejnowski TJ. Impact of correlated synaptic input on outputfiring rate and variability in simple neuronal models. J Neurosci 20:6193–6209, 2000.
Salinas E and Sejnowski TJ. Correlated neuronal activity and the flow ofneural information. Nat Rev Neurosci 2: 539–550, 2001.
Salinas E and Sejnowski TJ. Integrate-and-fire neurons driven by correlatedstochastic input. Neural Comput 14: 2111–2155, 2002.
Shadlen MN and Newsome WT. Noise, neural codes and cortical organiza-tion. Curr Opin Neurobiol 4: 569–579, 1994.
Shadlen MN and Newsome WT. The variable discharge of cortical neurons:implications for connectivity, computation, and information coding. J Neu-rosci 18: 3870–3896, 1998.
Shinomoto S, Shima K, and Tanji J. Differences in spiking patterns amongcortical neurons. Neural Comput 15: 2823–2842, 2003.
Softky WR and Koch C. Cortical cells should fire regularly, but do not.Neural Comput 4: 643–646, 1992.
Softky WR and Koch C. The highly irregular firing of cortical cells isinconsistent with temporal integration of random EPSPs. J Neurosci 13:334–350, 1993.
Stabler SE, Palmer AR, and Winter IM. Temporal and mean rate dischargepatterns of single units in the dorsal cochlear nucleus of the anesthetizedguinea pig. J Neurophysiol 76: 1667–1688, 1996.
Stancak A and Pfurtscheller G. Mu-rhythm changes in brisk and slowself-paced finger movements. Neuroreport 7: 1161–1164, 1996.
Stein RB. A theoretical analysis of neuronal variability. Biophys J 5: 173–194,1965.
Stein RB and Matthews PB. Differences in variability of discharge frequencybetween primary and secondary muscle spindle afferent endings in the cat.Nature 208: 1217–1218, 1965.
Stern EA, Kincaid AE, and Wilson CJ. Spontaneous subthreshold membranepotential fluctuations and action potential variability of rat corticostriatal andstriatal neurons in vivo. J Neurophysiol 77: 1697–1715, 1997.
Svirskis G and Rinzel J. Influence of temporal correlation of synaptic input on the rateand variability of firing in neurons. Biophys J 79: 629–637, 2000.
Tiesinga PHE. Chaos-induced modulation of reliability boosts output firingrate in downstream cortical areas. Phys Rev E Stat Nonlin Soft Matter Phys69: 031912, 2004.
Thomson AM. Presynaptic frequency- and pattern-dependent filtering. J Com-put Neurosci 15: 159–202, 2003.
Truccolo W, Eden UT, Fellows MR, Donoghue JP, and Brown EN. A pointprocess framework for relating neural spiking activity to spiking history,neural ensemble, and extrinsic covariate effects. J Neurophysiol 93: 1074–1089, 2005.
Werner G and Mountcastle VB. The Variability of central neural activity ina sensory system, and its implications for the central reflection of sensoryevents. J Neurophysiol 26: 958–977, 1963.
Wetmore DZ and Baker SN. Post-spike distance-to-threshold trajectories ofneurones in monkey motor cortex. J Physiol 555: 831–850, 2004.
Young ED, Robert JM, and Shofner WP. Regularity and latency of units inventral cochlear nucleus: implications for unit classification and generationof response properties. J Neurophysiol 60: 1–29, 1988.
Innovative Methodology
918 R. M. DAVIES, G. L. GERSTEIN, AND S. N. BAKER
J Neurophysiol • VOL 96 • AUGUST 2006 • www.jn.org