
Surface EMG in Subacute and Chronic Care after Traumatic ...
Upload
independentCategory
view
1download
0
Hindawi Publishing CorporationEURASIP Journal on Advances in Signal ProcessingVolume 2010, Article ID 918012, 9 pagesdoi:10.1155/2010/918012
Research Article
Interactions between Uterine EMG at Different SitesInvestigated Using Wavelet Analysis: Comparison ofPregnancy and Labor Contractions
Mahmoud Hassan,1, 2 Jeremy Terrien,2 Brynjar Karlsson,2, 3 and Catherine Marque1
1 UMR CNRS 6600, Biomecanique et Bio-ingenierie, Universite de Technologie de Compiegne, 60200 Compiegne, France2 School of Science and Engineering, Reykjavik University, Menntavegur 1 101 Reykjavik, Iceland3 Institute of Physiology, University of Iceland, Sæmundargotu 2 101 Reykjavik, Iceland
Correspondence should be addressed to Mahmoud Hassan, [email protected]
Received 30 December 2009; Revised 22 March 2010; Accepted 6 May 2010
Academic Editor: Aydin Akan
Copyright © 2010 Mahmoud Hassan et al. This is an open access article distributed under the Creative Commons AttributionLicense, which permits unrestricted use, distribution, and reproduction in any medium, provided the original work is properlycited.
This paper describes the use of the Morlet wavelet transform to investigate the difference in the time-frequency plane betweenuterine EMG signals recorded simultaneously on two different sites on women’s abdomen, both during pregnancy and in labor.The methods used are wavelet transform, cross wavelet transform, phase/amplitude correlation, and phase synchronization. Wecomputed the linear relationship and phase synchronization between uterine signals measured during the same contractions attwo different sites on data obtained from women during pregnancy and labor. The results show that the Morlet wavelet transformcan successfully analyze and quantify the relationship between uterine electrical activities at different sites and could be employedto investigate the evolution of uterine contraction from pregnancy to labor.
1. Introduction
There are many open questions concerning the functioningof the human uterus. One of these open questions concernsexactly how the uterus operates as an organ to performthe very organized act of contracting, in a synchronizedway, to expulse a new human into this world. If we donot understand how the uterus works when it is workingnormally, it is obvious that we will not be able to detector even prevent problems when it does not work properlyleading to child born before time, sometimes with tragicconsequences.
Uterine electromyography has been a research subjectfor many years since the 1950s. It has been proven tobe of interest for pregnancy and parturition monitoring[1–4].
Uterine electromyogram recorded externally in women,the so-called electrohysterogram (EHG), has been proven tobe representative of uterine contractility. The analysis of thissignal may allow the prediction of a preterm labor threat assoon as 28 weeks of gestation (WG) [5].
One of the ways used to understand the functioningof biological systems is the detection of the relationshipbetween signals. Several methods are proposed; it canbe done by detecting the amplitude correlation (linearand nonlinear regression. . .), or the frequency relation(coherence. . .), or the phase synchronization and the depen-dency in time-frequency domain.
There have been little studies in the past concerningthe application of these methods on EHG signals. One ofthe most important work was Marque et al. who showed,by using linear correlation coefficient, that the strongestcorrelation between bursts is located at the low frequencycomponent [6]. The intercorrelation is however a temporalmethod; it cannot be used to analyze the interplay of variousfrequency components independently.
Furthermore, classical interrelation measures such asFourier-based coherence and correlation rely on the station-arity of the measured signals, which is a condition that israrely fulfilled with real biological signals.
Time frequency distributions (TFDs) were introducedas means of representing signals whose frequency content
2 EURASIP Journal on Advances in Signal Processing
is varying with time, and for which both time domainrepresentations and frequency domain representations areinadequate to appropriately describe the signal. Many dif-ferent TFDs of a signal exist, including, but not limitedto, the Wigner-Ville distribution (WVD), the spectrogramusing a Short Time Fourier Transform (STFT), the wavelettransform (WT), the Hilbert Huang transform (HHT) andother methods that evaluate several parameters with TFD,such as the relationship between the instantaneous frequency(IF) and the TFD’s [7]. Recently, alternative tools basedon wavelet analysis have been developed and successfullyapplied to biological signals like EEG/MEG signals [8]. Theyallow tracking the time course of coherence in nonstationaryneuronal signals with good temporal and frequency resolu-tion.
Several approaches have been taken to study the relation-ship between nonstationary signals in the time-frequencydomain. The three main approaches are
(1) multiple window time frequency analysis (MW-TFA)[9],
(2) frequency-dependant correlation coefficient [10],
(3) time varying causal coherence function (TVCCF)based on the multivariate autoregressive model [11].
We chose to use the complex-wavelet analysis because,due to its variable window length, depending on the analyzedfrequency band, it does not suppose a particular model ofthe data. Furthermore, another advantage is the possibility itoffers to extract phase information. In addition, the waveletanalysis has been used with success on many types of signalssuch as EEG signals [12] as well as geophysical time series[13].
In a previous work, we have used the “wavelet coherence”to detect the interaction between the uterine electricalactivities [14].
The results has shown the presence of higher coherenceat the low frequency with constant phase shift [15]. Anotherinteresting result is the possibility to use wavelet coherenceon the whole signal without segmentation of the burstsof contractile activity [14]. However, the wavelet coherencedepends on both amplitude and phase of the time series.Therefore, we cannot detect the nature of the relation byusing the wavelet coherence.
The aim of this work is to separate the two kinds ofinformation (phase and amplitude) in order to detect thenature of the relation between the uterine bursts in thetime-frequency plane. First, we compute the scalogram oftwo uterine bursts and get their cross-scalogram. We thenuse two methods to describe phase and amplitude relation.The first method is the wavelet local correlation coefficient(WLCC), which detects the phase correlation. The secondone is the cross wavelet coherence function (CWCF), whichdetects the amplitude correlation. The phase synchronizationis described by the wavelet synchronization index, whichcan reveal the phase synchronization in the time-frequencydomain. This index is used to evidence a difference betweensets of uterine bursts during pregnancy and labor.
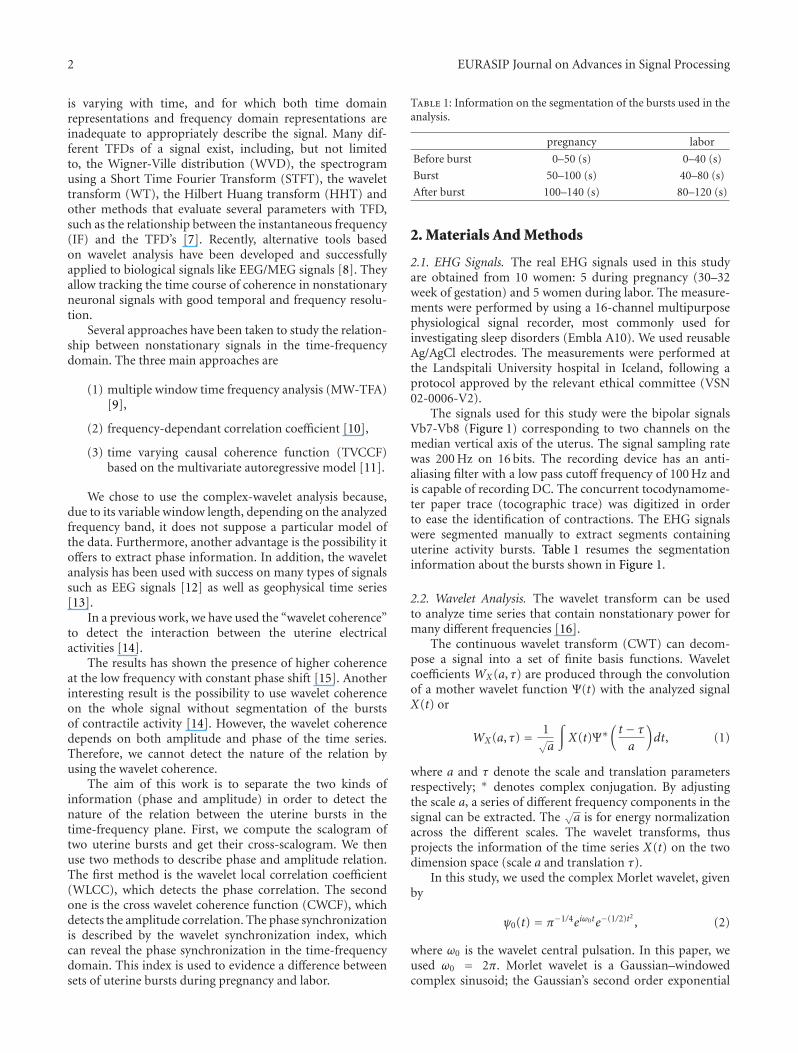
Table 1: Information on the segmentation of the bursts used in theanalysis.
pregnancy labor
Before burst 0–50 (s) 0–40 (s)
Burst 50–100 (s) 40–80 (s)
After burst 100–140 (s) 80–120 (s)
2. Materials And Methods
2.1. EHG Signals. The real EHG signals used in this studyare obtained from 10 women: 5 during pregnancy (30–32week of gestation) and 5 women during labor. The measure-ments were performed by using a 16-channel multipurposephysiological signal recorder, most commonly used forinvestigating sleep disorders (Embla A10). We used reusableAg/AgCl electrodes. The measurements were performed atthe Landspitali University hospital in Iceland, following aprotocol approved by the relevant ethical committee (VSN02-0006-V2).
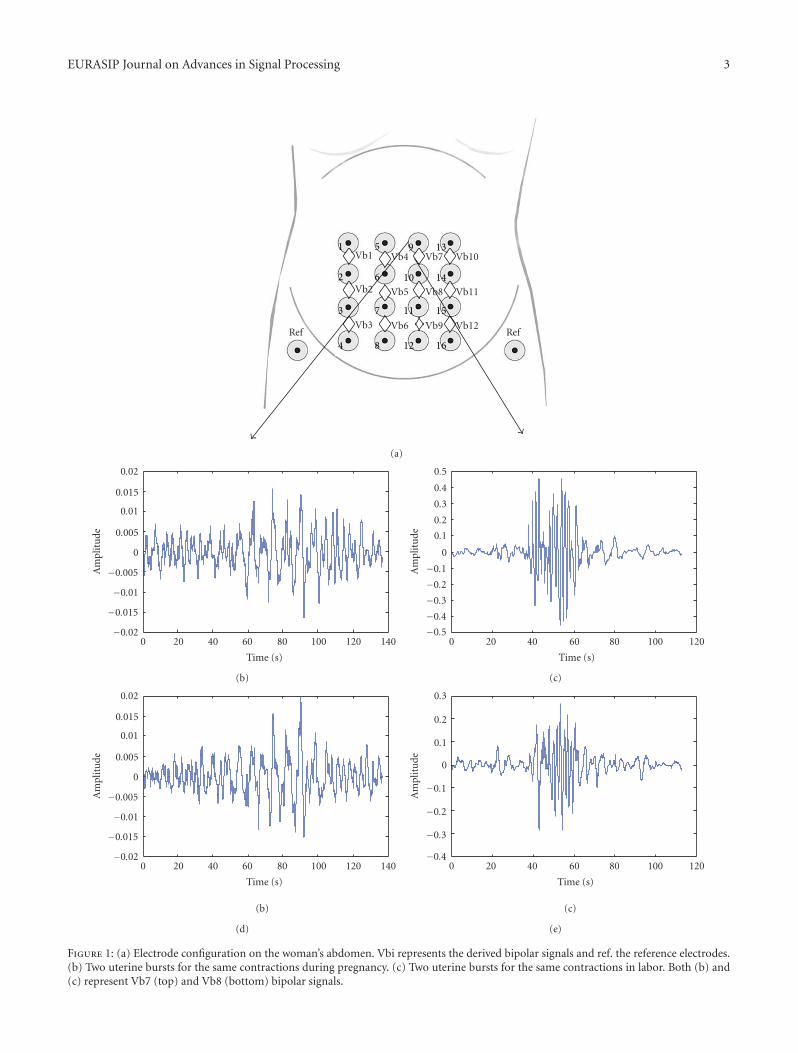
The signals used for this study were the bipolar signalsVb7-Vb8 (Figure 1) corresponding to two channels on themedian vertical axis of the uterus. The signal sampling ratewas 200 Hz on 16 bits. The recording device has an anti-aliasing filter with a low pass cutoff frequency of 100 Hz andis capable of recording DC. The concurrent tocodynamome-ter paper trace (tocographic trace) was digitized in orderto ease the identification of contractions. The EHG signalswere segmented manually to extract segments containinguterine activity bursts. Table 1 resumes the segmentationinformation about the bursts shown in Figure 1.
2.2. Wavelet Analysis. The wavelet transform can be usedto analyze time series that contain nonstationary power formany different frequencies [16].
The continuous wavelet transform (CWT) can decom-pose a signal into a set of finite basis functions. Waveletcoefficients WX(a, τ) are produced through the convolutionof a mother wavelet function Ψ(t) with the analyzed signalX(t) or
WX(a, τ) = 1√a
∫X(t)Ψ∗
(t − τa
)dt, (1)
where a and τ denote the scale and translation parametersrespectively; ∗ denotes complex conjugation. By adjustingthe scale a, a series of different frequency components in thesignal can be extracted. The
√a is for energy normalization
across the different scales. The wavelet transforms, thusprojects the information of the time series X(t) on the twodimension space (scale a and translation τ).
In this study, we used the complex Morlet wavelet, givenby
ψ0(t) = π−1/4eiω0te−(1/2)t2 , (2)
where ω0 is the wavelet central pulsation. In this paper, weused ω0 = 2π. Morlet wavelet is a Gaussian–windowedcomplex sinusoid; the Gaussian’s second order exponential
EURASIP Journal on Advances in Signal Processing 3
1 5
4
3
2
9
8
7
6
12
11
10
16
15
14
13
Ref Ref
Vb1
Vb2
Vb3
Vb4
Vb5
Vb6
Vb7
Vb8
Vb9
Vb10
Vb11
Vb12
(a)
−0.02
−0.015
−0.01
−0.005
0
0.005
0.01
0.015
0.02
0 20 40 60 80 100 120 140
Time (s)
Am
plit
ude
(b)
−0.5
−0.4
−0.3
−0.2
−0.1
0
0.1
0.2
0.3
0.4
0.5
0 20 40 60 80 100 120
Time (s)
Am
plit
ude
(c)
−0.02
−0.015
−0.01
−0.005
0
Am
plit
ude 0.005
0.01
0.015
0.02
0 20 40 60
Time (s)
(b)
80 100 120 140
(d)
−0.4
−0.3
−0.2
−0.1
0
0.1
0.2
(c)
0.3
0 20 40 60 80 100 120
Time (s)
Am
plit
ude
(e)
Figure 1: (a) Electrode configuration on the woman’s abdomen. Vbi represents the derived bipolar signals and ref. the reference electrodes.(b) Two uterine bursts for the same contractions during pregnancy. (c) Two uterine bursts for the same contractions in labor. Both (b) and(c) represent Vb7 (top) and Vb8 (bottom) bipolar signals.

4 EURASIP Journal on Advances in Signal Processing
decay of the Morlet function gives a good time localizationin the time domain [17]. We chose this wavelet as it pro-vides simultaneously the signal amplitude and phase. Thisproperty allows us to use the complex Morlet Wavelet trans-form (cMWT) to investigate the coherence/synchronizationbetween two signals recorded at two different sites simulta-neously.
Based on cMWT, the wavelet power of a time series X(t)at the time scale space is called the scalogram. It is simplydefined as the squared modulus of WX(a, τ).
Given two time series X and Y , their cMWT areWX(a, τ) and WY (a, τ), respectively. Their cross-cMWT isdefined as WXY (a, τ) = WX(a, τ)W∗
Y (a, τ), where ∗ meanscomplex conjugation. The plot of |WXY (a, τ)|2 is calledcross-scalogram [12]. It provides the means to indicate thecoincident events over frequency, for each time in the signalsX and Y .
Cross-scalogram is a measure of the similarity of power,at different frequency bands, for two separate uterine signals.It gives a “direct” estimation of the correlation of two uterineactivities in the time–frequency domain. So the estimatedvalues contain bias and noise information. In preliminarywork [14], we used the wavelet coherence to describe therelation between our signals in the time-frequency domain.The wavelet coherence computes the relation in phase andamplitude simultaneously. It does not permit to describeseparately the relations of amplitude and phase between twouterine electrical activities. As we are interested in identifyingthe nature of the relation between EHG signals, we choose touse two different methods that focus on separate aspects ofthe relationship between the signals, namely, the phase andthe amplitude.
(i) The first method is the Wavelet local correlationcoefficient (WLCC), proposed by [18] and defined as
WLCC(a, τ) = Re[∣∣WXY(a,τ)
∣∣]|WX(a, τ)||WY (a, τ)| , (3)
where Re is the real part of WXY . WLCC is a tool thatdescribes the phase correlation between two time series inthe time-frequency domain.
(ii) The second method is the cross wavelet coherencefunction (CWCF) which computes the amplitude (intensity)relation between two signals in the time-frequency domain[19]. It is defined as
CWCF(a, τ) = 2∣∣WXY(a,τ)
∣∣2
|WX(a, τ)|4 + |WY (a, τ)|4 . (4)
The values of CWCF range between 0 (no amplitudecorrelation between X and Y) and 1 (X and Y are totallycorrelated in amplitude).
The application of these 2 methods on EEG signalshas indicated that phase correlation decreases during thetransition from interictal stage to ictal stage and thatamplitude correlation increases from interictal to ictal [12].
Simultaneously, with CWCF and WLCC, we computedthe phase difference between X and Y in the time-frequencyplane, defined as
φ(a, τ) = tan−1(
Re(WXY (s, τ))Im(WXY (s, τ))
). (5)
Re is the real part of the cross-cMWT and Im is itsimaginary part.
The phase difference is represented by arrows with bothmethods: WLCC and CWCF. Phase arrows indicate the phasedifference of the two bursts being compared. This can alsobe interpreted as a lead/lag: if the arrows are oriented to theright it means that the two signals are in phase and if they areoriented to the left it means that the signals are in antiphase.
The parameter used for measuring phase synchroniza-tion is the relative phase angle between two oscillatorysystems. The Morlet wavelet transform acts as a bandpassfilter and, at the same time, yields separate values for theinstantaneous amplitude A(t) and the phase Φ(t) of a timeseries signal at a specific frequency. Thus, the wavelet phasesof two signals X and Y can be used to determine theirinstantaneous phase difference in a given frequency band,and to establish a synchronization measure (Wavelet PhaseSynchronization: WPS) which quantifies the coupling ofphases independently from amplitude effects.
The principle of phase synchronization corresponds to aphase locking between two systems defined as
ϕn,m(t) = |nΦX(t)−mΦY (t)| ≤ C, (6)
where ΦX(t) and ΦY (t) are the unwrapped phases of thesignals of the two systems and C is a constant. For real noisydata the cyclic relative phase, ϕn,m(t)mod 2π, is preferentiallyused. Note that according to the above equation, the phasedifference has to be calculated from the univariate phaseangle. Phase locking is observed if the phase differenceremains approximately constant over some time period.
In order to evidence the variation of the strength ofphase synchronization between two uterine segment bursts,we used the intensity of the first Fourier mode of thedistribution, given by
γn,m(t) =√⟨
cos(ϕn,m(t)
)⟩2 +⟨
sin(ϕn,m(t)
)⟩2, (7)
where 〈〉 denotes the average over time. The measure ofsynchronization strength range from 0 to 1. It is also calledthe synchronization index. As it is the most usual case inneurophysiological signals, in this paper we use m = n = 1.
2.3. Statistical Test. The statistical significance of the resultsof the two methods WLCC and CWCF was tested usingsurrogates. By this way, we can be sure that the resultsobtained are not due to chance and that they correspond toreal features present in the signals. Surrogate data are timeseries that are generated in order to keep particular statisticalcharacteristics of an original time series while destroying allothers. They have been used to test for nonlinearity [20]and nonstationarity of time series [21]. A classical approach
EURASIP Journal on Advances in Signal Processing 5
to construct such time series is phase randomization inthe Fourier domain or simulated annealing [20]. We usedthe iterative amplitude adjusted Fourier transform (IAAFT)method to produce the surrogates in the case of WLCC andbootstraps in the case of CWCF. The choice of the type ofsurrogates depends on the way the surrogate is resampled inthe particular method. We used the bootstraps in the caseof CWCF (linear relation) because its resampling is linear,whereas when studying the phase correlation (nonlinearrelation) nonlinear resampling is needed and IAAFT isappropriate in this case. In IAAFT, surrogates have the samepower spectrum and autocorrelation function as the originaltime series, but their phases are totally different.
The method we propose to use in this work can bedescribed with the following steps, for WLCC, for example,
(1) compute WLCC between the two original signals Xand Y , we obtain WLCCorg,
(2) generate N surrogates from signal Y , so we obtained:Ys(s = 1 . . . N),
(3) at each surrogate, calculate WLCC between X and Ysthen: WLCCsurr = WLCC(X, Ys),
(4) the confidence limit for WLCC may be obtained fromthe tails of the WLCCsurr distribution,
(5) the generated surrogates have the same amplitudeinformation as Y but their phases are randomized.The null hypothesis is that the results related toamplitude information obtained on Y are the sameas those obtained on the surrogates. By rejecting thishypothesis we can be sure (to within 1-p) that thephase information obtained is significant and not dueto chance,
(6) “rank test” is used to reject or accept the hypothesis.
In a rank test, [WLCCorg; WLCCsurr (:)] is sorted inincreasing order, and the rank index for WLCCorg returned.With a number of surrogates (n surr = 25 for example), ifthe rank of WLCCorg is unity or 25, this means that it lies inthe tail of the distribution, and the null can be rejected (two-tailed test) with a significance of p = 2∗(1/(n surr + 1)).In this paper, the n surr used was 100. Ranks <5 and > 95were considered significant and the hypothesis thus rejected(P = .05). The significant values were contoured by thickblack lines and arrows are only plotted inside the contouredregions but values that did not test as significant were notplotted on the graphs.
3. Results
As stated before, wavelet transform is a powerful toolto analyze non-stationary signals [12]. In this section wepresent the results of applying this powerful tool to analyzethe relationship between uterine signals recorded at differentsites during the same contractions. All the results wereobtained using MATLAB (version 2008b) on a Pentium4(2 GHz) PC computer. The typical computational costs are0.12 ms per contraction for scalogram, cross-scalogram and
phase synchronization, and 10 min per contraction forWLCC and CWCF with the significance test.
The scalogram displays the frequency content of theEHG signal over time. The difference in its aspect betweenpregnancy and labor bursts is clear and as shown in Figure 2:in labor (Figures 2(a) and 2(b) right) there are more high-frequency components than during pregnancy (Figures 2(a)and 2(b) left).
In Figure 2 and Figure 3, two EHG data sets are used:Vb7 (denoted by X) and Vb8 (denoted by Y). TheirMWT are WX(a, τ) and WY (a, τ), respectively. The plotof |WXY (a, τ)|2 displays the coincident events in the time-frequency domain for the two EHG signals: Figure 2(c)(left) shows the cross-scalogram of the two bursts measuredduring pregnancy; Figure 2(c) (right) shows the cross-scalogram of the two bursts measured during labor.
The cross-scalogram shows that the highest levels ofcommon power are located during the uterine activity that is,50s–100s for the pregnancy bursts and 40s–80s for the laborbursts. This common power is therefore clearly due to andrelated to the contractile activity of the uterus.
Based on Figure 1, the uterine electrical activities occurbetween 40–100 s for the pregnancy bursts and 40–80 s forthe labor bursts (segmented from the Tocographic trace).
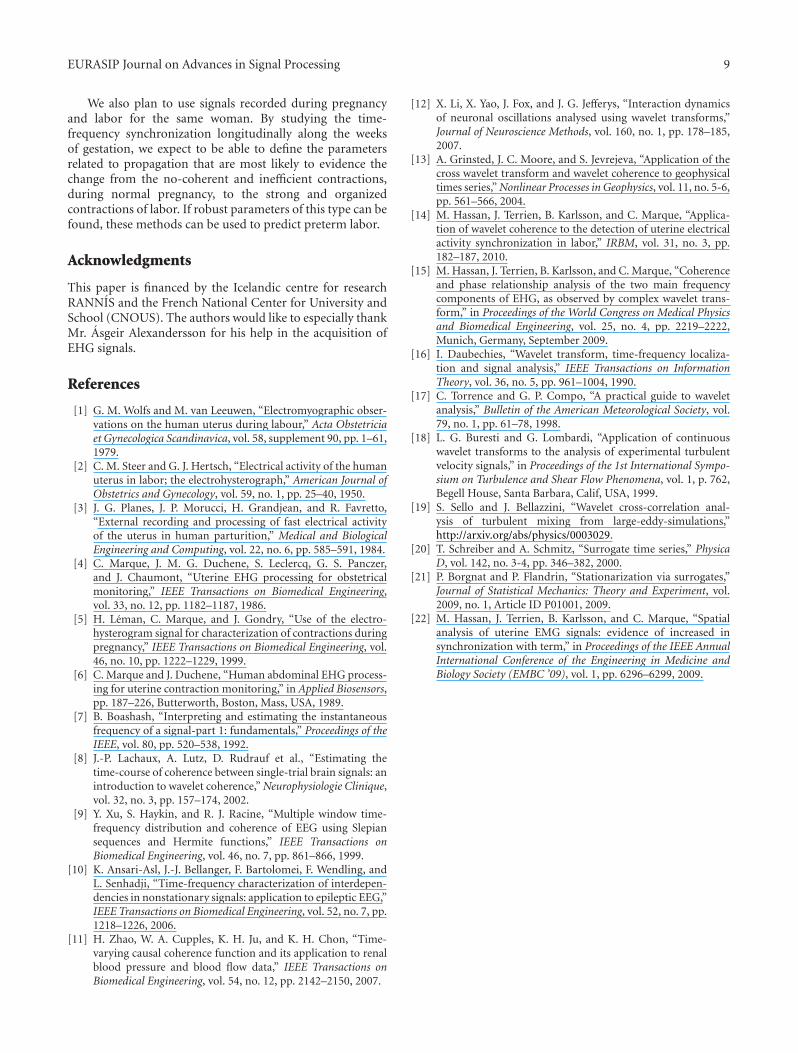
The statistical rank test with surrogates is applied tothe CWCF and WLCC methods. When the statistical testindicates that the values obtained are significant, the areawhere these values are located are contoured by a thickblack line and any values obtained outside these regions(nonsignificant) are shown as blank. The arrows indicatingthe phase difference are plotted only inside the regions wherethe values are found to be significant.
In the case of the signals recorded during pregnancy,we notice a small area between 40 s and 100 s where themethod shows significant values in the case of CWCF-amplitude correlation—(Figure 3(a)) and much larger areain the case of WLCC-phase correlation—(Figure 3(c)). In thelabor contraction we notice the opposite (between 40 s and80 s): large areas of significance with CWCF and smaller oneswith WLCC.
The comparison between CWCF and WLCC figures indi-cates that during pregnancy there is more phase correlationthan during labor. At the opposite, there is more amplitudecorrelation during labor than during pregnancy (Figure 3).Some regions of significance can be seen outside the burstranges that are probably due to noise. This is one of thedisadvantages of both methods. The use of wavelet coherencethat has great advantages is better in this respect becauseit can be applied to the whole signal without segmen ta-tion.
The results of CWCF are similar to our previous results,with a method that computes the nonlinear amplituderelation between two signals in the time domain, thatindicated an increase in the nonlinear correlation coefficientfrom pregnancy to labor [22].
Concerning the wavelet phase synchronization results,Figure 4 indicates, either during labor or pregnancy, thehighest phase synchronization is located at the lowerfrequencies of the signal. The phase synchronization is higher

6 EURASIP Journal on Advances in Signal Processing
0
0.1
0.2
0.3
0.4
0.5
0.6
0.7
0.8
0.9
1
0 20 40 60 80 100 120
Time (s)
Scalogram
Freq
uen
cy(H
z)
0
0.1
0.2
0.3
0.4
0.5
0.6
0.7
0.8
0.9
1
0 20 40 60 80
Time (s)
Scalogram
Freq
uen
cy(H
z)
100
1
2
3
4
5
6
7
8
9
×10−6
0.02
0.04
0.06
0.08
0.1
0.12
0.14
0.16
0.18
(a)
0
0.1
0.2
0.3
0.4
0.5
0.6
0.7
0.8
0.9
1
0 20 40 60 80 100 120
Time (s)
Scalogram
Freq
uen
cy(H
z)
0
0.1
0.2
0.3
0.4
0.5
0.6
0.7
0.8
0.9
1
0 20 40 60 80
Time (s)
Scalogram
Freq
uen
cy(H
z)
100
0.5
1
1.5
2
2.5
3
3.5
4
×10−6
0.01
0.02
0.03
0.04
0.05
0.06
0.07
0.08
0.09
(b)
0
0.1
0.2
0.3
0.4
0.5
0.6
0.7
0.8
0.9
1
0 20 40 60 80 100 120
Time (s)
Cross-scalogram
Freq
uen
cy(H
z)
0
0.1
0.2
0.3
0.4
0.5
0.6
0.7
0.8
0.9
1
0 20 40 60 80
Time (s)
Cross-scalogram
Freq
uen
cy(H
z)
100
0.5
1
1.5
2
2.5
3
3.5
×10−3
4
×10−11
2
4
6
8
10
12
14
16
(c)
Figure 2: (a) and (b) Scalogram for the two bursts and (c) Cross-scalogram between the two bursts. (Left) pregnancy, (Right) labor.
during pregnancy than during labor, which confirms theresults of WLCC presented in Figure 3.
In order to compare quantitatively between pregnancyand labor, the signals were numerically filtered in threefrequency bands (0–0.25 Hz; 0.25–0.5 Hz; >0.5 Hz). Thenthe mean of WPS was computed for each band. By doingthis, we aim to evidence for which frequency bands thehighest phase synchronization is located. Our previous workindicated that the highest coherence (computed by waveletcoherence) was located at the lower frequencies [14]. We seek
to confirm this result. The second aim of this analysis is toinvestigate the difference in phase synchronization (WPS)between pregnancy and labor bursts in order to find if thismethod can potentially be used as a tool to classify pregnancyversus labor EHG bursts.
The results in Table 2 correspond to the mean of WPSat different frequency bands calculated on 25 contractions(CTs) for 5 women during pregnancy (30 to 36 WG) and 25contractions from 5 women during labor (delivery time of39 to 42 WG). These results indicate that the highest phase

EURASIP Journal on Advances in Signal Processing 7
0
0.1
0.2
0.3
0.4
0.5
0.6
0.7
0.8
0.9
1
0 20 40 60 80 100 120
Time (s)
CWCF (amplitude correlation)
Freq
uen
cy(H
z)
0
0.1
0.2
0.3
0.4
0.5
0.6
0.7
0.8
0.9
1
(a)
0
0.1
0.2
0.3
0.4
0.5
0.6
0.7
0.8
0.9
1
0 20 40 60 80 100
Time (s)
CWCF (amplitude correlation)
Freq
uen
cy(H
z)
0
0.1
0.2
0.3
0.4
0.5
0.6
0.7
0.8
0.9
1
(b)
0
0.1
0.2
0.3
0.4
0.5
0.6
0.7
0.8
0.9
1
0 20 40 60 80 100 120
Time (s)
WLCC (phase correlation)
Freq
uen
cy(H
z)
−1
−0.8
−0.6
−0.4
−0.2
0
0.2
0.4
0.6
0.8
1
(c)
0
0.1
0.2
0.3
0.4
0.5
0.6
0.7
0.8
0.9
1
0 20 40 60 80 100
Time (s)
WLCC (phase correlation)
Freq
uen
cy(H
z)
−1
−0.8
−0.6
−0.4
−0.2
0
0.2
0.4
0.6
0.8
1
(d)
Figure 3: (a)-(b) Cross wavelet coherence function: amplitude correlation between two bursts. (c)-(d) Wavelet local correlation: phasecorrelation between two bursts. (Left): pregnancy, (right): labor. The vertical lines indicate the start and the end of the uterine activityextracted from the Topography trace. Inside the thick black line there is significant level of 95% with resampling of Bootstraps (CWCF) andIAFFT (WLCC). The phase difference of cross spectrum is shown by arrow direction (in-phase: arrow pointing right, means Vb7 leads Vb8;antiphase: arrow pointing left, means Vb8 leads Vb7).
Table 2: Comparison between mean (± standard deviation) ofWPS at different frequency bands for 25 pregnancy bursts and 25labor bursts.
Pregnancy Labor
0 < f(Hz) ≤ 0.25 0.59 ± 0.05 0.57 ± 0.06
0.25 < f(Hz) ≤ 0.5 0.53 ± 0.07 0.48 ± 0.06
f(Hz) > 0.5 0.49 ± 0.05 0.46 ± 0.02
synchronization during both pregnancy and during labor isat the low frequencies (0–0.25 Hz) and the results indicatea significance difference (P = .05) in the phase synchroniza-tion in the time-frequency plane between pregnancy andlabor.
The values indicate also that during labor the locationof the high synchronization becomes clearer and that thereis more difference between values at the low frequenciesand higher ones, while this difference is less clear duringpregnancy.
4. Discussion and Conclusion
In this paper, a study based on the Morlet wavelet transformis proposed to analyze the difference between uterine electri-cal activity bursts recorded from woman during pregnancyand others from women during labor. The wavelet trans-form, cross wavelet transform, phase correlation, amplitudecorrelation, and phase synchronization of the two types ofuterine signals were described.
The scalogram exhibited the previously observed result:the presence of higher frequency components during laborthan during pregnancy.
The cross-scalogram was used to detect where thehighest common power was located between the two signalsrecorded during the same contraction. The highest commonpowers were found to be at lower frequencies duringpregnancy than during labor.
WLCC and CWCF are two tools used to separate thephase and amplitude correlation. We used them in orderto detect the nature of the relation between signals, forpregnancy and labor. The results indicate that there is

8 EURASIP Journal on Advances in Signal Processing
−0.02
−0.015
−0.01
−0.005
0
0.005
0.01
0.015
0.02
0 20 40 60 80 100 120 140
Time (s)
Am
plit
ude
Vb7Vb8
(a)
−0.5−0.4
−0.3
−0.2
−0.1
0
0.1
0.2
0.3
0.40.5
0 20 40 60 80 100 120
Time (s)
Am
plit
ude
Vb7Vb8
(b)
0
0.1
0.2
0.3
0.4
0.5
0.6
0.7
0.8
0.9
1
0 20 40 60 80 100 120
Time (s)
Wavelet phase synchronization
Freq
uen
cy(H
z)
0
0.1
0.2
0.3
0.4
0.5
0.6
0.7
0.8
0.91
(c)
0
0.1
0.2
0.3
0.4
0.5
0.6
0.7
0.8
0.9
1
0 20 40 60 80 100 120
Time (s)
Wavelet phase synchronization
Freq
uen
cy(H
z)
0
0.1
0.2
0.3
0.4
0.5
0.6
0.7
0.8
0.91
(d)
0.35
0.4
0.45
0.5
0.55
0.6
0.65
0.70.75
0.8
0.85
0 0.1 0.2 0.3 0.4 0.5 0.6 0.7 0.8 0.9 1
Frequency (Hz)
Mea
nW
PS
(e)
0.4
0.5
0.6
0.7
0.8
0.9
1
0 0.1 0.2 0.3 0.4 0.5 0.6 0.7 0.8 0.9 1
Frequency (Hz)
Mea
nW
PS
(f)
Figure 4: The phase synchronization between the two uterine bursts: pregnancy (left) and labor (right).
more significant amplitude correlation in labor than duringpregnancy and more significant phase correlation duringpregnancy than in labor.
Phase synchronization index in the time frequencydomain, is then used to describe the phase synchronizationbetween signals. The pregnancy signals were again shown tobe more synchronized in phase than the labor signals.
We noted that the results of WLCC and CWCF are similarwith the results of the EEG during the transition from preic-tal to ictal stages, a phase desynchronization and amplitude
synchronization. The question can be raised if there aresimilarities in the underlying physiological interpretation ofthese phenomena.
Although the cross-scalogram, WLCC, CWCF, andwavelet phase synchronization can describe linear relation-ship between the two time series, nonlinear interactionsbetween the two time series cannot be revealed by thesemethods. The next step will be the use of the bicoherencemethod, which is a powerful tool to detect the nonlinearrelation between signals.
EURASIP Journal on Advances in Signal Processing 9
We also plan to use signals recorded during pregnancyand labor for the same woman. By studying the time-frequency synchronization longitudinally along the weeksof gestation, we expect to be able to define the parametersrelated to propagation that are most likely to evidence thechange from the no-coherent and inefficient contractions,during normal pregnancy, to the strong and organizedcontractions of labor. If robust parameters of this type can befound, these methods can be used to predict preterm labor.
Acknowledgments
This paper is financed by the Icelandic centre for researchRANNIS and the French National Center for University andSchool (CNOUS). The authors would like to especially thankMr. Asgeir Alexandersson for his help in the acquisition ofEHG signals.
References
[1] G. M. Wolfs and M. van Leeuwen, “Electromyographic obser-vations on the human uterus during labour,” Acta Obstetriciaet Gynecologica Scandinavica, vol. 58, supplement 90, pp. 1–61,1979.
[2] C. M. Steer and G. J. Hertsch, “Electrical activity of the humanuterus in labor; the electrohysterograph,” American Journal ofObstetrics and Gynecology, vol. 59, no. 1, pp. 25–40, 1950.
[3] J. G. Planes, J. P. Morucci, H. Grandjean, and R. Favretto,“External recording and processing of fast electrical activityof the uterus in human parturition,” Medical and BiologicalEngineering and Computing, vol. 22, no. 6, pp. 585–591, 1984.
[4] C. Marque, J. M. G. Duchene, S. Leclercq, G. S. Panczer,and J. Chaumont, “Uterine EHG processing for obstetricalmonitoring,” IEEE Transactions on Biomedical Engineering,vol. 33, no. 12, pp. 1182–1187, 1986.
[5] H. Leman, C. Marque, and J. Gondry, “Use of the electro-hysterogram signal for characterization of contractions duringpregnancy,” IEEE Transactions on Biomedical Engineering, vol.46, no. 10, pp. 1222–1229, 1999.
[6] C. Marque and J. Duchene, “Human abdominal EHG process-ing for uterine contraction monitoring,” in Applied Biosensors,pp. 187–226, Butterworth, Boston, Mass, USA, 1989.
[7] B. Boashash, “Interpreting and estimating the instantaneousfrequency of a signal-part 1: fundamentals,” Proceedings of theIEEE, vol. 80, pp. 520–538, 1992.
[8] J.-P. Lachaux, A. Lutz, D. Rudrauf et al., “Estimating thetime-course of coherence between single-trial brain signals: anintroduction to wavelet coherence,” Neurophysiologie Clinique,vol. 32, no. 3, pp. 157–174, 2002.
[9] Y. Xu, S. Haykin, and R. J. Racine, “Multiple window time-frequency distribution and coherence of EEG using Slepiansequences and Hermite functions,” IEEE Transactions onBiomedical Engineering, vol. 46, no. 7, pp. 861–866, 1999.
[10] K. Ansari-Asl, J.-J. Bellanger, F. Bartolomei, F. Wendling, andL. Senhadji, “Time-frequency characterization of interdepen-dencies in nonstationary signals: application to epileptic EEG,”IEEE Transactions on Biomedical Engineering, vol. 52, no. 7, pp.1218–1226, 2006.
[11] H. Zhao, W. A. Cupples, K. H. Ju, and K. H. Chon, “Time-varying causal coherence function and its application to renalblood pressure and blood flow data,” IEEE Transactions onBiomedical Engineering, vol. 54, no. 12, pp. 2142–2150, 2007.
[12] X. Li, X. Yao, J. Fox, and J. G. Jefferys, “Interaction dynamicsof neuronal oscillations analysed using wavelet transforms,”Journal of Neuroscience Methods, vol. 160, no. 1, pp. 178–185,2007.
[13] A. Grinsted, J. C. Moore, and S. Jevrejeva, “Application of thecross wavelet transform and wavelet coherence to geophysicaltimes series,” Nonlinear Processes in Geophysics, vol. 11, no. 5-6,pp. 561–566, 2004.
[14] M. Hassan, J. Terrien, B. Karlsson, and C. Marque, “Applica-tion of wavelet coherence to the detection of uterine electricalactivity synchronization in labor,” IRBM, vol. 31, no. 3, pp.182–187, 2010.
[15] M. Hassan, J. Terrien, B. Karlsson, and C. Marque, “Coherenceand phase relationship analysis of the two main frequencycomponents of EHG, as observed by complex wavelet trans-form,” in Proceedings of the World Congress on Medical Physicsand Biomedical Engineering, vol. 25, no. 4, pp. 2219–2222,Munich, Germany, September 2009.
[16] I. Daubechies, “Wavelet transform, time-frequency localiza-tion and signal analysis,” IEEE Transactions on InformationTheory, vol. 36, no. 5, pp. 961–1004, 1990.
[17] C. Torrence and G. P. Compo, “A practical guide to waveletanalysis,” Bulletin of the American Meteorological Society, vol.79, no. 1, pp. 61–78, 1998.
[18] L. G. Buresti and G. Lombardi, “Application of continuouswavelet transforms to the analysis of experimental turbulentvelocity signals,” in Proceedings of the 1st International Sympo-sium on Turbulence and Shear Flow Phenomena, vol. 1, p. 762,Begell House, Santa Barbara, Calif, USA, 1999.
[19] S. Sello and J. Bellazzini, “Wavelet cross-correlation anal-ysis of turbulent mixing from large-eddy-simulations,”http://arxiv.org/abs/physics/0003029.
[20] T. Schreiber and A. Schmitz, “Surrogate time series,” PhysicaD, vol. 142, no. 3-4, pp. 346–382, 2000.
[21] P. Borgnat and P. Flandrin, “Stationarization via surrogates,”Journal of Statistical Mechanics: Theory and Experiment, vol.2009, no. 1, Article ID P01001, 2009.
[22] M. Hassan, J. Terrien, B. Karlsson, and C. Marque, “Spatialanalysis of uterine EMG signals: evidence of increased insynchronization with term,” in Proceedings of the IEEE AnnualInternational Conference of the Engineering in Medicine andBiology Society (EMBC ’09), vol. 1, pp. 6296–6299, 2009.
Copyright © 2022 FDOKUMEN