Monte Carlo simulation of homopolymer chains. I. Second virial coefficient

This article appeared in a journal published by Elsevier. The attachedcopy is furnished to the author for internal non-commercial researchand education use, including for instruction at the authors institution
and sharing with colleagues.
Other uses, including reproduction and distribution, or selling orlicensing copies, or posting to personal, institutional or third party
websites are prohibited.
In most cases authors are permitted to post their version of thearticle (e.g. in Word or Tex form) to their personal website orinstitutional repository. Authors requiring further information
regarding Elsevier’s archiving and manuscript policies areencouraged to visit:
http://www.elsevier.com/copyright

Author's personal copy
Molecular dynamics of poly(ATRIF) homopolymer and poly(AN-co-ATRIF)copolymer investigated by dielectric relaxation spectroscopy
E.G. Merino a, S. Atlas b, M. Raihane b, A. Belfkira b, M. Lahcini b, A. Hult c, M. Dionísio a,N.T. Correia a,d,⇑a REQUIMTE, Departamento de Química, Faculdade de Ciências e Tecnologia da Universidade Nova de Lisboa, 2829-516 Caparica, Portugalb Laboratory of Bioorganic and Macromolecular Chemistry, Cadi-Ayyad University, Faculty of Sciences and Technologies (FST), Av. A. Khattabi,BP 549, 40000 Marrakech, Moroccoc Division of Coating, Fiber and Polymer Technology-KTH-Teknikringen 56-58, SE-100 44 Stockholm, Swedend Unité Matériaux et Transformation (UMET), UMR CNRS 8207, UFR de Physique, BAT P5, Université Lille 1, 59655 Villeneuve d’Ascq, France
a r t i c l e i n f o
Article history:Received 2 February 2011Received in revised form 3 April 2011Accepted 19 April 2011Available online 4 May 2011
Keywords:Dielectric polymersPoly(ATRIF)Dielectric spectroscopySecondary relaxationsNMR characterization
a b s t r a c t
Aiming to develop new dielectric polymers containing CN and F groups with strong dipolemoments, a novel copolymer of acrylonitrile (AN) and 2,2,2-trifluoroethyl acrylate (ATRIF)was synthesized in acetonitrile by free radical process as well as the respective homopol-ymer (poly(ATRIF)). The copolymer’s composition and microstructure were analyzed byFTIR, 1H and 13C NMR spectroscopy and SEC. The molar incorporation of AN determinedin the copolymer by NMR was 58 mol%. Thermogravimetric analysis of poly(AN-co-ATRIF)copolymer showed good thermal stability comparatively to the fluorinated homopolymer.
Both copolymer, poly(AN-co-ATRIF), and homopolymer, poly(ATRIF), were dielectricallycharacterized over a frequency range from 10�1 to 106 Hz, and in a temperature range from223 to 393 K. The dominating relaxation process detected in both materials is the a-relax-ation, associated with the dynamic glass transition. A VFTH temperature dependence of therelaxation times (s) was found for both materials, as characteristic of cooperative pro-cesses, from which the respective glass transition temperatures (Tg(s = 100 s)) were esti-mated, which differ �40 K, the one of the copolymer being higher (307 K) in accordanceto the calorimetric analysis. This effect was attributed to a higher stiffness of the backbonein the copolymer originated by the inclusion of the acrylonitrile groups. Both relaxationfunctions have the same breath of relaxation times allowing constructing a single mastercurve, indicating similar non-exponential character. A less fragile behavior was found forthe copolymer. This was rationalized in a more straightforward way by the free volumeapproach instead from a correlation between fragility and intermolecular coupling. Itwas found that in the copolymer the free volume increases at a lower rate with the tem-perature increase. It was inferred from the VFTH temperature dependence of the dc con-ductivity and low values of the decoupling index that ion motion is significantlyinfluenced by the dynamics of the a-process.
� 2011 Elsevier Ltd. All rights reserved.
1. Introduction
Vinylidene cyanide (VCN) is known to polymerize with awide variety of monomers, such as vinyl acetate, styrene, ordienes, to form chiefly alternating copolymers [1]. Theirmechanical properties have been studied extensively [2].New applications of VCN were found by Miyata et al. [3]
0014-3057/$ - see front matter � 2011 Elsevier Ltd. All rights reserved.doi:10.1016/j.eurpolymj.2011.04.006
⇑ Corresponding author at: REQUIMTE, Departamento de Química,Faculdade de Ciências e Tecnologia da Universidade Nova de Lisboa,2829-516 Caparica, Portugal.
E-mail address: [email protected] (N.T. Correia).
European Polymer Journal 47 (2011) 1429–1446
Contents lists available at ScienceDirect
European Polymer Journal
journal homepage: www.elsevier .com/locate /europol j

Author's personal copy
who observed piezoelectric properties for the amorphouscopolymer of VCN with vinyl acetate. The most importantfinding in this investigation is the unusual large relaxationstrength above its Tg in the non-crystalline copolymer. Amesophase glass structure has been proposed for thiscopolymer allowing cooperative effects in relation to dipolarmotions of CN groups around the glass transition tempera-ture. Therefore, studies that include the copolymerizationreactions of VCN with various monomers have been of grow-ing relevance in the last few years. VCN copolymerized withmethyl methacrylate [4], isopropenyl acetate [5], vinyl ben-zoate [6], styrene [4], substituted styrenes [7], and vinyl es-ters of fatty acids [8]. All these copolymerizations gavealternating copolymers, and their microstructures werecharacterized by 13C NMR spectroscopy.
Fundamental studies of the piezoelectric properties ofsome copolymers take into account the chain mobility inthe macromolecules [9], their dielectric properties [10,11],and their enthalpy relaxation [12]. Industrial patents reportthe main characteristic of piezoelectric copolymers of vinyl-idene cyanide [13,14].
Other cyano monomers such as methacrylonitrile (MAN),acrylonitrile (AN) and methyl b,b-dicyanoacrylate (DCNA)copolymerized with vinyl acetate (VAc) or isopropenyl ace-tate (IPOAc) and vinyl formiate (VCHO) [15] gave copoly-mers showing interesting pyroelectric properties [16]. VCNcopolymerized with captodative monomers such as a-cyanovinyl acetate and methacrylonitrile [17]. Statisticalcopolymers based on acrylonitrile and methacrylonitrilewith ethyl a-acetoxyacrylate [18] and methyl a-acetoxyacrylate [19] were synthesized by radical copolymerization.The microstructure of the resulting copolymers was charac-terized by 13C NMR, and some reactivity ratios could be as-sessed. In addition, copolymers based on methylvinylidenecyanide (MVCN) and or styrene [7] also exhibit interestingdielectric behavior [20].
Indeed, fluorinated polymers [21] exhibit remarkableproperties: thermal stability, chemical inertness, lowrefractive index, low surface tension and good electricproperties. Several fluoroalkylacrylate and methacrylatepolymers were developed and their physical propertiesstudied [22–25].
Dielectric relaxation studies carried out on a series ofpoly (fluoroalkyl methacrylate)s indicate the occurrenceof a and c relaxations assigned to segmental reorientationand local molecular motions of fluoroalkyl side groups,respectively [26].
Three cyano-olefins, acrylonitrile (AN), methacrylonitri-le (MAN), and methylvinylidene cyanide (MVCN), have alsobeen copolymerized with 2,2,2-trifluoroethyl methacrylate(MATRIF) by free radical process initiated by AIBN [27].Films of these copolymers have been studied using dielec-tric relaxation spectroscopy [28]. These copolymers of MA-TRIF show a primary relaxation with large relaxationstrength above Tg. This a-relaxation was related to thecooperative reorientation motions of CN dipoles. The pres-ence of the fluorine atoms in MATRIF does not contributesignificantly to De which is equal to 1.1 in the case ofpoly(MATRIF) homopolymer. In the glassy state, the per-mittivity values of AN and MAN copolymers show an in-crease of polarity and low tan d values.
The syntheses of poly(vinylidene fluoride)-b-poly(AN,MAN, VCN) (PVDF-b-PMCN) block copolymers, using theiodine transfer polymerization (ITP) of (AN), (MAN) and(VCN), in the presence of PVDF-I have been reported [29].Dielectric analyses of these copolymers show several relax-ations processes associated with long-range molecular mo-tions, which are associated to the glass transitiontemperatures of both blocks (PVDF block and poly(cyanomonomer blocks)).
In recent study, Raihane et al. [30] have presented thesynthesis and characterization of a novel copolymer ofvinylidene cyanide (VCN) and 2,2,2-trifluoroethyl methac-rylate (MATRIF). High-resolution 1H and 13C NMR spectrawere used to study the microstructure of the copolymersuggesting alternating tendency in this copolymerization.The dynamic dielectric behavior of the poly(VCN-co-MA-TRIF) copolymer was also investigated, this copolymerexhibited a dynamic scenario with four relaxation pro-cesses, two above Tg, merging at low temperatures, andtwo below Tg. The addition of VCN unit increases thedielectric constant as well as the value of calorimetric glasstransition temperature, Tg [31].
To develop new dielectric polymers containing CN and Fgroups with strong dipole moments, the radical copoly-merization of acrylonitrile (AN) with 2,2,2-trifluoroethylacrylate (ATRIF) as a fluorinated comonomer initiated byAIBN is reported in the present work and a detailed charac-terization of dipolar relaxation and charge transport isprovided.
2. Experimental
2.1. Materials
Acrylonitrile (AN) is commercially available product(Aldrich Chimie, Saint-Quentin Fallavier, France) and wasdistilled (bp. 350.45 K at 1 atm), then stored below 278 Kprior to use. a,a0-Bis-azobisisobutyronitrile (AIBN) wasprovided by Aldrich and was purified by recrystallizationfrom ethanol. Acetonitrile of analytical grade (Aldrich)was distilled over calcium hydride prior to use. 2,2,2-Tri-fluoroethyl acrylate (ATRIF) was kindly provided byAldrich and was distilled in the presence of 2,6-ditert-bu-tyl-p-cresol as polymerization inhibitor, then stored undernitrogen in the dark at 248 K prior to use.
2.2. Synthesis of polymers
Under free radical conditions, ATRIF monomer (2 g,0.013 mol) dissolved in acetonitrile (3 mL) was polymer-ized at 343 K for 4 h using AIBN as initiator (1 wt.%), andafter precipitation from ethanol gave a white homopoly-mer, noted poly(ATRIF).
Radical copolymerization of equimolar feed composi-tion of AN and ATRIF was performed in thick borosilicateCarius tube (length 130 mm, internal diameter 10 mm,thickness 2.5 mm, total volume 8 cm3). After introducinginitiator AIBN (1 wt.% of the total monomer), AN (0.7 g,0.013 mol), ATRIF (2 g, 0.013 mol) and a minimum of driedacetonitrile, the tube was purged with nitrogen for 10 min
1430 E.G. Merino et al. / European Polymer Journal 47 (2011) 1429–1446

Author's personal copy
to remove oxygen. The tube was then heated 4 h at 343 K.At the end of the copolymerization, the content of the tubewere precipitated from methanol, isolated by filtration anddried under vacuum at 353 K. Synthesis route of polymersis shown in Scheme 1.
2.3. Analysis
1H and 13C NMR spectra were recorded on a Bruker AM400 using acetone deuterated dimethyl sulfoxide (DMSO-d6) or deuterated acetone-d6 as solvents. The solvent signalwas used as the internal standard.
FTIR measurements were performed on Perkin-ElmerSpectrum 2000 equipped for mid-IR, near-IR transmission.Each spectrum was based on 18 scans.
Size exclusion chromatography (SEC) was used to mon-itor the molecular weights and distribution. SEC using THF(1.0 mL min�1) as mobile phase was performed at 308 Kusing a Viscotek TDA model 301 equipped with twoT5000 columns with porous styrene divinylbenzenecopolymer (300 mm L � 7.8 mm). The injection volumewas 50 lL. The SEC apparatus was calibrated with 11 nar-row linear polystyrene (PS) standards (Mw 5800–185,000 g mol�1). The setup permitted molecular weightsto be determined using universal calibration method.
Differential scanning calorimetry (DSC) measurementswere performed on Mettler Toledo DSC 820 equipped withsample robot and cryocooler. The DSC runs were carriedout using the following temperature protocol: heating from223 to 373 K (10 K min�1), cooling from 373 to 223 K(10 K min�1), then the second heating and cooling. Theweight of polymers ranging between 10 and 15 mg wasplaced in an aluminium pan. The glass transition tempera-tures (Tg) were determined from the second heating scanand taken at the mid-point and the onset of the transition.
Thermogravimetric analyses (TGA) were performed, un-der Nitrogen (60 mL min�1), by using a Metler Toledo ther-mogravimetric analysis equipped with a sample robot. The
samples were heated first with dynamic segment from 248to 373 K (40 K min�1), followed by an isothermal segmentat 373 K for 5 min, then a dynamic segment from 373 to773 K (10 K min�1). The typical sample size was approxi-mately 7 mg.
For the dielectric spectroscopy measurements, poly(A-TRIF) homopolymer and poly(AN-co-ATRIF) copolymerfilms were cut into disks of about 10 and 20 mm in diam-eter, respectively. For the poly(ATRIF) two silica spacers of0.05 mm thickness were used; the poly(AN-co-ATRIF)copolymer film was 0.132 mm thickness. The sampleswere then placed between two gold plated electrodes ina parallel plate capacitor, BDS 1200. The sample cell wasmounted on a cryostat, BDS 1100, and exposed to a heatedgas stream being evaporated from liquid nitrogen in aDewar. The temperature control was assured by the QuatroCryosystem and performed within ±0.5 K (all modules sup-plied by Novocontrol). The complex dielectric functione⁄(f) = e0(f) � ie00(f) (f – frequency, e0 – real part, e00 – imagi-nary part) was measured by an Alpha-N analyzer also fromNovocontrol GmbH, covering a frequency range from10�1 Hz to 1 MHz. In order to erase any previous history,samples were first heated up to 393 K and then cooleddown to 173 K (poly(ATRIF)), 213 K (poly(AN-co-ATRIF)),after which isothermal dielectric measurements were car-ried up to 263 K (poly(ATRIF)), 273 K (poly(AN-co-ATRIF)),in steps of 10 K and thereafter until 393 K in steps of 5 K.
The dielectric relaxation data obtained were deconvo-luted using a sum of the model function introduced byHavriliak–Negami [32]:
e�ðxÞ ¼ e1 þX
j
Dej
1þ ixsHNj
� �aHNjh ibHNj
ð1Þ
where j is the number of relaxation processes,De = es � e1 isthe dielectric strength, i.e., the difference between the realpermittivity values at, respectively, the low and high fre-quency limits, s � (2pfmax)�1 is the characteristic
H2C C
H
CN
H2C C
H
CN
*
CH3CN
AN
H2C C
H
CO2CH2CF3
H2C C
H
CO2CH2CF3
* *CH3CN
ATRIF
H2C C
H
CO2CH2CF3
H2C C
H
CO2CH2CF3
ATRIF
n
n
AIBN, 343 K
poly(ATRIF)
nm
AIBN, 343 K
poly(AN-co-ATRIF)
+
nn
(a)
(b)
Scheme 1. Synthesis route of: (a) poly(ATRIF) homopolymer and (b) poly(AN-co-ATRIF) copolymer.
E.G. Merino et al. / European Polymer Journal 47 (2011) 1429–1446 1431

Author's personal copy
relaxation time, and aHN and bHN, the shape parameters(0 < aHN < 1, 0 < aHN � bHN < 1). When the data are influencedby low frequency conductivity contribution, and an addi-tional term ir/xceo was added to the dielectric loss, wheree0 is the vacuum permittivity, r and c are fitting parameters:r is related to the dc conductivity of the sample and theparameter c (0 < c 6 1) reflects bulk conductivity of ionsfor c = 1, while c < 1 reflects interfacial polarizations.
From the estimated values of sHN, aHN and bHN, a model-independent relaxation time smax = (2pfmax)�1 was calcu-lated according to [33,34]:
smax ¼ sHN sinaHNp
2þ 2bHN
� �� ��1=aHN
sinaHNbHNp2þ 2bHN
� �� ��1=aHN
ð2Þ
3. Results and discussion
3.1. Synthesis of monomers and copolymer
2,2,2-Trifluoroethyl acrylate (ATRIF) can be also synthe-sized from acryloyl chloride and 2,2,2-trifluoroethanol un-der nitrogen in the presence of triethylamine as base and2,6-di-tert-butyl-4-methylphenol as inhibitor, accordingto procedure previously reported [35]. The purification ofthe ATRIF monomer was carried out by distillation (bp.:319 K/125 mm Hg).
In order to study the incorporation of (AN) in the ATRIFunits, radical homopolymerization of 2,2,2-trifluoroethylacrylate (ATRIF) was performed in acetonitrile in glass tubeusing AIBN as a free radical initiator at 343 K. The copoly-merization yield was close to 60%.
Original fluorocyano was synthesized by radical copoly-merization of equimolar feed composition of AN with
ATRIF mixed with 1 wt.% of initiator (AIBN) in acetonitrile.This solvent is known to induce very low transfer reactions[36]. After reaction and purification by precipitation, a yel-lowish copolymer was obtained in a 76% yield. These poly-mers based on ATRIF were characterized by FTIR, NMRspectroscopy, and their thermal and dielectric propertieswere investigated.
3.2. Copolymer composition and microstructure
The FTIR spectrum of the poly(AN-co-ATRIF) copolymer(Fig. 1) exhibits a nitrile stretching vibration at 2243 cm�1,in addition to the characteristic main absorptions from theATRIF co-units centered at 2925 cm�1 (C–H), 1749 cm�1
(C@O), 1451–1413 cm�1 (out-of-plane C–H bending),1277 cm�1 (C–F stretching), 1143 cm�1 (C–O–C stretch-ing), and 971 cm�1 (out-of-plane C–H bending).
Table 1 summarizes the 300 MHz 1H NMR chemicalshifts of different resonances observed in the spectrum ofpolymers based on ATRIF (Fig. 2).
The assignments of poly(AN-co-ATRIF) copolymer re-corded in acetone-d6 were deduced from the comparisonwith those of poly(ATRIF) homopolymer and a copolymerbased on AN with 2,2,2-trifluoroethyl methacrylate (MA-TRIF) [27].
Fig. 2 showed the chemical shifts of different protons inthe copolymer. Peaks assigned to vinylic protons (5.6 and6.2 ppm for AN; 4.6 and 6.3 ppm for ATRIF) were absentin this spectrum indicating that ATRIF monomer was suc-cessfully copolymerized with AN.
Incorporation of AN in the copolymer can be calculatedby measuring areas of some characteristic peaks in the 1HNMR spectrum (Fig. 2). For example, the integrals of theresonances from the side chain methylene CH2–CF3 as-signed to ATRIF (I1) in the range 4.60–4.90 ppm and the
3600,0 3200 2800 2400 2000 1800 1600 1400 1200 1000 800 600,033,8
40
45
50
55
60
65
70
75
80
85
90
95
98,5
cm-1
%T
2925 2243
1749
1451
1413
1277
1077
971
894
839
750
666
1143
Fig. 1. FTIR spectrum of poly(AN-co-ATRIF) copolymer in transmission mode.
1432 E.G. Merino et al. / European Polymer Journal 47 (2011) 1429–1446

Author's personal copy
methine resonances CH of both counits (I2) in the range2.35–3.35 ppm were considered according to the followingequation:
AN% ¼ 2I2 � I1
2I2� 100 ð3Þ
The calculated molar incorporation of AN in poly(AN-co-ATRIF) copolymer was close to 58%. This percentage ishigher than that obtained in the case of copolymer basedon AN and 2,2,2-trifluroethyl methacrylate (MATRIF), asthe molar incorporation ratio of AN is equal to 44% inpoly(AN-co-MATRIF) copolymer [27]. This result confirmsthat the acrylate monomers are more reactive than theircorresponding methacrylates according to the values ofthe rapport kp
2/kt where kp and kt are respectively the con-stant rate of the propagation and termination reactions[25].
We have used the 1H NMR results to determine the ste-reosequence distribution of poly(ATRIF) homopolymer.The expansion of the 1.5–2.4 ppm region assigned to themethylene protons in the 1H NMR spectrum (Fig. 2) wasused to determine the ratio of meso:racemic diads. In fact,
three resolved resonances were observed at 2.10, 1.75 and1.55 ppm attributed respectively to (mm), (mr) and (rr) tri-ads by analogy to the assignments of poly(a-fluoroacrylo-nitrile) homopolymer [37]. In our case, the triadsconcentration for syndiotactic (rr), heterotactic (mr) andisotactic (mm) can be assessed from numerical integral ofthe resonance from CH2 protons of poly(ATRIF) homopoly-mer, this calculation gives 18% (rr), 55% (mr) and 27%(mm). This result shows that the poly(ATRIF) homopoly-mer is atactic and follows Bernoullian statistics [38] witha P(m) = 0.54 [P(m) is the probability that addition to theend of the chain is in the meso configuration for the distri-bution of the diads].
Fig. 3 shows the 13C NMR spectrum of poly(AN-co-AT-RIF) copolymer recorded in DMF-d6 from decoupling C–F.Table 1 summarizes the chemical shifts of the differentgroups observed in this spectrum.
Information about the structure of the poly(AN-co-AT-RIF) copolymer can be provided from the 13C NMR spec-trum. For example, in the CN carbon region in the range120–125 ppm three resonances at 124.29, 123.49 and120.55 ppm were observed. The two first stronger
Table 11H and 13C NMR chemical shifts for polymers based on ATRIF.
Comonomer units Species 1H poly(ATRIF) (ppm) 1H poly(AN-co-ATRIF) (ppm) 13C poly(AN-co-ATRIF) (ppm)
AN CH2 (main chain) – 1.70–2.45 29.84CH – 2.80–3.35 24.27CN – – 120.55; 123.49; 124.29
ATRIF CH2 (main chain) 1.50–2.20 1.7–2.45 29.84CH 2.35–2.70 2.35–2.70 24.56CH2CF3 4.50 4.80 64.57CF3 – – 133.13C@O – – 171.46
1.0 1.2 1.2 1.3
0.51.01.52.02.53.03.54.04.55.05.56.06.5
1.0 0.5 0.3 0.6 0.2
poly(AN-co-ATRIF)
poly(ATRIF)
Acetone
Fig. 2. 1H NMR spectrum of: poly(ATRIF) homopolymer (upper part) and poly(AN-co-ATRIF) copolymer (solvent: acetone d6).
E.G. Merino et al. / European Polymer Journal 47 (2011) 1429–1446 1433

Author's personal copy
resonances can be associated with the central unit of AN inthe triads ATRIF–AN–ATRIF and ATRIF–AN–AN by analogywith assignments reported in the study of microstructureof a copolymer of AN with methyl acrylate [39]. In partic-ular, the structured resonance of ATRIF–AN–ATRIF triadshifts at low field was caused by the nearest neighbor elec-tron-withdrawing ester groups of ATRIF counit. The peakobserved at 120.55 may be assigned to the central unit ofAN–AN–AN homotriad (corresponding to AN homose-quences in the poly(AN-co-ATRIF) copolymer) as itmatched the corresponding one in the spectrum of poly(-AN) homopolymer [40]. Integration of three sets of reso-nances yields the ratio ATRIF–AN–ATRIF/ATRIF–AN–AN/AN–AN–AN = 38/43/19. Finally, we can consider that themicrostructure of poly(AN-co-ATRIF) copolymer is statisticwith the presence of alternating structure and homose-quences of AN in its chain, the latter in much less extent.Similar result was reported for a copolymer of vinylidenecyanide with 2,2,2-trifluoethyl methacrylate [31].
This result has been confirmed by the preliminary studyof microstructure of the poly(AN-co-ATRIF) copolymerusing the reactivity ratio. From the monomer–copolymercopolymerization curve, the Fineman–Ross and Kelen–Tüdos laws, the first results obtained suggest a randomstructured copolymer with a particularly ideal copolymer-ization character (r1 � r2 = 1.1 with r1(AN) = 1.23 andr2(ATRIF) = 0.91) and indicate that the poly(AN-co-ATRIF)copolymer contains more AN than ATRIF (r1 > r2) and thecopolymer has an atactic structure.
SEC analysis using calibration gave Mn = 102,000 g/mol,Mw = 186,000 g/mol (in equivalent of polystyrene stan-dards). For poly(ATRIF) homopolymer, it was not possibleto make measurement of molecular weight in the sameconditions. We cannot detect any signal as the THF solventused as mobile phase for SEC presents a refractive indexn20/D equal to 1.04 [41] similar to that of poly(ATRIF)hompolymer (n20/D = 1.405).
3.3. Thermal properties
Two key thermal properties were studied, glass transi-tion temperature Tg and thermal degradation, Td deter-mined by differential scanning calorimetry (DSC) and bythermogravimetric analysis (TGA), respectively.
First, all the polymers analyzed show a sharp transitionfrom the glassy domain to the viscoelastic one, as evi-denced by the presence of only a single Tg. Although DSCwas also realized on two samples from 223 to 373 K, theabsence of any crystallization or melting temperaturewas noted (Fig. 4). The midpoint Tg of poly(ATRIF) homo-polymer is around 273 K conferring to this polymer a rub-ber (or elastomeric) character at room temperature.However, the Tg (midpoint) of poly(AN-co-ATRIF) copoly-mer is close to 316 K (Table 2), the incorporation of polarcyano groups in the copolymer backbone resulted in an
2030405060708090100110120130140150160170180
120121122123124125
0,51,11,0
120.55123.49124.29
.
Fig. 3. 13C NMR spectrum of poly(AN-co-ATRIF) copolymer (solvent: DMSO d6).
240 260 280 300 320 340 360
1.1
1.2
1.3
1.4
1.5
1.6
1.7
1.8
1.9
Hea
t Flo
w /
W g
-1
T / K
poly(ATRIF) poly(AN-co-ATRIF)
exo down
Fig. 4. DSC thermograms of poly(ATRIF) homopolymer and poly(AN-co-ATRIF) copolymer obtained on heating at 10 K min�1.
1434 E.G. Merino et al. / European Polymer Journal 47 (2011) 1429–1446

Author's personal copy
increase of Tg due to chain stiffening and marked inhibitionor rotation about C–C bonds [27–29,42].
Fig. 5 shows the temperatures at which the polymersstart to decompose. It can be observed that the degradationtemperature Td corresponding to 1% weight loss, occurs at570 and 591 K for the poly(ATRIF) homopolymer andpoly(AN-co-ATRIF) copolymer, respectively (Table 2). Sucha comparatively high thermal stability of the poly(AN-co-ATRIF) copolymer indicates that incorporation of isolatedAN units in poly(AN-co-ATRIF) copolymer improves thethermal stability even with respect to the fluorinatedhomopolymer, and particularly when the copolymer pre-sents an alternating bloc in its structure which is in agree-ment with the NMR observations. Similar result wasobserved in the TGA analysis for a fluorocyano copolymerof vinylidene cyanide with 2,2,2-trifluoethyl methacrylate[30].
The results of dynamic and isothermal investigations ofthe thermal degradation behavior of poly(ATRIF) andpoly(AN-co-ATRIF) polymers will be the subject of forth-coming paper.
3.4. Dielectric characterization
3.4.1. The main a-relaxationThe real and imaginary components of the complex
dielectric permittivity, e⁄(f), are presented in Fig. 6 for thepoly(ATRIF) homopolymer (a and b) and the poly(AN-co-ATRIF) copolymer (c and d), for some representative tem-peratures above the glass transition temperature, Tg. Adominant relaxation process is visible being associated
with the dynamic glass transition, a-relaxation. As ex-pected, the maximum of each peak is shifted to higher fre-quencies as the temperature increases due to anenhancement of dipolar mobility in the origin of coopera-tive motions above Tg. At high temperatures, and low fre-quencies, the dielectric spectra are dominated by chargetransport that will be analyzed further on.
The real permittivity, at any temperature above Tg ofeach polymer, as well as the intensity of the dielectric losspeaks observed for the main a-relaxation is always greaterfor the poly(AN-co-ATRIF) copolymer than for poly(ATRIF)homopolymer. In Fig. 7 the respective isochronal dielectricplots taken from the isothermal data at 1 kHz of e0(T) andtan d(T) are compared; tan d(T) = e00(T)/e0(T) is being usedsince it is a quantity independent of the capacitance ofthe empty cell, C0, calculated from the cell geometry, giventhat the samples differ in both their diameters and thick-nesses (see Section 2).
Both e0(T) traces (Fig. 7a) for poly(ATRIF) homopolymerand poly(AN-co-ATRIF) copolymer present the normal steprising which is the signature of the a-relaxation associatedto the dynamical glass transition, occurring at temperaturesclose to the glass transition determined by calorimetry (seeTable 2); the decrease observed at temperatures above thee0 step is the expected behavior for the real permittivity aspredicted by the Fröhlich–Kirkwood equation [33,43].
The difference in the temperature location of the abrupte0 steps is a further evidence of the significant shift to high-er temperatures of the copolymer glass transition rela-tively to the homopolymer, confirmed also by thedeviation of the tan d-peak, as presented in Fig. 7b. Asthe dielectric technique probes molecular mobility,through the reorientation of dipoles, the observed shift tohigher temperatures means that the molecular dynamicsassociated with the glass transition, becomes more hin-dered in the copolymer. The slowness of this cooperativemotion arises from the substitution of part of the bulkyCO2CH2CF3 side-groups by the more rigid CN groups,which, as previously mentioned, increases the stiffness ofthe polymer main-chain. Several factors can concur to thiseffect: (i) the smaller CN substituent that leads to a close-ness between neighboring chains, (ii) the increase of theinter-chains cohesive forces and (iii) an higher correlationbetween the motion of the backbone and the rigid cyanogroups directly attach to it increasing the steric hindranceto intramolecular rotation [44]. From the NMR results itwas found that the presence of alternating ATRIF–AN–AT-RIF and also ATRIF–AN–AN triads reduces the interactionsbetween CN neighbor groups. From the FTIR analysiswhere a reduced absorption CN band was observed inthe poly(AN-co-ATRIF) copolymer spectrum relative to
Table 2Thermal properties of the polymers of ATRIF measured by DSC and TGA: glass transition temperature at the onset and midpoint point, Tg,onset andTg,midpoint, heat capacity jump at the glass transformation region, DCp, and temperature of degradation at onset and at 50% of loss weight, Td and T 0d.
Polymer DSC TGA
Tg,onset (K) Tg,midpoint (K) DCp (J/g K) Td (K) T 0d (K) Residue (%)
Poly(ATRIF) 269 273 0.31 570 650 9Poly(AN-co-ATRIF) 312 316 0.40 591 658 30
400 500 600 7000
20
40
60
80
100
Wei
ght l
oss
(%)
T / K
poly(ATRIF) poly(AN-co-ATRIF)
Fig. 5. TGA thermograms under nitrogen (10 K min�1) of poly(ATRIF)homopolymer and poly(AN-co-ATRIF) copolymer.
E.G. Merino et al. / European Polymer Journal 47 (2011) 1429–1446 1435

Author's personal copy
the same band in the FTIR spectra of AN monomer, poly(-AN) homopolymer, and the copolymers of AN and methylacrylate [45] or AN with methyl a-acetoxyacrylate [19],we can conclude also that inter-chain interactions are de-creased. In fact, the presence of AN and ATRIF in alternat-ing diad in poly(AN-co-ATRIF) copolymer promotes thedipole–dipole interaction between the CN dipole rich inelectron and the carbon (CF3) poor in electron due to elec-tron-withdrawing of fluorine atoms decreasing the interac-tion between CN groups and its neighbor chains. Theenhanced CN–CF3 intramolecular interaction causes areduction in the vibration absorption between C and N incyano groups and therefore, decreases the intensity ofthe respective band in the FTIR spectrum. So, the increaseobserved in Tg is mainly a consequence of the higher pack-ing in the copolymer and strong coupling of the CN sidegroup with the main chain motion (items (i) and (iii) listedabove).
From the magnitude of the step in the e0(T) traces it canbe concluded that a higher dielectric strength is associatedwith the a-relaxation of poly(AN-co-ATRIF) copolymer rel-atively to the homopolymer, indicating that a higher dipolemoment is relaxing in the copolymer as it is expected bythe inclusion of the highly polar cyano (CN) moieties rig-idly attached to the main-chain that relax coupled to thesegmental motion in the origin of the a-process.
The isothermal data concerning the a-process will benow analyzed in detail.
The model function of Havriliak and Negami (HN-func-tion) (Eq. (1)) was fitted to the dielectric spectra shown inFig. 6. The estimated shape fit parameters,
aHN = 0.76 ± 0.03 and bHN = 0.44 ± 0.03, are almost temper-ature independent and are the same for the homo andcopolymer. For the highest temperatures (T > 313 K), theshape parameters estimated for the poly(ATRIF) homopol-ymer tend to deviate owing to the secondary relaxationthat, although outside our frequency window, influencethe high-frequency flank of the a-relaxation.
In Fig. 8, it is well demonstrated that the a-peak ofpoly(ATRIF) homopolymer collected at different tempera-tures maintains the same shape as a single curve is definedin the normalized e00 plot. The plot includes the normalizeda-peak for the co-polymer at 338 K (full circles) that fallsin the same master curve. The shape of the a-relaxationof both systems is here well described by an HN functionhaving as aHN and bHN values, respectively, 0.77 and 0.44.At a first glance, this could be a surprising result since anincreased spread of relaxation times should be expectedfor the co-polymer in line to which is observed forpoly(vinylethylene) (PVE) and chlorinated polyethylene(CPE) relative to polyethylene (PE), where the incorpora-tion of less flexible side groups (in the case of PVE) andmore polar atoms (as in CPE) leads to stronger intermolec-ular coupling and to broader dispersion plots [46]. More-over, if the produced poly(AN-co-ATRIF) copolymer wascomposed by regions richer in CN or CO2CH2CF3 substi-tuted chains, a less homogeneous backbone structurewould result, widening the distribution of relaxation times.The shape invariance of the relaxation process of the poly(-AN-co-ATRIF) copolymer relatively to the poly(ATRIF)homopolymer can be taken as further indication that thepoly(AN-co-ATRIF) copolymer has a relatively high
-1 0 1 2 3 4 5 64
6
8
(a)
poly(ATRIF)
ε'
log10
( f / Hz )
-1 0 1 2 3 4 5 60.0
0.5
1.0poly(ATRIF)
(b)
333 K
273 K
ε''
log10
( f / Hz )-1 0 1 2 3 4 5 6
0
1
2
(d)
373 K
313 Kpoly(AN-co-ATRIF)
ε''
log10
( f / Hz )
-1 0 1 2 3 4 5 62
4
6
8
10
12
14
(c)
poly(AN-co-ATRIF)
log10
( f / Hz )
ε'
Fig. 6. Real permittivity, e0(f), and dielectric loss spectra, e00(f), collected isothermally for: poly(ATRIF) homopolymer between 273 and 333 K (a) and (b);poly(AN-co-ATRIF) copolymer between 313 and 373 K, (c) and (d); all isotherms presented in steps of 5 K. The low frequency tails due to ionic conductivitywere suppressed in the dielectric loss spectra (b) and (d) for clarity reasons. Lines are guides for the eyes.
1436 E.G. Merino et al. / European Polymer Journal 47 (2011) 1429–1446

Author's personal copy
structural homogeneity where AN and ATRIF sub-units al-ter regularly. This result is in agreement with 13C NMRstudy discussed above. In fact, poly(AN-co-ATRIF) copoly-mer presents more sequences when AN and ATRIF alter(38% of (ATRIF–AN–ATRIF) and 41% of (ATRIF–AN–AN) tri-ads) with no large sequences of AN (the larger AN se-quences (AN–AN–AN) constitute only 19% of thecopolymer).
Moreover, the same spectral width of the dispersionmeans an equal degree of non-exponentiality of the relaxa-tion function for both systems in light of the Coupling Model[46]. According to this model the strength of the intermolec-ular constraints due to coupling of segmental motions withrelaxations of neighboring nonbonded segments is charac-terized by the degree of non-exponentiality quantified bythe coupling parameter n; n = 1–bKWW, where bKWW is thestretch exponent of the Kohlrausch–Williams–Watts(KWW) relaxation function [47], (UðtÞ ¼ exp½�ðt=sÞbKWW ]),varying within the range 0 < bKWW 6 1 that quantifies the
extent of deviation from a single exponential (bKWW = 1),i.e., characterizes the non-Debye nature of the time decay,and s is a characteristic relaxation time. The bKWW parame-ter can be estimated from the HN shape parameters as pro-posed by Alegría et al. [48,49], therefore, the same HN shapeparameters as found for both homo and copolymer lead tothe same bKWW and consequently to a common value of n.The absence of broadening of the copolymer’s relaxationfunction relative to the homopolymer is coherent with both13C NMR and FTIR analysis pointing to low interaction be-tween neighboring chains.
Another parameter obtainable from the HN fit is thedielectric strength, De presented in the upper inset ofFig. 9.
As can be seen, De generally decreases with the temper-ature increase as predicted by the Fröhlich–Kirkwoodequation [33,50]. This is also evident from the evolutionof the peaks height in the raw data (Fig. 6) where the sametrend is observed for both poly(ATRIF) and poly(AN-co-AT-RIF) polymers. The estimated De values confirm the higherdielectric response of the copolymer, attaining a factor of�2.6 higher than the homopolymer. As previously men-tioned, this increase of the relaxation strength in the co-polymer comes from an increase in the dipolar moment,more precisely, in the average square value of the dipolemoment, per monomer unit. The high value of the dipolemoment of the cyano group, �4 D in several aliphatic com-pounds [51–53], explains the higher value in the dielectricstrength in the copolymer; the dipole moment of theCO2CH2CF3 moiety is around 1.34 D as it was calculatedin the 2,2,2-trifluoro methacrylate (MATRIF) units in thecopolymer of vinylidene cyanide with MATRIF [30].
Finally, the characteristic relaxation times obtained bythe HN fit to the data, after conversion to smax (Eq. (2)), areplotted versus the inverse of temperature in Fig. 9 for poly(-ATRIF) homopolymer and poly(AN-co-ATRIF) copolymer.
Both plots exhibit curvature, typically regarded as a signof the dynamical glass transition. This departure from lin-
150 200 250 300 350 4002
3
4
5
6
7
8
9
10
11
12
f = 1000 Hz poly(ATRIF)poly(AN-co-ATRIF)
T / K
ε'
(a)
150 200 250 300 350 400
0.01
0.1
1
tan δ
f = 1000 Hz poly(ATRIF)poly(AN-co-ATRIF)
T / K
(b)
Fig. 7. Temperature dependency of (a) the real part of dielectricpermittivity e0(T) and (b) the dielectric loss tangent tan d(T) = e00(T)/e0(T),for the poly(ATRIF) homopolymer (black squares) and poly(AN-co-ATRIF)copolymer (gray circles). All isochronal plots were taken from isothermaldata obtained on heating (shown in Fig. 6). Lines are guides for the eyes.
-2 -1 0 1 2 3 40.0
0.2
0.4
0.6
0.8
1.0
1.2 poly(ATRIF) poly(AN-co-ATRIF) HN fit curve
σε''/ε''max
log10
( f / fmax
)
α
Fig. 8. Normalized plot of the loss curves for the a-relaxation of thepoly(ATRIF) homopolymer (open circles) at temperatures above Tg: from278 to 328 K in steps of 5 K (see Fig. 6b); the normalized plot for thepoly(AN-co-ATRIF) copolymer at 338 K (full circles) is included forcomparison. All curves fall into a single master curve, for which the aHN
and bHN shape parameters are, respectively, 0.77 and 0.44 (HN fit curve-thicker solid line).
E.G. Merino et al. / European Polymer Journal 47 (2011) 1429–1446 1437

Author's personal copy
earity is often described by the empirical Vogel–Fulcher–Tamman–Hesse (VFTH) law [54–56]
sðTÞ ¼ s1 expB
T � T0
� �¼ s1 exp
D � T0
T � T0
� �ð4Þ
where s1, B and T0, the so-called Vogel temperature, areempirical parameters characteristic of the material. Thedegree of deviation from Arrhenius-type temperaturedependence near Tg, provides an useful classification ofglass formers, either low molecular weight compounds ormacromolecules [57–59] in terms of fragility. Materialsare called ‘‘strong’’ if s(T) dependence is close to an Arrhe-nius-type behavior and ‘‘fragile’’ if their s(T) significantlydeviates from linearity, induced by high cooperativemolecular rearrangements, which reflects in a strong tem-perature-dependent apparent activation energy that lar-gely increases on approaching Tg from above [34]. Aquantitative measure of the fragility can be obtained fromthe steepness index m according the following equation:
m ¼ d log10sðTÞdðTg=TÞ
����T¼Tg
ð5Þ
Fragility values typically range between m = 16 forstrong systems and m = 200 for fragile ones [33]. Thestrength parameter, D ¼ B
T0in Eq. (4) can be also used as
an indication of fragility [57–59] however, varying in anopposite way to m, being high for strong glasses and lowfor fragile ones (D > 100 for the strongest and D < 10 forthe more fragile glasses [57]).
The parameters obtained from the VFTH fit (solid linesin Fig. 9) of the plot of ln s(T) vs. the reciprocal of temper-ature are listed in Table 3, that allow to estimate the glasstransition temperature at s = 100 s [60], as 269.5 and
307.1 K for poly(ATRIF) homopolymer and poly(AN-co-AT-RIF) copolymer, respectively, in reasonable agreement withDSC results (see Table 2 about the Tg onset from DSC: 269and 312 K for the poly(ATRIF) and poly(AN-co-ATRIF)). Ta-ble 3 also includes the strength parameter, D, values calcu-lated from B and T0.
Using the VFTH expression (Eq. (4)) together with Eq.(5), m can be estimated as:
m ¼ BTg
ðTg � T0Þ2ðln 10Þð6Þ
that, taking the B and T0 values determined for the VFTH fitto the a-relaxation (Table 3), gives a fragility index ofm = 109 and 87, respectively, for the poly(ATRIF) homopol-ymer and poly(AN-co-ATRIF) copolymer, comparable to thecharacteristic values of m reported for several polymers[57,61,62].
By replacing the VFTH equation in the activation energyequation, defined as:
Ea ¼ R@ ln s@ð1=TÞ ð7Þ
where R is the gas constant (8.314 J K�1 mol�1), it is possi-ble to calculate the temperature dependent activation en-ergy (apparent activation energy):
EaðTÞ ¼RB
ð1� T0=TÞ2ð8Þ
The higher departure from a linear behavior of thehomopolymer is evident in the plot of the log (smax) versustemperature inverse presented in Fig. 9, leading to a higherfragility as directly quantified by m (smaller D value).
2.2 2.4 2.6 2.8 3.0 3.2 3.4 3.6 3.8-2
0
2
4
6
8
Tg,homopolymerT
g, copolymer
1000/T / K -1
- lo
g 10( τ
max
/ s)
260 280 300 320 340 360 3800
4
8
T / K
-log
10(τ
(T)/
τ(T
g))2.6 2.8 3.0 3.2 3.4 3.60
4
8
12
Δε
1000/T / K-1
Tg, homopolymer
0
4
8
2.6 2.8 3.0 3.2 3.4 3.60
4
8
12
Δε
1000/T /K-1
Fig. 9. Temperature dependence of the relaxation times of both poly(ATRIF) homo polymer (squares) and poly(AN-co-ATRIF) copolymer (circles); thearrows indicate the glass transition temperatures estimated from the VFTH equations at s = 100 s. The left inset presents the WLF plot given a furtherevidence of the higher curvature of the temperature dependence of the homopolymer (same symbols are used); solid line is the WLF fit to the data. In theupper inset: dielectric strength, De, versus temperature inverse for both polymers.
1438 E.G. Merino et al. / European Polymer Journal 47 (2011) 1429–1446

Author's personal copy
Different explanations are given in literature for poly-mer fragility mainly related with the chemical structureof polymers [46] where factors as chain stiffness [61,63]bulkiness and flexibility of side groups [64], molecularweight and symmetry of the polymer structural units[65], are tentatively correlated with fragility. The resultsreported in the present work can be taken as a further con-tribution to this discussion. In fact, the two polymericmaterials that are being compared differ in their structuresby having identical backbones but partially different sidegroups. From the analysis of data reported in literatureon the role of chemical structure in polymers fragility,Kunal et al. [64] concluded that polymers with stiff back-bones always have high Tg and fragility, while polymerswith flexible backbones and no side groups are the stron-gest. Our results do not corroborate their observationssince with increasing the stiffness relative to the ATRIFunit, by the inclusion of the cyano side groups, no increasein the fragility was found.
Alternatively, the difference in fragilities can be ana-lyzed based in a free volume model which basic underlyingidea is that molecular mobility at each temperature isdetermined on the available free volume at that tempera-ture [66,67]. In this context, the temperature dependenceof relaxation times in the glass transition region can be de-scribed as follows:
lnsðTÞsðT0Þ
¼ �c1ðT � T0Þc2 þ ðT � T0Þ
ð9Þ
which is known as the Williams–Landel–Ferry (WLF) equa-tion [68], where T0 is an arbitrary reference temperatureand c1 and c2 are constants of the material, dependent onthe value chosen for T0, and where s(T) and s(T0) are therelaxation times at, respectively, T and T0.
Eq. (9) was fitted to the temperature dependence ofrelaxation times for the particular case where Tg was se-lected for T0 and taking s(Tg) = 100 s. The respective plotis shown in the inset of Fig. 9 giving a further evidence ofthe steepness of s(T) for the homopolymer and thereforehigher fragility; the solid line is the best WLF fit to the data.The obtained cg
1, cg2 and Tg values are presented in Table 4,
the latter coinciding with the value obtained by the VFTHfit. Although this is not surprising since the VFTH equation
is exactly the same as the WLF equation with appropriatedsubstitution of parameters (B = c1 � c2; T0 = Tg–c2 [69]), thisobservation validates the previous VFTH fit. In fact, theVFTH equation has three fit parameters, being the glasstransition temperature obtained from an extrapolation tos = 100 s which could lead to a less accurate value.
From cg1 and cg
2 parameters, primitive activation energyassociated with local bond rotational barriers, equivalentto the activation energy of noncooperative intramolecularbond rotation used by Matsuoka [70], was determined bythe expression:
Ea ¼ ln ð10Þ � R � cg1 � c
g2 ð10Þ
which values for homo- and copolymer are also included inTable 4.
On the other hand the WLF equation can be derived byassuming that the fractional free volume f = vf/v (where vf
is the free volume per gram and v the specific volume ofthe polymer at T), increases linearly with the temperature:
f ðTÞ ¼ f ðTgÞ þ af ðT � TgÞ ð11Þ
where af is the temperature coefficient of free volumeexpansion both f and af relate with the WLF parametersas: cg
1 ¼ b=ðln 10 � f ðTgÞÞ and cg2 ¼ f ðTgÞ=af , where b � 1
[66]. The f(Tg) and af values calculated using the WLFparameters were included in Table 4.
The cg2 value is an indication of the temperature dis-
tance from the glass transition temperature to T0, whichtypically occurs at �50 K above T0 (more precisely51.6 K) [66], as found here for the copolymer. The valueof cg
1, usually 17.44 [70], is associated to the activation en-ergy barrier to rotation of a conformer without being inter-fered by their neighbors. Both cg
1 values here determinedare slightly lower, specially for the homopolymer leadingalso to rather small activation energies for individual rota-tion (Ea) (Eq. (10)) in comparison with values reported forother polymers [71], or the values of a single bond rotationinvolving the smallest unit, the conformer, that lie in be-tween 12.6 and 15.1 kJ/mol [70]. It is worth to note thehigher intramolecular bond rotational barrier for thecopolymer, almost two times that of the homopolymer,in spite of the lower Ea(Tg) value for the cooperative motionat Tg of the former (remember Table 3). Given that the
Table 3Fit parameters, s1, B and T0 obtained according the VFTH law (Eq. (4)), strength parameter D (Eq. (4)), fragility index, m (Eq. (6)) and apparent activation energyat the glass transition temperature, Ea(Tg) (Eq. (8)). Tg is the dielectric glass transition temperature obtained from the VFTH equation at s = 100 s. Statisticalerrors originated from the fitting procedure are also given.
Polymer s1 (s) B (K) T0 (K) Tg (s = 100 s) (K) D m Ea(Tg) (kJ mol�1)
Poly(ATRIF) (1.2 ± 0.2) � 10�11 (92 ± 4) � 10 238 ± 1 269.5 3.9 ± 0.1 (10.9 ± 0.1) � 10 580Poly(AN-co-ATRIF) (9 ± 4) � 10�14 (184 ± 8) � 10 254 ± 2 307.1 7.2 ± 0.2 (9 ± 1) � 10 512
Table 4WLF parameters obtained according the WLF law (Eq. (9)) from which f(Tg) and af were derived; the respective statistical errors originated from the fittingprocedure. Ea, the primitive activation energy, was calculated from Eq. (10).
Polymer cg1 cg
2 (K) f(Tg) Tg (K) af (K�1) Ea (kJ mol�1)
Poly(ATRIF) 12.9 ± 0.1 31.3 ± 0.5 0.034 269.4 ± 0.1 1.1 � 10�3 7.7Poly(AN-co-ATRIF) 15.0 ± 0.2 53 ± 2 0.029 307.1 ± 0.3 5.5 � 10�4 15.2
E.G. Merino et al. / European Polymer Journal 47 (2011) 1429–1446 1439

Author's personal copy
incorporation of the more rigid CN groups in the copoly-mer, turned more difficult the bond rotation of a con-former, it probably means that Ea, instead of Ea(Tg), betteraccounts for the structural differences between the studiedmaterials. From cg
1 and cg2 it was possible to estimate the
fractional free volume for each material being not far fromthe Doolittle value, which is about 0.025 [66,70]. Neverthe-less the value is higher for the homopolymer as well as thetemperature coefficient of free volume expansion, the lat-ter being the responsible for the steepness of the tempera-ture dependence of the free volume. The f(T) dependencewas determined according Eq. (11) and plotted scaled toTg in Fig. 10 (the inset shows the linear f(T) dependencefor both materials). From the plot is visible the largest rel-ative change in free volume with temperature exhibited bythe homopolymer, explaining the higher fragility of the lat-ter relative to the copolymer. This means that in the homo-polymer, the free volume increases at a larger rate with thetemperature increase than in the copolymer. The observedvariation of the free volume with temperature can be inter-preted similarly as done for poly-p-phenylenes [71] wherea more rigid character restricts free volume expansion tolibrations and rotations of the side groups around the mainchain while a flexible backbone allow for long range diffu-sive mobility and main chain segmental motion with alarge swept volume. Therefore, the free volume theoryseems to be a more straightforward approach to explainthe observed differences in the segmental relaxationdynamics of the two tested materials.
3.4.2. The secondary relaxationsAt the lowest temperature region, below Tg, secondary
processes are detected as can be seen in Fig. 11a and b.
The existence of secondary relaxations at temperaturesbelow Tg is clearly evident for the poly(ATRIF) homopoly-mer from the tan d(T) plots at the fixed frequency (1 kHz)shown in Fig. 7b; the same plot for the poly(AN-co-ATRIF)copolymer shows only a nearly constant plateau. The iso-thermal dielectric loss spectra, e00(f), shown in Fig. 11a con-firm the latter observations for the poly(ATRIF), where atleast two secondary relaxations can be identified (yet, anaccurate deconvolution analysis of these two processeswas not possible). Interestingly is that from the isothermalspectra shown in Fig. 11b it is also evident the existence ofsub-glass mobility for the copolymer, but much less in-tense than for the homopolymer. Because the nitrilegroups are bounded directly to the polymer backbone, itsmovement is highly correlated to the movement of thepolymeric backbone and therefore their contribution tothe secondary process is rather small being the reasonwhy the dielectric response in the copolymer is muchsmaller compared with the homopolymer. However, inspite of this lower dielectric response it was possible todeconvolute the dielectric loss for the copolymer in twocontributions, designated as usually, by b and c in decreas-ing order of temperature. In the sub-glass region the maincontribution comes from the c-process: the respectivedielectric strength, Dec, slightly increases from 0.49 to0.54, while for the b-process Deb almost does not vary(0.09–0.11). The inset in Fig. 11b shows the relaxationmap that includes the temperature dependence of relaxa-tion times for the two secondary processes. The designatedb-process exhibits a strong change around Tg as character-istic for the process taken as the precursor of the a-relax-ation found also in the related poly(MATRIF) andpoly(VCN-co-MATRIF) materials [31]. The respective
0.70 0.75 0.80 0.85 0.90 0.95 1.00
0.03
0.06
0.09
0.12
0.15
270 300 330 360 390 4200.02
0.04
0.06
0.08
0.10
0.12
0.14
0.16
poly(ATRIF)
poly(AN-co-ATRIF)
f (T
)
Tg/T
f (T
)
T / K
Fig. 10. Fractional free volume (f(T)) versus reduced temperature; in the inset the temperature dependence of f(T) is plotted.
1440 E.G. Merino et al. / European Polymer Journal 47 (2011) 1429–1446

Author's personal copy
activation energy in the sub-glass region was estimated as72 ± 6 kJ mol�1; if the all the temperature range is consid-ered, the value raises to 94 ± 14 kJ mol�1. For the homopol-ymer it is possible to conceive a mechanism for thesecondary relaxation analogue to PEMA which pendentgroups are CO2CH2CH3 being not strictly local as foundfor PMMA, but rather consists in the carboxyl group hin-dered rotation involving restricted rearrangements of the
main chain (rocking motion) [72]. Concerning the copoly-mer, that carries cyano groups which are rigidly attach tothe main chain, the contribution to the secondary b-relax-ation can be compared with the PAN homopolymer whereit cannot arise from rotations of the pendent groups aboutthe bonds that connect it to the main chain, since thismechanism does not involves a directional change of theside group and therefore some local movement within
-1 0 1 2 3 4 5 60.01
0.1
(a)
secondary relaxation
poly(ATRIF)
αε''
log10(f / Hz)
-1 0 1 2 3 4 5 6
0.1
1
2.7 3.0 3.3 3.6 3.9 4.2 4.5 4.80
2
4
6
1000/T / K-1
- lo
g 10(τ
max
/ s)
γβ
α
Tg
(b)
α
log10(f / Hz)
ε''
poly(AN-co-ATRIF)
β
γ
Fig. 11. Isothermal dielectric loss spectra, e00(f), obtained at temperatures below Tg for (a) the homopolymer poly(ATRIF), between 173 and 263 K, in steps of10 K, and (b) the copolymer poly(AN-co-ATRIF), between 213 and 283 K in steps of 10 K and 288 and 308 K in step of 5 K. Lines are guides for the eyes. Theinset in (b) shows the relaxation time, s, versus 1000/T for all processes detected in the copolymer; solid lines are the respective VFTH and Arrhenius fit, thedashed line evidences the abrupt change around Tg for the b-process. The deconvolution of the secondary process in the homopolymer was not accurate sono data are provided.
E.G. Merino et al. / European Polymer Journal 47 (2011) 1429–1446 1441
Author's personal copy
the main chain should be involved as postulated to polyvi-nylchloride [73]. In vitreous PAN homopolymer the localdynamics was attributed to motions of one and two mono-meric units according to crankshaft mechanisms, requiringcolinearity of two bonds (1 and 5 [66] or 1 and 7 [66,74]) ofthe backbone; these processes became frozen at 170 K[74]. Nevertheless the perfluoroalkyl side groups have anenhanced mobility relative to the cyano moieties causinga higher dielectric response in the homopolymer. Theinternal motions of those perfluoroalkyl groups in the side
chain could be in the origin of the detected c-process asfound for the analogous poly(fluoroalkyl methacrylate)s[26]. In fact, the activation energy determined for this pro-cess for the copolymer is 39 ± 4 kJ mol�1 in good agree-ment with the values found for poly(fluoroalkylmethacrylate)s which lie between 30 and 42 kJ mol�1 [26].
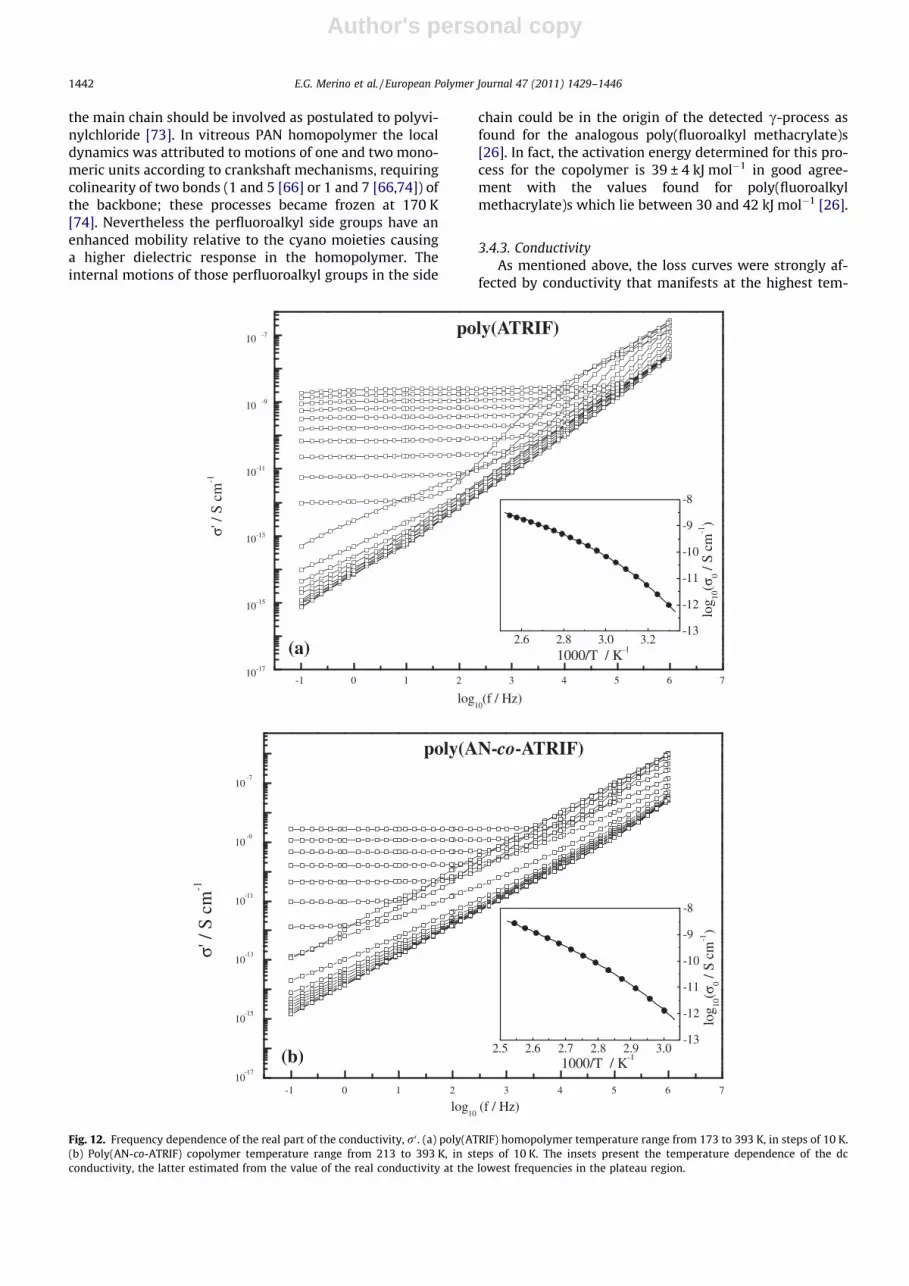
3.4.3. ConductivityAs mentioned above, the loss curves were strongly af-
fected by conductivity that manifests at the highest tem-
-1 0 1 2 3 4 5 6 710-17
10-15
10-13
10-11
10 -9
10 -7
2.6 2.8 3.0 3.2
1000/T / K-1
-13
-12
-11
-10
-9
-8
log 10
(σ0 /
S cm
-1)
σ' /
S c
m-1
log10
(f / Hz)
poly(ATRIF)
(a)
-1 0 1 2 3 4 5 6 710
-17
10-15
10-13
10-11
10-9
10-7
2.5 2.6 2.7 2.8 2.9 3.0
1000/T / K-1
-13
-12
-11
-10
-9
-8
log 10
( σ0 /
S cm
-1)
σ ' /
S cm
-1
log10
(f / Hz)
poly(AN-co-ATRIF)
(b)
Fig. 12. Frequency dependence of the real part of the conductivity, r0 . (a) poly(ATRIF) homopolymer temperature range from 173 to 393 K, in steps of 10 K.(b) Poly(AN-co-ATRIF) copolymer temperature range from 213 to 393 K, in steps of 10 K. The insets present the temperature dependence of the dcconductivity, the latter estimated from the value of the real conductivity at the lowest frequencies in the plateau region.
1442 E.G. Merino et al. / European Polymer Journal 47 (2011) 1429–1446

Author's personal copy
peratures in the low frequency side of the spectra. Thisconductivity contribution can be also analyzed to extractinformation on the charge transport mechanism for eachmaterial. In Fig. 12 the frequency dependence of the realpart of the conductivity, r0, is presented for (a) the homo-polymer and (b) the copolymer in steps of 10 K. As foundfor a variety of quite different materials [75–77], the plotof r at the lowest frequencies exhibits a plateau, bendingoff at higher frequencies into a dispersive regime, with astrong increase of the conductivity with increasing fre-quency. For highly conductive materials the high fre-quency side of conductivity follows a power lawdependence (ac conductivity) of the type r0 �xs (s 6 1)[78], however in both materials, poly(ATRIF) and poly(-AN-co-ATRIF), conductivity spectra data are highly affectedby dipolar relaxation associated with the dynamic glasstransition.
The plateau region corresponds to a linear dependenceof slope 1 in the plots of log (e00(f)) versus log (f) and givesthe value of r0, the conductivity in the dc limit. The tem-perature dependence of the extracted r0 values is plottedin the insets of Fig. 12 for (a) poly(ATRIF) homopolymerand (b) poly(AN-co-ATRIF) copolymer obeying to a VFTHlike law as expressed in Eq. (12):
ln r ¼ ln r1 �B
T � T0ð12Þ
Table 5 presents the parameters for the fit of the VFTHEq. (12) to r0(T). The temperature dependence of the dcconductivity has been found for a variety of materials tofollow either VFTH (polymers as PET [75] and Nylon [77],polymer electrolytes [79–81], small glass formers [82]and ionic liquids [83]), or Arrhenius (mixtures of sugarand drug [84], polyurethane based blends [85] and poly-saccharides [86]) behavior. The VFTH behavior observedhere as in some polymers, such as PET and Nylon, at tem-peratures above Tg, has been taken as an indication thatcharge carrier transport was governed by the segmentalmotion of the polymer chain [75,77].
To test if the ion motion is correlated with the dynamicsof the structural relaxation the ‘decoupling index’, Rs(Tg),can be used, which is the ratio of the structural relaxationtime to the conductivity relaxation time [87,88], giving aphysical idea of the relation between the conductivityand structural relaxation processes [89]. This factor conve-niently describes the extent to which the ion conductingmotions in a given glass can be considered decoupled fromthe viscous motions of the glassy matrix [90]. An approxi-mate relation between the log (decoupling index) and theconductivity (in S cm�1) measured at Tg was proposed byAngell [91]:
Decoupling index ðlogÞ ¼ logð1015 � r0ðTgÞÞ ð13Þ
giving the orders of magnitude of the mobility of thecharge carriers relative to the mobility driven by the seg-mental dynamics. For systems where high values of thelog decoupling index (�7 [92], 9 [89]) are obtained itseems unlikely that the excess mobility could be attributedto any ionic species, and it is therefore probably due to themotion of protons themselves [89]. In the present case lowdecoupling indexes were estimated, respectively, 0.0033and 0.39 (r0(Tg)ATRIF = 3.3� 10�18 S cm�1; r0(Tg)AN-co-ATRIF =3.9 � 10�16 S cm�1) for the homopolymer and the co-poly-mer, respectively, meaning a strong coupling between seg-mental motion and conductivity. This fact together withthe VFTH dependence of the dc conductivity indicates thation motion is significantly influenced by the dynamics ofthe a-process as found for other polymeric materials[75,77,93].
4. Conclusions
In the frame of a research aiming at developing newdielectric polymers containing C–CN and C–F substituentswith strong dipole moment, new copolymer containing2.2.2-trifluoroethylacrylate (ATRIF) and acrylonitrile wassynthesized by radical copolymerization initiated by AIBNin a 52% yield from an equimolar comonomer feed. Thehomopolymer poly(ATRIF) was also prepared to compari-son. These polymers were characterized by 13C, 1H NMR,IR spectroscopy and SEC. The NMR analysis showed thatthe molar percentage of AN in the copolymer was58 mol%. The microstructures of these polymers were alsostudied using some characteristic signals in NMR spectrafor the poly(ATRIF) homopolymer and poly(AN-co-ATRIF)copolymer. Thermogravimetric analysis of poly(AN-co-AT-RIF) copolymer showed good thermal stability compara-tively to poly(ATRIF) homopolymer.
Both copolymer and homopolymer were dielectricallycharacterized over a frequency range from 10�1 to106 Hz, and covering a temperature range from 223 to393 K. The a-relaxation associated with the dynamic glasstransition was detected in both materials presenting a sig-nificant shift in the temperature/frequency location, beinghigher/lower for the copolymer. The respective calorimet-ric glass transition temperatures confirm the displace-ment: Tg,copolymer = 316 K and Tg,homopolymer = 273 K. Thetemperature dependence of relaxation times exhibit theusual curvature to which the WLF and VFTH equationswere fitted to. The dielectric glass transition temperaturefor the two materials revealed good agreement with DSCvalues and are � 40 K apart. The higher Tg for the copoly-mer was attributed to a higher stiffness of the backboneoriginated by the inclusion of the acrylonitrile groups. Itwas possible to construct a master curve for the a-processcommon for both polymers indicating a similar distribu-tion of relaxation times. However, different fragilities wereestimated being the copolymer less fragile (mcopolymer = 87;mhomopolymer = 109). This was better rationalized by the freevolume approach instead from a correlation between fra-gility and intermolecular coupling; it was found that, forthe copolymer, the fractional free volume increases at alower rate with the temperature increase than for the
Table 5Fit parameters obtained according the VFTH law (Eq. (12)) applied to the dcconductivity r0.
Polymer r1 (S cm�1) B (K) T0 (K)
Poly(ATRIF) 1.3 � 10�6 992 232.3Poly(AN-co-ATRIF) 1.1 � 10�4 1536 248.9
E.G. Merino et al. / European Polymer Journal 47 (2011) 1429–1446 1443

Author's personal copy
homopolymer. The dielectric strength of the a-relaxationwas higher for the copolymer due to the inclusion of thehighly polar cyano (CN) groups which are rigidly attachedto the main-chain and relax coupled to the segmental mo-tion that it is in the origin of the dynamic glass transition.Therefore the contribution of the cyano groups to the sec-ondary process is rather small.
A strong coupling between segmental motion and con-ductivity was found for both materials being responsibleby the VFTH temperature dependence of the dcconductivity.
Acknowledgments
The authors thank the financial supports to the Actionof Cooperation (Maroc/Portugal) 415/CNRST/Marrocosand to the Fundação para a Ciência e Tecnologia (Portugal)through the project PTDC/CTM/6428/2006, and the Swed-ish Research Links Programme for the framework ‘‘Interna-tional Research Grant’’ Sweden – MENA (Middle East andNorth of Africa) (Ref: VR 2008-6002) between FST (Marrak-ech) and KTH (Stockholm) is also acknowledge.
References
[1] Guilbert H, Miller FF, Averill SJ, Carlson EJ, Folt VL, Heller HJ, et al.Vinylidene cyanide. VII. Copolymerization. J Am Chem Soc1956;78:1669–75.
[2] Conciatore AB, Trapasso LE, Stackman RW. Vinylidene cyanidepolymers. In: Encyclopedia of polymer science and technology, 1sted., vol. 14. New York: John Wiley and Sons, Inc.; 1971.
[3] Miyata S, Yoshikawa M, Tasaka S, Ko M. Piezoelectricity revealed inthe copolymer of vinylidene cyanide and vinyl acetate. Polym J1980;12(12):857–60.
[4] Maruyama Y, Jo YS, Inoue Y, Chûjô R, Tasaka S, Miyata S. C-13Nuclear-Magnetic-Resonance studies on the microstructure of thecopolymer of vinylidene cyanide and methyl-methacrylate. Polymer1987;28(7):1087–92.
[5] Inoue Y, Kawaguchi K, Maruyama Y, Jo YS, Chûjô R, Seo I, et al. 13CNMR studies on the microstructure of piezoelectric copolymers ofvinylidene cyanide. Polymer 1989;30(4):698–704.
[6] Inoue Y, Kashiwazaki A, Maruyama Y, Jo YS, Chûjô R, Seo I, et al. 13CNMR studies on the microstructure of poly(vinylidene cyanide/vinylbenzoate) and poly(vinylidene cyanide/styrene). Polymer1988;29(1):144–51.
[7] Monthéard JP, Boinon B, Belfkira A, Raihane M, Pham QT. Copolymersof substituted styrenes with vinylidene cyanide or methylvinylidenecyanide. 13C NMR-studies of their microstructures. Makromol Chem1993;194(10):2839–50.
[8] Ohta Y, Inoue Y, Chûjô R, Kishimoto M, Seo I. Microstructure ofvinylidene cyanide copolymers with linear-chain fatty acid vinylesters. Polymer 1990;31(8):1581–8.
[9] Inoue Y, Maruyama Y, Kawaguchi K, Ohta Y, Sakurai M, Sung Jo Y,et al. Two-dimensional 1H NMR studies of conformations ofpiezoelectric vinylidene–cyanide copolymers. Polymer1991;32(16):2958–62.
[10] Zou D, Iwasaki S, Tsutsui T, Saito S, Kishimoto M, Seo I. Anomaly indielectric relaxation in alternating copolymers of vinylidene cyanideand fatty acid vinyl ester. Polymer 1990;31(10):1888–93.
[11] Belfkira A, Sadel A, Monthéard JP, Boiteux G, Lucas JM, Seytre G.Dielectric studies of amorphous vinylidene cyanide alternatingcopolymers. Polymer 1993;34(19):4015–9.
[12] Inoue Y, Jo YS, Kashiwazaki A, Maruyama Y, Chûjô R, Kishimoto M,et al. Enthalpy relaxation and piezoelectric activity of vinylidenecyanide vinyl benzoate copolymer. Polym Comm 1988;29(4):105–8.
[13] Kihimito M, Nakajima K, Seo I. Vinylidene cyanide copolymer.(Mitsubishi Petrochemical) EP. 1988/0 264 240 A2.
[14] East A, Conciatori AB. Vinylidene cyanide alternating copolymers.(Hoechst Celanese PCT) WO. 1991/13922.
[15] Way TF, Hall Jr HK. Novel copolymerizations of the methylvinylidene cyanide with electron-rich vinyl monomers. Polym Bull1990;24:151–6.
[16] (a) Hall Jr HK, Padias AB, Chu G, Lee HY, Kalnin I, Sansone M, et al.Novel cyano-containing copolymers of vinyl esters for piezoelectricmaterials. J Poly Sci Part A: Poly Chem 1992;30(11):2341–7;(b) Padias AB, Chu G, Kalnin I, Hall Jr HK. Novel cyano-containingcopolymers of vinyl esters as piezoelectric materials. Am Chem SocPolym Div Poly Chem 1991;32(1):537–8.
[17] Montheard JP, Mesli A, Belfkira A, Raihane M, Pham QT.Copolymerization of vinylidene cyanide with methacrylonitrile andcyanovinyl acetate 13C NMR studies of their structure. Macromol Rep1994;A31(Suppl. 1–2):1–8.
[18] Tanaka H, Okazaki T, Tezuka Y, Hongo T, Takahashi Y. Radicalcopolymerization of 2-acetoxyacrylates with nitrile monomers andproperties of the copolymers. Polymer 2002;43:1189–95.
[19] Monthéard JP, Zerroukhi A, Ouillon I, Raihane M, Pham QT.Copolymers of cyano compounds with captodative monomers.Studies of their microstructures. J Macromol Sci Part A: Pure ApplChem 1997;34(2):291–313.
[20] Raihane M, Montheard JP, Boiteux G. Etude diélectrique de deuxcopolymères du méthylcyanure de vinylidène avec le 4-fluorostyrène et le 4-chlorostyrène. Macromol Chem Phys2000;201:2365–70.
[21] Ameduri B, Boutevin B. Well architecturedfluoropolymers. Amsterdam: Elsevier; 2004.
[22] Passaglia E, Aglietto M, Ciardelli F, Mendez B. 13C NMRcharacterization of polymers from 2,2,2-trifluoroethylmethacrylate. Polym J 1994;26(10):1118–23.
[23] Castelvetro V, Montagnini di Mirabello L, Aglietto M, Passaglia E.Homo- and copolymers of hexafluoroisopropyl methacrylate and a-fluoroacrylate with alkyl vinyl ethers: microstructure and thermalproperties. J Polym Sci Part A: Polym Chem 2001;39:32–45.
[24] Castelvetro V, Aglietto M, Ciardelli F, Chiantore O, Lazzari M, TonioloL. Structure control, coating properties, and durability of fluorinatedacrylic-based polymers. J Coat Technol 2002;74(928):57–66.
[25] Boutevin B, Pietrasanta Y. Les Acrylates et Polyacrylates Fluorés.Paris: Erec; 1989.
[26] (a) Koizumi S, Tadano K, Tanaka Y, Shimidzu T, Kutsumizu S, Yano S.Dielectric relaxation of poly(fluoro methacrylate)s andpoly(fluoroalkyl a-fluoroacrylate)s. Macromolecules 1992;25:6563–7;(b) Tadano T, Tanaka Y, Shimizu T, Yano S. Dielectric studies onmolecular motion of poly(fluoro a-substituted acrylate)s andcompass motion for internal motion of fluoroalkyl side chain.Macromolecules 1999;32:1651–60.
[27] Raihane M, Ameduri B. Radical copolymerization of 2,2,2-trifluoroethyl methacrylate with cyano compounds for dielectricmaterials: synthesis and characterization. J Fluorine Chem2006;127:391–9.
[28] Meskini A, Raihane M, Ameduri B, Hakme C, Sage D, Stevenson I,et al. Dielectric behaviour of copolymers based on 2,2,2-trifluoroethylmethacrylate and cyano co-monomers. Eur Polym J2009;45:804–12.
[29] Meskini A, Raihane M, Stevenson-Royaud I, Boiteux G, Seytre G,Ameduri B. Dielectric properties of block copolymers based onvinylidene fluoride and cyano comonomers. J Non-Cryst Solids2010;356:688–94.
[30] Raihane M, Castelvetro V, Bianchi S, Atlas S, Ameduri B. Radicalcopolymerization of vinylidene cyanide with 2,2,2-trifluoroethylmethacrylate: structure and characterization. J Polym Sci Part A:Polym Chem 2010;48:4900–8.
[31] Capaccioli S, Castelvetro V, Rolla PA, Raihane M, Atlas S, Meskini A.a- and b-Dielectric relaxations in fluorinated methacrylate polymersand copolymers of vinylidene cyanide. Results presented at the 6thInternational Conference on Broadband Dielectric Spectroscopy andits Application, Madrid (Spain) 7–10 September 2010. P-23, p. 201.
[32] (a) Havriliak S, Negami S. A complex plane representation ofdielectric and mechanical relaxation processes in some polymers.Polymer 1967;8(4):161–210;(b) Havrilia S, Negami S. A complex plane analysis of alpha-dispersions in some polymer systems. J Polym Sci Part C: PolymSymp 1966;14:99–117.
[33] Schönhals A, Kremer F. Analysis of dielectric spectra. In: Schönhals A,Kremer F, editors. Broadband dielectric spectroscopy. Berlin:Springer-Verlag; 2003 [chapter 3].
[34] (a) Boersma A, van Turnhout J, Wübbenhorst M. Dielectriccharacterization of a thermotropic liquid crystalline copolyestera-mide: 1. Relaxation peak assignment. Macromolecules 1998;31(21):7453–60;(b) Schröter K, Unger R, Reissig S, Garwe F, Kahle S, Beiner M, et al.Dielectric spectroscopy in the ab splitting region of glass transition
1444 E.G. Merino et al. / European Polymer Journal 47 (2011) 1429–1446

Author's personal copy
in poly(ethyl methacrylate) and poly(n-butyl methacrylate):Different evaluation methods and experimental conditions.Macromolecules 1998;31(25):8966–72.
[35] Lazzari M, Chiantore O, Castelvetro V. Photochemical stability ofpartially fluorinated acrylic protective coatings. Part 3. Copolymersof 1H, 1H, 2H, 2H-perfluorodecyl acrylate and 2,2,2-trifluoroethylmethacrylate with butyl methacrylate. Polym Int 2001;50:863–8.
[36] Alric J, David G, Boutevin B, Rousseau A, Robin JJ. Evaluation of thetermination mode in the radical polymerization of 2,2,2-trifluoroethyl a-fluoroacrylate. Polym Int 2002;51(2):140–9.
[37] Victor MW, Saffariannour M, Reynolds JR. Structuralcharacterization of poly(a-fluoroacrylonitrile) and poly(ethyl a-fluoroacrylate). J Macromol Sci Part A: Pure Appl Chem1994;A31(6):721–36.
[38] Majumdar RN, Harwood HJ. Determination of the microstructure ofpoly(methyl a-fluoroacrylate) by NMR-spectroscopy. Polym Bull1981;4(7):391–7.
[39] Brar AS, Kaur J. 2D NMR studies of acrylonitrile–methyl acrylatecopolymers. Eur Polym J 2005;41(10):2278–89.
[40] Pham QT, Petiaud R, Waton H, Lauro-Diarricades NF. Proton andcarbon NMR spectra of polymers. London: Penton Press; 1991. p. 20–81.
[41] www.sigmaAldrich.com/ catalog (CAS No.: 109-99-9).[42] Kharas GB, Feinberg CF. New copolymers of styrene with some
trisubstituted ethylenes. Proc Am Chem Soc Polym Chem1988;29:180–1.
[43] Fröhlich H. Theory of dielectrics. Oxford: Clarenton Press; 1958.[44] McCrum NG, Read BE, Williams G. Anelastic and dielectric effects in
polymeric solids. New York: Dover Publications Inc.; 1991. p. 238–299 [republication of the work first published by John Wiley & Sons,1967].
[45] Lui X, Chen H, Ji C, Yu M, Xuan Y. Suspended emulsioncopolymerization of acrylonitrile with methyl acrylate: effects ofreaction parameters on the polymerization. J Macromol Sci Par A:Pure Appl Chem 2009;46(7):656–62.
[46] Ngai KL, Roland CM. Chemical-structure and intermolecularcooperativity – dielectric-relaxation results. Macromolecules1993;26(25):6824–30.
[47] Williams G, Watts DC. Non-symmetrical dielectric relaxationbehaviour arising from a simple empirical decay function. TransFaraday Soc 1970;66:80–5.
[48] Alegría A, Guerrica-Echevarria E, Goitiandía L, Telleria I, Colmenero J.Alpha-relaxation in the glass-transition range of amorphouspolymers.1. Temperature behavior across the glass-transition.Macromolecules 1995;28(5):1516–27.
[49] Alvarez F, Alegría A, Colmenero J. Relationship between the time-domain Kohlrausch–Williams–Watts and frequency-domainHavriliak–Negami relaxation functions. Phys Rev B 1991;44(14):7306–12.
[50] Fröhlich H. Theory of dielectrics. Oxford: Claredon Press; 1958.[51] Blythe AR. Electrical properties of polymers. Cambridge: Cambridge
University Press; 1979.[52] Thünemann AF. Dielectric relaxation of polyacrylonitrile in its
pristine and cyclized stage. Macromolecules 2000;33(5):1790–5.[53] Schwarz M, Kitchman LA, Tucker RW, Nelson ER. Dielectric constants,
dipole moments and molecular structure of some bicyclic nitriles andaliphatic dinitriles. J Chem Eng Data 1970;15(2):341–6.
[54] Vogel HT. He temperature dependence law of the viscosity of fluids.Phys Zeit 1921;22:645–6.
[55] Fulcher GS. Analysis of recent measurements of the viscosity ofglasses. J Am Ceram Soc 1925;8(6):339–55.
[56] Tammann G, Hesse W. The dependancy of viscosity on temperaturein hypothermic liquids. Z Anorg Allg Chem 1926;156(4):245–57.
[57] Böhmer R, Ngai KL, Angell CA, Plazek DJ. Nonexponentialrelaxations in strong and fragile glass formers. J Chem Phys1993;99(5):4201–9.
[58] Angell CA. Relaxation in liquids, polymers and plastic crystals –strong fragile patterns and problems. J Non-Cryst Solids1991;131(Part 1):13–31.
[59] Angell CA. Entropy and fragility in supercooling liquids. J Res NatlInst Stand Technol 1997;102(2):171–85.
[60] Richert R, Blumen A. Disorder effects on relaxational processes:glasses, polymers, proteins. Berlin: Springer; 1994.
[61] Sokolov AP, Novikov VN, Ding Y. Why many polymers are so fragile. JPhys Condens Matter 2007;19(20):205116.
[62] Huang D, McKenna GB. New insights into the fragility dilemma inliquids. J Chem Phys 2001;114(13):5621–30.
[63] Andreozzi L, Faetti M, Giordano M, Zulli F, Galli G, Samaritani S.Fragility and glass transition temperature in the rheological
response of azobenzene copolymers. Mol Cryst Liq Cryst2006;450:373–82.
[64] Kunal K, Robertson CG, Pawlus S, Hahn SF, Sokolov AP. Role ofchemical structure in fragility of polymers: a qualitative picture.Macromolecules 2008;41(19):7232–8.
[65] Ding Y, Novikov VN, Sokolov AP, Cailliaux A, Dalle-Ferrier C, Alba-Simionesco C, et al. Influence of molecular weight on fast dynamicsand fragility of polymers. Macromolecules 2004;37(24):9264–72.
[66] McCrum NG, Read BE, Williams G. Anelastic and dielectric effects inpolymeric solids. New York: Dover Publications Inc.; 1991. p. 141–82 [republication of the work first published by John Wiley & Sons,1967].
[67] (a) Doolittle AK. Studies in Newtonian flow. II. The dependence ofthe viscosity of liquids on free-space. J Appl Phys 1951;22(12):1471–5;(b) Doolittle AK. Studies in Newtonian flow. III. The dependence ofthe viscosity of liquids on molecular weight and free space (inhomologous series). J Appl Phys 1952;23(2):236–9.
[68] Williams ML, Landel RF, Ferry JD. The temperature dependence ofrelaxation mechanisms in amorphous polymers and other glass-forming liquids. J Am Chem Soc 1955;77(14):3701–7.
[69] Fytas G, Patkowski A, Meier G, Dorfmüller T. A high pressure photoncorrelation study of bulk poly(methylacrylate). Comparison withrelaxation processes in poly(ethylacrylate) and related polymethac-rylates. J Chem Phys 1984;80(5):2214–20.
[70] Matsuoka S. Entropy, free volume, and cooperative relaxation. J ResNatl Inst Stand Technol 1997;102(2):213–28.
[71] Connolly M, Karasz F, Trimmer M. Viscoelastic and dielectricrelaxation behavior of substituted poly(p-phenylenes). Macromol-ecules 1995;28(6):1872–81.
[72] Kuebler SC, Schaefer DJ, Boeffel C, Pawelzik U, Spiess HW. 2Dexchange NMR investigation of the a-relaxation in poly(ethylmethacrylate) as compared to poly(methyl methacrylate). Macro-molecules 1997;30:6597–609.
[73] McCrum NG, Read BE, Williams G. Anelastic and dielectric effects inpolymeric solids. New York: Dover Publications Inc.; 1991. p. 300–350 [republication of the work first published by John Wiley & Sons,1967].
[74] Kamalova DI, Kolyadko IM, Remizo AB. A study of local crankshaft-type mobility in vitreous polyvinyl chloride and polyacrylonitrile bythe method of conformational probes. Russ J Phys Chem A2009;83(13):2278–82.
[75] Neagu E, Pissis P, Apekis L, Gomez Ribelles JL. Dielectric relaxationspectroscopy of polyethylene terephthalate (PET) films. J Phys D:Appl Phys 1997;30(11):1551–60.
[76] Sun M, Pejanovic S, Mijovic J. Dynamics of deoxyribonucleic acidsolutions as studied by dielectric relaxation spectroscopy anddynamic mechanical spectroscopy. Macromolecules 2005;38(23):9854–64.
[77] Lu H, Zhang X, Zhang H. Influence of the relaxation of Maxwell–Wagner–Sillars polarization and dc conductivity on the dielectricbehaviors of nylon 1010. J Appl Phys 2006;100(5):054104.
[78] Kremer F, Ró _zanski SA. The dielectric properties of semiconductingdisordered materials. In: Schönhals A, Kremer F, editors. Broadbanddielectric spectroscopy. Berlin: Springer-Verlag; 2003 [chapter 12].
[79] Kaskhedikar N, Paulsdorf J, Burjanadze M, Karatas Y, Wilmer D,Roling B, et al. Ionic conductivity of polymer electrolyte membranesbased on polyphosphazene with oligo(propylene oxide) side chains.Solid State Ionics 2006;177(7–8):703–7.
[80] Matsumi N, Sugai K, Miyake M, Ohno H. Polymerized ionic liquidsvia hydroboration polymerization as single ion conductive polymerelectrolytes. Macromolecules 2006;39(20):6924–7.
[81] Ogihara W, Washiro S, Nakajima H, Ohno H. Effect of cationstructure on the electrochemical and thermal properties of ionconductive polymers obtained from polymerizable ionic liquids.Electrochim Acta 2006;51(13):2614–9.
[82] Stickel F, Fischer EW, Richert R. Dynamics of glass-forming liquids. II.Detailed comparison of dielectric relaxation, dc-conductivity, andviscosity data. J Chem Phys 1996;104(5):2043–55.
[83] Rivera A, Rössler EA. Evidence of secondary relaxations in thedielectric spectra of ionic liquids. Phys Rev B 2006;73(21):212201(4).
[84] El Moznine R, Smith G, Polygalov E, Suherman PM, Broadhead J.Dielectric properties of residual water in amorphous lyophilizedmixtures of sugar and drug. J Phys D: Appl Phys 2003;36(4):330–5.
[85] Charnetskaya AG, Polizos G, Shtompel VI, Privalko EG, Kercha YY,Pissis P. Phase morphology and molecular dynamics of apolyurethane ionomer reinforced with a liquid crystalline filler.Eur Polym J 2003;39(11):2167–74.
E.G. Merino et al. / European Polymer Journal 47 (2011) 1429–1446 1445

Author's personal copy
[86] Einfeldt J, Meißner D, Kwasniewski A. Contributions to the molecularorigin of the dielectric relaxation processes in polysaccharides – thehigh temperature range. J Non-Cryst Solids 2003;320(1–3):40–55.
[87] Moynihan CT, Balitactac N, Boone L, Litovitz TA. Comparison of shearand conductivity relaxation times for concentrated lithium chloridesolutions. J Chem Phys 1971;55(6):3013–9.
[88] Angell CA. Fast ion motion in glassy and amorphous materials. SolidState Ionics 1983;9–10:3–16.
[89] Mizuno F, Belieres J-P, Kuwata N, Pradel A, Ribes M, Angell CA.Highly decoupled ionic and protonic solid electrolyte systems, inrelation to other relaxing systems and their energy landscapes. JNon-Cryst Solids 2006;352(42–49):5147–55.
[90] Ngai KL. Structural relaxation and conductivity relaxation in glassyionics. J Phys IV 1992;2(C2):61–73.
[91] Angell CA. Mobile ions in amorphous solids. Annu Rev Phys Chem1992;43:693–717.
[92] Sangoro JR, Turky G, Abdel Rehim M, Iacob C, Naumov S, Ghoneim A,et al. Charge transport and dipolar relaxations in hyperbranchedpolyamide amines. Macromolecules 2009;42(5):1648–51.
[93] Klein RJ, Runt J. Plasticized single-ion polymer conductors:conductivity, local and segmental dynamics, and interactionparameters. J Phys Chem B 2007;111(46):13188–93.
1446 E.G. Merino et al. / European Polymer Journal 47 (2011) 1429–1446
Copyright © 2022 FDOKUMEN